Non-Price Competition and the California WIC...
27
Non-Price Competition and the California WIC Program Patrick W. McLaughlin Dept. of Agricultural & Resource Economics University of California, Davis [email protected] Tina L. Saitone Dept. of Agricultural & Resource Economics University of California, Davis [email protected] Richard J. Sexton Dept. of Agricultural & Resource Economics University of California, Davis [email protected] Selected paper prepared for presentation at the Agricultural and Applied Economics Association’s 2013 AAEA & CAES Joint Annual Meeting, Washington D.C., August 4-6, 2013. Copyright 2013 by Patrick W. McLaughlin, Tina L. Saitone and Richard J. Sexton. All rights reserved. Readers may make verbatim copies of this document for noncommercial purposes by any means, provided that this copyright notice appears on all such copies.
Transcript of Non-Price Competition and the California WIC...

Non-Price Competition and the California WIC Program
Patrick W. McLaughlin Dept. of Agricultural & Resource Economics
University of California, Davis [email protected]
Tina L. Saitone
Dept. of Agricultural & Resource Economics University of California, Davis
Richard J. Sexton Dept. of Agricultural & Resource Economics
University of California, Davis [email protected]
Selected paper prepared for presentation at the Agricultural and Applied Economics Association’s 2013 AAEA & CAES Joint Annual Meeting,
Washington D.C., August 4-6, 2013. Copyright 2013 by Patrick W. McLaughlin, Tina L. Saitone and Richard J. Sexton. All rights reserved. Readers may make verbatim copies of this document for noncommercial purposes by any means, provided that this copyright notice appears on all such copies.

Introduction The food retail sector of the United States saw significant consolidation and
concentration in the past two decades (McCorriston 2002; Reardon et al. 2003; Sexton
2013). Over this time, the concentration of sales in the top four leading grocery retail
chains more than doubled, accounting for more than 80% of all sales in some geographic
regions (Sexton 2013; Richards and Pofahl 2010). Scale economies in buying power and
innovations in procurement logistics and inventory management technology drove much
of this change (Reardon et al. 2003). In addition to the expansion of sales in national
supermarket chains, supercenters like Walmart increased their presence in this market.
Walmart’s superior supply chain management and purchasing power enables the
supercenters to charge, on average, 10% less for all food products compared to nearby
supermarkets (Basker and Noel 2007). Further, the authors observe that supermarkets’
and other grocers’ price responses to Walmart range from small to nearly nothing. When
“traditional” food retailers lose the ability to compete in price, how will they remain
profitable in a highly concentrated industry?
An additional and likely related shift in the food retail industry is the considerable
increase in the number of products carried. From 1980 to 2010, the median number of
stock-keeping units (SKUs) carried by supermarkets increased from roughly 14,000 to up
to 60,000 for some supermarkets (Richards and Hamilton 2006; Progressive Grocer
2010). Because of the costs associated with managing a large and diverse inventory in a
store location with fixed shelf space, it very likely that food retailers use the brands of
products they carry strategically to compete with other retailers to attract consumers.

Further, consumer surveys reveal that many customers base their patronage decisions
strongly on the assortment of products a store offers (Progressive Grocer 2010).
Economists have long asked how firms optimally differentiate themselves from
one another with approaches highly applicable to food retail. A long history of theoretical
literature exists characterizing how firms locate in geographic (or product) space
(Hotelling 1929; Benson and Faminow 1985), how firms choose multiple qualities of a
good (Mussa and Rosen 1978) and how many varieties firms produce (Dixit and Stiglitz
1977; Spence 1976). These studies inspired empirical investigations of how food retailers
strategically use price promotions (Kalnins 2003), food and non-food services (Bonnano
and Lopez 2009) and the quantity and quality of brands stocked (Richards and Hamilton
2006).
A grocery retailer differentiating its store based on product offerings will impact
the firm’s market share and prices charged. Yet, it is difficult to empirically observe
effects of such brand competition. Shelf price changes and price promotions (temporary
decreases in price) are both confounding factors in previous work. To resolve this issue,
we propose a case study involving the Women, Infants and Children (WIC) program, a
federal food assistance program providing vouchers for food products redeemable at
authorized food retailers. Participants redeem the vouchers at no cost and hence have
perfectly inelastic demand. A subset of authorized vendors, A-50 vendors, who derive
50% or more of food sales from WIC, cater almost exclusively to WIC participants. The
unique institutional features of WIC and the authorized A-50 vendor population facilitate
the study of a market where price is not a strategic variable and hence only non-price
variables (e.g., brands carried, geographic location) drive market share.

Background The Special Supplemental Nutrition Program for Woman, Infant and Children (WIC Pro-
gram) provides food assistance and health interventions to low-income women, infants,
and children under 5 years of age in the United States. Specifically, eligible women and
children have a household income of at most 185 percent of the federal poverty line and
are often eligible for or receiving Supplemental Nutrition Assistance Program (SNAP;
formerly known as Food Stamps), Temporary Assistance for Needy Families (TANF)
and/or Medicaid benefits. Nationwide, nearly 9 million women, infants and children
participate in WIC (USDA FNS 2012), a group which historically includes roughly one-
half of all infants born in the United States (Davis 2007), making WIC an integral part of
the nation’s public safety net.
The federal government funds the program and charges the individual states to
administer the provision of supplemental food, nutritional counseling, and access to
health-care services. The food assistance component explicitly promotes the consumption
of foods that are beneficial to the wellbeing of prenatal and postpartum mothers and the
healthy development of their newborns and young children (USDA FNS 2013). WIC
provides the supplemental food at no cost to the participant, which includes an array of
nutritionally focused product categories such as infant formula and infant foods, milk,
eggs, cheese, dry beans and lentils, peanut butter, breakfast cereal, fruit juice, and whole
grain products. While these product categories are federally mandated, it is the
responsibility of the individual state to approve specific food brands, package sizes, and
types for WIC food packages (USDA FNS 2013). For example, California WIC’s criteria

for authorizing a food item includes that a given food brand or type (a) promotes (or at a
minimum, does not detract from) WIC health and nutrition goals while demanded by
participants, and (b) helps maintain the cost-effectiveness of the Program while being
consistently available on the wholesale market (California DPH 2012a). Product
categories require either brand specific or non-brand specific approval. For example, in
breakfast cereal category, WIC participants can only purchase approved brands of ready-
to-eat cereal (e.g., General Mills Cheerios), yet if a participant chooses to use her voucher
to procure oatmeal, all brands meeting general product characteristic requirements can be
purchased.
The latter criterion of cost-effectiveness ensures that candidate food brands and
types are not so costly that they could undermine the ability of WIC to adequately
provide benefits. Because WIC is not an entitlement program it must maximize Program
benefits under a fixed annual budget constraint, necessitating the requirement for cost
control. In California, the Program administration minimizes costs in the non-brand
specific approval process by excluding product types that are premium, luxury or
otherwise highly priced compared to related goods. For example, the state agency
approves many types of cheese such as cheddar, Colby, jack, etc. where consumers can
purchase any brand; however, more expensive artisan or organic cheeses are excluded
(California DPH 2012). For brand-specific product categories, such as breakfast cereal,
certain brands may not receive approval if they are prohibitively costly even if they meet
nutritional requirements, (e.g., organic cold breakfast cereals) (California DPH 2012).
The approval process for infant formula, on the other hand, is unique compared to
all other product categories. The California WIC Program approves a single brand of
infant formula by way of a bidding process that selects the producer who is willing to
accept the lowest final price (USDA FNS 2013, California DPH 2012a). Essentially, the
winning formula producer is the one who offers the highest per unit rebate to the state
agency following reimbursement of the WIC vendors. Manufacturers have a strong
incentive to provide a high rebate to gain market share, as roughly 50% of all infant
formula is sold through WIC (Oliveira, Frazao and Smallwood 2010; Reed and Levedahl
2012; Davis 2012).
Program participants “purchase” the supplementary food by means of redeemable
food vouchers, or food instruments (FIs), for specified bundles of WIC-approved
products. Consumers receive FIs monthly for bundles that vary in breadth from a month’s
supply of infant formula to a basket of low-fat milk, eggs, cheese, and peanut butter or
dry beans. For a given FI, consumers can typically choose among multiple brands within
a product category without a limit on the price, provided the item is authorized by the FI
and WIC Program guidelines. Participants can only redeem FIs at authorized WIC
vendors, which consist of private food retailers that vary in size, store format, and brand
availability. For example, supercenters (e.g., Walmart), large grocery chains (e.g.,
Safeway), and many small grocery and convenience stores in low-income neighborhoods
operate as WIC vendors. The WIC vendor approval process ensures that a candidate
retailer can meet mandated minimum stocking requirements of WIC products and is
equipped to handle FI redemptions (USDA FNS 2013).
Over 5,000 vendors are authorized currently in California. The USDA Food and
Nutrition Service halted authorization of new vendors as of 2011 to ensure the state WIC

Agency was able to manage the existing authorized vendor population (California DPH
2012b).
When a participant redeems a FI, the vendor records the retail value of the bundle
purchased and submits the dollar amount to the state agency for reimbursement. WIC
reimburses the vendor up to a pre-determined price ceiling–or maximum allowable
department reimbursement (MADR)–that varies by store size (measured by the number
of registers in a store) and geographical region. A pair of store-size grouping by register
and geographical region constitutes a peer group, the unit for which a MADR rate is
computed. The MADR rate is information provided to all vendors within a peer group.
A peer group’s MADR rate for a FI is a function of a twelve-week rolling average value
of all redemptions within the peer group for that FI. In particular, WIC calculates the
MADR rate for FI i and peer group j at time t as follows
10~12 ~1 1
,2 ~ 2
ij ij i ijt t t tX cMADR σ= +
where ~12ijtX is the rolling twelve-week average value of redemptions in the FI-peer group
combination, ~12ijtσ is the standard deviation and ,10
~12itc is a scaling constant. The agency
specifies the scaling constant such that peer groups with high variance in 10+ register
store redemption values have a higher MADR rate. This specification gives vendors in
geographic peer groups with highly variable prices a greater level of tolerance in the
maximum they can charge for a FI.
Recently, WIC shifted policy so that the aforementioned MADR rate formula
only applies to larger stores, those with five or more registers. Instead, WIC allows 1-2
register (3-4 register) stores a 15% (11%) markup over the average redemption value of a
FI for stores with five or more registers. This change in how MADR rates were calculated
was intended to reduce costs by restraining the amount smaller stores charge to the state,
while allowing them to charge slightly more on average due to potential cost
disadvantages.
For many grocery chains and supercenter retailers, the share of WIC sales relative
to total sales is small. And, because these retailers must compete with each other for
market share of paying customers, the MADR rate is often not a binding constraint.
However, in the past decade, so-called A-50 stores (stores for which more than 50
percent of their food revenue is derived from WIC sales) that cater largely or exclusively
to WIC consumers entered the market and captured a significant share of WIC business.
A-50 stores include small food markets that accommodate large numbers of WIC
participants and so-called “WIC-only Stores”, food retailers that carry only WIC products
and serve WIC participants exclusively.
Compared to traditional food retailers, many A-50 vendors claim to offer a
shopping environment amenable to the comfort and needs of WIC consumers. These
stores are large in number, amounting to just over 900, more than 15% of WIC
authorized vendors in California. A-50 vendors’ redemptions account for over one-third
of the value of all WIC redemptions in the state. To control costs stemming from these
stores, the A-50 MADR rate is set equal to the statewide average redemption value for
the FI, which is often much lower than the MADR rate of non-A50 vendors of similar
size. The low MADR rate is typically a binding constraint for A-50 vendors, resulting in
these vendors charging approximately the MADR rate consistently for a given FI.
A-50 stores tend to concentrate in geographic areas with relatively high densities
of low-income households with typically more than one A-50 vendor in a given locale.

The proximity of A-50 stores to one another as well as other authorized WIC vendors
prompts the question: do these stores compete with all WIC vendors and, if so, how?
Because WIC customers are not sensitive to the price of WIC authorized foods, it must be
that A-50 stores do not compete using price as a strategic variable and instead use non-
price dimensions to attract WIC participants.
One such avenue for non-price competition is the quality and quantity of the
brands of a given product offered by an A- 50 store. WIC minimum stocking
requirements only require that a vendor carry a certain number of items of at least one
brand of every WIC product category. However, we observe that A-50 stores tend to
carry multiple brands for many product categories, likely because variety will appeal to
the customers. On the other hand, the comparatively low MADR rates in place for A-50
stores may induce these vendors to cut costs by carrying brands that are relatively low
cost. To this end, this paper investigates the relationship between the institutional details
of California WIC and its impact on the brand choice of A-50 vendors.
Previous Work Attention paid to WIC in the economics literature is small relative to its larger food
assistance counterpart SNAP. To date, the studies that address the WIC Program have
fallen into one of two veins. One includes market impact studies of sole-source infant
formula contracts. For example, Oliveira et al. (2004) examine the role that
manufacturers played in rising infant formula prices following the implementation of
sole-source contracting.
The other strand of literature includes analysis health impact on WIC participants.
Arcia, Crouch, and Kulka (1990) examine the changes in reported consumption from two

survey datasets, one survey conducted before WIC enrollment and one during enrollment.
The authors observe a reduction in the number of away-from-home meals consumed, an
increase in healthy food intake, and no change in total household food expenditure.
Subsequent work, using similar data, corroborates the second conclusion, finding that
WIC participants, on average, consume food with less added sugar intake (Wilde,
McNamara, and Ranney 1999) than non-participants. Carlson and Senauer (2003) show
that young children enrolled in WIC have better health on average than non-enrolled.
Studies on Nonprice Competition in Food Retailing
Bonanno and Lopez (2009) model milk demand as a function of price and the food and
non-food services offered by supermarket chains. The authors frame services as demand
shifters that linearly increase marginal operating costs. Using scanner data on milk from
several major U.S. metropolitan regions, combined with knowledge of services offered,
they find in-store services tend to increase market share and retain a relatively price-
inelastic clientele.
Richards and Hamilton (2006) investigate how supermarket chains strategically
use product category heterogeneity, measured by the number of varieties of a product that
the store carries. A supermarket chain’s demand curve follows from a nested logit
approach in the vein of McFadden (1978), where consumers’ utility comes from the chain
patronized and products purchased, consecutively. Both components of utility are
subsumed into a nested CES function, incorporating preference for variety as the sole
determinant of the utility of chain patronization (Dixit and Stiglitz 1977). Like Bonanno

and Lopez (2009), the authors employ scanner data and analyze the fresh fruit offerings
of Los Angeles area supermarket chains.
Richards and Hamilton (2006) find that price and variety choices are strategic
complements, allowing supermarkets to increase the number of products they carry in
order to maintain market share while raising price. Additionally, supermarkets tend to
match variety offerings meaning one chain increases the type of fresh fruit that it carries
in response a competitor increasing its product offerings in the fresh fruit category.
However, the response is not homogenous across firms.
Heterogeneity among any food retailers could exist for a number of reasons. For
example, Benson and Faminow (1985) applied the Hotelling (1929) framework coupled
with cost variation to show that spatial differentiation can account for price dispersion.
In principle, the geographic space of Benson and Faminow (1985) can be extended
generally to all modes of address product differentiation.
Addressing geographic space and the effect of price promotions on fast-food
demand, Kalnins (2003) takes a spatial econometric approach in the vein of Anselin
(2006). The author’s reduced form approach models the strategic variable of one firm as
a direct function of those of all neighboring competing firms. One advantage of this
approach is the ability to employ various measures of distance of firms from one another.
Additionally, when price is not a strategic variable as with WIC A-50 stores, the
methodology can be readily applied to non-price strategic variables.
In contrast to the extant literature on the WIC program, our primary objective in
this study is to utilize the unique features of the Program to address a broader set
questions related to food retailing and grocer non-price competition rather than

exclusively evaluating program impacts. We explore to what extent both types of spatial
differentiation (product and geographic) drive observed heterogeneity among A-50 WIC
vendors. Whereas price competition is a confounding factor in the existing non-price
competition literature, our approach takes advantage of the institutional details of WIC
where price is organically non-strategic. In this setting, we explore how A-50 vendors
engage in non-price competition to achieve spatial oligopoly when only non-price
strategic choice variables are available.
Conceptual Framework Economists have long been interested in various modes of product differentiation
relevant to competition in food retail. Two types of product differentiation paradigms
comprise the broader address model approach to modeling product differentiation: i)
horizontal differentiation, where consumers differ across product attribute space in their
preferences (Hotelling 1929; d’Aspremont et al. 1979; Benson and Faminow 1985), and
ii) vertical differentiation where consumers all prefer high quality goods but vary in
intensity of preference (Mussa and Rosen 1978). Alternatively, the non-address approach
models study the number of products supplied by multiproduct firms in the face of
consumer preference for variety (Dixit and Stiglitz 1977; Spence 1976). Both approaches
potentially provide at least a partial explanation for WIC vendors’ brand stocking choices
and hence we synthesize the address and non-address conceptual frameworks to account
for them all.
Consider a vendor’s choice to stock, for example, one particular brand of ready-
to-eat breakfast cereal. A highly differentiated product, consumers vary in the location of
their preference (or address) over the horizontal product characteristics of ready-to-eat

breakfast cereal brands (e.g.,flavor, sugar content, and type of grain). The domain of a
particular characteristic can be thought of as Hotelling’s linear city where consumers are
distributed along the line in accordance to their preference. Choosing to stock (or locate)
a ready-to-eat breakfast cereal, say, high in whole grains attracts consumers located near
this product. However, consumers who prefer cereal made of refined grains are less
enticed as they would endure a significant “transport cost,” in utility terms, to consume
this good.
Additionally, this candidate ready-to-eat breakfast cereal brand can have a distinct
vertical quality component such that all consumers could agree that it was preferred to
other brand offerings. For example, consumers may prefer a nationally recognizable
brand to a generic brand of cereal although differ in their intensity of this preference. A
vendor who stocks a higher quality product entices consumers to endure the transport
costs to purchase the good. We can think of consumers having an “address” here also
such that consumers are located along a continuum according to their intensity of
preference.
However, most food retailers stock more than one brand of most products. And,
likewise, consumers may purchase multiple brands with different horizontal and vertical
characteristics. In this case, consumers may have a preference for variety of brands that
may or may not be independent of a preference over the qualities of a single good. On
one hand, between shopping trips, a consumer may desire to alternate between two or
more cereal brands. On the other hand, the consumer may be shopping for multiple
individuals, each with their own unique addresses in product attribute space. Both

scenarios can account for consumers preferring vendors who carry more brands then
others.
In studying the optimal provision of product variety by multiproduct firms,
studies in the vein of Dixit and Stiglitz (1977) and Spence (1976) use a CES utility
function where utility is increasing in the number of products offered. An address
approach, often assumes a utility function that is increasing in a product’s proximity to
the consumer in space (either geographic or product characteristic) (Hotelling 1929,
d’Aspremont 1979) or increasing the quality of a product consumed (Mussa and Rosen
1978). Because both address and non-address differentiation plays a role in the brands
vendors chose to stock, we do not assume an explicit form of the utility function to
motivate the approach.
Instead, let ( )iju x be the indirect utility of WIC participant j associated with
purchasing a particular FI bundle from vendor i where ix is a -dimensionalk vector of the
k non-price brand-related characteristics of vendor i . We take any element of ix to be
either the quantity or quality measure of brands for a given product category. Utility
( )iju x is not a function of prices because WIC participants redeem their FI at no cost.
For simplicity, consider the case where ix is one-dimensional. We assume ( )iju x
to have the property that 0'( )j iu x ≥ consistent with the utility specifications utilized in
both address and non-address specifications. For example, if ix is the number of
breakfast cereals offered 0'( )j iu x ≥ could arise from either a consumer’s preference for
variety or a brand being proximate to consumer i ’s location in product space.
Alternatively, if ix measures the quality of brands then we expect 0'( )j iu x ≥ as well.

Participants choose to redeem their FI at the vendor for which their utility is
maximized. Then vendor i ’s demand for a given product category is the number of
participants for which ( ) ( )j i j iu x u x−> where i− denotes all other vendors who are not i .
It follows then that vendor i ’s demand is function of both ix and ix− and is defined as
, )(i i if x x . It follows from the utility function, ( )iju x , that vendor i ’s demand function
has the properties / 0i if x∂ ∂ > and / 0i lf x∂ ∂ < for l i∈− .
We assume the objective of the A-50 vendor is to maximize profits by selling FIs
rather than specific goods themselves. Let the redemption value of the FI for vendor i be
denoted as [0, ]ip p∈ where p is the FI MADR rate. The profit maximization problem of
vendor i is
00
( ) ( , )( )i
i
i i i i i ip px
p c xX x xA fM −≤ ≤≥
Π = −
where ( )i ic x is vendor i ’s marginal cost of the FI at brand-characteristic level ix with the
properties ) 0'(i ixc > and )'' ( 0i ixc > .
Maintaining 1k = , the first-order conditions of the problem are
( , ) 0ii i
i
f x xp −
∂Π= ≥
∂ (1.1)
( ) ( , ) ( ) 0' ( )[ ]i i i li i i i i i i
l ii i l i
f f xc x f x x p c xx x x x−
∀ ∈−
∂Π ∂ ∂ ∂= − + − + ≤
∂ ∂ ∂ ∂∑ (1.2).
Equation (1.1) then holds with strict inequality meaning vendor i sets ip p= . In other
words, because WIC participants are price inelastic, A-50 vendors will price goods such
that the redemption value is equal to the MADR rate.
Equation (1.2) holds in equality since ) 0"(i ixc > and we rewrite it as

'( ) ( ) ( , )( )[ ]i i li i i i i i i
l ii l i
f f xp c x c x f x xx x x −
∀ ∈−
∂ ∂ ∂− +
∂ ∂ ∂=∑ (1.3).
Intuitively, vendor i increases the non-price brand variable ix until the gain in revenue
from increasing demand, taking into account competitors’ responses, equals the change in
marginal cost of increasing ix . In other words, equation (1.3) summarizes an A-50
vendor’s relevant strategic behavior as engaging in non-price brand competition to
balance the tradeoff between shifting demand and increasing costs.
In general, however, it is reasonable to think that 1k > since all food vendors in
practice face brand choices over many product categories. With respect to the model of
A-50 vendor behavior, equation (1.3) would evolve into a system of k equations with
conduct parameters allowing for vendor l to respond to any element of ix in any of the k
dimensions.
The theoretical literature of multidimensional product differentiation in
price competition predicts that firms differentiate in only one characteristic, the one with
the largest marginal utility (Tabuchi 1994; Irmen and Thisse 1998). This result is driven
by the tradeoff to maximize market share (minimally differentiating) while also
distancing oneself from a competitor (maximizing differentiation) to minimize price
competition. Offsetting economic forces would appear to be at work. On one hand, an A-
50 store can increase the number and quality of brands it carries, relative to competing
WIC vendors, to attract customers. On the other hand, given that prices received by the
A-50 vendors are fixed at the price ceiling, cost minimization through carrying cheaper
brands presents itself as the only option to increase profit margins. Because A-50 vendors
do not engage in price competition and product differentiation is costly, the degree to

which vendors differentiate themselves will be driven by the cost-to-market-share
tradeoff. Thus, vendors must balance the profit-margin effect of carrying cheap brands
with the market-share effect of carrying more brands and more expensive brands.
Data We use four data sets to estimate the impact of spatial competition on brand choice: (i)
individual vendor FI redemption data for California, (ii) an in-store product survey for
California WIC vendors, (iii) store-wide wholesale and price information on all food
products sold for several leading grocery chains in Northern and Southern California, and
(iv) information on the precise geographic locations of all WIC vendors in California.
The first dataset consists of all FI redemptions made under the California WIC
Program for the 29-month period from October 2009 to February 2012. Each month of
redemption data contains approximately five million observations or about 150 million
observations in total. The variables contained in the redemption data can be divided into
three categories: i) FI identification and information, ii) vendor identification and
information, and iii) redemption information.
Each observation in the data identifies the specific FI for which the vendor
requested redemption. Further, the data provide information on the participant category
(e.g., breastfeeding mother, pregnant woman, etc.) under which the FI is provided, as
well as a brief description of the types of items allowed by the FI. However, we do not
observe the specific products purchased.
With respect to vendor information, each observation provides vendor
identification number, contract identification number, zip code, county of the vendor
location, and the vendor peer group. From the vendor identification number, vendor name

and address information were merged onto the data to allow for the identification of
specific retailers or chains of retailers. Based upon location and peer-group information,
the number of registers operated at each vendor location was inferred. Redemption
information includes the MADR rate and the amount redeemed.
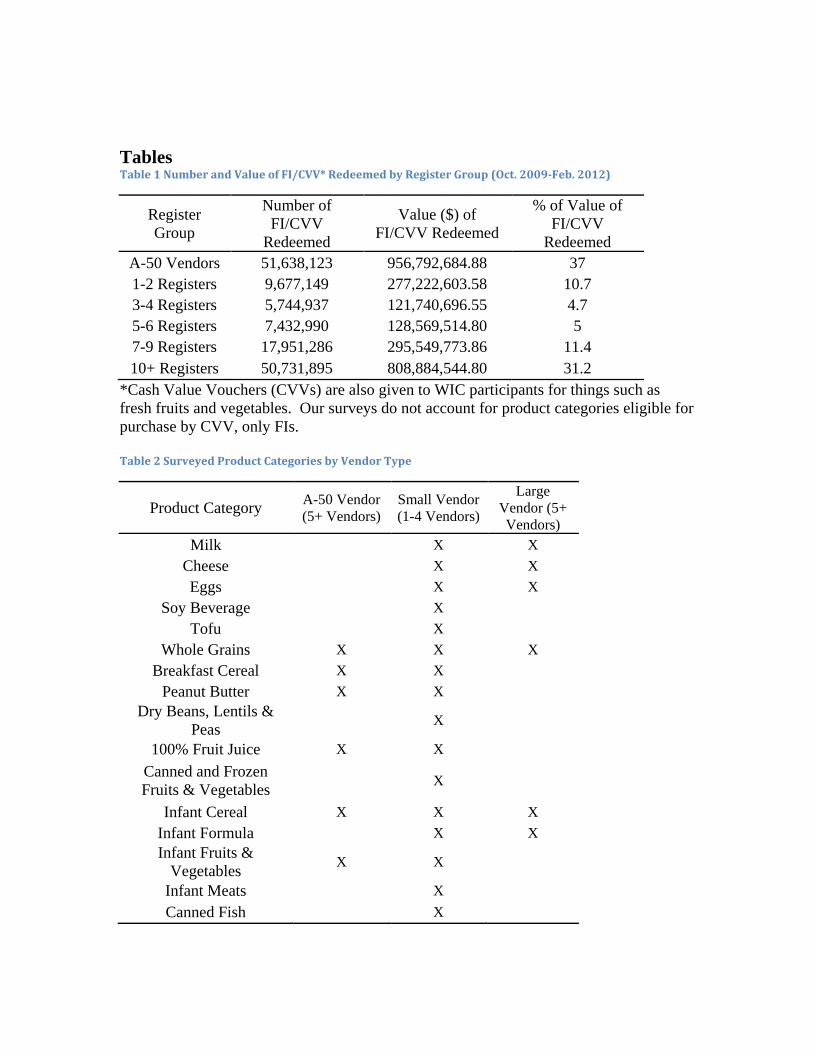
This first dataset is important because we can observe the market share of A-50
vendors in the California WIC program for the above time-period. Table 1 summarizes
the number and value of WIC redemptions by A-50 vendors and non A50-vendors by
number of registers which proxies for store size. A-50 vendors themselves redeem 37%
of the value of total WIC transactions despite comprising less than 17% of all WIC
vendors. The value of A-50 vendors’ redemptions is even higher than those of large (10+
registers) vendors, which include large supermarkets and supercenters. This provides
evidence that A-50 vendors play a big role in the WIC program.
The second dataset was derived from three in-store surveys (two of non A-50
vendors and one of A-50 vendors) that we designed and which were implemented with
the cooperation of the California WIC Program: a small-store survey was designed for
non A-50 vendors with from 1 – 4 registers; a large-store survey was designed for
vendors with 5 or more registers; and an A-50 vendor survey. Both surveys were
conducted by the Program’s local vendor liaisons during two distinct time periods. The
A-50 survey was completed by the A-50 vendors themselves, with the results transmitted
to the California WIC Program, which required participation by the A-50 vendors.
Table 2 provides a list of the product categories that were included in each of the
surveys. For a particular product category, we observe the specific brands that a vendor
carried on shelves at the time of the survey. This allows us to construct measures of
brand competition for vendors, for example, the number of brands of breakfast cereal
carried, which is computed and summarized in Table 3 for surveyed A-50 vendors.
There is a significant amount of variation in the number of breakfast cereal brands
observed. Sixteen possible brands can be observed, and looking at Table 3, we see then
on average all A-50 vendors carry about 75% of them. However, some vendors carry all
of them while others carry as little as four brands. There is a small difference across
differently sized stores, for example, the small stores tend to carry on average one brand
less. Further, the standard deviation for largest A-50 vendors (5 registers) is the smallest
of all.
The third dataset was provided by the California WIC Program and contains
weekly wholesale cost and retail price data for three large supermarket chains in Northern
California and four large supermarket chains in Southern California for the time period
August 2011 through May 2012. Wholesale costs and retail prices in this dataset are
averaged for each supermarket chain and location in each week. The data also contain
product description, package quantity, product size, and UPC code.
For surveyed products from the second data set, we can match wholesale prices to
the brands carried by vendors. It is a common modeling framework to assume higher
quality products are more costly to produce (Mussa and Rosen 1978) and hence we use
wholesale costs to proxy quality of brand. We take the average wholesale cost for a
given brand across the time period in terms of cents per ounce. For breakfast cereal
brands, for example, nationally recognized brands’ wholesale price mean is 24.9 cents
per ounce with a standard deviation of 5.7, with some brands falling as low as 14.5 cents
per ounce. One surveyed “off” brand (Mill Select) was not included in the wholesale data

and the highest average wholesale cost of a comparable non-surveyed WIC-certified off-
brand (Western Family, roughly 11.3 cents per ounce). This allows us to present
variation in vendor’s wholesale costs in a conservative manner. Table 4 summarizes the
average of combined nationally recognized and proxied off-brands wholesale costs for all
the brands a vendor carries by number of registers. With lower-cost off-brands included,
the average wholesale cost per brand carried ranges from roughly 19.32 to 27.30 cents
per ounce with no significant differences across store size.
The fourth data set, the exact geographic location of all vendors, allows us to
relate, for instance, the number of and average supermarket wholesale costs of breakfast
cereals spatially. Figures 1 and 2 respectively map these two variables for all A-50
vendors in Los Angeles County, a geographic region with a significant number of A-50
vendors. Thiessen polygons centered on a vendor incorporate contiguous vendors as
competing neighbors. A pattern emerges that many vendors tend to have similar values
of the two measures. However, this pattern is not uniform, noting that the largest
deviations occur in more dense parts of the county. For example, towards the bottom-
center of Figure 1 are two vendors with very high and very low numbers of breakfast
cereal brands on shelves who are neighbors. Interestingly, the two vendors switch roles
when it comes to supermarket wholesale costs: the vendor with the low number carries
brands with higher wholesale costs and vice versa as seen in Figure 2. These two figures
alone a rich picture of competition in brands that is heterogeneous across space.
Conclusion The California WIC program’s unique institutional features present a valuable
opportunity to study non-price competition among food retailers. In particular, WIC
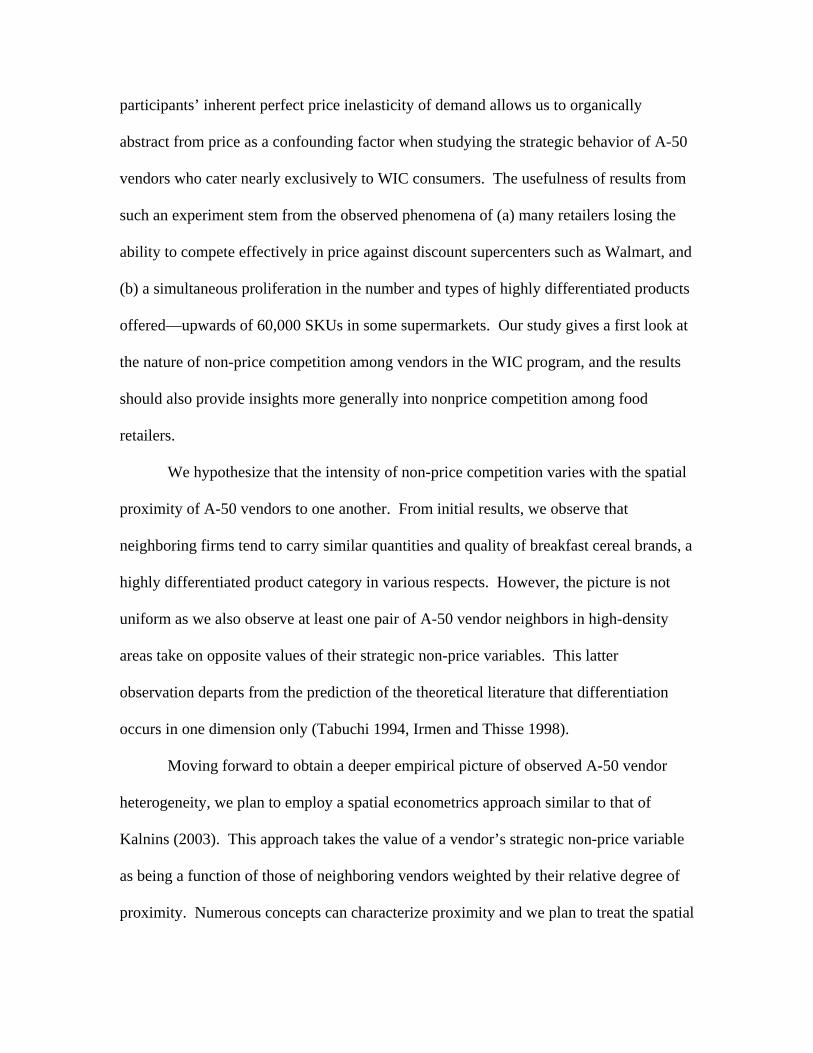
participants’ inherent perfect price inelasticity of demand allows us to organically
abstract from price as a confounding factor when studying the strategic behavior of A-50
vendors who cater nearly exclusively to WIC consumers. The usefulness of results from
such an experiment stem from the observed phenomena of (a) many retailers losing the
ability to compete effectively in price against discount supercenters such as Walmart, and
(b) a simultaneous proliferation in the number and types of highly differentiated products
offered—upwards of 60,000 SKUs in some supermarkets. Our study gives a first look at
the nature of non-price competition among vendors in the WIC program, and the results
should also provide insights more generally into nonprice competition among food
retailers.
We hypothesize that the intensity of non-price competition varies with the spatial
proximity of A-50 vendors to one another. From initial results, we observe that
neighboring firms tend to carry similar quantities and quality of breakfast cereal brands, a
highly differentiated product category in various respects. However, the picture is not
uniform as we also observe at least one pair of A-50 vendor neighbors in high-density
areas take on opposite values of their strategic non-price variables. This latter
observation departs from the prediction of the theoretical literature that differentiation
occurs in one dimension only (Tabuchi 1994, Irmen and Thisse 1998).
Moving forward to obtain a deeper empirical picture of observed A-50 vendor
heterogeneity, we plan to employ a spatial econometrics approach similar to that of
Kalnins (2003). This approach takes the value of a vendor’s strategic non-price variable
as being a function of those of neighboring vendors weighted by their relative degree of
proximity. Numerous concepts can characterize proximity and we plan to treat the spatial

dimension using various measures. We will compare our results to existing empirical
studies of non-price competition and the predictions of the theoretical literature as well.
Tables Table 1 Number and Value of FI/CVV* Redeemed by Register Group (Oct. 2009-Feb. 2012)
Register Group
Number of FI/CVV
Redeemed
Value ($) of FI/CVV Redeemed
% of Value of FI/CVV
Redeemed A-50 Vendors 51,638,123 956,792,684.88 37 1-2 Registers 9,677,149 277,222,603.58 10.7 3-4 Registers 5,744,937 121,740,696.55 4.7 5-6 Registers 7,432,990 128,569,514.80 5 7-9 Registers 17,951,286 295,549,773.86 11.4 10+ Registers 50,731,895 808,884,544.80 31.2
*Cash Value Vouchers (CVVs) are also given to WIC participants for things such as fresh fruits and vegetables. Our surveys do not account for product categories eligible for purchase by CVV, only FIs. Table 2 Surveyed Product Categories by Vendor Type
Product Category A-50 Vendor (5+ Vendors)
Small Vendor (1-4 Vendors)
Large Vendor (5+ Vendors)
Milk X X Cheese X X Eggs X X
Soy Beverage X Tofu X
Whole Grains X X X Breakfast Cereal X X
Peanut Butter X X Dry Beans, Lentils &
Peas X 100% Fruit Juice X X
Canned and Frozen Fruits & Vegetables X
Infant Cereal X X X Infant Formula X X Infant Fruits &
Vegetables X X Infant Meats X Canned Fish X

Table 3 Number of Surveyed Brands of Breakfast Cereals by Number of Registers for A-50 Vendors Only
Registers n Mean Std. Dev. Min Max
1 109 12.13 0.28 4 16 2 91 11.38 0.32 4 16 3 46 13.22 0.24 7 16 4 28 13.68 0.27 9 16 5 24 13.58 0.12 12 14
All 298 12.33 2.70 4 16
Table 4 Average Supermarket Wholesale Cost of A-50 Vendors' Observed Surveyed Brands
Registers n Mean Std. Dev. Min Max
1 109 22.34 1.69 19.32 27.30 2 91 22.29 1.70 17.02 26.60 3 46 22.25 1.45 19.75 24.27 4 28 22.98 1.56 19.75 24.27 5 24 23.23 1.37 21.35 24.27
All 298 22.45 1.64 17.02 27.30

Figure 1 Number of Observed Breakfast Cereal Brands for LA County A-50 Vendors (white is lowest and black is highest)
Figure 2 Average Supermarket Wholesale Costs of Breakfast Cereal Brands Carried for LA County A-50
Vendors (white is lowest and black is highest)

References Anselin, L. 2006 “Spatial Econometrics.” Palgrave Handbook of Econometrics: Volume
1, Econometric Theory. pp. 901-969 Bonnano, A. and R.A. Lopez. 2009. “Competition Effects of Supermarket
Services."American Journal of Agricultural Economics. 91(3):555-568. California Department of Public Health. 2012a. “Moratorium on Accepting New Vendor
Store Applications Will Continue Indefinitely, Discontinuation of the Exception List." Vendor Alerts. Accessed: http://www.cdph.ca.gov/programs/wicworks/Documents/VendorAlerts/WIC-Vendor-Alert-2012-10.pdf
California Department of Public Health. 2012b. “Food Policy Manual." Accessed:
http://www.cdph.ca.gov/programs/wicworks/WIC%20Foods/WIC-FP-1-0-WICFoodAuthorizationProcess.pdf
Carlson, A. and B. Senauer. 2003. “The Impact of the Special Supplemental
NutritionProgram for Women, Infants, and Children on Child Health." American Journal of Agricultural Economics. 85(2): 479-491.
d'Aspremont, C., J.J. Gabszewicz and J.-F. Thisse. 1979. “On Hotelling’s Stability in
Competition." Econometrica. 47(5):1145-1150 Davis, D.E. 2007. “Containing the Cost of Infant Formula to the WIC Program." Issue
Briefs, South Dakota State University. No. 2007491. Davis, D.E. 2012. “Bidding for WIC Infant Formula Contracts: Do Non-WIC Customers
Subsidize WIC Customers?" American Journal of Agricultural Economics. 94(1): 80-96.
Dixit, A.K. and J. Stiglitz. 1977. “Monopolistic Competition and Optimal Product
Diversity." American Economic Review. 67(3): 297-308. Feather, P.M. 2003. “Valuing Food Store Access: Policy Implications for the Food Stamp
Program." American Journal of Agricultural Economics. 85(1): 162-172. Irmen, A. and J.-F. Thisse. 1998. “Competition in Multi-characteristics Space: Hotelling
Was Almost Right." Journal of Economic Theory. 78(1): 76-102. Kalnins, A. 2003. “Hamburger Prices and Spatial Econometrics." Journal of Economics
and Management Strategy. 12(4): 591-616. McCorriston, S. 2002. “Why Should Imperfect Competition Matter to Agricultural
Economists?" European Review of Agricultural Economics. 29(3):349-372.

McFadden, D. 1973. “Conditional Logit Analysis of Qualitative Choice Behavior."
Frontiers in Econometrics. pp. 105-142. Mussa, M. and S. Rosen. 1978. “Monopoly and Product Quality." Journal of Economic
Theory. 18(2):301-317 Oliveira, V, E. Frazao and D. Smallwood. 2010. “Rising Infant Formula Costs to the
WIC Program: Recent Trends in Rebates and Wholesale Prices." USDA Economic Research Report No. 59384.
Progressive Grocer. 2010. “Progressive Grocers 2010 Marketing Handbook.” Reed, A.J. and J.W. Levedahl. 2012. “WIC and the Price of Infant Formula." American
Journal of Agricultural Economics. 94(3): 687-701. Reardon T., P. Timmer, C.B. Barrett and J Berdgu. 2003. “The Rise of Supermarkets in
Africa, Asia, and Latin America." American Journal of Agricultural Economics. 85(5):1140-1146
Spence, A.M. 1976. “Product Selection, Fixed Costs and Monopolistic Competition."
Review of Economic Studies. 43(2):217-235. Tabuchi, T. 1994. “Two-Stage Two-Dimensional Competition between Two Firms."
Regional Science and Urban Economics. 24(2): 207-227. USDA Food and Nutrition Service. 2012. “WIC Program Participation and Costs." FNS
Program Data. Accessed: http://www.fns.usda.gov/pd/wisummary.htm USDA Food and Nutrition Service. 2013. “WIC Program Regulations." Accessed:
http://www.fns.usda.gov/wic/lawsandregulations/WICRegulations-7CFR246.pdf Wilde, P., P. McNamara and C. Ranney. 1999. “The Effect of Income and Food
Programs on Dietary Quality: A Seemingly Unrelated Regression Analysis with Error Components." American Journal of Agricultural Economics. 81(4):959-71.