Non Destructive destructive controls of radioactive waste ...

October 2014
NON DESTRUCTIVE TESTINGOF BRIDGES

NON DESTRUCTIVE TESTINGOF
BRIDGES
(Revised & Reprinted October 2014)
INDIAN RAILWAY INSTITUTE OF CIVIL ENGINEERINGPUNE 411001

ii

Forward to the Second Edition
The book “NON DISTRUCTIVE TESTING OFBRIDGES” was first published in June 2005. The book wasintended to help field engineers for periodically monitoringthe health of very important bridges as prescribed by IndianRailways Bridge Manual (IRBM). Since then , lot of new NDTtechniques have been used world wide. This editionincorporates new NDT testing techniques like NuclearMethod, Structural Scanning Equipment (GPR), SpectralAnalysis of Surface Waves for Unknown Foundation etc. andmany more, which were not the part of the first edition.
I hope this edition will be a useful source ofinformation for Railway engineers dealing with Non DestructiveTesting of Bridges.
Pune Vishwesh ChaubeyOctober 2014 Director / IRICEN, Pune

Preface to the Second Edition
The first edition of the book “NON DISTRUCTIVETESTING OF BRIDGES” was published in June 2005 byIndian Railways Institute of Civil Engineering, Pune. The bookwas out of print and there was great demand from fieldengineers.
In August 2009, B & S Directorate of RDSO hasissued “GUIDELINES ON NON - DESTRUCTIVE TESTINGOF BRIDGES, BS – 103”. This edition of book incorporatesthe new testing methods included in the RDSO guidelines,BS-103.
I am thankful to Shri N.C.Sharda, Senior Professor/ Track I, for his contribution in publication of this book. I amgrateful to Shri Vishwesh Chaubey, Director IRICEN, Punefor his encouragement and guidance in bringing out thispublication.
Although care has been taken to include details asper reference, still there may be some errors. I would bethankful to the readers for their suggestions , which may besent to IRICEN at [email protected] . These will be helpfulfor rectifying them.
Pune J.M.PatekariOctober 2014 Lecturer/Track-1
IRICEN/PUNE

v
PREFACE
Non-destructive testing of bridges has assumed agreater significance in the present scenario because ourexisting inspection system is not adequate to identify theinternal defects in the structures. With the recent collapsesof bridges in India and other countries the objective inspectionof bridges has become the need of the hour.
Indian Railway Bridge Manual (IRBM) prescribesperiodical Health Monitoring of Very Important Bridges by anindependent agency which includes corrosion monitoring,deterioration of material, system damage, retrofitting etc. Allthese can be done by using suitable NDT methods. Sincethe work will be executed by the independent agency, it isimportant to understand the details of the testing proceduresas the engineer may have to supervise the work at the site.Since non-destructive testing methods do not form part ofIRBM, the various methods used for testing different types ofbridges have been included in this publication.
I hope this book will be found very much useful byfield engineers, who are entrusted with the work of non-destructive testing of bridges, and will help as guide forimplementation of testing methods for inspection and testingof bridges.
Shiv KumarDirector
IRICEN/PUNE

vi
ACKNOWLEDGEMENT
The subject “non-destructive testing of bridges” isbeing taught during various courses at IRICEN. In the presentscenario, it needs special attention. Even though a lot ofinformation is available on this subject , yet when it pertainingto various types of bridges i.e. concrete, steel and masonrybridges, it is not available at one place.
The IRICEN publication is an attempt to compile allthe relevant information regarding various NDT methodscommonly in use for testing of all types of bridges on IndianRailways. Even though the publication is primarily aimed atRailway Engineers, the basic concepts are equally applicableto road bridges also.
It would not be out of place to acknowledge thesupport and assistance rendered by IRICEN faculty and staffin the above efforts. I am particularly thankful to Shri. PraveenKumar, Prof. (Computers), who has provided logisticassistance for printing of this book. The word processing ofthe manuscript and repeated editings thereof has been doneby Mrs. Gayatri. I also acknowledge the help of drawingstaff of IRICEN who have assisted in preparation of drawings.
Above all, the author is grateful to Sri Shiv Kumar,Director, IRICEN for his encouragement and advice forimproving the document.
A.K. GuptaProfessor/Track-1
IRICEN/Pune

vii
CONTENTS
CHAPTER-1 NON - DESTRUCTIVE TESTING OF BRIDGES -GENERAL
1.1 Introduction 1
1.2 Concrete Bridges 1
1.3 Steel Bridges 5
1.4 Masonry Bridges 6
CHAPTER-2 NON – DESTRUCTIVE TESTS FOR STRENGTHESTIMATION OF CONCRETE
2.1 Rebound hammer test (Schmidt Hammer) 7
2.2 Ultrasonic Pulse Velocity Tester 13measurements
2.3 Combined use of Rebound hammer and Ultrasonic 26 Pulse Velocity Method
2.4 Pull Off Test 26
2.5 Pull out Test 30
2.6 The Break-off Test 33
2.7 Penetration Resistance Methods 39
2.8 Core drilling method 41
2.9 Permeability Test 42
2.10 Bond Test 48
2.11 Maturity Method 49

viii
2.12 Complete Structural Testing 49
CHAPTER-3 NON – DESTRUCTIVE TESTS FOR CORROSIONASSESSMENT, LOCATION AND DIAMETER OFREINFORCEMENT AND COVER THICKNESS OFCONCRETE BRIDGES
3.1 Introduction 51
3.2 Half-cell Potential Measurement Method 51
3.3 Resistivity Test 56
3.4 Tests for carbonation of Concrete 59
3.5 Test for chloride content of concrete 60
3.6 Endoscopy Technique 60
3.7 Profometer 61
3.8 Micro Covermeter 63
CHAPTER-4 NON – DESTRUCTIVE TESTS FOR DETECTIONOF CRACKS / VOIDS / DELAMINATIONS ETC. INCONCRETE BRIDGES
4.1 Introduction 66
4.2 Infrared thermographic techniques 66
4.3 Acoustic Emission Technique 70
4.4 Short Pulse Radar Method 74
4.5 Stress Wave Propagation Methods 78
4.6 Crack Detection Microsscope 92
ix
4.7 Boroscope 94
4.8 Nuclear Method 97
4.9 Structural Scanning Equipment (GPR) 97
4.10 Spectral Analysis & Surface Waves 109for unknown Foundation.
CHAPTER-5 NON – DESTRUCTIVE TESTING OF STEELBRIDGES
5.1 Introduction 113
5.2 Liquid Penetrant Inspection 113Dye Penetrant Inspection
5.3 Magnetic Particle Inspection 127
5.4 Eddy Current Testing 139
5.5 Radiographic Testing 150
5.6 Ultrasonic Inspection 151
5.7 Complete Structural Testing 160
5.8 Accoustic Emission Techniques 160
CHAPTER-6 NON – DESTRUCTIVE TESTING OF MASONRYBRIDGES
6.1 Introduction 161
6.2 Flat Jack Testing 161
6.3 Impact Echo Testing 162
6.4 Impulse Radar Testing 162
6.5 Infrared Thermography 162

x
6.6 Boroscope 162
CHAPTER-7 SUMMARY OF NDT EQUIPMENTS 163AVAILABLE AND THEIR USE
LIST OF FIRMS DEALING WITH NDT EQUIPMENTS 168
REFERENCES 169

1
CHAPTER 1
NON-DESTRUCTIVE TESTING OF BRIDGES - GENERAL
1.1 Introduction
There are about 1,27,000 bridges of different types withvarying spans on Indian Railways. About 40% of these bridgesare over 100 years old and have completed their codal life. Thepresent method of bridge inspection is mostly visual and give onlysubjective assessment of the condition of bridge. Moreover presentinspection system is not capable of assessing hidden defects, ifany.
We may group the various bridges mainly in three types,based upon material of construction.
(i) Concrete bridges(ii) Steel bridges(iii) Masonry bridges
Various types of bridges are having their own strengths,weaknesses and maintenance related problems. Each type ofbridge is having different properties i.e. concrete is a heteroge-neous material but the steel is a denser and homogeneous mate-rial. Similarly in masonry structures, the condition of joints andmaterial of construction is of utmost importance. Considering theuniqueness of each type of bridge , there are different methodsadopted for inspection and maintenance based on material of con-struction. In this book, various Non-Destructive Testing (NDT)methods for testing concrete , steel and masonry bridges havebeen discussed separately.
1.2 Concrete Bridges
The quality of new concrete structures is dependent onmany factors such as type of cement, type of aggregates, watercement ratio, curing, environmental conditions etc. Besides this,

2
the control exercised during construction also contributes a lot toachieve the desired quality. The present system of checking slumpand testing cubes, to assess the strength of concrete, in struc-ture under construction, are not sufficient as the actual strength ofthe structure depend on many other factors such as proper com-paction, effective curing etc.
Considering the above requirements, need of testing ofhardened concrete in new structures as well as old structures, isthere to asses the actual condition of structures. Non-DestructiveTesting (NDT) techniques can be used effectively for investigationand evaluating the actual condition of the structures. These tech-niques are relatively quick, easy to use, cheap and give a generalindication of the required property of the concrete.This approachwill enable us to find suspected zones ,thereby reducing the timeand cost of examining a large mass of concrete. The choice of aparticular NDT method depends upon the property of concrete tobe observed such as strength, corrosion, crack monitoring etc.The subsequent testing of structure will largely depend upon theresult of preliminary testing done with the appropriate NDT tech-nique.
Purpose of Non-destructive Tests: The non-destructive evalua-tion techniques are being increasingly adopted in concrete struc-tures for the following purposes:
(i) Estimating the in-situ compressive strength
(ii) Estimating the uniformity and homogeneity
(iii) Estimating the quality in relation to standard requirement.
(iv) Identifying areas of lower integrity in comparison to other parts.
(v) Detection of presence of cracks, voids and other imperfec-tions.
(vi) Monitoring changes in the structure of the concrete whichmay occur with time.
(vii) Identification of reinforcement profile and measurement ofcover, bar diameter, etc.

3
(viii) Condition of prestressing /reinforcement steel with respect tocorrosion.
(ix) Chloride, sulphate, alkali contents or degree of carbonation.
(x) Measurement of Elastic Modulus.
(xi) Condition of grouting in prestressing cable ducts.
Many of NDT methods used for concrete testing have theirorigin to the testing of more homogeneous, metallic system. Thesemethods have a sound scientific basis, but heterogeneity of con-crete makes interpretation of results somewhat difficult. Therecould be many parameters such as materials, mix, workmanshipand environment, which influence the result of measurements.Moreover the test measure some other property of concrete (e.g.hardness) yet the results are interpreted to assess the differentproperty of the concrete e.g. (strength). Thus, interpretation of theresult is very important and a difficult job where generalization isnot possible. Even though operators can carry out the test butinterpretation of results must be left to experts having experienceand knowledge of application of such non-destructive tests.
Variety of NDT methods have been developed and areavailable for investigation and evaluation of different parametersrelated to strength, durability and overall quality of concrete. Eachmethod has some strength and some weakness. Therefore pru-dent approach would be to use more than one method in combina-tion so that the strength of one compensates the weakness of theother. The various NDT methods for testing concrete bridges arelisted below –
A. For strength estimation of concrete
(i) Rebound hammer test
(ii) Ultrasonic Pulse Velocity Tester
(iii) Combined use of Ultrasonic Pulse Velocity tester and reboundhammer test
(iv) Pull off test

4
(v) Pull out test
(vi) Break off test
(vii) Penetration Resistance Test (Windsor Probe)
(viii) Core Drilling Method
(ix) Permeability Test
(x) Bond Test
(xi) Maturity Method
(xii) Complete Structural Testing
B. For assessment of corrosion condition of reinforcementand to determine reinforcement diameter and cover
(i) Half Cell Potentiometer
(ii) Resistively Meter Test
(iii) Test for Carbonation of Concrete
(iv) Test for Chloride Content of Concrete
(v) Endoscopy Technique
(vi) Profo Meter
(vii) Micro Cover Meter
C. For detection of cracks/voids/ delamination etc.
(i) Infrared Thermographic Technique
(ii) Acoustic Emission Techniques
(iii) Short Pulse Radar Methods
(iv) Stress Wave Propagation Methods
- pulse echo method
- impact echo method
- response method
(v) Crack Detection Microscope
(vi) Boroscope

5
(vii) Nuclear Method
(viii) Structural Scanning Equipment
(ix) Spectral Analysis of Surface Waves for Unknown Foundation
All the above said methods have been discussed in detailin this book.
1.3 Steel Bridges
On Indian Railways, the superstructure of the large num-ber of major bridges are of steel, and substructure is generally ofconcrete/masonry. These steel bridges are fabricated using struc-tural steel section i.e. channels, angles, plates and I-sections etc.The bridges are subjected to severe dynamic stresses under pas-sage of traffic and because of these stresses, the deterioration ofthe materials takes place.
In our system of inspection, we are mainly carrying outthe visual inspection of the various parts of bridges, rivet testingand inspection of bearings etc. But all these methods do not giveany indication about the microcracking, presence of flaws/internalblow holes/lamination etc. in the bridge members. Moreover someof the members of the bridge girders are difficult to inspect be-cause of inaccessibility and in those cases, the NDT techniquecan be used effectively for inspection and evaluation of structures.
The various NDT methods for testing steel bridges arelisted below:
(i) Liquid Penetrant Testing(ii) Magnetic Particle Testing(iii) Electromagnetic Testing or Eddy Current Testing(iv) Radiography(v) Ultrasonic Testing(vi) Complete Structural Testing(vii) Acoustic Emission Techniques

6
All the above said methods have been discussed in de-tail in this book.
1.4 Masonry Bridges
A large no. of bridges on Indian Railways are masonrybridges in which foundation or substructure is of either stone orbrick masonry. In addition, a large no. of bridges are masonry archbridges which have become quite old and already outlived theirdesign life. The weakest location in a masonry bridge is the joint,as the deterioration gets initiated from the joints. With the pas-sage of loads and over a period of time the deterioration of thematerial itself take place due to which the strength of the masonrystructures gets affected. At the time of inspection, normally thecondition of joints or the material on the outer surface is noted butit does not give any indication about the inherent defects withinthe structures. Moreover the present system of inspection is notabout detecting the deterioration in strength of the stone/brick ma-sonry because of the weathering action and other factors. In In-dia, the NDT of masonry structures is still in necessant stage.There are lot of methods available for NDT of masonry structure,as indicated below:
(a) Flat Jack Testing
(b) Impact Echo Testing
(c) Impulse Radar Testing
(d) Infrared Thermography
(e) Boroscope
As the application of the above said NDT methods formasonry inspection is not very common in India, details given inthis book are just for general guidance.
7
CHAPTER-2
NON-DESTRUCTIVE TESTS FOR STRENGTHESTIMATION OF CONCRETE
2.1. Rebound Hammer Test (Schmidt Hammer)
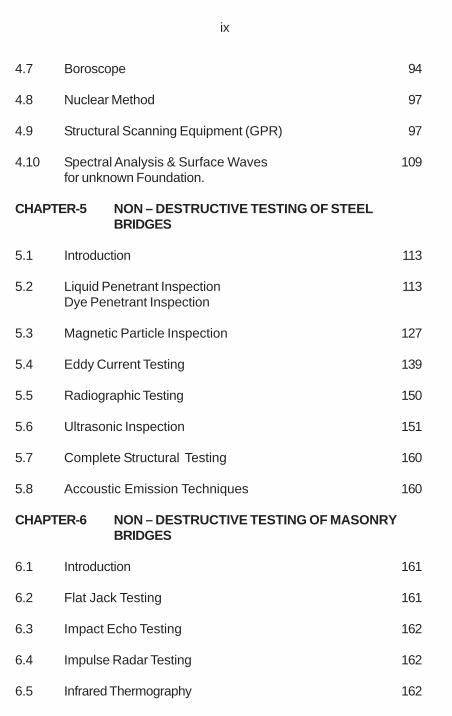
This is a simple, handy tool, which can be used to providea convenient and rapid indication of the compressive strength ofconcrete. It consists of a spring controlled mass that slides on aplunger within a tubular housing. The schematic diagram showingvarious parts of a rebound hammer is given as Fig 2.1.1
1. Concrete surface; 2. Impact spring; 3. Rider on guide rod; 4.Window and scale; 5. Hammer guide; 6. Release catch; 7. Com-pressive spring; 8. Locking button; 9. Housing; 10. Hammer mass;11. Plunger
Fig. 2.1.1 Components of a Rebound Hammer
2.1.1 Object
The rebound hammer method could be used for –(a) Assessing the likely compressive strength of concrete with
the help of suitable co-relations between rebound index andcompressive strength.
(b) Assessing the uniformity of concrete

8
(c) Assessing the quality of concrete in relation to standardrequirements.
(d) Assessing the quality of one element of concrete in relationto another
This method can be used with greater confidence for dif-ferentiating between the questionable and acceptable parts of astructure or for relative comparison between two different struc-tures.
Fig. 2.1.2 Rebound Hammer
2.1.2 Principle
The method is based on the principle that the rebound ofan elastic mass depends on the hardness of the surface againstwhich mass strikes. When the plunger of rebound hammer ispressed against the surface of the concrete, the spring controlledmass rebounds and the extent of such rebound depends upon thesurface hardness of concrete. The surface hardness and thereforethe rebound is taken to be related to the compressive strength ofthe concrete. The rebound value is read off along a graduatedscale and is designated as the rebound number or rebound index.The compressive strength can be read directly from the graphprovided on the body of the hammer.

9
The impact energy required for rebound hammer fordifferent applications is given below –
Sr. Approximate impactNo. Application energy required for
the reboundhammers (N-m)
1. For testing normal weight concrete 2.252. For light weight concrete or small
and impact sensitive part ofconcrete 0.75
3. For testing mass concrete i.e. inroads, airfield pavements andhydraulic structures 30.00
Depending upon the impact energy, the hammers areclassified into four types i.e. N, L, M & P. Type N hammer havingan impact energy of 2.2 N-m and is suitable for grades of concretefrom M-15 to M-45. Type L hammer is suitable for lightweightconcrete or small and impact sensitive part of the structure. TypeM hammer is generally recommended for heavy structures andmass concrete. Type P is suitable for concrete below M15 grade.
2.1.3 Methodology
Before commencement of a test, the rebound hammershould be tested against the test anvil, to get reliable results. Thetesting anvil should be of steel having Brinell hardness number ofabout 5000 N/mm2. The supplier/manufacturer of the reboundhammer should indicate the range of readings on the anvil suitablefor different types of rebound hammer.
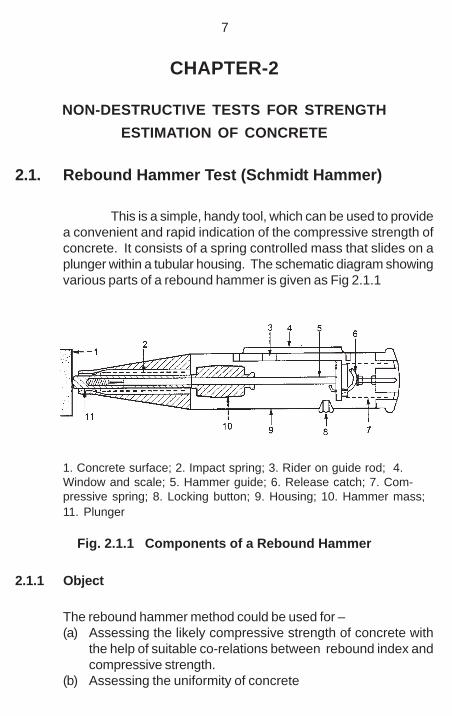
For taking a measurement, the hammer should be held atright angles to the surface of the structure. The test thus can beconducted horizontally on vertical surface and vertically upwardsor downwards on horizontal surfaces (Fig.2.1.3).
10
Fig. 2.1.3 Various positions of Rebound Hammer
If the situation so demands, the hammer can be held atintermediate angles also, but in each case, the rebound numberwill be different for the same concrete.
The following should be observed during testing.(a) The surface should be smooth, clean and dry(b) The loosely adhering scale should be rubbed off
with a grinding wheel or stone, before testing(c) Do not conduct test on rough surfaces resulting
from incomplete compaction, loss of grout,spalled or tooled surfaces.
(d) The point of impact should be at least 20mm awayfrom edge or shape discontinuity.
Around each point of observation, six readings of reboundindices are taken and average of these readings after deleting out-liers as per IS 8900:1978 is taken as the rebound index for thepoint of observation.
HORIZONTAL POSITION
VERTICAL UPWARD POSITION
VERTICAL DOWNWARDPOSITION
VERTICAL SURFACE

11
2.1.4 Procedure for obtaining correlation between compressivestrength of concrete and rebound number
The most satisfactory way of establishing a correlationbetween compressive strength of concrete and its rebound num-ber is to measure both the properties simultaneously on concretecubes. The concrete cubes specimens are held in a compressiontesting machine under a fixed load, measurements of reboundnumber taken and then the compressive strength determined asper IS 516: 1959. The fixed load required is of the order of 7 N/mm2 when the impact energy of the hammer is about 2.2 Nm. Theload should be increased for calibrating rebound hammers of greaterimpact energy and decreased for calibrating rebound hammers oflesser impact energy. The test specimens should be as large amass as possible in order to minimize the size effect on the testresult of a fullscale structure. 150mm cube specimens are pre-ferred for calibrating rebound hammers of lower impact energy(2.2Nm), whereas for rebound hammers of higher impact energy,for example 30 Nm, the test cubes should not be smaller than300mm.
If the specimens are wet cured, they should be removedfrom wet storage and kept in the laboratory atmosphere for about24 hours before testing. To obtain a correlation between reboundnumbers and strength of wet cured and wet tested cubes, it isnecessary to establish a correlation between the strength of wettested cubes and the strength of dry tested cubes on which re-bound readings are taken. A direct correlation between reboundnumbers on wet cubes and the strength of wet cubes is not rec-ommended. Only the vertical faces of the cubes as cast should betested. At least nine readings should be taken on each of the twovertical faces accessible in the compression testing machine whenusing the rebound hammers. The points of impact on the speci-men must not be nearer an edge than 20mm and should be notless than 20mm from each other. The same points must not beimpacted more than once.
2.1.5 Interpretation of results
After obtaining the correlation between compressive
12
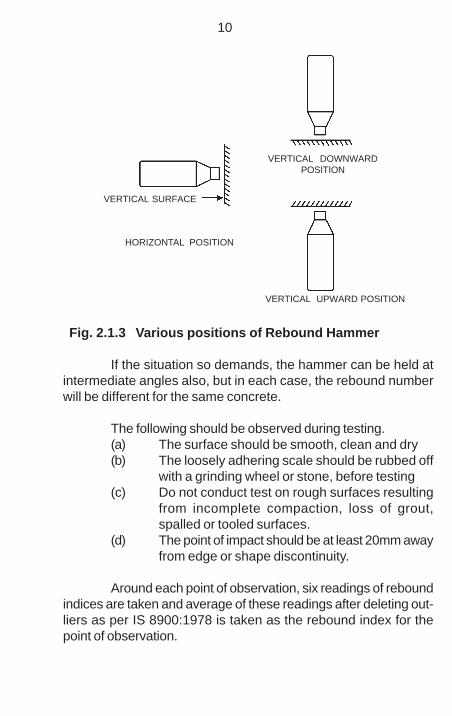
strength and rebound number, the strength of structure can beassessed. In general, the rebound number increases as thestrength increases and is also affected by a number of param-eters i.e. type of cement, type of aggregate, surface conditionand moisture content of the concrete, curing and age of concrete,carbonation of concrete surface etc. Moreover the rebound indexis indicative of compressive strength of concrete upto a limiteddepth from the surface. The internal cracks, flaws etc. or hetero-geneity across the cross section will not be indicated by reboundnumbers.
Fig. 2.1.4 Rebound number vs compressive strength
As such the estimation of strength of concrete by reboundhammer method cannot be held to be very accurate and probableaccuracy of prediction of concrete strength in a structure is ± 25percent. If the relationship between rebound index and compres-sive strength can be found by tests on core samples obtainedfrom the structure or standard specimens made with the same

13
concrete materials and mix proportion, then the accuracy of re-sults and confidence thereon gets greatly increased.
2.1.6 Standards
The rebound hammer testing can be carried out as per IS-13311 (Pt.2).
2.1.7 Other types of Rebound Hammer are:- Concrete Test Hammer (Pendulum Type):
This is a new type of test hammer. In addition to testing ofconcrete, this measures the strength of masonry structures aswell, although approximately. The equipment is very handy and tothe fair extant reliable also. Further more, this is only equipmentwhich is most pre-dominantly used in the field. It’s new addition ishaving so many additional features.
- Digital Concrete Test Hammer
The digital concrete test hammer is a microprocessoroperated standard unit equipped with electronic transducer whichconverts the rebound of the hammer into electric signal and dis-plays it in the selected stress unit. It has capability of setting oftest of the testing angle, selection of units in use (Kg/cm
2 , Mpa or
Psi ). It is battery operated instrument and can be easily con-nected to a PC and has large memory to store up-to 5000 results.
2.2 Ultrasonic Pulse Velocity Tester
Ultrasonic instrument is a handy, battery operated andportable instrument used for assessing elastic properties or con-crete quality. The apparatus for ultrasonic pulse velocity mea-surement consists of the following (Fig. 2.2.1) –
(a) Electrical pulse generator(b) Transducer – one pair(c) Amplifier(d) Electronic timing device

14
Fig. 2.2.1 Apparatus for UPV measurement
2.2.1 Object
The ultrasonic pulse velocity method could be used toestablish:(a) The homogeneity of the concrete(b) The presence of cracks, voids and other imper
fections(c) Change in the structure of the concrete which
may occur with time(d) The quality of concrete in relation to standard re-
quirement(e) The quality of one element of concrete in relation
to another(f) The values of dynamic elastic modulus of the con-
crete
2.2.2 Principle
The method is based on the principle that the velocity ofan ultrasonic pulse through any material depends upon the density,modulus of elasticity and Poisson’s ratio of the material.Comparatively higher velocity is obtained when concrete quality is

15
good in terms of density, uniformity, homogeneity etc. Theultrasonic pulse is generated by an electro acoustical transducer.When the pulse is induced into the concrete from a transducer, itundergoes multiple reflections at the boundaries of the differentmaterial phases within the concrete. A complex system of stresswaves is developed which includes longitudinal (compression), shear(transverse) and surface (Reyleigh) waves. The receiving transducerdetects the onset of longitudinal waves which is the fastest.
The velocity of the pulses is almost independent of thegeometry of the material through which they pass and dependsonly on its elastic properties. Pulse velocity method is a convenienttechnique for investigating structural concrete.
For good quality concrete pulse velocity will be higherand for poor quality it will be less. If there is a crack, void or flawinside the concrete which comes in the way of transmission of thepulses, the pulse strength is attenuated and it passed around thediscontinuity, thereby making the path length longer. Consequently,lower velocities are obtained. The actual pulse velocity obtaineddepends primarily upon the materials and mix proportions ofconcrete. Density and modulus of elasticity of aggregate alsosignificantly affects the pulse velocity.
Any suitable type of transducer operating within the fre-quency range of 20 KHz to 150KHz may be used. Piezoelectricand magneto-strictive types of transducers may be used and thelatter being more suitable for the lower part of the frequency range.Following table indicates the natural frequency of transducers fordifferent path lengths –
Path length Natural Frequency Minimum(mm) of Transducer transverse
(KHz) dimensions ofmembers (mm)
Upto 500 150 25
500 – 700 >60 70
700 – 1500 >40 150
above 1500 >20 300

16
The electronic timing device should be capable of mea-suring the time interval elapsing between the onset of a pulsegenerated at the transmitting transducer and onset of its arrival atreceiving transducer. Two forms of the electronic timing apparatusare possible, one of which use a cathode ray tube on which theleading edge of the pulse is displayed in relation to the suitabletime scale, the other uses an interval timer with a direct readingdigital display. If both the forms of timing apparatus are available,the interpretation of results becomes more reliable.
2.2.3 Methodology
The equipment should be calibrated before starting theobservation and at the end of test to ensure accuracy of themeasurement and performance of the equipment. It is done bymeasuring transit time on a standard calibration rod supplied alongwith the equipment.
A platform/staging of suitable height should be erected tohave an access to the measuring locations. The location ofmeasurement should be marked and numbered with chalk or similarthing prior to actual measurement (pre decided locations).
Mounting of Transducers
The direction in which the maximum energy is propagatedis normally at right angles to the face of the transmitting trans-ducer, it is also possible to detect pulses which have travelledthrough the concrete in some other direction. The receiving trans-ducer detects the arrival of component of the pulse which arrivesearliest. This is generally the leading edge of the longitudinalvibration. It is possible, therefore, to make measurements of pulsevelocity by placing the two transducers in the following manners(Fig.2.2.2)

17
Fig.2.2.2 Various Methods of UPV Testing
(a) Direct Transmission (on opposite faces) – This arrangementis the most preferred arrangement in which transducers arekept directly opposite to each other on opposite faces of theconcrete. The transfer of energy between transducers ismaximum in this arrangement. The accuracy of velocitydetermination is governed by the accuracy of the path lengthmeasurement. Utmost care should be taken for accuratemeasurement of the same. The couplant used should bespread as thinly as possible to avoid any end effects resultingfrom the different velocities of pulse in couplant and concrete.
(b) Semi-direct Transmission: This arrangement is used when itis not possible to have direct transmission (may be due tolimited access). It is less sensitive as compared to directtransmission arrangement. There may be some reduction inthe accuracy of path length measurement, still it is found tobe sufficiently accurate. This arrangement is otherwise similarto direct transmission.
Semi-direct TransmissionDirect Transmission(Cross probing)
Indirect Transmission(Surface probing)

18
(c) Indirect or Surface Transmission: Indirect transmission shouldbe used when only one face of the concrete is accessible(when other two arrangements are not possible). It is theleast sensitive out of the three arrangements. For a givenpath length, the receiving transducer get signal of only about2% or 3% of amplitude that produced by direct transmission.Furthermore, this arrangement gives pulse velocitymeasurements which are usually influenced by the surfaceconcrete which is often having different composition from thatbelow surface concrete. Therefore, the test results may notbe correct representative of whole mass of concrete. Theindirect velocity is invariably lower than the direct velocity onthe same concrete element. This difference may vary from5% to 20% depending on the quality of the concrete. Whereverpracticable, site measurements should be made to determinethis difference.
There should be adequate acoustical coupling betweenconcrete and the face of each transducer to ensure that theultrasonic pulses generated at the transmitting transducer shouldbe able to pass into the concrete and detected by the receivingtransducer with minimum losses. It is important to ensure thatthe layer of smoothing medium should be as thin as possible.Couplant like petroleum jelly, grease, soft soap and kaolin/glycerolpaste are used as a coupling medium between transducer andconcrete.
Special transducers have been developed which impart orpick up the pulse through integral probes having 6mm diametertips. A receiving transducer with a hemispherical tip has beenfound to be very successful. Other transducer configurations havealso been developed to deal with special circumstances. It shouldbe noted that a zero adjustment will almost certainly be requiredwhen special transducers are used.
Most of the concrete surfaces are sufficiently smooth.Uneven or rough surfaces, should be smoothened usingcarborundum stone before placing of transducers. Alternatively, asmoothing medium such as quick setting epoxy resin or plaster

19
can also be used, but good adhesion between concrete surfaceand smoothing medium has to be ensured so that the pulse ispropagated with minimum losses into the concrete.
Transducers are then pressed against the concrete surfaceand held manually. It is important that only a very thin layer ofcoupling medium separates the surface of the concrete from itscontacting transducer. The distance between the measuring pointsshould be accurately measured.
Repeated readings of the transit time should be observeduntil a minimum value is obtained.
Once the ultrasonic pulse impinges on the surface of thematerial, the maximum energy is propagated at right angle to theface of the transmitting transducers and best results are, therefore,obtained when the receiving transducer is placed on the oppositeface of the concrete member known as Direct Transmission.
The pulse velocity can be measured by DirectTransmission, Semi-direct Transmission and Indirect or SurfaceTransmission. Normally, Direct Transmission is preferred beingmore reliable and standardized. (various codes gives correlationbetween concrete quality and pulse velocity for Direct Transmissiononly). The size of aggregates influences the pulse velocitymeasurement. The minimum path length should be 100mm forconcrete in which the nominal maximum size of aggregate is 20mmor less and 150mm for aggregate size between 20mm and 40mm.
Reinforcement, if present, should be avoided during pulsevelocity measurements, because the pulse velocity in the rein-forcing bars is usually higher than in plain concrete. This is be-cause the pulse velocity in steel is 1.9 times of that in concrete.In certain conditions, the first pulse to arrive at the receiving trans-ducer travels partly in concrete and partly in steel. The apparentincrease in pulse velocity depends upon the proximity of the mea-surements to the reinforcing bars, the diameter and number ofbars and their orientation with respect to the path of propagation.It is reported that the influence of reinforcement is generally small

20
if the bar runs in the direction right angle to the pulse path for bardiameter less than12 mm. But if percentage of steel is quite highor the axis of the bars are parallel to direction of propagation, thenthe correction factor has to be applied to the measured values.
2.2.4. Determination of pulse velocity
A pulse of longitudinal vibration is produced by an electro-acoustical transducer, which is held in contact with one surface ofthe concrete member under test. After traversing a known pathlength(L) in the concrete, the pulse of vibration is converted into anelectrical signal by a second electro-acoustical transducer, andelectronic timing circuit enable the transit time (T) of the pulse tobe measured. The pulse velocity (V) is given by
V = L / T
where,
V = Pulse velocity
L = Path length
T = Time taken by the pulse to traverse the path length
2.2.5 Interpretation of Results
The ultrasonic pulse velocity of concrete can be related toits density and modulus of elasticity. It depends upon the materi-als and mix proportions used in making concrete as well as themethod of placing ,compacting and curing of concrete. If the con-crete is not compacted thoroughly and having segregation, cracksor flaws, the pulse velocity will be lower as compare to good con-crete, although the same materials and mix proportions are used.The quality of concrete in terms of uniformity, can be assessedusing the guidelines given in table below:
21
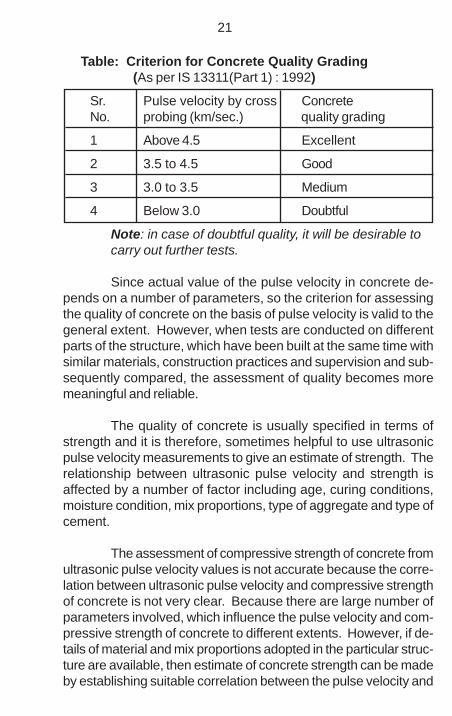
Table: Criterion for Concrete Quality Grading(As per IS 13311(Part 1) : 1992)
Sr. Pulse velocity by cross ConcreteNo. probing (km/sec.) quality grading
1 Above 4.5 Excellent
2 3.5 to 4.5 Good
3 3.0 to 3.5 Medium
4 Below 3.0 Doubtful
Note: in case of doubtful quality, it will be desirable tocarry out further tests.
Since actual value of the pulse velocity in concrete de-pends on a number of parameters, so the criterion for assessingthe quality of concrete on the basis of pulse velocity is valid to thegeneral extent. However, when tests are conducted on differentparts of the structure, which have been built at the same time withsimilar materials, construction practices and supervision and sub-sequently compared, the assessment of quality becomes moremeaningful and reliable.
The quality of concrete is usually specified in terms ofstrength and it is therefore, sometimes helpful to use ultrasonicpulse velocity measurements to give an estimate of strength. Therelationship between ultrasonic pulse velocity and strength isaffected by a number of factor including age, curing conditions,moisture condition, mix proportions, type of aggregate and type ofcement.
The assessment of compressive strength of concrete fromultrasonic pulse velocity values is not accurate because the corre-lation between ultrasonic pulse velocity and compressive strengthof concrete is not very clear. Because there are large number ofparameters involved, which influence the pulse velocity and com-pressive strength of concrete to different extents. However, if de-tails of material and mix proportions adopted in the particular struc-ture are available, then estimate of concrete strength can be madeby establishing suitable correlation between the pulse velocity and

22
the compressive strength of concrete specimens made with suchmaterial and mix proportions, under environmental conditions simi-lar to that in the structure. The estimated strength may vary fromthe actual strength by ± 20 percent. The correlation so obtainedmay not be applicable for concrete of another grade or made withdifferent types of material.
2.2.6. Factors influencing pulse velocity measurement
The pulse velocity depends on the properties of the con-crete under test. Various factors which can influence pulse veloc-ity and its correlation with various physical properties of concreteare as under:
Moisture Content: The moisture content has chemical and physi-cal effects on the pulse velocity. These effects are important toestablish the correlation for the estimation of concrete strength.There may be significant difference in pulse velocity between aproperly cured standard cube and a structural element made fromthe same concrete. This difference is due to the effect of differentcuring conditions and presence of free water in the voids. It isimportant that these effects are carefully considered when esti-mating strength.
Temperature of Concrete: No significant changes in pulse ve-locity, in strength or elastic properties occur due to variations ofthe concrete temperature between 5° C and 30° C. Corrections topulse velocity measurements should be made for temperaturesoutside this range, as given in table below:

23
Table – Effect of temperature on pulse transmissionBS 1881 (Pt 203 Year 1986)
Temperature °C Correction to the measured pulsevelocity in %
Air dried concrete Watersaturatedconcrete
60 +5 +4
40 +2 +1.7
20 0 0
0 -0.5 -1
- 4 -1.5 -7.5
Path Length: The path length (the distance between two trans-ducers) should be long enough not to be significantly influencedby the heterogeneous nature of the concrete. It is recommendedthat the minimum path length should be 100mm for concrete with20mm or less nominal maximum size of aggregate and 150mmfor concrete with 20mm and 40mm nominal maximum size of ag-gregate. The pulse velocity is not generally influenced by changesin path length, although the electronic timing apparatus may indi-cate a tendency for slight reduction in velocity with increased pathlength. This is because the higher frequency components of thepulse are attenuated more than the lower frequency componentsand the shapes of the onset of the pulses becomes more roundedwith increased distance travelled. This apparent reduction in ve-locity is usually small and well within the tolerance of time mea-surement accuracy.
With indirect transmission, there is some uncertainty re-garding the exact length of the transmission path. It is, therefore,preferable to make a series of measurements with placing trans-ducers at varying distances to eliminate this uncertainty. To dothis, the transmitting transducer should be placed in contact withthe concrete surface at a fixed point “x” and the receiving trans-

24
ducer should be moved at fixed increments ‘x’n along a chosen lineon the surface. The transmission times recorded should be plot-ted as points on a graph showing their relation to the distanceseparating the transducers.( Fig.2.2.3).
Fig.2.2.3 Method for determination of pulse velocity
The slope of the best fitted straight line drawn through thepoints should be measured and recorded as the mean pulse ve-locity along the chosen line on the concrete surface. Where thepoints measured and recorded in this way indicate a discontinu-ity, it is likely that a surface crack or surface layer of inferior qual-ity is present and the pulse velocity measured in such case isunreliable.Shape and Size of Specimen: The velocity of pulses of vibra-tions is independent of the size and shape of specimen, unless its

25
least lateral dimension is less than a certain minimum value. Belowthis value, the pulse velocity may be reduced appreciably. Theextent of this reduction depends mainly on the ratio of the wave-length of the pulse vibrations to the least lateral dimension of thespecimen but it is insignificant if the ratio is less than unity. Tablegiven below shows the relationship between the pulse velocity inthe concrete, the transducer frequency and the minimum permis-sible lateral dimension of the specimen.
Table: Effect of specimen dimension on pulsetransmission
BS 1881 (Part 203 Year 1986)
Transducer Minimum lateral dimensionFrequency in mm for Pulse specimen
in KHz velocity in concrete in Km/s
Vc = 3.5 Vc = 4.0 Vc = 4.5
24 146 167 188
54 65 74 83
82 43 49 55
150 23 27 30
This is particularly important in cases where concrete elementsof significantly different sizes are being compared.
Effect of Reinforcing Bars: The pulse velocity in reinforced con-crete in vicinity of rebars is usually higher than in plain concrete ofthe same composition because the pulse velocity in steel is al-most twice to that in plain concrete. The apparent increase de-pends upon the proximity of measurement to rebars, their num-bers, diameter and their orientation. Whenever possible, mea-surement should be made in such a way that steel does not lie inor closed to the direct path between the transducers. If the sameis not possible, necessary corrections needs to be applied. Thecorrection factors for this purpose are enumerated in different codes.
26
2.3. Combined use of Rebound hammer and UltrasonicPulse Velocity Method
In view of the relative limitations of either of the two methodsfor predicting the strength of concrete, both ultrasonic pulse velocity(UPV) and rebound hammer methods are sometimes used incombination to alleviate the errors arising out of influence ofmaterials, mix and environmental parameters on the respectivemeasurements. Relationship between UPV, rebound hammer andcompressive strength of concrete are available based on laboratorytest specimen. Better accuracy on the estimation of concretestrength is achieved by use of such combined methods. However,this approach also has the limitation that the establishedcorrelations are valid only for materials and mix having sameproportion as used in the trials. The intrinsic difference betweenthe laboratory test specimen and in-situ concrete (e.g. surfacetexture, moisture content, presence of reinforcement, etc.) alsoaffect the accuracy of test results.
Combination of UPV and rebound hammer methods canbe used for the assessment of the quality and likely compressivestrength of in-situ concrete. Assessment of likely compressivestrength of concrete is made from the rebound indices and this istaken to be indicative of the entire mass only when the overallquality of concrete judged by the UPV is ‘good’. When the qualityassessed is ‘medium’, the estimation of compressive strength byrebound indices is extended to the entire mass only on the basisof other collateral measurement e.g. strength of controlled cubespecimen, cement content of hardened concrete by chemicalanalysis or concrete core testing. When the quality of concrete is‘poor’, no assessment of the strength of concrete is made fromrebound indices.
2.4 Pull Off Test
Pull off tester is microprocessor based, portable hand op-erated and mechanical unit used for measuring the tensile strengthof in situ concrete. The tensile strength obtained can be corre-lated with the compressive strength using previously established

27
empirical correlation charts. The apparatus for pull off test shallconsist of the following -
(a) 50mm dia steel disc with threaded rod screw(b) Pull off tester
One commercially available pull off tester is shown in Fig 2.4.1.
Fig. 2.4.1 Pull Off Tester
2.4.1 Object
The pull off test could be used to establish:(a) The compressive strength of concrete(b) Tensile strength of in situ concrete(c) The adhesive strength of all kinds of applied
coatings(d) The bond strength of repairs and renovation works
on concrete surfaces
2.4.2 Principle
The pull off test is based on the concept that the tensileforce required to pull a metal disk, together with a layer of con-crete, from the surface to which it is attached, is related to com-pressive strength of concrete There are two basic approachesthat can be used. One is where the metal disk is glued directly to

28
the concrete surface and the stressed volume of the concrete liesclose to the face of the disk, and the other is where surface car-bonation or skin effect are present and these can be avoided byuse of partial coring to an appropriate depth. Both the approachesare illustrated in Fig. 2.4.2.
Fig. 2.4.2 Various Methods of Pull Off Testing
2.4.3 Methodology
The first step is to remove any laitance from the concretesurface to expose the top of the coarse aggregate particles. Thisis usually done using some sort of abrasion, using typically a wirebrush. The exposed concrete surface and metal disk are thendegreased to ensure good bonding of the adhesive. The adhesiveis generally a two part epoxy system. A thin layer of adhesive isspread over the disk area and the metal disk is pressed firmlyonto the concrete surface. Excessive adhesive that is squeezedout during this process should be removed before it sets. Thecuring time needed for the adhesive depends upon the type ofepoxy used and surrounding environmental condition, although inmost of the situations a curing time of not more than 24 hours isrequired. After the adhesive has cured sufficiently, the metal diskis “pulled” from the concrete surface. The apparatus used forapplying and recording this tensile force is known as “Limpet” and

29
this applies a tensile force through a threaded rod screwed intothe metal disk.
Equipments are available from 5 kN to 100 kN tensileforce capacities. The instrument mechanism makes it possible topre-select the rate of loading and actual tensile force applied isdisplayed on LCD monitor. The memory allows transferring ofrecorded data to PC.
From the recorded tensile force a nominal pull off tensilestrength is calculated on the basis of the disk diameter (usually50mm). To convert this pull off tensile strength into a cubecompressive strength, a previously established empirical correlationchart is used.
2.4.4 Advantages and Limitations
The main advantage of pull off test is that it is simple andquick to perform. The entire process of preparing the surface andbonding the steel disk normally doesn’t take more than 15 min-utes. The damage caused to concrete surface after conductingthe test is very minor and can be repaired easily.
The main limitation of this method is, the curing time,required for the adhesive. In most situations, it is normal practiceto apply the disk one day and complete the test next day. Theanother problem is the failure of adhesive. The adhesive may failbecause of inferior quality of adhesive or improper surface prepa-ration or unfavourable environmental conditions. If during testing,the adhesive fails, the test result becomes meaningless.To com-pensate for this type of problem, it is recommended that at leastsix disks be used to estimate the compressive strength and, ifnecessary, one of the individual test results can be eliminated ifan adhesive failure has occurred.
Another aspect of the pull off test is the correlation usedto determine the compressive strength. The single factor that hasthe greatest effect on this relationship is the type of coarse aggre-gate used in the concrete, the greatest difference being betweennatural gravels and crushed rocks. Therefore, care should always

30
be taken to ensure that the correlation being used is applicable inthat situation.
2.4.5 Standards
The test is conducted as per BS-1881 part 207.
2.5 Pull Out Test
The pull out test measures the force needed to extract anembedded insert from a concrete mass. By using a previouslyestablished relationship, the measured ultimate pullout load is usedto estimate the in place compressive strength of the concrete.The equipments required for pull out test shall consist of thefollowing:
(a) Specially shaped steel rod or discs(b) Dynamometer to apply the force(c) Loading ram seated on a bearing ring for applying
pull out force
2.5.1 Object
The pull out test can be used to determine the followingproperties.
(a) Compressive strength of concrete(b) Normally planned for new structures to help decide,
whether critical activities such as form removal,application of post tensioning etc. can be started
(c) Can be used for existing structures and surveys ofmatured concrete
2.5.2 Principle
The pullout test measures the force required to pull anembedded metal insert with an enlarged head from a concretespecimen or a structure. The Fig 2.5.1 illustrates the configuration

31
of a pull out test. The test is considered superior to the reboundhammer and the penetration resistance test, because large vol-ume and greater depth of concrete are involved in the test. Thepull out strength is proportional to the compressive strength ofconcrete. The pull out strength is of the same order of magnitudeas the direct shear strength of concrete, and is 10 to 30% of thecompressive strength. The pull out test subjects the concrete toslowly applied load and measures actual strength property of theconcrete. The concrete is subjected, however, to a complex threedimensional state of stress, and the pull out strength is not likelyto be related simply to uniaxial strength properties. Nevertheless,by use of a previously established correlation, the pull out test canbe used to make reliable estimates of in situ strength.
2.5.3 Methodology
The pull out tests falls into two basic categories
(i) Those in which an insert is cast along with concretei.e. the test is preplanned for new structures and
(ii) Those in which insert is fixed by under cutting andsubsequent expanding procedure in the hardened con-crete of existing structures.
Fig. 2.5.1 Configuration of Pull Out Test

32
These methods are generally known as “cast-in-method”and “drilled hole method” respectively. There are various variantsin cast - in - in methods like LOK test as well as in drilled holemethod like “CAPO” (cut and pull out). In the “CAPO” test method,an expanding ring is fixed into an under reamed groove, producinga similar pull out device to that used for “LOK”.
This insert is pulled by a loading ram seated on a bearingring that is concentric with the inner shaft. The bearing ring trans-mits the reaction force to the concrete. As the insert is pulled out,a conical-shaped fragment of concrete is extracted from the con-crete mass. The idealized shape of extracted conic frustum isshown in Fig 2.5.1. Frustum geometry is controlled by the innerdiameter of the bearing ring (D), the diameter of the insert head(d), and the embedded depth (h). The apex angle (α) of the ideal-ized frustum is given by
2 α = 2tan-1 D-d 2h
The ultimate pullout load measured during the in placetest is converted to an equivalent compressive strength by meansof a previously established relationship.
As per ASTM C-900-82, following are the requirements formetal insert –
(a) Embedment depth 1.0d(b) Bearing ring 2.0d to 2.4d(c) Apex angle 53° to 70°where d = insert head diameter
2.5.4 Advantages & Limitations
The relationship between pullout strength and compres-sive strength is needed to estimate in place strength. Studiessuggested that for a given test system there is a unique relation-ship. Therefore the recommended practise is to develop thestrength relationship for the particular concrete to be used in con-struction. A large number of correlation studies have reported that

33
compressive strength is linear function of pull out strength.
The locations and number of pullout tests in a given place-ment should be decided very carefully. The inserts should belocated in the most critical portions of the structure and sufficientnumber of tests should be conducted to provide statistically sig-nificant results.
The test is considered superior to the rebound hammerand the penetration resistance test, because large volume andgreater depth of concrete are involved in the test.
2.5.6 Standards
The pull out test is conducted as per ASTM C 900-01 &BS-1881 Part 207.
2.6 The Break-Off Test
This test is a variant of the pull out test in which the flexturalstrength of concrete is determined in a plane parallel to and at acertain distance from the concrete surface. The break off stressat failure can then be related to the compressive or flextural strengthof the concrete using a predetermined relationship that relates theconcrete strength to the break off strength.
The BO tester, consists of a load cell, a manometer and amanual hydraulic pump capable of breaking a cylindrical concretespecimen having the specified dimensions.
2.6.1 Object
This test can be used both for quality control and qualityassurance. The most practical use of the BO test method is fordetermining the time for safe form removal and the release time fortransferring the force in prestressed post-tensioned members. Thistest can be planned for new structures as well as for existingstructures.

34
2.6.2 Principle
The method is based upon breaking off a cylindrical speci-men of in place concrete. The test specimen has a 55mm diam-eter and a 70mm height. The test specimen is created in theconcrete by means of a disposable tubular plastic sleeve, whichis cast into the fresh concrete and then removed at the plannedtime of testing, or by drilling the hardened concrete at the time ofthe break off (BO) test. Fig 2.6.1 and 2.6.2 show tubular plasticsleeves and a drill bit, respectively.
Fig. 2.6.1 Tubular Plastic Sleeves
Fig. 2.6.2 Drill Bit
Both the sleeve and the drill bit are capable of producinga 9.5mm wide groove (counter bore) at the top of the test speci-men (see Fig 2.6.3).A force is applied through the load cell bymeans of a manual hydraulic pump. Fig 2.6.3 is a schematic of aBO concrete cylindrical specimen obtained by inserting a sleeveor drilling a core. The figure also shows location of the appliedload at the top of the BO test specimen. In principal, the load

35
configuration is the same as a cantilever beam with circular crosssection, subjected to a concentrated load at its free end. The forcerequired to break off a test specimen is measured by mechanicalmanometer. The BO stress can then be calculated as:
Fig. 2.6.3 Schematic dig. of BO concrete specimen
fBO = M Swhere M = PBOh,
PBO = BO force at the top
h = 65.3 mmS = d d
32d = 55mm
In this case the cracks are initiated at the point 55mmaway from the concrete surface.
36
2.6.3 Methodology
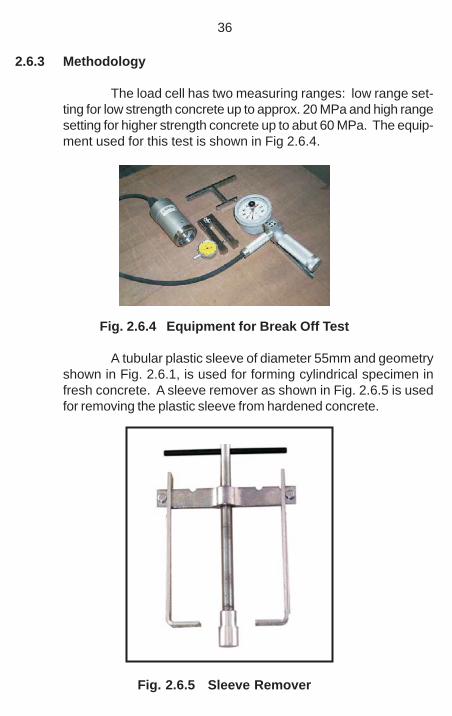
The load cell has two measuring ranges: low range set-ting for low strength concrete up to approx. 20 MPa and high rangesetting for higher strength concrete up to abut 60 MPa. The equip-ment used for this test is shown in Fig 2.6.4.
Fig. 2.6.4 Equipment for Break Off Test
A tubular plastic sleeve of diameter 55mm and geometryshown in Fig. 2.6.1, is used for forming cylindrical specimen infresh concrete. A sleeve remover as shown in Fig. 2.6.5 is usedfor removing the plastic sleeve from hardened concrete.
Fig. 2.6.5 Sleeve Remover

37
A diamond tipped drilling bit is used for drilling cores forthe BO test in hardened concrete (Fig. 2.6.2). The bit is capableof producing a cylindrical core, along with a reamed ring (counterbore) in the hardened concrete at the top with dimensions similarto that produced by using a plastic sleeve.
The sleeves should be at center to center and edge dis-tance of minimum 150mm. Concrete inside the sleeve and thetop of plastic sleeve itself should then be tapped by fingers toensure good compaction for the BO specimen. Sleeves shouldthen be moved gently up and down in place and brought to thesame level as the concrete surface at its final position. For stiffmixes (i.e. low slump concrete) a depression may occur withinthe confines of the sleeve during the insertion process. In suchcases the sleeve should be filled with additional concrete, tappedwith fingers. For high slump concrete, the sleeve may move upward due to bleeding. For such cases, sleeves should be gentlypushed back in place, as necessary, to the level of finished con-crete surface. Grease or other similar material, should be used tolubricate the plastic sleeves for its easier removal after the con-crete hardens.
For core drilling from hardened concrete the concrete sur-face should be smooth in order to fix the vaccum plate of the coredrilling machine. The core barrel should be perpendicular to theconcrete surface. The length of the drilled core should be 70mmand in no case shorter than 70mm.
At the time of conducting BO test, remove the insertedplastic sleeve by means of key supplied with the tester (Fig 2.6.5).Leave the plastic ring in place. Remove loose debris from aroundthe cylindrical slit and the top groove. Select the desired rangesetting and place the load cell in the groove on the top of theconcrete surface so that load is applied properly. The load shouldbe applied to the test specimen at a rate of approx. one stroke ofhand pump per second. After breaking off the test specimen,record the BO manometer reading. The BO meter reading canthen be translated to the concrete strength using curves relatingthe BO reading to the desired concrete strength.

38
Before conducting the test, the BO tester should be cali-brated as per the procedure given by the manufacture. The BOmanufacturer provides correlation curves relating the BO readingand the compressive strength of the standard 150mm cubes.However, it is desireable that the user should develop his owncorrelation curves for a particular concrete batch. Developing cor-relation curves for different types of concrete would increase theaccuracy and dependability of method in predicting the in-placestrength. The following precaution should be taken when develop-ing data for correlations:(a) Keep the center-to-center and edge distance of at least 150mm
in the process of inserting sleeves or drilling(b) Obtain a minimum of 5 readings and three corresponding
strength test specimens values i.e. cubes for compressivestrength, and beams for flextural strength, for each test age.
(c) An average of the five BO readings and the average of thethree standard cube test results represent one point on thegraph relating the BO reading to the desired standard strengthof the concrete.
(d) Cover the range of concrete strengths expected during ex-ecution of the project, at early as well as later stages, suchas 1,3,5,7,14 and 28 days.
2.6.4 Advantages & Limitations
The main advantage of BO test is that it measures in-place concrete (flextural) strength. The equipment is simple andeasy to use, the test is fast to perform, requiring only one ex-posed surface. The BO test does not need to be planned in ad-vance of placing the concrete because drilled BO test specimencan be obtained.
The two limitations of this test are : (i) The max. aggregate size and(ii) The minimum member thickness for which it can be used.
The max. aggregate size is 19mm and min. member thickness is 100mm. However, the principle for the methodcan be applied to accommodate large aggregate sizes orsmaller members. The test cause the damage to the concrete which needs repair after conducting the test.

39
2.6.5. Standards
The break off test is conducted as per ASTM C 1150.
2.7 Penetration Resistance Test (Windsor Probe).
Amongst the penetration methods presently available, themost well known and widely used is Windsor Probe test. Pen-etration resistance methods are based on the determination of thedepth of penetration of probes (steel rods or pins) into concrete.This provides a measure of the hardness or penetration resistanceof the material that can be related to its strength.
The Windsor probe consists of powder – actuated gun ordriver, hardened alloy steel probes, loaded cartridges, a depth gaugefor measuring the penetration of probes and other related equip-ment (Fig. 2.7.1).
Fig. 2.7.1 Windsor Probe
The probes have a tip dia of 6.3 mm, a length of 79.5mm, and aconical point. Probes of 7.9mm dia are also available for the test-ing of concrete made with light weight aggregates.
2.7.1 Object
The Windsor probe test is used to determine(a) Compressive strength of in situ concrete(b) For ensuring quality control
40
(c) For determining safe form removal time(d) The uniformity of concrete and to delineate zones of poor
quality or deteriorated concrete in structures.
2.7.2 Principle
The Windsor probe, like the rebound hammer, is a hardnesstester, and the penetration of probe can be related to thecompressive strength of concrete below the surface, usingpreviously developed correlations between strength properties andpenetration of the probe. The underlying principal of this penetrationresistance technique is that for standard test conditions, thepenetration of probe in to the concrete is inversely proportional tothe compressive strength of the concrete. In other words largerthe exposed length of the probe, greater the compressive strengthof concrete.
2.7.3 Methodology
The method of testing is simple and is given in the manualsupplied by the manufacturer. The area to be tested must have asmooth surface. To test structure with coarser finish, the surfacemust be first ground smooth in the area of the test. The powderactuated driver is used to drive a probe into concrete. If flat surfacesare to be tested, a suitable locating template to provide 158mmequilateral triangular pattern is used and three probes are driveninto the concrete at each corner. The exposed length of individualprobes are measured by a depth gauge. For testing structureswith curved surfaces, three probes are driven individually using thesingle probe locating template. In either case, the measuredaverage value of exposed probe length may then be used toestimate the compressive strength of concrete by means ofappropriate correlation data.
The manufacturer of the Windsor probe test system supplytables relating exposed length of the probe with compressivestrength of concrete. For each exposed length value, differentvalues of compressive strength are given, depending upon thehardness of aggregate. However the manufacturer’s table do notalways give satisfactory results. Sometimes they considerably

41
over estimate the actual strength and in some cases theyunderestimate the strength. It is, therefore, imperative to correlateprobe test result with the type of concrete being used. In additionto hardness of the coarse aggregate, the type and size of coarseaggregate also have a significant effect on probe penetration. Thedegree of carbonation and the age of concrete may also affect theprobe penetration strength relationship.
2.7.4 Advantages & Limitations
Windsor probe testing method is basically hardnessmethod, and like other hardness methods, should not be expectedto yield absolute values of strength of concrete in a structure.However, like surface hardness tests, penetration tests provide anexcellent means of determining the relative strength of concrete inthe same structure, or relative strength in different structures.
One of the limitation of this test is minimum sizerequirements for the concrete member to be tested. The minimumdistance from a test location to any edges of the concrete memberor between two given test locations is of the order of 150mm to200mm, while the minimum thickness of the member is aboutthree times the expected depth of penetration. The test also causessome minor damage to the surface, which generally needs to berepaired.
The main advantages of this test are the speed andsimplicity and only one surface is required for testing.
2.7.5. Standards
The penetration resistance test is coducted as per ASTMC 803 / C 803-03 and BS 1881 Part 207.
2.8 Core Drilling Method
Core drilling method is the most direct way of measuringthe actual strength of concrete in the structure. It mostly involvesproper selection of location and number of samples to be obtained.
42
Core should be taken so as to avoid the reinforcement. Ifavoidance of secondary reinforcement or surface reinforcement isinescapable, strength of Core can be taken as 10% less thanmeasured strength. Cylindrical specimen of 100mm or 150mmdiameter are common; other sizes may also be permitted but theleast lateral dimension should not be less than 3 times themaximum size of the aggregates used. The core specimen to betested should preferably have height of specimen as twice thediameter. If there are difficulties of obtaining samples of such size,the length to diameter ratio is permitted to be lower, but in no caselower than 0.95. The samples are to be stored in water for twodays prior to testing and are to be tested in moist condition. Theends of specimens are trimmed and flatten and capped withmolten sulphur or high alumina cement or some other permissiblecapping material to obtain a true flat surface. The specimen isthen tested in compression.
Although drilling of cores and compressive strength testare quite simple (and are covered in IS:1199 and IS:516), but theprocedures and influencing factors are to be carefully understoodas they affect the measured value and therefore the assessmentof the quality of in-place concrete. The provision of IS 456: 2000vide clause 17.4.3 in this regard is given below:
“Concrete in the member represented by a core test shallbe considered acceptable if the average equivalent cube strengthof the cores is equal to at least 85 percent of the cube strength ofthe grade of concrete specified for the corresponding age and noindividual core has strength less than 75 percent.”
2.9 Permeability Test:
2.9.1 Introduction
The permeability tester is a measuring instrument whichis suitable for the determination of the air permeability of coverconcrete by a non destructive method.
The fundamental significance of thin surface layer for thedurability of concrete structures is attracting more and more

43
attention among researchers and engineers since it has beenrecognized that owing to the small distance between form workand reinforcement and as a result of process such as segregationand bleeding , finishing and curing, the formulation of micro-cracks,etc., the composition and properties of the cover concrete maydiffer very considerably from those of the good quality of coverconcrete. In addition, the concrete test specimens used forquality controls can never represent the quality and properties ofthe cover concrete since they are produced and stored in acompletely different manner.
Fig. 2.9.1 General arrangement of Permeability Tester
Bearing capacity of a structural element in a concretestructure is based on the mechanical properties of the totalelement and its durability under aggressive environmentalinfluences depends essentially on the quality of a relatively thinsurface layer ( 20-50 mm) . This layer is intended to protect thereinforcement from corrosion which may occur as a result ofcarbonation or due to ingress of chlorides or other chemical ef-fects. The influence mentioned is enhanced by damage due tofrost/thaw/salt.
The process which cause damage to concrete structureare so varied and include so many different and often interlinedmechanisms( Physical, Chemical , Physi cochemical ,Electrochemical, Mechanical) that it cannot be expected that onlyone or two parameters of the cover concrete quality will be

44
sufficient for predicting the durability. This aside, there is generalagreement that the permeability of the cover concrete is the mostrelevant property for measuring the potential durability of andindividual concrete.
There is no generally accepted method to characterizethe pore structure of concrete and to relate it to its durability.However, several investigations have indicated that concretepermeability both with respect to air and to water is an excellentmeasure for the resistance of concrete against the ingress ofagressive media in the gaseous or in the liquid state and thus is ameasure of the potential durability of a particular concrete.
There is at present no generally accepted method for arapid determination of concrete permeability and of limiting valuesfor the permeability of concrete exposed to different environmentalconditions.
Though concrete of a high strength class is in mostinstance more durable than concrete of a lower strength class,compressive strength alone is not a complete measure ofconcrete durability, because durability primarily depends on theproperties of the surface layer of a concrete member, which haveonly a limited effect on concrete compressive strength.
The Permeability Tester permits a rapid and non-destructive measurement of the quality of the cover concrete withrespect its durability. The general arrangement of the permeabilitytester is shown in fig 2.9.1.
2.9.2 Principle:
Significance of permeability in addition to compressivestrength in assessing quality of concrete has become moreimportant due to increasing instances of corrosion inreinforcement concrete. The rate at which the air from the con-crete cover may extracted, is a measure of permeability of con-crete. This method can be used to assess the resistance of con-crete to carbonation, penetration of aggressive ions and quality ofgrout in post tension ducts.

45
2.9.3 Description of equipment:
The technical details of the instrument are given below:
(1) Display Unit• Non volatile memory for upto 200 measured objects• Display on 128 X 128 graphic LCD• RS 232 C interface• Integrated software for printout of measured objects and trans-
mission to pC• Operation with 6 batteries LR6 1.5 v for about 60 hrs. or com-
mercial power unit 9 VDC/0.2 A.• Temperature range –100C to +600C• Carrying case 320 x 285 x 105 mm, total weight 2.1 Kg
(2) Control Unit and vacuum cell• The volume of inner chamber and hose and the cross sec-
tional area of the inner chamber are terms in the formula forcalculating kT and L. They must therefore not be changed.
• Vacuum connection – small flange 16 KF• Carrying case 520 x 370 x 125 mm , total weight 6.3 kg
(3) Resistance probe WENNER – PROCEQ• Electrode spacing 50 mm
(4) Vacuum pump:• The instrument is operated with a commercial vacuum pump.• Technical data as per DIN 28400• Suction capacity : 1.5 m3/h• Final total pressure : approx 10 bar• Suction side connection : small flange 10 KF / 16KF• High water vapour toleration

46
2.9.4 Methodology:
It operates under vacuum and can be used at the site andalso in the laboratory.
The essential features of the method of measurement area two chamber vacuum cell and a pressure regulator whichensures an air flow at right angles to the surface and into the innerchamber.
Dry surface without cracks should be selected for test. Itshould be insured that inner chambers should not be located abovethe reinforcement bar. Pressure loss is calibrated from time totime and after a large change in temperature and pressure. 3 to 6measurements of electrical resistance of the concrete and its meanvalue is taken for the measurement of coefficient of permeability.This permits the calculation of the permeability coefficient kT onthe basis of theoretical model.
In case of dry concrete, the results are in good agree-ment with laboratory methods, such as oxygen permeability, cap-illary suction, chloride penetration and others. The quality class ofthe cover concrete is determined from kT using a table as shownbelow.Table - Quality class of cover concrete
Quality of cover concrete Index kT (10-16 m2 )
Very Bad 5 > 10
Bad 4 1.0 - 10
Normal 3 0.1 – 1.0
Good 2 0.01 – 0.1
Very Good 1 < 0.01
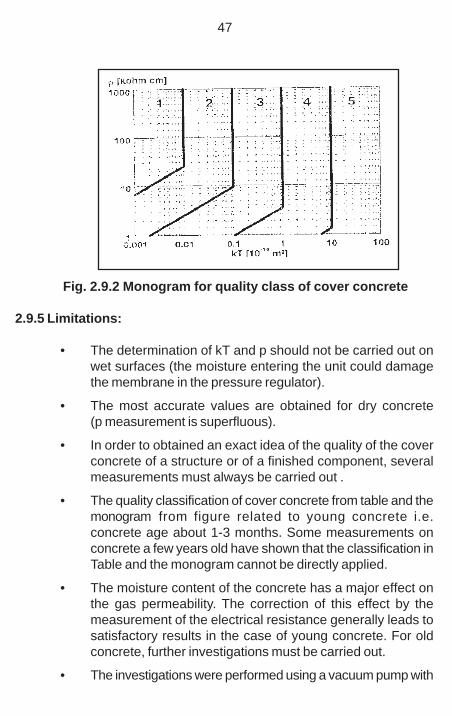
The humidity, a main influence on the permeability, iscompensated by additionally measuring the electrical resistanceρ of the concrete. With kT and ρ the quality class is obtainedfrom a monogram shown in fig 2.9.2.
47
Fig. 2.9.2 Monogram for quality class of cover concrete
2.9.5 Limitations:
• The determination of kT and p should not be carried out onwet surfaces (the moisture entering the unit could damagethe membrane in the pressure regulator).
• The most accurate values are obtained for dry concrete(p measurement is superfluous).
• In order to obtained an exact idea of the quality of the coverconcrete of a structure or of a finished component, severalmeasurements must always be carried out .
• The quality classification of cover concrete from table and themonogram from figure related to young concrete i.e.concrete age about 1-3 months. Some measurements onconcrete a few years old have shown that the classification inTable and the monogram cannot be directly applied.
• The moisture content of the concrete has a major effect onthe gas permeability. The correction of this effect by themeasurement of the electrical resistance generally leads tosatisfactory results in the case of young concrete. For oldconcrete, further investigations must be carried out.
• The investigations were performed using a vacuum pump with

48
a suction capacity of 1.5 m3/h and a motor power of 0.13kW, this pump makes it possible to achieve a vacuum of afew mbar. Pumps of lower power do not reach the samevacuum and it is therefore advisable to use only pumps ofsimilar power.
• There may be three further reasons why the desired vacuum(10-50 mbar ) is not reached.
- The concrete cover is too permeable (normal function of theunit).
- The concrete surface is too uneven: the rubber seals cancompensate only a certain degree of unevenness (abnormalfunction).
- The unit has a leak (abnormal function).
2.10 Bond Test:
The bond testing equipment measures in place bondingor direct tensile strength between two layers e.g. a repair overlayand the parent concrete material or adhesion of shot Crete andmembrane. The test location is so selected with the help of ametal detector that reinforcement disturbance, if any, is controlledand minimised during cutting operation.
The test consists of drilling a 100 mm nominal diametercore through the overlay into the parent concrete material. Thedrilled core is left without breaking. The top surface of the core iscleaned and dried and a cylindrical steel disc 85 mm in diameteris fastened to it with epoxy resin and adhesive. After hardening ofthe epoxy, the counter pressure ring with an inside diameter of105 mm is placed concentric with the core on the overlay surfaceand connected to the pull bolts with countering plate and cou-pling. Load is applied by turning the instrument handle to a re-quired pull force up to failure of the core in tension. Here also thedisadvantage is that a small damage to the concrete is required tobe repaired.

49
2.11 Maturity Method :
ASTM C 1074 has adopted a standard practice on theuse of the maturity method to estimate concrete strength. Thematurity method is also used in ASTM C 918 for estimatinglater-age potential cylinder strength based on measured early-agestrength.
Compressive strength of well cured concrete increaseswith time. But this increase is dependent on the temperature ofcuring also. The combined influence of time and temperature isconsidered as the maturity. It is thus defined as the integral oftime multiplied by temperature with a datum temperature of – 100
C, since below this temperature cement in concrete ceases tohydrate.
The maturity of in-place can be monitored bythermocouples or by instruments called “maturity meters” Thestrength of in-place concrete is then estimate using theestablished correlation graph between maturity and compressivestrength of concrete. The advantage of maturity concept is that byprior placing of maturity meters in the formwork at the time of theconstruction, the strength of early age concrete can be monitoredand accordingly formwork can be removed confidently.
2.12 Complete Structural Testing:
2.12.1 Structural Testing System-
This integrated technique provides an approach that canbe used todetect damage, general evaluation and development ofload ratings for all type of st eel, concrete and timber structures.
The technique is based on the principle of “semi- static“live load test. It consists of instrumentation removal. In thistechnique upto 65 recessable strain transducers are indented tothe structural members of the bridge and strains recorded vehiclewith known weight crosses at crawling speed. High speed passesare also needed to conduct in order to determine actual impact.
50
2.12.1.1 Advantage:
• In this technique no holes or welds are required.
• Each strain sensors needs very short period of time (about 5minutes) to install.
• In need, only one lane to be closed at a time.
The subsequent analytical modeling techniques range froma simple planner grid model to a three dimensional finite elementrepresentation. The response of the model in systematicallycompared with the field test results using multiple gauge locationand load configurations. Structural parameters such as lateral deckstiffness, rotational restraints are then modified through aninteractive process until the analytical responses closely matchthe field measurement. This calibrated model can be used topredict stress levels at critical locations due to rating andoverloaded vehicle. Rating factors can then be developed usingeither allowable stress method (ASD) or the load factor method(LFD).
This approach is suitable to use on highway bridges, rail roadbridges and other structures. Where the live load can be easilyapplied and load stresses significant, by approaching to this methodsteel, pre-stressed concrete, reinforce concrete and timberstructures can be tested successfully.2.12.2 Indian Railways has planned to procure the completestructural testing equipment for performing live load tests on shortto medium span Railway Bridge for static load, low speed, fullsectional speed i.e. upto 200 kmph, braking and acceleration oftrains so as to complete the full test for load rating of bridge.

51
CHAPTER-3
NON–DESTRUCTIVE TESTS FOR CORROSIONASSESSMENT, LOCATION AND DIAMETER OF
REINFORCEMENT AND COVER THICKNESS OFCONCRETE BRIDGES
3.1 Introduction
For effective inspection and monitoring of concrete bridges,the condition assessment of reinforcement is an important step.Even for deciding appropriate repair strategy for a distressedconcrete bridge, the determination of corrosion status of reinforcingbars is a must. Most of NDT methods used for corrosionassessment are based on electrochemical process. But apartfrom the process, it is advisable that the persons involved forconducting the tests should have enough experience in thisparticular field. The following methods are normally used for thecondition assessment of reinforcement in concrete structures :
(a) Half cell Potential Measurement (Corrosion AnalyzingInstrument)
(b) Resistivity test(c) Test for carbonation of concrete(d) Test for chloride content of concrete(e) Endoscopy Technique
The following methods are generally used for determiningthe location / diameter of reinforcement bars and cover thicknessin concrete bridges
(a) Profometer(b) Micro covermeter
Each of the above said methods has been discussed indetail in this chapter.
3.2 Half-cell Potential Measurement Method
When there is active corrosion, current flow through the

52
concrete between anodic and cathodic sites is accompanied byan electric potential field surrounding the corroding bar. Theequipotential lines intersect the surface of the concrete and thepotential at any point can be measured using the half potentialmethod. Apparatus for half cell potential measurement is shown inFig.3.2.1.
Fig. 3.2.1 Apparatus for Half-Cell Potential Measurement
The apparatus includes copper-copper sulphate half-cell,connecting wires and a high impedance voltmeter. This half-cell iscomposed of a copper bar immersed in a saturated copper sulphatesolution. It is one of the many half cells that can be used as areference to measure the electrical potential of embedded bars. Ahigh impedance voltmeter (normally greater than 10MW) is used
53
so that there is very little current through the circuit. The copper-copper sulphate half-cell makes electrical contact with the concreteby means of porous plug and a sponge that is moistened with awetting solution (such as liquid detergent).
One of the instrument available in the market is CANINcorrosion analyzer, which is a computer based device for makinghalf cell potential measurement. This particular instrument storesdata acquired at different test points and display equipotentialcontours.
3.2.1 Object
This test is used to assess the corrosion conditions in areinforced concrete structure. The method detects the likelihoodof corrosion of steel but can not indicate the rate of corrosion. Bymaking measurements over the whole surface, a distinction canbe made between corroded and non-corroded locations.
3.2.2 Principle
Corrosion analyzer is based on electro-chemical processto detect corrosion in the reinforcement bars of structure. Itrepresents a galvanic element similar to a battery ,producing anelectrical current, measurable as an electric field on the surface ofconcrete. The potential field can be measured with an electrodeknown as half cell. The electrical activity of the steel reinforcementand concrete leads them to be considered as one half of batterycell with the steel acting as one electrode and concrete aselectrolyte. The name half cell surveying derives from the fact thatthe one half of the battery cell is considered to be the steelreinforcing bars and surrounding concrete. The electrical potentialof a point on the surface of steel reinforcing bar can be measuredcomparing its potential that of copper – copper sulphate referenceelectrode/silver- silver nitrate reference electrode on the surface.
The positive terminal of the voltmeter is attached to thereinforcement and the negative terminal is attached to the copper-copper sulphate half cell. If there is any corrosion in the bars, the

54
excess electrons in the bar would tend to flow from the bar to thehalf cell. Because of the way the terminals of the voltmeter areconnected in the electrical circuit (Fig. 3.2.1), the voltmeterindicates a negative voltage. The measured half cell potential isthe open circuit potential, because it is measured under thecondition of no current in the measuring circuit. A more negativevoltage reading at the surface is to interpreted to mean that theembedded bar has more excess electrons, and there is, therefore,a higher likelihood that the bar is corroding.
The half cell potential readings are indicative of theprobability of corrosion activity of the reinforcing bars locatedbeneath the copper-copper sulphate reference cell. However, thisis true only if the reinforcing steel is electrically connected to thebar attached to the voltmeter.
3.2.3 Methodology
The corrosion analyzing instrument CANIN operates asdigital voltmeter. Voltage of + 999 mV DC can be measured usingthis instrument. The potential in millivolts is measured with rodelectrodes at different locations on the structure. The measuredvoltage depends upon the type of the half-cell, and conversionfactors are available to convert readings obtained with other halfcells to copper-sulphate half cell.
Testing is usually performed at points arranged in a grid.The required spacing between test points depends on the particularstructure. Excessive spacing can miss points of activity or provideinsufficient data for proper evaluation, while closer spacing increasethe cost of survey. In surveying bridge decks, ASTM C 876recommends a spacing of 1.2 meter. If the difference in voltagebetween adjacent points exceed 150 mV, a closer spacing issuggested. A key aspect of this test is to ensure that the concreteis sufficiently moist to complete the circuit necessary for a validmeasurement. If the measured value of the half cell potential varieswith time, pre wetting of the concrete is required. Although prewetting is necessary, there should be no free surface water betweentest points at the time of potential measurement. The concrete issufficiently moist if the measured potential at a test point does not

55
change by more than + 20 mV within a 5 min. period. If stabilitycannot be achieved by pre-wetting, it may be because of strayelectrical currents or excessive electrical resistance in the circuit.In either case, the half cell potential method should not be used.Testing should be performed between temperature range of 17 to280C.
3.2.4 Interpretation of test results
As per ASTM C 876, two techniques can be used toevaluate the results (i) the numeric technique (ii) the potentialdifference technique.
In the numeric technique, the value of the potential is usedas an indicator of the likelihood of the corrosion activity. Thepotential measured at the surface of concrete can be interpretedas per table given below:-
Phase of Corrosion Activity Potential as measured byCopper Half Cell
1. Initial Phase – Corrosion < - 200 mVactivity not taking place
2.Transient Phase – Corrosion - 200 mV to - 350 mVactivity uncertain
3. Final phase – corrosion > - 350 mVoccurring positively
Source: Appendix of ASTM C 876
The numeric method should not be used in the followingconditions –
(a) Carbonation extends to the level of reinforcement
(b) Comparison of corrosion activity in outdoorconcrete with highly variable moisture or oxygencontent.
(c) Evaluation of indoor concrete that has not beensubjected to frequent wetting.

56
(d) To formulate conclusions about changes incorrosion activity due to repairs which changedthe moisture or oxygen content at the level of thesteel.
In the potential difference technique, the areas of activecorrosion are identified on the basis of the potential gradients. Inthe equipotential contour plot, the closer spacing of the voltagecontour indicates regions of high gradients. The higher gradientindicates, higher risk of corrosion.
The potential difference technique is considered morereliable for identifying regions of active corrosion than is the use ofnumerical limits.
3.2.5 Limitations
For conducting this test access to the reinforcement ismust. The method cannot be applied to epoxy coatedreinforcement or concrete with coated surfaces. The concreteshould be sufficiently moist for conducting this test.
This test only indicates the liklyhood of corrosion activityat the time of measurement. It does not furnish direct informationon the rate of corrosion of the reinforcement.
3.2.6 Standards
This method is covered under ASTMC 876-91 (Reapproved1999).
3.3 Resistivity Test
This test is used to measure the electrical resistance ofthe cover concrete. Once the reinforcement bar loses its passivity,the corrosion rate depends on the availability of oxygen for thecathodic reaction. It also depends on the concrete, which controlsthe ease with which ion migrate through the concrete between
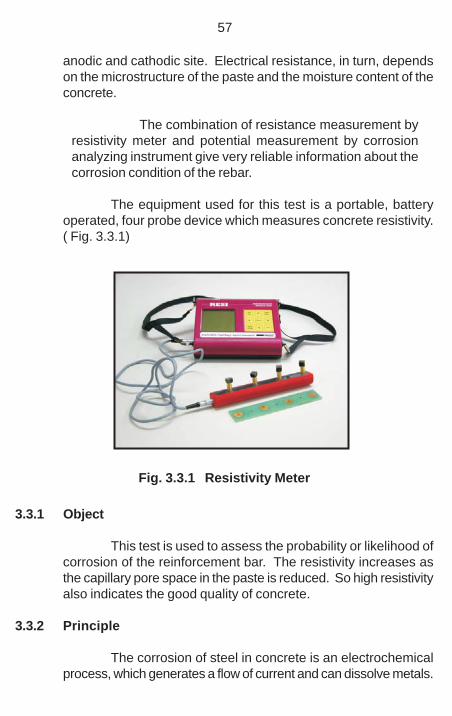
57
anodic and cathodic site. Electrical resistance, in turn, dependson the microstructure of the paste and the moisture content of theconcrete.
The combination of resistance measurement byresistivity meter and potential measurement by corrosionanalyzing instrument give very reliable information about thecorrosion condition of the rebar.
The equipment used for this test is a portable, batteryoperated, four probe device which measures concrete resistivity.( Fig. 3.3.1)
Fig. 3.3.1 Resistivity Meter
3.3.1 Object
This test is used to assess the probability or likelihood ofcorrosion of the reinforcement bar. The resistivity increases asthe capillary pore space in the paste is reduced. So high resistivityalso indicates the good quality of concrete.
3.3.2 Principle
The corrosion of steel in concrete is an electrochemicalprocess, which generates a flow of current and can dissolve metals.

58
The lower the electrical resistance, the more readily the corrosioncurrent flows through the concrete and greater is the probability ofcorrosion. The resistivity is numerically equal to the electricalresistance of a unit cube of a material and has units of resistance(in ohms) times length. The resistance (R) of a conductor of areaA and length L is related to the resistivity ρ as follows:
R = ρ L A
The schematic diagram showing the set up formeasurement of concrete resistivity is shown in Fig. 3.3.2.
Fig. 3.3.2 Setup for Measurement of concrete resistivity
This is based on the classical four electrode system inwhich four equally spaced electrodes are electrically connectedto the concrete surface. The outer electrodes are connected to asource of alternating current, and the two inner electrodes areconnected to voltmeter.

59
3.3.3 Methodology
One of commercial equipment available for measurementof resistivity is Resistivity Meter which is a four probe device usedfor measuring resistivity. The set of four probes are fitted withsuper conductive foam tips to ensure full contact on irregularsurfaces. Once the probes are kept in contact with the concretesurface, the LCD display will indicate the resistivity directly on thescreen. The limits of possible corrosion are related with resistivityas under:
1. With ρ =12 K W cm Corrosion is improbable
2. With ρ = 8 to 12 K W cm Corrosion is improbable
3. With ρ = 8 K W cm Corrosion is fairly certain
where ρ (rho) is the resistivity
3.3.4 Limitations
The method is slow because it covers small area at atime. The system should not be used in isolation because it givesbetter indication of corrosion in reinforced concrete if used incombination with half - cell potentiometer.
3.4 Tests for Carbonation of Concrete
Carbonation of concrete in cover results in loss of protectionto the steel against corrosion. The depth of carbonation can bemeasured by spraying the freshly fractured concrete surface witha 0.2% solution of phenolphthalein in ethanol. Sincephenolphthalein is a pH indicator, the magenta (pink colour) areapresents uncarbonated concrete and the remaining (colourless)portion, the carbonated area. The change in colour occurs ataround pH 10 of concrete.
The test must be applied only to freshly exposed surfaces,

60
because reaction with atmospheric carbon dioxide startsimmediately. Relating carbonation depth to concrete cover is oneof the main indicators of corrosion.
3.5 Test for Chloride Content of Concrete
The presence of chloride in the concrete is the contributoryfactor towards corrosion of reinforcement.
Portable equipments are available in the market, whichcan be used for rapid on site measurement of chloride content ofconcrete. The chloride content of concrete can also be determinedby chemical analysis of concrete in the laboratory.
A rotary percussion drill is used to collect a pulverizedsample of concrete and a special acid extracts the chlorides. Theamount of acid soluble chloride is determined directly by a chloridesensitive electrode connected to a electrometer.
If different samples are obtained from different concretedepths, it can be established whether the chloride contaminationwas there in the original concrete or the same has come from theenvironment.
3.6 Endoscopy Technique:
Endoscopy consists of inserting a rigid or flexible viewingtube into holes drilled into concrete bridge components or cableducts and view them with light provided by optical glass fibersfrom an external source. This is a most useful method for inspectingor detecting voids in the grout and corrosion in steel in the cableducts. It is also useful for detail examination of other part of thebridge structure, which could not other wise be assessed.Endoscopes are available as attachments for a camera or a TVmonitor. It, however, needs an experienced engineer to makeassessment of most likely locations of voids in the grout andprobable points of entry of chlorides into the ducts.

61
3.7 Profometer
In any RCC/PSC structure, adequate cover thickness isessential to prevent corrosion of the reinforcement. In oldstructures, sometimes the detailed drawings are not traceable dueto which it becomes very difficult to calculate the strength of thestructure which is essentially required for finalizing the strengtheningscheme. Sometimes, the bridges are to be checked from strengthpoint of view to permit higher axle load and in absence ofreinforcement details it becomes very difficult to take a decision.
To overcome all these problems, the methods have beendeveloped for investigation and evaluation of concrete structures.Profometer is a small versatile instrument for detecting location,size of reinforcement and concrete cover. This instrument is alsoknown as rebar locator. This is a portable and handy instrumentwhich is normally used to locate the reinforcement on LCD display.This instrument is available with sufficient memory to storemeasured data. Integrated software is loaded in the equipment forcarrying out and printing statistical values. One of the equipmentwhich is commercially available in the market is shown inFig. 3.7.1.
Fig. 3.7.1. Profometer

62
The equipment is quite handy and weighing less than twokgs. It works on normal batteries and thus does not require anyelectrical connection.
3.7.1. Object
This test is used to assess the location and diameter ofreinforcement bars and concrete cover. This equipment can beused effectively for evaluation of new as well as old structures. Themethod can be used both for quality control as well as qualityassurance.
3.7.2. Principle
The instrument is based upon measurement of change ofan electromagnetic field caused by steel embedded in the concrete.
3.7.3. Methodology
To ensure satisfactory working of profometer and to getaccurate results, it should be calibrated before starting theoperations and at the end of the test. For this purpose, test blockprovided with the instrument should be used. To check thecalibration accuracy, the size and cover of the reinforcement ofthe test block is measured at different locations on test block andthe recorded data should match with the standard values prescribedon the test block.
Path measuring device and spot probes are together usedfor path measurements and scanning of rebars. These areconnected with profometer with cables and are moved on theconcrete surface for scanning the rebars and measuring the spacing.As soon as the bar is located, it is displayed on the screen. Oncethe bar is located, it is marked on the concrete surface.
Diameter probe is used for measuring the dia of bars. It isalso connected with profometer by one cable. After finding out thelocation of rebar, the dia probe is placed on the bar parallel to bar
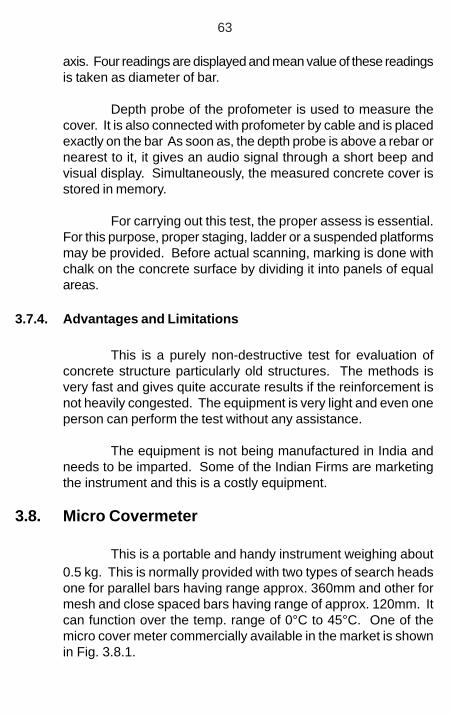
63
axis. Four readings are displayed and mean value of these readingsis taken as diameter of bar.
Depth probe of the profometer is used to measure thecover. It is also connected with profometer by cable and is placedexactly on the bar As soon as, the depth probe is above a rebar ornearest to it, it gives an audio signal through a short beep andvisual display. Simultaneously, the measured concrete cover isstored in memory.
For carrying out this test, the proper assess is essential.For this purpose, proper staging, ladder or a suspended platformsmay be provided. Before actual scanning, marking is done withchalk on the concrete surface by dividing it into panels of equalareas.
3.7.4. Advantages and Limitations
This is a purely non-destructive test for evaluation ofconcrete structure particularly old structures. The methods isvery fast and gives quite accurate results if the reinforcement isnot heavily congested. The equipment is very light and even oneperson can perform the test without any assistance.
The equipment is not being manufactured in India andneeds to be imparted. Some of the Indian Firms are marketingthe instrument and this is a costly equipment.
3.8. Micro Covermeter
This is a portable and handy instrument weighing about0.5 kg. This is normally provided with two types of search headsone for parallel bars having range approx. 360mm and other formesh and close spaced bars having range of approx. 120mm. Itcan function over the temp. range of 0°C to 45°C. One of themicro cover meter commercially available in the market is shownin Fig. 3.8.1.

64
Fig. 3.8.1. Micro Covermeter
The equipment is of 180mm x 100mm x 45mm sizeapproximately. The equipment is available with volatile memorythat helps in storing data while taking measurements.
3.8.1. Object
The test is aimed mainly to detect the location and coverof reinforcement. The test may be used for analyzing the integrityof the structures as the cover thickness is an important aspect ofconstruction. In the coastal areas, the test can be used for decidingthe effectiveness of cover as well as rehabilitation measuresrequired.
3.8.2 Principle
The equipment consists of a highly permeable U-shapemagnetic core on which two coils are mounted. When analternating current is passed through one of these coils, the currentinduced in the other coil can be measured. The presence of steelaffects the electromagnetic field. The induced current dependsupon the mutual inductance of the coils and the nearness of thesteel bars. A moving coil meter measures the current. Formeasurement of the cover, the probe is placed directly over theconcrete member and moved slowly until reading is obtained onthe dial. The probe should be kept parallel to the length of rebar.

65
Depending upon the diameter of the bar, the dial readings givesdirectly the cover to the reinforcement.
3.8.3. Methodology
The equipment should be calibrated before starting and atthe end of the test to get accurate results. For this purpose, onespacer is provided with each equipment. For calibration, the covershould be measured at one location and then it is remeasuredafter placing the spacer between the concrete surface and probe.The difference between two readings should not vary more than+/- 5% of the thickness of the spacer.
For locating the reinforcement bar, the search head shouldbe placed on the surface of concrete in such a way so that thelength of the search head should be parallel to the reinforcementprovided in the structure. The location of the main reinforcementshould be decided based upon the geometry of the structure. Thesearch head should be moved from one end to other end in adirection perpendicular to the main reinforcement. The sound ofthe buzzer /beep will be strongest when the bar will come justabove or below the probe.
For measurement of cover, the search head is moved onthe surface. While moving, the cover displayed on the screenreduces and sound of the buzzer/beep increases when probecomes near reinforcement bars. The minimum reading displayedwill be the cover and the sound of the buzzer is strongest whenthe reinforcement bar is just below the search head.
3.8.4. Advantages and Limitations
The method is very fast and large area can be coveredwithin short time. The instrument work on batteries and does notrequire any electric supply. Since the equipment is very smalland portable, the test can be conducted by single person withoutany assistance.

66
CHAPTER 4
NON-DESTRUCTIVE TESTS FOR DETECTION OFCRACKS/VOIDS/ DELAMINATIONS ETC.
IN CONCRETE BRIDGES
4.1 Introduction
For the assessment of the actual condition of a concretebridge, the detection of internal crack, void, lamination etc. is verymuch necessary. The NDT methods for testing surface hardness,strength and for checking the condition of reinforcement do notindicate the internal condition of concrete. Sometimes theseinternal cracks, voids etc. may lead to the corrosion ofreinforcement, cracking of section which may ultimately result intoreduced life of bridge. The following methods are normally usedfor detection of cracks/voids/laminations etc. in concrete bridges:–
(i) Infrared thermographic techniques(ii) Acoustic Emission technique(iii) Short pulse radar methods(iv) Stress wave propagation methods(v) Crack Detection Microscope(vi) Boroscope(vii) Nuclear Method(viii) Structural scanning equipment(ix) Spectral Analysis of surface waves for unknown
foundation
Some of these methods are used extensively all over theworld for condition assessment of various components of concretebridges while some methods are still in the laboratory trial stage.All the above methods are discussed in detail in this chapter.
4.2 Infrared Thermographic Techniques
For conducting this test, high resolution infraredthermographic radiometers (Fig. 4.2.1) are used to inspect largeareas of concrete efficiently and quickly. This type of equipment

67
allows larger areas to be scanned, and the resulting data can bedisplayed as pictures with areas of differing temperaturesdesignated by differing grey tones in black and white image or byvarious colours on a colour image. A complete thermographic
Fig. 4.2.1 Infrared Thermographic Radiometer
data collection and analysis system can be divided into four mainsubsystems. The first is the infrared sensor head that normallycan be used with interchangeable lenses. It is similar in appearanceto a portable video camera.
The second major component of the infrared scanningsystem is a real-time microprocessor coupled to a black-and-whiteor colour display monitor. With this, component, cooler itemsbeing scanned are normally represented by darker grey ones, andwarmer areas are represented by lighter gray tones. Now-a-days,colour monitors are also used, which displays the differenttemperature levels as contrasting colours and patterns, which areeasier to decipher.
The third major component of the infrared scanning systemis the data acquisition and analysis equipment. It is composed ofan analog-to-digital converter for use with analog sensors, acomputer with a high resolution colour monitor, and data storage
68
and analysis software.
The fourth major component consists of various types ofimage recording and retrieving devices. These are used to recordboth visual and thermal images.
4.2.1 Object
This technique can be used to detect concrete subsurfacedelamination on bridge decks. This can also detect the internalvoids, cracks and honeycombing in concrete structures. Thismethod gives the fairly accurate picture about the condition ofconcrete inside and can be effectively applied for larger surfaces.
4.2.2 Principle
Infrared thermographic investigation techniques are basedon the principle that the materials with subsurface anomalies, suchas voids caused by corrosion of reinforcing steel, or voids causedby poor compaction called honeycombing, in a material affect heatflow through that material. These changes in heat flow causelocalized differences in surface temperatures. Thus, by measuringsurface temperatures under conditions of heat flow into or out ofthe material, one can determine the presence and location of anysubsurface anomalies.
An infrared thermographic scanning system measuressurface temperature only, but the surface temperatures of aconcrete mass depend on three factors.
(a) The subsurface configuration(b) The surface conditions(c) The environment
Normally the testing should be conducted during times ofthe day or night when the solar radiation or lack of solar radiationwould produce the most rapid heating or cooling of the concretesurface. The test should not be conducted when sky is cloudy.The measurements should be taken when then wind speed is lowerthan 25kmph. The test should not be conducted when the

69
temperature is below 0°C. If the concrete surface is covered withstanding water, the test should not be conducted.
4.2.3 Methodology
For performing this test efficiently, a movement of heatmust be established in the structure. Normally the inspectionshould be conducted during the sunny day, i.e. the testing shouldbe avoided during monsoon. The inspection may begin either 2 to3 hours after sunrise or 2 to 3 hours after sunset, both are times ofrapid heat transfer. The surface to be tested should be cleanedthoroughly.
The next step is to locate a section of sound concrete.This work can be done by chain dragging (sounding), coring, orground penetrating radar or by using some other suitable method.Image the reference area and set the equipment controls so thatan adequate temperature image is viewed and recorded.
The next step is to image the area, which is known tohave defects i.e. voids/delamination/cracks etc. and images ofthis defective area are viewed and recorded. Now the setting ofthe equipment should be done in such a way to allow viewing ofboth the sound and defective reference areas in the same imagewith the widest contrast possible.
If a black and white monitor is used, better contrast imageswill normally be produced when the following convention is used,black is defective concrete and white is sound material. If a colourmonitor or computer enhanced screen is used, three colours arenormally used to designate definite sound areas, definite defectiveareas and indeterminate areas. When tests are performed duringday light hours, the defective concrete areas will appear warmer,whereas during test performed after dark, defective areas will appearcooler.Once the control are set, the recording of images can bedone and stored.

70
4.2.4 Advantages & Limitations
The main advantage of this method is that it is an areatesting technique, whereas other destructive and non-destructivemethods are points testing or line testing methods. This methodis completely non-destructive, repeatable, accurate, efficient andeconomical. The method can cover large areas within short time.One of the biggest advantage of this method is that this is absolutelysafe and equipment does not emit any radiation.
The main limitation is that the depth or thickness of a voidcannot be determined using this method. It cannot be determinedwhether a subsurface void is near the surface or away from thesurface. When used in combination with ground penetrating radarmethod this method gives useful information about the internaldefects.
4.3 Acoustic Emission Technique
Acoustic emission is the sound (both audible andsub-audible), that are generated when a material undergoesirreversible changes, such as those due to cracking. In general,acoustic emissions are defined as the class of phenomena wherebytransient elastic waves are generated by the rapid release of energyfrom localized sources within a material. These wave propagatethrough the material, and their arrival at the surface can be detectedby the piezoelectric transducers.
The main elements of a modern acoustic emissiondetection system are shown in Fig. 4.3.1.
The brief description of the most important parts of thissystem is as follows:
a) Transducers – Piezoelectric transducers (generallymade of lead zirconate titanate, PZT) are used toconvert the surface displacements into electric signals.There are mainly two types of transducers – wide bandtransducers and narrow band transducers. Thetransducers must be properly coupled to the specimen,

71
Fig.
4.3
.1 E
lem
ents
of M
oder
n A
cous
tic E
mis
sion
Det
ectio
n Sy
stem
osci
llosc
ope
audi
o am
plifi
eran
d sp
eake
r
disp
lay
prin
ter
cass
ette
reco
rder
com
pute
r
Plot
ter
puls
e co
unte
r
even
t co
unte
r
sign
al d
urat
ion
max
imum
ampl
itude
ener
gy
freq
uenc
yan
alys
is
aplit
ude
dist
ribu
tion
defe
ctlo
catio
n
mai
nam
plifi
er
band
pass
filte
r
prea
mpl
ifier
trans
duce
rs
thre
shol
ddi
scrim
inat
ion
spec
imen
sign
al a
naly
sis

72
often using some form of silicon grease as the couplingmedium.
(b) Preamplifier – Because of the low voltage output, theleads from the transducer to the preamplifier must beas short as possible. Sometimes the preamplifier isintegrated within the transducer itself. This amplifiesthe output signals.
(c) Passband filters – These are used to suppress theacoustic emission signals that lie outside the frequencyrange of interest.
(d) Main amplifier - This further amplifies the signals,typically within a gain of 20 to 60 dB.
(e) The discriminator – It is used to set the threshold voltageabove which signals are counted.
4.3.1 Object
This method is used mainly to detect the cracking inconcrete, whether due to externally applied loads, drying shrinkageor thermal stresses. This method can be helpful in determiningthe internal structure of the material and to know the structuralchanges during the process of loading.
The method can also be used to establish whether thematerial or the structure meet certain design or fabrication criteria.In this case, the load is increased only to some predeterminedlevel. The amount and nature of acoustic emissions may be usedto establish the integrity of the specimen or structure and mayalso be used to predict the service life.
4.3.2 Principle
When an acoustic emission event occurs at a source withthe material, due to inelastic deformation or cracking, the stress
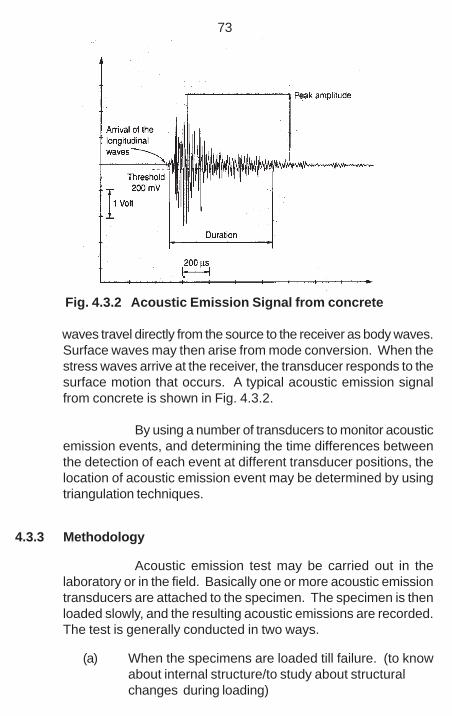
73
Fig. 4.3.2 Acoustic Emission Signal from concrete
waves travel directly from the source to the receiver as body waves.Surface waves may then arise from mode conversion. When thestress waves arrive at the receiver, the transducer responds to thesurface motion that occurs. A typical acoustic emission signalfrom concrete is shown in Fig. 4.3.2.
By using a number of transducers to monitor acousticemission events, and determining the time differences betweenthe detection of each event at different transducer positions, thelocation of acoustic emission event may be determined by usingtriangulation techniques.
4.3.3 Methodology
Acoustic emission test may be carried out in thelaboratory or in the field. Basically one or more acoustic emissiontransducers are attached to the specimen. The specimen is thenloaded slowly, and the resulting acoustic emissions are recorded.The test is generally conducted in two ways.
(a) When the specimens are loaded till failure. (to knowabout internal structure/to study about structuralchanges during loading)
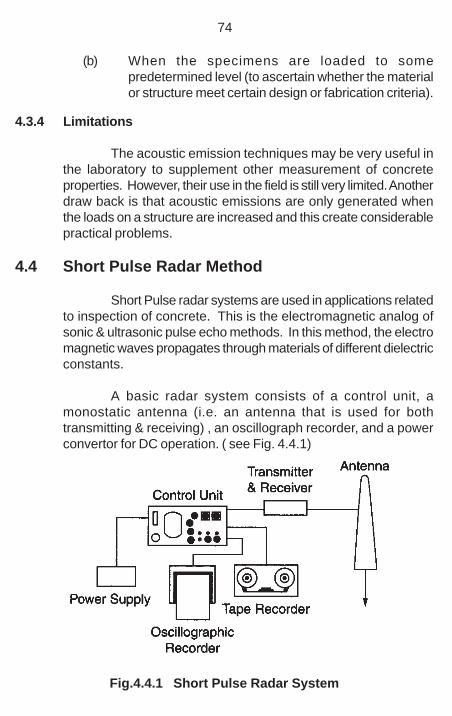
74
(b) When the specimens are loaded to somepredetermined level (to ascertain whether the materialor structure meet certain design or fabrication criteria).
4.3.4 Limitations
The acoustic emission techniques may be very useful inthe laboratory to supplement other measurement of concreteproperties. However, their use in the field is still very limited. Anotherdraw back is that acoustic emissions are only generated whenthe loads on a structure are increased and this create considerablepractical problems.
4.4 Short Pulse Radar Method
Short Pulse radar systems are used in applications relatedto inspection of concrete. This is the electromagnetic analog ofsonic & ultrasonic pulse echo methods. In this method, the electromagnetic waves propagates through materials of different dielectricconstants.
A basic radar system consists of a control unit, amonostatic antenna (i.e. an antenna that is used for bothtransmitting & receiving) , an oscillograph recorder, and a powerconvertor for DC operation. ( see Fig. 4.4.1)
Fig.4.4.1 Short Pulse Radar System

75
For inspection of concrete structures, it is desirable touse a radar antenna with relatively high resolution or short pulsewidth.
4.4.1 Object
The method can be effectively used for detection ofdelamination in concrete. The method can also be used fordetermination of degree of hydration of concrete, water content infresh concrete, and for measurement of concrete layer thicknessetc. Method can also be used for locating the position of rebars.
4.4.2 Principle
When an electromagnetic wave (such as microwave) strikean interface, or boundary between two materials of differentdielectric constants, a portion of the energy is reflected and theremaining penetrates through the interface into the second material( Fig. 4.4.2 )
Fig. 4.4.2 Movment of Electromagnetic Wave
The intensity of reflected energy (AR), is related to the intensityof the incident energy (AI) by the following relationship -
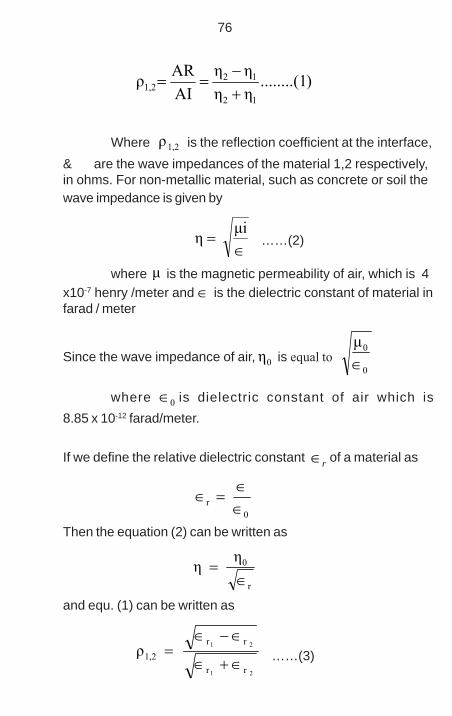
76
)........(1ηηηη
AIARρ
12
121,2 +
−==
Where 1,2ρ is the reflection coefficient at the interface,& are the wave impedances of the material 1,2 respectively,in ohms. For non-metallic material, such as concrete or soil thewave impedance is given by
∈=
μiη ……(2)
where μ is the magnetic permeability of air, which is 4x10⁻⁷ henry /meter and ∈ is the dielectric constant of material infarad / meter
Since the wave impedance of air, 0η is equal to 0
0μ∈
where 0∈ is dielectric constant of air which is8.85 x 10-12 farad/meter.
If we define the relative dielectric constant r∈ of a material as
0r ∈
∈=∈
Then the equation (2) can be written as
r
0ηη∈
=
and equ. (1) can be written as
21
21
rr
rr1,2ρ
∈+∈
∈−∈= ……(3)
77
where 1r∈ and
2r∈ are the relative dielectric constants ofmaterial 1 an 2 respectively.
So depending upon the relative dielectric constants ofmaterial 1 and 2, the amount of reflected energy from interface ofmaterial 1 &2 is determined, and the remaining energy will bepenetrated into material 2. When this remaining microwave en-ergy reaches another interface after traveling to material 2, aportion will be reflected back as shown in equation (3).
This reflection of energy from various interfaces is beingmeasured in Short Pulse Radar method for determination of vari-ous defects.
4.4.3 Methodology
For inspection of concrete bridges, an antenna is placedwith its transmitting face parallel to and at a distance from thesurface of the concrete. However, if the concrete member is rela-tively thick and the expected deterioration is deep or if the an-tenna does not have sufficient power or penetration, the antennamay be placed directly over the concrete surface. With the ad-justments in the control unit the radar signals are recorded with aproperly calibrated oscillograph recorder. This is called the staticmode of measurement, since the antenna is stationary with re-spect to the concrete being tested.
If relatively large concrete area has to be inspected theantenna is mounted on the front or rear of an inspection vehicle.The vehicle will make several passes over the area to be tested tocover the entire area. During each pass the antenna scans adifferent area. The stream of the radar signals are recorded con-tinuously with an instrumentation tape recorder. With two antennaor multi antenna system, the requirement of number of passes willbe less. These recordings are later on studied and interpreted fordetection of defects.
78
4.4.4 Advantages and Limitations
This methods is very much effective for inspection of deckslab of road bridges, provided with asphalt overlays. The distruptionto road traffic is minimal while inspection is done. There are norestrictions, regarding the timing of inspection or the availability ofcertain ambient conditions during inspections and inspection canbe done any time and in any type of ambient conditions.
The major limitation is that the interpretation of signalsreceived at radar is very cumbersome because of the presence ofinterfering signals.
4.5 Stress Wave Propagation Methods
There are several test methods, based on stress wavepropagation, used for non-destructive testing of concrete. Theecho methods (impact echo and pulse echo) are used for thick-ness measurements, flaw detection and integrity testing of piles.The impulse response method is also used to test piles and slablike structures. The following stress wave propagation method aregenerally used for testing of concrete.
(a) Pulse Echo method(b) Impact Echo method(c) Impulse response method
All the three methods are discussed in detail in this chapter.
4.5.1 Pulse Echo Method
In this method, a transmitter introduces a stress pulseinto an object at an accessible surface. The pulse propagatesinto the test object and is reflected by flaws or interfaces. Thesurface response caused by the arrival of reflected waves, or ech-oes, is monitored by either the transmitter acting as a receiver(true pulse echo) or by a second transducer located near the pulsesource (pitch-catch). (Fig. 4.5.1.)
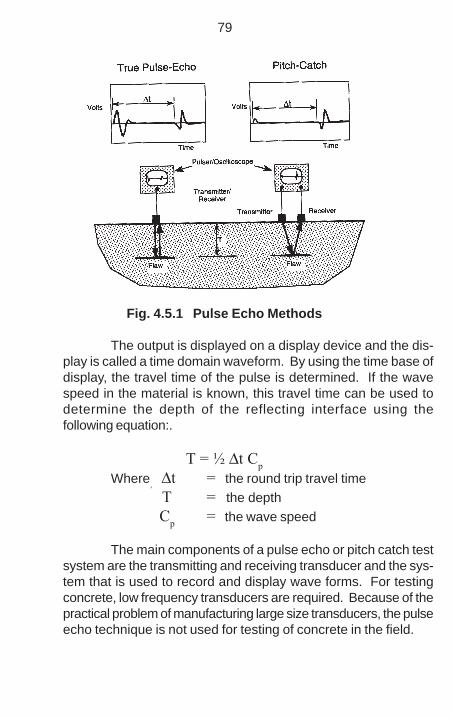
79
Fig. 4.5.1 Pulse Echo Methods
The output is displayed on a display device and the dis-play is called a time domain waveform. By using the time base ofdisplay, the travel time of the pulse is determined. If the wavespeed in the material is known, this travel time can be used todetermine the depth of the reflecting interface using thefollowing equation:.
T = ½ Δt CpWhere, Δt = the round trip travel time T = the depth Cp = the wave speed
The main components of a pulse echo or pitch catch testsystem are the transmitting and receiving transducer and the sys-tem that is used to record and display wave forms. For testingconcrete, low frequency transducers are required. Because of thepractical problem of manufacturing large size transducers, the pulseecho technique is not used for testing of concrete in the field.

80
4.5.2 Impact Echo Method:
4.5.2.1 Introduction:
The impact-echo method is a technique for flaw detectionin concrete based on stress wave propagation. A team ofresearchers at the National Institute of Standards and Technology(formerly the National Bureau of Standards) initiated a study in1983 that developed the rudimentary basis for this method.Subsequently, research carried out at Cornell University, underthe direction of Dr. Mary Sansalone, has refined the theoreticalbasis of the method, and extended its applications to a broadspectrum of problems and lead to the development of a field testsystem. Studies have shown that the impact-echo method iseffective for locating voids, honeycombing, delaminations, depthof surface opening cracks, and measuring member thicknesses.
4.5.2.2 Basic Principle
The principle of the impact-echo technique is illustratedin Fig.4.5.2.1. A transient stress pulse is introduced into a testobject by mechanical impact on the surface. The stress pulsepropagates into the object along spherical wavefronts as P- andS-waves (Fig. 1(a)). In addition, a surface wave (R-wave) travelsalong the surface away from the impact point. The P- and S- stresswaves are reflected by internal interfaces or external boundaries.The arrival of these reflected waves at the surface where theimpact was generated produces displacements which aremeasured by a receiving transducer (Fig.1 (b)). If the receiver isplaced close to the impact point, the displacement waveform isdominated by the displacements caused by P-wave arrivals. Thedisplacement waveform can be used to determine the travel time,t, from the initiation of the pulse to the arrival of the first P-wavereflection. If the P-wave speed, Cp, in the test object is known, thedistance, T, to the reflecting interface can be determined.

81
Fig. 4.5.2.1 - Principle of the impact-echo method : (a) Impact on solidresults in stress waves that propagate into the solid and along its surface;(b) A receiver near the impact point sense the arrival of the R-wave andreflected P-wave.
4.5.2.3 Instrumentation:
An impact-echo test system is comprised of three com-ponents:• An impact source.• A displacement transducer.• A computer or waveform analyzer.
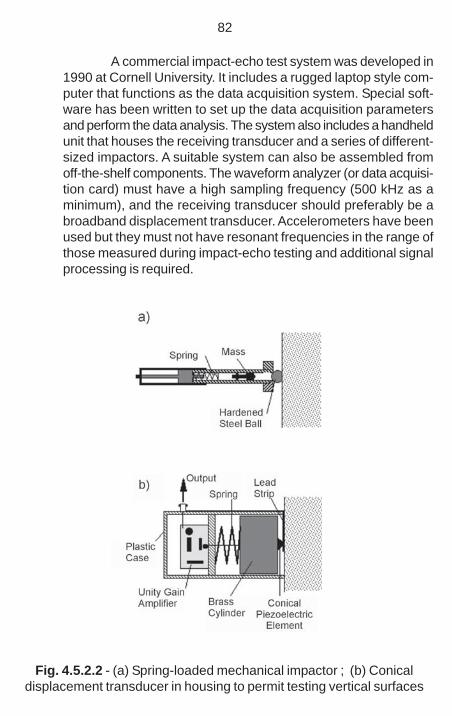
82
A commercial impact-echo test system was developed in1990 at Cornell University. It includes a rugged laptop style com-puter that functions as the data acquisition system. Special soft-ware has been written to set up the data acquisition parametersand perform the data analysis. The system also includes a handheldunit that houses the receiving transducer and a series of different-sized impactors. A suitable system can also be assembled fromoff-the-shelf components. The waveform analyzer (or data acquisi-tion card) must have a high sampling frequency (500 kHz as aminimum), and the receiving transducer should preferably be abroadband displacement transducer. Accelerometers have beenused but they must not have resonant frequencies in the range ofthose measured during impact-echo testing and additional signalprocessing is required.
Fig. 4.5.2.2 - (a) Spring-loaded mechanical impactor ; (b) Conicaldisplacement transducer in housing to permit testing vertical surfaces

83
The force-time history of the impact may be approximatedas a half-sine curve, and the duration of the impact is the contacttime. The contact time is an important variable because itdetermines the size of the defect which can be detected byimpact-echo testing. As the contact time decreases, smallerdefects can be detected. However, as contact time decreases thepenetrating ability of the stress waves also decreases. Thus theselection of the impact source is a critical aspect of a successfulimpact-echo test system. For the development work performed atNIST, contact times on the order of 30 to 60 microseconds wereobtained by dropping steel spheres of different diameters. In laterwork at NIST, a commercially available impactor was adapted foruse as the impact source. The components of the impactor areshown in Fig.4.5.2.2. The spherically-tipped mass is propelled bythe spring-loaded device. A hardened steel ball is attached to theend of the device and contacts the test surface. The ball serves toincrease the repeatability of the input pulse and shorten thecontact time of the impact. Typically the impactor producesimpacts with contact times ranging from 30 to 50 microseconds,depending on the characteristics of the concrete at the impactpoint. The commercially available impact-echo test system usessteel spheres on spring rods for the impact source. The userselects the size of the impactor based on the depth and size offlaw that is to be detected.
The receiving transducer must be capable of accuratelymeasuring surface displacement. A special housing was built tohold the transducer so that it could be used on vertical surfaces(Fig. 4.5.2.2(b)). A thin lead strip is used to provide acousticcoupling between the transducer and the test surface.
A waveform analyzer, or computer with high-speed digitaldata acquisition hardware, is used to capture the transient outputof the displacement transducer, store the digitized waveforms, andperform signal analysis. A suitable waveform analyzer, or dataacquisition card, should have a sampling frequency of at least 500kHz.

84
4.5.2.4 Signal Analysis Method
During the initial development of the impact-echotechnique, interpretation of the recorded waveforms was performedin the time domain. This required establishing the time of impactinitiation and the arrival time of the first P-wave echo. While thiswas feasible, it was found to be time-consuming. An alternativeapproach is frequency analysis of the displacement waveforms.
The principle of frequency analysis is illustrated inFig. 4.5.2.3, which shows a solid plate of thickness T subjected toan impact-echo test.
Fig. 4.5.2.3 - Frequency analysis is based on the principle that the P-waveundergoes multiple reflections between the reflecting surfaces. The P-wavearrives at the test surface at periodic intervals, resulting in a characteristicfrequency in the waveform that is dependent on the distance to the reflect-ing surface.
The P-wave generated by the impact propagates backand forth between the top and bottom surfaces of the plate. Eachtime the P-wave arrives at the top surface it produces a character-istic displacement. Thus the waveform is periodic, and the period,t, is equal to the travel path, 2T, divided by the P-wave speed.Since frequency is the inverse of the period, the frequency, fp, ofthe characteristic displacement pattern is:
fp = Cp/2T Eq. (1)

85
Thus, if the frequency of an experimental waveform canbe determined, the thickness of the plate (or distance to areflecting interface) can be calculated:
T = Cp/2fp Eq. (2)
Note that Eq. (2) is an approximation that is suitable formost applications in plate-like structures. When using the methodto measure plate thickness, a correction factor is needed. Forprismatic members, the value of the correction factor depends onthe geometry of the member. In practice, the frequency content ofthe recorded waveforms is obtained using the fast Fouriertransform (FFT) technique to obtain the amplitude spectrum.Appendix A gives additional background information on digitalfrequency analysis.
4.5.2.5 Illustrative Example
Figure 4.5.2.5 illustrates how frequency analysis is usedin impact-echo testing. In Fig. 4.5.2.5(a) an impact- echo test wasperformed over a solid portion of a 0.5-m thick concrete slab. Inthe amplitude spectrum there is a frequency peak at 3.42 kHz.This frequency corresponds to multiple reflections between thebottom and top surfaces of the slab. Using Eq. (1) and solving forCp, the P-wave speed is calculated to be 3410 m/s. Figure4.5.2.5(b) shows the amplitude spectrum obtained from a test overa portion of the slab containing a disk-shaped void. The peak at7.32 kHz results from multiple reflections between the top of theplate and the void. Using Eq. (2), the calculated depth of the voidis 3410/ (2 * 7320) = 0.23 m, which compares favorably with theknown distance of 0.25 m.

86
Fig. 4.5.2.5 - Examples of amplitude spectra : a) for a test over a solidportion of a 0.5- m thick concrete slab; b) for a test over a disk-shaped voidembedded in another portion of the same slab.
Appendix A explains that the resolution in the amplitudespectrum, that is, the frequency difference between adjacent points,is equal to the sampling frequency divided by the number of pointsin the waveform record. This imposes a limit on the resolution ofthe depth calculated according to Eq. (2). Because depth andfrequency are inversely related, it can be shown that for a fixedresolution in the frequency domain, the resolution of thecalculated depth improves as the frequency increases, that is, asdepth decreases
4.5.2.6 ASTM Standard
In 1998, ASTM adopted a standard test method on usingthe impact-echo method to measure the thickness of concretemembers (ASTM C 1383, Standard Test Method for Measuringthe P-wave Speed and Thickness of Concrete Plates Using theImpact-Echo Method). The method involves two procedures.Procedure A is to determine the P-wave speed in the concrete bymeasuring the travel time between two surface receiversseparated by a known distance. Procedure B is to measure thethickness of the member by measuring the thickness frequencyusing the impact-echo procedure. The method is applicable to

87
plate-like structures in which the smallest lateral dimension is atleast six times the thickness of the member. The standardincludes procedures for estimating the systematic errorsassociated with the thickness measurement due to the digitalnature of the data. In the background research leading to thestandard, researchers at Cornell University found that Eq. (2) hasto be modified by a factor of 0.96 to correctly estimate thethickness based on the measured P-wave speed from ProcedureA and the measured frequency from Procedure B.
4.5.2.7 APPENDIX A -- FREQUENCY ANALYSIS:
An impact on the top surface of an infinite plate results inmultiple reflections of stress waves between the top and bottomsurfaces. The multiple reflections give a periodic character to thedisplacement response at points close to the impact point. Infinite solids containing flaws, multiple reflections occur between avariety of interfaces and free boundaries. As a result, time domainwaveforms become complex and difficult to interpret. However, ifthe waveforms are transformed into the frequency domain,multiple reflections from each interface become dominant peaksin the amplitude spectrum -- at frequency values corresponding tothe frequency of arrival of reflections from each interface. Thesefrequencies can be used to calculate the location of the interfaceat each test point. It has been found that, for impact-echo testing,data interpretation is much simpler and quicker in the frequencydomain than in the time domain.
The transformation from the time to the frequency domainis based on the idea that any waveform can be represented as asum of sine curves, each with a particular amplitude, frequency,and phase shift. This transformation is carried out using theprinciples of the Fourier transform. As an example, Fig. A1 (a)shows the digital time domain waveform, g(t), given by the func-tion:
g(t) = sin (2 (pi) 20 t) + sin (2 (pi) 40 t) + sin (2 (pi) 60 t) Eq. (A.1)
where t = time, s.
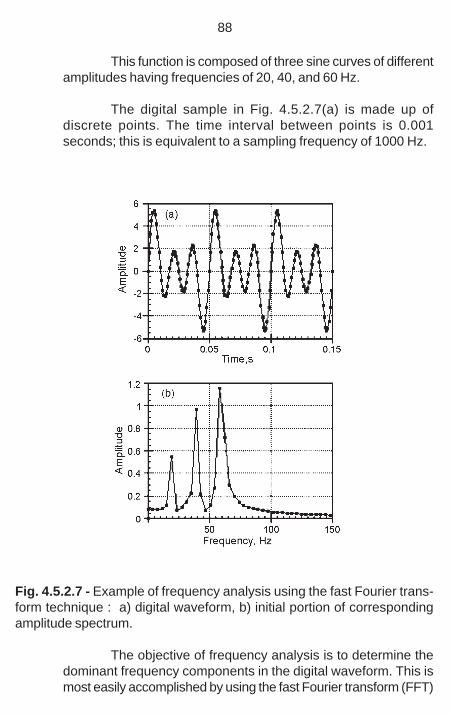
88
This function is composed of three sine curves of differentamplitudes having frequencies of 20, 40, and 60 Hz.
The digital sample in Fig. 4.5.2.7(a) is made up ofdiscrete points. The time interval between points is 0.001seconds; this is equivalent to a sampling frequency of 1000 Hz.
Fig. 4.5.2.7 - Example of frequency analysis using the fast Fourier trans-form technique : a) digital waveform, b) initial portion of correspondingamplitude spectrum.
The objective of frequency analysis is to determine thedominant frequency components in the digital waveform. This ismost easily accomplished by using the fast Fourier transform (FFT)

89
technique. The FFT results can be used to construct theamplitude spectrum, which gives the amplitudes of the variousfrequency components in the waveform. The amplitude spectrumobtained by the FFT contains half as many points as the timedomain waveform, and the maximum frequency in the spectrum isone-half the sampling rate, which for this example is 500 Hz.Figure 4.5.2.7(b) shows the initial portion of the computedamplitude spectrum; the peaks occur at 20, 40, and 60 Hz. Eachof the peaks corresponds to one of the component sine curves inEq. (A.1).
In the FFT technique, the frequency interval, f, in thespectrum is equal to the sampling frequency divided by thenumber of points in the waveform. For this example, there are 256points in the complete time domain waveform, and the frequencyinterval is equal to 1000 Hz divided by 256, or 3.9 Hz. Since thefrequency interval is proportional to the sampling frequency, a slowersampling rate enhances resolution in the frequency domain.However, slower sampling rates leads to longer record lengthswhich can result in complex spectra due to reflections from sideboundaries of the test object. Experience has shown that asampling frequency of 500 kHz with 1024 points per record isdesirable in most applications.
4.5.3 Impulse Response Method:
Impulse response equipment is used to produce a stresswave in the considered component. The stress wave may e.g. beproduced by an impact with an instrumented rubber tippedhammer. The impact causes the component to act in bendingmode. A velocity transducer placed adjacent to the impact pointmeasures the response of the component.
In contrast to the Impact-Echo method the impulseresponse equipment does not measure the reflection of theimpact. Furthermore, the impact used to produce the response isconsiderably larger than the impulse used for the Impact-Echomethod.

90
The hammer used to produce the impact and thetransducer used to measure the response of the component areboth connected to a laptop PC. The laptop performs a spectralanalysis of the impact as well as the response. Dividing theresultant velocity spectrum by the force spectrum then derives the“mobility”. An example of a mobility graph is shown below.
For each measurement the resulting mobility graph isshown. On the basis of the mobility graph the followingparameters are determined:
• Average mobility: The average mobility is shown as thegreen line in the figure above. The average mobility dependson the thickness of the material. If the thickness is reducedthe average mobility is increased. This implies that laminatedconcrete has a higher average mobility than non-laminatedconcrete.
• Stiffness: The stiffness is determined as the inverse of theinclination of the part of the mobility graph below 80 Mz, thered line in the figure above. The stiffness depends on thestiffness of the material, the thickness of the material and itdepends on how the component is supported. Based on acomparison of the stiffness at a number of different locationspotential “weak” areas may be located.
• Mobility slope: The presence of honeycombs in the con-crete will reduce the damping of the signal. This implies thatthe mobility graph will be increasing within the consideredfrequency range, see figure below.

91
Voids index: The voids index is defined as the ratio be-tween the initial maximum of the mobility and the average mobil-ity. If the component is laminated the initial maximum of the mo-bility will be considerably higher than the average mobility. If thevoids index is higher than 2 – 4 it indicates a potentially “weak”area, see figure below.
92
The impulse response method is a fast method whichmay be used to screen a relatively large area within a short periodof time. The equipment delivers surface graphs of the measuredparameters. In the figure below a surface graph of the averagemobility of a bridge deck is shown.
The results of the impulse response testing shall alwaysbe calibrated on the basis of e.g. cores, break-ups or a visualinspection using a boroscope. The locations of these tests areselected on the basis of the surface graphs of the measuredparameters.
The method is used mainly for testing of piles. Testing ofpiles by this method is covered in ASTM test method D 5882 andis known as transient response method.
4.6 Crack Detection Microscope:
It is a high quality product designed for measuring crackwidth, both in concrete and other materials. The high definitionmicroscope is connected to an adjustable light source which pro-vide a well – illuminated image under all workingconditions. The image is focused by turning the knob at the sideof the microscope and the eye-piece graticule can be rotatedthrough 360
0 to align with the direction of the crack under
examination. The 4 mm range of measurement has a lower scaledivided into 0.2 mm divisions. These 0.2 mm divisions are

93
sub-divided into 0.02 mm divisions. Current Codes of practice,state that calculated maximum crack widths should not exceedcertain values: e.g.0.3 mm in BS 8110 : Part 2 for most types ofenvironment . This value is 15 divisions on the graticule.
The Crack Detection microscope is very easy to use andcomes with simple instructions in a wooden carrying box.
Specifications:Magnification = 40 timesMeasuring Range = 4 mmDivisions = 0.02 mmWeight including battery and box = 560 grDimensions of box = 150x100 50 mm deep
Advantages :It can measure the width of fine cracks. Can measure
visible cracks only.
Disadvantages :It can not measure the depth of cracks.
Operational Procedure :Place the scale of Crack Detection Microscope on the
crack. Read the number of divisions which falls on the crack.

94
Multiply the number of division by L.C. of the microscope. This willgive the width of the crack in mm. L.C. stands for least count andits value is 0.02 mm.
4.7 Boroscope:
This method can be used for concrete, steel and masonrystructures. The method is most commonly used on concrete andmasonry structures.
A boroscope is used to look inside inaccessible or smallvoids. For example, if cable ducts are not injected, it is possible toinspect the strands by means of an endoscope through a contactdrilling (here a drilled hole from the surface to the cable duct).
For steel structures the method is usually used for inves-tigation of closed profiles to gain information regarding the condi-tion of the interior surfaces of the closed profiles.
For masonry structures the boroscope can be used togain information of the depth of the outer layer of bricks or naturalstones and it can provide information of the filling material inbetween the arches. It may also be used to examine the mortarbetween bricks or natural stone.
The boroscope equipment includes a lighting source anda fibre optic cable to transfer the light to the boroscope.
A system of lenses enables the boroscope to be used asa monocular. A camera or video camera can also be mounted onthe boroscope for photo documentation.
Generally speaking, the method is appropriate and mayalso be used for inspections of structural components such asexpansion joints, honeycombs and cracks/slots.
The many variations and features which can be obtainedfor boroscopes make them an almost universal tool for internalinspections. These include a wide range of lengths and diameters,solid tubular or flexible bodies, lenses for forward, sideways or

95
retro viewing, still and video camera attachments, and mains orbattery power supplies.
4.7.1 SpecificationVideo Boroscope Remote High Resolution CCD camera
is comprising of three items as below.
(i) Videoscope 3M 6MM diaIndustrial videoscope with diameter 6 mm, length 3m, tung-
sten sheet, deflection 150 degree (up/down) and 120 degree (right/left), direction of view 0 degree, field of view 50 degree, consistingof VP06030AE Videoscope 3m x 6 mm dia, V0625WAE Inter-changeable lens 0 degree, 80135A Carrying case
(ii) Interchangeable lens 90 degreeInterchangeable lens 90 degree, interchangeable lens for
videoscope with 6 mm diameter. Direction of view 100 degree,depth of field 1 to 15 mm.
(iii) Portable Pack , PALConsisting of 81040020 Portable pack base unit, PAL
81040030 Portable pack battery 81040031, Portable pack batterycharger 81040040 Portable pack carrying strap 81040045 Sup-port cover type 1 81040050 Support cover type 2 81040055 Por-table pack soft carrying bag 88003001 C Compact – flash card128 MB, 88002013 Card reader.
Portable Pack24W Xenon light source, 6.4” TFT monitor, integrated
battery with life of 2.5 hrs, 1GB CF card as standard for imagerecording
4.7.2 Operational Procedure :-Each company specifies the operational procedure. The
operational procedure of KARL STORZ Borescope is given for in-formation as below.
(i) System startupInsert video connector into the camera port of the camera

96
control unit / the KARL STORZ TECHNO PACK.
Insert light connector into the light tapping point of thecold light projector / the KARL STORZ TECHNO PACK.
Turn on camera control unit / KARL STORZ TECHNOPACK, light source and monitor (if a separate monitor is used).
(ii) System ShutoffTurn off monitor (if a separate monitor is used), light source
and camera control unit / KARL STORZ TECHNO PACK.
Disconnect light connector from the light tapping point ofthe cold light projector / the KARL STORZ TECHNO PACK.
Disconnect video connector from the camera port of thecamera control unit / the KARL STORZ TECHNO PACK.
(iii) White BalanceThe white balance adjusts the colour reproduction of the
system to match the colour temperature of cold light projectorused. The white balance remains in memory after the base unit isturned off. When the system is started again , a new whitebalance must be set whenever a different light source or a differentlamp or a different cable is used.
Point VIDEOSCOPE towards a white surface while thecamera control unit is turned on. Ensure that no objects with othercolour can be seen in the image section.
(iv) Press the white balance button ( blue function button on hand-piece ) for a long time. If the white balance is correct, the screendisplay is briefly inverted. If this does not happen, the white bal-ance was not completed correctly. Either too much or too littlelight was received. In this case, increase or, as the case may be,decrease the distance between the VIDEOSCOPE tip and thewhite surface.
(v) Repeat the white balancing.

97
• Controlling the viewing direction
(vi) The viewing of the VIDEOSCOPE may be adjusted bydeflecting the movable tip in four directions.
(vii) By rotating the larger of the two hand wheels on thehandpiece, the movable tip of the VIDEOSCOPE is deflecteddownward or upward. The viewing direction that was set eitherdownward or upward can be locked in with a locking lever betweenthe large hand wheel and the handpiece.
(viii) By rotating the smaller of the left or right wheels on thehandpiece, the movable tip of the VIDEOSCOPE is deflected tothe left or right. The viewing direction that was set either to the leftor right can be locked in with the rotary dial on the small handwheel.
4.8 Nuclear Methods:
Neutron Moisture Gauges- These are used to measuremoisture content in concrete. They are based on the principle thathydrogen containing materials (water) act as excellentmoderators for fast neutrons, i.e. such materials produce a rapiddecrease in neutron energy, depending on amount of hydrogen.Thus, counting of the slowed down neutrons gives a measure ofthe hydrogen content of the concrete. Isotopic neutron sources(such as radium with beryllium) are generally used in moisturegauges.
4.9 Structural Scanning Equipment:
4.9.1 Introduction:Structural scanning equipment consists of SIR –3000
Ground Penetrating Radar System, High resolution 1500 MHzantenna, handy cart, RADAN 6.0 processing & interpretationsoftware, 3D Quick DRAW software with, Structure Scan and BridgeDeck evaluation Modules and data collection grid. Structure Scanis a complete concrete inspection system. The system isdesigned to be user-friendly, just four simple steps. Set up survey

98
area, collect the data and view it in real time. Download the dataand create 3D image for easy and accurate analysis. The Struc-ture Scan System is a very rugged, compact and lightweight sys-tem. Flash memory data transfer capability (up to 1 GB), high –resolution color monitor, very easy to operate with single personoperation. No laptop is required in the field for data acquisition,initial data processing steps and viewing the data.
4.9.2 Ground Penetrating Radar:
Ground penetrating radar (GPR) is a geophysical imagingtechnique used for subsurface exploration and monitoring. Itprovides an ideal technique for concrete evaluation. Concreteevaluation studies utilizing GPR include the inspection of variousfoundation floor systems such as structurally suspended slabs,post tensioned or conventionally reinforced slab-on-gradefoundation systems, retaining walls, decks, tunnels, balconies andgarages. Ground penetrating radar covers a wide area in arelatively short period of time for concrete evaluation studies. Dueto recent hardware and software advances, real time cursoryanalysis can be performed at the site. Because of these and otherreasons; GPR has become an increasingly attractive method forthe engineering in particular for shallow, high resolutionapplications such as concrete evaluation studies. Standard testmethods and guides involving GPR have been derived by theAmerican Society for Testing and Materials (ASTM). ASTM D4748-87 is a standard test method for the exploratory use of GPRfor the determination of pavement layer(s) thickness. A morerecent and broad guide for GPR usage for subsurfaceinvestigation is standardized in ASTM D 6432-99. This ASTM guideprovides a compendium of related GPR information useful for awide range of applications including concrete evaluation studies.
GPR is a non-destructive technique that emits a shortpulse of electromagnetic energy, which is radiated into thesubsurface. When this pulse strikes an interface between layersof materials with different electrical properties, part of the wavereflects back, and the remaining energy continues to the nextinterface. GPR evaluates the reflection of electromagnetic wavesat the interface between two different dielectric materials. The
99
penetration of the waves into the subsurface is a function of themedia relative dielectric constants (∈). If a material is dielectricallyhomogeneous, then the wave reflections will indicate a single thicklayer.
Ground penetrating radar directs electromagnetic energyinto the subsurface. The propagation of electromagnetic energy isdescribed by Maxwell’s equation with the electric component (E)orthogonal to the magnetic component (H) (Reynolds, 1997). Forconcrete evaluation studies, both components are equallyimportant. Concrete material is a low conductivity, non-metallicmedium that is ideal for GPR signal propagation. However,concrete typically has steel reinforcement, which is a metallicand therefore completely reflects the GPR signal and shadowsanything directly below the metal. If applicable, the sub-basebeneath a concrete unit is non-metallic. The sub base may behighly conductive soils (such as expansive clays) that effectivelyattenuate the GPR signal propagation thereby limiting depthpenetration. The relative dielectric constant (∈) of non-metallicmedium is a function of three different materials within themedium- solid, fluid and gas (Lytton, 1995). Therefore, for example,the relative dielectric constant for an unsaturated soil is acombination of the relative dielectric constant of the air, relativedielectric constant of water, relative dielectric constant of soil,porosity and degree of saturation.
The velocity in which electromagnetic energy propagatesthrough any medium is a function of the relative dielectricproperty, speed of light (c=0.3 meters/nanosecond) and magneticpermeability (μ ). The magnetic permeability is equal to one (μ =1)in a non-metallic medium and therefore is not a factor for the wavepropagation velocity. Wave propagation velocities (V) through agiven medium are important to convert a time domain radargrammodel into a distance domain radargram model.
4.9.2.1 Operation Principles:
There are several antenna manufacturers, antenna types,

100
signal pre- and post- setting options; operating frequencies soft-ware packages, etc. to consider for a specific application withinthe engineering and construction industry, geological, environmen-tal and/or archaeological fields. Each radar system must be de-signed to meet the objective(s) of a given project. For concreteevaluation studies, there are several options available – all of whichhave certain advantages and disadvantages. For the evaluation ofvarious concrete structures, which include streets/highways,parking lots, bridge decks, pools, tilt wall panels, sidewalks,various foundation systems and retaining walls, a versatile andhighly portable radar system with a ground coupled, monostaticantenna is suitable. However, for specialized projects, such asroad condition evaluation, an air launched (horn) antenna iscommonly used due to the efficient data collection, characteristicof this antenna. Currently, GPR data can be collected with thisair-launched antenna at highway speeds.
A typical radar system for concrete evaluation studiesgenerally consists of a control unit (computer), pulse generator,transmitting and receiving antennae and video monitor. A bistaticantenna describes a radar system with two antennae, one totransmit and the other to receive. An antenna that both transmitsand receives is defined as a monostatic antenna. There areadvantages and disadvantages of each antenna type for a givenapplication; however, for concrete evaluation studies, monostaticantennae are typically more advantageous due to higher datacollection and processing efficiency.
GPR is a non-destructive technique that useselectromagnetic (EM) waves to “look” into a material. GPRsystems operate in a similar manner to sonar – i.e. by emitting aseries of brief pulses and estimating distance to objects from thetime it takes to detect reflections. Figure 4.9.2.1 shows aschematic of a GPR system in operation. Transmitting andreceiving antennas are used to emit the EM pulse and detect thereflections.

101
Fig. 4.9.2.1 - Schematic of GPR operation
Reflections occur when the EM wave passes from onematerial into another material with contrasting electricalproperties. The strength of the reflection depends on the electricalcontrast between materials (i.e. a strong contrast produces a strongreflection).
The GPR records the strength of reflections detected fora set duration after each pulse. A plot of this data is called a“trace”. Figure 4.9.2.2 shows a typical trace and illustrates howthe EM reflections correspond to the material boundaries.

102
Fig. 4.9.2.2-GPR “Trace” and corresponding material boundaries
As the EM waves travel very quickly, the time duration theGPR ‘listens’ for after each pulse is very brief. The trace signal isusually plotted against a time scale measured in nanoseconds.(i.e. billionths of a second).
GPR systems generate a rapid succession of traces,which are displayed as a “radargram”. A radargram is simply adisplay of one trace after another with the intensity of the reflectedsignal represented by different colours or shades of grey. Figure4.9.2.3 shows an unprocessed radargram of the end of a girdershown with a grey scale palette.

103
Fig.4.9.2.3-Unprocessed Radargram
In figure 4.9.2.3 the black line near the top is the nearside of the girder and the far side of the girder is around 9ns(somewhat difficult to see). The location of an internal feature hasbeen highlighted. The white squares near the top are markers thatwere entered at metre intervals.
The depth to the feature can be estimated as follows:D=Vr tr /2 Eqn. (1)
2
Where Vr = Velocity of the EM wavetr = time to detect reflectiond = depth to feature
The velocity (Vr ) of the EM wave is dependant on thematerial properties, but is fairly constant in sound timber. As thethickness of the girder is known from site observation, the averagevelocity can be calculated from the time it takes for the signal toreflect from the far side of the girder.
The appearance of the radargram can often be improvedby signal processing of the raw data. Figure 4.9.2.4 shows thesame radargram shown in Figure 4.9.2.3 after basic signal pro-cessing, including corrections for distance along the girder, zerodepth and with the depth scale shown.

104
Fig.4.9.2.4-Processed radargram
After signal processing it is now easier to see the far sideof the girder, which was previously obscured because of signalartifacts.
4.9.3 Performance and Other Considerations:
GPR surveys, signal processing and interpretation of theresults should be undertaken by personnel experience in usingthese techniques. Poorly configured systems will lead to poor results.
Interpretation of the results is often an involved process.Successful interpretation requires a good understanding of theunderlying principles and limitations of these techniques.
GPR is suitable for investigating relatively non-conductivematerials such as concrete, timber and road pavements. It is notsuitable for investigating materials with high conductivities suchas metals, or materials with high moisture contents.
As GPR uses very weak non-ionising radiation there areno particular safety issues for site personnel (i.e. similar but muchweaker than a mobile phone)

105
4.9.4 Bridge Decks:
On bridge decks, various issues can be addressed withthe help of GPR. Some examples are asphalt pavementthickness, concrete cover of re-bar, position of pre-stressing-ten-dons or tendon ducts and bridge deck deterioration.
4.9.5 Concrete Cover Assessment Technique for New Bridge Decks:
A procedure for analyzing ground penetrating radar (GPR)data to accurately locate and determine the depth ofreinforcement bars (REBAR) in new concrete bridge decks. Thistechnique involves collecting GPR data with a ground coupledantenna attached to a distance encoder. The GPR data issubsequently transferred to a processing computer. Onecalibration core is then drilling to a rebar located along the datacollection profiles line and the depth of the top of the rebar withrespect to the concrete surface is recorded. The location and depthof the rebar in the calibration hole are entered into a dataprocessing program which performs the following:
(1) Locates the horizontal position of all the rebar with respect tothe start of the profile line.
(2) Calculates the depth of the top of each rebar using the cali-bration core information.
4.9.6 Conclusions:
GPR provides an efficient and versatile means for con-crete evaluation studies. Ideal electrical properties of concrete makeexploratory studies using GPR extremely efficacious. Data col-lection and on-site cursory analysis are increasingly becomingeasier with recent hardware improvements. More importantly,readily available GPR software has improved significantly, in par-ticular for the concrete evaluation usage. Significant research anddevelopment has recently been applied to the determination ofdensity and water content of each layer using GPR (Lytton, 1995).This is an added benefit for concrete evaluation studies.Three-dimensional modeling of GPR data is relatively new, butrecent software advances using 3D processing and modeling are

106
becoming more feasible and user-friendly. Current concreteevaluation studies involve the identification, qualification and/orquantification of reflected GPR signatures. These GPR signaturesinclude, but may not be limited to, reflection strength, signalpolarity, two-way travel time, signal attenuation and hyperbolicreflection, which is necessary for subsurface feature identificationand/or delineation.
4.9.7 Details of Equipments:
(A) Structure Scan (SIR-3000)SIR 3000 is the newest GPR product from the world leader
in Ground Penetrating Radar. This rugged, high-performance,single-channel radar system provides unrivaled scan rates withlow noise.
• Rugged, compact and lightweight system (Weight 4.1kgincluding Battery, dimension 12.4” x 8.7” x 4.1”)
• Flash Memory data transfer capability,• High resolu tion color monitor,• Easy to use operating system,• Simple single-person operation,
Features:• Inspect floors, decks, slabs, tunnels, and balconies.• Locate rebar, tension cables, conduits, voids, PVC pipes,
and measure slab thickness.• Locate a target depth of 18 inches and more in concrete.• Detect and map the relative concrete condition for rehab
planning.
(B) SIR SYSTEM ANTENNASThe structure Scan Standard system comes with a very
high resolution antenna model 5100 of Central frequency 1500MHz that is specially configured for access to small areas up to adepth range of 0 – 18”.
Built for durability and reliability• Rugged, military-style connectors.• Coated, sealed electronics.

107
• Shielded to eliminate above-ground interference.• All temperature conditions, 20
0C to 50
0C.
• Low resistance, long-life replaceable wear skids.• Rugged, high-density molded cases.• Heavy duty cable.
Physical Properties:• Depth Range 0-0.5m (0-18in),• Dimensions 3.8 x 10 x 16.5 cm,• Weight 1.8 kg (4 lbs),
(C) SOFTWARE
(i) RADAN 6.0 Processing & Interpretation SoftwareIt is Advanced Post Processing Software that works on
Windows-XP and Windows 2000 Professional Program, projectsprocessing which includes 16 million colors, horizontal scaling,distance normalization, surface normalization, static corrections,zero position adjustments, arithmetic functions, range gain, gainrestoration, vertical and spatial filters, predictive deconvolution, 2Dconstant and variable velocity migration, interactive interpretationand structure identification.
Now RADAN for Windows has applications specificadd-on modules with more new features and capabilities. Some ofthem are as below:
(ii) Software 3D Quick Draw Mapping ModuleThis add-on module features 3D presentations of data with
simple manipulations of the entire data “cube” so that it can be“sliced and diced” along various x-y, y-z, or x-z planes.
This module also uses some of the variable velocitymigration capabilities that are featured in the RADAN mainprogram to appropriately “size” point targets that appear like hy-perbolic shapes in the raw data.
By first performing a migration operation, the final 3-D dataset is now ready for linear feature recognition-a capability thatenables the module to assist in identification and display of linear

108
features such as walls or utilities that may be embedded in theearth.
New Features:• Ability to create multi-segmented “pipes”• Remap color transform, contrast and gain in real time• New improved form for easy assembly of 3D survey data
Stretch survey in any direction: X, Y and Z• Movie Mode – Easy control of movie mode in Z, Y or Z direc-
tions. Automatically “slice” through your data for easy targetidentification.
• Simulated Borehole toll
(iii) Structural Identification ModuleThe Structure Identification module is the heart of GSSI?s
Structure Scan systems. This powerful tool allows for easy cre-ation of planview slices to aid in interpretation of Structure Scandata files.
The versatility of this module allows for a broad range ofcivil/structural applications, including structures with different typesof reinforcement. It can also be used to automatically find pointtargets, such as utility crossings or archaeological features withlower frequency antennas.
• Semi-automatic mapping of rebar locations and depths onsimple concrete structures.
• Interactive location mapping of conduits within concretestructures.
• Semi-automatic mapping of deterioration zones withinconcrete structures.
(iv) Bridge Assessment ModuleCapable of identifying rebar and calculating concrete cover
over rebar on new deck structures; performs deterioration-map-ping using GSSI’s patented data analysis method, and is designedso that post-processing and analysis are streamlined specificallyfor bridge deck data. Perfect software for large bridge deck struc-tures with typical two-layer orthogonal grid reinforcement patterns.

109
4.10 Spectral Analysis of Surface Waves for UnknownFoundation:
4.10.1 Introduction: Spectral Analysis of Surface Wave (SASW)method is a NDT method used for determining the depth of un-known foundations in bridges and structures. Earlier this methodwas used to determine the shear wave velocity profileversus depth from ground surface without drilling a boring.Subsequently, SASW tests are useful in determining depth ofunknown foundations of more massive abutments, piers andfooting provided the substructure geometry allows for properaccess. Access for SASW test in term of unknown bridgefoundations means that the foundation is more massive and hasan exposed fairly flat ledge or top surface on which impacts areapplied and a pair of receivers placed. Lately, SASW testing hasbeen adopted for offshore/underwater use.
4.10.2 Principle: This method is based on the principle that foun-dation sub-structure materials have different stress wave veloci-ties (stiffness) than the underline supporting soil and bed blocks,which typically have slower velocities, i.e. they are less stiff thanfoundation material. SASW method measures variation in surfacewave velocity with depth in layered material. The bottom depths ofexposed substructures or footings are indicated by slower veloci-ties of surface wave travel in underlying soils. The brief descriptionof the method is given in the figure below:

110
The SASW method has unique capabilities tonondestructively determine layer thicknesses and velocity(stiffness) versus depth for soft over stiff over soft layers that othermethods such as Seismic Refraction are not capable of doingunless velocity increases with depth. One advantage of the SASWmethod for investigation unknown foundation depths of bridges isthat measurements are performed using a source and tworeceivers which can be placed on top of a horizontal surface suchas the exposed surface of an abutment.
4.10.3 Process & Method: A source and two receivers placed in aline on surface such that distance from Source to first receivers(d1) is equal to distance between two receivers. Testing is per-formed by impacting the surface and recording the passage ofpredominant Rayleigh (surface) wave energy past the tworeceivers.
A series of receiver spacing is used and testing isperformed in forward & reverse directions at each receiversspacing.
Surface A dynamic Signal analyzer is used to captureand process receiver outputs. Time domain outputs are thentransformed to the frequency domain using a Fast FourierTransform. This is used to calculate cross power spectrumbetween two receivers. The surface wave velocity and wavelength

111
associated with each frequency are then calculated and plot ofsurface wave velocity versus wavelength, called dispersion curve,is prepared. Wave velocity is calculated from phase plots (for onereceiver spacing).
By dispersion curve, shear wave velocity profile ofstructure or soil being tested can be obtained by process calledforward modeling. A Computer programming for forward modelinghas been developed. A good match obtained betweenexperimental and theoretical dispersion curves, assumed profileis considered to be a good representation of actual profile.Accuracies of velocity profiles and layer thickness vary withvariability of pavement/soil/bedrock or other layers being tested,but theoretically modeled values are typically accurate to within10-15% of actual values.
4.10.4 Applications:
The SASW tests has applications for unknownfoundation depth determination where flat, wide structure accessis available for geometry determination of abutment wall thicknessand exposed footings/pilecaps, for determining substructurematerial properties v.s. depth, and for measurement of thevariation of stiffness (velocity) of soil and bedrock with depth. Theequipment for SASW method includes hammers from 1-lb to a4-lb hand sledge to a 12-lb sledge hammer (vibrators can also beused), a dynamic signals analyzer, and two seismicaccelerometers (or suitable geophones for greater depths and fortesting of soils).
4.10.5 Capabilities & Uses in Unknown Foundation:
i) This method has been found to be capable ofdetermining depth of shallow abutments, pier walls and other solidsubstructure with a flat surface from which testing can beperformed. Such flat surfaces could be the top of an abutmentbetween girders, a ledge or step, or even the top of exposedfooting or pile cap.

112
ii) It can also be used to determine unknown thickness ofabutments breast walls and wing walls, exposed footing, pile capsetc. and indicate material properties in terms of stiffness (velocity)for substructures and surrounding soils and rock.
iii) SASW method is only NDT method (method withoutdrilling a bore) to provide data on change in stiffness of foundationmaterials with depths.
4.10.6 Limitations:
Main limitation of method is geometric. Flat access isrequired to generate surface wave energy. Maximum foundationdepths that can be determined are estimated to be not much deeperthan longest test horizontal surface on the tested substructure.Substructure must be solid for surface wave energy to travel downthrough it and interact with underlying soil.

113
CHAPTER-5
NON-DESTRUCTIVE TESTING OF STEEL BRIDGES
5.1 Introduction
Flaws and cracks can play havoc with the performance ofstructures and for improving the performance, the timely detectionof these defects is very much necessary. Our present system ofinspection of bridges mainly emphasize on the visual inspectionwhich does not give correct picture of internal structural defects.By using non-destructive testing methods, the structures can beevaluated to a greater degree of accuracy, without damaging them.These methods can be used as quality control measures at thetime of construction of structures as well as tool for detection ofdefect during the service. The biggest advantage of NDT methodsis that these are quick and large no. of structure can be covered toevaluate their in service performance without causing any damageto the structure. In this chapter, only the following methods whichare commonly used for evaluating the steel structures, arediscussed –
(a) Dye Penetrant Inspection ORLiquid Penetrant Inspection
(b) Magnetic Particle Inspection(c) Eddy current testing(d) Radiography testing(e) Ultrasonic testing(f) Complet structral testing(g) Acoustic Emission Techniques
5.2 Dye Penetrant Inspection OR Liquid PenetrantInspection (LPI)
5.2.1 Introduction and History of Penetrant Testing:
Dye penetrant inspection is a method that is used to re-

114
veal surface breaking flaws by bleed out of a colored or fluorescentdye from the flaw. The technique is based on the ability of a liquidto be drawn into a "clean" surface breaking flaw by capillary ac-tion. After a period of time called the "dwell," excess surface pen-etrant is removed and a developer applied. This acts as a"blotter." It draws the penetrant from the flaw to reveal itspresence. Colored (contrast) penetrants require good white lightwhile fluorescent penetrants need to be used in darkenedconditions with an ultraviolet "black light".
The advantage that a dye penetrant inspection offers overan unaided visual inspection is that it makes defects easier to seefor the inspector. There are basically two ways that a penetrantinspection process makes flaws more easily seen. First, LPIproduces a flaw indication that is much larger and easier for theeye to detect than the flaw itself. Many flaws are so small ornarrow that they are undetectable by the unaided eye. Due to thephysical features of the eye, there is a threshold below whichobjects cannot be resolved. This threshold of visual acuity isaround 0.003 inch for a person with 20/20 vision.
The second way that LPI improves the detect ability of aflaw is that it produces a flaw indication with a high level ofcontrast between the indication and the background which alsohelps to make the indication more easily seen. When a visibledye penetrant inspection is performed, the penetrant materialsare formulated using a bright red dye that provides for a high levelof contrast between the white developer that serves as abackground as well as to pull the trapped penetrant from the flaw.When a fluorescent penetrant inspection is performed, thepenetrant materials are formulated to glow brightly and to give offlight at a wavelength that the eye is most sensitive to under dimlighting conditions.
Fig. 5.2.1: Example of different contrasts.

115
5.2.2 Basic Processing of a Dye Penetrant Testing:
1. Surface Preparation: One of the most critical stepsof a dye penetrant inspection is the surface preparation. The sur-face must be free of oil, grease, water, or other contaminants thatmay prevent penetrant from entering flaws. The sample may alsorequire etching if mechanical operations such as machining, sand-ing, or grit blasting have been performed. These and other me-chanical operations can smear the surface of the sample, thusclosing the defects.
2. Penetrant Application: Once the surface has beenthoroughly cleaned and dried, the penetrant material is applied byspraying, brushing, or immersing the parts in a penetrant bath.
Fig. 5.2.2.1: Penetrant application.
3. Penetrant Dwell: The penetrant is left on the surfacefor sufficient time to allow as much penetrant as possible to bedrawn from or to seep into a defect. Penetrant dwell time is thetotal time that the penetrant is in contact with the part surface.Dwell times are usually recommended by the penetrant producersor required by the specification being followed. The times varydepending on the application, penetrant materials used, thematerial, the form of the material being inspected, and the type ofdefect being inspected. Minimum dwell times typically range from5 to 60 minutes. Generally, there is no harm in using a longerpenetrant dwell time as long as the penetrant is not allowed to dry.The ideal dwell time is often determined by experimentation and isoften very specific to a particular application.
4. Excess Penetrant Removal: This is a most delicatepart of the inspection procedure because the excess penetrantmust be removed from the surface of the sample while removing

116
as little penetrant as possible from defects. Depending on thepenetrant system used, this step may involve cleaning with asolvent, direct rinsing with water, or first treated with an emulsifierand then rinsing with water.
Fig. 5.2.2.2: Excess Penetrant Removal.
5. Developer Application: A thin layer of developer isthen applied to the sample to draw penetrant trapped in flaws backto the surface where it will be visible. Developers come in a varietyof forms that may be applied by dusting (dry powdered), dipping,or spraying (wet developers).
Fig. 5.2.2.3: Developer.
6. Indication Development: The developer is allowed tostand on the part surface for a period of time sufficient to permitthe extraction of the trapped penetrant out of any surface flaws.This development time is usually a minimum of 10 minutes andsignificantly longer times may be necessary for tight cracks.
7. Inspection: Inspection is then performed underappropriate lighting to detect indications from any flaws which maybe present.

117
8. Clean Surface: The final step in the process is tothoroughly clean the part surface to remove the developer from theparts that were found to be acceptable.
5.2.3 Common Uses of Dye Penetrant Inspection:
Dye penetrant inspection is one of the most widely usednondestructive evaluation (NDE) methods. Its popularity can beattributed to two main factors, which are its relative ease of useand its flexibility. LPI can be used to inspect almost any materialprovided that its surface is not extremely rough or porous. Materi-als that are commonly inspected using LPI include the following:
* Metals (aluminum, copper, steel, titanium, etc.)* Glass* Many ceramic materials* Rubber* Plastics

118
Dye penetrant inspection is used to inspect for flaws thatbreaks the surface of the sample. Some of these flaws are listedbelow:
• Cracks• Overload and impact fractures• Porosity• Laps Seams• Pin holes in welds• Lack of fusion or braising along the edge of the bond line
As mentioned above, one of the major limitations of apenetrant inspection is that flaws must be open to the surface.
5.2.4 Advantages and Disadvantages of Dye Penetrant Testing:
Like all nondestructive inspection methods, dye penetrantinspection has both advantages and disadvantages. The primaryadvantages and disadvantages when compared to other NDEmethods are summarized below.
Primary Advantages:• The method has high sensitive to small surface discontinuities.• The method has few material limitations, i.e. metallic and
nonmetallic, magnetic and nonmagnetic, and conductive and

119
nonconductive materials may be inspected.• Large areas and large volumes of parts/materials can be in-
spected rapidly and at low cost.• Parts with complex geometric shapes are routinely inspected.• Indications are produced directly on the surface of the part
and constitute a visual representation of the flaw.• Aerosol spray cans make penetrant materials very portable.• Penetrant materials and associated equipment are relatively
inexpensive.
Primary Disadvantages:• Only surface breaking defects can be detected.• Only materials with a relative nonporous surface can be in-
spected.• Precleaning is critical as contaminants can mask defects.• Metal smearing from machining, grinding, and grit or vapor
blasting must be removed prior to LPI.• The inspector must have direct access to the surface being
inspected.• Surface finish and roughness can affect inspection sensitiv-
ity.• Multiple process operations must be performed and controlled.• Post cleaning of acceptable parts or materials is required.• Chemical handling and proper disposal is required.
5.2.5 Dye Penetrant Testing Materials:
The penetrant materials used today are much more so-phisticated than the kerosene and whiting first used by railroadinspectors near the turn of the 20th century. Today's penetrantsare carefully formulated to produce the level of sensitivity desiredby the inspector. To perform well, a penetrant must possess anumber of important characteristics. A penetrant must
• spread easily over the surface of the material being inspectedto provide complete and even coverage.

120
• be drawn into surface breaking defects by capillary action.• remain in the defect but remove easily from the surface of the
part.• remain fluid so it can be drawn back to the surface of the part
through the drying and developing steps.• be highly visible or fluoresce brightly to produce easy to see
indications.• must not be harmful to the material being tested or the in-
spector.Penetrant materials come in two basic types. These typesare listed below:
• Type 1 - Fluorescent Penetrants• Type 2 - Visible Penetrants
Fluorescent penetrants contain a dye or several dyes thatfluoresce when exposed to ultraviolet radiation. Visible penetrantscontain a red dye that provides high contrast against the whitedeveloper background. Fluorescent penetrant systems are moresensitive than visible penetrant systems because the eye is drawnto the glow of the fluorescing indication. However, visible penetrantsdo not require a darkened area and an ultraviolet light in order tomake an inspection. Visible penetrants are also less vulnerable tocontamination from things such as cleaning fluid that can signifi-cantly reduce the strength of a fluorescent indication.

121
Fig. 5.2.5: Inspection under ultraviolet light.
Penetrants are then classified by the method used toremove the excess penetrant from the part. The four methods arelisted below:
• Method A - Water Washable
• Method B - Post Emulsifiable, Lipophilic
• Method C - Solvent Removable
• Method D - Post Emulsifiable, Hydrophilic
Water washable (Method A) penetrants can be removedfrom the part by rinsing with water alone. These penetrantscontain some emulsifying agent (detergent) that makes itpossible to wash the penetrant from the part surface with wateralone. Water washable penetrants are sometimes referred to asself-emulsifying systems. Post emulsifiable penetrants come intwo varieties, lipophilic and hydrophilic. In post emulsifiers,lipophilic systems (Method B), the penetrant is oil soluble andinteracts with the oil-based emulsifier to make removal possible.Post emulsifiable, hydrophilic systems (Method D), use anemulsifier that is a water soluble detergent which lifts the excesspenetrant from the surface of the part with a water wash. Solventremovable penetrants (Method C) require the use of a solvent toremove the penetrant from the part.

122
Penetrants are then classified based on the strength ordetectability of the indication that is produced for a number of verysmall and tight fatigue cracks. The five sensitivity levels are shownbelow:
• Level ½ - Ultra Low Sensitivity
• Level 1 - Low Sensitivity
• Level 2 - Medium Sensitivity
• Level 3 - High Sensitivity
• Level 4 - Ultra-High Sensitivity
5.2.6 Penetrants:
The industry and military specification that control thepenetrant materials and their use all stipulate certain physical prop-erties of the penetrant materials that must be met. Some of theserequirements address the safe use of the materials, such as tox-icity, flash point, and corrosiveness, and other requirements ad-dress storage and contamination issues. Still others delineate prop-erties that are thought to be primarily responsible for the perfor-mance or sensitivity of the penetrants. The properties of penetrantmaterials that are controlled by AMS 2644 and MIL-I-25135E in-clude flash point, surface wetting capability, viscosity, contactangle, color, brightness, ultraviolet stability, thermal stability, wa-ter tolerance, and removability.
How some of these properties can affect penetrant test-ing are described next.
Some properties of a penetrant Capillary Action:
Capillary action is the tendency of certain liquids to travelor climb when exposed to small openings. In nature there aremany examples of capillary action. Plants and trees have a net-work similar to capillary tubes that draw water upward supplyingnourishment. The earth brings water to the surface through thecapillary action of the earth's exterior.

123
Dye Penetrant Inspection:
Capillary action is the phenomena that makes dyepenetrant inspection possible. All of the steps that are taken inthe process of conducting a penetrant test, from precleaning throughthe actual evaluation of the results, is done to promote capillaryaction.
Precleaning:
When a part is precleaned, everything is removed that willprevent the penetrant from entering discontinuities and therefore,interfere with capillary action. Once the surface is clean and dry,the penetrant is applied. The penetrant is then drawn into thediscontinuities through capillary action, see figure below.
Fig. 5.2.6.1: Penetrant entering a discontinuitythrough capillary action.
If the part is not clean and dry, less penetrant andpossibly none, will be drawn into the discontinuities. Discontinuitiesthat would have been revealed may be overlooked.
Applying Developer:
Following the removal of the excess penetrant, adeveloper is applied. The developer induces reverse capillaryaction to take place. Penetrant is drawn from the discontinuitiesinto the developer in the same way that the fibers of a paper towelabsorb or blot a liquid, see figure below.

124
Fig. 5.2.6.2: Blotting action of developer drawspenetrant from discontinuity.
Surface Tension:
There are many factors in capillary action; among theseare surface tension, cohesion, wetting ability, adhesion andcontact angle. Each of these factors has a strong influence in theperformance of capillary action. Of these, surface tension is oneof the two most important factors. Water in a pond exhibitssurface tension when it supports the weight of an insect - a spideror mosquito for example. The insect is supported by a molecularmembrane created by the attraction (cohesiveness) of one watermolecule to another. Each water molecule is attracted laterallyand vertically (above and below) to adjacent molecules. Themolecules on the surface are attracted only laterally and belowbecause of the absence of molecules above them. This change inattraction between surface molecules creates the effect of astretched membrane on the surface of the water strong enough tosupport small objects. Water has high surface tension because ofthe strong cohesive attraction between the molecules of water.The amount of surface tension will vary between different liquidsdepending upon how cohesive the molecules are.
Wetting Ability and Contact Angle:
The second most important factor in capillary action iswetting ability. How well a liquid wets the surface of a specimen isreferred to as its wetting ability. The wetting ability of a liquid isdetermined by the contact angle produced when a liquid meets a

125
surface. The cohesive force that determines surface tension com-petes with the adhesive properties of a liquid producing a specificdegree of contact angle.
Adhesion:
Adhesion is how strongly the molecules of a liquid areattracted to a particular surface. If a capillary tube is placed in abeaker of water, the water will rise in the tube to a level higher thanthe water surrounding the tube. The water climbs in the tube be-cause the molecules of water are more strongly attracted to theinside surface of the tube than they are to each other. The stron-ger the attraction between the molecules of a liquid and a surface,the smaller will be the contact angle and the higher a liquid willrise in a capillary tube.
5.2.7 Developers:
The role of the developer is to pull the trapped penetrantmaterial out of defects and to spread the developer out on thesurface of the part so it can be seen by an inspector. The finedeveloper particles both reflect and refract the incident ultravioletlight, allowing more of it to interact with the penetrant, causingmore efficient fluorescence. The developer also allows more lightto be emitted through the same mechanism. This is whyindications are brighter than the penetrant itself under UV light.Another function that some developers performs is to create awhite background so there is a greater degree of contrast betweenthe indication and the surrounding background.
5.2.8 Use and Selection of a Developer:
The use of developer is almost always recommended. Onestudy reported that the output from a fluorescent penetrant couldbe multiplied by up to seven times when a suitable powderdeveloper was used. Another study showed that the use ofdeveloper can have a dramatic effect on the probability ofdetection (POD) of an inspection. When a Haynes Alloy 188, flatpanel specimen with a low-cycle fatigue crack was inspectedwithout a developer, a 90 % POD was never reached with crack
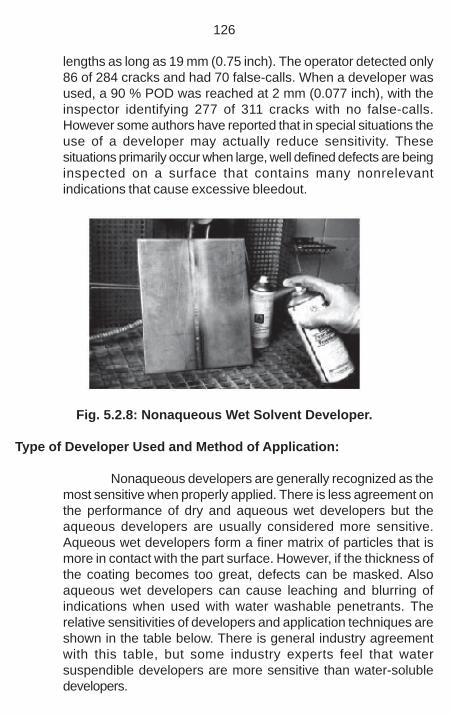
126
lengths as long as 19 mm (0.75 inch). The operator detected only86 of 284 cracks and had 70 false-calls. When a developer wasused, a 90 % POD was reached at 2 mm (0.077 inch), with theinspector identifying 277 of 311 cracks with no false-calls.However some authors have reported that in special situations theuse of a developer may actually reduce sensitivity. Thesesituations primarily occur when large, well defined defects are beinginspected on a surface that contains many nonrelevantindications that cause excessive bleedout.
Fig. 5.2.8: Nonaqueous Wet Solvent Developer.
Type of Developer Used and Method of Application:
Nonaqueous developers are generally recognized as themost sensitive when properly applied. There is less agreement onthe performance of dry and aqueous wet developers but theaqueous developers are usually considered more sensitive.Aqueous wet developers form a finer matrix of particles that ismore in contact with the part surface. However, if the thickness ofthe coating becomes too great, defects can be masked. Alsoaqueous wet developers can cause leaching and blurring ofindications when used with water washable penetrants. Therelative sensitivities of developers and application techniques areshown in the table below. There is general industry agreementwith this table, but some industry experts feel that watersuspendible developers are more sensitive than water-solubledevelopers.

127
Ranking Developer Form Method of Application
1 Nonaqueous Wet Solvent Spray
2 Plastic Film Spray
3 water-soluble Spray
4 Water Suspendible Spray
5 water-soluble Immersion
6 Water Suspendible Immersion
7 Dry Dust Cloud (Electrostatic)
8 Dry Fluidized Bed
9 Dry Dust Cloud (Air Agitation)
10 Dry Immersion (Dip)
Sensitivity Ranking (highest to lowest) Developer Form Applica-tion Technique.
5.3 Magnetic Particle Inspection (MPI)
Magnetic particle inspection is a NDT method used fordefect detection in steel structures. This is a fast and relativelyeasy method to apply in field. MPI uses magnetic fields and smallmagnetic particles, such as iron fillings to detect flaws incomponents. The component being inspected must be made of aferromagnetic particle such as iron, nickle, cobalt or some of theiralloys. Ferromagnetic materials are materials that can be magneticto a level that will allow the inspection to be effective.
The method may be used effectively for inspection of steelgirders and other bridge parts made of steel.
5.3.1 Principle
When ferromagnetic material or component (weld) ismagnetized, magnetic discontinuities that lie in direction approx.perpendicular to the field direction, will result in formation of a
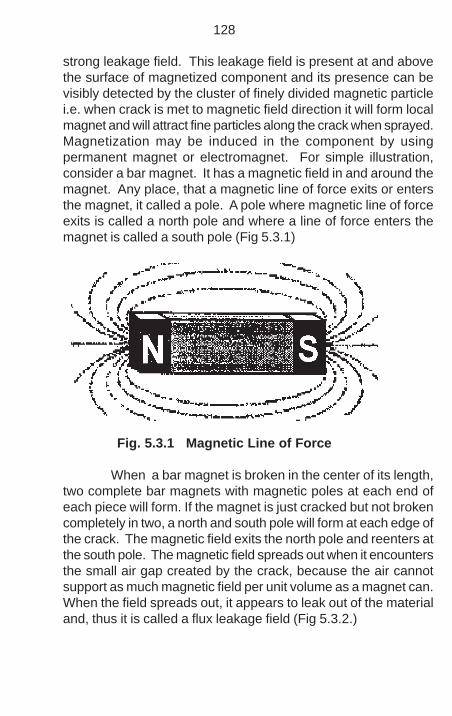
128
strong leakage field. This leakage field is present at and abovethe surface of magnetized component and its presence can bevisibly detected by the cluster of finely divided magnetic particlei.e. when crack is met to magnetic field direction it will form localmagnet and will attract fine particles along the crack when sprayed.Magnetization may be induced in the component by usingpermanent magnet or electromagnet. For simple illustration,consider a bar magnet. It has a magnetic field in and around themagnet. Any place, that a magnetic line of force exits or entersthe magnet, it called a pole. A pole where magnetic line of forceexits is called a north pole and where a line of force enters themagnet is called a south pole (Fig 5.3.1)
Fig. 5.3.1 Magnetic Line of Force
When a bar magnet is broken in the center of its length,two complete bar magnets with magnetic poles at each end ofeach piece will form. If the magnet is just cracked but not brokencompletely in two, a north and south pole will form at each edge ofthe crack. The magnetic field exits the north pole and reenters atthe south pole. The magnetic field spreads out when it encountersthe small air gap created by the crack, because the air cannotsupport as much magnetic field per unit volume as a magnet can.When the field spreads out, it appears to leak out of the materialand, thus it is called a flux leakage field (Fig 5.3.2.)

129
Fig. 5.3.2 Magnetic flux leakage field
If iron particles are sprinkled on a cracked magnet, theparticles will be attracted to and cluster will be formed not only atthe ends of the magnet (poles) but also at poles formed at theedges of the cracks. This formation cluster of particles along theedges of the cracks can be easily detected. (fig. 5.3.3)
Fig. 5.3.3 Formation of cluster of particles
The direction of magnetic field in an electro magnetic circuitis controlled by the direction of current flow. The effectiveness ofthe defect indication will depend on the orientation of the flaw tothe induced magnetic field and greatest when defect isperpendicular. Hence to detect a defect in a member/weld, it hasto be tested in both axis i.e. xx-axis as well as yy-axis.

130
5.3.2 Equipments and Methodology
For proper inspection of a component, it is important toestablish a magnetic field in at least two directions, so that defectslies in the different directions can be detected. For establishingmagnetic field in component various types of equipments areavailable which are discussed below –
(a) Permanent magnets – The primary types of permanentmagnets are bar magnets and horseshoes (yoke)magnets. These are very strong magnets and difficult tohandle in the field because large force is required to removethem from the component being inspected. Normally theseare used for underwater inspection and for the explosiveenvironment, where electromagnets cannot be used.
(b) Electromagnets – These type of magnets are most widelyused in the MPI equipments. In this equipment, electricalcurrent is used to produce the magnetic field. Anelectromagnetic yoke is a very common piece of equipmentwhich is made by wrapping an electrical coil around apiece of soft ferromagnetic steel. A switch is included inthe electrical circuit so that current as well as magneticfield can be turn on and off. This type of magnet generatesa very strong magnetic field in a local area where the polesof magnet touch the part to be inspected.
(c) Prods – These are hand held electrodes that are pressedagainst the surface of the component being inspected tomake contact for passing electrical current through steel.The current passing between the prods creates a circularmagnetic field around the prods that can be used formagnetic particle inspection. Prods are made from copperand have an insulated handle. One of the prods have atrigger switch so that the current can be quickly and easilyturned on and off. Sometimes the two prods are connectedby any insulator to facilitate one hand operation. This isknown as dual prod also and generally used for weldinspection.

131
(d) Portable coils and conductive cables – These are used toestablish a longitudinal magnetic field within a component,when a preformed coil is used, the component is placedagainst the inside surface on the coil.
All the above said equipments are portable equipments and canbe used in the field without any handling problems.
Following methodology to be followed whileperforming the test in the field –
(1) The surface should be cleaned before inspection.The surface must be free of grease, oil or othermoisture.
(2) Apply the magnetizing force using permanentmagnets, a electromagnetic yoke, prods, a coilor other means to establish the necessarymagnetic flux.
(3) Dust on the light layer of magnetic particles withthe magnetizing force still applied, remove theexcess powder from the surface with few gentlepuf of dry air.
If wet suspension is used, then the suspensionis gently sprayed or flowed over the surface to betested. Immediately after the application of wetsuspension the magnetizing force should beapplied.
(4) After this the area should be inspected carefullyfor finding out the cluster of particles. Surfacediscontinuities will produce a sharp indication.
5.3.3 Magnetic Particles:
(1) As mentioned previously, the particles that are usedfor magnetic particle inspection are a key ingredient as they formthe indications that alert the inspector to defects. Particles start
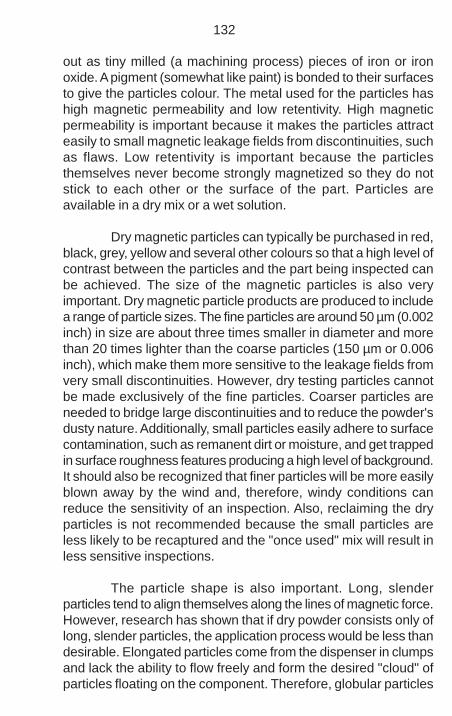
132
out as tiny milled (a machining process) pieces of iron or ironoxide. A pigment (somewhat like paint) is bonded to their surfacesto give the particles colour. The metal used for the particles hashigh magnetic permeability and low retentivity. High magneticpermeability is important because it makes the particles attracteasily to small magnetic leakage fields from discontinuities, suchas flaws. Low retentivity is important because the particlesthemselves never become strongly magnetized so they do notstick to each other or the surface of the part. Particles areavailable in a dry mix or a wet solution.
Dry magnetic particles can typically be purchased in red,black, grey, yellow and several other colours so that a high level ofcontrast between the particles and the part being inspected canbe achieved. The size of the magnetic particles is also veryimportant. Dry magnetic particle products are produced to includea range of particle sizes. The fine particles are around 50 µm (0.002inch) in size are about three times smaller in diameter and morethan 20 times lighter than the coarse particles (150 µm or 0.006inch), which make them more sensitive to the leakage fields fromvery small discontinuities. However, dry testing particles cannotbe made exclusively of the fine particles. Coarser particles areneeded to bridge large discontinuities and to reduce the powder'sdusty nature. Additionally, small particles easily adhere to surfacecontamination, such as remanent dirt or moisture, and get trappedin surface roughness features producing a high level of background.It should also be recognized that finer particles will be more easilyblown away by the wind and, therefore, windy conditions canreduce the sensitivity of an inspection. Also, reclaiming the dryparticles is not recommended because the small particles areless likely to be recaptured and the "once used" mix will result inless sensitive inspections.
The particle shape is also important. Long, slenderparticles tend to align themselves along the lines of magnetic force.However, research has shown that if dry powder consists only oflong, slender particles, the application process would be less thandesirable. Elongated particles come from the dispenser in clumpsand lack the ability to flow freely and form the desired "cloud" ofparticles floating on the component. Therefore, globular particles

133
are added that are shorter. The mix of globular and elongated par-ticles results in a dry powder that flows well and maintains goodsensitivity. Most dry particle mixes have particle with L/D ratiosbetween one and two.
Wet Magnetic Particles:
Magnetic particles are also supplied in a wet suspensionsuch as water or oil. The wet magnetic particle testing method isgenerally more sensitive than the dry because the suspensionprovides the particles with more mobility and makes it possible forsmaller particles to be used since dust and adherence to surfacecontamination is reduced or eliminated. The wet method alsomakes it easy to apply the particles uniformly to a relatively largearea.
Wet method magnetic particles products differ from drypowder products in a number of ways. One way is that both visibleand fluorescent particles are available. Most nonfluorescent par-ticles are ferromagnetic iron oxides, which are either black or brownin colour. Fluorescent particles are coated with pigments that fluo-resce when exposed to ultraviolet light. Particles that fluorescegreen-yellow are most common to take advantage of the peakcolour sensitivity of the eye but other fluorescent colours are alsoavailable. (For more information on the colour sensitivity of theeye, see the penetrant inspection material.)

134
The particles used with the wet method are smaller insize than those used in the dry method for the reasons mentionedabove. The particles are typically 10 µm (0.0004 inch) and smallerand the synthetic iron oxides have particle diameters around 0.1µm (0.000004 inch). This very small size is a result of the processused to form the particles and is not particularly desirable, as theparticles are almost too fine to settle out of suspension. However,due to their slight residual magnetism, the oxide particles arepresent mostly in clusters that settle out of suspension muchfaster than the individual particles. This makes it possible to seeand measure the concentration of the particles for process controlpurposes. Wet particles are also a mix of long slender andglobular particles.
The carrier solutions can be water- or oil-based.Water-based carriers form quicker indications, are generally lessexpensive, present little or no fire hazard, give off nopetrochemical fumes, and are easier to clean from the part.Water-based solutions are usually formulated with a corrosioninhibitor to offer some corrosion protection. However, oil-basedcarrier solutions offer superior corrosion and hydrogenembrittlement protection to those materials that are prone toattack by these mechanisms.
5.3.4 Suspension Liquids:
Suspension liquids used in the wet magnetic particleinspection method can be either a well refined light petroleumdistillate or water containing additives. Petroleumbased liquids arethe most desirable carriers because they provided good wetting ofthe surface of metallic parts. However, water-based carriers are
135
used more because of low cost, low fire hazard, and the ability toform indications quicker than solvent-based carriers. Water-basedcarriers must contain wetting agents to disrupt surface films of oilthat may exist on the part and to aid in the dispersion of magneticparticles in the carrier. The wetting agents create foaming as thesolution is moved about, so anti-foaming agents must be added.Also, since water promotes corrosion in ferrous materials, corro-sion inhibitors are usually added as well.
Petroleum based carriers are primarily used in systemswhere maintaining the proper particle concentration is a concern.The petroleum based carriers require less maintenance becausethey evaporate at a slower rate than the water-based carriers.Therefore, petroleum based carriers might be a better choice for asystem that only gets occasional use and adjusting the carriervolume with each use is undesirable. Modern solvent carriers arespecifically designed with properties that have flash points above200 degrees F and keep nocuous vapours low. Petroleum carriersare required to meet certain specifications such as AMS 2641.
5.3.5 Testing Practices:
Dry Particle Inspection:
In this magnetic particle testing technique, dry particlesare dusted onto the surface of the test object as the item ismagnetized. Dry particle inspection is well suited for theinspections conducted on rough surfaces. When anelectromagnetic yoke is used, the AC or half wave DC currentcreates a pulsating magnetic field that provides mobility to thepowder. The primary applications for dry powders are ungroundedwelds and rough as-cast surfaces.
Dry particle inspection is also used to detect shallowsubsurface cracks. Dry particles with half wave DC is the bestapproach when inspecting for lack-of-root penetration in welds ofthin materials. Half wave DC with prods and dry particles iscommonly used when inspecting large castings for hot tears andcracks.

136
Steps in performing an inspection using dry particles:
Prepare the part surface:- The surface should be relativelyclean but this is not as critical as it is with liquid penetrantinspection. The surface must be free of grease, oil or othermoisture that could keep particles from moving freely. A thin layerof paint, rust or scale will reduce test sensitivity but cansometimes be left in place with adequate results. Specificationsoften allow up to 0.003 inch (0.076 mm) of a nonconductivecoating (such as paint) and 0.001 inch max (0.025 mm) of aferromagnetic coating (such as nickel) to be left on the surface.Any loose dirt, paint, rust or scale must be removed.
Apply the magnetizing force: Use permanent magnets,an electromagnetic yoke, prods, a coil or other means toestablish the necessary magnetic flux.
Dust on the dry magnetic particles: Dust on a light layerof magnetic particles.
Gently blow off the excess powder: With the magnetizingforce still applied, remove the excess powder from the surface

137
with a few gently puffs of dry air. The force of the air needs to bestrong enough to remove the excess particle but not strong enoughto dislodge particle held by a magnetic flux leakage field.
Terminate the magnetizing force: If the magnetic flux isbeing generated with an electromagnet or an electromagnetic field,the magnetizing force should be terminated. If permanent mag-nets are being used, they can be left in place.
Inspect for indications: Look for areas where the mag-netic particles are clustered.
Wet Suspension Inspection:
Wet suspension magnetic particle inspection, or morecommonly wet magnetic particle inspection, involves applying theparticles while they are suspended in a liquid carrier. Wetmagnetic particle inspection is most commonly performed usinga stationary, wet, horizontal inspection unit but suspensions arealso available in spray cans for use with an electromagnetic yoke.A wet inspection has several advantages over a dry inspection.First, all the surfaces of the component can be quickly and easilycovered with a relatively uniform layer of particles. Second, theliquid carrier provides mobility to the particles for an extended pe-riod of time, which allows enough particles to float to small leak-age fields to form a visible indication. Therefore, wet inspection isconsidered best for detecting very small discontinuities on smoothsurfaces. On rough surfaces, however, the particles (which aremuch smaller in wet suspensions) can settle in the surfacevalleys and loose mobility rendering them less effective than drypowders under these conditions.

138
Steps in performing an inspection using wet suspensions:
Prepare the part surface: Just as is required with dry par-ticle inspections, the surface should be relatively clean. The sur-face must be free of grease, oil and other moisture that couldprevent the suspension from wetting the surface and preventingthe particles from moving freely. A thin layer of paint, rust or scalewill reduce test sensitivity, but can sometimes be left in place withadequate results. Specifications often allow up to 0.003 inch (0.076mm) of a nonconductive coating (such as paint) and 0.001 inchmax (0.025 mm) of a ferromagnetic coating (such as nickel) to beleft on the surface. Any loose dirt, paint, rust or scale must beremoved.
Apply the suspension: The suspension is gently sprayedor flowed over the surface of the part. Usually, the stream ofsuspension is diverted from the part just before the magnetizingfield is applied.
Apply the magnetizing force: The magnetizing force shouldbe applied immediately after applying the suspension of magneticparticles. When using a wet horizontal inspection unit, the currentis applied in two or three short busts (1/2 second) which helps toimprove particle mobility.
Inspect for indications: Look for areas where the mag-netic particles are clustered. Surface discontinuities will produce
139
a sharp indication. The indications from subsurface flaws will beless defined and loose definition as depth increases.
5.4 Eddy Current Testing:
5.4.1 Introduction:
The most basic eddy current testing instrument consistsof an alternating current source, a coil of wire connected to thissource, and a voltmoter to measure the voltage change across thecoil. An ammeter could also be used to measure the current changein the circuit instead of using the voltmeter.
Eddy current equipment can be used for a variety ofapplications such as detection of cracks (discontinuity),measurement of metal thickness, detection of metal thining dueto corrosion and erosion, determination of coating thickness andthe measurement of electrical conductivity and magneticpermeability.
For inspection of bridge girder, this technique can be usedfor detection of surface breaking cracks. This is an excellent methodfor detecting surface and near surface defects when the probabledefect location and orientation is well known. Defects such ascracks are detected when they disrupt the path of eddy currentand weaken their strength.
5.4.2 Principal:
This is one of the several NDT methods that use theprinciple of electromagnetism as the basis for conducting the test.Eddy currents are created through a process calledelectromagnetic induction. When alternating current is applied tothe conductor, such as copper wire, a magnetic field develops inand around the conductor. This magnetic field expands as thealternating current rises to maximum and collapses as the currentis reduced to zero. If another electrical conductor is brought intothe close proximity to this changing magnetic field, current will beinduced in this second conductor. Eddy current are inducedelectrical currents that flow in a circular path. They get their names
140
from “eddies” that are formed when a liquid or gas flows in acircular path around obstacles.
For generating eddy current, a “probe” is used whichconsists of electrical conductor formed into a coil and housedinside the probe. These probes are available in a large varietyshapes and sizes. In fact, one of the major advantages of eddycurrent inspection is that probes can be custom designed for awide variety of applications. Eddy current probes are classified bythe configurations and mode of operation of the test coils. Theconfiguration of probes generally refers to the way the coil or coilsare placed with reference to test area. An example of differentconfiguration of probes would be bobbin probes, which are insertedinto a piece of pipe to inspect from inside out. While in encirclingprobes, the coil or coils encircle the pipe to inspect from outsidein. The mode of operation refers to the way the coil or coils arewired and interface with the test equipment. The mode ofoperation of a probe generally falls into one of four categories,absolute, differential, reflection and hybrid. Normally differentialprobes are used for flaw detection in steel members.

141

142
5.4.3 Technical Specification:
The technical specification of eddy current instrument, which RDSOhas procured, is divided in 4 categories -
(i) Basic Performance.
(ii) Inputs/ Outputs
(iii) Additional Features
(iv) General.
(i) Basic Performance.
Frequency Range 100 Hz –12 MHz
Gain 0 – 90.0 dB
Sensitivity Adjustable to 200 Volts per ohm.
Flaw Response 0 – 2000 Hz nominal
Digitizing Rate 6000 samples/ see (max.)
Rotation variable 00 – 3600 in 10 steps
Sweep Variable 0.005 – 4 seconds/ division
Low Pass Filter 10 Hz – 500 Hz with 1 Hz increments,500 Hz – 2000 Hz in 50 Hz increments,WB setting of 4 kHz. Greater than 4 poleresponse.
High Pass Filter 0 (dc), 2, 4, 6, 8 and 10 –500 Hz in1 Hz increments. Two pole response avail-able in frequency 1 only.
Prove Drive Adjustable in 3 steps (low, mid, high)corresponding to 2, 6 and 12v peak topeak into 75 ohms, + 0.5v.
Null Three stage digital null.
Variable persistence Screen persistence varies 0.1 – 5 sec-onds in 0.1 steps. Operator may select

143
periodic screen erase atintervals of up to 1 minute. Basic storedscreen time is infinite with manual erase.
Probe Types Absolute and differential in either bridgeor reflection Configuration, I.D., O.D., bolthole, sliding and custom special productorders (SPO).
Scanner Drive Drives PS – 5AL, Mini Mite, Spit fire 2000or RA 2000 scanners at the followingspeeds.
PS - 5AL – 40 to 240 rpm
MiniMite – 600 to 3000 rpm
Spit fire 2000 – 600 to 3000 rpm
RA 2000 – 600 to 2400 rpm
Alarms Can be set to trigger when signal entersthe alarm area or is outside alarm area.
Alarms Mode Impedance Plane Display 1 – 3 indepen-dent box gates. One polar gate. Seep dis-play – high and low threshold gates.
Waterfall Display 4 – 60 lines with 32 lines max. displaysimultaneously 105 – 210 points/ sweeprecorded. Active with PS - 5AL only.
Conductivity Accuracy + 0.5% IACS accuracy from 0.9% -2%IACS + 1.0% IACS accuracy over 62%Liftoff accuracy from 0 – 15 mil + 1 mil.Conductivity measurements with greaterthan 10 mil of liftoff have recorded accu-racy.
Non-Conductive Coating Measures non conductive coating.
Thickness thickness from 0.00" – 0.025". Accuracy+ 0.001" over 0.00 – 0.015".

144
Trace Storage Stores upto 20 traces for recall. Locationsmay store any combination of frozenscreens or movement of the impedancespot for upto 60 seconds.
Program Storage 120 instrument setup may be stored andrecalled. The date and time of storage arerecorded and available to the operator.Each location may be labeled withalphanumeric names upto 29 characters.The instrument can maintain storage uptoone year with batteries removed (with afunctional internal memory backup bat-tery).
Serial Interface RS232 compatible serial interface,adjustable from 2400 – 57600 baud, with9600 baud default.
Communicates with external computer orserial printer. Instrument parameters ex-cept power ON/OFF can be controlledthrough the serial interface. All programsand stored screenlocations one accessible through this in-terface.
Printout Printout available with optional serialprinter. Additional printers may be com-patible with optional serial toparallel converter. Printout text may becustomized from either the font panel oran external computer.
Supported Printers Cannon Inkjet, Epson compatible, PentaxPocket Jet, Pentax II, Pocket Jet and otherHP-PCL Compatibles.

145
Inputs/ OutputsPower 7 pin connector (2000D), 8-pin connector
(2000D+) to operate from AC power andcharge internal batteries.
RS232C DB9P connector for bidinectional serialdata by way of RS232C links to externalcomputers, terminals or printer.
Outputs DB9F connector provides analog out forvertical and horizontal signals ( + 5V, 10mAmax. 1V per div) on both frequency 1 andfrequency 2 and 5TTL Compatible (3Vlogic) active high alarm output.
Probe Connectors 16 pin LEMO connector with flush mountadapters.
Additional Features
Report Fields User defined 40-character report header,upto 7 user defined 40-character reportfields and 26 character labels, upto 3 userdefined 26 character report entries maybe down load to the RS232 port or en-tered through the report edit function.Clock, calendar time, date stored andprinted with each wave form instrument ID,manufacturer'. name and model printedwith each waveform. International menuselectable languagesincluding English, Spanish, French andGerman.
Conductivity Frequency: 60 kHz or 480 kHz
Probe Type: Conductivity Probe.
Digital conductivity: Digital conductivitydisplay from 0.9% - 110% IACS.
146
Accuracy within + 0.5% IACS from 0.9%- 62% IACS and within + 1.0% of valuesover 62%. Meets or exceeds BAC5651.Conductivity measurements with greaterthan 10 mil of lift off have reduced accu-racy.
Alarms: Independent high and low limitalarms can be set for conductivity lift off.Alarms can be set to trigger when the sig-nals one inside the limits or outside thelimits.
Dual Frequency Second frequency: 100Hz – 3MHz, 2ndfrequency is an exact division of the firstfrequency in rations of 1/2, 1/4 and evendivisors to 1/32
Display: Frequency 1 only, Fequency 2 only, sumof frequencies 1 and 2, difference betweenfrequencies 1 and 2, split screen with se-lected combinations of frequencies 1 and2 and mixed frequencies.
General
Dimensions 9.5" L x 5.5" W x 3.6" D (241mm x 140mm x 92mm)
Weight 2000D : 6lbs (2.7kg) with batteries
2000D+ : 4.6 lbs (2.09 kg) with batteries.(3.6 lbs or 1.6 kg without batteries)
Display (Color LCD) For 2000D +, color LCD, 3.0" x 3.8" (5"diagonal) (76mm x 96mm, 122mm diago-nal), 320H x 240V pixel. 72 Hz refreshrate. Adjustable backlight.
Display (LCD) Monochrome LCD, 3.0" x 3.8" (5" diago-
147
nal) (76mm x 96mm, 122mm diagonal),320H x 240V pixel. 72 Hz refresh rate.Adjustable backlight.
Operating Temperatures - 40F to 140
0F (-20
0C to 60
0C).
Storage temperature - 400F to 1760F (-400C to 800C).
Power DC: Two 10.8V DR35 Ni MH batteries(2000D), one 10.8V Li-Ion battery(2000D+), optional D cell pack or externalDR 35 pack.
AC: External charger/ adapter. Fullycharges batteries in appox 6 hours whichoperating instrument. Line voltage 100 –240V AC, 47-63 Hz.
Operating Time Eight hours (typical) @ 750F (240C) withEL display. Seven hours (typical) with LCDdisplay. Estimated operating time remain-ing indicated by icon on status display.With optional belt mounted battery pack,eight hours (typical).
5.4.4 Methodology:
While performing the inspection with surface probe fol-lowing methodology should be adopted:
(i) Connect the probe with the system. Power Link screen willappear. Rotate the smart knobs to confirm and press enter.The screen will display the information about the probe. Thereare three different types of probes. These are denoted asLOW, MID, HI. The approximate peak to peak voltages foreach are 2, 6 and 12 volts respectively. Mid probe drive isnormally sufficient for most eddy current testing. Now pressthe MAIN key to proceed with test setup.

148
(ii) Adjust the frequency as required. Press the FREQ menu softkey. Rotate the smart knobs for the required frequency until itappears in the frequency box.
(iii) Adjust the phase angle as required. Press the ANGLE menusoft key on the instrument. Rotate the smart knobs until thesame appears in the angle box.
(iv) Adjust the horizontal gain and vertical gain as required. Ifhorizontal gain and vertical gain to be kept same than pressGAIN from the menu. Rotate the smart knobs key until bothreaches to the desired value. If horizontal gain and verticalgain to be kept different than press HGAIN menu soft keyand rotate the smart knobs to the required value. Similarlyselect the VGAIN and adjust the required value.
(v) Place the probe on the specimen to be tested away fromcracks. Press NULL and ERASE keys for positioning of theprobe and to clean the screen.
(vi) Slide the probe on the specimen smoothly.
It has an extensive selection of data storage capabilities. Datamay be stored using one of three different methods and oncestored, the information and instrument setups may be ac-cessed.
Data may be stored as either frozen data, captured data andwaterfall data.
Frozen data captured an image as if is displayed on the screen,frozen at that instant of time.
Captured data saves data for a period of time 2.5 to 60 sec-onds and can be replay this data back to screen, completewith alarms.
The captured data may be recorded using one of two modes.
149
(a) Capture once starts recording the capture as soon as opera-tion is selected and will automatically end when the selectedtime has been reached.
(b) Capture continuous stops recording data when the operationis ended and automatically stores the preceding data for theallotted time period. This capture is ended manually by press-ing the ENTER key. When the continuous capture is endedthe information stored is the information that was being re-corded at the end of the capture .
Waterfall data is data captured from a waterfall (multiplesweep) display using a PS-5AL scanner. It is the only data thatcan be modified after it is captured. All methods of saving willrecord the current data and time of storage.
Scan the probe over part of the surface in a pattern thatwill provide complete coverage of the area being inspected. Caremust be taken to maintain the same probe to surface orientationas probe wobble can affect interpretation of the signal.
5.4.5 Advantages and Limitations:
This method is very sensitive to small cracks and otherdefects. This method detects surface and near surface defectsvery efficiently. The results can be obtained immediately afterinspection. The equipment required for test is very small andportable and minimum part preparation is required for carrying outthis test. During the test, the test probe does not need to contactthe part.
One of the major limitation is that the depth forpenetration is limited so it cannot detect the internal defects whichare located away from the surface. The surface to be tested mustbe accessible to the probe. Flaws such as delamination that lieparallel to the probe coil winding and probe scan direction cannotbe detected easily.

150
5.5 Radiographic Testing
This is the technique of obtaining a shadow image of asolid using penetrating radiation such as X-rays or gamma rays.These rays are used to produce a shadow image of an object onfilm. Thus if X-ray or gamma ray source is placed on one side of aspecimen and a photographic film on the other side, an image isobtained on the film which is in projection, with no details of depthwithin the solid. Images recorded on the films are also known asradiographs.
The contrast in a radiograph is due to different degrees ofabsorption of X-rays in the specimen and depends on variations inspecimen thickness, different chemical constituents, non-uniformdensities, flaws, discontinuities, or to scattering processes withinthe specimen.
Some of the other closely related methods are Tomogra-phy, Radioscopy, Xerography etc.
5.5.1 Methodology
First step of the method is to examine carefully thespecimen and to decide on the direction to examine the objectconsidering the probable orientation of defects and the thicknessof the specimen in relation to the diverging beam of X-rays.
Considering the thickness of object, density of the materialetc., the wavelength of X-ray to be used should be decided.
The images can be observed on an image intensifyingtube with remote viewing or recorded on film with or withoutintensifying screens. Grid or blocking materials should be usedto reduce scattering effects. The optimum time of exposure needto be determined by experimental trials.
The last but the most important step is the interpretationof radiograph. Radiographs are projections, providing no informationabout depth within the specimen. While interpreting following factorsnormally should be considered –

151
(a) Orientation of the object to permit any discontinuity ordefect to show maximum contrast.
(b) Use of radiation so that to have largest possible differ-ences in the relative absorption coefficients of the differ-ent compositions present.
(c) The selection of wavelength of X-ray to control sharpnessand contrast of the image.
(d) Use of well illuminated viewing screen under optimum light-ing conditions.
(e) Probable defects in the specimen.(f) The X-ray target to film distance should not be less than
10 x the thickness of specimen.(g) The greatest dimension of the suspected flaw should be
parallel to X-ray beam.
5.5.2 Advantages & Limitations
For conducting this test access to opposite side of theobject is required. X-rays and gamma-rays are dangerous and lotof safety precautions to be taken while conducting the test. Adiscontinuity of thickness less than 2% of the overall thickness ofthe specimen is difficult to observe. This method is relativelyexpansive method. Normally this method is used for detectinginternal flaws in the welds especially butt welds.
5.6 Ultrasonic Inspection:
This method can be used for steel structures.
5.6.1 Definition of Ultrasound:
Mechanical vibrations of different kinds can travel throughsolids due to their elastic properties. A good example is a spring,which is tightened at one end. The other end is able to expand upand down. If it makes enough oscillations per second, you will beable to hear a sound. This is due to the fact that the air also startsvibrating as compression waves. The human ear can hear thesecompression waves, if the frequency is higher than the lowestaudible range, which is about 20 oscillations/sec (Hz).

152
The faster the spring oscillates the higher the sound. Overa certain number of oscillations, we are not able to hear anything.We have then reached the upper audible level, which is about20000 oscillations per second (Hz).
Sound waves with a frequency higher than 20kHz are calledultrasound waves.
After changing to the use of ultrasound the methodbecame useful in a greater scale. Ultrasonic waves gives due totheir higher frequency and smaller wave length a much betterpossibility of finding defects and determine their size and theirposition. The vibrations are normally generated by the use of apiezoelectric crystal, which can be excited by an electrical pulse.
We are going through the two most common testmethods, the through transmission technique and the pulse echotechnique.
5.6.2 Through Transmission Technique:
When using this technique you have a transmitter on oneside and a receiver on the other side of the object to be tested.The transmitter sends out ultrasonic waves either as continuousoscillations or as short pulses, each consisting of a fewoscillations. In the last case the pulses are send out with aninterval, which is long compared to the duration of the pulse itself.The wave travels through the object and is then received by thereceiver. The signal from the receiver shows the sound energy,which has travelled from the transmitter to the receiver. If the soundbeam hits a discontinuity in the object, the received sound energywill be less. The signal from the receiver will then be smaller. Thissignal can be registered and used in different ways. For examplethe signal can automatically activate an alarm, if the sound beamhits a defect over a certain size, by which the received soundenergy goes down under an equivalent fixed level.
The signal can also be registered with ordinary ultrasonicequipment, which contains an oscilloscope. It is seen as verticalreflections of the signal on the screen at a distance to the right of

153
the deflection on the left side of the screen. This reflection to theleft is called the initial pulse.
The ultrasonic equipment's way of working will bediscussed later. If there is a defect between the transmitter andthe receiver, it will prevent a larger or smaller part of the soundbeam from reaching the receiver, which will weaken the signal.This is seen on the screen as a smaller deflection as seen onFigure 5.6.2.
Fig. 5.6.2: Principles of through transmission technique.
5.6.3 The Pulse Echo Technique:
This is the most common used technique.
The principle in this technique is almost the same as usedin an echo sounder. A transmitter sends out a short pulseconsisting of a few oscillations into the object to be tested.
The sound wave travels through the object with aconstant speed, the sound velocity, which is always the same inthe same material, regardless of the frequency. If the object iswithout defects, the pulse continues until it hits the back wall ofthe object, from where it is reflected like light beam from a mirror.

154
The pulse then travels back through the object - still with the samevelocity - and is received by a receiver. As the pulse travels with aconstant speed, the time, the sound pulse has travelled from thetransmitter till it returns is equivalent to twice the thickness of theobject. After a while a new pulse is send out, which travels exactlylike the first one.
In order to measure the very short time from sending outone pulse till it is received again, the ultrasonic equipment isprovided with an oscilloscope or a digital display. An electron beammakes a bright spot to travel horizontally across the screen with aconstant velocity from left to right. The movement begins at thesame time as the pulse is send out from the crystal. The initialpulse gives a vertical deflection on the left side of the screen.
After that the bright spot continues to the right with aspeed that can vary from about 1/200 to 5 times the velocity ofsound in steel. See Figure 5.6.3.1.
Fig. 5.6.3.1: Principles of pulse echo technique.
If you adjust the velocity of the bright spot on the screen,to be the same as the sound velocity in the test piece, it will travelto the right on the screen with the same speed as the pulsetravels inside the object. When it returns to the receiver, the brightspot has travelled a distance, which is twice the thickness of thetest piece.

155
The moment the pulse hits the receiver, it sends anelectrical signal to the ultrasonic equipment. On the screen it isseen as a brief, vertical reflection of the bright spot. This is calleda bottom echo. The distance on the screen between the initialpulse and the bottom echo is in this case twice the thickness ofobject.
Changing the speed of the bright spot on the screen, thedistance between the initial pulse and the bottom echo can beadjusted. You can change it in such a way that the thickness ofthe steel object between approximately 2 mm and 10 m can beread off on the screen.
If the sound wave hits a reflecting surface during its waythrough the object for example a crack, a part of the sound willreflect back and will be seen as a vertical reflection before thebottom echo. This deflection is called the defect echo. By its po-sition on the screen the distance from the surface of object can bedetermined quite accurately. The height and shape of the flaw ech-oes might give some information about the size and type of thedefect.
The sending out of a pulse and the movement on the screenis repeated many times a second. The single instant pictures ap-pear on the screen as constantly shining lines, which only moveswhen the probe is moved across the surface of the object. How-ever, there is a distance between the pulses, which allows the firstto die out before a new pulse is send out. In most ultrasonic equip-ment it means that a pulse can move backwards and forwards in a10 m long steel bar, before a new pulse is send out.

156
Figure 5.6.3.2 and Figure 5.6.3.3 show some commonultrasonic equipment.
Fig. 5.6.3.2: USM 35 and EPOCH IV.
Fig. 5.6.3.3:
5.6.4 Probes:
Normal probes:
A normal probe generates longitudinal waves, which leavesthe probe at a right angle to its contact surface. If the probe is incontact with a specimen, the sound wave penetrate into it. Ittravels in straight lines, with a certain beam spread. See Figure5.6.4.1.

157
Fig. 5.6.4.1: Normal probes.
Construction:A normal probe is constructed as shown in Figure 5.6.4.2
below:
Fig. 5.6.4.2: Inside of a Normal probe.
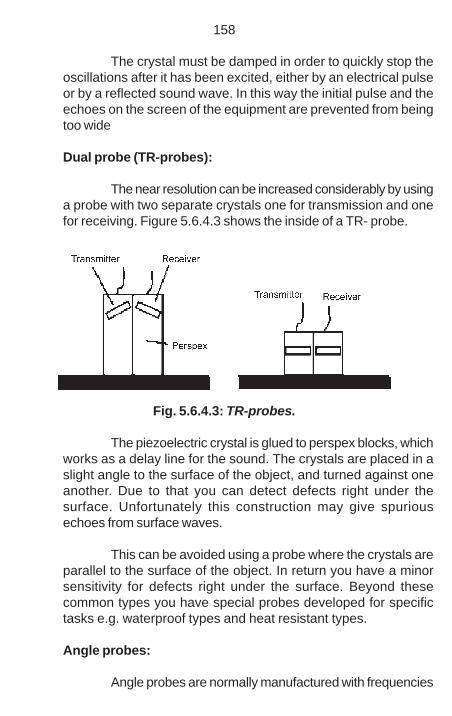
158
The crystal must be damped in order to quickly stop theoscillations after it has been excited, either by an electrical pulseor by a reflected sound wave. In this way the initial pulse and theechoes on the screen of the equipment are prevented from beingtoo wide
Dual probe (TR-probes):
The near resolution can be increased considerably by usinga probe with two separate crystals one for transmission and onefor receiving. Figure 5.6.4.3 shows the inside of a TR- probe.
Fig. 5.6.4.3: TR-probes.
The piezoelectric crystal is glued to perspex blocks, whichworks as a delay line for the sound. The crystals are placed in aslight angle to the surface of the object, and turned against oneanother. Due to that you can detect defects right under thesurface. Unfortunately this construction may give spuriousechoes from surface waves.
This can be avoided using a probe where the crystals areparallel to the surface of the object. In return you have a minorsensitivity for defects right under the surface. Beyond thesecommon types you have special probes developed for specifictasks e.g. waterproof types and heat resistant types.
Angle probes:
Angle probes are normally manufactured with frequencies
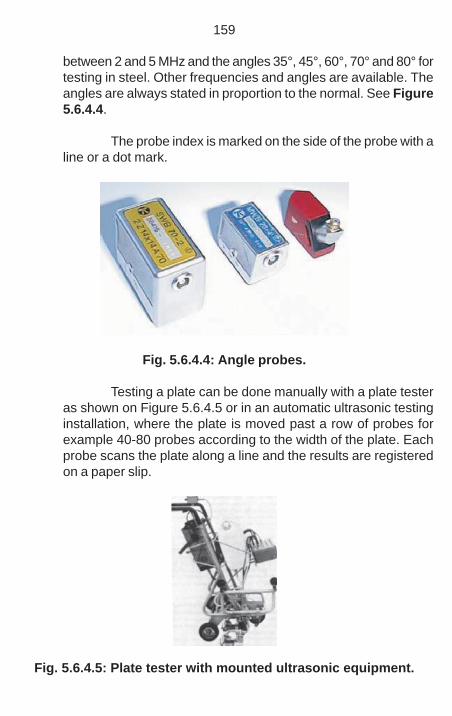
159
between 2 and 5 MHz and the angles 35°, 45°, 60°, 70° and 80° fortesting in steel. Other frequencies and angles are available. Theangles are always stated in proportion to the normal. See Figure5.6.4.4.
The probe index is marked on the side of the probe with aline or a dot mark.
Fig. 5.6.4.4: Angle probes.
Testing a plate can be done manually with a plate testeras shown on Figure 5.6.4.5 or in an automatic ultrasonic testinginstallation, where the plate is moved past a row of probes forexample 40-80 probes according to the width of the plate. Eachprobe scans the plate along a line and the results are registeredon a paper slip.
Fig. 5.6.4.5: Plate tester with mounted ultrasonic equipment.
160
5.6.5 Application of Ultrasonic Testing Method:
This method is not suitable for testing of coarse grainedstructures. Most of the castings cannot be scanned using thismethod because of the coarse grained structure which leads toscattering and attenuation of waves. This method is suitable forscanning of fine grained structure. Rolled sheets and plates aresuitable for ultrasonic testing. Normal probes are used fordetecting laminations and angle probes for fast inspection of platesfor most of the discontinuities except smooth laminations parallelto the surface.
Before starting the test, the equipment should be testedwith a calibration block. The surface to be tested should be smoothand plain. The couplant must be used for testing purpose. Thethickness of couplant layer must be as less as possible. A thicklayer will affect the direction of the ultrasonic beam in the testpiece. For detection of smaller flaws, small diameter high frequencytransducers are used.
5.7 Complete Structreal Testing :Details are given at S. No. 2.12
5.8 Accoustic Emission Techniques :Details are given at S. No. 4.3
161
CHAPTER-6
NON-DESTRUCTIVE TESTING OF MASONRY BRIDGES
6.1 Introduction
As already explained in chapter 1, the use of NDT methodsfor testing of masonry structures is not very common in India.However there is a necessity of adopting suitable NDT methodsfor evaluation of masonry structures as existing system ofinspection is not sufficient to cover all the aspects of inspection.Sometimes very critical defects like, deterioration of masonrymaterials, internal cavities formed due to rat holes etc. and crackingof structures due to overstressing go unnoticed which may provedto be very fatal for the safety of structure. The NDT methods havea large potential to be part of system for inspection and monitoringof structures. This includes quality assurance during and afterconstruction, identification of damages in an early stage and todecide the repair strategy for rehabilitation of the structures. Someof the NDT methods which are used for evaluation and inspectionof masonry structures are listed below –
(a) Flat Jack Testing
(b) Impact Echo Testing
(c) Impulse radar testing
(d) Infrared thermography
(e) Boroscope
6.2 Flat Jack Testing
This test can determine the engineering properties of olderstructures for structural evaluation. This method is used todetermine the in situ stress and compressive strength of masonrystructures.

162
A flat jack is a flexible steel envelope, thin enough to fitwithin a masonry mortar joint. During testing, the flat jack ishydraulically pressurized and applies stress to the surroundingmasonry.
This method directly measures the actual state ofcompressive stress present within the masonry and is useful fordetermining stress gradients present within a masonry wall orcolumn. The in situ stress test works on basic principle of stressrelief, when mortar is removed from a joint, compressive stresswithin the masonry forces the slot thus formed to close by a smallamount. A flat jack is inserted into the slot and pressurized torestore the slot to its original opening dimension. The pressure atwhich the original opening is restored is adjusted by the flat jackcalibration constant, providing a measure of the in situ masonrycompressive stress.
The other test is, in situ deformability test which is usedfor direct measurement of masonry deformability properties and toestimate the masonry compressive strength. For conducting thistest, two parallel flat jacks are used which subject the masonrybetween them to compressive stress. The stress strain curvewhich is obtained during the test, is used for obtaining bothcompressive modulus and an estimate of compressive strength.
6.3 Impact Echo Testing :Details are given at S. No. 4.5.2.
6.4 Impulse Radar Testing :Details are given at S. No. 4.4.
6.5 Infrared Thermography :Details are given at S. No. 4.2.
6.6 Boroscope :Details are given at S. No. 4.7
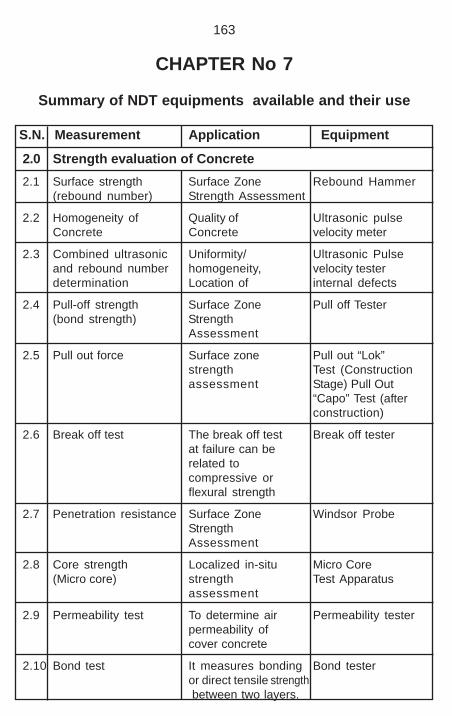
163
CHAPTER No 7
Summary of NDT equipments available and their use
S.N. Measurement Application Equipment
2.0 Strength evaluation of Concrete2.1 Surface strength Surface Zone Rebound Hammer
(rebound number) Strength Assessment
2.2 Homogeneity of Quality of Ultrasonic pulseConcrete Concrete velocity meter
2.3 Combined ultrasonic Uniformity/ Ultrasonic Pulseand rebound number homogeneity, velocity testerdetermination Location of internal defects
2.4 Pull-off strength Surface Zone Pull off Tester(bond strength) Strength
Assessment
2.5 Pull out force Surface zone Pull out “Lok”strength Test (Constructionassessment Stage) Pull Out
“Capo” Test (afterconstruction)
2.6 Break off test The break off test Break off testerat failure can berelated tocompressive orflexural strength
2.7 Penetration resistance Surface Zone Windsor ProbeStrengthAssessment
2.8 Core strength Localized in-situ Micro Core(Micro core) strength Test Apparatus
assessment
2.9 Permeability test To determine air Permeability testerpermeability ofcover concrete
2.10 Bond test It measures bonding Bond testeror direct tensile strength between two layers.

164
2.11 Maturity method It estimate concrete Maturity meters.strength
2.12 Complete Structural To detect damage Complete structuraland general testing equipmentevaluation of techniquestructures
3.0 Corrosion assessment, location and diaof rebar and cover
3.2 Corrosion potential(half-cell) Status of Corrosion Half Cell
activity Potential Meter
3.3 Resistivity Rate of probable Resistivity Metercorrosion
3.4 Carbonation depth Corrosion risk Carbonation Test Kitand cause
3.5 Chloride content Corrosion risk Chloride Field Testand cause System
3.6 Voids and Corrosion Viewing interior Endoscopyof concrete
3.7 Scanning and dia of It is used for Profometerrebar and cover locating rebars,
diameter of rebarsand concrete cover
3.8 Cover and re-bar Corrosion risk Micro Cover Metermeasurement and cause
4.0 Crack measurement, length changes,deflection in, buildings and structures
4.1 Length changes Strain measurement Measurement anddigital strain gauges
4.2 Infra Red Images Cracks, delamination Infra Red ThermalImaging Systems
4.3 Acoustic Emission To measure the Acoustic Emissiontechnique location and activity Detection System
of cracks
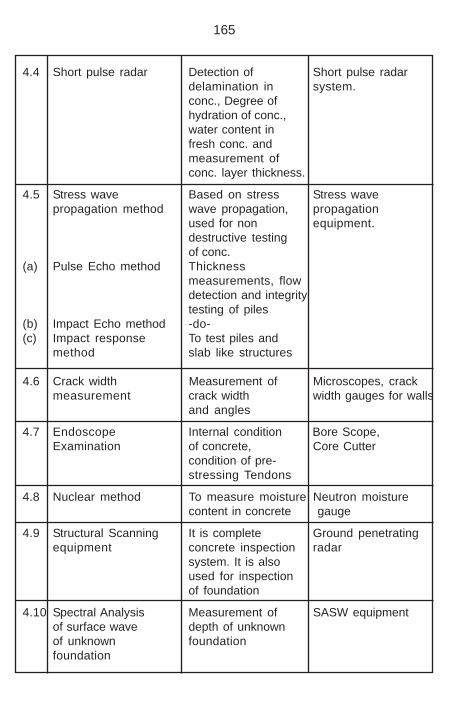
165
4.4 Short pulse radar Detection of Short pulse radardelamination in system.conc., Degree ofhydration of conc.,water content infresh conc. andmeasurement ofconc. layer thickness.
4.5 Stress wave Based on stress Stress wavepropagation method wave propagation, propagation
used for non equipment.destructive testingof conc.
(a) Pulse Echo method Thicknessmeasurements, flowdetection and integritytesting of piles
(b) Impact Echo method -do-(c) Impact response To test piles and
method slab like structures
4.6 Crack width Measurement of Microscopes, crackmeasurement crack width width gauges for walls
and angles
4.7 Endoscope Internal condition Bore Scope,Examination of concrete, Core Cutter
condition of pre-stressing Tendons
4.8 Nuclear method To measure moisture Neutron moisturecontent in concrete gauge
4.9 Structural Scanning It is complete Ground penetratingequipment concrete inspection radar
system. It is alsoused for inspectionof foundation
4.10 Spectral Analysis Measurement of SASW equipmentof surface wave depth of unknownof unknown foundationfoundation

166
5.0 Non Destructive Testing of Steel Bridges5.2 Dye-penetrating It is used to reveal Dye – penetrating
method surface breaking equipmentflaws by bleedout of a coloredor fluorescentdye from the flaw
5.3 Magnetic particle To detect defects Magnetic particleinspection (MPI) in the structures inspection equipments
5.4 Eddy Current Cracks, Voids, Eddy Current MeterHoney combing
5.5 Radiographic testing It gives shadow Radiographic testerimage of an objector film by usingpenetrating radiationsuch as X-rays orGamma rays
5.6 Cross hole pile Integrity Testing of Ultrasonic Crossintegrity testing pile pile Integrity
Testing Equipment.
5.7 Complete Structural To detect damage Completetechnique and general structural testing
evaluation of equipments.structures
5.8 Acoustic Emission To measure the Acoustic Emissiontechnique location and activity Detection System
of cracks
6.0 Non Destructive Testing of Masonry Bridges
6.2 Stress modulus In-situ stress Flat Jacks andof deformation deformability and accessories
resistance ofbrickwork orstone masonry
6.3 Impact Echo method Thickness Stress wavemeasurements, propagationflow detection and equipment.integrity testingof piles

167
6.4 Short pulse radar Detection of Short pulse radardelamination, Degree system.of hydration, watercontent andmeasurement oflayer thickness.
6.5 Infra Red Images Cracks, delamination Infra Red ThermalImaging Systems
6.6 Endoscope Internal condition BorescopeExamination of Material, condition
of pre-stressingTendons

168
LIST OF FIRMS DEALING WITH NDT EQUIPMENTS :(NOTE : The list is not exhaustive, there are many moremanufacturer and distributes available all over India)
1. M/s AIMIL LTD., A-8, MOHAN COOPERATIVIE INDUSTRIALESTATE, MATHURA ROAD, NEW DELHI.
2. M/s HILTI INDIA PVT. LTD.,8 LSC PUSHPA VIHAR COMMUNITYCENTRE, NEW DELHI
3. M/s ULTRA TECHNOLOGIES PVT. LTD, B-85, KALKAJI,NEW DELHI.
4. M/s. ENCARDIO RITES, LUCKNOW
5. M/s. JAMES INSTRUMENTS LUC. 3727, NORTH AEDZIE AVENUE,CHICAGO ILLINOIS 60618, U.S.A.
6. PROSEQ U.S.A., RIESHASH STRASSE 57 CH - 8034 ZURICH,SWITZERLAND.
7. ELE INTERNATIONAL LTD., EAST MAN WAY, HEMELHAMPSTEAD HERTFORDSHIRE, HP2 7HB, ENGLAND.
8. M/S S.G. MARKETING PVT. LTD., 15, BIRBAL ROAD, JANGPURAXTN., NEW DELHI 110014
9. M/S NDT TECHNOLOGIES PVT. LTD., PLOT NO. 11, SECTOR 23,TURBHE, NEW BOMBAY 400705
10. M/S J.MITRA & CO. PVT. LTD., A 180-181, OKHLA INDUSTRIALAREA – I, NEW DELHI 110020
11. M/S KARL STORZ ENDOSCOPY INDIA PVT. LTD., C-126, OKHLAINDUSTRIAL AREA PHASE – I, NEW DELHI 110020.

169
REFERENCES:
1. RDSO Guidelines on non-destructive testing of bridgesBS - 103
2. IS-1311 (Part-1) : 1992 Non-Destructive Testing of Concretemethods of test, Part-I, Ultrasonic Pulse Velocity.
3. IS 13322 (Part-2) : 1992, Non-Destructive Testing of Concrete –methods of test, Part 2, Rebound hammer.
4. RDSO Report No.BS-51 : Guidelines on use of Acoustic emissiontechnique
5. RDSO Report No.BS-52: Guidelines on use of corrosion monitoringequipments
6. RDSO Report No.BS-53: Guidelines on use of ultrasonicinstruments for monitoring of concrete structures.
7. RDSO Report No.BS-50: Guidelines on use of Profometer.
8. RDSO Report No.BS-42: Guidelines on use of Microcovermeter
9. “Handbook on Non Destructive Testing of Concrete” (second edition)by V.M. Malhotra and N.J. Carino
10. “Non destructive testing” by Louis Cartz.

Published by :INDIAN RAILWAYS INSTITUTE OF CIVIL ENGINEERING, PUNE
11-A, South Main Road, Koregaon Park, Pune - 411001.
Price ` 80/-