
NON-DESTRUCTIVE METHODS OF MEASUREMENT OF · PDF fileNON-DESTRUCTIVE METHODS OF MEASUREMENT OF...
27
NON-DESTRUCTIVE METHODS OF MEASUREMENT O F RESIDUAL STRESSES Viktor Hauk Imtitut fiir Werkstoflunde, Rhei~zisch-WesfilischeTechnische Hochschule Aachen, ITrlOO Aachen, FRG ABSTRACT The principle and fundamental of the methods to evaluate residual stresses are described, they use X- and neutron- rays to measure lattice strain, ultrasonic waves to measure velocities or time of flight and different magnetic measuring quantities. The characteristics are explained, the penetration depth, the reliability and the interpretation of the measuring results. The application on different materials and on different stress states need to separate influences like texture, macro- and micro-residual stresses within phases and crystallite groups. The extraordinary role of the surface and the residual stresses in surface layers requires special consideration. Formulae, tables and recommendations enable employment of the nondestructive methods. NOMENCLATURE XSE RS TOF D FWHM PSPC 'P ct JF v RD TD XEC r X-Ray Stress Evaluation Residual Stress Time of Flight Lattice distance, often used as D (1001 Lattice distance of stress free state Lattice plane Full Width at Half Maximum Position Sensitive Proportional Counter Azimuth Measuring angle Angle of specimen cut Attenuation factor Rolling Direction Transverse Direction X-Ray Elasticity Constant Cubic orientation factor
Transcript of NON-DESTRUCTIVE METHODS OF MEASUREMENT OF · PDF fileNON-DESTRUCTIVE METHODS OF MEASUREMENT OF...

NON-DESTRUCTIVE METHODS OF MEASUREMENT O F RESIDUAL STRESSES
Viktor Hauk Imtitut fiir Werkstoflunde, Rhei~zisch-Wesfilische Technische Hochschule Aachen,
ITrlOO Aachen, FRG
ABSTRACT
The principle and fundamental of the methods to evaluate residual stresses are described, they use X- and neutron- rays to measure lattice strain, ultrasonic waves to measure velocities or time of flight and different magnetic measuring quantities. The characteristics are explained, the penetration depth, the reliability and the interpretation of the measuring results. The application on different materials and on different stress states need to separate influences like texture, macro- and micro-residual stresses within phases and crystallite groups. The extraordinary role of the surface and the residual stresses in surface layers requires special consideration. Formulae, tables and recommendations enable employment of the nondestructive methods.
NOMENCLATURE
XSE
RS
TOF
D
FWHM
PSPC
'P
ct JF
v RD
TD
XEC
r
X-Ray Stress Evaluation
Residual Stress
Time of Flight
Lattice distance, often used as D (1001 Lattice distance of stress free state
Lattice plane
Full Width at Half Maximum
Position Sensitive Proportional Counter
Azimuth
Measuring angle
Angle of specimen cut
Attenuation factor
Rolling Direction
Transverse Direction
X-Ray Elasticity Constant
Cubic orientation factor

252 V. Hauk Non-destructive Methods of Measurement
11 Hexagonal orientation factor
a,b Lattice constants
E Young's modulus of elasticity
G Shear modulus
K Compression modulus
v Poisson's ratio
Normal components :
Shear components and d33 i n each depth: INTRODUCTION
There exists a lot of papers on the measuring methods to determine and to analyse residual stresses (RS) by X-ray [l], also over-viewing publications [2-151, but only a few of them deal with all nondestructive methods and some present not the newest state of development. The following paper is based on previous publications of the author [2, 4, 9, 10, 11, 121 but describes new measuring and evaluation procedures to the benefit of science and technology to use the residual stress evaluation (RSE).
Fig. 2 Compensation of normal and shear stress components.
A further characteristic of the method to be chosen is the penetration depth in which the RS will be measured. Figure 3 demonstrates the big diffferences in depth the different methods will cover. Details will follow. The definitions of the kinds of RS are given in Fig. 1 [16, 171. Besides the
macro-residual stresses (kind I) there exist the micro-residual stresses (kind I1 and kind 111). At the reference point within a material there may exist the RS as the sum of RS klind I + 11+ 111. In this paper there will be used the above stated definitions of RS.
CU - K, X-Rays and Synchrotron radiation
------( MO - K,
Neutron diffraction
-1 US - guided Waves I = (-)
several cryrtallites Magn. and -4 - -----.--- -(
magn. 1 acoust. Methods 1 I 1
0,001 0.01 0.1 1 10. -dI
one crystallite Penetration depth in mm
Fig. 3 Penetration depth of the nondestructive methods of stress evaluation.
The result of measurement, its distribution in space or in planes will be shown in orthogonal or polar diagrams or in polefigures. Besides the usual description of texture (distribution of reflecting crystallites), the distribution of interplanar spacing (lattice strain) or FWHM are nowadays also presented in polefigures. The usual forms are shown in Fig. 4, at the right the stereographic projection, at left with linearity in sin2+. In both polefigures the non-linearity of the $-scale ($ measuring angle, Fig. 6) is demonstrated for consideration.
grain boundaries
Fig. 1 Definition os residual stresses kind I, 11, I11 [16, 171. To use the full load capacity of a component and to understand the behaviour of the state of the material it is necessary to know and to elaborate many characteristics of the material. Besides the RS on the surface and in different depths from the surface, the interplanar spacing Do of the unstressed material versus the distance from the surface, the tensile strength (yield and ultimate stress, the elongation, the Young's modulus ...I the profile of the surface (roughness), the micro structure on the surface and of the bulk material as
Another important fact concerning RS is the compensation within the cross section and the phases of a heterogeneous material. The origin of the RS may be of thermic nature or plastic strain. They compensate over the cross section of the specimen and are of the same in sign and amount in the phases of the material - macro RS - and they may compensate within the phases in each depth - micro RS. The formulae are given in Fig. 2.

V. Hauk Non-destructive Methods of Measurement
focusing %b circle 1 $ =0 I
specimen X-ray
Fig. 5 Principle of Debye-Scherrer method.
Normal N 0 Fig. 4 Principle polefigures.
well as gradient of the composition of material. The knowledge of all properties of the material is necessary to predict the loadability and lifetime of components especially if they are of sophisticated, heterogeneous materials of high strength - the knowledge of the RS state is only one of the important facts.
DIFFRACTION METHODS
Principle
The basic principle is the usage of the Debye-Scherrer method measuring the shift of the interferences, also referred to as reflections or peaks, in the region of low or high 28 (Braggrs angle), Fig. 5. Formerly the measurements were made in the so-called back reflection region due to the high resolving power
Fig. 6 Definitions of angles V,$;5 and of RD, TD, ND.
distinguished by positive and negative sign. The principle of diffractometers n and y as well as the rotation of specimen and detector are demonstrated in Fig. 7. The characteristics of the n- and the y-diffractometer are compared in Fig. 8 C31. The remarks are selfinterpreting and need no further explanation.
(28) = - 2 2 tan 9 Do
t Besides the stationary X-ray installations used in the laboratories of the industry and the universities, mobile measuring systems will be used more and more on site. In recent years according to the high precision of the diffractometers and the
improvements of the measuring techniques, in general measurements in the low 28 region are also commonly in use. A word to the alignment and the calibration procedures of the diffractometers.
There exists a numerous literature about the quantitative influence of several kinds of misalignments on 0- and I-stationary and mobile diffractometers. It will be out of the scope of this publication to deal with all details. The procedures recommended by the manufacturers should be observed carefully.
The lattice strain will be measured in directions that are oblique and inclined to the surface of the specimen in a plane which includes the direction of the stress to be measured.
t
Detectors, Slits, Peak Position Apparatus, Diffractometer
There exists quite a number of X-ray installations of many manufacturers in the world. It is not the intention of this paper to deal with all the different designs and the characteristics of them. The use and the working procedures are offered by the manufacturers of the machines. But some remarks must be said about the diffractometer and the detector with the appropriate slits.
The measuring devices of today are using scintillation counter and position sensitive proportional counter (PSPC). The detail of handling and the procedure for usage are to be found in the descriptions of the manufacturers. The slits on the side of the X-ray tube and in front of the detector have different, partially divergent purposes. The aim is to have on the detector side a sharp, continuously blackened interference line. The specimen should be irradiated in an area which allows to measure one strese component not to be influenced by
1 First of all the definitions of the specimen and the measuring system- The angles q,+,G used are clarified in Fig. 6. Please note that + will be

V. Hauk Non-destructive Methods of Measurement 25 7
cha rec te r i s t i c s fl -dif Fractometer 9 -d i f f r ec tomete r
plane of p - t i l L parollol t o plono of dirrrectomnter pnrpandiculnr t o plono of diflroctomntnr
beam geometry i n the plane of asymmetrical f o r Y >< 0 symmetrical, independent of >< 0
d i f f r ac t ion
beam geometry f o r tiltI$ 0 unequal. equal f o r specimen 180•‹ rotated equal
defocusing asymmetrical increasing withy, symmetrical, s l i g h t increase with y
divergence pa ra l l e l t o diffrac- c r i t i c a l with respect t o y - t i l t and decreasing unc r i t i ca l with respect t o high valuas o f y . tometer plane 0 must be r e s t r i c t ed f o r small Q
uncr i t i ca l f o r h ighybu t l imited, unc r i t i ca l
f o r small 0
point-shaped, small; independent: of direct ion
of ro t a t ion , s l i g h t l y increasing with l y l
s l igh t ly dependent on y, independent of 0
divergence perpendicular t o unc r i t i ca l but l imited, S o l l e r - s l i t s
diffractometer plane recommended
c> stepwise rototion i r r ad ia t ed specimen surface l inea r , line-shaped, l a rge ; decreasing
steadily f o r y< O' to y > 0
C) recording of interference line
0 TI\
r a t i o of penetrat ion depthT,/t,,, especial ly f o r small 0 s t rong~dependen t
co r rec t io t f fo r absorption required f o r broad interference l i n e s
depending on y
not required, independent on ly
low(normal1y l a rge diffractometer radius) scan velocity quick f o r routine measurements due t o high
in t ens i ty
no r e s t r i c t ion , s inzy=< .9 l a t t i c e s t r a i n measurements r e s t r i c t ed t o range of back r e f l ec t ion ,
s inzyz .6
t ex tu re analysis
alignment
adjustment of specimen
possible under s trong l imi t a t ions s t a t e of the a r t
extensive, dependent on construction
unc r i t i ca l
i
YJ - diffractometer R - diffractometer r e l a t ive ly simple and precise
sens i t ive regarding excentr ici ty Fig. 7 Principle of Q- and y-diffractometer
Fig. 8 Characteristics of n- and I-diffractometer C31. stress gradients in the surface of the specimen. Small slits must be used the specimen has to be irradiated at a very high inclination. The mostly used slit sizes are 12, 123 on tube side 1" resp. 3" horizontal and 2" resp. 1" vertical divergence for Q- resp. I-diffractometer and in front of the detector up to 0.5 FWHM. Some laboratories use Soller-collimators on one (tube side) or on both sides to avoid any difficulties of non-parallel ray bundles. In recent years the double slit to symmetrize the peak is more often used C183. This purpose can also be achieved by using single slits and make the symmetrization by computer, also the separation of the doublet can be done by computer, Fig. 9 C191. The benefit to use a double slit is the high intensity for series of measurement. Peaks measured with PSPC or with single slit symmetrizing and separation of Ka-doublets should be done by computer; no change of slit necessary.
Registration Symmetrizing Seporotion of K, Doublet + of K, Doublet of K d
Figure 10 shows schematically the measuring procedure up to the point of getting the peak position. The methods to evaluate the peak position are umerous and shown in Fig. 11. There may be used a single or a double slit and the separation of the doublet- For more precise measurements the interference line should be counted stepwise (not registered) with small steps in 28.
Another correction should be made if high precision is necessary. The PLA-factor, P Polarization-,LLorentz -, A absorptions factor is part of the intensity formula: I Q H. S2. PLA with H the multiplicity factor and S the structural factor. The PLA factor, Fig. 12, varies with 2- and in addition for the n-diffractometer with f + according the following formulae
Fig. 9 Symmetrizing and separation of Kal,Z-doublet by computer.
n-diffractometer lSrn:zS (1 - tan+ cote)

V. Hauk Non-destructive Methods of Measurement
- Diffractorneter R - Diffractometer + Computer
Mobile - Diffractorneter (0, V, 9,)
l o r 2 Szint i l lat ion counter I I l ( 2 ) PSPC + Mu l t i - + computer Channel Analyzer (MCA)
+ computer
I 1
- HM - resp. 2H/3 m Method
- Gravitational l i ne
Statistical noise removal, PLA, Background separation I
- Parabola 2 3 - p o i n t s
I
- Centre of gravi ly
- Centre of gravitv mul t ip le - threshhold
I
Symmetrizing o r doublet separation by computer
4
of peak sh i f t
- Cross correlation
I
Temperature correction
Fig. 10 Measuring procedure, schematically.
The background should be taken into account, especially if it is highly depended on 20. Monochromators are used to avoid the excitation of the material and to get a high peaklnoise ratio.
Radiations, Penetration Depth
The K,1,2 - doublet and sometimes the K B ~ - line of the following X-ray tubes are used with decreasing wavelength of eigen-radiation Cr, Mn, Fe, Co, Cu, Mo. The wavelengths and the B-filters are given in the appropriate tables. The broad continuous spectrum of synchrotron radiation from the deflection magnet
Fig. 11 Measuring procedure, schematically.
20?.t O?.t O?,* 20v.t 20?.t A20?.*
Fig. 12 PLA-data using n-diffractometer, 4 = 0" data for y-diffractometer.
H/2-resp.ZH/3 Method
Gravitational Line
Parabola ?3-points
Centre of Gravity
3ntredGmvity multiple- threshold
continuous -registrat ion of peakshift Correlation
260 V. Hauk Non-destructive Methods of Measurement 261
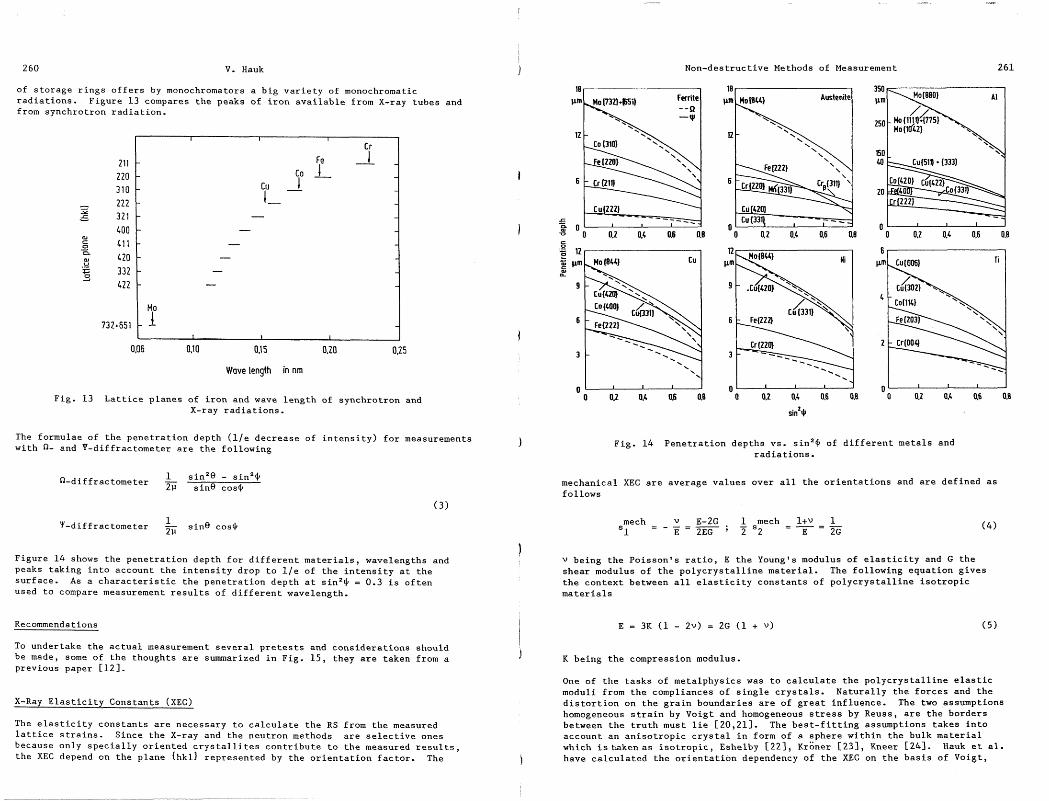
of storage rings offers by monochromators a big variety of monochromatic radiations. Figure 13 compares the peaks of iron available from X-ray tubes and from synchrotron radiation.
18 Austenite
Cu 0 3 q ---- 0 I
0 0.2 0.4 46 0.8
Wave length in nm
Fig. 13 Lattice planes of iron and wave length of synchrotron and X-ray radiations.
The formulae of the penetration depth (l/e decrease of intensity) for measurements with n- and y-diffractometer are the following Fig. 14 Penetration depths vs. sin2$ of different metals and
radiations.
1 sin2@ - sin2$ n-dif fractometer - 2~ sine cos$
mechanical XEC are average values over all the orientations and are defined as follows
Y-dif f ractometer sine cosO mech s1 = -
1 v being the Poisson's ratio, E the Young's modulus of elasticity and G the shear modulus of the polycrystalline material. The following equation gives the context between all elasticity constants of polycrystalline isotropic materials
Figure 14 shows the penetration depth for different materials, wavelengths and peaks taking into account the intensity drop to l/e of the intensity at the surface. As a characteristic the penetration depth at sin2$ = 0.3 is often used to compare measurement results of different wavelength.
Recommendations
To undertake the actual measurement several pretests and considerations should be made, some of the thoughts are summarized in Fig. 15, they are taken from a previous paper C121.
j K being the compression modulus.
One of the tasks of metalphysics was to calculate the polycrystalline elastic moduli from the compliances of single crystals. Naturally the forces and the distortion on the grain boundaries are of great influence. The two assumptions homogeneous strain by Voigt and homogeneous stress by Reuss, are the borders between the truth must lie [20,21]. The best-fitting assumptions takes into account an anisotropic crystal in form of a sphere within the bulk material which is taken as isotropic, Eshelby 1221, ~roner C231, Kneer C241. Hauk et al. have calculated the orientation dependency of the XEC on the basis of Voigt,
X-Ray Elasticity Constants (XEC)
The elasticity constants are necessary to calculate the RS from the measured lattice strains. Since the X-ray and the neutron methods are selective ones because only specially oriented crystallites contribute to the measured results, the XEC depend 00 the plane {hkl) represented by the orientation factor. The
Non-destructive Methods of Measurement 263 262 V. Hauk
Re& and ~roner for homogeneous and heterogeneous materials. Reference will be made to the special papers [25-293.
It is recommended
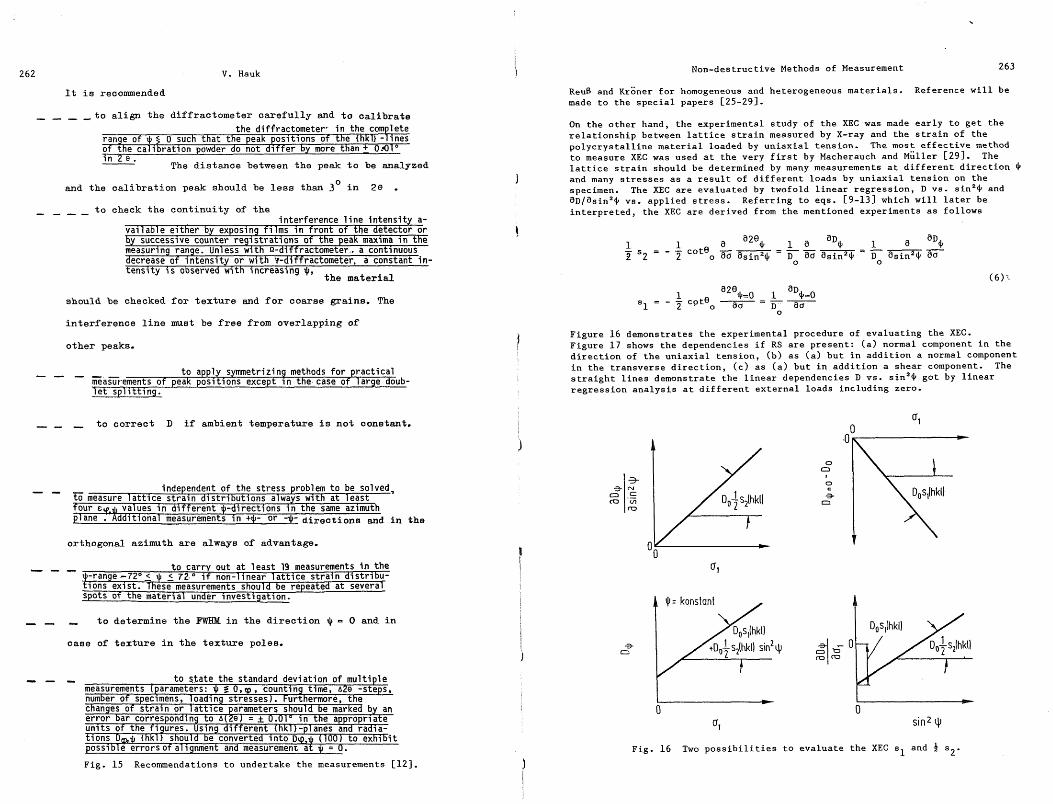
- - - - to align the diffractometer carefully and to calibrate On the other hand, the experimental study of the XEC was made early to get the relationship between lattice strain measured by X-ray and the strain of the polycrystalline material loaded by uniaxial tension. The most effective method to measure XEC was used at the very first by Macherauch and ~uller 1291. The lattice strain should be determined by many measurements at different direction $ and many stresses as a result of different loads by uniaxial tension on the specimen. The XEC are evaluated by twofold linear regression, D vs. sin2$ and a~/asin~$ vs. applied stress. Referring to eqs. [9-131 which will later be
the diffractometer* in the complete range of $ 5 0 such that the peak positions of the (hkD -lines of the calibration powder do not d i f fe r by more than + 0.41'' in Z e .
The distance between the -peak to be analyzed
and the calibration peak should be less than 3' in 29 . - - - - to check the continuity of the interpreted, the- XEC are derived from the mentioned experiments as follows
1 a aD$ ---- - D~ asin2$ a0
- interference l ine intensitv a- . . . - - . . - . - - - . - . . . - - . -
vailable ei ther by exposing films in front of the detect& or by successive counter registrat ions of the peak maxima in the measurina ranae. Unless with n-diffractometer.. a continuous decrease of intensity or with Y-diffractometer, a constant in- tensitv i s observed with i nc r ea s in~ $, - . -
the material
should be checked for texture and for coarse grains. The
interference line must be free from overlapping of Figure 16 demonstrates the experimental procedure of evaluating the XEC. Figure 17 shows the dependencies if RS are present: (a) normal component in the direction of the uniaxial tension, (b) as (a) but in addition a normal component in the transverse direction, (c) as (a) but in addition a shear component. The straight lines demonstrate the linear dependencies D vs. sin2$ got by linear regression analysis at different external loads including zero.
other peaks.
- - - _. _. t o apply symrnetrizi ng methods for practical measurements of peak positions except in the case of large doub- l e t spli t t ing.
, , , to correct D if ambient temperature is not constant.
7
in the
orthogonal azimuth are always of advantage.
t o carrv out a t l eas t 19 measurements i n the -ran e - 7 2 O 2 < 7Zm0 i f non-linear la t t ice strain distribu-
tionsgexi s t . Th?se measurements should be repeated a t several spots of the material under investigation.
, , , to determine the FWHhl in the direction $ = 0 and in
case of texture in the texture poles.
t o s ta te the standard deviation o f multiple measurements (parameters: J, 5 O , Q , counting time, A28 -steps, number of specimens, loading stresses) . Furthermore, the changes of strain or la t t ice parameters should be marked by an error bar corresponding t o A(2e) = k 0.01" i n the appropriate units of the figures. Using different {hkll-planes and radia- t ions Do& {hkl l should be converted into D Q , ~ (100) t o exhibit possible errorsofalignment and measurement a t II, = 0.
Fig. 15 Recommendations to undertake the measurements [
Fig. 16 Two possibilities to evaluate the XEC sl and 4 s2.

V. Hauk
all = a,, =-100~ /mrn~ 1
Fig. 17 Evaluation of XEC if residual stresses are present.
The recommendation of whether to use the calculated XEC or to evaluate them by the time consuming measuring method should read as follows. For material with no strongly preferred orientations, no influence of texture on the X-ray stress analysis, the calculated XEC should be used especially if they belong to orientations in the neighbourhood of the mechanical value. The reason for that is that the influence of the grainboundaries is small if any and data achieved using one or the other assumption are approximately the same. The recommendation may also read, use the mechanical XEC, also in case of textured material for the orientations mentioned. Another important observation should also be obeyed namely that all the elasticity and strength data within a certain length of material are not exactly the same but differ up to approximately 2 5%, so also the XEC.
A relation valid for mechanically isotropic cubic crystallizing material states the following E311
1 3smech 1 mech 1-2v j.- 3s1 + - S 2 2 - 2 2 = 1 + - s E - 3 K
In a practical sense this means a proof test for experimentally determined XEC on different reflections {hkl) , but the errors involved by measuring technique and the material should be considered. The relation (7) allows also to determine only 3 s2 and the mechanical XEC and to get sl by subtraction as the experimental determination of sl will have a big error.
Non-destructive Methods of Measurement 265
Fig. 18 Calculated XEC from the compliances of single crystals, according the assumptions of Reuss, ~roner and of Voigt. The orientation factors are for the cubic crystallizing metals.
and for the hexagonal crystallizing titanium
H = l2
4 c 3(;12 (h2 + k2 + hk) + l2
266 V. Hauk Non-destructive Methods of Measurement
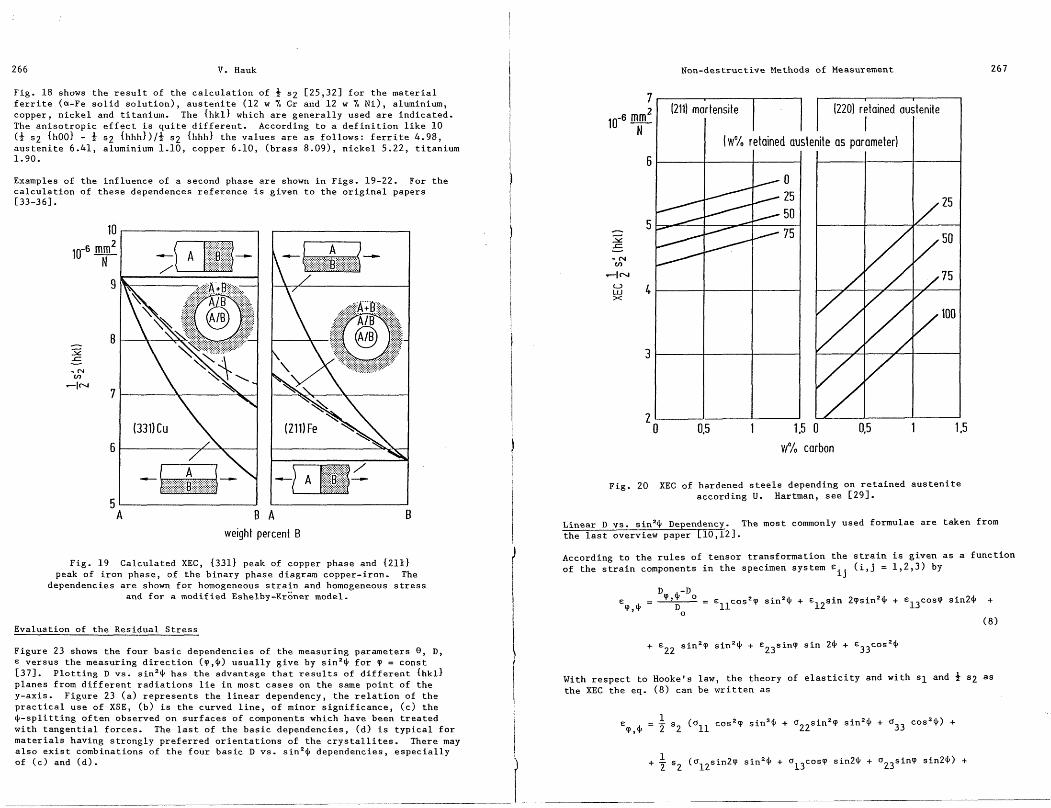
Fig. 18 shows the result of the calculation of 3 $2 [25,32] for the material ferrite (a-Fe solid solution), austenite (12 w % Cr and 12 w % Ni), aluminium, copper, nickel and titanium. The {hkl) which are generally used are indicated. The anisotropic effect is quite different. According to a definition like 10 (8 s2 {~oo) - 8 52 {hhh))/+ s2 {hhh) the values are as follows: ferrite 4.98, austenite 6.41, aluminium 1.10, copper 6.10, (brass 8-09], nickel 5.22, titanium 1.90.
1211) mar tensite (220) retained austenite
I I 1 1 I I I I wO/. retained austenite as parameter) I I
Examples of the influence of a second phase are shown in Figs. 19-22. For the calculation of these de~endences reference is given to the original papers
L
0 0.5 1 1.5 0 1 1.5 W% carbon
Fig. 20 XEC of hardened steels depending on retained austenite according U. Hartman, see [29].
Linear D vs. sin2+ Dependency. The most commonly used formulae are taken from the last overview paper 110,121. weight percent B
According to the rules of tensor transformation the strain is given as a function of the strain components in the specimen system Eij (i,j = 1,2,3) by
Fig. 19 Calculated XEC, (331) peak of copper phase and 1213) peak of iron phase, of the binary phase diagram copper-iron. The
dependencies are shown for homogeneous strain and homogeneous stress and for a modified ~shelb~-~roner model.
Evaluation of the Residual Stress
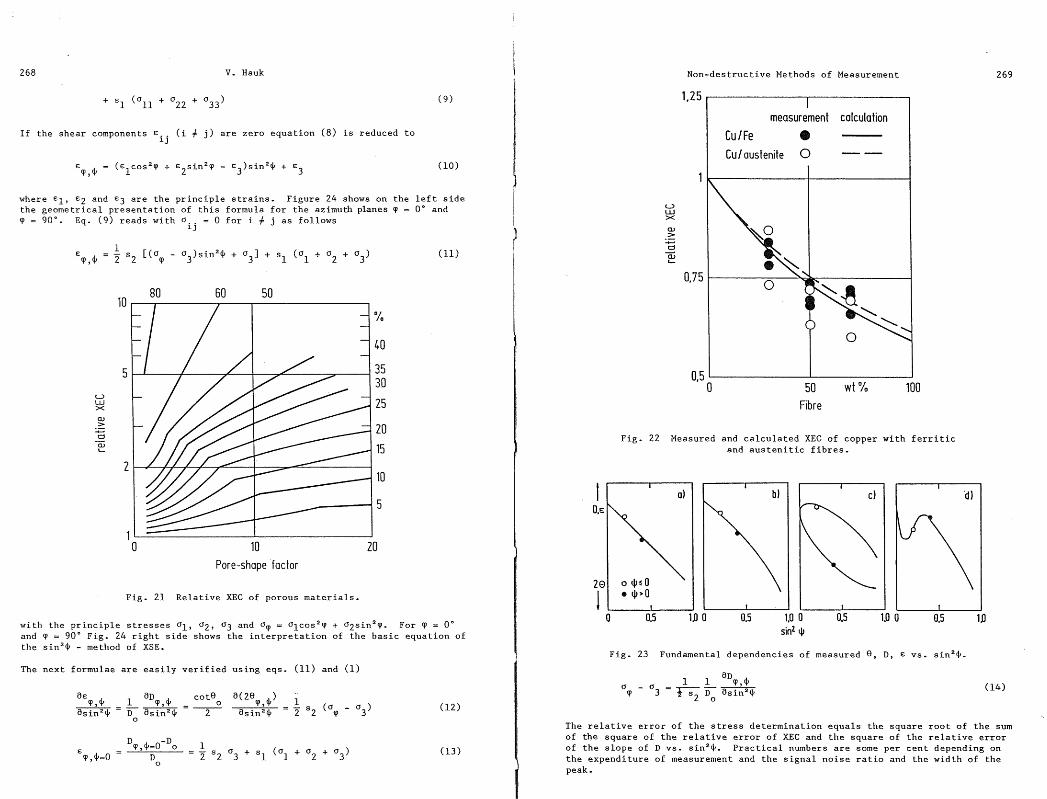
+ E~~ s i n 2 ~ sin2+ + E23sinq sin 24 + ~ ~ ~ ~ o s ~ + Figure 23 shows the four basic dependencies of the measuring parameters '3, D, E versus the measuring direction (P,+) usually give by sin2+ for T = const [37]. Plotting D vs. sin2+ has the advantage that results of different {hkl)
With respect to Hookels law, the theory of elasticity and with sl and 3 s2 as the XEC the eq. (8) can be written as
planes from different radiations lie in most cases on the same point of the y-axis. Figure 23 (a) represents the linear dependency, the relation of the practical use of XSE, ( b ) is the curved line, of minor significance, (c) the +-splitting often observed on surfaces of components which have been treated with tangential forces. The last of the basic dependencies, (dl is typical for materials having strongly preferred orientations of the crystallites. There may also exist combinations of the four basic D vs. sin2+ dependencies, especially of (c) and (d).
V. Hauk
If the shear components Eij (i f j) are zero equation (8) is reduced to
where €1, €2 and €3 are the principle strains. Figure 24 shows on the left side the geometrical presentation of this formula for the azimuth planes cp = 0" and v = 90". Eq. (9) reads with a = 0 for i f j as follows ij
0 10 20 Pore-shape factor
Fig. 21 Relative XEC of porous materials.
with the principle stresses 01, 02, 03 and or = olcos2~ + a2sin2p. For = 0" and = 90" Fig. 24 right side shows the interpretation of the basic equation of the sin2$ - method of XSE.
The next formulae are easily verified using eqs. (11) and (1)
Non-destructive Methods of Measurement
I measurement calculation
Cu IFe - Culaustenite 0 - -
' 0 50 wt% 100 Fibre
Fig. 22 Measured and calculated XEC of copper with ferritic and austenitic fibres.
Fig. 23 Fundamental dependencies of measured 9, D, E vs. sin2$.
1 1 aDP,a Or - ' 3 = % D~ asin29 (14)
The relative error of the stress determination equals the square root of the sum of the square of the relative error of XEC and the square of the relative error of the slope of D vs. sin2$. Practical numbers are some per cent depending on the expenditure of measurement and the signal noise ratio and the width of the peak.

2 70 V. Hauk
F ig . 24 D vs . s i n 2 $ f o r = 0" and 90" of a t r i a x i a l s t r a i n ( l e f t ) and a t r i a x i a l s t r e s s ( r i g h t ) s t a t e . Third component perpendicu la r
t o t h e s u r f a c e of t h e specimens.
Curved D vs. s i n 2 $ Dependencies. A curved D vs . s i n 2 $ dependency can be t h e r e s u l t of a D, g r a d i e n t and may be caused by a g r a d i e n t of r e s i d u a l s t r e s s e s . " - The l a t t e r c a s e h a s been s t u d i e d r e c e n t l y 138,391 and it was shown t h a t on ly i n a few courses of RS t h e c u r v a t u r e i s b igger than t h e measurement accuracy.
A l t e r a t i o n of l a t t i c e c o n s t a n t w i t h t h e dep th from t h e s u r f a c e a s a consequence of d i f f u s i o n e f f e c t s may f e i g n RS [40]. The magnitude of those f i c t i t i o u s RS depends on t h e g r a d i e n t of t h e l a t t i c e c o n s t a n t , t h e th ickness of t h e s u r f a c e l a y e r involved and on t h e p e n e t r a t i o n dep th of t h e r a d i a t i o n . F igure 25 (d iagrz i n t h e c o r n e r ) shows t h e Do-course over t h e dep th z. The measured average <DIlO0)> corresponds t o
CD{loo)' = O P z exp ( - ,) dz
0
w i t h P a s t h e th ickness of t h e specimen, r t h e p e n e t r a t i o n depth. The cor responding D(100) VS. s i n 2 $ dependency is shown i n Fig. 25 (main diagram) f o r both measuring ranges 0 i s i n 2 $ 5 0.5 and 0.9 u s i n g Mo - K, (732 + 651) and a Y-diffractometer . F igure 25 shows a l s o t h e l i n e a r r e g r e s s i o n l i n e and t h e chord between t h e p o i n t s on t h e ends , t h e s l o p e of bo th a r e approximately t h e same.
The f i c t i t i o u s RS have been c a l c u l a t e d f o r d i f f e r e n t Do g r a d i e n t s , f o r t h e dep th of t h e s u r f a c e l a y e r b in f luenced by t h e Do g r a d i e n t and f o r two r a d i a t i o
Non-destruct ive Methods of Measurement
F ig . 25 Curved D vs. s i n 2 $ dependency accord ing t o a D g r a d i e n t by a l l o y i n g .
peaks Cr {211} and ?o (732 + 651) of i r o n , F ig . Using Mo-radiat ion Do g r a d i e n t s 5 2 10- nm/Pm and Cr- rad ia t ion 5 lO"*nm/Vm w i l l have no i n f luence on t h e r e s u l t of RS. Higher g r a d i e n t s a s s t a t e d w i l l show up a s f i c t i t i o u s RS.
The t h e o r e t i c a l i n f l u e n c e of g r a d i e n t s of RS on t h e XSE was r e c e n t l y s t u d i e d [38,39] w i t h r e s p e c t t o v e r y s t e e p courses of t h e t e n s o r components and t o t h e RS s t a t e i n very near s u r f a c e l a y e r s . Two k i n d s of courses must be cons idered , Fig. 27. The g r a d i e n t may s t a r t on t h e very s u r f a c e o r a t a d i s t a n c e r from t h e s u r f a c e . By means of X-rays t h e average s t r a i n i s determined accord ing t o wave l e n g t h and d i r e c t i o n and a t t e n u a t i o n f a c t o r of t h e m a t e r i a l . For c a l c u l a t i o n t h e eq- (15) i n terms of a and t h e eq. ( 3 ) f o r t h e p e n e t r a t i o n dep th of a y -d i f f rac tometer were used w i t h t h e assumption of a RS on t h e very s u r f a c e of - 500 N/mm2 and t h e g r a d i e n t a s w e l l a s t h e amount of r a s parameter , Fig. 28. The Dvs. s i n 2 $ dependencies up t o s i n 2 $ i 0.9 show f o r measurements on s t e e l w i t h C r - r a d i a t i o n on (211) peak d i f f e r e n t averaged v a l u e s of RS. The r e s u l t of t h e s e s t u d i e s i s shown i n Fig. 29 f o r t h e v e r y h igh RS v a l u e - 1000 N/mm2 on t h e s u r f a c e of an i r o n specimen f o r d i f f e r e n t peaks, d i f f e r e n t g r a d i e n t s and f o r measurements up t o s i n 2 # < 0.6 and < 0.9.
The consequences of t h e s e s t u d i e s a r e a s fo l lows . The r e a l v a l u e of t h e RS on t h e s u r f a c e can be measured under c e r t a i n c o n d i t i o n s . Genera l ly t h e measured RS is l e s s than t h e r e a l a b s o l u t e va lue . The d i f f e r e n c e i s l e s s o r equa l than 10% of t h e r e a l v a l u e i f t h e l a y e r under s t r e s s i s about twice a s t h i c k a s t h e

2 72 V. Hauk
Fig. 26 F i c t i t i o u s s t r e s s vs. d i s t ance of Do g r ad i en t f o r d i f f e r e n t r a d i a t i o n s , g r ad i en t s and two sin2$-ranges.
z- 0
distance from surface
Fig. 27 Two courses of s t r e s s gradient .
Non-destructive Methods of Measurement
Fig. 28 D vs. s i n2$ , r a d i a t i o n Cr-Ka and peak of i r on (2111, f o r d i f f e r e n t g r ad i en t s and d i f f e r e n t d i s t ance s of g r ad i en t
s t a r t from su r f ace
mean pene t r a t i on depth of t he X-rays. To determine t he course of RS wi th t he depth from t h e su r f ace , measurements with d i f f e r e n t r a d i a t i o n s and up t o s i n 2 + 2 0.9 should be made o r wi th Cr- rad ia t ion a t d i f f e r e n t depths a f t e r removing of su r f ace l aye r s by etching. The g r ad i en t of RS and t h e RS on t he su r f ace i t s e l f can be ca l cu l a t ed by deconvolution.
D vs. s i n2$ Dependencies with $ - s p l i t t i n g , t he S t r e s s Tensor. The e a r l y observed + - s p l i t t i n g , i - e . d i f f e r e n t D va lues f o r t h e two measuring d i r e c t i o n s f $, was explained by t he ex is tence of shear s t r a i n s i n su r f ace l aye r s of ma t e r i a l s which had undergone su r f ace t rea tments wi th predominantly t angen t i a l f o r ce s [41,42]. The phys ica l i n t e r p r e t a t i o n of t he shear s t r e s s e s c a l cu l a t ed therefrom has some d i f f i c u l t i e s , b u t t he use of them t o de sc r i be s p e c i a l su r f ace t re tments has proved va luable . The geometrical i n t e r p r e t a t i o n of eq. (8) and t h e eva lua t ion of t h e s t r e s s tensor fol lows t h e procedure of ~ o l l e and Hauk C421, Fig. 30. I n the genera l c a se t he t h r ee normal s t r a i n s €11, €22, €33 and t he t h r ee shear s t r a i n s €12, €23, €13 can be der ived from measurements of D a t T = 0 , 45, 90•‹ , $ f 0 vs. s in2$. The l a t t i c e cons tn t Do must be known wi th g r e a t accuracy, s ee chapter Do eva lua t ion . Figure 30 needs no f u r t h e r explanation. A c h a r a c t e r i s t i c of p r a c t i c a l importance i s t h e f a c t t h a t t h i s eva lua t ion method i s based on l i n e a r c o r r e l a t i o n s of average va lues and d i f f e r ences of measured parameters. The s t r e s s tensor i s c a l cu l a t ed from the measured s t r a i n tensor us ing Hooke's law, Fig. 31. The s t r e s s tensor become simpler i f t h e measurements a r e made p a r a l l e l and perpendicular t o t he d i r e c t i o n of t h e t angen t i a l f o r ce 1431. I n add i t i on t o t he shear s t r e s s e s t he angle of tilt A$ of t he normal components may be ca lcu la ted . As an example t he following formula leads t o A$ i f P3 a r e p r e sen t
13 and

V. Hauk
1 A+ = - a r c t an ( E 1 - 2013 ) - ) = - a r c t an (, -
2 11 - &33 2 11 33
Since t he i n t roduc t i on of t h i s method by ~ o l l e and Hauk t h e d iscuss ion has taken p lace of ex is tence and t he determination of 033, t h e normal component i n t h e d i r e c t i o n perpendicular t o t h e su r f ace of the specimen. The c r u c i a l f e a t u r e s a r e t he p r ec i s e va lue of Do and t h e f a c t t h a t 033 i s zero on t h e very su r f ace and on a l l new su r f ace s a f t e r removal of su r f ace layers .
L a t t i c e S t r a i n Polef igures . Resul t s of measurements of l a t t i c e diameters D{100), of i n t e n s i t y of peaks and of FWHM over t h e t o t a l range (P ,$ ) o r ha l f p a r t of i t i f appropr ia te ( 0 5 P 5 90•‹, 4 5 0) w i l l be presented i n po l e f i gu re s using a l i n e a r s c a l e i n s in2$-or t a n $ 1 2 , Fig. 4. The experimental procedure i s time consuming bu t t h e output may be of i n t e r e s t and may he lp wi th t h e eva lua t ion of RS s t a t e i f ma t e r i a l s of s t r ong ly p r e f e r r ed o r i e n t a t i o n s and t h e i r a l t e r a t i o n s by r o l l i n g and hea t - t r e a t i ng processes a r e fundamentally inves t iga ted [9,44,45]. It should be emphasized t h a t t he XSE i n genera l and on a r ou t i ne b a s i s needs only t h e s lope of D vs. s in2$ , t h e s t r a i g h t l i n e i n t he azimuths 9 = O 0 , 90"-
distance from surface r
Fig. 29 Re l a t i ve averaged s t r e s s vs. d i s t ance of g r ad i en t s t a r t from su r f ace f o r d i f f e r e n t peaks, g r ad i en t s and two s i n2$ - ranges.
According t o eq. (9) and tak ing s eve ra l s t r e s s s t a t e s i n t o account Fig. 32 r ep re sen t s t he po l e f i gu re s ( l i n e a r i n s in2$) f o r i r o n wi th Do = 0.28665 nm. Note t h a t i n each polef igure t he r e i s a curve represent ing t he d i r e c t i o n (P ,+ ) of t he s t r e s s f r e e l a t t i c e cons t an t D .
l s t r uc t i ve Methods of Measur ement 2 75
Fig. 30 The eva lua t ion of t he s t r a i n tensor wi th shear components.
Fig. 31 Calcula t ion of t he s t r e s s tensor us ing Hooke's law and t h e s t r a i n tensor of a ground ma te r i a l (gr inding d i r e c t i o n p a r a l l e l E
11 ) '
D- Evaluation It i s a mistake t o use any powder of approximately t h e same mgter ia l t o measure Do t h e l a t t i c e parameter of t h e s t r e s s f r e e s t a t e , s i nce t h e o f t e n unknown small amount of elements i n t he l a t t i c e of t h e parent ma t e r i a l w i l l s t r ong ly i n f l uece t h e necessary exac t va lue of Do of t he ma t e r i a l which i s involved i n t he t e s t i ng .
Another method which may r e s u l t t o e r r o r s i s t o use a powder made of t h e specimen i t s e l f . The procedure t o make t h e powder by machining o r f i l i n g may in t roduce RS I1 and I11 kind which broaden t h e peak t o g r e a t ex ten t . The necessary hea t t reatment, s t r e s s r e l e a s e , i n vacuum o r i n n e u t r a l gases changes t h e va lue of Do ( e s p e c i a l l y of s t e e l s ) t o a small amount bu t h igh enough t o pretend t h e ex is tence of a 03. To r e a l i z e t he r i s k t he following es t imat ion may he lp

V. Hauk
F ig . 32 D-polefigure of d i f f e r e n t s t r e s s t e n s o r s ( l i n e a r i n s i n 2 + ) . The s i g n 0 r e p r e s e n t s Do = 0.28665 nm; 0 - G AD = - 3.10-' nm;
0 - 4 AD = 3.10-' nm.
For f e r r i t e , C r - Ka, 1211) and AD = 2.10-' nm
t h e e r r o r i n a3 i s approximately 1 5 N/mm2-
The s a f e s t method i s t o measure Do on t h e s t r e s s e d specimen i t s e l f . There a r e two p o s s i b i l i t i e s . The f i r s t and mostly used fo l lows from eq. ( 9 ) and i s i l l u s t r a t e d i n Fig. 24, s e e a l s o Fig. 1 7 C461. The d i r e c t i o n +*, t h e s t r a i n f r e e d i r e c t i o n i s g iven f o r = 0" by
Non-destruct ive Methods of Measurement
For T = 90" t h e eq. r e a d s
w i t h t h e same accessory c o n d i t i o n . These a r e an a b s o l u t e l y e x a c t c a l i b r a t i o n of t h e d i f f r a c t o m e t e r and a c c u r a t e measurements of t h e l a t t i c e d i s t a n c e . I n s p i t e of . t h a t , e r r o r s may occur i f t h e s l o p e s of D vs . s i n 2 + a r e l a r g e .
The second method can be used measuring t h e dep th dependency of t h e s t r e s s s t a t e from s u r f a c e I n t h i s c a s e D w i l l become Do i n t h a t dep th where t h e s t r e s s i s zero. I n a l l c a s e s a p r o f i l e of Do w i t h dep th from t h e s u r f a c e must be checked whether it is a Do g r a d i e n t due t o a l l o y i n g o r a r e a l 03 course. Supplementary i n v e s t i g a t i o n s of t h e m i c r o s t r u c t u r e a r e necessary.
Tab les , E r r o r s . The t a b l e s a r e taken from prev ious p u b l i c a t i o n s [ l o ,121, they c o n t a i n a l l d a t a f o r t h e s e l e c t i o n of t h e a p p r o p r i a t e r e f l e c t i o n of t h e phase of t h e m a t e r i a l t o be i n v e s t i g a t e d , Fig. 33. The XEC a r e c a l c u l a t e d accord ing t o [25,32]. f o r t h e s e l e c t i o n of t h e r a d i a t i o n t h e c h a r a c t e r i s t i c parameters a r e : i n t e r f e r e n c e { h k l ) w i t h r e g r d t o 28 and t h e o r i e n t a t i o n f a c t o r . High v a l u e of 2emeans h i g h r e s o l v i n g power. An o r i e n t a t i o n f a c t o r n e a r t h e c r o s s i n g p o i n t of t h e 3 s t r a i g h t l i n e s , s e e Fig. 1 8 , means p r a c t i c a l no i n f l u e n c e of t h e e l a s t i c an i so t ropy of t h e s i n g l e c r y s t a l . The o t h e r a s p e c t f o r s e l e c t i o n of t h e r a d i a t i o n is t h e p e n e t r a t i o n depth. The dep th of t h e s u r f a c e l a y e r s which a r e p e n e t r a t e d by X-ray i s o f t e n of g r e a t importance.
The peaks of t h e m a t e r i a l s shown a r e i n t h e back r e f l e c t i o n range , g e n e r a l l y 28 > 140". The technique of today enab les measurements a t lower Bragg angles . For m a t e r i a l s having d i f f e r e n t l a t t i c e c o n s t a n t s due t o s o l i d s o l u t i o n w i t h ano ther element and c o n t a i n i n g a second phase, t h e d a t a g iven should be construec a s a guide. The a l t e r a t i o n of XEC because of a second phase can be c a l c u l a t e d E33-361.
The d a t a of t h e c a l i b r a t i o n powders a r e based on t h e fo l lowing l a t t i c e c o n s t a n t s i n nm: Au 0.40786, Ag 0.40865, C r 0.28844, Ge 0.56575, W 0.31650. The peaks of t h e c a l i b r a t i o n powders which i n t e r f e r e w i t h t h e peaks of t h e m a t e r i a l a r e marked w i t h an *. I n t h i s c a s e t h e c a l i b r a t i o n and meauring procedure must be separa ted . I f 2eC > 2e0 t h e mark ** i s shown.
The e r r o r of t h e r e s u l t of measurement should be s t a t e d . There a r e d i f f e r e n t sources of e r r o r s : Specimen ( f l u c t u a t i o n s i n m i c r o s t r u c t u r e , composit ion, s t e n g t h ... ), a n a l y t i c and i n s t r u m e n t a l e r r o r s . I n d e t a i l e r r o r s a r e due t o count ing s t a t i s t i c s , temperature a l t e r a t i o n s , s i z e s of s l i t s i f a g r a d i e n t on t h e s u r f a c e i s p r e s e n t . I n a dubious c a s e a second o r t h i r d measurement on a neighbouring s p o t of t h e specimen is favourab le r a t h e r than t o e n l a r g e t h e count ing r a t e .
Separa t ions of Macro- and Micro-Residual S t r e s s e s . Under t h e c o n d i t i o n t h a t t h e micro RS i n a heterogeneous m a t e r i a l - a r e compensating in t h e phases , t h e micro (11)- and macro ( I ) RS a r e a d d i t i v e and bo th peaks of bo th phases a r e measurable t h e fo l lowing method of s e p a r a t i o n can be s t a t e d [47,481: c a t @ i s t h e volume percen tage of t h e a- o r t h e 8-phase, exp means exper imenta l ly determined, aJJ means t h a t t h e RS i n t h e t h i c k n e s s d i r e c t i o n e x i s t s on ly a s RS k ind 11. From t h e measured RS of bo th phases w i t h t h e c o n d i t i o n t h a t t h e micro

280 V. Hauk
Deconvolut ion of Real S t r e s s . To a n a l y s e t h e RS s t a t e i n t h e s u r f a c e r e g i o n s o r over t h e whole c r o s s s e c t i o n of t h e specimen it i s , b e s i d e s u s i n g d i f f e r e n t r a d i a t i o n w i t h d i f f e r e n t p e n e t r a t i o n s , n e c e s s a r y t o remove s u r f a c e l a y e r s . The r e l e a s e of RS i s t h e consequence of t h i s p rocedure accord ing t o t h e new ad jus tment of t h e s t r e s s and momentum equ i l ib r ium.
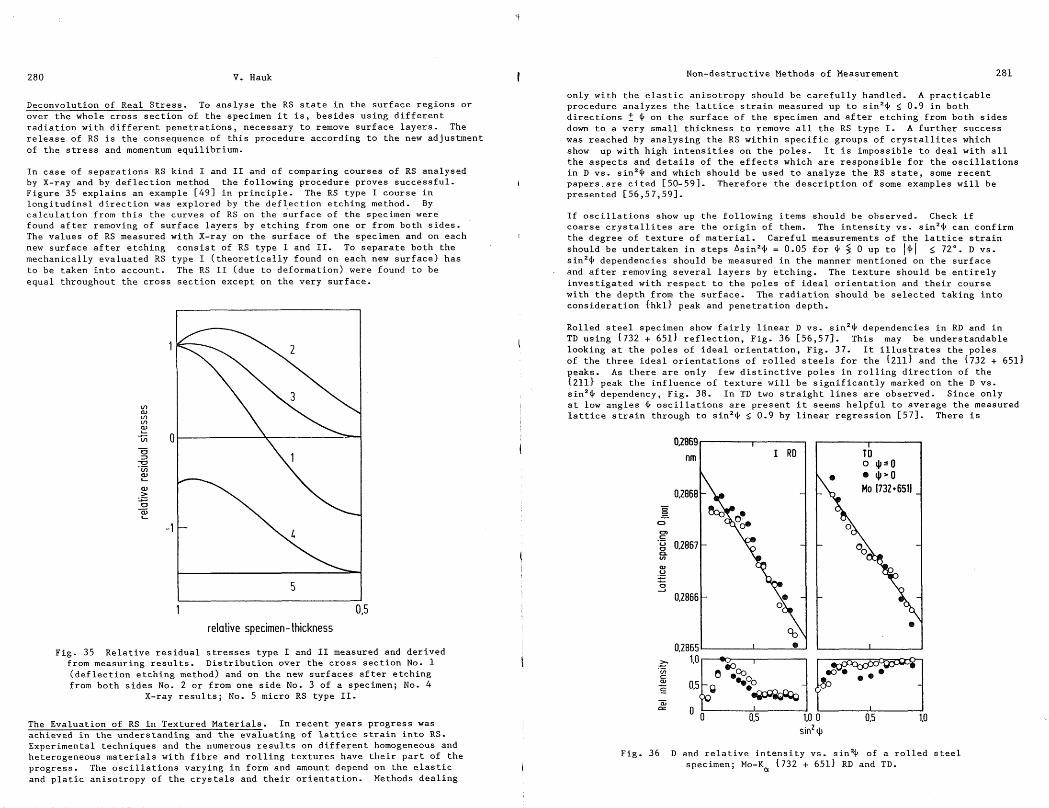
I n c a s e of s e p a r a t i o n s RS k ind I and I1 and of comparing c o u r s e s o f RS ana lysed by X-ray and by d e f l e c t i o n method t h e fo l lowing procedure proves s u c c e s s f u l . I Figure 35 e x p l a i n s a n example C491 i n p r i n c i p l e - The RS type I c o u r s e i n l o n g i t u d i n a l d i r e c t i o n was exp lored by t h e d e f l e c t i o n e t c h i n g method. By c a l c u l a t i o n from t h i s t h e curves of RS on t h e s u r f a c e of t h e specimen were . found a f t e r removing of s u r f a c e l a y e r s by e t c h i n g from one o r from bo th s i d e s . The v a l u e s of RS measured w i t h X-ray on t h e s u r f a c e of t h e specimen and on each I
new s u r f a c e a f t e r e t c h i n g c o n s i s t of RS type I and 11. To s e p a r a t e bo th t h e mechan ica l ly eva lua ted RS type I ( t h e o r e t i c a l l y found on each new s u r f a c e ) h a s t o be t aken i n t o account . The RS I1 (due t o de format ion) were found t o be equa l throughout t h e c r o s s s e c t i o n e x c e p t on t h e v e r y s u r f a c e .
relative specimen- thickness
Fig . 35 R e l a t i v e r e s i d u a l s t r e s s e s t y p e I and I1 measured and d e r i v e d from measuring r e s u l t s . D i s t r i b u t i o n over t h e c r o s s s e c t i o n No. 1 ( d e f l e c t i o n e t c h i n g method) and on t h e new s u r f a c e s a f t e r e t c h i n g from bo th s i d e s No. 2 o r from one s i d e No. 3 of a specimen; No. 4
X-ray r e s u l t s ; No. 5 micro RS type 11.
The Eva lua t ion of RS i n Textured M a t e r i a l s . I n r e c e n t y e a r s p r o g r e s s was ach ieved i n t h e unders tand ing and t h e e v a l u a t i n g of l a t t i c e s t r a i n i n t o RS. Experimental t echn iques and t h e numerous r e s u l t s on d i f f e r e n t homogeneous and heterogeneous m a t e r i a l s w i t h f i b r e and r o l l i n g t e x t u r e s have t h e i r p a r t of t h e p rogress . The o s c i l l a t i o n s v a r y i n g i n form and amount depend on t h e e l a s t i c and p l a t i c a n i s o t r o p y of t h e c r y s t a l s and t h e i r o r i e n t a t i o n . Methods d e a l i n g
Non-des t ruc t ive Methods of Measurement 281
on ly w i t h t h e e l a s t i c a n i s o t r o p y should be c a r e f u l l y handled. A p r a c t i c a b l e procedure a n a l y z e s t h e l a t t i c e s t r a i n measured up t o s i n 2 $ 5 0.9 i n bo th d i r e c t i o n s f $ on t h e s u r f a c e of t h e specimen and a f t e r e t c h i n g from bo th s i d e s down t o a v e r y s m a l l t h i c k n e s s t o remove a l l t h e RS t y p e I. A f u r t h e r s u c c e s s was reached by a n a l y s i n g t h e RS w i t h i n s p e c i f i c groups of c r y s t a l l i t e s which show up w i t h h i g h i n t e n s i t i e s on t h e po les . It i s imposs ib le t o d e a l w i t h a l l t h e a s p e c t s and d e t a i l s of t h e e f f e c t s which a r e r e s p o n s i b l e f o r t h e o s c i l l a t i o n s i n D vs . s i n 2 $ and which shou ld be used t o ana lyze t h e RS s t a t e , some r e c e n t p a p e r s . a r e c i t e d [50-593. There fore t h e d e s c r i p t i o n of some examples w i l l be p resen ted [56,57,591.
I f o s c i l l a t i o n s show up t h e fo l lowing i t ems should be observed. Check i f c o a r s e c r y s t a l l i t e s a r e t h e o r i g i n of them. The i n t e n s i t y vs . s i n 2 $ can confirm t h e d e g r e e of t e x t u r e o f m a t e r i a l . C a r e f u l measurements o f t h e l a t t i c e s t r a i n should be under taken i n s t e p s b i n 2 $ = 0.05 f o r $ f 0 up t o 141 72'. D vs . s i n 2 + dependencies should be measured i n t h e manner mentioned on t h e s u r f a c e
. and a f t e r removing s e v e r a l l a y e r s by e t c h i n g . The t e x t u r e shou ld be e n t i r e l y i n v e s t i g a t e d w i t h r e s p e c t t o t h e p o l e s o f i d e a l o r i e n t a t i o n and t h e i r c o u r s e w i t h t h e d e p t h from t h e s u r f a c e . The r a d i a t i o n shou ld be s e l e c t e d t a k i n g i n t o c o n s i d e r a t i o n ( h k l ) peak and p e n e t r a t i o n depth.
Rol led s t e e l specimen show f a i r l y l i n e a r D vs . s i n 2 $ dependencies i n RD and i n TD u s i n g (732 + 651) r e f l e c t i o n , Fig. 36 [56,57]. Th i s may be unders tandab le look ing a t t h e p o l e s o f i d e a l o r i e n t a t i o n , Fig. 37. I t i l l u s t r a t e s t h e p o l e s of t h e t h r e e i d e a l o r i e n t a t i o n s of r o l l e d s t e e l s f o r t h e 1211) and t h e 1732 + 651) peaks. As t h e r e a r e on ly few d i s t i n c t i v e p o l e s i n r o l l i n g d i r e c t i o n of t h e (211) peak t h e i n f l u e n c e of t e x t u r e w i l l be s i g n i f i c a n t l y marked on t h e D vs . s i n 2 $ dependency, F ig . 38. I n TD two s t r a i g h t l i n e s a r e observed. S i n c e on ly a t low a n g l e s $ o s c i l l a t i o n s a r e p r e s e n t i t seems h e l p f u l t o average t h e measured l a t t i c e s t r a i n th rough t o s i n 2 $ s 0 . 9 by l i n e a r r e g r e s s i o n [57]. There i s
Fig. 36 D and r e l a t i v e i n t e n s i t y v s . s i n 9 of a r o l l e d s t e e l specimen; Mo-Ka (732 + 6511 RD and TD.

V. Hauk
Fig. 37 Polefigures (linear in tan $12) of the (2111 and (732 + 6511 reflections of the three ideal orientations of rolled steels.
Fig. 38 D and relative vs. sin2$ of a rolled steel specimen; Cr-Kay 12111, RD and TD.
astonishingly a good correlation between the results of the Mo 1732 + 6511 - and Cr (2111 - results.
Figures 39-42 show the results of measurements over the total (T,@) orientation of the intensity and of the interplanar spacing as two- and perspectively three-dimensional polefigures (linear in sin2$). The perspectively polefigures were achieved by looking 75" left from RD and 15" inclined to the surface. The results belong to the same rolled steel material as above mentioned.
Non-destructive Methods of Measurement 283
Fig. 39 Intensity (211) polefigure (linear in sin2$) of a rolled steel.
The strain formula for single crystals by ~oller and Martin and others
i was used to evaluate the RS of crystal groups belonging to different zone axis [54,56]. There exist the following formulae for iron
axis CilIl
ideal orientation (100) <011> and zone axis [oil]
1 s ~ ~ ~ ~ + s ~ ~ ~ ~ + s ~ ~ ~ ~ + [-(S + S ) (01-03)+ $S (02-03) ]sin2+
2 44 0 (23
The RS 0 1, U2, a3 can be determined by measuring the lattice strain in the I poles (different peaks, different radiations) and using the compliances of


ELEMENT
A 1
Ti
C r
FI
C 0
N i
M 0
W
V. Hauk Non-destructive Methods of Measurement 28 7
NEUTRONS ' b p '50%
(10"~cm l (cm") (cm 1
0.35 0.1 0 7.05
-0 .34 0.45 1.55
0.35 0 . 4 7 1.47
0.96 1.1 2 0 .62
0.25 2.40 0.29
1.03 1.86 0 .37
0.69 0 .48 1.44
0 . 4 7 1.05 0.66
* A* 0.129 n m
** A* 0.154 nm .Cu K. X-RAYS. f VALUES al ,in 8 / A 10.5 ;-'
Fig. 44 Neutron and X-ray scattering characteristics [61].
1. The attenuation coefficient for n-rays are generally about 3 orders of magnitude smaller than those for X-rays, Fig. 44. Therefore the 50% attenuation thickness varies from 0.3 to 7 cm instead of 2 to 70 Um for X-rays, except for a few highly absorbing materials like Cd or B. As a consequence RS can be investigated in the interior of bulk samples, which is the main advantage of n-rays for RS-problems. A further important consequence is the fact that with neutrons D vs.sin2+-distributions can be measured up to sin2+ = 1. Although recent improvements of the X-ray measuring technique have increased the +-range to be measured to 4~ = 70•‹ (sin2+ = 0-91, the last 20" cannot be investigated by X-rays. In textured materials the measurement of D-spacings at + = 90" is very valuable or even necessary for the determination of RS as a function of the orientation of the crystallites.
2. The n-scattering amplitudes, which do not vary in a systematic fashion with increasing atomic number, are one to two orders of magnitude smaller than those for X-rays, Fig. 44. Moreover, available neutron sources have a much lower brightness than common X-ray tubes. Consequently relatively large volumes have to be irradiated to get reasonable counting rates. At present a volume of 5 mm3 has to be taken as a lower limit. This means that the spatial resolution in any direction is about one or several mm, i-e. considerably more than in the X-ray case. On the other hand this means that the surface of the specimen needs no preparation. Moreover the spatial resolution can be deliberately relaxed to irradiate the total cross section. As in this case the mean value of the RS type I is zero, the measurement yields directly the RS type 11.
3 . As a further consequence of the comparatively low brightness of neutron sources the instrumental resolution 5A/a is generally somewhat poorer than for X-rays. However, this is not a serious drawback as in many applications the width of the reflection lines is not limited by the instrumental
resolution, but by the properties of the sample. For the accuracy of the D-spacings evaluated from the peak position of the reflection lines a value AD/D 2 10'~ has been achieved [651.
4. There are only a few places to undertake n-tests. The experiments are time consuming and costly. Therefore any investigation by n-rays needs a careful preparation, theoretically and practically. A close co-operation of experts of neutron diffraction and of materials engineering is a basic requirement
I of a successful experiment.
The experimental technique depends on the type of the n-source. If the n's are delivered by a steady state source (generally a research reactor), the beam is first monochromatized by a Bragg reflection on a monochromator crystal, then
I impinges on the sample and the diffracted neutrons are analysed in respect to their 2 8 values as in X-ray diffraction. The wavelength of the n's is in the same range as that of the commonly employed X-ray tubes, i.e. A = 0.1 to 0.3 nm. If pulsed n's are used (generally from a spallation source) the sample is irradiated by a polychromatic beam, and the diffracted n's are analysed at fixed angles 28 in respect to their time-of-flight (TOF). From the flight path L and the TOF t the velocity v = L/t can be computed, which gives the wavelength A of the corresponding n's according to the formula A = h/mv.
The useful range of wavelengths extends to somewhat shorter values than in the 1 case of reactors, i.e. to about A = 0.05 nm. Each peak in the TOF distribution
corresoponds to a different set of Miller indices. The simultaneous measurement of D-spacings from a large number of reflection lines is certainly an important advantage of this technique. However, the intensity of n-rays produced by spallation sources has been so far too low to obtain a spatial resolution adequate for RS problems. Therefore only RS of type I1 have been investigated by the TOF t,echnique.
. The first investigations of RS by n's had the character of proof-of-principle
9 experiments [60,61,62]. The experimental set-up used in one of these experiments is shown in Fig. 45. Figure 46 illustrates the internal probe region for an investigation, in which the so far best spatial resolution has been achieved. In the meantime n-stress analysis has been applied to RS problems of practical importance 162-653. Figures 47, 48 and 49 shuow some results obtained in these investigations.
ULTRASONIC METHODS
1 The basic equations and the dependencies of the sound velocity from several parameters of the material were found in the fifties. There have been done intense tasks within the last 10 years to fit the use of the ultrasonic (US)- methods of stress- and residual stress determination for practical problems. Activities in this respect have been contributed by the following institutes and laboratories: Department of Mechanical Engineering, University of Houston; Fraunhofer-Institut fur zerst&ungsfreie ~rufverfahren, Saarbrucken; Edward L. Ginzton Laboratory, Stanford University. The problems are manyfold since dependencies of different parameters are convoluted, for example streee
I and texture.
According to the present state the application of the US-methods is limited to special problems and to the determination of the elastic constants of higher orders. A reliable result on the stress values and on the stress state is possible if the macro- and micro-structure of the material are well known. It is recommended that using the US-methuods on site the US-specialist and the engineer of material testing should co-operate very closely. The following explanations rely predominately on the papers 166-723 and relate the facts without the sophisticated details.
I

V. Hauk Non-destructive Methods of Measurement
From Reactor
y S.C. Monochromator Crystals
wide 1
from monochromator
beam stop U beam stop specimen ( position JI= 90•‹ )
Fig. 45 Schematic drawing of the experimental set-up for stress analysis by neutron diffraction C621.
The wave modes. In principle there are volume and surface waves and there should be differentiated between longitudinal and transversal (shear) waves. 1 The main characteristic is the propagation velocity of the sound in the material given by the density p and the elastic constants of first and third order. In the following equations the technical data of the polycrystal are used. If examples are presented they do belong to the texture-free steels ( E = 210. lo3 N/mmz, v = 0.28, G = 82.103 N/mm2).
Longitudinal wave
1-v put = (1-2v)(l+v) =
Transversal wave (ST Shear transversal)
PV; = G
Fig. 46 Incoming and outgoing neutron beam, shifting and rotation of specimen used in C651.
I/ =r= Neutrons
p- d -- Strain - I Gauge - 2 0 2 4
- Position [mm] - Fig. 47 Lattice strain by neutron diffraction in an aluminium alloy bar
loaded with a bending moment exceeding the yield strength of the material and after releasing the load C621.

4 J 0 , > 4 J a, L a , @
C w u c 4 J o 4 J 3 ?
C L O w a , . i L ) M O r n 3 . 4 r n .
0 m 3 a, .& a, r n ~ o 4 3 a , U U rl m ; 2 : . z o m Ll C p : C c
- 4 C P 0 , 4 J C + ' a + c a , v k > O C - 0 a = a h 5 y a o e, E
. A S 0 Mv) m u m u * c 3 c o r n 3 a , a , a w O V d a , E ( d L l C ( d C
a m a w a , u 0 0 0 , k > C L c w ' (d c h a a o v, 3 . 4

Non-destructive Methods of Measurement 292 V. Hauk
Taking into account a measuring accurcy of TOF with the error for the difference of stresses is of the order of 10 N/mm2.
Uniaxial tension test. The formula (24) reduces to the stress component in the direction of the strain
The sound will be sent in the direction perpendicular to the strain (thickness of the specimen with rectangular cross section) and the TOF will be measured when the polarization of the shear waves is parallel and perpendicular to the longitudinal, the strain direction.
Two axial RS. Figure 50 C711 shows the RS within a weld seam of two sheets determined by ultrasonic measurement. The sound was sent in the thickness direction at different distances from the weld. The TOF was measured when the polarization was parallel and perpendicular to the weld seam.
- -0-- -,- Ultrasonic
o Trace 3
Distance from crack end ( mm 1
Fig. 51 The principle stresses vs. distance of a crack end determined by US-methods and X-ray C 711.
Two axial RS state on the surface of components. Rayleigh- or SH-waves are used. The sound velocities are to be measured of the stress free state of the material vo and in the direction of the principle stress. Also the elastic constants included those of third order of the material must be known. The formulae get the following form [ 701.
Distance from the seam (mm) Using the Rayleigh waves there exists a further constant C. A, B, C are functions of the elastic constants of the material.
Fig. 50 Determination of the stress difference by US-method at different distances from a weld seam of steel sheets along 3
traces C711.
Textured material. The influence of texture on the sound velocities is bigger than that of the stress. Therefore the use of US-methods on site was extremely limited. But there exist now hopeful tendencies to solve the problem. In the following the method of [72] will be described. Accordingly the dependency of the velocities of the US waves from the frequency will be used. This dispersion is a consequence of the elastic anisotropy of the crystallites in the polycrystalline material. The assumption is made that the influence of the texture and the stress is additive and that of the frequencies is of potence two. Figures 52 and 53 show schematically the influence of the texture on the
To separate the stress difference in the stresses parallel and perpendicular to the weld seam, additional measurements are necessary, Fig. 51 C711.
Three axial stress state can be determined if measurements with longitudinal waves [ 691 can be made from the three directions of the specimen or the component.

V. Hauk Non-destructive Methods of Measurement
Fig. 52 Separation of. stress and texture influence on US-measurement schematically [ 721.
Fig. 54 Relative TOF difference vs. frequency given by Kf2 for texture free (J = 1) and textured steel specimen (J > 1) C721.
Fig. 53 Separation of stress and texture influence on US-measurement schematically [ 723.
relative TOF and how to separate texture and stress. The equation (24) reads as follows with the addition of the frequency dependent term
The constant K depends on the mean radius of crystallites a and is rn2a2p/~. Figure 54 shows measuring results C721.
Measuring equipment. Commercial US - apparatus and US - transducers for each kind of waves are available. Also a two-channel oscilloscope with a crystal reference for time interval measurements is necessary. The measurement itself is easy and fast to undertake. Barkhausen jumps /
magnetization reversal mechanisms Hysteresis shearing under tensile /compressive stress
MAGNETIC METHODS Fig. 55 Magnetication reversals and hysteresis shearing C701.
< , The characteristics of the magnetic methods have been studied very carefully and intense within the last 10 years. The use of these methods to analyse

296 V. Hauk
material specific data has proven worthful and has clarified many problems of the past. Members of the Fraunhofer-Institut fur zerst~run~sfreie Prufverfahren have published several papers in this field. The following items are referred to the following recent papers [68,70,73,741.
Characteristics. The condition to use the magnetic methods is a ferromagnetic, magnetostrictive active material. The magnetic quantities are sensitive to alterations of the microstructure and of the RS state of the material. It was the big mistake from the last generation of apparatus for magnetic measurement to use quasi universal only one measuring magnetic quantity. Combinations of at least two (as many as possible) magnetic parameters, which are independent from each other, are necessary to separate the influences of microstructures and RS. These possibilities are realized in special apparatus, for example the EMAG - analysator of the Fraunhofer Institut in Saarbrucken.
The magnetic methods are limited to a surface layer of max. 1 mm in depth according to the excitation frequency used, variable from 10 M Hz to 1 Hz. Figure 6 should be reminded which relates to the penetration depth of the different methods to analyse RS states. The fundamental physical processes are the motion and rotation of Bloch walls during the course of the magnetic hysteresis loop. The method differentiates between 180" and 90" Blochwalls and the rotation process, the density and configuration of these Blochwalls. The hysteresis loop can not be realized in a set-up technique therefore the measurement of the thereof related magnetic parameters were introduced. Figure 55 points out in principle the hysteresis loop, left the Barkhausen jumps and on the right the hysteresis shearing under tensile and compressive stresses C 701.
The influence of microstructure and stresses are effective to the following magnetic measuring quantities
the magnetic Barkhausen noise
the acoustic Barkhausen noike
the incremental permeability.
But there are no theoretical and quantitative dependencies between the magnetic measuring data and macro-stress.
The apparatus of the magnetic measuring technique are simple to use. The measuring detectors need no special alignment. The time for the measuring is very short and is in the magnitude of seconds. Figure 56 shows an apparatus with exciting and transducer system C701.
An example will demonstrate the procedure how to analyse stresses by a magnetic method following the paper [70]. The example is taken from the practical use of measuring the Barkhausen noise determined by the coercitivity HcM and correlate the magnetic quantity with conventional hardness testing HV 10 and X-ray stress analysis. The results were got from turbine blades of a high alloyed steel. Figure 5 7 shows the measured data HV 10 and HcM and the correlated value along a trace on the turbine blade. In a further series the two measuring parameters M M ~ ~ (Maximum magnetic Barkhausen noise) and HcM are calibrated by the macro- stresses as a result from X-ray evaluation; Fig. 58 explains the procedure in principle. These two calibration tests enables a quantitative RS measurement if deviations of stress and hardness levels occur in other samples of the testing staff .
Non-destructive Methods of Measurement
Fig. 56 Measuring unit of a magnetic exciting and transducer system, schematically 1701-
probe
Fig. 57 The correlation between hardness and a magnetic quantity along a trace on a turbine blade C701.
signal processing
ACKNOWLEDGEMENT
I
(EMAT, eddy current coil, ... 1
The author would like to acknowledge the discussions and suggestions during several years of co-operation and writing this paper with Dr L. Pintschovius, Institut fur Nucleare ~estkgrper~hysik, Kernforschungszentrum Karlsruhe (neutron diffraction) and with gentlemen of Fraunhofer - Institut fur zer~torun~sfreie Prufverfahren, ~aarbrucken, especially E. Schneider (ultrasonic methods) and Dr W. A. Theiner (magnetic methods).

V. Hauk
Fig. 58 Correlation between magnetic quantities and RS determined by X-ray along a trace in a turbine blade C701.
REFERENCES
Hauk, J. (1976,1982) Compiled literature on X-ray stress evaluation, HTM 31, 112-124; in "Eigenspannungen und Lastspannungen, Moderne Ermittlung - Ergebnisse - Bewertung", Edited by V. Hauk and E. Macherauch, Carl Hanser Verlag Munchen Wien will be published, 1986.
Faninger, G., V. Hauk, E. Macherauch and U. Wolfstieg (1976) Recommendations
for the practical use of'-the X-ray stress evaluation method (for iron base materials) (in German), HTM 31, 109-111.
Macherauch, I?, (1979) Newer investigations on the origin and assessment of residual stresses in metallic materials (in German), Z Werkstofftechn. 10, 97-111. -
Hauk, V. (1980) Methods for determination of residual stresses (in GeAn), in "Eigenspannungen, Entstehung - Berechnung - Messung - Bewertung", DGM Oberursel, 21-39.
James, M. R. and J. B. Cohen (1980) The measurement of residual stresses by X-ray-diffraction techniques, in "Treatise on materials science and technology", Edited by H. Herman, Academic Press New York, London, Toronto, Sydney, San Francisco, 1-62.
Ruud. C. 0. (1981) A review of nondestructive methods for residual stress measurement, J. Met. 33, 35-40,
Ruud, C. 0. (1982) A review of selected non-destructive methods for residual stress measurement, NDT intern. 15, w., 15-23.
Maeder, G. (1982) Mesure de contraintes r&ssuelles par diffraction X. Applications (in ~rench), Revue Francaise de ~Lcani~ue 82, 57-70. 7
Hauk, V. (1982) X-ray methods for measuring residual stress, in stress and stress relaxation", Edited by E. Kula and V. Weiss, Plenum Press New York and London. 117-138.
[lo] Hauk, V. and E. Macherauch (1982) The suitable performance of X-ray stress evaluation (XSE) (in German), in "Eigenspannungen und Lastspannungen, Moderne Ermittlung - Ergebnisse - Bewertung", Edited by V. Hauk and E. Macherauch, HTM Beiheft Carl Hanser Verlag ~ h c h e n Wien, 1-19.
[Ill Hauk, V. (1983) Residual stresses. Their importance in science and technology (in ~erman), Conference April 1983, in "Eigenspannungen, Entstehung - Messung - Bewertung", Edited by E. Macherauch and V. Hauk, DGM Oberursel, vol. 1, 9-48, (in English) DGM Oberursel (19861, 9-45.
- . -- - - -- -- - -- -
Non-destructive Methods of Measurement
Hauk, V. M. and E. Macherauch (1984) A useful guide for X-ray stress evaluation (xSE), Adv. X-Ray Anal. 27, 81-99.
Maeder, G. (1984) InterktiGi entre les contraintes r6siduelles superficielles et le comportement des mGteriaux: Apports de la diffraction X (in ~rench), Revue Francaise de ~Gcani~ue, 84, 2232236.
Macherauch, E. (1984) Residual stresses, in "Application of fracture mechanics to materials and structures", Edited by G. C. Sih, E. Sommer and W. Dahl, Martinus Nijhoff Publishers, The Hague, Boston, Lancester, 157-192.
Maeder, G. (1985) Measures de contraintes par diffraction des rayons X, in. "Traitements Mecaniques de Surface, Technologie, Applications industrielles, Controles, Effets" (in French), Edited by A. Niku-Lari, La Librairie de Traitements de Surface Paris 2, 59-95.
Macherauch, E., H. Wohlfahrt and U. Wolfstieg (7973,1976) On the useful definition of residual stresses (in German) HTM 28, 201-211, U. Wolfstieg and E. Macherauch, HTM 31, 2-3.
Kloos, K. H. (1979) Residual stresses, definitions and causes for origin (in German), in ltEigenspannungen, Entstehung - Berechnung - Messung - Bewertung", DGM Oberursel (1980) 1-20, Z. Werkstofftechn. 10, 293-302.
Wolfstieg, U. (1976) The symmetrizing of non symmetrical interference lines using special slits (in German), HTM 31, 23-26.
Hauk, V. and W. K. Krug (1983) Computerized separation and symmetrizing of Ka-doublets in X-ray stress measurements (in German), ~aterial~ruf. 25, 241-243.
~ o G t , W. (1928) Textbook on crystalphysics (in German), B. G. Teubner Leipzig Berlin.
Reuss, A. (1929) Calculation of Yieldpoint of solid solution crystals from the condition of plasticity of single crystals (in German), Z. angew. Math. and Mech. 9, 49-58.
Eshelby, J. D. (1957) The determination of the elastic field of an - . ellipsoidal inclusion and related problems, Proc. Roy. Soc. ondo don) A 241, 3 76-396.
~roner, E. (1958) Calculation of the elastic constants of polycrystal from the constants of single crystal (in German), Z. phys. 151, - 504-518.
Kneer, G. (1963) The elastic constants of quasi isotropic polycrystals (in ~erman), Phys. Stat. Sol. 3, K331-K335.
Bollenrath, F., V. Hauk and E. H. Miiller (1967) Calculation of poly- crystalline elasticity constants fromdata of single crystals (in German), Z. Metallkde. 58, 76-82.
Hauk, V. and U. Wolfstieg (1976) X-ray elasticity constants (in ~erman), HTM 31, 38-42.
Hauk, V. and H. Kockelmann (1980) X-ray elasticity constants for stress evaluation (in ~erman), in uEigenspannungenll, DGM Oberursel, 241-260.
Hauk, V. (1982) X-ray elasticity constants (XEC) (in ~erman), in "Eigenspannungen und Lastspannungen, Moderne Ermittlung - Ergebnisse - Bewertung", Edited by V. Hauk and E. Macherauch, HTM Beiheft Carl Hanser Verlag ~unchen Wien, 49-5 7.
Hauk, V. and H. Kockelmann (1979) X-ray elasticity constants of ferritic austenitic and hardened steels (in German), Arch. ~isenhuttenwes. 50, 347-350.
Macherauch, E. and P. ~uller (1958) Evaluation of X-ray elasticity constants of cold-strained Armco-iron and CrMo-steel (in German), Arch. Eisenhuttenwes., 29, 257-260.
Stickforth, J. (1966) On the relationship of X-ray lattice strain and macro-elastic stresses (in German), Tech. Mitt. Krupp Forsch.-Ber. 24, NO. 3, 89-102.
Behnken, H. and V. Hauk (1986) Calculation of the X-ray elasticity constants of the polycrystal from the elastic data of the single crystal for arbitrary symmetry (in German), Z. Metallkunde. in the press.
Hauk, V. and H. Kockelmann (1977) To the determination of stresses with X-ray on porous materials (in ~erman), Materialpruf. 19, 148-151.

V. Hauk
Hauk, V. and H. Kockelmann (1977) Calculation of stress distribution and of XEC of two-phase materials (in German), Z. Metallkde. 68, 719-724.
Hauk, V. and H. Kockelmann (1978) X-ray stress determination on fibre compound materials (in ~erman), ~aterial~ruf. 20, 464-468.
Hauk, V. and H. Kockelmann (1979) A practical method to determine X-ray elasticity constants of multiphase materials (in ~erman), ~aterial~ruf. 21, 201-206.
~ a e , H. and V. Hauk (1977) System of possible lattice strain distributions on mechanically loaded metallic materials (in ~erman), 2. Metallkde. 68. 725-728,
7 - -
D G F ~ , H. and V. Hauk (1979) The theoretical influence of multiaxial depth-dependent residual stresses upon the stress measurement by X-rays (in German), HTM 2, 272-277.
Hauk, V. and W. K. Krug (1984) The theoretical influence of depth-dependent states of residual stresses upon the stress evaluation by X-rays I1 (in German), HTM 39, 273-279.
~rummer, R. and H. W. Pfeiffer-Vollmar (1981) Influence of concentration gradients on the X-ray stress determination (in German), Z. Werkstofftech. 12, 282-289.
~vzschor , P. D. and V. Hauk (1975) On non-linear distributions of lattice interplanar spacing at X-ray strain measurements (in German), 2. Metallkde. 66, 167-168.
~ b ; z e , H. and V. Hauk (1976) Evaluation of residual stress systems arbitrarily oriented by X-rays (in German), HTM 31, 165-168.
Hauk, V., W. K. Krug, G. Vaessen and H. Weisshaupt (1980) The residual strain-/residual stress-state after grinding (in German), HTM 35, 144-147.
Hoffmann, J., H. Neff, B. Scholtes and E. Macherauch (1983) Plane polefigures and lattice strain polefigures of textured materials (in German), HTM 38, 180-183.
Hauk, V. and G. Vaessen (1983) Evaluation of residual stresses by X-rays on textured steels (in ~erman), in "Eigenspannungen, Entstehung - Messung - Bewertungu, Edited by E. Macherauch and V. Hauk, DGM Oberursel, vol. 2, 9-30.
Hauk, V. (1984) Stress evaluation on materials having non-linear lattice strain distributions, Adv. X-Ray Anal. 27, 101-120.
Noyan, I. C. (1983) Equilibrium conditions for the average stresses measured by X-rays, Metallurgical Transactions 14 A, 1907-1914.
Hauk, V. and P. J. T. Stuitje (1985) Phase specific investigations of residual stresses in heterogeneous materials by X-rays after plastic deformations, part I and I1 (in ~erman), 2 . Metallkde. 76, 445-451 and 471-474.
Feja, K., V- Hauk, W. K. Krug and L. Pintschovius. Residual stress evaluation on a cold rolled steel strip using X-rays and a layer removal technique, Mat. Science Engg., in the press.
Evenschor, P. D. and V. Hauk (1975) X-ray elasticity constants and distributions of interplanar spacings of materials with preferred orientation (in German), Z. Metallkde. 66, 164-166.
Hauk, V. and H. Sesemann (1976) Deviations from linear distributions of lattice interplanar spacings in cubic metals and their relation to stress measurement by X-rays (in ~erman), 2. Metallkde. 67, 646-650.
Hauk, V. and H. Kockelmann (1980) Lattice strain distributions of plastically deformed specimens of pure and silveralloyed copper (in ~erman), Z. Metallkde. 71, 303-308.
Hauk, V. and G- Vaessen (1982) Evaluation of non-linear lattice strain distribution (in German), in "Eigenspannungen und Lastspannungen, Moderne Ermittlung - Ergebnisse - Bewertung1I, Edited by V. Hauk and E. Macherauch, HTM-Beiheft, Carl Hanser Verlag Munchen Wien, 38-48.
Willemse, P. F., B. P. Naughton and C. A. Verbraak (1982) X-ray residual stress measurements on cold-drawn steel wire, Mat. Science Engg. 56 25-37.
Hauk, V. M. and G. J. H. Vaessen (1984) Residual stress evaluation with
Non-destructive Methods of Measurement 301
X-rays in steels having preferred orientation. Metallurgical Transactions 15 A. 1407-1414.
C561 H ~ G , V. and G. Vaessen (1985) Residual stresses in groups of crystallites of steels having preferred orientation (in ~erman), & Metallkde. 76, 102-107.
C571 Hauk, V., G. Vaessen and B. Weber (1985) The evaluation of residual stresses with rolling-texture (in ~erman), HTM 40, 122-128.
C581 Hauk, V., P . J. T. Stuitje and A. Troost (198'5T- Analysis of the state of residual stresses in a rolled sheet of Cu Zn 40 (in ~erman), ~aterialprufun~ 27, 347-350.
C591 Hauk, V. M. (1986) Evaluation of macro- and micro-residual stresses on textured materials by X-ray, neutron diffraction and deflection measurements, Adv. X-Ray Anal. 29, 1-15,
Allen, A,, C. Andreani, M. T. Hutchings and C. G. Windsor (1981) Measurement of internal stress within bulk materials using neutron diffraction, NDT intern. 3 Oct., 249-254.
Krawitz, A. D., J. E. Brune and M. J. Schmank (1982) Measurements of stress in the interior of solids with neutrons, in "Residual stress and stress relaxationu, Edited by E. Kula and V. Weiss, Plenum Press New York and London, 139-155.
Pintschovius, L- , V. Jung, E. Macherauch, R. ~chzfer and 0. VEhringer (1982) Determination of residual stress distributions in the interior of technical parts by means of neutron diffraction, in "Residual stress and stress relaxation", Edited by E. Kula and V. Weiss, Plenum Press New York and London
Pintschovius, L., V. Jung, E. Macherauch and 0. Vohringer (1983) Residual stress measurement by means of neutron diffraction, Mat. Science and Engg. 61, 43-50;
Pintschovius, L. and E. Macherauch (1982) Stress determination by neutron rays (in German), in llEigenspannungen und Lastspannungen, Moderne Ermittlung - Ergebnisse - Bewertung", Edited by V. Hauk and E. Macherauch, HTM Beiheft Carl Hanser Verlag ~unchen Wien, 170-174.
MacEwen, S. R., J. Faber Jr. and A. P. L. Turner (1983) The use of time- of-flight neutron diffraction to study grain interaction stresses. Acta Metall. 31, 657-676
Krawitz, A. D., R. Roberts and J. Faber (1984) Residual stress relaxation in cemented carbide composites studied uinn the Arnonne intense ~ulsed - - & - - - - - neutron source, Adv. X-Ray Anal. 27, 239-249.
Pintschovius, L., V. Hauk and W. K. Krug. Neutron diffraction study of the residual stress state of a cold rolled steel strip, Mat. Science and Engg., in the press.
Schneider, E. and K. Goebbels (1982) Nondestructive determination of (residual-)stresses with linear-polarized ultrasonic waves (in German), VDI-Berichte No. 439, 91-96.
Schneider, E. (1982) Determination of stress by ultrasound (in German), in "Eigenspannungen und Lastspannungen, Moderne Ermittlung - Ergebnisse - Bewertungw, Edited by V. Hauk and E. Macherauch, HTM Beiheft Carl Hanser Verlag ~Znchen Wien, 164-170.
Several papers on nondestructive stress measurement (19831, in wNew-procedures in nondestructive testingw, Editor P. HBller, Springer-Verlag Berlin Heidelberg New York, 521-596.
Schneider, E. and K. Goebbels (1983) Nondestructive determination of residual stresses by ultrasound (in ~erman), in "Eigenspannungen, Entstehung - Messung - Bewertungw, Edited by E. Macherauch and V. Hauk, DGM Oberursel, vol 2, 69-82.
Brinksmeier, E., E. Schneider, W. A. Theiner and H. K. ~Snshoff (1984) Nondestructive testing for evaluating surface integrity, Annals of the CIRP 33, 489-509.
C711 Schneider, E., H. Pitsch, S. Hirsekorn and K. Goebbels (1985) Nondestructive detection and analysis of stress states with polarized ultrasonic waves, in "Review of progress in quantitative nondestructive eval~ation~~, Editors D. 0. Thompson and D. E. Chimenti, Plenum Press, vol. 5 B, 1079- 1088.
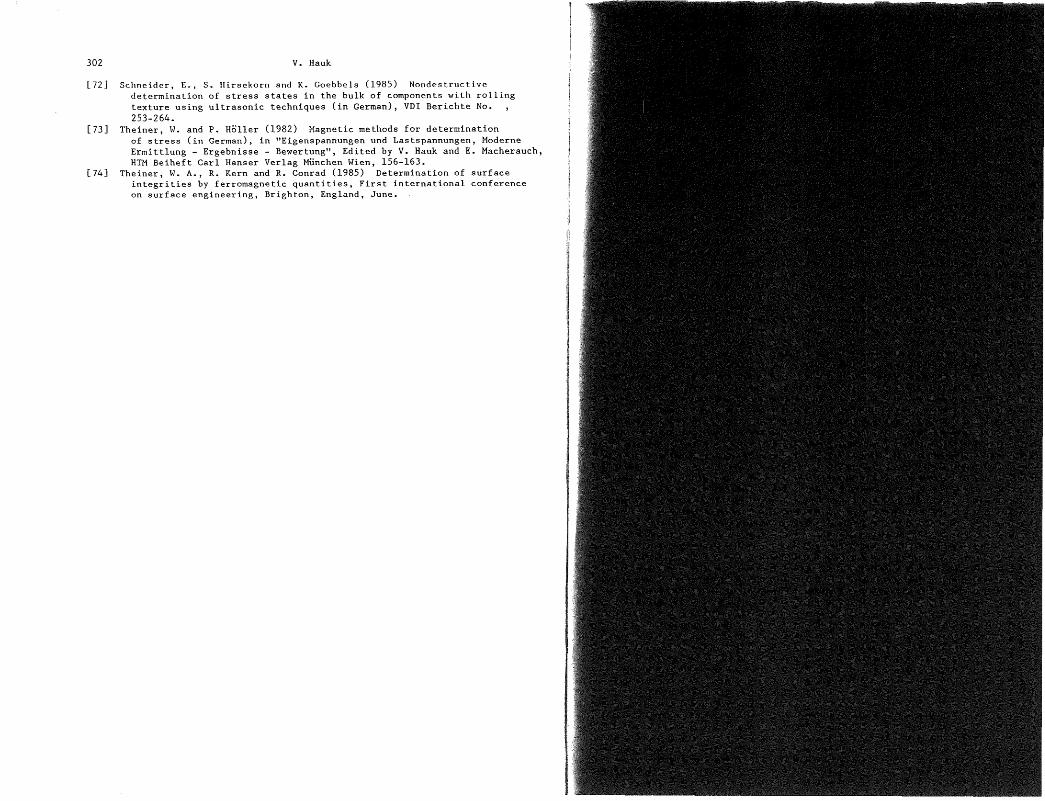
302 V. Hauk
[ 7 2 1 Schneider, E . , S. Hirsekorn and K . Goebbels (1985) Nondestructive determination of stress states in the bulk of components with rolling texture using ultrasonic techniques (in German), VDI Berichte No. , 253-264.
1731 Theiner, W. and P. Hgller (1982) Magnetic methods for determination of stress (in ~erman), in "Eigenspannungen und Lastspannungen, Moderne Ermittlung - Ergebnisse - Bewertung", Edited by V. Hauk and E. Macherauch, HTM Beiheft Carl Hanser Verlag ~Gnchen Wien, 156-163.
[ 7 4 1 Theiner, W. A., R. Kern and R. Conrad (1985) Determination of surface integrities by ferromagnetic quantities, First international conference on surface engineering, Brighton, England, June.


![Introduction To Facebook By Gowda, Hauk And Szabo[1]](https://static.fdocuments.us/doc/165x107/54c912914a795900548b4581/introduction-to-facebook-by-gowda-hauk-and-szabo1.jpg)