Noise Impact Assessment Perdaman Collie Urea Project...
98
Noise Impact Assessment Prepared For GHD July 2009 Reference: 8071043-02 G E O R G E L L O Y D Acoustics Perdaman Collie Urea Project Collie Shotts Plant
Transcript of Noise Impact Assessment Perdaman Collie Urea Project...
Noise Impact Assessment
Prepared For
GHD
July 2009
Reference: 8071043-02
GEORGE
LLOYD
Acoustics
Perdaman Collie Urea Project
Collie Shotts Plant
Report: 8071043-02
Lloyd George Acoustics Pty Ltd ABN: 79 125 812 544
PO Box 717 Hillarys WA 6923
Offices: Ocean Reef Padbury Scarborough Waterford
Phone: Fax:
Email: Mobile:
9300 4188 9300 4199 [email protected]
0439 032 844
9401 7770 9401 7770 [email protected]
0400 414 197
9245 3223 9300 4199 [email protected]
0438 201 071
9313 3655 9300 4199 [email protected]
0427 388 876
Member of the Association of Australian Acoustical Consultants – (AAAC)
This report has been prepared in accordance with the scope of services described in the contract or agreement between Lloyd George Acoustics Pty Ltd and the Client. The report relies upon data, surveys, measurements and results taken at or under the particular times and conditions specified herein. Any findings, conclusions or recommendations only apply to the aforementioned circumstances and no greater reliance should be assumed or drawn by the Client. Furthermore, the report has been prepared solely for use by the Client, and Lloyd George Acoustics Pty Ltd accepts no responsibility for its use by other parties.
Approved for Issue: Michael Cake
Position: Project Director
Verified Daniel Lloyd
Date: 31 July 2009

Lloyd George Acoustics
CONTENTS
1 INTRODUCTION ............................................................................................................. 1
2 EXISTING NOISE ENVIRONMENT ................................................................................ 1
3 CRITERIA ........................................................................................................................ 3
3.1 Plant Operations...................................................................................................... 3
4 NOISE MODELLING METHODOLOGY .......................................................................... 5
4.1.1 Meteorological Information .................................................................................. 6
4.1.2 Topographical Data ............................................................................................. 6
4.1.3 Ground Absorption .............................................................................................. 6
4.1.4 Source Sound Levels .......................................................................................... 6
5 RESULTS ........................................................................................................................ 9
6 ASSESSMENT .............................................................................................................. 14
6.1 Noise Levels at Existing Noise Sensitive Premises .............................................. 18
6.2 Noise Levels at Potential Residential Premises .................................................... 18
6.3 Noise Levels at Stockton Pool............................................................................... 19
6.4 Noise Levels at the Boundary ............................................................................... 20
7 RECOMMENDATIONS ................................................................................................. 20
APPENDICES
A Site Location
B Background Noise Monitoring Details
C Receiver Locations
D Plant Layout
E Terminology
Lloyd George Acoustics
Reference: 8071043-02v3 Page 1
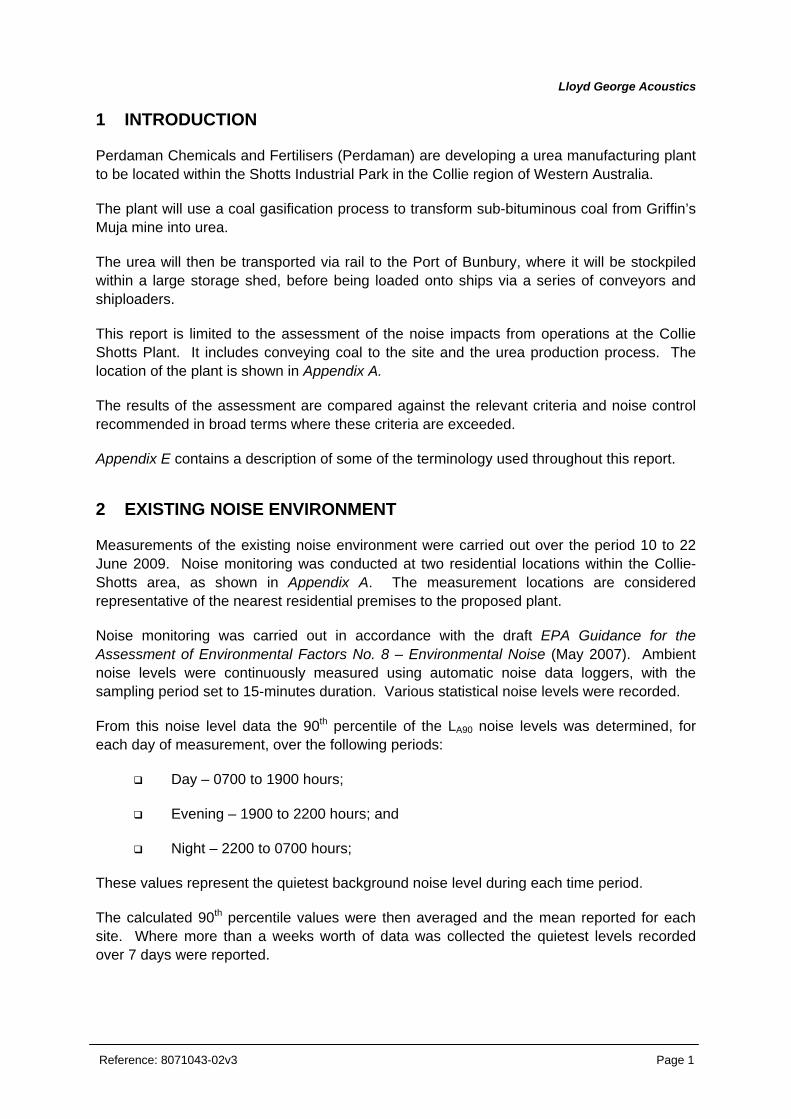
1 INTRODUCTION
Perdaman Chemicals and Fertilisers (Perdaman) are developing a urea manufacturing plant to be located within the Shotts Industrial Park in the Collie region of Western Australia.
The plant will use a coal gasification process to transform sub-bituminous coal from Griffin’s Muja mine into urea.
The urea will then be transported via rail to the Port of Bunbury, where it will be stockpiled within a large storage shed, before being loaded onto ships via a series of conveyors and shiploaders.
This report is limited to the assessment of the noise impacts from operations at the Collie Shotts Plant. It includes conveying coal to the site and the urea production process. The location of the plant is shown in Appendix A.
The results of the assessment are compared against the relevant criteria and noise control recommended in broad terms where these criteria are exceeded.
Appendix E contains a description of some of the terminology used throughout this report.
2 EXISTING NOISE ENVIRONMENT
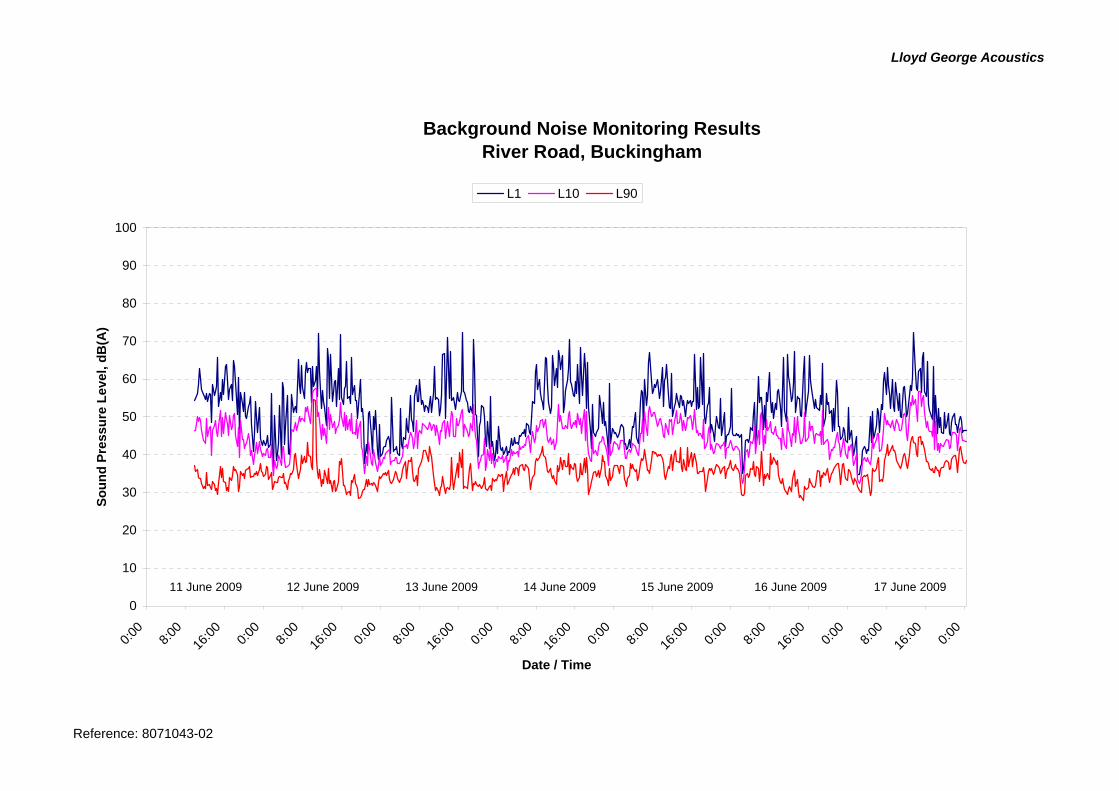
Measurements of the existing noise environment were carried out over the period 10 to 22 June 2009. Noise monitoring was conducted at two residential locations within the Collie-Shotts area, as shown in Appendix A. The measurement locations are considered representative of the nearest residential premises to the proposed plant.
Noise monitoring was carried out in accordance with the draft EPA Guidance for the Assessment of Environmental Factors No. 8 – Environmental Noise (May 2007). Ambient noise levels were continuously measured using automatic noise data loggers, with the sampling period set to 15-minutes duration. Various statistical noise levels were recorded.
From this noise level data the 90th percentile of the LA90 noise levels was determined, for each day of measurement, over the following periods:
Day – 0700 to 1900 hours;
Evening – 1900 to 2200 hours; and
Night – 2200 to 0700 hours;
These values represent the quietest background noise level during each time period.
The calculated 90th percentile values were then averaged and the mean reported for each site. Where more than a weeks worth of data was collected the quietest levels recorded over 7 days were reported.

Lloyd George Acoustics
Reference: 8071043-02v3 Page 2
It must be noted that these measurements only provide a snapshot of the existing noise environment. They do not, for example, capture any possible variation in background noise levels during different seasons. Nevertheless they are considered to provide a reasonable estimation of the typical background noise environment at representative residential locations.
The proposed production plant site will be located within the Shotts Industrial Park, about 7.5km east of the Collie townsite. Surrounding the Shotts Industrial Park are several large-scale existing industries, which produce their own noise, including:
Griffin’s Muja and Ewington coal mines;
Wesfarmers’ Premier coal mine; and
Muja, Collie and Bluewaters power stations.
The district surrounding Shotts is sparsely populated, characterised by some isolated settlements and rural residences. The closest residential premises are several kilometres away from the proposed production plant site.
East of Shotts is the old Buckingham townsite, now consisting of a handful of residents. These residences are all located within one or two kilometres of the Wesfarmers Premier Coal mine and are known to be exposed to some existing noise from mining activity.
To the south-west of Shotts are the settlements of Collie Burn and Cardiff, nestled between the old railway line and the Collie River. These old mining towns are now mostly abandoned, although they continue to offer some residents a quiet rural lifestyle.
Noise monitoring was carried out in Buckingham and Cardiff, with the results presented in Table 2.1.
Table 2.1 – Background Noise Levels – Collie-Shotts, dB
Average 90th Percentile of the LA90 Levels
Measurement Location Day
0700 – 1900
Evening
1900 – 2200
Night
2200 – 0700
River Road, Buckingham 31 32 31
Cherry Street, Cardiff 26 ≤19 ≤19
From Table 2.1 is can be seen that measured background noise levels in Buckingham were in the range of 31 to 32 dB(A). Mining noise was audible at this location and was prominent in the mid to low frequencies. Traffic noise along Coalfields Road was also found to be influencing ambient noise levels during the day time and in the early evenings. The LA90 measured noise levels were fairly consistent across the day, evening and night time periods, which indicates that the background noise environment is influenced by 24-hour operations at the nearby mine.

Lloyd George Acoustics
Reference: 8071043-02v3 Page 3
The noise environment in Cardiff is characterised by very low background noise levels. The existing environment consists mostly of natural or agricultural sounds (such as the sound of cows, sheep and roosters). During the day the average background noise level was measured to be 26 dB(A). At night, and during the evenings, LA90 noise levels were recorded at 19 dB(A), which is approaching the measurement limitations of the equipment1. Background noise levels can therefore be described as being at or below this level during the evening and night time periods.
Although no noise monitoring was carried out in Collie Burn, the background noise environment is expected to be very similar to that measured in Cardiff.
Full details of monitoring results and meteorological conditions during the measurement period are presented in Appendix B.
3 CRITERIA
3.1 Plant Operations Environmental noise in Western Australia is governed by the Environmental Protection Act 1986 and the Environmental Protection (Noise) Regulations 1997 (the Regulations).
Regulation 7 defines the prescribed standard for noise emissions as follows:
“7. (1) Noise emitted from any premises or public place when received at other premises –
(a) Must not cause or significantly contribute to, a level of noise which exceeds the assigned level in respect of noise received at premises of that kind; and
(b) Must be free of –
i. Tonality;
ii. Impulsiveness; and
iii. Modulation”.
A “…noise emission is taken to significantly contribute to a level of noise if the noise emission exceeds a value which is 5 dB below the assigned level…”
Tonality, impulsiveness and modulation are defined in regulation 9. Noise is to be taken to be free of these characteristics if:
(a) The characteristics cannot be reasonably and practicably removed by techniques other than attenuating the overall level of noise emission; and
(b) The noise emission complies with the standard after the adjustments of Table 3.1 are made to the noise emission as measured at the point of reception.
1 The ARL Ngara noise data logger used at this location is listed as having a microphone noise floor of 15 dB(A) and an electronic noise floor of 12 dB(A).

Lloyd George Acoustics
Reference: 8071043-02v3 Page 4
Table 3.1 – Adjustments For Intrusive Characteristics
Tonality Modulation Impulsiveness
+ 5 dB + 5 dB + 10 dB
Note: The above adjustments are cumulative to a maximum of 15 dB.
The baseline assigned levels (prescribed standards) are specified in Regulation 8 and are shown below in Table 3.2.
Table 3.2 – Baseline Assigned Noise Levels, dB
Assigned Level Premises
Receiving Noise Time Of Day LA10 LA1 LAmax
0700 to 1900 hours Monday to Saturday (Day)
45 + influencing
factor
55 + influencing
factor
65 + influencing
factor
0900 to 1900 hours Sunday and public holidays (Sunday)
40 + influencing
factor
50 + influencing
factor
65 + influencing
factor
1900 to 2200 hours all days (Evening)
40 + influencing
factor
50 + influencing
factor
55 + influencing
factor
Noise Sensitive(1)
2200 hours on any day to 0700 hours Monday to Saturday and 0900 hours Sunday and public holidays (Night)
35 + influencing
factor
45 + influencing
factor
55 + influencing
factor
Noise Sensitive(2) All hours 60 75 80
Commercial All hours 60 75 80
Industrial All hours 65 80 90
Notes: (1) Applies within 15 metres of a building associated with a noise sensitive use, as defined in Schedule 1, Part C. (2) Applies at a noise sensitive premises greater than 15 metres from a building associated with a noise sensitive
use.
For this assessment it has been assumed that the influencing factor will be zero for the majority of the noise sensitive premises surrounding the plant, as most will be more than 450 metres from any industrial or commercial premises or major road.
The night time assigned levels, which are the most critical in terms of compliance, are summarised in Table 3.3 for the key residential locations.

Lloyd George Acoustics
Reference: 8071043-02v3 Page 5
Table 3.3 – Night Time Assigned Noise Levels, dB
Night Time Assigned Level Residential Location
LA10 LA1 LAmax
Buckingham 35 45 55
Collie Burn 35 45 55
Cardiff 35 45 55
Collie 35 45 55
Isolated Rural Residences 35 45 55
It must be noted that existing noise levels in Buckingham are known to exceed the assigned levels, under certain conditions, as a result of mining activity at the Wesfarmers Premier Coal Mine2. The background noise monitoring results support these previous findings, as they clearly indicate the presence of mining noise in Buckingham. Where the assigned levels are likely to be already exceeded at residential locations, noise levels from Perdaman’s plant cannot “significantly contribute” to the overall noise level. This means that noise levels from the plant must be 5 dB below the assigned levels at these receiver locations.
For the purpose of this assessment, it was assumed that residences in close proximity to the Wesfarmers coal mine are currently exposed to noise levels above the assigned levels. Hence, the Perdaman’s plant must achieve a level 5 dB below the assigned levels at these locations, so as to not be “significantly contributing”.
4 NOISE MODELLING METHODOLOGY
The noise modelling software used was SoundPLAN 6.5 together with the CONCAWE noise propagation algorithms. These algorithms have been selected as they are one of the few that include the influence of wind and atmospheric stability. Input data required in the model are:
Meteorological Information;
Topographical data;
Ground Absorption; and
Source sound power levels.
Noise levels have been predicted at 80 receiver locations surrounding the plant. These receiver locations were supplied by GHD and are detailed in Appendix C.
2 Environmental Protection Authority (2003), Wesfarmers Premier Coal Mine, Collie – Noise Regulation 17 Variation, Bulletin 1096, Regulation 17 Report 6, April 2003.

Lloyd George Acoustics
Reference: 8071043-02v3 Page 6
4.1.1 Meteorological Information
Meteorological information utilised is based on that specified in the draft EPA Guidance for the Assessment of Environmental Factors No. 8 – Environmental Noise (May 2007), and are shown below in Table 4.1. Note that only night time conditions have been modelled, as these represent the worst-case scenario for compliance, given that the plant will operate 24 hours a day.
Table 4.1 – Modelling Meteorological Conditions
Parameter Night (1900-0700)
Temperature (oC) 15
Humidity (%) 50
Wind Speed (m/s) 3
Wind Direction(1) All
Pasquil Stability Factor F
Note: (1) The modelling package used allows for all wind directions to be modelled simultaneously.
The above conditions approximate the typical worst-case for enhancement of sound propagation. It is EPA policy that compliance with the assigned noise levels needs to be demonstrated for 98% of the time, during the day and night periods, for the month of the year in which the worst-case weather conditions prevail. In most cases, the above conditions occur for more than 2% of the time and therefore must be satisfied. At wind speeds greater than those shown above, sound propagation may be further enhanced, however background noise from the wind itself and from local vegetation is likely to be elevated and dominate the ambient noise levels.
4.1.2 Topographical Data
Topographical data was provided by GHD and extended several kilometres from the plant. The contours are in 5 metre intervals and cover the noise sensitive premises of concern.
4.1.3 Ground Absorption
Ground absorption varies from a value of 0 to 1, with 0 being for an acoustically reflective ground (e.g. water or bitumen) and 1 for acoustically absorbent ground (e.g. grass). In this instance, a value of 0.7 has been used as an average for the study area.
4.1.4 Source Sound Levels
Detailed plant design was not available at the time of this modelling. Therefore indicative sound power levels have been used, based on the schematic plant layout (see Appendix D). Table 4.2 shows the sound power levels used in the modelling.

Lloyd George Acoustics
Reference: 8071043-02v3 Page 7
Table 4.2 – Source Sound Power Levels, dB
Octave Band Centre Frequency (Hz) Description Source
Height 63 125 250 500 1k 2k 4k 8k
Overall dB(A)
Coal Conveyor 1.2m 84 81 84 85 81 76 68 60 85/m
Coal Conveyor Transfer 3m 103 102 100 99 94 89 83 74 100
Stacker/Reclaimer 6m 129 118 110 105 105 104 104 99 111
Coal Milling & Drying 20m 113 111 110 110 107 106 99 91 111
CMD Stack 60m 115 107 106 104 100 99 94 100 107
Gasifier 60m 108 109 105 109 111 114 106 99 117
Air Separation Unit 10m 96 96 91 96 99 102 93 86 105
Acid Gas Recovery 30m 103 103 99 103 106 108 100 93 112
Sulphur Plant 5m 88 88 83 88 91 94 85 78 97
Ammonia Synthesis 10m 109 109 105 109 112 114 106 99 118
Urea Synthesis 10m 109 109 105 109 112 114 106 99 118
Urea Granulation 10m 109 109 105 109 112 114 106 99 118
Urea Granulation Stack 50m 88 88 88 93 98 103 108 108 112
Urea Conveyor 1.2m 76 81 77 74 67 64 52 42 75/m
Urea Conveyor Drive 1.2m 95 93 87 82 79 77 70 59 86
Dehumidifiers 0.8m 100 102 98 94 92 90 87 81 98
Power Station 20m 110 106 104 102 100 98 96 90 106
Power Station Air Inlet 20m 118 120 118 100 82 78 102 94 112
Power Station Exhaust 35m 122 116 108 98 90 84 86 84 104
Cooling Towers 6m 94 98 98 97 97 96 97 98 104
Flare 80m 120 117 116 114 110 109 104 110 117
Although the proposal is for a 24-hour operation, some of these noise sources (such as flares and stack vents) will not operate continuously. Nevertheless, to be conservative, it has been assumed that, in the worst case, all sources will operate simultaneously, with the predicted noise level representing the LA10 noise level.
Lloyd George Acoustics
Reference: 8071043-02v3 Page 8
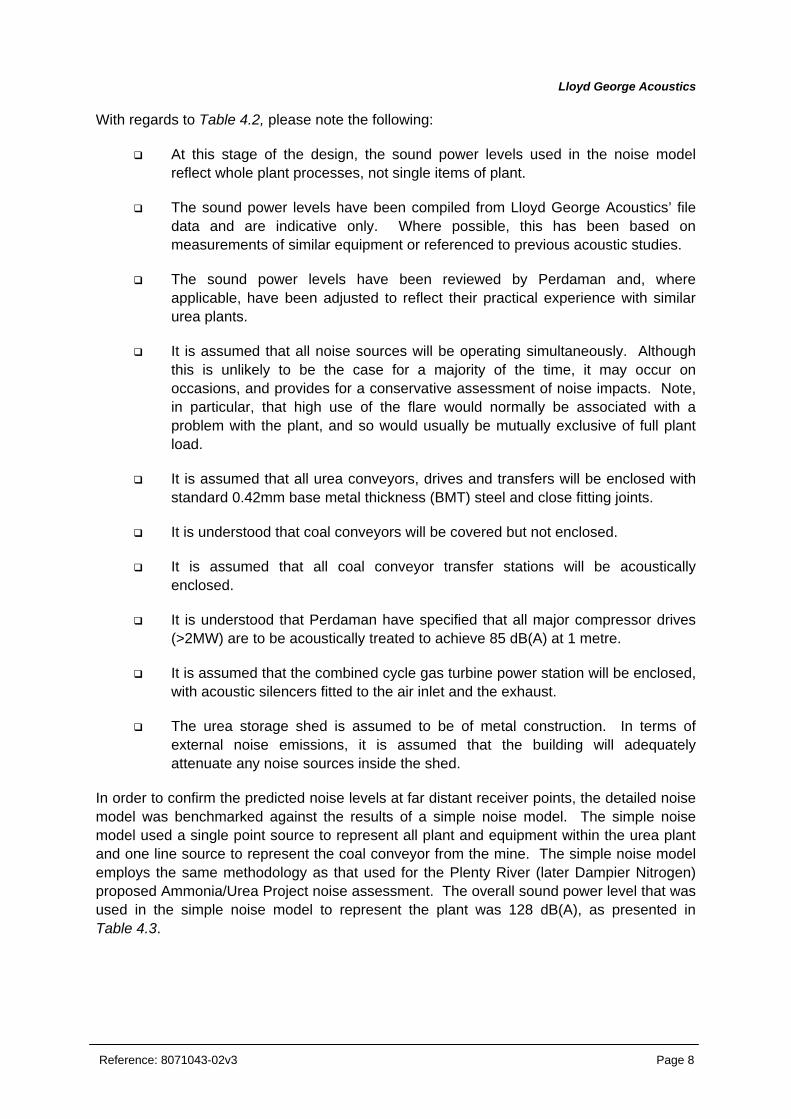
With regards to Table 4.2, please note the following:
At this stage of the design, the sound power levels used in the noise model reflect whole plant processes, not single items of plant.
The sound power levels have been compiled from Lloyd George Acoustics’ file data and are indicative only. Where possible, this has been based on measurements of similar equipment or referenced to previous acoustic studies.
The sound power levels have been reviewed by Perdaman and, where applicable, have been adjusted to reflect their practical experience with similar urea plants.
It is assumed that all noise sources will be operating simultaneously. Although this is unlikely to be the case for a majority of the time, it may occur on occasions, and provides for a conservative assessment of noise impacts. Note, in particular, that high use of the flare would normally be associated with a problem with the plant, and so would usually be mutually exclusive of full plant load.
It is assumed that all urea conveyors, drives and transfers will be enclosed with standard 0.42mm base metal thickness (BMT) steel and close fitting joints.
It is understood that coal conveyors will be covered but not enclosed.
It is assumed that all coal conveyor transfer stations will be acoustically enclosed.
It is understood that Perdaman have specified that all major compressor drives (>2MW) are to be acoustically treated to achieve 85 dB(A) at 1 metre.
It is assumed that the combined cycle gas turbine power station will be enclosed, with acoustic silencers fitted to the air inlet and the exhaust.
The urea storage shed is assumed to be of metal construction. In terms of external noise emissions, it is assumed that the building will adequately attenuate any noise sources inside the shed.
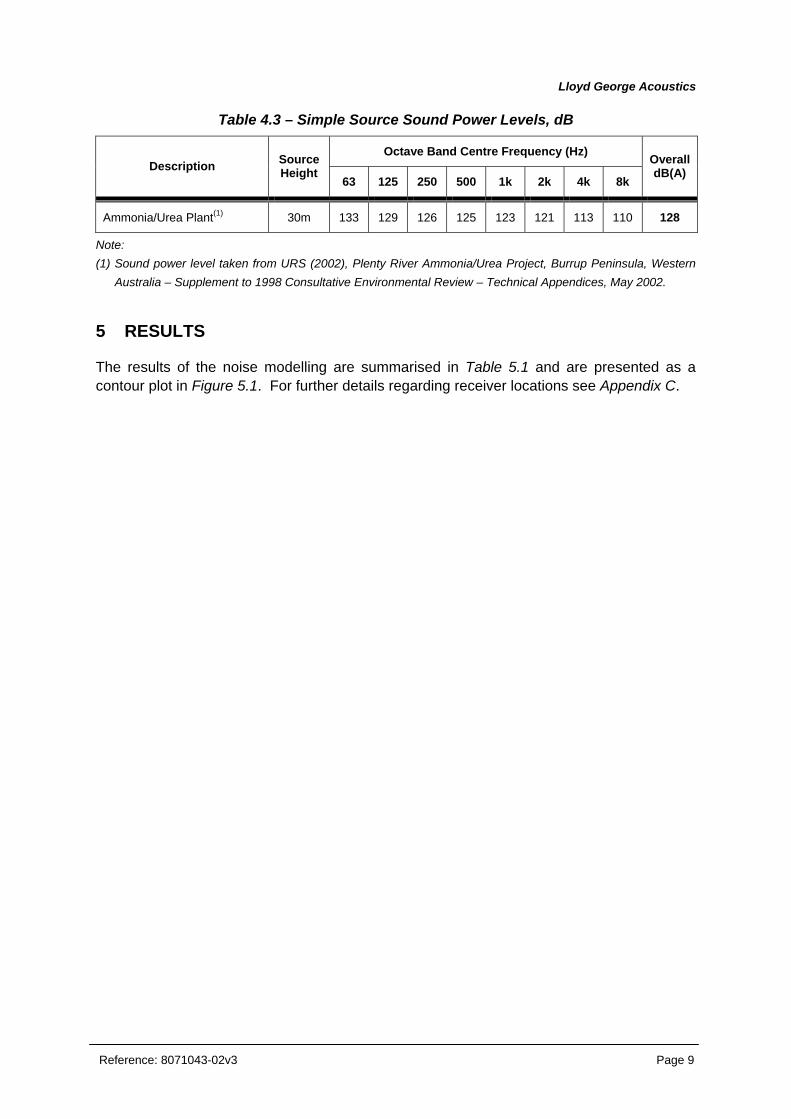
In order to confirm the predicted noise levels at far distant receiver points, the detailed noise model was benchmarked against the results of a simple noise model. The simple noise model used a single point source to represent all plant and equipment within the urea plant and one line source to represent the coal conveyor from the mine. The simple noise model employs the same methodology as that used for the Plenty River (later Dampier Nitrogen) proposed Ammonia/Urea Project noise assessment. The overall sound power level that was used in the simple noise model to represent the plant was 128 dB(A), as presented in Table 4.3.
Lloyd George Acoustics
Reference: 8071043-02v3 Page 9
Table 4.3 – Simple Source Sound Power Levels, dB
Octave Band Centre Frequency (Hz) Description Source
Height 63 125 250 500 1k 2k 4k 8k
Overall dB(A)
Ammonia/Urea Plant(1) 30m 133 129 126 125 123 121 113 110 128
Note: (1) Sound power level taken from URS (2002), Plenty River Ammonia/Urea Project, Burrup Peninsula, Western
Australia – Supplement to 1998 Consultative Environmental Review – Technical Appendices, May 2002.
5 RESULTS
The results of the noise modelling are summarised in Table 5.1 and are presented as a contour plot in Figure 5.1. For further details regarding receiver locations see Appendix C.

#29#30
#33
#38
#52#55
#57#56
#54
#67
#71#69
#72
#70
#75
#44#43
#63
#35
#36
#39
#41
#45
#48
Noise LevelsLA10 dB
< 3030 <= < 3535 <= < 4040 <= < 4545 <= < 5050 <= < 5555 <= < 6060 <= < 6565 <=
Lloyd George Acousticsby Michael [email protected](08) 9245 3223
Signs and symbolsPoint receiver
Point source
Line source
31 July 2009
Length Scale 1:6500000 0.3 0.6 1.2 1.8
km
Perdaman Collie Fertiliser Project - Plant OperationsPredicted LA10 Noise Level Contours - Wind From All Directions - Night Conditions
Figure 5.1

Lloyd George Acoustics
Reference: 8071043-02v3 Page 11
Table 5.1 – Summary of Noise Modelling, dB
Receiver No. Receiver Description(1) Predicted LA10 Noise Level
(Worst-Case Downwind)
1 Cluster of rural residences 11
2 Cluster of rural residences 15
3 Single rural residence 10
4 Cluster of rural residences 15
5 Single rural residence 14
6 Single rural residence 15
7 Single rural residence 17
8 Single rural residence 16
9 Single rural residence 12
10 Single rural residence 17
11 Single rural residence 18
12 Single rural residence 12
13 Single rural residence 12
14 Single rural residence 17
15 Single rural residence 18
16 Single rural residence 17
17 Single rural residence 16
18 Single rural residence 19
19 Single rural residence 17
20 Single rural residence 19
21 Cluster of rural residences 13
22 Cluster of rural residences 14
23 Cluster of rural residences 14
24 Cluster of rural residences 18
25 Single rural residence 20
26 Cluster of rural residences 17
27 Cluster of rural residences 15

Lloyd George Acoustics
Reference: 8071043-02v3 Page 12
Receiver No. Receiver Description(1) Predicted LA10 Noise Level
(Worst-Case Downwind)
28 Cluster of rural residences 13
29 Single rural residence 27
30 Single rural residence 26
31 Built up town area – Collie (northern extent) 18
32 Cluster of rural residences 15
33 Built up town area – Collie (north-eastern extent) 26
34 Built up town area – Collie (town centre) 19
35 Built up town area – Collie (eastern extent) 25
36 Potential rural residence 30
37 Single rural residence 24
38 Single rural residence 29
39 Potential rural residence 29
40 Single rural residence 17
41 Potential rural residence 30
42 Cluster of rural residences 25
43 Recreational – Stockton Pool 50
44 Single rural residence – Government land – Stockton Pool Caretaker Cottage 44
45 Potential rural residence 31
46 Single rural residence 26
47 Cluster of rural residences 19
48 Potential rural residence 30
49 Single rural residence 23
50 Cluster of rural residences 22
51 Single rural residence 27
52 Single rural residence 28
53 Single rural residence 23
54 Potential rural residence 41

Lloyd George Acoustics
Reference: 8071043-02v3 Page 13
Receiver No. Receiver Description(1) Predicted LA10 Noise Level
(Worst-Case Downwind)
55 Single rural residence 30
56 Single rural residence 35
57 Cluster of rural residences 28
58 Cluster of rural residences 22
59 Single rural residence 21
60 Single rural residence 20
61 Cluster of rural residences 20
62 Cluster of rural residences 17
63 Potential rural residence 45
64 Single rural residence 22
65 Cluster of rural residences 19
66 Cluster of rural residences 16
67 Cluster of rural residences 27
68 Single rural residence 19
69 Cluster of rural residences 24
70 Recreational – Collie Motorplex 34
71 Built up town area – Collie Burn 25
72 Single rural residence 26
73 Cluster of rural residences 18
74 Cluster of rural residences 17
75 Single rural residence 25
76 Cluster of rural residences 13
77 Single rural residence 14
78 Single rural residence 14
79 Cluster of rural residences 17
80 Built up town area - Cardiff 16
Note: (1) Refer to Appendix C for exact receiver location, given by easting and northing. Receiver information and
description provided by GHD.

Lloyd George Acoustics
Reference: 8071043-02v3 Page 14
When the results in Table 5.1 were compared to noise levels predicted using the simple noise model, the resultant noise levels at each receiver location were, on average, 2 dB lower (and ranging from 0 to 3 dB lower).
Noise levels were also predicted at the plant boundaries and are presented in Table 5.2.
Table 5.2 – Summary of Boundary Noise Predictions, dB
Receiver Location Predicted LA10 Noise Level
(Worst-Case Downwind)
Northern Plant Boundary 65
Eastern Plant Boundary 64
Southern Plant Boundary 65
Western Plant Boundary 60
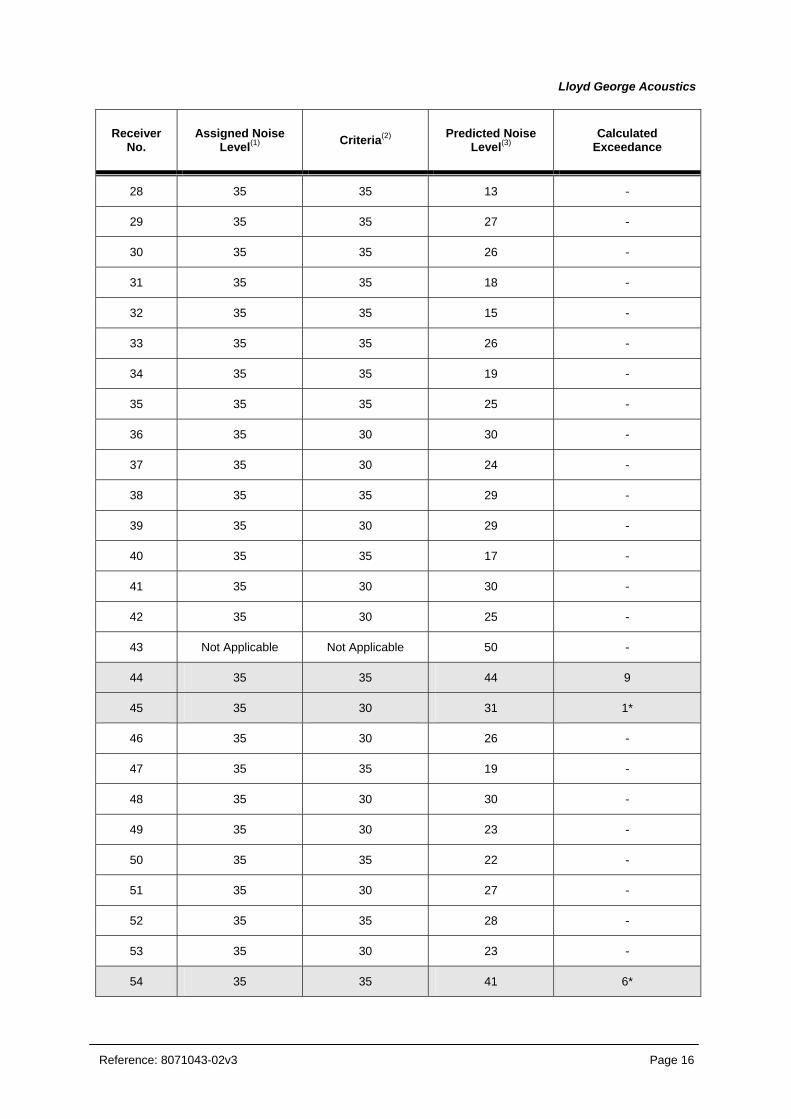
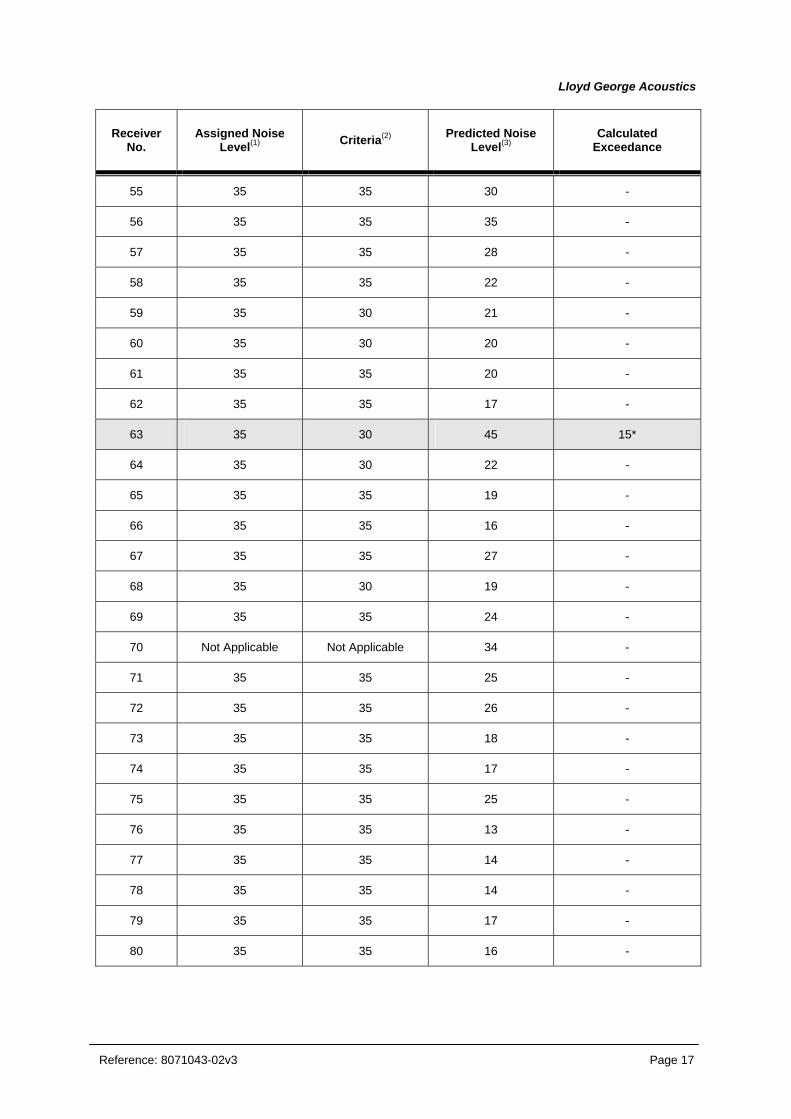
6 ASSESSMENT
Table 6.1 provides an assessment of the predicted noise levels in relation to the Regulations. As discussed in Section 3, there are some locations where the night time assigned levels are likely to be already exceeded by existing mining operations. In these instances the noise from the proposed Perdaman’s plant needs to be 5 dB below the assigned levels so as to not be considered a “significantly contributing” noise source.
As can be seen from Table 6.1, noise levels from Perdaman’s urea plant are predicted to exceed the noise criteria at four receiver locations. Of these locations, three are not known to contain any existing dwellings and are identified only as potential residential locations. The other location (receiver #44) is a caretaker’s cottage at Stockton Pool, where the assigned level for noise sensitive premises is predicted to be exceeded by 9 dB.

Lloyd George Acoustics
Reference: 8071043-02v3 Page 15
Table 6.1 – Assessment of Predicted LA10 Noise Levels, dB
Receiver No.
Assigned Noise Level(1) Criteria(2) Predicted Noise
Level(3)Calculated
Exceedance
1 35 35 11 -
2 35 35 15 -
3 35 35 10 -
4 35 35 15 -
5 35 35 14 -
6 35 35 15 -
7 35 35 17 -
8 35 35 16 -
9 35 35 12 -
10 35 35 17 -
11 35 35 18 -
12 35 35 12 -
13 35 35 12 -
14 35 35 17 -
15 35 35 18 -
16 35 35 17 -
17 35 35 16 -
18 35 35 19 -
19 35 35 17 -
20 35 35 19 -
21 35 35 13 -
22 35 35 14 -
23 35 35 14 -
24 35 35 18 -
25 35 35 20 -
26 35 35 17 -
27 35 35 15 -
Lloyd George Acoustics
Reference: 8071043-02v3 Page 16
Receiver No.
Assigned Noise Level(1) Criteria(2) Predicted Noise
Level(3)Calculated
Exceedance
28 35 35 13 -
29 35 35 27 -
30 35 35 26 -
31 35 35 18 -
32 35 35 15 -
33 35 35 26 -
34 35 35 19 -
35 35 35 25 -
36 35 30 30 -
37 35 30 24 -
38 35 35 29 -
39 35 30 29 -
40 35 35 17 -
41 35 30 30 -
42 35 30 25 -
43 Not Applicable Not Applicable 50 -
44 35 35 44 9
45 35 30 31 1*
46 35 30 26 -
47 35 35 19 -
48 35 30 30 -
49 35 30 23 -
50 35 35 22 -
51 35 30 27 -
52 35 35 28 -
53 35 30 23 -
54 35 35 41 6*
Lloyd George Acoustics
Reference: 8071043-02v3 Page 17
Receiver No.
Assigned Noise Level(1) Criteria(2) Predicted Noise
Level(3)Calculated
Exceedance
55 35 35 30 -
56 35 35 35 -
57 35 35 28 -
58 35 35 22 -
59 35 30 21 -
60 35 30 20 -
61 35 35 20 -
62 35 35 17 -
63 35 30 45 15*
64 35 30 22 -
65 35 35 19 -
66 35 35 16 -
67 35 35 27 -
68 35 30 19 -
69 35 35 24 -
70 Not Applicable Not Applicable 34 -
71 35 35 25 -
72 35 35 26 -
73 35 35 18 -
74 35 35 17 -
75 35 35 25 -
76 35 35 13 -
77 35 35 14 -
78 35 35 14 -
79 35 35 17 -
80 35 35 16 -

Lloyd George Acoustics
Reference: 8071043-02v3 Page 18
Notes to Table 6.1: (1) The assigned noise level is the night time assigned level, as defined in Table 3.3. (2) Adjusted by -5 dB for a ”significantly contributing” noise source, where applicable. (3) From Table 5.1. (4) Shaded rows indicate that the predicted noise level exceeds the criteria for this receiver location. (5) The symbol * indicates that whilst noise levels are predicted to exceed the criteria at this location, there is
currently no known residential dwelling on this premises. The receiver location represents a potential residential premises. Should residential development occur on this land then compliance issues may arise.
6.1 Noise Levels at Existing Noise Sensitive Premises Noise levels from the urea plant are predicted to comply with the noise regulations at all existing noise sensitive premises, with the exception of the caretaker’s cottage at Stockton Pool. It is understood that the caretaker’s cottage is currently being used as a residence and therefore warrants protection from noise commensurate with this use.
In addressing this issue, the initial focus should be on reducing noise at the caretaker’s cottage to as low as is reasonably practicable, during the detailed engineering design phase of the plant. Notwithstanding that, Perdaman’s may need to consider acoustic treatment of this cottage or the provision of alternative accommodation for the caretaker, to address any residual non-compliance.
Given the significant distances to existing residences, noise from the urea plant is likely to be at or below the existing background noise environment. Where background noise levels were monitored, in Buckingham and Cardiff, the existing background noise level can be compared to the predicted noise level from the urea plant. This comparison is provided in Table 6.2.
Table 6.2 – Comparison of Predicted Versus Existing Noise Levels, dB
Night Time Noise Level
Receiver No. Receiver Location Existing LA90 Noise Level(1)
Predicted LA10 Noise Level from Urea Plant(2)
46 River Road, Buckingham 31 26
80 Cherry Street, Cardiff ≤19 16
Notes: (1) From Table 2.1 (2) From Table 5.1.
6.2 Noise Levels at Potential Residential Premises Three locations (receivers #45, #54 and #63) were identified as posing potential future compliance risks for this proposal. These locations represent privately owned land where residential development could potentially proceed. Should residences be built at these locations then it is predicted that noise from the plant would exceed the Regulations.
Receiver #63 is located to the south-east of the plant and is in close proximity to the proposed alignment for the coal conveyor. Noise levels are predicted to exceed the

Lloyd George Acoustics
Reference: 8071043-02v3 Page 19
allowable level by 16 dB, should residential development occur at this site. Receiver #54 is to the south-west of the plant and is predicted to exceed by 6 dB. Receiver #45 is to the east and is predicted to exceed by 1 dB.
Mitigation of this risk forms part of the broader industrial buffer study for the Shotts Industrial Park and should be managed through this process. This buffer study will allow other risk factors to be considered, beyond just noise. Suitable protections should be put in place to ensure that residential encroachment does not compromise either the viability of the proposed industrial development or future residential amenity. It is expected that resolution of this issue will require ongoing negotiation between Perdaman, the State Government, the Shire and affected landholders.
As input to this buffer study, noise levels were predicted at distances of 2km and 3km from the centre of the urea plant site. Predicted noise levels at these notional buffer distances are presented in Table 6.3.
Table 6.3 – Predicted Noise Levels at Notional Buffer Distances
Predicted LA10 Noise Level
(Worst-Case Downwind) Direction from Plant
2km from Plant(1) 3km from Plant(1)
North 40 37
East 44 39
South 46 42
West 44 37
Note: (1) Distances are measured from the centre of the plant site.
6.3 Noise Levels at Stockton Pool Stockton Pool is an artificial lake created from an old, disused mining void. It is a popular water recreation facility, used predominantly by the local community for water skiing and camping. Alongside Stockton Pool is the Collie Motorcycle Club’s Stockton Park motocross circuit.
It should be noted that
Stockton Pool and its surrounds is a rehabilitated mine site;
Stockton Pool is an artificial lake and is not known to hold any significant, natural environmental value;
Stockton Pool lies in proximity to existing industrial activity; and
Lloyd George Acoustics
Reference: 8071043-02v3 Page 20
The Stockton Pool recreation area is commonly used for noisy human activities, such as water skiing and motocross.
Given this, it is considered that Stockton Pool does not warrant special protection from noise, as natural quiet is not part of the intrinsic value of this place.
Noise levels from the plant are predicted to be 50 dB(A) at Stockton Pool (receiver #43). Although noise from the urea plant is likely to be clearly audible at this location, it is considered that, at this noise level, the recreational value of Stockton Pool will not be compromised.
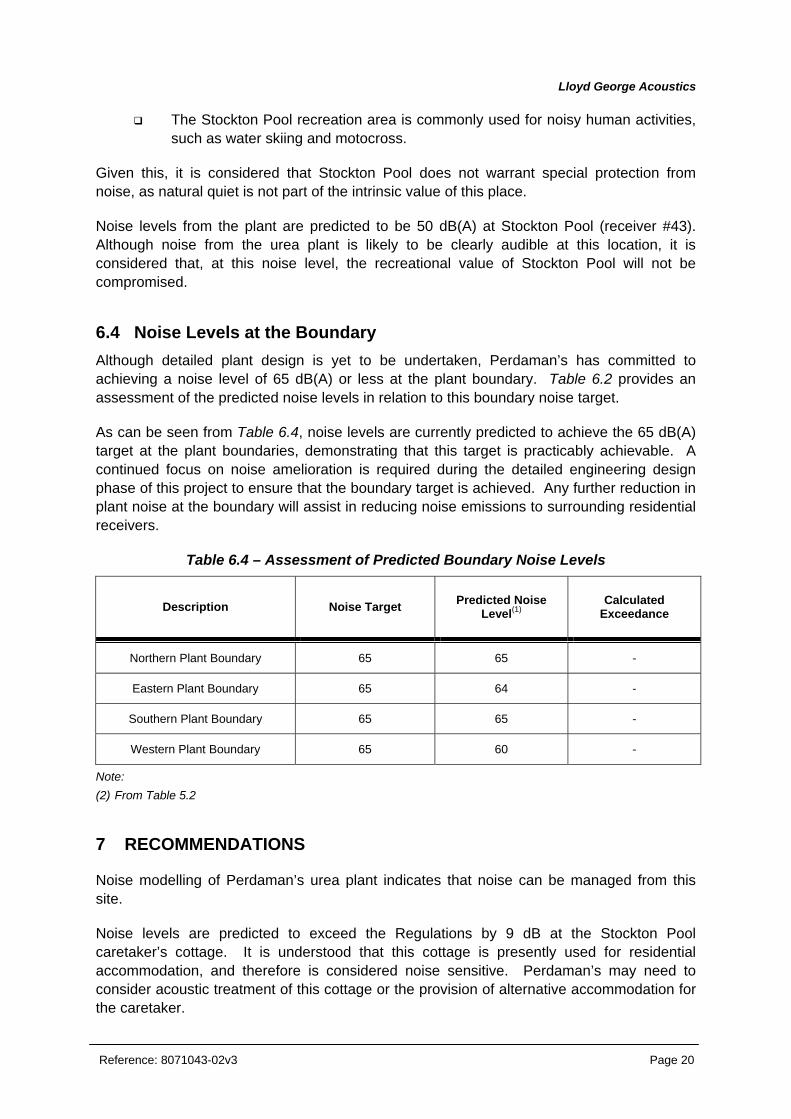
6.4 Noise Levels at the Boundary Although detailed plant design is yet to be undertaken, Perdaman’s has committed to achieving a noise level of 65 dB(A) or less at the plant boundary. Table 6.2 provides an assessment of the predicted noise levels in relation to this boundary noise target.
As can be seen from Table 6.4, noise levels are currently predicted to achieve the 65 dB(A) target at the plant boundaries, demonstrating that this target is practicably achievable. A continued focus on noise amelioration is required during the detailed engineering design phase of this project to ensure that the boundary target is achieved. Any further reduction in plant noise at the boundary will assist in reducing noise emissions to surrounding residential receivers.
Table 6.4 – Assessment of Predicted Boundary Noise Levels
Description Noise Target Predicted Noise Level(1)
Calculated Exceedance
Northern Plant Boundary 65 65 -
Eastern Plant Boundary 65 64 -
Southern Plant Boundary 65 65 -
Western Plant Boundary 65 60 -
Note: (2) From Table 5.2
7 RECOMMENDATIONS
Noise modelling of Perdaman’s urea plant indicates that noise can be managed from this site.
Noise levels are predicted to exceed the Regulations by 9 dB at the Stockton Pool caretaker’s cottage. It is understood that this cottage is presently used for residential accommodation, and therefore is considered noise sensitive. Perdaman’s may need to consider acoustic treatment of this cottage or the provision of alternative accommodation for the caretaker.

Lloyd George Acoustics
Reference: 8071043-02v3 Page 21
There are also some surrounding premises where future residential development could potentially create compliance issues for Perdaman. It is recommended that this issue be addressed through the Shotts Industrial Park buffer study and that suitable protections be put in place to ensure that residential encroachment does not compromise either the viability of the proposed industrial development or future residential amenity. It is expected that resolution of this issue will require ongoing negotiation between Perdaman, the State Government, the Shire and affected landholders.
Otherwise noise levels at all other receiver locations are predicted to comply with the Regulations.
Noise levels are currently predicted to comply with Perdaman’s noise target of 65 dB(A) at the plant boundaries. A continued focus on noise amelioration is required during the detailed engineering design phase of this project to ensure that the boundary target is achieved. Any further reduction in plant noise at the boundary will assist in reducing noise emissions to surrounding residential receivers.
As these predicted noise levels in this study are based on preliminary plant design and indicative sound power levels, they should be confirmed through subsequent noise modelling, as the detailed plant design progresses. Noise reduction measures should be investigated through the detailed engineering design phase to ensure that noise emissions are kept as low as is reasonably practicable.

Lloyd George Acoustics
APPENDIX A
Site Location

Lloyd George Acoustics
Reference: 8071043-02v3 Page A1

Lloyd George Acoustics
APPENDIX B
Background Noise Monitoring Details
Lloyd George Acoustics
Reference: 8071043-02
Background Noise Monitoring ResultsRiver Road, Buckingham
0
10
20
30
40
50
60
70
80
90
100
0:00
8:00
16:00 0:0
0
8:00
16:00 0:0
0
8:00
16:00 0:0
0
8:00
16:00 0:0
0
8:00
16:00 0:0
0
8:00
16:00 0:0
0
8:00
16:00 0:0
0
Date / Time
Soun
d Pr
essu
re L
evel
, dB
(A)
L1 L10 L90
11 June 2009 12 June 2009 13 June 2009 14 June 2009 15 June 2009 16 June 2009 17 June 2009

Lloyd George Acoustics
Reference: 8071043-02
Background Noise Monitoring ResultsRiver Road, Buckingham
0
10
20
30
40
50
60
70
80
90
100
0:00
8:00
16:00 0:0
0
8:00
16:00 0:0
0
8:00
16:00 0:0
0
8:00
16:00 0:0
0
8:00
16:00 0:0
0
8:00
16:00 0:0
0
8:00
16:00
Date / Time
Soun
d Pr
essu
re L
evel
, dB
(A)
L1 L10 L90
18 June 2009 19 June 2009 20 June 2009 21 June 2009 22 June 2009 23 June 2009

Lloyd George Acoustics
Reference: 8071043-02
Background Noise Monitoring ResultsCherry Street, Cardiff
0
10
20
30
40
50
60
70
80
90
100
0:00
8:00
16:00 0:0
0
8:00
16:00 0:0
0
8:00
16:00 0:0
0
8:00
16:00 0:0
0
8:00
16:00 0:0
0
8:00
16:00 0:0
0
8:00
16:00
Date / Time
Soun
d Pr
essu
re L
evel
, dB
(A)
L1 L10 L90
11 June 2009 12 June 2009 13 June 2009 14 June 2009 15 June 2009 16 June 2009 17 June 2009

Lloyd George Acoustics
Reference: 8071043-02
Collie East Weather Observations11 to 22 June 2009
0
10
20
30
40
50
60
70
80
90
100
080
016
00 080
016
00 080
016
00 080
016
00 080
016
00 080
016
00 080
016
00 080
016
00 080
016
00 080
016
00 080
016
00 080
016
00 0
Time
Air
Tem
pera
ture
(°C
) / R
elat
ive
Hum
idty
(%)
0
2
4
6
8
10
12
14
16
18
20
Hou
rly P
reci
pita
tion
(mm
)
Precipitation Air Temperature Relative Humidity

Lloyd George Acoustics
Reference: 8071043-02
Collie East Weather Observations11 to 22 June 2009
0
10
20
30
40
50
60
70
80
90
100
080
016
00 080
016
00 080
016
00 080
016
00 080
016
00 080
016
00 080
016
00 080
016
00 080
016
00 080
016
00 080
016
00 080
016
00 0
Time
Win
d Sp
eed
(km
/hr)
0
90
180
270
360
Win
d D
irect
ion
(deg
rees
)
Wind Direction Wind Speed 10 m/s 5 m/s

Lloyd George Acoustics
APPENDIX C
Receiver Locations
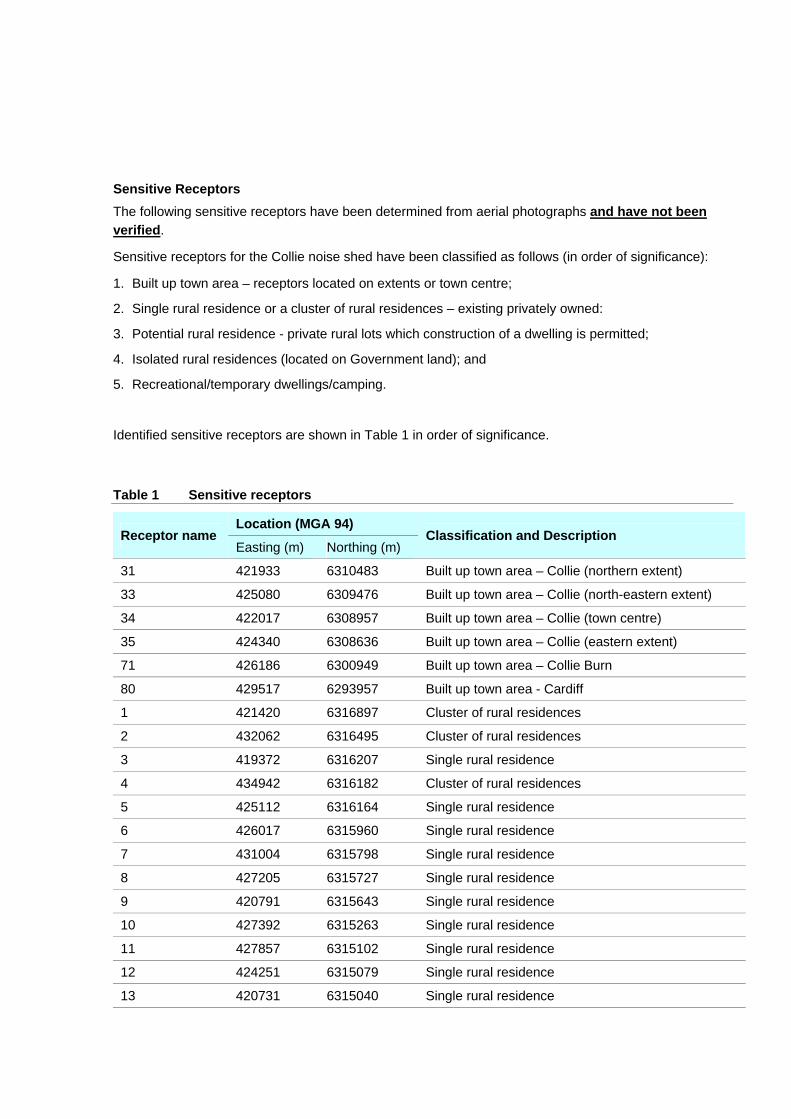
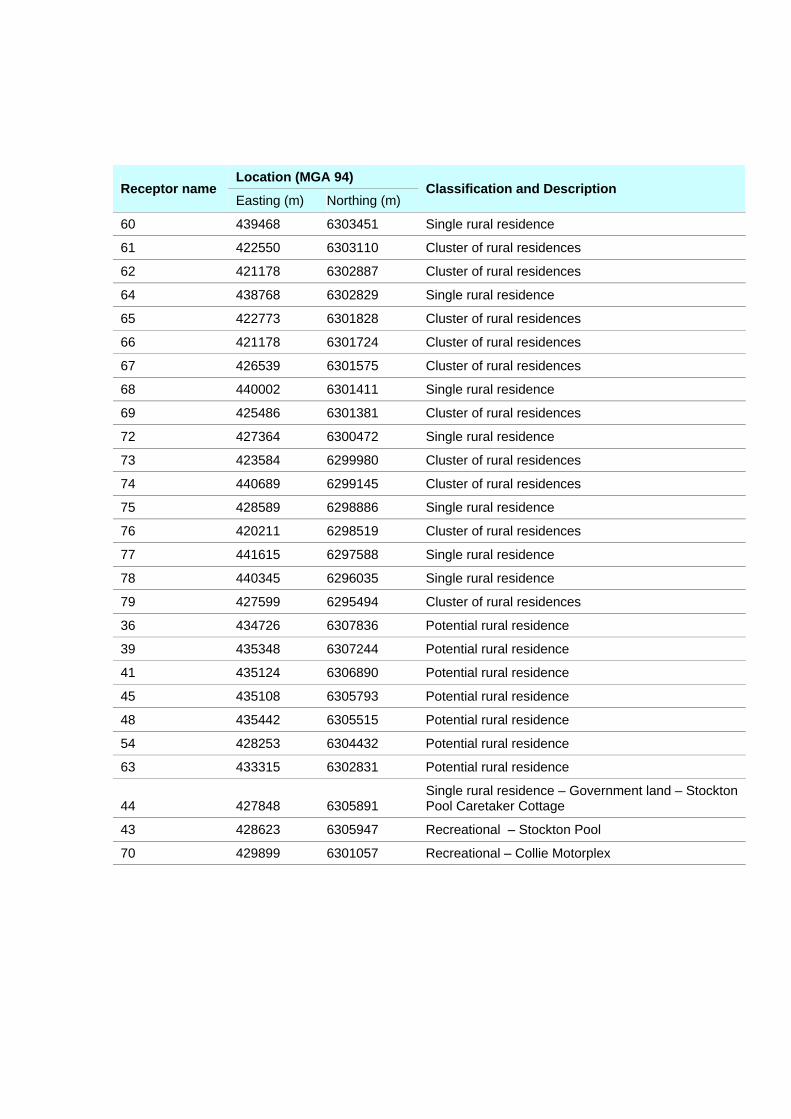
Sensitive Receptors The following sensitive receptors have been determined from aerial photographs and have not been verified.
Sensitive receptors for the Collie noise shed have been classified as follows (in order of significance):
1. Built up town area – receptors located on extents or town centre;
2. Single rural residence or a cluster of rural residences – existing privately owned:
3. Potential rural residence - private rural lots which construction of a dwelling is permitted;
4. Isolated rural residences (located on Government land); and
5. Recreational/temporary dwellings/camping.
Identified sensitive receptors are shown in Table 1 in order of significance.
Table 1 Sensitive receptors
Location (MGA 94) Receptor name
Easting (m) Northing (m) Classification and Description
31 421933 6310483 Built up town area – Collie (northern extent)
33 425080 6309476 Built up town area – Collie (north-eastern extent)
34 422017 6308957 Built up town area – Collie (town centre)
35 424340 6308636 Built up town area – Collie (eastern extent)
71 426186 6300949 Built up town area – Collie Burn
80 429517 6293957 Built up town area - Cardiff
1 421420 6316897 Cluster of rural residences
2 432062 6316495 Cluster of rural residences
3 419372 6316207 Single rural residence
4 434942 6316182 Cluster of rural residences
5 425112 6316164 Single rural residence
6 426017 6315960 Single rural residence
7 431004 6315798 Single rural residence
8 427205 6315727 Single rural residence
9 420791 6315643 Single rural residence
10 427392 6315263 Single rural residence
11 427857 6315102 Single rural residence
12 424251 6315079 Single rural residence
13 420731 6315040 Single rural residence

Location (MGA 94) Receptor name
Easting (m) Northing (m) Classification and Description
14 433660 6315038 Single rural residence
15 432002 6314930 Single rural residence
16 425692 6314810 Single rural residence
17 434547 6314752 Single rural residence
18 432812 6314586 Single rural residence
19 424654 6314158 Single rural residence
20 432809 6314124 Single rural residence
21 420405 6313395 Cluster of rural residences
22 420166 6312366 Cluster of rural residences
23 440062 6312083 Cluster of rural residences
24 422870 6311681 Cluster of rural residences
25 424211 6311574 Single rural residence
26 421793 6311502 Cluster of rural residences
27 420450 6311382 Cluster of rural residences
28 419136 6311219 Cluster of rural residences
29 426776 6310814 Single rural residence
30 425995 6310785 Single rural residence
32 420092 6309713 Cluster of rural residences
37 436871 6307563 Single rural residence
38 424941 6307495 Single rural residence
40 420284 6307156 Single rural residence
42 436554 6306732 Cluster of rural residences
46 436895 6305603 Single rural residence
47 421581 6305584 Cluster of rural residences
49 437831 6305098 Single rural residence
50 422728 6305018 Cluster of rural residences
51 436690 6304860 Single rural residence
52 424845 6304765 Single rural residence
53 438252 6304532 Single rural residence
55 425709 6304407 Single rural residence
56 427129 6304076 Single rural residence
57 425054 6303960 Cluster of rural residences
58 423130 6303836 Cluster of rural residences
59 438934 6303531 Single rural residence
Location (MGA 94) Receptor name
Easting (m) Northing (m) Classification and Description
60 439468 6303451 Single rural residence
61 422550 6303110 Cluster of rural residences
62 421178 6302887 Cluster of rural residences
64 438768 6302829 Single rural residence
65 422773 6301828 Cluster of rural residences
66 421178 6301724 Cluster of rural residences
67 426539 6301575 Cluster of rural residences
68 440002 6301411 Single rural residence
69 425486 6301381 Cluster of rural residences
72 427364 6300472 Single rural residence
73 423584 6299980 Cluster of rural residences
74 440689 6299145 Cluster of rural residences
75 428589 6298886 Single rural residence
76 420211 6298519 Cluster of rural residences
77 441615 6297588 Single rural residence
78 440345 6296035 Single rural residence
79 427599 6295494 Cluster of rural residences
36 434726 6307836 Potential rural residence
39 435348 6307244 Potential rural residence
41 435124 6306890 Potential rural residence
45 435108 6305793 Potential rural residence
48 435442 6305515 Potential rural residence
54 428253 6304432 Potential rural residence
63 433315 6302831 Potential rural residence
44 427848 6305891 Single rural residence – Government land – Stockton Pool Caretaker Cottage
43 428623 6305947 Recreational – Stockton Pool
70 429899 6301057 Recreational – Collie Motorplex
Lloyd George Acoustics
APPENDIX D
Plant Layout


Wastewater ponds
ASU 90 x 100
NH385 x 50
NH3 tnk
/Urea 2
80 x 55Urea
1
Urea shed200 x 70
Rail loading
Power Island90 x 100
transform
Flare
Fire waterControl
laboffice workshop
Coal pile150 x 90Gasifier
1 & 2
110 x 45
Coal prep70 x 35
Ash water treatment80 x 30
Shift60 x 40
Acid G
as Recovery120 x 60N
WU
Sulphur50 x30
CO2
park
CW
Chemtanks
utils
CW
hold
N
Revised areas Oct 08
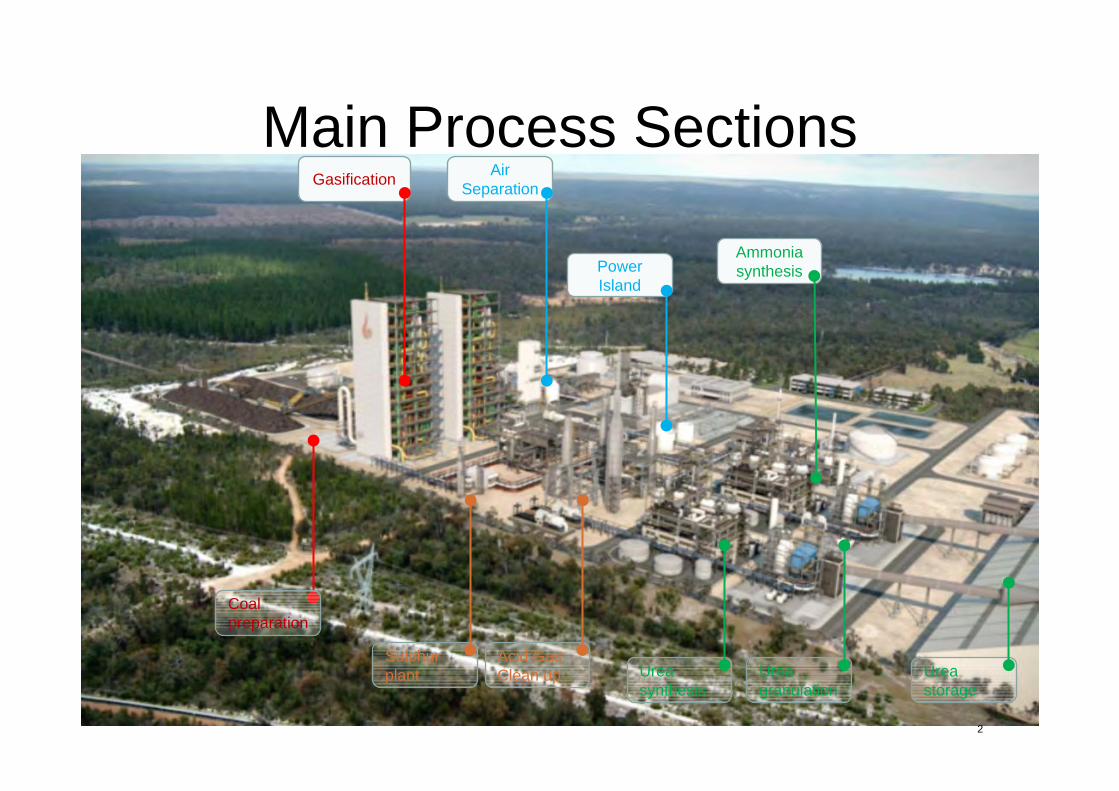
Main Process SectionsAir
SeparationGasification
Coal preparation
Acid Gas Clean up
Ammoniasynthesis
Urea synthesis
Urea granulation
Power Island
Sulphur plant Urea
storage
2

APPENDIX E
Terminology

Reference: 8071043-02v3 Page C1
The following is an explanation of the terminology used throughout this report.
Decibel (dB)
The decibel is the unit that describes the sound pressure and sound power levels of a noise source. It is a logarithmic scale referenced to the threshold of hearing.
A-Weighting
An A-weighted noise level has been filtered in such a way as to represent the way in which the human ear perceives sound. This weighting reflects the fact that the human ear is not as sensitive to lower frequencies as it is to higher frequencies. An A-weighted sound level is described as LA dB.
Sound Power Level (Lw) Under normal conditions, a given sound source will radiate the same amount of energy, irrespective of its surroundings, being the sound power level. This is similar to a 1kW electric heater always radiating 1kW of heat. The sound power level of a noise source cannot be directly measured using a sound level meter but is calculated based on measured sound pressure levels at known distances. Noise modelling incorporates source sound power levels as part of the input data.
Sound Pressure Level (Lp) The sound pressure level of a noise source is dependent upon its surroundings, being influenced by distance, ground absorption, topography, meteorological conditions etc and is what the human ear actually hears. Using the electric heater analogy above, the heat will vary depending upon where the heater is located, just as the sound pressure level will vary depending on the surroundings. Noise modelling predicts the sound pressure level from the sound power levels taking into account ground absorption, barrier effects, distance etc.
LASlow
This is the noise level in decibels, obtained using the A frequency weighting and the S time weighting as specified in AS1259.1-1990. Unless assessing modulation, all measurements use the slow time weighting characteristic.
LAFast
This is the noise level in decibels, obtained using the A frequency weighting and the F time weighting as specified in AS1259.1-1990. This is used when assessing the presence of modulation only.
LAPeak
This is the maximum reading in decibels using the A frequency weighting and P time weighting AS1259.1-1990.
LAmax
An LAmax level is the maximum A-weighted noise level during a particular measurement.
LA1
An LA1 level is the A-weighted noise level which is exceeded for one percent of the measurement period and is considered to represent the average of the maximum noise levels measured.
Reference: 8071043-02v3 Page C2
LA10
An LA10 level is the A-weighted noise level which is exceeded for 10 percent of the measurement period and is considered to represent the “intrusive” noise level.
LAeq
The equivalent steady state A-weighted sound level (“equal energy”) in decibels which, in a specified time period, contains the same acoustic energy as the time-varying level during the same period. It is considered to represent the “average” noise level.
LA90
An LA90 level is the A-weighted noise level which is exceeded for 90 percent of the measurement period and is considered to represent the “background” noise level.
One-Third-Octave Band Means a band of frequencies spanning one-third of an octave and having a centre frequency between 25 Hz and 20 000 Hz inclusive.
LAmax assigned level Means an assigned level which, measured as a LA Slow value, is not to be exceeded at any time. LA1 assigned level Means an assigned level which, measured as a LA Slow value, is not to be exceeded for more than 1% of the representative assessment period.
LA10 assigned level Means an assigned level which, measured as a LA Slow value, is not to be exceeded for more than 10% of the representative assessment period.
Tonal Noise A tonal noise source can be described as a source that has a distinctive noise emission in one or more frequencies. An example would be whining or droning. The quantitative definition of tonality is:
the presence in the noise emission of tonal characteristics where the difference between —
(a) the A-weighted sound pressure level in any one-third octave band; and
(b) the arithmetic average of the A-weighted sound pressure levels in the 2 adjacent one-third octave bands,
is greater than 3 dB when the sound pressure levels are determined as LAeq,T levels where the time period T is greater than 10% of the representative assessment period, or greater than 8 dB at any time when the sound pressure levels are determined as LA Slow levels.
This is relatively common in most noise sources.
Reference: 8071043-02v3 Page C3
Modulating Noise A modulating source is regular, cyclic and audible and is present for at least 10% of the measurement period. The quantitative definition of tonality is:
a variation in the emission of noise that —
(a) is more than 3 dB LA Fast or is more than 3 dB LA Fast in any one-third octave band;
(b) is present for at least 10% of the representative
Impulsive Noise An impulsive noise source has a short-term banging, clunking or explosive sound. The quantitative definition of tonality is:
a variation in the emission of a noise where the difference between LA peak and LA Max slow is more than 15 dB when determined for a single representative event;
Major Road
Is a road with an estimated average daily traffic count of more than 15,000 vehicles.
Secondary / Minor Road
Is a road with an estimated average daily traffic count of between 6,000 and 15,000 vehicles.
Influencing factor
( ) ( )
100m within roadmajor each for 6450m within roadmajor each for 2
100m within roadsecondary each for 2 dB) 6 of (maximumFactor Traffic
noise thereceiving premises theof radius 450m a within land commercial of percentage the%TypeB
noise thereceiving premises theof radius a100m within land commercial of percentage theB Type %
noise thereceiving premises theof radius 450m a within land industrial of percentage the%TypeA
noise thereceiving premises theof radius a100m withinland industrial of percentage theA Type %
:
B Type %B Type %20
A Type %A Type %10
450
100
450
100
450100450100
===+
=
=
=
=
+++=
where
11
Representative Assessment Period
Means a period of time not less than 15 minutes, and not exceeding four hours, determined by an inspector or authorised person to be appropriate for the assessment of a noise emission, having regard to the type and nature of the noise emission.

Reference: 8071043-02v3 Page C4
Background Noise Background noise or residual noise is the noise level from sources other than the source of concern. When measuring environmental noise, residual sound is often a problem. One reason is that regulations often require that the noise from different types of sources be dealt with separately. This separation, e.g. of traffic noise from industrial noise, is often difficult to accomplish in practice. Another reason is that the measurements are normally carried out outdoors. Wind-induced noise, directly on the microphone and indirectly on trees, buildings, etc., may also affect the result. The character of these noise sources can make it difficult or even impossible to carry out any corrections.
Ambient Noise Means the level of noise from all sources, including background noise from near and far and the source of interest.
Specific Noise Relates to the component of the ambient noise that is of interest. This can be referred to as the noise of concern or the noise of interest.
Satisfactory Design Sound Level The level of noise that has been found to be acceptable by most people for the environment in question and also to be not intrusive.
Maximum Design Sound Level The level of noise above which most people occupying the space start to become dissatisfied with the level of noise.
Reverberation Time Of an enclosure, for a sound of a given frequency or frequency band, the time that would be required for the reverberantly decaying sound pressure level in the enclosure to decrease by 60 decibels.
RMS The root mean square level. This is used to represent the average level of a wave form such as vibration.
Vibration Velocity Level The RMS velocity of a vibration source over a specified time period. Units are mm/s.
Peak Velocity Level of vibration velocity measured as a non root mean square (r.m.s.) quantity in millimetres per second (mm/s).

Reference: 8071043-02v3 Page C5
Chart of Noise Level Descriptors
Typical Noise Levels
Noise Impact Assessment
Prepared For
GHD
September 2009
Reference: 8071043-01
GEORGE
LLOYD
Acoustics
Perdaman Collie Urea Project
Bunbury Port Operations

Report: 8071043-01
Lloyd George Acoustics Pty Ltd ABN: 79 125 812 544
PO Box 717 Hillarys WA 6923
Offices: Ocean Reef Padbury Scarborough Waterford
Phone: Fax:
Email: Mobile:
9300 4188 9300 4199 [email protected]
0439 032 844
9401 7770 9401 7770 [email protected]
0400 414 197
9245 3223 9300 4199 [email protected]
0438 201 071
9313 3655 9300 4199 [email protected]
0427 388 876
Member of the Association of Australian Acoustical Consultants – (AAAC)
This report has been prepared in accordance with the scope of services described in the contract or agreement between Lloyd George Acoustics Pty Ltd and the Client. The report relies upon data, surveys, measurements and results taken at or under the particular times and conditions specified herein. Any findings, conclusions or recommendations only apply to the aforementioned circumstances and no greater reliance should be assumed or drawn by the Client. Furthermore, the report has been prepared solely for use by the Client, and Lloyd George Acoustics Pty Ltd accepts no responsibility for its use by other parties.
Approved for Issue: Daniel Lloyd
Position: Project Director
Verified Michael Cake
Date: 18 September 2009
Lloyd George Acoustics
CONTENTS
1 INTRODUCTION ............................................................................................................. 1
2 EXISTING NOISE ENVIRONMENT ................................................................................ 1
3 CRITERIA ........................................................................................................................ 3
3.1 Port Operations ....................................................................................................... 3
3.2 Transportation Noise ............................................................................................... 5
4 NOISE MODELLING METHODOLOGY .......................................................................... 5
4.1.1 Meteorological Information .................................................................................. 6
4.1.2 Topographical Data ............................................................................................. 6
4.1.3 Ground Absorption .............................................................................................. 6
4.1.4 Source Sound Levels .......................................................................................... 6
5 RESULTS ........................................................................................................................ 8
6 ASSESSMENT .............................................................................................................. 12
6.1 LA10 Noise Levels ................................................................................................... 12
6.2 LA1 Noise Levels .................................................................................................... 14
6.3 LAmax Noise Levels ................................................................................................. 14
6.4 Transportation Noise Levels.................................................................................. 15
6.5 Port Noise.............................................................................................................. 15
7 RECOMMENDATIONS ................................................................................................. 15
APPENDICES
A Site Location
B Background Noise Monitoring Details
C Terminology

Lloyd George Acoustics
Reference: 8071043-01v3 Page 1
1 INTRODUCTION
Perdaman Chemicals and Fertilisers (Perdaman) are developing a urea manufacturing plant to be located within the Shotts Industrial Park in the Collie region of Western Australia.
The plant will use a coal gasification process to transform sub-bituminous coal into urea.
The urea will then be transported via rail to the Port of Bunbury, where it will be stockpiled within a large storage shed, before being loaded onto ships via a series of conveyors and shiploaders.
This report is limited to the assessment of the noise impacts from the Port of Bunbury operations. It includes the train unloading, stockpiling of materials and loading of the urea into ships. The location of the operation is shown in Appendix A.
The results of the assessment are compared against the relevant criteria and noise control recommended in broad terms where these criteria are exceeded.
Appendix C contains a description of some of the terminology used throughout this report.
2 EXISTING NOISE ENVIRONMENT
Measurements of the existing noise environment were carried out over the period 10 to 22 June 2009. Noise monitoring was conducted at two residential premises surrounding the Bunbury Port. The measurement locations are considered representative of the nearest residential premises to the port developments associated with this project.
Noise monitoring was carried out in accordance with the draft EPA Guidance for the Assessment of Environmental Factors No. 8 – Environmental Noise (May 2007). Ambient noise levels were continuously measured using automatic noise data loggers, with the sampling period set to 15-minutes duration. Various statistical noise levels were recorded.
From this noise level data the 90th percentile of the LA90 noise levels was determined, for each day of measurement, over the following periods:
Day – 0700 to 1900 hours;
Evening – 1900 to 2200 hours; and
Night – 2200 to 0700 hours;
These values represent the quietest background noise level during each time period.
The calculated 90th percentile values were then averaged and the mean reported for each site. Where more than a weeks worth of data was collected the quietest levels recorded over 7 days were reported.

Lloyd George Acoustics
Reference: 8071043-01v3 Page 2
It must be noted that these measurements only provide a snapshot of the existing noise environment. They do not, for example, capture any possible variation in background noise levels during different seasons. Nevertheless they are considered to provide a reasonable estimation of the typical background noise environment at representative residential locations.
It is proposed that the urea product will be transported to the Port of Bunbury’s Inner Harbour via rail, where it will be loaded onto ships at Berth 5. The Port of Bunbury is currently a busy operating facility with more than 13 million tonnes handled annually. The main exports through the Port are alumina, woodchips and mineral sands, with caustic soda the chief import.
The closest residences are south-west of the Port, in the suburbs of East Bunbury and Bunbury. However, the residents immediately adjacent the Port are located alongside the busy Koombana Drive (one of the primary roads into the Bunbury city centre) and so these premises are subject to significant levels of traffic noise, as well as noise from the Port.
On the opposite side of the Port, to the north-east, are residences in Pelican Point. Houses within the Pelican Point Estate that face Vittoria Bay tend to be well shielded from traffic noise along Estuary Drive, however, they are also more exposed to noise from the Port, particularly when the wind is blowing from the west.
Noise monitoring was carried out in both East Bunbury and Pelican Point, with the results presented in Table 2.1.
Table 2.1 – Background Noise Levels – Bunbury
Average 90th Percentile of the LA90 Levels, dB(A)
Measurement Location Day
0700 – 1900
Evening
1900 – 2200
Night
2200 – 0700
Oliver Street, East Bunbury 50 43 40
Kendle Close, Pelican Point 42 42 39
With the exception of day time noise levels in Oliver Street, which were dominated by traffic noise from Koombana Drive, background noise levels at both locations were found to be in the range 39 to 43 dB(A). The existing noise environment in areas surrounding the Port is likely to be, at least, partly influenced by noise from Port operations. For residences alongside busy major roads, noise from the Port of Bunbury is likely to be masked by traffic noise during the daytime period.
Full details of monitoring results and meteorological conditions during the measurement period are presented in Appendix B.

Lloyd George Acoustics
Reference: 8071043-01v3 Page 3
3 CRITERIA
3.1 Port Operations Environmental noise in Western Australia is governed by the Environmental Protection Act 1986 and the Environmental Protection (Noise) Regulations 1997 (the Regulations).
Regulation 7 defines the prescribed standard for noise emissions as follows:
“7. (1) Noise emitted from any premises or public place when received at other premises –
(a) Must not cause or significantly contribute to, a level of noise which exceeds the assigned level in respect of noise received at premises of that kind; and
(b) Must be free of –
i. Tonality;
ii. Impulsiveness; and
iii. Modulation”.
A “…noise emission is taken to significantly contribute to a level of noise if the noise emission exceeds a value which is 5 dB below the assigned level…”
Tonality, impulsiveness and modulation are defined in regulation 9. Noise is to be taken to be free of these characteristics if:
(a) The characteristics cannot be reasonably and practicably removed by techniques other than attenuating the overall level of noise emission; and
(b) The noise emission complies with the standard after the adjustments of Table 3.1 are made to the noise emission as measured at the point of reception.
Table 3.1 – Adjustments For Intrusive Characteristics
Tonality Modulation Impulsiveness
+ 5 dB + 5 dB + 10 dB
Note: The above adjustments are cumulative to a maximum of 15 dB.
The baseline assigned levels (prescribed standards) are specified in Regulation 8 and are shown below in Table 3.2.

Lloyd George Acoustics
Reference: 8071043-01v3 Page 4
Table 3.2 – Baseline Assigned Noise Levels
Assigned Level (dB) Premises
Receiving Noise Time Of Day LA10 LA1 LAmax
0700 to 1900 hours Monday to Saturday (Day)
45 + influencing
factor
55 + influencing
factor
65 + influencing
factor
0900 to 1900 hours Sunday and public holidays (Sunday)
40 + influencing
factor
50 + influencing
factor
65 + influencing
factor
1900 to 2200 hours all days (Evening)
40 + influencing
factor
50 + influencing
factor
55 + influencing
factor
Noise Sensitive(1)
2200 hours on any day to 0700 hours Monday to Saturday and 0900 hours Sunday and public holidays (Night)
35 + influencing
factor
45 + influencing
factor
55 + influencing
factor
Noise Sensitive(2) All hours 60 75 80
Commercial All hours 60 75 80
Industrial All hours 65 80 90
Notes: (1) Applies within 15 metres of a building associated with a noise sensitive use, as defined in Schedule 1, Part C. (2) Applies at a noise sensitive premises greater than 15 metres from a building associated with a noise sensitive use.
For the purpose of this assessment the Bunbury Port has supplied the influencing factors and assigned levels for key noise sensitive premises. The night-time assigned levels, which are the most critical in terms of compliance, are shown in Table 3.3.
Table 3.3 – Night Time Assigned Noise Levels
Night Time Assigned Level (dB) Residential Location
LA10 LA1 LAmax
Location 1 – Bunbury 35 45 55
Location 2– East Bunbury (North) 35 45 55
Location 3 – East Bunbury (East) 42 52 62
Location 4 – East Bunbury (West) 35 45 55
Location 5 – Pelican Point (North) 35 45 55
Note that Location 3, which is in Oliver Street, East Bunbury, has an influencing factor of 7 dB, which is determined by its proximity to Koombana Drive (the main access route into the City of Bunbury) and the Port. Receiver locations are presented in Appendix A.

Lloyd George Acoustics
Reference: 8071043-01v3 Page 5
3.2 Transportation Noise Regulation 3(b) of the Regulations, states “Nothing in these regulations applies to noise emissions from trains or aircraft”. As such, the noise from the locomotive and wagons during the urea unloading will be treated separately with assessment being against the Western Australian Planning Commission’s (WAPC’s) State Planning Policy: Road and Rail Transport Noise and Freight Considerations in Land Use Planning.
This policy has been recently approved by the WAPC and represents a whole-of-government approach to noise from transportation sources. The latest version has not been released for public use at this stage, however it is understood to align with the criteria as shown below in Table 3.3.
Table 3.3 – External Transport Noise Criteria
Time of Day Noise “Target” Noise “Limit”
Day (6am – 10pm) LAeq (Day) = 55dB(A) LAeq (Day) = 60dB(A)
Night (10pm – 6am) LAeq (Night) = 50dB(A) LAeq (Night) = 55dB(A)
In applying these outdoor noise criteria to new noise-sensitive developments, the objectives are to achieve –
• acceptable indoor noise levels in noise-sensitive areas (eg bedrooms and living rooms of houses); and
• a ‘reasonable’ degree of acoustic amenity in at least one outdoor living area on each residential lot.
In terms of proposed new freight handling facilities, the policy states “In determining appropriate policy measures for proposed new freight handling facilities, it should be recognised that some noise emissions, for example from trucks on the premises, are required to meet the Environmental Protection (Noise) Regulations 1997. The noise emissions from the operation of trains at the freight handling facility will depend on the nature of the operations; in the case of a proposed new freight handling facility, appropriate noise criteria need to be developed in consultation with the State environmental agency”.
4 NOISE MODELLING METHODOLOGY
The noise modelling software used was SoundPLAN 6.5 together with the CONCAWE noise propagation algorithms. These algorithms have been selected as they are one of the few that include the influence of wind and atmospheric stability. Input data required in the model are:
Meteorological Information;
Topographical data;
Ground Absorption; and
Source sound power levels.

Lloyd George Acoustics
Reference: 8071043-01v3 Page 6
4.1.1 Meteorological Information
Meteorological information utilised is based on that specified in EPA draft Guidance for the Assessment of Environmental Factors No.8 Environmental Noise, and are shown below in Table 4.1.
Table 4.1 –Modelling Meteorological Conditions
Parameter Night (1900-0700)
Temperature (oC) 15
Humidity (%) 50
Wind Speed (m/s) 3
Wind Direction* All
Pasquil Stability Factor F
* Note that the modelling package used allows for all wind directions to be modelled simultaneously.
The above conditions approximate the typical worst-case for enhancement of sound propagation. It is EPA policy that compliance with the assigned noise levels needs to be demonstrated for 98% of the time, during the day and night periods, for the month of the year in which the worst-case weather conditions prevail. In most cases, the above conditions occur for more than 2% of the time and therefore must be satisfied. At wind speeds greater than those shown above, sound propagation may be further enhanced, however background noise from the wind itself and from local vegetation is likely to be elevated and dominate the ambient noise levels.
4.1.2 Topographical Data
Topographical data was based on that provided by GHD. The contours are in 5 metre intervals and cover the noise sensitive premises of concern.
4.1.3 Ground Absorption
Ground absorption varies from a value of 0 to 1, with 0 being for an acoustically reflective ground (e.g. water or bitumen) and 1 for acoustically absorbent ground (e.g. grass). In this instance, a value of 0.7 has been used as an average for the study area and 0 for areas over the water.
4.1.4 Source Sound Levels
Table 4.2 shows the sound power levels used in the modelling. They have been grouped depending on the percentage of time the noise is present. For example, the LA10 noise sources are present for more than 10% of any representative time period.

Lloyd George Acoustics
Reference: 8071043-01v3 Page 7
Table 4.2 – Source Sound Power Levels, dB
Octave Band Centre Frequency (Hz) Description
63 125 250 500 1k 2k 4k 8k
Overall dB(A)
LA10 Noise Sources
Conveyor Drive (enclosed) 95 93 87 82 79 77 70 59 86
Conveyor enclosed - speed 5m/s standard idlers 50 65 68 71 67 65 53 41 72/m
Shiploader Tail Drive (enclosed) 95 93 87 82 79 77 70 59 86
Dehumidifier 100 102 98 94 92 90 87 81 98
Loader 112 110 106 104 105 102 98 89 109
LA1 Noise Source
Truck Slow Moving 91 94 90 91 93 92 87 79 97
LAmax Noise Source
Train Wagon Bottom Dumper 98 93 92 94 94 96 96 91 102
Transportation Noise Sources
Idling Q-class Loco (x2) 94 96 89 97 86 84 80 78 95
Train Shunt 109 108 111 113 112 112 110 106 118
LA10 Port Noise Source
Panamax Vessel 90 101 99 101 100 94 85 74 107
With regards to Table 4.2, please note the following:
Noise source group relates to percentage of time noise is present within a representative time period;
The data has been collected from measurements by Lloyd George Acoustics of similar equipment;
Conveyor/shiploader drives and transfers are assumed to be enclosed with standard 0.42mm base metal thickness (BMT) steel and close fitting joints;
It is assumed that all noise sources will be operating simultaneously. Although this is unlikely to be the case for a majority of the time, it may occur on occasions and provides for a conservative assessment of noise impacts;
The stockpiling shed is assumed to be of metal construction with openings facing north towards the port area;

Lloyd George Acoustics
Reference: 8071043-01v3 Page 8
Storage shed mechanical ventilation and dehumidification plant is assumed to be located on the north wall of the shed. This will provide maximum shielding to noise sensitive premises located to the south; and
The noise from the ship is commented on, however is considered to be part of the Port of Bunbury and covered by the appropriate port approvals.
5 RESULTS
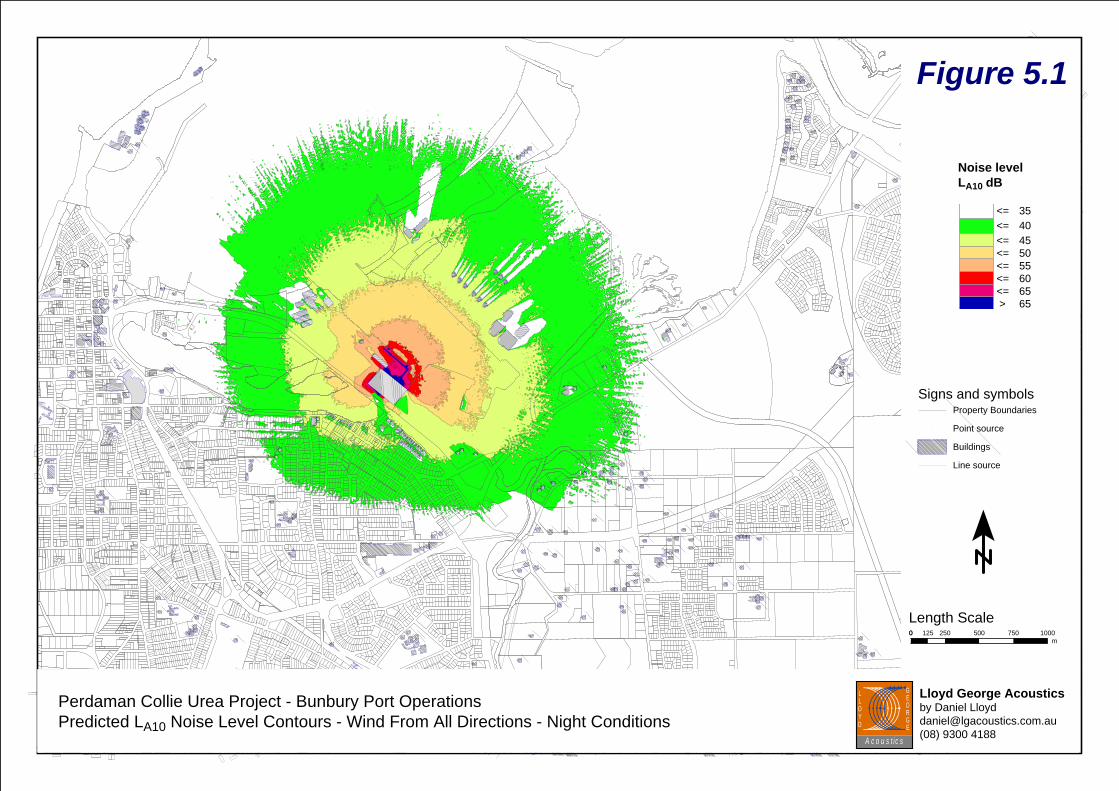
The results of the noise modelling are summarised below in Tables 5.1 to 5.5 and the LA10 predicted noise levels presented in Figure 5.1.
Table 5.1 – Summary of LA10 Noise Modelling
Location Predicted Noise Level, dB LA10
Worst-Case Downwind
Location 1 – Bunbury 37
Location 2 – East Bunbury (North) 37
Location 3 – East Bunbury (East) 42
Location 4 – East Bunbury (West) 35
Location 5 – Pelican Point (North) 28
Table 5.2 – Summary of LA1 Noise Modelling
Location Predicted Noise Level, dB LA1
Worst-Case Downwind
Location 1 – Bunbury 37
Location 2 – East Bunbury (North) 37
Location 3 – East Bunbury (East) 47
Location 4 – East Bunbury (West) 37
Location 5 – Pelican Point (North) 28
Signs and symbolsProperty Boundaries
Point source
Buildings
Line source
Length Scale00 125 250 500 750 1000
m
Figure 5.1
Perdaman Collie Urea Project - Bunbury Port OperationsPredicted LA10 Noise Level Contours - Wind From All Directions - Night Conditions
Lloyd George Acousticsby Daniel [email protected](08) 9300 4188
GEORGE
LLOYD
A c o u s t ic s
Noise level LA10 dB
<= 35<= 40<= 45<= 50<= 55<= 60<= 65> 65

Lloyd George Acoustics
Reference: 8071043-01v3 Page 10
Table 5.3 – Summary of LAmax Noise Modelling
Location Predicted Noise Level, dB LAmax
Worst-Case Downwind
Location 1 – Bunbury 37
Location 2 – East Bunbury (North) 37
Location 3 – East Bunbury (East) 50
Location 4 – East Bunbury (West) 37
Location 5 – Pelican Point (North) 28
Table 5.4 – Summary of Transportation Noise Modelling dB(A)
Location Predicted Noise Level, dB(A)
Worst-Case Downwind
Location 1 – Bunbury Shunt – 49 / Locomotive 33
Location 2– East Bunbury (North) Shunt – 55 / Locomotive 37
Location 3 – East Bunbury (East) Shunt – 73 / Locomotive 43
Location 4 – East Bunbury (West) Shunt – 58 / Locomotive 39
Location 5 – Pelican Point (North) Shunt – 35 / Locomotive 0
Table 5.5 – Summary of Port LA10 Noise Modelling
Location Predicted Noise Level, dB LA10
Worst-Case Downwind
Location 1 – Bunbury 41
Location 2 – East Bunbury (North) 41
Location 3 – East Bunbury (East) 42
Location 4 – East Bunbury (West) 40
Location 5 – Pelican Point (North) 31
Tables 5.6 and 5.7, provide noise source rankings for predicted LA10 and LA1 levels respectively.
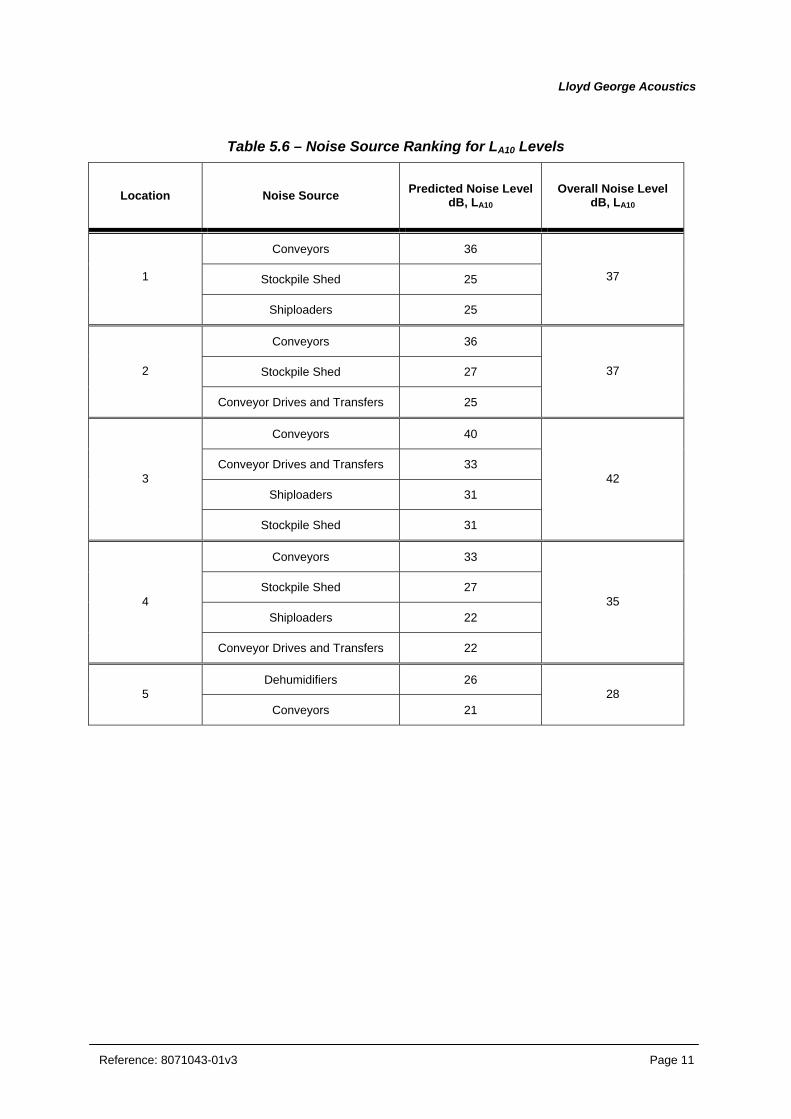
Lloyd George Acoustics
Reference: 8071043-01v3 Page 11
Table 5.6 – Noise Source Ranking for LA10 Levels
Location Noise Source Predicted Noise Level dB, LA10
Overall Noise Level dB, LA10
Conveyors 36
Stockpile Shed 25 1
Shiploaders 25
37
Conveyors 36
Stockpile Shed 27 2
Conveyor Drives and Transfers 25
37
Conveyors 40
Conveyor Drives and Transfers 33
Shiploaders 31 3
Stockpile Shed 31
42
Conveyors 33
Stockpile Shed 27
Shiploaders 22 4
Conveyor Drives and Transfers 22
35
Dehumidifiers 26 5
Conveyors 21 28
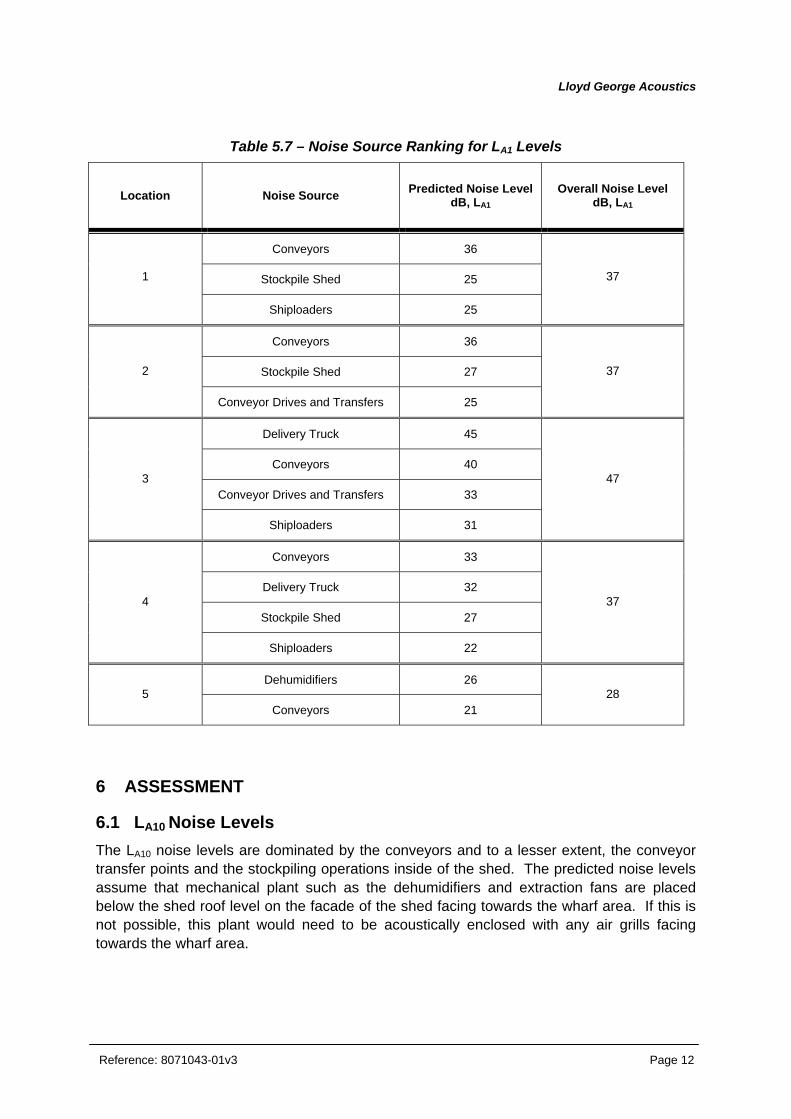
Lloyd George Acoustics
Reference: 8071043-01v3 Page 12
Table 5.7 – Noise Source Ranking for LA1 Levels
Location Noise Source Predicted Noise Level dB, LA1
Overall Noise Level dB, LA1
Conveyors 36
Stockpile Shed 25 1
Shiploaders 25
37
Conveyors 36
Stockpile Shed 27 2
Conveyor Drives and Transfers 25
37
Delivery Truck 45
Conveyors 40
Conveyor Drives and Transfers 33 3
Shiploaders 31
47
Conveyors 33
Delivery Truck 32
Stockpile Shed 27 4
Shiploaders 22
37
Dehumidifiers 26 5
Conveyors 21 28
6 ASSESSMENT
6.1 LA10 Noise Levels The LA10 noise levels are dominated by the conveyors and to a lesser extent, the conveyor transfer points and the stockpiling operations inside of the shed. The predicted noise levels assume that mechanical plant such as the dehumidifiers and extraction fans are placed below the shed roof level on the facade of the shed facing towards the wharf area. If this is not possible, this plant would need to be acoustically enclosed with any air grills facing towards the wharf area.

Lloyd George Acoustics
Reference: 8071043-01v3 Page 13
Although conveyor noise often exhibits tonal noise characteristics, which would attract a penalty of 5 dB, because they are enclosed, this tonal component, which is usually in the higher frequency range, is unlikely to be present at any receiving location. There are no noise sources that are considered to be modulating or impulsive in nature.
From the background noise level measurements presented in Section 2, night-time noise levels are currently above the assigned levels and this is likely to be a result of existing Port operations. The noise from the proposed Perdaman operations is therefore considered to be a “contributing source” and would need to be 5 dB below the assigned levels.
As the noise from the Perdaman operations is considered to be a “contributing source” it can be seen from Table 6.1, that it is predicted to exceed the regulations by 7 dB at some locations.
Table 6.1 – Assessment of Predicted LA10 Noise Levels
Location Period1 Assigned Noise Level2 Criteria3 Background
Noise Level4Predicted
Noise Level5Calculated
Exceedance
Day 45 dB LA10 40 dB LA10 Not Avail 37 dB LA10 -
Evening 40 dB LA10 35 dB LA10 Not Avail 37 dB LA10 2 dB LA10 1
Night 35 dB LA10 30 dB LA10 Not Avail 37 dB LA10 7 dB LA10
Day 45 dB LA10 40 dB LA10 Not Avail 37 dB LA10 -
Evening 40 dB LA10 35 dB LA10 Not Avail 37 dB LA10 2 dB LA10 2
Night 35 dB LA10 30 dB LA10 Not Avail 37 dB LA10 7 dB LA10
Day 52 dB LA10 47 dB LA10 50 dB LA90 42 dB LA10 -
Evening 47 dB LA10 42 dB LA10 43 dB LA90 42 dB LA10 - 3
Night 42 dB LA10 37 dB LA10 40 dB LA90 42 dB LA10 5 dB LA10
Day 45 dB LA10 40 dB LA10 Not Avail 35 dB LA10 -
Evening 40 dB LA10 35 dB LA10 Not Avail 35 dB LA10 - 4
Night 35 dB LA10 30 dB LA10 Not Avail 35 dB LA10 5 dB LA10
Day 45 dB LA10 40 dB LA10 42 dB LA10 28 dB LA10 -
Evening 40 dB LA10 35 dB LA10 42 dB LA10 28 dB LA10 - 5
Night 35 dB LA10 30 dB LA10 39 dB LA10 28 dB LA10 -
Notes: 1. Periods are as defined in Table 3.2. 2. The assigned noise level is as defined in Table 3.3 3. Adjusted by -5 dB as “Contributing Noise Source” 4. Background noise level is as calculated in Table 2.1. 5. From Table 5.1.
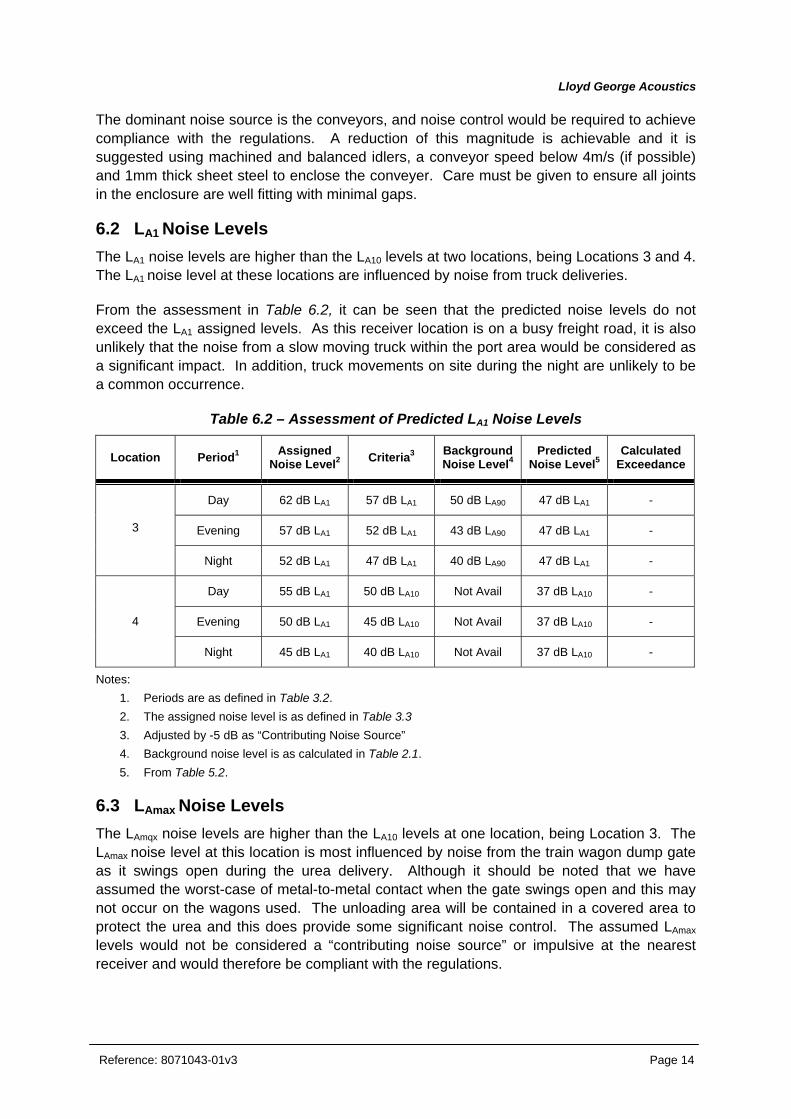
Lloyd George Acoustics
Reference: 8071043-01v3 Page 14
The dominant noise source is the conveyors, and noise control would be required to achieve compliance with the regulations. A reduction of this magnitude is achievable and it is suggested using machined and balanced idlers, a conveyor speed below 4m/s (if possible) and 1mm thick sheet steel to enclose the conveyer. Care must be given to ensure all joints in the enclosure are well fitting with minimal gaps.
6.2 LA1 Noise Levels The LA1 noise levels are higher than the LA10 levels at two locations, being Locations 3 and 4. The LA1 noise level at these locations are influenced by noise from truck deliveries.
From the assessment in Table 6.2, it can be seen that the predicted noise levels do not exceed the LA1 assigned levels. As this receiver location is on a busy freight road, it is also unlikely that the noise from a slow moving truck within the port area would be considered as a significant impact. In addition, truck movements on site during the night are unlikely to be a common occurrence.
Table 6.2 – Assessment of Predicted LA1 Noise Levels
Location Period1 Assigned Noise Level2 Criteria3 Background
Noise Level4Predicted
Noise Level5Calculated
Exceedance
Day 62 dB LA1 57 dB LA1 50 dB LA90 47 dB LA1 -
Evening 57 dB LA1 52 dB LA1 43 dB LA90 47 dB LA1 - 3
Night 52 dB LA1 47 dB LA1 40 dB LA90 47 dB LA1 -
Day 55 dB LA1 50 dB LA10 Not Avail 37 dB LA10 -
Evening 50 dB LA1 45 dB LA10 Not Avail 37 dB LA10 - 4
Night 45 dB LA1 40 dB LA10 Not Avail 37 dB LA10 -
Notes: 1. Periods are as defined in Table 3.2. 2. The assigned noise level is as defined in Table 3.3 3. Adjusted by -5 dB as “Contributing Noise Source” 4. Background noise level is as calculated in Table 2.1. 5. From Table 5.2.
6.3 LAmax Noise Levels The LAmqx noise levels are higher than the LA10 levels at one location, being Location 3. The LAmax noise level at this location is most influenced by noise from the train wagon dump gate as it swings open during the urea delivery. Although it should be noted that we have assumed the worst-case of metal-to-metal contact when the gate swings open and this may not occur on the wagons used. The unloading area will be contained in a covered area to protect the urea and this does provide some significant noise control. The assumed LAmax levels would not be considered a “contributing noise source” or impulsive at the nearest receiver and would therefore be compliant with the regulations.
Lloyd George Acoustics
Reference: 8071043-01v3 Page 15
6.4 Transportation Noise Levels Noise from the locomotive idling is predicted to be LAeq 43 dB at Location 3. This is close to the existing background noise level and is unlikely to result in a significant impact. In addition, assuming two trains being unloaded (one train at night and one during the day) the noise would comply with the ‘target’ criteria of the State Planning Policy Road and Rail Transport Noise and Freight Considerations in Land Use Planning.
Noise from the wagons shunting together as the locomotive stops and starts would be considered to be a high impact at noise sensitive premises. However, the proposed unloading is for the locomotive to constantly pull the wagons at slow speed with the bottom dumping mechanism opening and closing automatically. This technique should eliminate the wagon shunt during unloading. However, it is recommended that the unloading spur line through the unloader, be constructed on a slight upward grade to ensure the wagon tension is maintained at all times.
6.5 Port Noise Noise from the Panamax ships is indicative and is presented for information purposes only. Perdaman have no control over this noise source and it is essentially a part of the Port operations and is assumed to be covered under the Port of Bunbury approvals. Using the indicative sound power levels, the noise from the vessel would exceed the allowable noise levels under the Regulations at all assessment locations except Location 3.
7 RECOMMENDATIONS
To achieve compliance with the Regulations, a 7 dB reduction is required to the overall LA10 noise level. The conveyors are the dominant noise source and a reduction of this magnitude is considered practicably achievable. It is recommended that machined and balanced idlers be used, a conveyor speed below 4m/s (if possible) and 1mm thick sheet steel to enclose the conveyer. Care would be needed to ensure all joints in the enclosure are well fitting with minimal gaps. As a guide, a noise level of 54 dB(A) at 5m from the conveyor enclosure should be specified.
Care should also be taken with enclosing the conveyor transfers and it is recommended a noise level of 60 dB(A) at 5m be specified for this plant.
It should be noted that the predicted noise levels assume that mechanical plant, such as the dehumidifiers and extraction fans, are placed below the stockpiling shed roof level on the facade of the shed facing towards the wharf area. If this were not possible, this plant would need to be acoustically enclosed with any air grills facing towards the wharf area.
The noise from wagon shunting would be considered significant to nearby residences. The proposed unloading is for the locomotive to constantly pull the wagons at slow speed with the bottom dumping mechanism opening and closing automatically, which should eliminate the wagon shunt. To reduce the probability of the wagons shunting, it is recommended that the unloading spur line through the unloader, be constructed on a slight upward grade to ensure the wagon tension is maintained at all times.

Lloyd George Acoustics
Reference: 8071043-01v3 Page 16

Lloyd George Acoustics
APPENDIX A
Site and Receiver Locations

Lloyd George Acoustics
Reference: 8071043-01v3 Page A1
Perdaman PortOperations
Receiver Location 5
Receiver Location 1
Receiver Location 2
Receiver Location 3
Receiver Location 4

Lloyd George Acoustics
APPENDIX B
Background Noise Monitoring Details

Lloyd George Acoustics
Reference: 8071043-01
Background Noise Monitoring ResultsOliver Street, East Bunbury
0
10
20
30
40
50
60
70
80
90
100
0:00
8:00
16:00 0:0
0
8:00
16:00 0:0
0
8:00
16:00 0:0
0
8:00
16:00 0:0
0
8:00
16:00 0:0
0
8:00
16:00 0:0
0
8:00
16:00
Date / Time
Soun
d Pr
essu
re L
evel
, dB
(A)
L1 L10 L90
10 June 2009 11 June 2009 12 June 2009 13 June 2009 14 June 2009 15 June 2009 16 June 2009

Lloyd George Acoustics
Reference: 8071043-01
Background Noise Monitoring ResultsOliver Street, East Bunbury
0
10
20
30
40
50
60
70
80
90
100
0:00
8:00
16:00 0:0
0
8:00
16:00 0:0
0
8:00
16:00 0:0
0
8:00
16:00 0:0
0
8:00
16:00 0:0
0
8:00
16:00 0:0
0
8:00
16:00
Date / Time
Soun
d Pr
essu
re L
evel
, dB
(A)
L1 L10 L90
17 June 2009 18 June 2009

Lloyd George Acoustics
Reference: 8071043-01
Background Noise Monitoring ResultsKendle Close, Pelican Point
0
10
20
30
40
50
60
70
80
90
100
0:00
8:00
16:00 0:0
0
8:00
16:00 0:0
0
8:00
16:00 0:0
0
8:00
16:00 0:0
0
8:00
16:00 0:0
0
8:00
16:00 0:0
0
8:00
16:00
Date / Time
Soun
d Pr
essu
re L
evel
, dB
(A)
L1 L10 L90
10 June 2009 11 June 2009 12 June 2009 13 June 2009 14 June 2009 15 June 2009 16 June 2009

Lloyd George Acoustics
Reference: 8071043-01
Background Noise Monitoring ResultsKendle Close, Pelican Point
0
10
20
30
40
50
60
70
80
90
100
0:00
8:00
16:00 0:0
0
8:00
16:00 0:0
0
8:00
16:00 0:0
0
8:00
16:00 0:0
0
8:00
16:00 0:0
0
8:00
16:00 0:0
0
8:00
16:00
Date / Time
Soun
d Pr
essu
re L
evel
, dB
(A)
L1 L10 L90
17 June 2009 18 June 2009 19 June 2009 20 June 2009 21 June 2009

Lloyd George Acoustics
Reference: 8071043-01
Bunbury Weather Observations10 to 20 June 2009
0
10
20
30
40
50
60
70
80
90
100
080
016
00 080
016
00 080
016
00 080
016
00 080
016
00 080
016
00 080
016
00 080
016
00 080
016
00 080
016
00 080
016
00 0
Time
Air
Tem
pera
ture
(°C
) / R
elat
ive
Hum
idty
(%)
0
2
4
6
8
10
12
14
16
18
20
Hou
rly P
reci
pita
tion
(mm
)
Precipitation Air Temperature Relative Humidity
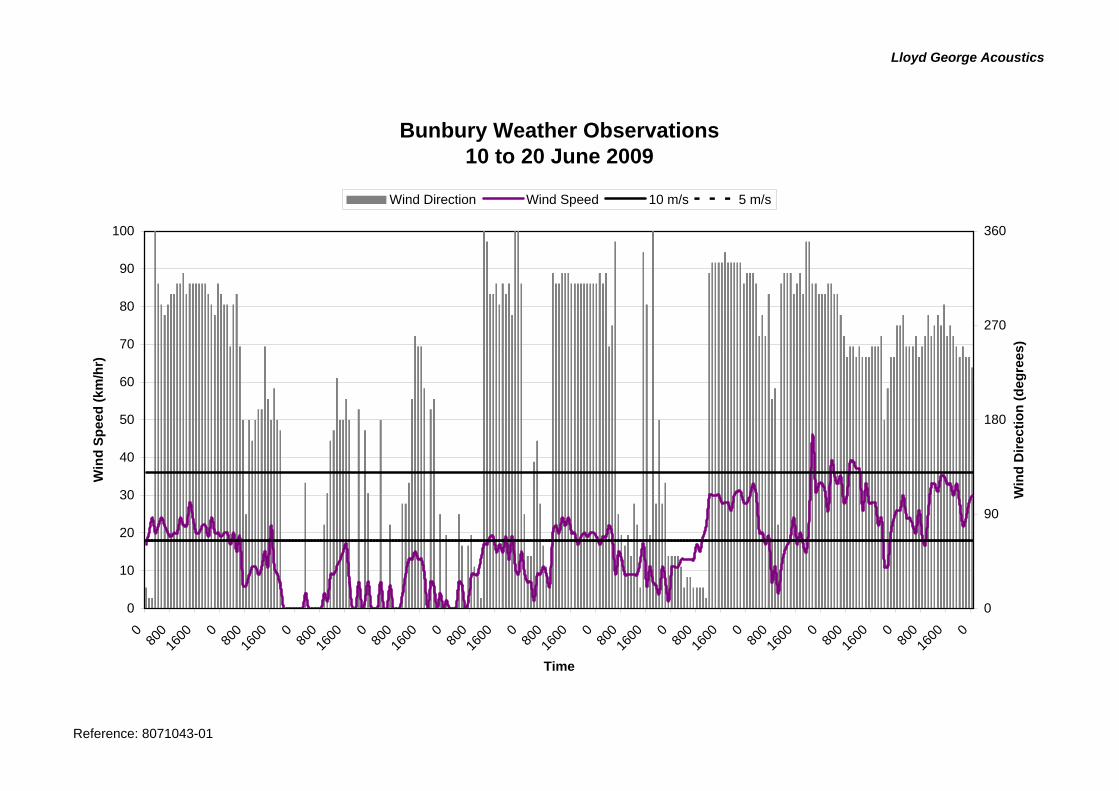
Lloyd George Acoustics
Reference: 8071043-01
Bunbury Weather Observations10 to 20 June 2009
0
10
20
30
40
50
60
70
80
90
100
080
016
00 080
016
00 080
016
00 080
016
00 080
016
00 080
016
00 080
016
00 080
016
00 080
016
00 080
016
00 080
016
00 0
Time
Win
d Sp
eed
(km
/hr)
0
90
180
270
360
Win
d D
irect
ion
(deg
rees
)
Wind Direction Wind Speed 10 m/s 5 m/s
Lloyd George Acoustics
APPENDIX C
Terminology
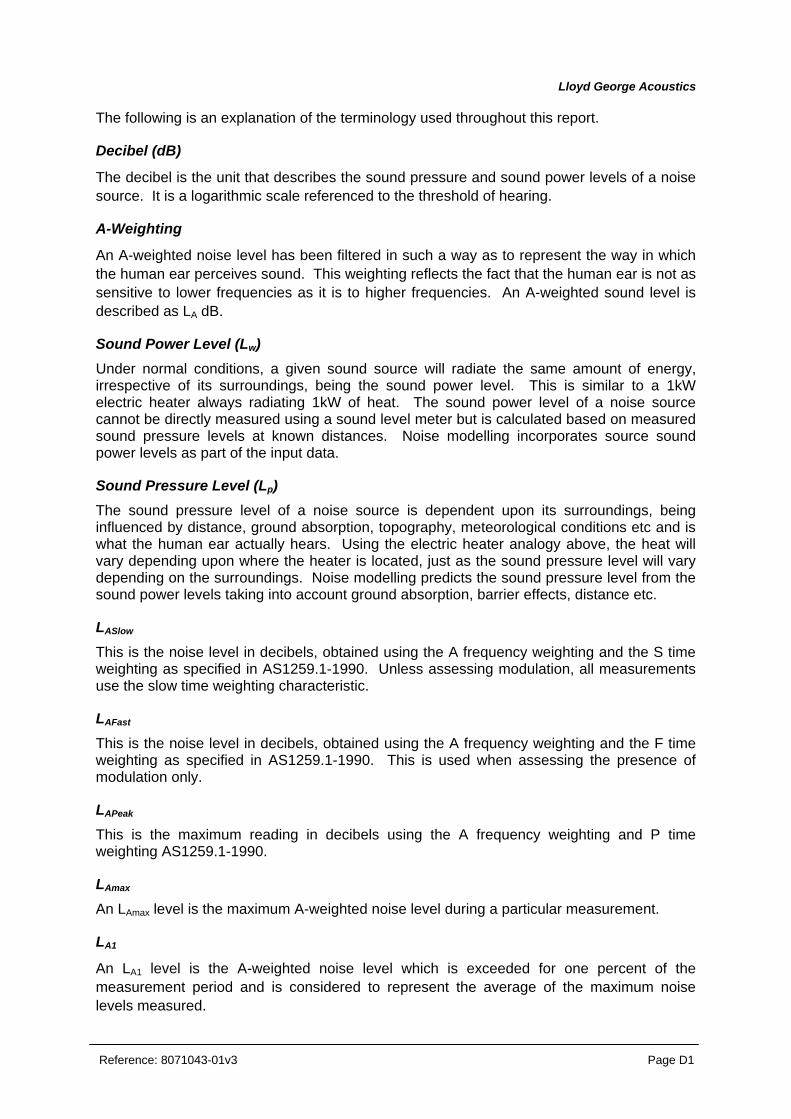
Lloyd George Acoustics
Reference: 8071043-01v3 Page D1
The following is an explanation of the terminology used throughout this report.
Decibel (dB)
The decibel is the unit that describes the sound pressure and sound power levels of a noise source. It is a logarithmic scale referenced to the threshold of hearing.
A-Weighting
An A-weighted noise level has been filtered in such a way as to represent the way in which the human ear perceives sound. This weighting reflects the fact that the human ear is not as sensitive to lower frequencies as it is to higher frequencies. An A-weighted sound level is described as LA dB.
Sound Power Level (Lw) Under normal conditions, a given sound source will radiate the same amount of energy, irrespective of its surroundings, being the sound power level. This is similar to a 1kW electric heater always radiating 1kW of heat. The sound power level of a noise source cannot be directly measured using a sound level meter but is calculated based on measured sound pressure levels at known distances. Noise modelling incorporates source sound power levels as part of the input data.
Sound Pressure Level (Lp) The sound pressure level of a noise source is dependent upon its surroundings, being influenced by distance, ground absorption, topography, meteorological conditions etc and is what the human ear actually hears. Using the electric heater analogy above, the heat will vary depending upon where the heater is located, just as the sound pressure level will vary depending on the surroundings. Noise modelling predicts the sound pressure level from the sound power levels taking into account ground absorption, barrier effects, distance etc.
LASlow
This is the noise level in decibels, obtained using the A frequency weighting and the S time weighting as specified in AS1259.1-1990. Unless assessing modulation, all measurements use the slow time weighting characteristic.
LAFast
This is the noise level in decibels, obtained using the A frequency weighting and the F time weighting as specified in AS1259.1-1990. This is used when assessing the presence of modulation only.
LAPeak
This is the maximum reading in decibels using the A frequency weighting and P time weighting AS1259.1-1990.
LAmax
An LAmax level is the maximum A-weighted noise level during a particular measurement.
LA1
An LA1 level is the A-weighted noise level which is exceeded for one percent of the measurement period and is considered to represent the average of the maximum noise levels measured.

Lloyd George Acoustics
Reference: 8071043-01v3 Page D2
LA10
An LA10 level is the A-weighted noise level which is exceeded for 10 percent of the measurement period and is considered to represent the “intrusive” noise level.
LAeq
The equivalent steady state A-weighted sound level (“equal energy”) in decibels which, in a specified time period, contains the same acoustic energy as the time-varying level during the same period. It is considered to represent the “average” noise level.
LA90
An LA90 level is the A-weighted noise level which is exceeded for 90 percent of the measurement period and is considered to represent the “background” noise level.
One-Third-Octave Band Means a band of frequencies spanning one-third of an octave and having a centre frequency between 25 Hz and 20 000 Hz inclusive.
LAmax assigned level Means an assigned level which, measured as a LA Slow value, is not to be exceeded at any time. LA1 assigned level Means an assigned level which, measured as a LA Slow value, is not to be exceeded for more than 1% of the representative assessment period.
LA10 assigned level Means an assigned level which, measured as a LA Slow value, is not to be exceeded for more than 10% of the representative assessment period.
Tonal Noise A tonal noise source can be described as a source that has a distinctive noise emission in one or more frequencies. An example would be whining or droning. The quantitative definition of tonality is:
the presence in the noise emission of tonal characteristics where the difference between —
(a) the A-weighted sound pressure level in any one-third octave band; and
(b) the arithmetic average of the A-weighted sound pressure levels in the 2 adjacent one-third octave bands,
is greater than 3 dB when the sound pressure levels are determined as LAeq,T levels where the time period T is greater than 10% of the representative assessment period, or greater than 8 dB at any time when the sound pressure levels are determined as LA Slow levels.
This is relatively common in most noise sources.

Lloyd George Acoustics
Reference: 8071043-01v3 Page D3
Modulating Noise A modulating source is regular, cyclic and audible and is present for at least 10% of the measurement period. The quantitative definition of tonality is:
a variation in the emission of noise that —
(a) is more than 3 dB LA Fast or is more than 3 dB LA Fast in any one-third octave band;
(b) is present for at least 10% of the representative
Impulsive Noise An impulsive noise source has a short-term banging, clunking or explosive sound. The quantitative definition of tonality is:
a variation in the emission of a noise where the difference between LA peak and LA Max slow is more than 15 dB when determined for a single representative event;
Major Road
Is a road with an estimated average daily traffic count of more than 15,000 vehicles.
Secondary / Minor Road
Is a road with an estimated average daily traffic count of between 6,000 and 15,000 vehicles.
Influencing factor
( ) ( )
100m within roadmajor each for 6450m within roadmajor each for 2
100m within roadsecondary each for 2 dB) 6 of (maximumFactor Traffic
noise thereceiving premises theof radius 450m a within land commercial of percentage the%TypeB
noise thereceiving premises theof radius a100m within land commercial of percentage theB Type %
noise thereceiving premises theof radius 450m a within land industrial of percentage the%TypeA
noise thereceiving premises theof radius a100m withinland industrial of percentage theA Type %
:
B Type %B Type %20
A Type %A Type %10
450
100
450
100
450100450100
===+
=
=
=
=
+++=
where
11
Representative Assessment Period
Means a period of time not less than 15 minutes, and not exceeding four hours, determined by an inspector or authorised person to be appropriate for the assessment of a noise emission, having regard to the type and nature of the noise emission.

Lloyd George Acoustics
Reference: 8071043-01v3 Page D4
Background Noise Background noise or residual noise is the noise level from sources other than the source of concern. When measuring environmental noise, residual sound is often a problem. One reason is that regulations often require that the noise from different types of sources be dealt with separately. This separation, e.g. of traffic noise from industrial noise, is often difficult to accomplish in practice. Another reason is that the measurements are normally carried out outdoors. Wind-induced noise, directly on the microphone and indirectly on trees, buildings, etc., may also affect the result. The character of these noise sources can make it difficult or even impossible to carry out any corrections.
Ambient Noise Means the level of noise from all sources, including background noise from near and far and the source of interest.
Specific Noise Relates to the component of the ambient noise that is of interest. This can be referred to as the noise of concern or the noise of interest.
Satisfactory Design Sound Level The level of noise that has been found to be acceptable by most people for the environment in question and also to be not intrusive.
Maximum Design Sound Level The level of noise above which most people occupying the space start to become dissatisfied with the level of noise.
Reverberation Time Of an enclosure, for a sound of a given frequency or frequency band, the time that would be required for the reverberantly decaying sound pressure level in the enclosure to decrease by 60 decibels.
RMS The root mean square level. This is used to represent the average level of a wave form such as vibration.
Vibration Velocity Level The RMS velocity of a vibration source over a specified time period. Units are mm/s.
Peak Velocity Level of vibration velocity measured as a non root mean square (r.m.s.) quantity in millimetres per second (mm/s).

Lloyd George Acoustics
Reference: 8071043-01v3 Page D5
Chart of Noise Level Descriptors
Typical Noise Levels

Noise Impact Assessment
Prepared For
GHD
September 2009
Reference: 8071043-03
GEORGE
LLOYD
Acoustics
Perdaman Collie Urea Project
Shotts to Bunbury Rail Activity

Report: 8071043-03
Lloyd George Acoustics Pty Ltd ABN: 79 125 812 544
PO Box 717 Hillarys WA 6923
Offices: Ocean Reef Padbury Scarborough Waterford
Phone: Fax:
Email: Mobile:
9300 4188 9300 4199 [email protected]
0439 032 844
9401 7770 9401 7770 [email protected]
0400 414 197
9245 3223 9300 4199 [email protected]
0438 201 071
9313 3655 9300 4199 [email protected]
0427 388 876
Member of the Association of Australian Acoustical Consultants – (AAAC)
This report has been prepared in accordance with the scope of services described in the contract or agreement between Lloyd George Acoustics Pty Ltd and the Client. The report relies upon data, surveys, measurements and results taken at or under the particular times and conditions specified herein. Any findings, conclusions or recommendations only apply to the aforementioned circumstances and no greater reliance should be assumed or drawn by the Client. Furthermore, the report has been prepared solely for use by the Client, and Lloyd George Acoustics Pty Ltd accepts no responsibility for its use by other parties.
Approved for Issue: Michael Cake
Position: Project Director
Verified Terry George
Date: 18 September 2009

Lloyd George Acoustics
CONTENTS
1 INTRODUCTION ............................................................................................................. 1
2 CRITERIA ........................................................................................................................ 1
3 EXISTING AND FORECAST TRAIN MOVEMENTS....................................................... 4
4 NOISE PREDICTION METHODOLOGY ......................................................................... 5
5 RESULTS And ASSESSMENT ....................................................................................... 6
5.1 Existing Train Movements ....................................................................................... 6
5.2 Forecast Train Movements (2013) Without Perdaman ........................................... 8
5.3 Forecast Train Movements (2013) With Perdaman .............................................. 11
6 CONCLUSION............................................................................................................... 13
APPENDICES
A Terminology
Lloyd George Acoustics
Reference: 8071043-03 Page 1
1 INTRODUCTION
Perdaman Chemicals and Fertilisers (Perdaman) are developing a urea manufacturing plant to be located within the Shotts Industrial Park in the Collie region of Western Australia.
The plant will use a coal gasification process to transform sub-bituminous coal into urea.
The urea will then be transported via rail to the Port of Bunbury, where it will be stockpiled within a large storage shed, before being loaded onto ships via a series of conveyors and shiploaders.
This report is limited to the assessment of the noise impacts resulting from the transportation of urea from the Collie Shotts Plant to the Port of Bunbury along the existing rail line.
The results of the assessment are compared against the relevant criteria and noise control recommended in broad terms where these criteria are exceeded.
Appendix C contains a description of some of the terminology used throughout this report.
2 CRITERIA
Although impacts from transportation noise sources are covered under the Environmental Protection Act 1986, these sources are specifically excluded from the Environmental Protection (Noise) Regulations 1997.
The most relevant criteria are the Western Australian Planning Commission’s State Planning Policy: Road and Rail Transport Noise and Freight Considerations in Land Use Planning (SPP Road and Rail Transport Noise) and the draft EPA Statements for EIA No. 14 (Version 3) - Road and Rail Transportation Noise, (draft EPA Statement No. 14) both of which are summarised below.
Generally the EPA would use the SPP Road and Rail Transport Noise to assess new transportation projects or major redevelopments of existing transportation infrastructure; and would use the draft EPA Statement No. 14 to assess the acceptability of a noise impact from increases in traffic or train volumes resulting from a specific project.
It is Lloyd George Acoustics’ opinion that the Perdaman Collie Urea Project falls into the later category, as the project will result in an increase in the number of trains operating on the existing rail line between Shotts and Bunbury. Therefore, it is considered that the draft EPA Statement No. 14 provides the most appropriate criteria for noise assessment.
SPP Road and Rail Transport Noise
This policy has been recently approved by the WAPC and represents a whole-of-government approach to noise from transportation sources. The latest version has not been released for public use at this stage, however it is understood to align with the criteria as shown in Table 2.1.
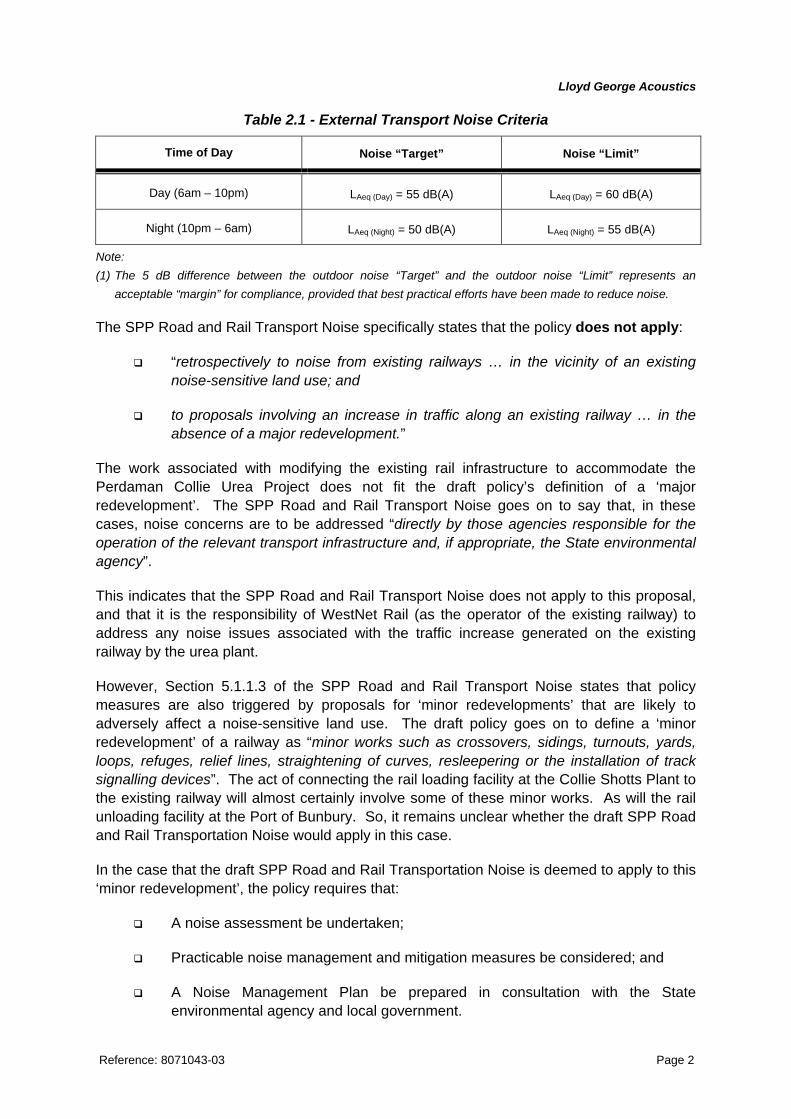
Lloyd George Acoustics
Reference: 8071043-03 Page 2
Table 2.1 - External Transport Noise Criteria
Time of Day Noise “Target” Noise “Limit”
Day (6am – 10pm) LAeq (Day) = 55 dB(A) LAeq (Day) = 60 dB(A)
Night (10pm – 6am) LAeq (Night) = 50 dB(A) LAeq (Night) = 55 dB(A)
Note: (1) The 5 dB difference between the outdoor noise “Target” and the outdoor noise “Limit” represents an
acceptable “margin” for compliance, provided that best practical efforts have been made to reduce noise.
The SPP Road and Rail Transport Noise specifically states that the policy does not apply:
“retrospectively to noise from existing railways … in the vicinity of an existing noise-sensitive land use; and
to proposals involving an increase in traffic along an existing railway … in the absence of a major redevelopment.”
The work associated with modifying the existing rail infrastructure to accommodate the Perdaman Collie Urea Project does not fit the draft policy’s definition of a ‘major redevelopment’. The SPP Road and Rail Transport Noise goes on to say that, in these cases, noise concerns are to be addressed “directly by those agencies responsible for the operation of the relevant transport infrastructure and, if appropriate, the State environmental agency”.
This indicates that the SPP Road and Rail Transport Noise does not apply to this proposal, and that it is the responsibility of WestNet Rail (as the operator of the existing railway) to address any noise issues associated with the traffic increase generated on the existing railway by the urea plant.
However, Section 5.1.1.3 of the SPP Road and Rail Transport Noise states that policy measures are also triggered by proposals for ‘minor redevelopments’ that are likely to adversely affect a noise-sensitive land use. The draft policy goes on to define a ‘minor redevelopment’ of a railway as “minor works such as crossovers, sidings, turnouts, yards, loops, refuges, relief lines, straightening of curves, resleepering or the installation of track signalling devices”. The act of connecting the rail loading facility at the Collie Shotts Plant to the existing railway will almost certainly involve some of these minor works. As will the rail unloading facility at the Port of Bunbury. So, it remains unclear whether the draft SPP Road and Rail Transportation Noise would apply in this case.
In the case that the draft SPP Road and Rail Transportation Noise is deemed to apply to this ‘minor redevelopment’, the policy requires that:
A noise assessment be undertaken;
Practicable noise management and mitigation measures be considered; and
A Noise Management Plan be prepared in consultation with the State environmental agency and local government.

Lloyd George Acoustics
Reference: 8071043-03 Page 3
Note that this does not necessarily mean that the external noise criteria presented by Table 2.1 would apply.
The practicability of noise control measures is to have regard to:
Existing transport noise levels;
Likely changes in noise emissions resulting from the proposal; and
The nature and scale of the works and the potential for noise amelioration.
In terms of proposed new freight handling facilities, the policy states “In determining appropriate policy measures for proposed new freight handling facilities, it should be recognised that some noise emissions, for example from trucks on the premises, are required to meet the Environmental Protection (Noise) Regulations 1997. The noise emissions from the operation of trains at the freight handling facility will depend on the nature of the operations; in the case of a proposed new freight handling facility, appropriate noise criteria need to be developed in consultation with the State environmental agency”.
The noise impact of freight handling at the Port of Bunbury is addressed in the report Noise Impact Assessment – Perdaman Collie Urea Project – Bunbury Port Operations (Ref: 8071043-01).
In regards to freight handling at the Collie Shotts Plant, it should be noted that the closest noise sensitive premises to the rail loading facility, where these minor works are likely to occur, is approximately 2.3 km away (Stockton Pool caretaker’s cottage), with the closest existing residence approximately 3.9 km away. At these distances, the maximum noise level from train shunting is unlikely to be discernable from the overall noise emissions of the plant (LAmax noise levels from shunting are predicted to be 33 and 23 dB respectively). Therefore freight handling is not considered to be a significant noise issue at the plant.
Draft EPA Statement No. 14 - Road and Rail Transportation Noise
Under the draft EPA Statement No. 14, a Noise Amenity Rating is applied in accordance with existing noise levels at the noise sensitive receiver. The noise ratings are reproduced in Table 2.2.
For this proposal, which is an increase in rail traffic for a specific industrial proposal, Section 5.3 of the draft statement applies.
The objectives listed in Section 5.3 of the draft EPA Statement No. 14 are -
(i) “that the noise levels inside noise-sensitive premises associated with the proposed traffic should meet acceptable levels, or that the degree of increase in noise levels should be of low significance; and
(ii) that the noise emissions of the vehicles associated with a specific proposal should comply with “best practice”.”

Lloyd George Acoustics
Reference: 8071043-03 Page 4
Table 2.2 – Transport Noise Amenity Ratings
Rating LAeq (Day) LAeq (Night)
N0 ≤ 50 ≤ 40
N1 51 - 55 41 - 45
N2 56 - 60 46 - 50
N3 61 - 65 51 - 55
N4 66 - 70 56 - 60
N5 ≥ 70 ≥ 60
Notes: (1) The Noise Amenity Rating for a location is the higher of the day and night ratings. (2) Noise levels refer to external locations at 1m from the building façade. (3) The day and night time periods in the draft EPA Statement No. 14 vary slightly from that in the SPP Road and
Rail Transport Noise. With respect to the draft EPA Statement No. 14 “day” means 7am – 10pm and “night” means 10pm – 7am.
In determining whether the EPA is likely to view an increase in noise level resulting from a particular project as significant, Table 2.3 (taken from the draft EPA Statement No. 14) provides acceptable increases in noise level relative to the Noise Amenity Rating immediately before the increase in transport that is due to the proposal.
Table 2.3 Acceptable Increases in Transport Noise Levels
Rating Before Increase Acceptable Increase in LAeq Noise Level
N0 4 dB, or to top of N0, whichever is greater
N1 3 dB
N2 1.5 dB
N3 0.5 dB
N4 0 dB
3 EXISTING AND FORECAST TRAIN MOVEMENTS
WestNet Rail provided information on train movements along the rail line between Ewington and the Port of Bunbury for existing and future conditions1. This information is presented in Table 3.1.
1 Pers. Comm. Geoff Brook, Manager Network Planning, WestNet Rail, 9 September 2009.

Lloyd George Acoustics
Reference: 8071043-03 Page 5
Table 3.1 – Existing and Future Train Movements
No. of Train Movements per Day
Forecast to 2013 Rail Section Existing
Without Perdaman With Perdaman
Ewington to Collie 8 22 26
Collie to Worsley 8 22 26
Worsley to Brunswick Jcn 24 44 48
Brunswick Jcn to Picton Jcn 48 68 72
Picton Jcn to Harbour Jcn 42 62 66
WestNet Rail advises that the forecast schedule is indicative of the additional services expected from the present day to 2013. As can be seen from Table 3.1, there is expected to be a significant increase in train traffic along the existing railway, irrespective of the development of the Perdaman plant. These additional train movements are the result of expected coal exports (12 additional movements between Ewington and the Port of Bunbury) and the expansion of operations at Worsley Alumina (8 additional movements between Worsley and the Port of Bunbury and 2 additional movements between Ewington and Worsley).
Note that Perdaman’s operations are expected to generate two train deliveries to the port each day, resulting in a total of four train movements between Shotts and the Port of Bunbury. It is understood that Perdaman proposes to haul 55 wagons using Q class locomotives.
4 NOISE PREDICTION METHODOLOGY
Train noise levels were predicted at various distances from the track, for both existing and future traffic conditions. Noise predictions were based on noise measurement results presented in the report Acoustic Assessment of Wagerup – Bunbury – Collie Rail Corridors2 and applied corrections according to the Calculation of Railway Noise (CoRN) algorithms. Using this method, LAeq noise levels were predicted.
The noise predictions were based on the following assumptions:
Train movements were assumed to consist of an equal mix of Q or S class locomotives and D or L class locomotives. The mix was assumed to be the same for both existing and future movements, however, all trains servicing the Perdaman plant were assumed to be Q class locomotives.
2 Herring Storer Acoustics (1998), Acoustic Assessment of Wagerup – Bunbury – Collie Rail Corridors, June 1998, Reference: 6472-98037.

Lloyd George Acoustics
Reference: 8071043-03 Page 6
All trains were assumed to be 45 wagons in length, with the exception of the Pardaman trains, which were taken to be 55 wagons long.
Trains were assumed to be operating at notch 5. This results in a 9 dB reduction relative to notch 8. This is consistent with the results of the Wagerup - Bunbury – Collie Rail Corridors study, which found that predictions using notch 8 as a typical train power setting tended to over-predicted actual, measured noise levels by more than 10 dB. Although, for this study, it is the relative difference between transport noise levels that is critical, the absolute noise level is important for determining the Noise Amenity Rating under the draft EPA Statement No. 14 and for comparison with the SPP Road and Rail Transport Noise external noise criteria.
The rail line was assumed to be at grade level and the ground was assumed to be flat between the rail line and the receiving location. Noise levels will be reduced where the line is in a cutting or where there is some other form of barrier between the source and receiver.
Predicted noise levels included a +2.5 dB façade correction.
No details were provided about the distribution of trains throughout the day, so it has been assumed that the train movements would be equally proportioned across the day and the night time period. Meaning that during the night it is assumed that there will be half the number of train movements, but in half the number of hours, when compared to the day time. As a result, the calculated LAeq (Day) and LAeq (Night) noise levels are identical. However, the results are compared against the night time criteria, since these are more stringent.
5 RESULTS AND ASSESSMENT
5.1 Existing Train Movements The results of the noise predictions for existing train movements are summarised in Table 5.1.
Table 5.1 suggests that existing transport noise levels are likely to exceed LAeq (Night) 55 dB at the following distances from the track:
Between Worsley and Brunswick Junction – up to 22 metres;
Between Brunswick Junction and Picton Junction - up to 38 metres; and
Between Picton Junction and the Port of Bunbury - up to 35 metres.

Lloyd George Acoustics
Reference: 8071043-03 Page 7
Table 5.1 – Predicted Noise Levels for Existing Train Movements, dB
Predicted LAeq (Day) and LAeq (Night) Noise Levels Rail Section
20m 30m 50m 100m 200m
Ewington to Collie 50.7 48.6 45.8 42.0 37.7
Collie to Worsley 50.7 48.6 45.8 42.0 37.7
Worsley to Brunswick Jcn 55.4 53.3 50.6 46.8 42.5
Brunswick Jcn to Picton Jcn 58.4 56.3 53.6 49.8 45.5
Picton Jcn to Harbour Jcn 57.9 55.8 53.0 49.2 44.9
Notes: (1) Number of train movements are taken from Table 3.1. (2) Values shown bolded in red (eg 57.9) exceed the night time noise “limit” criterion in the SPP Road and Rail
Transport Noise. However, the SPP Road and Rail Transport Noise does not apply to existing railways. (3) Values shown bolded in orange (eg 53.0) exceed the night time noise “target” criterion in the SPP Road and
Rail Transport Noise. However, the SPP Road and Rail Transport Noise does not apply to existing railways.
Using the predicted noise levels in Table 5.1 as a guide, Table 5.2 shows the Noise Amenity Ratings that would apply to residences at various distances from the track, in accordance with the draft EPA Statement No. 14. Note that the higher night time Noise Amenity Rating applies, since the predicted LAeq (Day) and LAeq (Night) noise levels are taken to be the same.
Table 5.2 – Noise Amenity Ratings for Existing Train Movements
Noise Amenity Rating Rail Section
20m 30m 50m 100m 200m
Ewington to Collie N3 N2 N2 N1 N0
Collie to Worsley N3 N2 N2 N1 N0
Worsley to Brunswick Jcn N3 N3 N3 N2 N1
Brunswick Jcn to Picton Jcn N4 N4 N3 N2 N2
Picton Jcn to Harbour Jcn N4 N4 N3 N2 N1
Note: (1) Noise Amenity Ratings are determined in accordance with Table 2.2, and are based on the predicted noise
levels presented in Table 5.1.
Table 5.3 therefore provides a guide as to the acceptable increase in transport noise level, based on the Noise Amenity Rating for existing train movements.
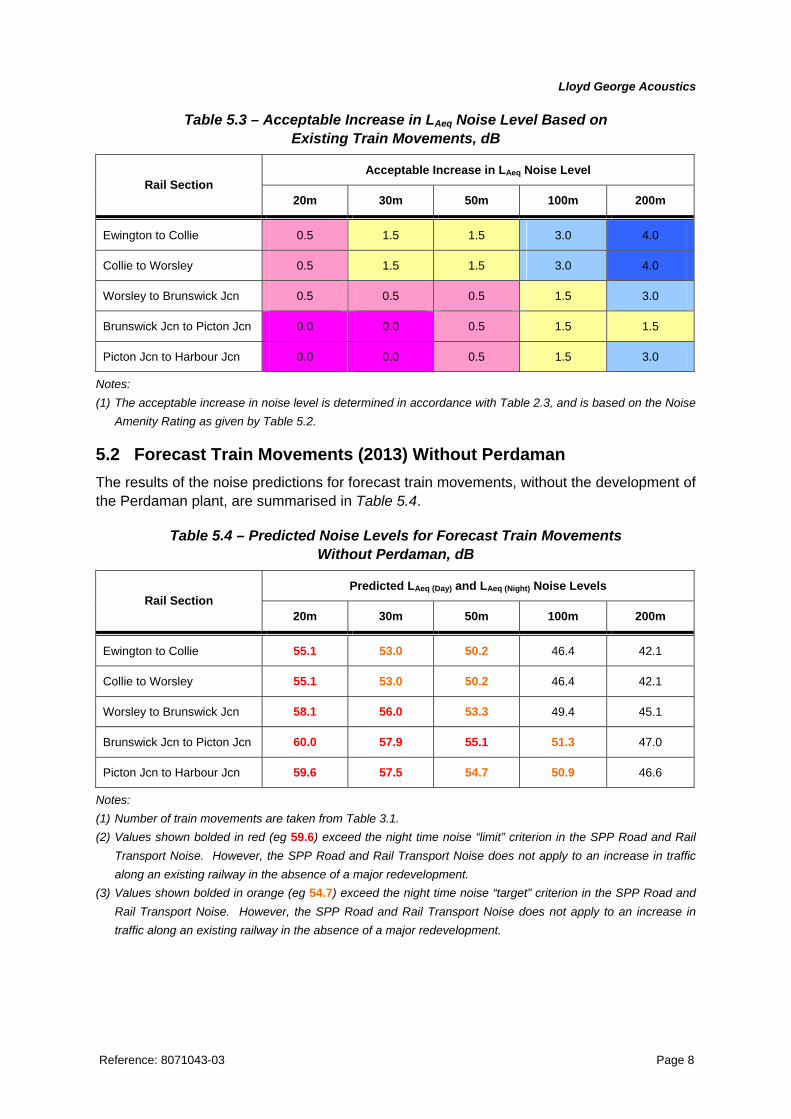
Lloyd George Acoustics
Reference: 8071043-03 Page 8
Table 5.3 – Acceptable Increase in LAeq Noise Level Based on Existing Train Movements, dB
Acceptable Increase in LAeq Noise Level Rail Section
20m 30m 50m 100m 200m
Ewington to Collie 0.5 1.5 1.5 3.0 4.0
Collie to Worsley 0.5 1.5 1.5 3.0 4.0
Worsley to Brunswick Jcn 0.5 0.5 0.5 1.5 3.0
Brunswick Jcn to Picton Jcn 0.0 0.0 0.5 1.5 1.5
Picton Jcn to Harbour Jcn 0.0 0.0 0.5 1.5 3.0
Notes: (1) The acceptable increase in noise level is determined in accordance with Table 2.3, and is based on the Noise
Amenity Rating as given by Table 5.2.
5.2 Forecast Train Movements (2013) Without Perdaman The results of the noise predictions for forecast train movements, without the development of the Perdaman plant, are summarised in Table 5.4.
Table 5.4 – Predicted Noise Levels for Forecast Train Movements Without Perdaman, dB
Predicted LAeq (Day) and LAeq (Night) Noise Levels Rail Section
20m 30m 50m 100m 200m
Ewington to Collie 55.1 53.0 50.2 46.4 42.1
Collie to Worsley 55.1 53.0 50.2 46.4 42.1
Worsley to Brunswick Jcn 58.1 56.0 53.3 49.4 45.1
Brunswick Jcn to Picton Jcn 60.0 57.9 55.1 51.3 47.0
Picton Jcn to Harbour Jcn 59.6 57.5 54.7 50.9 46.6
Notes: (1) Number of train movements are taken from Table 3.1. (2) Values shown bolded in red (eg 59.6) exceed the night time noise “limit” criterion in the SPP Road and Rail
Transport Noise. However, the SPP Road and Rail Transport Noise does not apply to an increase in traffic along an existing railway in the absence of a major redevelopment.
(3) Values shown bolded in orange (eg 54.7) exceed the night time noise “target” criterion in the SPP Road and Rail Transport Noise. However, the SPP Road and Rail Transport Noise does not apply to an increase in traffic along an existing railway in the absence of a major redevelopment.

Lloyd George Acoustics
Reference: 8071043-03 Page 9
Table 5.4 suggests that forecast transport noise levels, without the development of the Perdaman plant, are likely to exceed LAeq (Night) 55 dB at the following distances from the track:
Between Ewington and Worsley – up to 20 metres;
Between Worsley and Brunswick Junction – up to 36 metres;
Between Brunswick Junction and Picton Junction - up to 51 metres; and
Between Picton Junction and the Port of Bunbury - up to 48 metres.
Table 5.4 shows that, irrespective of whether the Perdaman proposal proceeds, future transport noise levels are expected to increase. The predicted increase in LAeq noise level is between 1.5 and 4.4 dB, and is shown in Table 5.5.
Table 5.5 Increase in Transport Noise Levels for Forecast Train Movements Without Perdaman
Rail Section Increase in LAeq Noise Level
Ewington to Collie 4.4 dB
Collie to Worsley 4.4 dB
Worsley to Brunswick Jcn 2.6 dB
Brunswick Jcn to Picton Jcn 1.5 dB
Picton Jcn to Harbour Jcn 1.7 dB
Note: (1) The predicted increase in noise level is obtained by subtracting the values in Table 5.1 from the
values in Table 5.4. Values may not match exactly due to rounding errors.
As can be seen by comparing Table 5.5 with the criteria in Table 5.3, the forecast increase in train activity along the existing rail line is expected to exceed the allowable increase in noise level from existing conditions, irrespective of the development of the Perdaman plant.
In assessing the impact of the Perdaman plant, it is first necessary to determine the Noise Amenity Rating that would apply, based on the noise levels at residences immediately before the increase in transport due to the proposal. Using the predicted noise levels in Table 5.4 as a guide, Table 5.6 shows the Noise Amenity Ratings that would apply to residences at various distances from the track, based on forecast train movements without the development of the Perdaman plant.

Lloyd George Acoustics
Reference: 8071043-03 Page 10
Table 5.6 – Noise Amenity Ratings for Forecast Train Movements Without Perdaman
Noise Amenity Rating Rail Section
20m 30m 50m 100m 200m
Ewington to Collie N3 N3 N2 N2 N1
Collie to Worsley N3 N3 N2 N2 N1
Worsley to Brunswick Jcn N4 N4 N3 N2 N1
Brunswick Jcn to Picton Jcn N4 N4 N3 N3 N2
Picton Jcn to Harbour Jcn N4 N4 N3 N3 N2
Note: (1) Noise Amenity Ratings are determined in accordance with Table 2.2, and are based on the predicted noise
levels presented in Table 5.4.
Table 5.7 therefore provides a guide as to the acceptable increase in transport noise level permissible for the Perdaman proposal, based on the Noise Amenity Rating for forecast train movements, prior to development of the plant.
Table 5.7 – Acceptable Increase in LAeq Noise Level Based on Forecast Train Movements Without Perdaman, dB
Acceptable Increase in LAeq Noise Level Rail Section
20m 30m 50m 100m 200m
Ewington to Collie 0.5 0.5 1.5 1.5 3.0
Collie to Worsley 0.5 0.5 1.5 1.5 3.0
Worsley to Brunswick Jcn 0.0 0.0 0.5 1.5 3.0
Brunswick Jcn to Picton Jcn 0.0 0.0 0.5 0.5 1.5
Picton Jcn to Harbour Jcn 0.0 0.0 0.5 0.5 1.5
Note: (1) The acceptable increase in noise level is determined in accordance with Table 2.3, and is based on the Noise
Amenity Rating as given by Table 5.6.
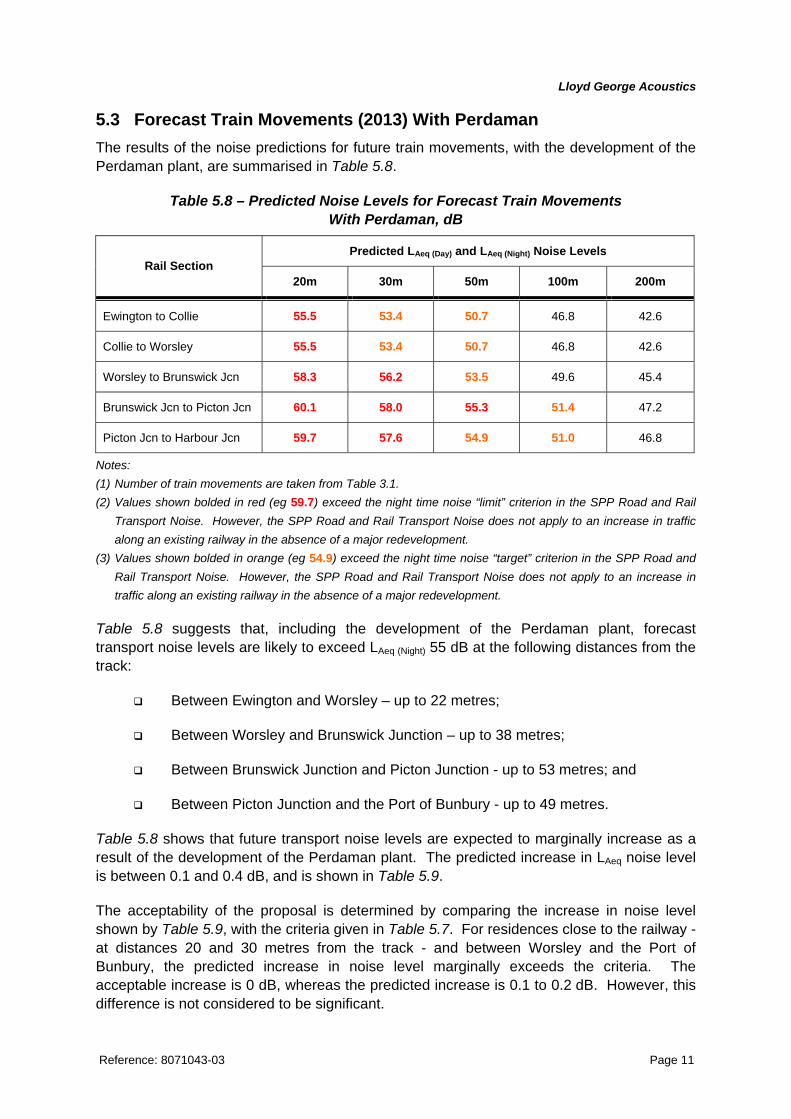
Lloyd George Acoustics
Reference: 8071043-03 Page 11
5.3 Forecast Train Movements (2013) With Perdaman The results of the noise predictions for future train movements, with the development of the Perdaman plant, are summarised in Table 5.8.
Table 5.8 – Predicted Noise Levels for Forecast Train Movements With Perdaman, dB
Predicted LAeq (Day) and LAeq (Night) Noise Levels Rail Section
20m 30m 50m 100m 200m
Ewington to Collie 55.5 53.4 50.7 46.8 42.6
Collie to Worsley 55.5 53.4 50.7 46.8 42.6
Worsley to Brunswick Jcn 58.3 56.2 53.5 49.6 45.4
Brunswick Jcn to Picton Jcn 60.1 58.0 55.3 51.4 47.2
Picton Jcn to Harbour Jcn 59.7 57.6 54.9 51.0 46.8
Notes: (1) Number of train movements are taken from Table 3.1. (2) Values shown bolded in red (eg 59.7) exceed the night time noise “limit” criterion in the SPP Road and Rail
Transport Noise. However, the SPP Road and Rail Transport Noise does not apply to an increase in traffic along an existing railway in the absence of a major redevelopment.
(3) Values shown bolded in orange (eg 54.9) exceed the night time noise “target” criterion in the SPP Road and Rail Transport Noise. However, the SPP Road and Rail Transport Noise does not apply to an increase in traffic along an existing railway in the absence of a major redevelopment.
Table 5.8 suggests that, including the development of the Perdaman plant, forecast transport noise levels are likely to exceed LAeq (Night) 55 dB at the following distances from the track:
Between Ewington and Worsley – up to 22 metres;
Between Worsley and Brunswick Junction – up to 38 metres;
Between Brunswick Junction and Picton Junction - up to 53 metres; and
Between Picton Junction and the Port of Bunbury - up to 49 metres.
Table 5.8 shows that future transport noise levels are expected to marginally increase as a result of the development of the Perdaman plant. The predicted increase in LAeq noise level is between 0.1 and 0.4 dB, and is shown in Table 5.9.
The acceptability of the proposal is determined by comparing the increase in noise level shown by Table 5.9, with the criteria given in Table 5.7. For residences close to the railway - at distances 20 and 30 metres from the track - and between Worsley and the Port of Bunbury, the predicted increase in noise level marginally exceeds the criteria. The acceptable increase is 0 dB, whereas the predicted increase is 0.1 to 0.2 dB. However, this difference is not considered to be significant.

Lloyd George Acoustics
Reference: 8071043-03 Page 12
Table 5.9 Increase in Transport Noise Levels Due to the Perdaman Proposal
Rail Section Increase in LAeq Noise Level
Ewington to Collie 0.4 dB
Collie to Worsley 0.4 dB
Worsley to Brunswick Jcn 0.2 dB
Brunswick Jcn to Picton Jcn 0.1 dB
Picton Jcn to Harbour Jcn 0.2 dB
Note: (1) The predicted increase in noise level is obtained by subtracting the values in Table 5.4 from the
values in Table 5.8. Values may not match exactly due to rounding errors.
The predicted increase in transport noise levels generated by the Perdaman development also needs to be considered in the overall context of a much larger predicted increase in noise, caused by a considerable growth in forecast traffic along this section of railway. Table 5.10 shows the total change in predicted transport noise levels from existing conditions. It can be seen from Table 5.10 that the Perdaman proposal is predicted to contribute only a small proportion to the overall increase in transport noise levels. The increase in LAeq noise levels generated by the Perdaman development alone is predicted to be between 0.1 and 0.4 dB, compared to the overall increase, which is between 1.7 and 4.8 dB.
Table 5.10 Total Increase in Transport Noise Levels for Forecast Train Movements With Perdaman
Increase in LAeq Noise Level
Rail Section Increase Due to
Perdaman Increase Due to Other Factors
Total Increase
Ewington to Collie 0.4 dB 4.4 dB 4.8 dB
Collie to Worsley 0.4 dB 4.4 dB 4.8 dB
Worsley to Brunswick Jcn 0.2 dB 2.6 dB 2.9 dB
Brunswick Jcn to Picton Jcn 0.1 dB 1.5 dB 1.7 dB
Picton Jcn to Harbour Jcn 0.2 dB 1.7 dB 1.9 dB
Note: (1) The total predicted increase in noise level is obtained by subtracting the values in Table 5.1 from the values in
Table 5.8. These values can also be obtained by adding the figures in Table 5.9 and Table 5.5. Values may not match exactly due to rounding errors.

Lloyd George Acoustics
Reference: 8071043-03 Page 13
Areas where existing residences are known to be in close proximity to the rail line are:
Collie – some residences within 20 to 30 metres of the track;
Brunswick Junction – some residences within 20 to 40 metres of the track;
Picton – an isolated residence about 25 metres of the track; and
Bunbury– several residences within 20 to 40 metres of the track.
At all other known locations, residences are more than 40 metres from the track.
Where residences are close to the track, noise barriers could be considered. However, it is recommended that noise mitigation be considered as a strategic response to the expected growth in train movements along this section of railway, which results from a number of industry developments. This is likely to then achieve the best overall noise management outcome.
6 CONCLUSION
This study predicts future LAeq (Day) and LAeq (Night) transport noise levels, at various distances from the track, based on forecast train movements along the rail line between Ewington and the Port of Bunbury. The forecasts anticipate a significant increase in train traffic along the existing railway, irrespective of the development of the Perdaman plant. As a result, LAeq noise levels are expected to increase overall by between 1.7 and 4.8 dB, depending on the section of track.
However, the Perdaman’s proposal is predicted to contribute only a small proportion to this overall increase in transport noise levels. The increase in LAeq noise levels generated by the Perdaman development alone is predicted to be between 0.1 and 0.4 dB. This is considered to be negligible, relative to the predicted change overall.
The predicted noise impact has been compared to the criteria in the draft EPA Statement No. 14. For residences in close proximity to the railway, and between Worsley and the Port of Bunbury, the predicted increase in noise level marginally exceeds the criteria. The acceptable increase is 0 dB, whereas the predicted increase is 0.1 to 0.2 dB. However, this difference is not considered to be significant.
Where residences are close to the track, noise barriers could be considered. However, it is recommended that noise mitigation be considered as a strategic response to the expected growth in train movements along this section of railway, which results from a number of industry developments. This is likely to then achieve the best overall noise management outcome.
Lloyd George Acoustics
APPENDIX A
Terminology

Lloyd George Acoustics
Reference: 8071043-03 Page A1
The following is an explanation of the terminology used throughout this report.
A-Weighting An A-weighted noise level has been filtered in such a way as to represent the way in which the human ear perceives sound. This weighting reflects the fact that the human ear is not as sensitive to lower frequencies as it is to higher frequencies. An A-weighted sound pressure level is described as LA dB or dB(A).
Decibel The decibel (dB) describes the sound pressure level of a noise source. It is a logarithmic scale referenced to the threshold of hearing.
LAeq
The LAeq level represents the “average” A-weighted noise energy during a measurement period. Technically speaking it is the equivalent steady state A-weighted noise level, which, in a specified time period, contains the same acoustic energy as the actual time-varying noise level over the same measurement period.
LAeq (Day)
The LAeq (Day) level is the logarithmic average of the 16 hourly LAeq levels from 6am to 10pm on the same day.
LAeq (Night)
The LAeq (Night) level is the logarithmic average of the eight hourly LAeq levels from 10pm to 6am.
Chart of Noise Level Descriptors