Collie SuperTown Combined Report - South West report - collie supertow… · Collie SuperTown...
130
Collie SuperTown Combined Report South West Development Commission Final Draft Report April, 2012
-
Upload
nguyenminh -
Category
Documents
-
view
217 -
download
1
Transcript of Collie SuperTown Combined Report - South West report - collie supertow… · Collie SuperTown...

Collie SuperTown
Combined Report
South West Development Commission
Final Draft Report
April, 2012

Collie SuperTown Combined Report
Final Draft Report
i
Document Control
Job ID: 16132
Job Name: SWDC ED Plans for Three SuperTowns in SW WA
Client: South West Development Commission
Client Contact: Richard Oades
Project Manager: Michael Campbell
Email: [email protected]
Telephone: 0409 349 256
Document Name: AECgroup Report - Collie SuperTown Combined Report - Final Draft Report
Last Saved: 10/4/2012 2:36 PM
Version Date Reviewed Approved
Draft Report 20 February 2012 MC SS
Draft Report V2.0 24 February 2012 MC SS
Final Draft Report 2 March 2012 MC SS
Final Combined Report 10 April 2012 MC SS

Collie SuperTown Combined Report
Final Draft Report
ii
Executive Summary
Introduction
SuperTowns (Regional Centres Development Plan) is a Royalties for Regions initiative to encourage regional communities in the southern half of the state to plan and prepare for the future so they can take advantage of opportunities created by Western Australia’s population growth to 2050. Western Australia's population is predicted to more than double over the next 40 years to 4.9 million people.
The SuperTowns' vision is to have balanced communities, with lifestyle options and access to services. They will have affordable, quality housing and a diverse range of job opportunities. The towns will offer more choices for people to live in regional areas and an attractive alternative to living in the metropolitan area.
Nine SuperTowns were selected throughout Western Australia to achieve this vision and accommodate future population growth. Within the South West Development Commission (SWDC) Region the areas Manjimup, Collie and Margaret River were selected as SuperTowns under the Royalties for Regions program.
This document provides the Economic Development Plan for the Shire of Collie.
Collie benefits from a range of economic drivers which will assist in its economic development into the future. Whilst economic diversification is a key focus of the economic development of Collie, improvements in the amenity of Collie will also be required in order to attract the desired population to the area.
Population & Demographics
Collie has a population of 9,470 people and has historically experienced slow growth of 0.5% p.a. - well below State and regional averages. Collie has a relatively young population due to high proportions of families with children. However, Collie has historically had difficulties in retaining its youth post-school due to a limited availability of education and training and employment opportunities outside of the mining and industrial sector activities.
The majority of residents of working age are blue collar workers due to the strength of the local mining and industrial sectors which have high demands for technicians and trades workers and machinery operators and drivers.
Average incomes in Collie are typically above the State and broader regional averages. This is largely due to the higher wages that are paid by the mining sector. Higher average wages usually results in higher median dwelling prices, however, Collie has an affordable housing market with lower median dwelling prices compared to the median for the SWDC Region and regional Western Australia.
Employment & Business Activity
Collie is the mining and industrial hub of the SWDC region and employs around 45% of its workforce either in local coal mining, alumina refining or electricity generated from the local coal production activities.
Collie has a labour force of 4,918 people and 4,598 people were employed in June Quarter 2011. Unemployment rates in Collie have historically been substantially higher than the SWDC region and Western Australia unemployment rates.
Sixty percent (60%) of Collie's businesses are small businesses and almost a quarter of all businesses undertake agriculture, forestry and fishing activities. Collie also has higher proportions of medium-sized businesses (20 to 49) as well as larger businesses (100+ employees) than the SWDC region and State averages. This is due to the presence of major industry players in the mining and manufacturing sector in Collie as well as a good representation of medium-sized construction businesses and supporting supply chain.
Disclaimer:
Whilst all care and diligence have been exercised in the preparation of this report, AEC Group Limited does not warrant the accuracy of the information contained within and accepts no liability for any loss or damage that
may be suffered as a result of reliance on this information, whether or not there has been any error, omission or negligence on the part of AEC Group Limited or their employees. Any forecasts or projections used in the
analysis can be affected by a number of unforeseen variables, and as such no warranty is given that a
particular set of results will in fact be achieved.

Collie SuperTown Combined Report
Final Draft Report
iii
Investment & Major Projects
Collie is currently experiencing significant levels of investment in mining and industry related projects and supporting infrastructure. The Shotts Industrial Estate is one of these projects, and is located adjacent to the Premier Coal mine. The estate is a strategic land project for coal-related industrial uses and will look to accommodate five tenants, complementing the Coolangatta heavy industrial estate. $83 million in funding has been provided by the State government to fund infrastructure upgrades to support Shotts Industrial Park.
Perdaman Chemicals and Fertilisers and Premier Coal will be the major tenants of the estate. Perdaman is planning to develop a $3.8 billion urea manufacturing plant at the site.
Significant investment of $2 billion has also made by BHP Billiton in the expansion of the Worsley Alumina Refinery.
These major projects will have the capacity to drive economic activity, not only during the construction phase but during the operational phases as well.
Economic Growth
Collie's estimated Gross Regional Product (GRP) has grown steadily by an average of 14.2% per annum since 2006-07 to over $2 billion in 2010-11.
Overall, 90% of Collie's industry value add is generated by mining, electricity, manufacturing and construction types of activities - making Collie a mining and industrial focussed region with little diversification. Local industry is also required to service the growing population in Collie, providing services such as education, retail and health care. Key opportunities for the Collie LGA in the future are likely to centre around capturing and localising the existing major industries' supply chains to facilitate economic growth.
Figure ES.1: Industry Structure
Source: AECgroup
Future economic growth in Collie will largely be determined by the ability of the area to diversify its economic base whilst continuing to support the activity of its leading mining and industrial sectors. Job creation will be important for sustaining population growth, as will be the provision of infrastructure and services for the local population.
Foundation Industry
•Coal mining & Electricity Generation
•Metals manufacturing
Population Serving
•Due to increased population growth, an extended regional catchment and income growth
Opportunity
• Capture of supply chains from mining sector including processing, transportation and energy sector activity

Collie SuperTown Combined Report
Final Draft Report
iv
The SuperTown Target
Under the SuperTowns’ growth plan, the aspirational growth target for Collie is a doubling of the population by 2031, resulting in an average annual growth rate of 3.4% per annum to 15,580 residents by 2031. This is equivalent to an additional 371 residents each year, which is roughly 300 more than the historical trend. This growth target is ambitious and will require significant proactive economic development in order to be achieved.
Obtaining this stretch target will require the average annual delivery of 179 new dwellings each year. This rate of dwelling development significantly exceeds the recent trend of an average delivery of 112 dwellings per year, so in order to facilitate population growth, the housing supply will also need to increase.
Figure ES. 1: Collie SuperTown Population Target, 2010-2031
Source: ABS (2011a)
Key Economic Drivers
There are four key economic growth drivers for Collie:
Increased Demand for Coal and Electricity: Population growth and economic growth in Western Australia and the South West region are expected to continue into the future, driving demand for coal and electricity from Collie's industry. As such, this future demand will ensure the future economic growth of Collie.
Coal and Alumina Sector: The Collie economy is benefitting from a range of major projects which are expanding its capacity for coal and alumina production. The expanded economic capacity of these expansions will continue to provide for economic growth in the future.
Climate Change and Carbon Tax Impacts: Climate change is making an impact on the global environment. The enactment of the Carbon Tax in July 2012 will have an impact on the way Australian businesses operate. Managing these impacts will be essential to driving future growth in Collie.
Internet: The internet has changed the way that people work and live as well as the way in which business is conducted. Ensuring that the Collie economy can tap into the internet with high speeds will be critical to the future economy.
0.0%
1.0%
2.0%
3.0%
4.0%
5.0%
6.0%
0
3,000
6,000
9,000
12,000
15,000
18,000
Po
pu
latio
n G
row
th R
ate
(%)
Po
pu
lati
on
Ta
rge
t
Collie Township Collie Township SuperTown Growth Rate Collie Township Historical Trend

Collie SuperTown Combined Report
Final Draft Report
v
Issues & Challenges
A range of issues and challenges are evident in the Collie economy which will need to be addressed if the town is to reach its goal of becoming a SuperTown. These issues include:
Existing shortage of skilled labour
Economic dependence on the coal industry
Lack of translation of the economic activity in the region into local jobs
Lack of broadband connections
Low rates of population growth and an ageing demographic
Lack of professional service delivery and supply chain gaps
These issues will need to be addressed in order for Collie to succeed in reaching its SuperTown population growth target of doubling its population by 2031. Diversifying the economy is of critical importance in Collie. A broader range of job opportunities will give incentive to young adults to stay and work in the region rather than having to leave in order to find suitable employment. Likewise, creating a range of post-school education and training options will stem the flow of young adults leaving Collie to gain further qualifications and also up-skill residents, helping to alleviate the shortage of skilled labour in Collie.
Opportunities
A range of opportunities are available to Collie to grow its economy into the future, these include:
Mining (including coal mining)
Heavy Manufacturing (including alumina manufacturing and other heavy industrial processes)
Utilities (including electricity generation)
Light Industry, Transport and Logistics (including light industry and logistics operations)
Professional Services (including population-related professional services and business-related professional services)
Health and Community (including health services, aged care services and allied health services)
Education (including high-quality secondary schooling and industry-oriented tertiary education)
Retail (including food and other retailing)
Tourism (including outdoor leisure and water activities)
The Economic Development Plan
Clearly defined and targeted action (as identified by the Economic Development Framework and both Strategic and Economic Development Initiatives) will assist in supporting the existing business community, marketing the shire, attracting and facilitating new investments into the shire and will assist in developing the local workforce. The key Strategic Initiatives are transformational projects which are inextricably linked to the Economic Development Initiatives. These projects will provide a solid base for future economic and residential growth.
This economic development plan will provide for a long-term foundation on which to achieve the goals of the SuperTowns’ initiative.

Collie SuperTown Combined Report
Final Draft Report
vi
Figure ES.2: Economic Development Plan Overview
Source: AECgroup
SuperTowns Vision: “To have balanced, well-connected regional communities, with lifestyle options and access to services – SuperTowns
will have affordable, quality housing and a growing and diverse range of job opportunities. They will offer more choices for people living in regional areas and an attractive alternative to living in the metropolitan area”
What Does it Take to
Become a SuperTown?
Improve amenity.
Grow the population.
Secure jobs locally.
Diversify the economy.
Change perceptions.
Economic Development Plan
Strategic Projects
1. Redevelopment of CBD: transforming the CBD including improving amenity of the river, redevelopment of the Wallsend Precinct, revitalisation of CBD and new community swimming pool.
2. Tourism Precincts Improvements: including new Motorplex and Lake Kepwari.
3. Wilson Park Redevelopment: urban renewal project to reinvigorate neighbourhood and raise socio-economic standing.
Economic Development Initiatives
1. Support Existing Business: develop programs to proactively engage with and assist the growth of local companies.
2. Market the Shire: marketing the Shire for new residences and businesses.
3. Attract and Facilitate New Investment: through pro-active business attraction and support.
4. Develop the Local Workforce: develop and attract new skills in the region.
Outcomes
Increased economic prosperity.
Improved economic capacity.
Increased retention of economic benefits in the local
region.
Increased opportunities.
Improved sustainability.
Increased service provision.
Collie SuperTown Combined Report
Final Draft Report
vii
Economic Growth Influences
Collie benefits from significant competitive advantages and opportunities, which could underpin strong economic and population growth over the next 20 years. In particular, the concentration of major mining, metal manufacturing and electricity generation, relative proximity to Bunbury and the associated Port and a diversity of outdoor and water sport attractions in the surrounding area, present opportunities to leverage external growth drivers and build greater local economic diversification.
However, there are some areas of weakness which will need to be addressed in order to support desired economic and population growth in Collie, which include:
An underrepresentation of skilled labour in the region, presenting capacity constraints to local business and industry growth and resulting in the inability to leverage the opportunity to become a major service centre.
Lack of translation of economic activity into local employment, with a combination of strong Drive-In/Drive-Out travel patterns to Collie from Bunbury and the surrounding region.
Low population growth and an ageing population demographic.
Lack of professional service delivery in Collie, due to the relative small size of the town and its local labour force as well as strong competition from Bunbury.
Lack of retail and residential service offering.
Collie is located within Bunbury’s regional catchment for major services like health and education.
Gaps in the supply chain with regards to industrial and professional services.
In addition to local advantages and weaknesses, a number of future economic drivers will also influence local economic conditions (such as population growth as well as the State and national economic outlook). Whilst many of these drivers are outside of the control of the Shire of Collie, proactively planning for the management of these impacts will be essential to achieving desired future economic and population outcomes.
Future Direction of the Collie Economy
The growth of the local economy needs to translate into employment if the residential population is to grow sufficiently large to support Collie’s transformation into a SuperTown. While mining and bauxite/alumina refining generate significant economic value and incomes, the operations have failed to translate to the generation of significant local jobs, reflected in above average unemployment rates in Collie.
Leveraging existing and potential new investments in mining and the bauxite/alumina refinery can create opportunities for growth in the supply chain and support service industries. This will require provision of quality, well located serviced industrial land for both light industry and transport / logistics businesses, which generate high employment yields. Additionally, commercial office floorspace is required in the township to increase Collie’s capture of professional service supply chain elements from these anchor industries.
The growth of the population of Collie, as it transforms into a SuperTown will increase demand for health and education related services. This demand will be further influenced by drivers such as population ageing and income growth. Growth in demand for these services will generate opportunities for increased economic activity, with the health sector currently the largest employing industry in Australia as well as one of the fastest growing. Opportunities exist to support the creation of a health precinct in Collie that builds upon general hospital-based health care provision to include ancillary health, sports health, retirement villages and aged care facilities.
In terms of education, increasing the scope of offering to capture secondary and tertiary education demand that currently escapes the local economy, to areas like Bunbury, will require increased cooperation and linkages with local industry. The critical mass of population in Collie in 20 years will likely remain insufficient for a full scale tertiary education offering, but partnership with mining, utility and heavy metal manufacturing

Collie SuperTown Combined Report
Final Draft Report
viii
industries can assist in the establishment and growth of niche tertiary education facilities and services. This may include industry-specific research capability. These specialty capabilities will assist in not only diversifying the economy but can act as a catalyst for change, attracting additional businesses to the area. The opportunity to offer a residential high school for families located inland from Collie who cannot afford a private boarding school may also prove to be an opportunity for education in Collie, particularly given the fact that there is a decommissioned aged care facility currently located adjacent to the existing high school.
Attracting new residents to Collie will require increases in local amenity. This includes reconnecting with the natural environment (particularly the Collie River) and revitalisation of public realm (such as the Central Business District). It also requires an increase in the scale, quality and diversity of retail offering in Collie. Enhancing the quality of the natural and urban environments along with some urban renewal in areas such as Wilson Park and increasing resident access to quality retail, health and education services will underpin efforts to attract and retain an increased population in Collie to support its transformation in a SuperTown.
This improved amenity will also increase the attractiveness of Collie to visitors. Collie has the opportunity to increase the quality of retail, café and restaurant offering for residents by capturing expenditure from visitors attracted by the region’s outdoor leisure and water sport activities. Attracting more visitors to the area would be assisted by strong transport interconnections with Bunbury and Perth and effective branding and marketing to counter Collie’s existing industrial profile. This leisure-based tourism can also be supplemented by heritage and industrial tourism activities, as well as increased business-related travel associated with the growth of the local professional services sector.

Collie SuperTown Combined Report
Final Draft Report
ix
Table of Contents
DOCUMENT CONTROL ....................................................................................... I
EXECUTIVE SUMMARY .................................................................................... II
TABLE OF CONTENTS ...................................................................................... IX
1. INTRODUCTION ....................................................................................... 1
1.1 BACKGROUND .............................................................................................. 1 1.2 PROJECT OVERVIEW ....................................................................................... 1 1.3 GEOGRAPHY ................................................................................................ 2
2. POPULATION & DEMOGRAPHIC PROFILE .................................................. 3
2.1 POPULATION & DEMOGRAPHICS .......................................................................... 3 2.1.1 HISTORICAL POPULATION ........................................................................ 3 2.1.2 POPULATION PROJECTIONS ...................................................................... 3 2.1.3 AGE STRUCTURE ................................................................................. 6 2.1.4 FAMILY/HOUSEHOLD TYPES ..................................................................... 8 2.1.5 HOUSEHOLD & DWELLING GROWTH ............................................................ 9
2.2 SOCIO-ECONOMIC CHARACTERISTICS .................................................................... 9 2.2.1 EDUCATION/QUALIFICATIONS ................................................................... 9 2.2.2 OCCUPATION .................................................................................... 10 2.2.3 INCOME .......................................................................................... 11 2.2.4 HOUSE PRICES .................................................................................. 11
2.3 KEY FINDINGS ............................................................................................ 13
3. EMPLOYMENT & BUSINESS ACTIVITY ..................................................... 14
3.1 LABOUR FORCE & UNEMPLOYMENT ...................................................................... 14 3.2 EMPLOYMENT & BUSINESS ............................................................................... 15
3.2.1 EMPLOYMENT BY INDUSTRY ..................................................................... 15 3.2.2 BUSINESS BY INDUSTRY ........................................................................ 15 3.2.3 BUSINESSES BY EMPLOYMENT SIZE ............................................................ 16 3.2.4 BUSINESSES BY TURNOVER ..................................................................... 17 3.2.5 SMALL BUSINESS ............................................................................... 17 3.2.6 TOURISM ACTIVITY.............................................................................. 18
3.3 KEY FINDINGS ............................................................................................ 20
4. INVESTMENT & MAJOR PROJECTS .......................................................... 21
4.1 BUILDING APPROVALS & PROPERTY MARKET ........................................................... 21 4.1.1 RESIDENTIAL APPROVALS ....................................................................... 21 4.1.2 NON-RESIDENTIAL APPROVALS ................................................................ 21 4.1.3 LAND RELEASES & DEVELOPMENTS ............................................................ 22
4.2 MAJOR PROJECTS ......................................................................................... 23 4.2.1 SHOTTS INDUSTRIAL ESTATE................................................................... 23 4.2.2 WORSLEY ALUMINA REFINERY EXPANSION .................................................... 23
5. ECONOMIC GROWTH .............................................................................. 24
5.1 CURRENT GROSS REGIONAL PRODUCT .................................................................. 24 5.2 FOUNDATION INDUSTRY - COAL MINING & POWER GENERATION ..................................... 25 5.3 FOUNDATION INDUSTRY - METALS MANUFACTURING ................................................... 26 5.4 KEY FINDINGS ............................................................................................ 27
6. ECONOMIC OUTLOOK ............................................................................. 28
6.1 FUTURE ECONOMIC DRIVERS............................................................................. 28 6.1.1 INTERNAL DRIVERS ............................................................................. 28 6.1.2 EXTERNAL DRIVERS ............................................................................. 28 6.1.3 REGIONAL & LOCAL DRIVERS .................................................................. 30
6.2 POTENTIAL FUTURE ECONOMIC GROWTH PATH ......................................................... 31 6.3 KEY FINDINGS ............................................................................................ 33
7. REGIONAL GAP ANALYSIS...................................................................... 34

Collie SuperTown Combined Report
Final Draft Report
x
7.1 IMPORT & EXPORT ANALYSIS ............................................................................ 34 7.2 SUPPLY CHAIN ANALYSIS ................................................................................. 36 7.3 COMPARATIVE ASSESSMENTS ............................................................................ 42 7.4 JOURNEY TO WORK ....................................................................................... 44 7.5 KEY FINDINGS ............................................................................................ 45
8. OPPORTUNITIES ASSESSMENT ............................................................... 46
8.1 LOCATION QUOTIENTS.................................................................................... 46 8.2 COMPETITIVE ASSESSMENT .............................................................................. 49
8.2.1 COMPETITIVE EDGE ............................................................................. 50 8.2.2 AREAS FOR IMPROVEMENT ...................................................................... 50
8.3 CLUSTER MAPPING ........................................................................................ 52 8.4 KEY FINDINGS ............................................................................................ 55
9. INDUSTRIAL LAND ASSESSMENT............................................................ 56
9.1 EXISTING SUPPLY & DEMAND ............................................................................ 56 9.2 FUTURE DEMAND FOR LAND .............................................................................. 56 9.3 KEY FINDINGS ............................................................................................ 57
10. RETAIL ASSESSMENT ............................................................................. 58
10.1 CATCHMENT ANALYSIS ................................................................................... 58 10.2 POPULATION GROWTH .................................................................................... 58
10.2.1 POPULATION PROJECTIONS ..................................................................... 59 10.3 RETAIL SUPPLY ............................................................................................ 60
10.3.2 RETAIL SUPPLY OUTSIDE THE CATCHMENT .................................................... 62 10.4 RETAIL EXPENDITURE ..................................................................................... 64
10.4.1 AVERAGE HOUSEHOLD RETAIL EXPENDITURE ................................................. 64 10.4.2 FORECAST HOUSEHOLD RETAIL EXPENDITURE POTENTIAL ................................... 64 10.4.3 MARKET SHARE ANALYSIS ...................................................................... 65 10.4.4 ESTIMATED RETAIL EXPENDITURE WITHIN THE CATCHMENT ................................. 66
10.5 RETAIL DEMAND .......................................................................................... 66 10.6 CURRENT DEMAND VS SUPPLY ........................................................................... 67 10.7 FUTURE DEMAND VS SUPPLY............................................................................. 68 10.8 KEY FINDINGS ............................................................................................ 69
11. COMMERCIAL & GOVERNMENT OFFICES ................................................. 70
11.1 METHODOLOGY ............................................................................................ 70 11.2 CURRENT DEMAND ........................................................................................ 71
11.2.1 COMMERCIAL OFFICE SPACE DEMAND ......................................................... 71 11.2.2 GOVERNMENT OFFICE SPACE DEMAND ........................................................ 73
11.3 PROJECTED FUTURE DEMAND ............................................................................ 73 11.3.1 COLLIE LABOUR FORCE GROWTH .............................................................. 73 11.3.2 FUTURE COMMERCIAL FLOORSPACE DEMAND ................................................. 74 11.3.3 FUTURE GOVERNMENT FLOORSPACE DEMAND ................................................. 75
11.4 KEY FINDINGS ............................................................................................ 76
12. FUTURE OPPORTUNITIES & GAPS .......................................................... 77
12.1 ECONOMIC OPPORTUNITIES .............................................................................. 77 12.2 POTENTIAL IMPEDIMENTS................................................................................. 81
13. KEY ECONOMIC DRIVERS & IMPORTANT TRENDS ................................... 82
13.1 INCREASED DEMAND FOR COAL & ELECTRICITY ........................................................ 82 13.2 COAL & ALUMINA SECTOR EXPANSION .................................................................. 82 13.3 CLIMATE CHANGE & CARBON TAX IMPACTS ............................................................ 83 13.4 INTERNET .................................................................................................. 84
14. ECONOMIC ISSUES & CHALLENGES ........................................................ 85
14.1 SKILLED LABOUR SHORTAGE ............................................................................. 85 14.2 ECONOMIC DEPENDENCE ON THE COAL INDUSTRY ..................................................... 86 14.3 TRANSLATION OF ECONOMIC ACTIVITY INTO LOCAL EMPLOYMENT .................................... 87 14.4 BROADBAND INTERNET CONNECTIONS .................................................................. 88 14.5 LOW POPULATION GROWTH & AGEING POPULATION DEMOGRAPHIC .................................. 88 14.6 PROFESSIONAL SERVICE DELIVERY ...................................................................... 90

Collie SuperTown Combined Report
Final Draft Report
xi
14.7 SUPPLY CHAIN OF INDUSTRIAL & PROFESSIONAL SERVICES ........................................... 91
15. ECONOMIC DEVELOPMENT PLAN ............................................................ 93
15.1 OVERVIEW ................................................................................................. 93 15.2 STRATEGIC PROJECTS .................................................................................... 95 15.3 ECONOMIC DEVELOPMENT INITIATIVES .................................................................. 96
15.3.1 SUPPORTING EXISTING BUSINESSES .......................................................... 96 15.3.2 MARKET THE SHIRE ............................................................................. 97 15.3.3 ATTRACT & FACILITATE NEW INVESTMENT .................................................... 97 15.3.4 DEVELOP THE LOCAL WORKFORCE ............................................................. 98
16. IMPLEMENTATION PLAN ........................................................................ 99
REFERENCES ............................................................................................... 107
APPENDIX A: MODELLING APPROACH .......................................................... 110
APPENDIX B: JOURNEY TO WORK DETAILS .................................................. 112
APPENDIX C: DETAILED LOCATION QUOTIENTS ........................................... 114
APPENDIX D: GRP METHODOLOGY ............................................................... 116

Collie SuperTown Combined Report
Final Draft Report
1
1. Introduction
1.1 Background
In recent years, a combination of robust migration-led population growth and increasingly constrained metropolitan housing markets has led to an increase in median house prices across the Perth urban area and a significant deterioration in housing affordability. The lack of population decentralisation in Western Australia limited the capacity for the State as a whole to accommodate new residents without rapid price growth, due to limited genuine alternate residential centres outside of the metropolitan area.
To provide greater levels of residential housing choice for a growing population, capitalise on existing infrastructure and capture a greater share of increased business investment in primary industries, the Government of Western Australia, through the Royalties for Regions program, established the Regional Centres Development Plan. In this Plan, nine regional centres or “SuperTowns” were identified - one of these being Collie.
The SuperTowns’ vision is to have balanced communities, with lifestyle options and access to services, with affordable, quality housing and a diverse range of job opportunities, offering an attractive alternative to living in the metropolitan area.
Collie is one of the twelve LGAs located in the South West Development Region1 in Western Australia. Augusta-Margaret River and Manjimup were also named as SuperTowns within the South West Development Region.
The town of Collie is located 60 kilometres from the regional City of Bunbury and is linked to the Bunbury Port by the Coalfields Highway and by a rail freight network. Mining and power generation are the leading sectors of the Collie economy with Collie's coal resources representing 100% of Western Australia's coal production, the majority of which is used in domestic electricity generation. Collie also produces alumina and is home to the Worsley Alumina Refinery.
1.2 Project Overview
Each SuperTown is required to prepare an Economic Development Growth Plan to assist guide the town during this growth phase.
The Economic Development Growth Plan will build on the existing strategic framework of each Shire and identify specific opportunities for economic development. This will complement, stimulate and strengthen the Growths Plans for the region. A key component of the plans will be an implementation framework comprising strategies and programs to align delivery partners, attract funding and facilitate action and investment to achieve a local vision for growth.
In the development of an Economic Development Growth Plan for the Shire of Collie, the following reports have been developed:
Socio-Economic Profile
Opportunities and Gap Analysis
Economic Development Plan
All of these reports, which were originally delivered separately, have been combined into this single report.
1 The South West Development Region is comprised of the LGAs of Bunbury, Augusta-Margaret River, Boyup Brook, Bridgetown-Greenbushes, Busselton, Capel, Collie, Dardanup, Donnybrook-Balingup, Harvey, Manjimup and
Nannup.

Collie SuperTown Combined Report
Final Draft Report
2
1.3 Geography
Data in this report is presented for the Local Government Area (LGA) of Collie, which primarily comprises the urban areas of the township of Collie and surrounding areas. Statistics in the report are primarily provided for the overall LGA, however, where relevant and available, data is reported for the Collie township (Collie Urban Centre).
In order to compare the area’s profile to other regions, and better understand its key features and strengths, statistics are benchmarked against Perth Statistical Division (SD) and Western Australia. In addition, where relevant, figures are also benchmarked against the South West Development Commission (SWDC) region, which comprises the LGAs Bunbury, Augusta-Margaret River, Boyup Brook, Bridgetown-Greenbushes, Busselton, Capel, Collie, Dardanup, Donnybrook-Balingup, Harvey, Manjimup and Nannup. This approach recognises the strong interrelationship that currently exists, and will continue to, between Collie and the surrounding South West region and the need for the benefits of Collie’s evolution to a SuperTown to flow through to surrounding townships and areas.

Collie SuperTown Combined Report
Final Draft Report
3
2. Population & Demographic Profile
This section provides an overview of historical and current population, demographic and socio-economic trends in the Collie and the impact of achieving aspirational population target for the Collie in the future.
2.1 Population & Demographics
2.1.1 Historical Population
Since 2006 the Collie LGA’s population has grown by 1.0% per annum (an average of approximately 96 additional residents each year), recording a total of 9,470 residents in 2010. This growth resulted in the expansion of the Collie Town population from 7,475 to 7,790 residents over the period, equating to 82.3% of the LGA’s population.
The recent growth in the Collie LGA’s population is below the growth of the broader SWDC region (average annual growth of 3.2% p.a.) which has been driven in large by population growth of coastal regions including Busselton (4.2% p.a.), Capel (5.6% p.a.), Dardanup (4.7% p.a.) and Harvey (3.0% p.a.).
Figure 2.1: Population Growth Comparison, 2006-2010
Source: ABS (2007), ABS (2011)
2.1.2 Population Projections
Population projections for Collie LGA are presented from three different sources – the Commonwealth Government Department of Health and Ageing, the Western Australia Planning Commission and more recently from the Collie Shire Council.
WAPC and DoHA projections estimate an average annual decline in Collie's population of -0.4% p.a. This is well below historical growth and is expected to underestimate future growth in Collie.
Commonwealth Government Department of Health & Ageing
The Commonwealth Government Department of Health and Ageing (DoHA) projections were published in 2007 and are based on 2006 Census and Estimated Resident Population (ERP) figures (Figure 2.2). These projections do not take into account the recent population growth in the Collie Region (0.5% p.a.) but rather estimate a declining
0
1,000
2,000
3,000
4,000
5,000
6,000
7,000
8,000
9,000
10,000
2006 2007 2008 2009 2010
Co
llie
Po
pu
lati
on
Collie Urban Centre Remainder of Collie LGA

Collie SuperTown Combined Report
Final Draft Report
4
growth trend of 0.4% per annum to 8,760 persons by 2031 (a loss of 34 people each year). These projections are based primarily on a consideration of demographic drivers, reflecting the use of the projections nationally for the purposes of health and aged care funding.
Figure 2.2: Collie LGA Projections, Federal Government Department of Health and Ageing 2010-2031
Source: Federal Government Department of Health and Ageing (2007)
Western Australia Planning Commission
The Western Australia Planning Commission (WAPC) projections were released in 2005 and are also based on older population data, and do not take into account the recent growth trends of the Collie LGA. As a result, these projections are also expected to underestimate future growth. Like the Commonwealth Government Department of Health and Ageing projections, the WAPC projections indicate the same declining growth trends of 0.4% p.a. to 8,748 persons by 2031 (refer to Figure 2.3).
-1.0%
0.0%
1.0%
2.0%
3.0%
4.0%
5.0%
0
1,000
2,000
3,000
4,000
5,000
6,000
7,000
8,000
9,000
10,000
11,000
12,0002010
2011
2012
2013
2014
2015
2016
2017
2018
2019
2020
2021
2022
2023
2024
2025
2026
2027
2028
2029
2030
2031
An
nu
al %
Ch
an
ge
Co
llie
LG
A P
op
ula
tio
n
Collie SLA Collie SLA SWDC Perth SD Western Australia

Collie SuperTown Combined Report
Final Draft Report
5
Figure 2.3: Collie LGA Projections, Western Australia Planning Commission 2010-2031
Source: Western Australia Planning Commission (2005)
Collie SuperTown Growth Target
Under the SuperTown growth plan, the aspirational growth target for the Collie Town is a doubling of the population by 2031.
Figure 2.4 shows Collie Town's anticipated growth trend of 3.4% per annum to 15,580 residents by 2031. This is equivalent to an additional 371 residents each year. This is above the historical and projected growth rates for the South West Development Region, Perth SD and Western Australia.
In order for the SuperTown population projection target to be achieved in Collie Town there is an immediate need for acceleration of population growth trends above the historical 0.5% per annum. Proactive planning schemes, infrastructure and community services will be required to support population growth. Investment attraction, industry growth and diversification of the economic base will also be critical to support job creation and the overarching sustainability of the economy.
Figure 2.4: Collie SuperTown Population Target, 2010-2031
Source: Shire of Collie (2011)
-1.0%
-0.5%
0.0%
0.5%
1.0%
1.5%
2.0%
2.5%
3.0%
0
1,500
3,000
4,500
6,000
7,500
9,000
10,500
12,000
2010
2011
2012
2013
2014
2015
2016
2017
2018
2019
2020
2021
2022
2023
2024
2025
2026
2027
2028
2029
2030
2031
An
nu
al %
Ch
an
ge
Co
llie
LG
A P
op
ula
tio
n
Collie(S) Collie(S) SWDC Perth SD Western Australia
0.0%
1.0%
2.0%
3.0%
4.0%
5.0%
6.0%
0
3,000
6,000
9,000
12,000
15,000
18,000
Po
pu
latio
n G
row
th R
ate
(%)
Po
pu
lati
on
Ta
rge
t
Collie Township Collie Township

Collie SuperTown Combined Report
Final Draft Report
6
2.1.3 Age Structure
Collie has a younger population (average age of 36.7 years) than the broader SWDC (37.3 years). This is due to the higher proportion of persons aged under 19 years than the SWDC region - an occurrence of Collie having higher proportions of families with children.
Despite having higher proportions of children and a lower average age than the broader region, Collie has very low proportions of people aged between 19 and 34 years, when compared to both the SWDC region and State averages.
This highlights the migration trends of Collie's youth from the region post school. Limited availability of post-school education and training and job opportunities outside of the region's mining and industrial sectors is likely to be a key factor that draws youth from Collie. The closest university to Collie is located in Bunbury - another locality of the SWDC region. A campus of the South West Institute of Technology is located in Collie, however, courses are limited to certificates in education, resources and infrastructure work preparation and business administration. Addressing the insufficient provision of education opportunities in Collie is necessary to ensure future skills demand will be met locally and that local residents can have clear education pathways that lead to jobs locally.
Figure 2.5: Age Distribution, Collie LGA, 2005-2010
Source: ABS (2011)
13.9%
15.5%
12.0%
12.7%
14.1%
13.9%
9.6%
5.4%
3.0%
14.6%
15.1%
10.2%
13.4%
15.7%
14.0%
8.2%
5.6%
3.0%
20.0% 15.0% 10.0% 5.0% 0.0% 5.0% 10.0% 15.0% 20.0%
0 to 9
10 to 19
20 to 29
30 to 39
40 to 49
50 to 59
60 to 69
70 to 79
80 and over
Collie SLA
2005
2010

Collie SuperTown Combined Report
Final Draft Report
7
Figure 2.6: Age Distribution, Collie Urban Centre, 2006
Source: ABS (2007)
Figure 2.7 and Figure 2.8 show the age distribution for the SWDC region and Western Australia. Comparison of 2005 to 2010 average age changes show that Collie has aged in line with the State trends over the past five years.
Figure 2.7: Age Distribution, South West Development Region, 2005-2010
Source: ABS (2011)
14.8%
16.0%
10.6%
11.8%
13.9%
15.0%
9.0%
5.9%
2.9%
13.7%
14.3%
9.6%
14.6%
14.3%
13.9%
8.3%
6.7%
4.5%
20.0% 15.0% 10.0% 5.0% 0.0% 5.0% 10.0% 15.0% 20.0%
0 to 9
10 to 19
20 to 29
30 to 39
40 to 49
50 to 59
60 to 69
70 to 79
80 and over
Collie Urban Centre Age Structure, 2006
Female
Male
13.5%
14.1%
11.9%
13.5%
14.9%
13.5%
9.9%
5.5%
3.3%
13.8%
15.1%
10.9%
14.1%
15.9%
13.2%
8.6%
5.5%
3.0%
20.0% 15.0% 10.0% 5.0% 0.0% 5.0% 10.0% 15.0% 20.0%
0 to 9
10 to 19
20 to 29
30 to 39
40 to 49
50 to 59
60 to 69
70 to 79
80 and over
SWDC Region
2005
2010

Collie SuperTown Combined Report
Final Draft Report
8
Figure 2.8: Age Distribution, Western Australia, 2005-2010
Source: ABS (2011)
2.1.4 Family/Household Types
Collie has high proportions of families with children (45.3%) when compared to the SWDC region (43.3%). This is slightly above the State average (45.1%).
A large proportion of Collie's families are also couple families with no children (38.7%), and is likely to comprise older adults or empty nesters. This reflects the migration of young adults of post-school age who leave the area to seek job opportunities or further studies outside of Collie.
The proportion of couple families without children in Collie is slightly above the State average, however well below the proportion of the broader SWDC region - a result of the attractiveness of the broader region to both empty nesters and young couple families without children.
Figure 2.9: Family/Household Type, Collie Urban Centre, 2006
Source: ABS (2007)
12.9%
13.3%
15.1%
14.3%
14.4%
12.6%
9.0%
5.1%
3.2%
13.0%
14.3%
13.8%
14.7%
15.1%
12.9%
8.1%
5.2%
2.9%
20.0% 15.0% 10.0% 5.0% 0.0% 5.0% 10.0% 15.0% 20.0%
0 to 9
10 to 19
20 to 29
30 to 39
40 to 49
50 to 59
60 to 69
70 to 79
80 and over
Western Australia
2005
2010
0.0% 10.0% 20.0% 30.0% 40.0% 50.0%
Couple Family w/ no
children
Couple Family w/ children
Single Parent Family
Other family
Collie Urban Centre, 2006
Collie Urban Centre
Collie (S)
SWDC
Perth SD
Western Australia

Collie SuperTown Combined Report
Final Draft Report
9
2.1.5 Household & Dwelling Growth
The total number of dwellings in the Collie LGA has grown from 2,990 dwellings in 2006 to 3,336 in 2011, an increase of 11.6%. The proportion of these dwellings that are classified as detached dwellings has fallen slightly over that time period, down from 92.2% of total dwellings in 2006 to 87.3% of total dwellings in 2011.
The average household size in the Collie Town was estimated to be 2.5 persons per household in 2006. If Collie Town's average household size decreases at the rate of regional WA projections (ABS, 2010) to 2.3 persons per household by 2031, there would a requirement for an additional 3,774 dwellings to be built between 2010 and 2031 to support the SuperTowns population growth target of 15,580 residents.
Figure 2.10: Forecast Household Growth, Collie Township, 2006-2031
Source: ABS (2007), ABS (2010)
2.2 Socio-Economic Characteristics
Collie has a unique set of socio-economic characteristics that differentiate it from other regional centres. Key indicators include education and qualifications, occupation, income and house-price based wealth and affordability.
2.2.1 Education/Qualifications
Collie's working aged population (15 years and over) has a low proportion of persons that have completed year 12 or undertaken tertiary education when compared to the broader SWDC region and Western Australia. However, almost 35% of Collie's working aged population have achieved certificate qualifications - well above Western Australia or the SWDC region averages.
The nature of industry and skills demand in Collie has resulted in this qualification trend towards certificate and trade type qualifications which do not require completion of year 12 or tertiary education.
High numbers of youth leaving the region for post-school tertiary education and job opportunities compounds this trend. Once youth have migrated from the region Collie does not provide sufficient job diversity to re-attract these workers back to the region after higher qualifications have been attained.
0
1,000
2,000
3,000
4,000
5,000
6,000
7,000
8,000
2006
2007
2008
2009
2010
2011
2012
2013
2014
2015
2016
2017
2018
2019
2020
2021
2022
2023
2024
2025
2026
2027
2028
2029
2030
2031
No
. o
f H
ou
se
ho
lds
Collie Township

Collie SuperTown Combined Report
Final Draft Report
10
Figure 2.11: School & Post-School Qualifications, 2006
Source: ABS (2007)
2.2.2 Occupation
As indicated by post-school qualifications trends, blue-collar workers make up the majority of Collie's workers (over 55%). This is well above the proportions for the SWDC region and Western Australia.
Growth of the local mining, electricity industry and associated industrial supply chain will continue to drive demand for blue-collar workers in Collie. However, the lack of industry and occupational diversification outside of blue-collar workers will contribute to the loss of young people that is currently being experienced by the region as well impacting the future ability to attract residents to Collie.
Figure 2.12: Employment by Occupation, 2008-2009
Source: ABS (2011)
0.0% 10.0% 20.0% 30.0% 40.0% 50.0% 60.0%
Postgraduate Degree
Graduate Diploma and Graduate Certificate
Bachelor Degree
Advanced Diploma and Diploma
Certificate
% Finished Year 12
Collie SLACollie Urban Centre Collie (S) SWDC Perth SD Western Australia
0.0%
10.0%
20.0%
30.0%
40.0%
50.0%
60.0%
70.0%
Blue Collar White Collar Service Workers
% o
f W
ork
forc
e
Collie SLA SWDC Perth SD WA

Collie SuperTown Combined Report
Final Draft Report
11
Service worker shares are also below regional and State average. This is a point of concern as it would be expected that regional service centres like Collie would have larger service sector labour forces in light of its role servicing large secondary and tertiary trade catchments.
2.2.3 Income
Regional centres commonly have below-average income levels, however, despite having high proportions of blue-collar workers Collie's population generate above-average incomes ($56,277) compared to the SWDC region and State averages. Higher earning occupations compared to the SWDC region and State averages include:
Machinery operators & drivers ($80,078)
Technicians & trades workers ($79,804)
Labourers ($45,167)
Dominance of the mining and industrial sector in the regional economy is the key driver of high wages and wage growth in Collie compared to other areas of the SWDC region and the State.
Figure 2.13: Average Income by Occupation, 2008-2009
Source: ABS (2011)
2.2.4 House Prices
In Australia, household wealth is dominated by the family home. This is particularly the case for older generations, who have not had the benefits of exposure to long-term compulsory superannuation.
During the last few years, and especially between 2005 and 2008, Western Australia generally, and Perth specifically, experienced significant increases in house prices.
As a regional area of the SWDC, Collie has experienced a relatively stable house price market that has not been heavily influenced by the broader property market fluctuations over the past five years.
In fact, Collie's median dwelling prices remain at an affordable level recording a median house price of $250,000 in 2010-11. This was 78% of the median prices for the SWDC and 67% of the median prices for the regional Western Australia house price.
$- $10,000 $20,000 $30,000 $40,000 $50,000 $60,000 $70,000 $80,000 $90,000
Managers
Professionals
Tecnhicians & Trade Workers
Community & Personal Service Workers
Clerical & Administrative Workers
Sales Workers
Machinery Operators & Drivers
Labourers
Collie SLA SWDC Perth SD Western Australia

Collie SuperTown Combined Report
Final Draft Report
12
Figure 2.14: Median Dwelling Prices
Source: REIWA (2011)
Lower house prices are often associated with regions with lower incomes, however this is not the case for Collie which recorded above average incomes when compared to the SWDC region and Western Australia trends (refer to Section 2.2.3). Lower median house prices and above average incomes levels represent the combination required to support an affordable housing market.
Comparison of incomes to house prices shows that households would require almost 4.0 years worth of income to purchase a house of median price outright. This is affordable compared to regional Western Australia housing standards, which is regarded internationally as highly unaffordable.
Figure 2.15: Ratio of Median House Prices to Median Household Incomes, 2008/2009
Source: ABS 5673.0 Wage and Salary Earners (2011), REIWA (2011) and AECgroup
$0
$100,000
$200,000
$300,000
$400,000
$500,000
$600,000
$700,000
$800,000
2006-07 2007-08 2008-09 2009-10 2010-11
Me
dia
n D
we
llin
g P
rice
s (
$)
Collie LGA Regional WA SWDC Perth City
0.0
1.0
2.0
3.0
4.0
5.0
6.0
Collie SWDC Regional WA
Me
dia
n M
ult
iple

Collie SuperTown Combined Report
Final Draft Report
13
2.3 Key Findings
Collie LGA (for which an estimated 82% of the population is located in Collie Town) has experienced steady growth of 0.5% p.a. to 9,470 between 2001 and 2010. Compared to the SWDC region and the State, this is low population growth.
The region is characterised by a younger population than the broader SWDC region due to the presence of high proportions of families with children under the age of 19 years. However, Collie loses significant proportions of its post-school aged youth due to a lack of local available vocational and tertiary education and training and job opportunities.
The working aged population (15 years and over) is mainly comprised of blue collar workers (over 55%) that have attained certificate level qualifications. Due to the dominance of the mining sector and associated industrial industries, average incomes are above the level of the State and the SWDC region, highlighting a certain level of prosperity held by the resident workforce.
Higher incomes usually suggest higher house prices, however, Collie enjoys lower median house prices compared to State and the SWDC region averages, which complement higher average incomes, making it an ideal combination for an affordable housing market.
SuperTowns population growth targets for Collie are for the town's population to double by 2031, indicating an immediate need for acceleration of population growth trends above the historical level if targets are to be achieved.
Proactive planning schemes, infrastructure and community services will be required to support population growth. Retention of youth will be important for creating vitality and a balanced community. Investment attraction, industry growth and diversification of the economic base will also be critical to support job creation and the overarching sustainability of the economy, as will be the provision of local education and training opportunities to support industry diversification and jobs growth.

Collie SuperTown Combined Report
Final Draft Report
14
3. Employment & Business Activity
This section profiles the employment and business characteristics of the Shire of Collie including labour force and unemployment trends, employment by industry and occupation and business size, growth and formation.
3.1 Labour Force & Unemployment
Growth of Collie's labour force and employment has generally been slower that of the broader SWDC region and the State over the past four years. In the June Quarter 2011, Collie recorded a labour force of 4,918 people and 4,598 people employed. This was 1.1% more than the previous year for both labour force and employment.
Figure 3.1: Labour Force & Unemployment Rate, 2006-2011
Source: DEEWR (2011)
Unemployment rates have averaged significantly higher than the SWDC region and State rates over the last four years. Economic diversification and job creation will be necessary to support attraction and sustainable growth of the Collie population over the next 20 years.
Table 3.1: Labour Force & Employment, June Q 2011
Region Jun Q 2011 % Ann. Change % Four Year Change
Labour Force
Collie 4,918 1.1% 9.5%
SWDC Region 87,249 1.1% 11.3%
Perth SD 960,400 2.5% 12.8%
Western Australia 1,283,100 2.6% 12.1%
Employment
Collie 4,598 1.1% 8.3%
SWDC Region 83,046 0.8% 9.2%
Perth SD 919,400 3.2% 11.5%
Western Australia 1,227,200 3.2% 10.8%
0.0%
1.0%
2.0%
3.0%
4.0%
5.0%
6.0%
7.0%
8.0%
0
750
1,500
2,250
3,000
3,750
4,500
5,250
6,000
Un
em
plo
ym
en
t Ra
teLa
bo
ur
Fo
rce
Collie (S) Collie (S) SWDC Region Perth Western Australia
Collie SuperTown Combined Report
Final Draft Report
15
Region Jun Q 2011 % Ann. Change % Four Year Change
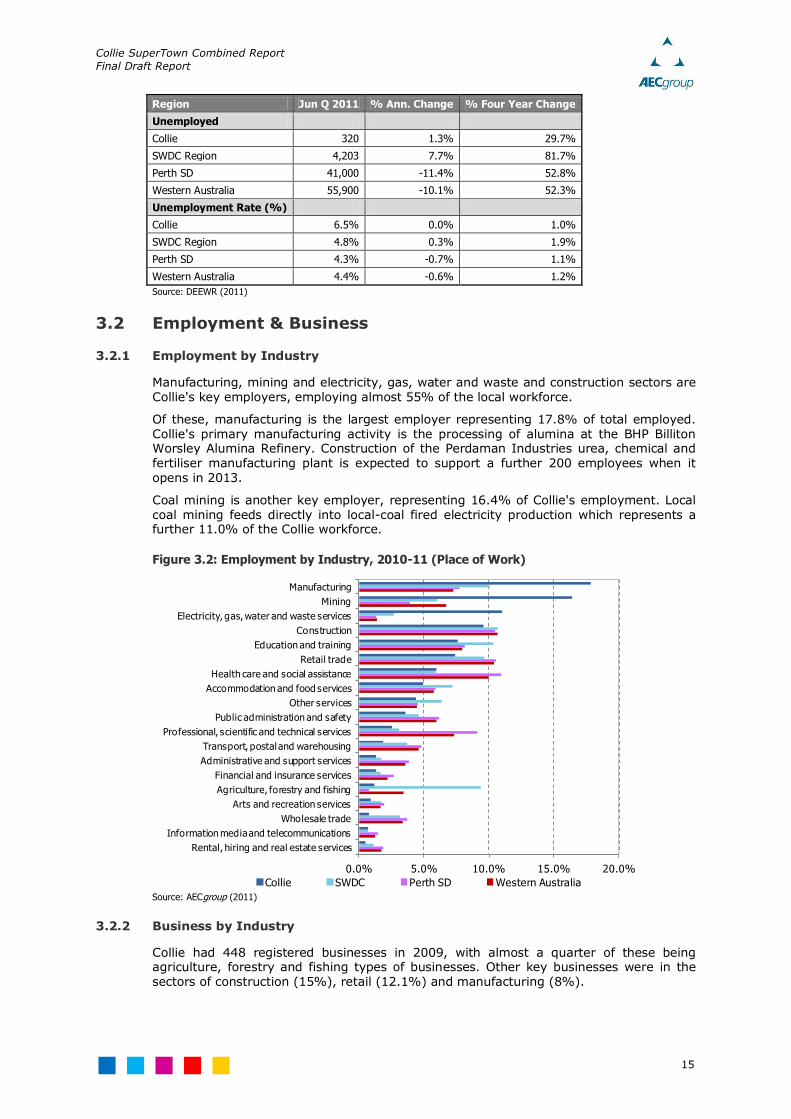
Unemployed
Collie 320 1.3% 29.7%
SWDC Region 4,203 7.7% 81.7%
Perth SD 41,000 -11.4% 52.8%
Western Australia 55,900 -10.1% 52.3%
Unemployment Rate (%)
Collie 6.5% 0.0% 1.0%
SWDC Region 4.8% 0.3% 1.9%
Perth SD 4.3% -0.7% 1.1%
Western Australia 4.4% -0.6% 1.2%
Source: DEEWR (2011)
3.2 Employment & Business
3.2.1 Employment by Industry
Manufacturing, mining and electricity, gas, water and waste and construction sectors are Collie's key employers, employing almost 55% of the local workforce.
Of these, manufacturing is the largest employer representing 17.8% of total employed. Collie's primary manufacturing activity is the processing of alumina at the BHP Billiton Worsley Alumina Refinery. Construction of the Perdaman Industries urea, chemical and fertiliser manufacturing plant is expected to support a further 200 employees when it opens in 2013.
Coal mining is another key employer, representing 16.4% of Collie's employment. Local coal mining feeds directly into local-coal fired electricity production which represents a further 11.0% of the Collie workforce.
Figure 3.2: Employment by Industry, 2010-11 (Place of Work)
Source: AECgroup (2011)
3.2.2 Business by Industry
Collie had 448 registered businesses in 2009, with almost a quarter of these being agriculture, forestry and fishing types of businesses. Other key businesses were in the sectors of construction (15%), retail (12.1%) and manufacturing (8%).
0.0% 5.0% 10.0% 15.0% 20.0%
Rental, hiring and real estate services
Information media and telecommunications
Wholesale trade
Arts and recreation services
Agriculture, forestry and fishing
Financial and insurance services
Administrative and support services
Transport, postal and warehousing
Professional, scientific and technical services
Public administration and safety
Other services
Accommodation and food services
Health care and social assistance
Retail trade
Education and training
Construction
Electricity, gas, water and waste services
Mining
Manufacturing
Collie SWDC Perth SD Western Australia

Collie SuperTown Combined Report
Final Draft Report
16
Figure 3.3: Business Counts by Industry, % of Total Businesses, June 2007 to June 2009
Source: ABS (2011)
3.2.3 Businesses by Employment Size
Sixty percent of Collie's businesses are non-employing (i.e. owner/operator) due to the rural nature of the region with a large proportion of agricultural businesses. However, this is below the representation of small business in the broader SWDC region and Western Australia economies.
Collie does however, have higher proportions of medium-sized businesses (20 to 49) as well as larger businesses (100+ employees). This is due to the presence of major industry players in the mining and manufacturing sector in Collie as well as a good representation of medium-sized construction businesses and supporting supply chain.
Figure 3.4: Business Counts by Industry by Number of Employees, June 2007 to June 2009
Source: ABS (2011)
0.0% 5.0% 10.0% 15.0% 20.0% 25.0%
Mining
Information Media and Telecommunications
Electricity, Gas, Water and Waste Services
Arts and Recreation Services
Public Administration and Safety
Education and Training
Wholesale Trade
Administrative and Support Services
Health Care and Social Assistance
Other Services
Accommodation and Food Services
Financial and Insurance Services
Transport, Postal and Warehousing
Professional, Scientific and Technical Services
Rental, Hiring and Real Estate Services
Manufacturing
Retail Trade
Construction
Agriculture, Forestry and Fishing
Collie (S) SWDC Perth SD Western Australia
0.0% 10.0% 20.0% 30.0% 40.0% 50.0% 60.0% 70.0%
Non employing
1 to 4
5-19
20-49
50-99
100-199
200+ Collie (S)
SWDC
Perth SD
Western Australia

Collie SuperTown Combined Report
Final Draft Report
17
3.2.4 Businesses by Turnover
Over 20% of businesses in Collie earn less than $25,000 per year with the second largest revenue category being businesses that earn between $200,000 and $500,000 each year (16.1% of businesses).
Not surprisingly, Collie has a higher proportion of businesses that earn over $10 million per annum (2%) compared to the SWDC (0.8%) and Western Australia (1.5%).
Figure 3.5: Business Counts by Industry by Turnover Size Ranges, June 2007 to June 2009
Source: ABS (2011)
3.2.5 Small Business
Small business incomes in Collie are generally significantly lower than the broader SWDC region or the State. In 2008-09, the average income of small unincorporated business in Collie was $10,250, relative to the average income in the SWDC region of $16,499 and State of $25,857.
Figure 3.6: Average Unincorporated Small Business Income, 2008-09
Source: ABS (2011)
0.0% 5.0% 10.0% 15.0% 20.0% 25.0%
Zero to less than $25k
$25k to less than $50k
$50k to less than $75K
$75k to less than $100k
$100k to less than $150k
$150k to less than $200k
$200k to less than $500k
$500k to less than $1m
$1m to less than $2m
$2m to less than $5m
$5m to less than $10m
$10m to less than $20m
$20m to less than $50m
$50m to less than $200m
$200m or more
Collie (S)
Collie (S)
SWDC
Perth SD
Western Australia
$-
$5,000
$10,000
$15,000
$20,000
$25,000
$30,000
Collie (S) SWDC Perth SD Western Australia
Inco
me
($
)
Unincorporated Small Business Income

Collie SuperTown Combined Report
Final Draft Report
18
3.2.6 Tourism Activity
Collie received 134,000 visitors in the year ending September 2011, which was an increase of 20% from recent years. The increase can be attributed to an increase in business travellers, likely visiting Collie in relation to major mining projects or expansion of the Worsley refinery. Visitors come to Collie for a diverse range of reasons, with the purpose of visit evenly distributed across holiday, visiting friends and relatives and business.
Figure 3.7: Total Visitors, Collie, 2000-2011
Note: Data is year ending September 2011 Source: TRA (2011)
Figure 3.8: Purpose of Visit, Collie, 2011
Note: Data is year ending September 2011 Source: TRA (2011)
Room occupancy rates have fallen dramatically from 59.4% during the year ending September 2007 to 38.0% in the most recent year ending September 2011. Occupancy rates above 65% are considered to be an indicator that a region would be able to support new entrants into the tourism accommodation market. The underperformance of the
0
20
40
60
80
100
120
140
160
180
200
2000 2001 2002 2003 2004 2005 2006 2007 2008 2009 2010 2011
Nu
mb
er
of
Vis
ito
rs (
'00
0)
Day Trip Domestic Overnight International
34%
29%
27%
10%
Holiday or leisure
Visiting friends and relatives
Business
Other

Collie SuperTown Combined Report
Final Draft Report
19
occupancy rates in Collie in recent years suggest that, at present, the tourism accommodation market is over supplied with four establishments in the region providing 115 rooms2.
Despite the recent fall in guest arrivals and occupancy rates within the LGA, takings from accommodation have risen 39.0% over the past year and 20.4% from the year ending September 2007 to the year ending September 2011 (ABS, 2011).
Figure 3.9: Guest Arrivals and Room Occupancy Rates, December 2006 – September 2011
Source: ABS (2011)
Collie has numerous tourism attractions within the town and in its surrounding areas. These attractions include Lake Kepwari, Wellington Dam, Kostecki Motorplex, the Munda Biddi Trail and Honeymoon Point.
Lake Kepwari is located 10 kilometres south-east of Collie. It is a water filled former open-cut mine that is approximately 2 km long, 1 km wide and 70 metres deep. The lake has been rehabilitated by Premier Coal.
The Wellington Dam was constructed in 1933 and further enlarged in 1956. The dam is the second largest in the State and acts as home to one of two hydro power stations in Western Australia. The dam offers tourists camping facilities, canoe hire, BBQ’s as well as spectacular views across the dam. It is one of only a few dams that allows camping and recreational activities (South West Life, 2010).
The Kostecki Motorplex is located approximately 14km east of Collie within the Collie State Forest. The 1.7km circuit track hosts a series of motorsport events throughout the year (Collie River Valley, 2007).
The Munda Biddi Trail is a 609km mountain biking trail stretching from Mundaring to Manjimup. The trail is still a work in progress, with the final trail running for close to 1,000km all the way south to Albany. The trail also has eight purpose built shelters along the way with camping areas available (Munda Biddi Trail Foundation, 2011).
Honeymoon Point is situated along the Collie River in Wellington National Park. The point offers camping and picnic facilities, wood BBQ’s, toilets as well as swimming and canoeing areas (Department of Environment and Conservation, 2011).
These attractions highlight the vast array of recreational tourism opportunities on offer in and around the Collie area. Tourism can be a beneficial industry of opportunity as tourism
2 Note ABS statistics only include establishments with over 15 rooms.
0.0%
10.0%
20.0%
30.0%
40.0%
50.0%
60.0%
70.0%
80.0%
0
400
800
1,200
1,600
2,000
2,400
2,800
3,200
Ro
om
Occu
pa
ncy
Ra
te (%
)
Gu
est
Arr
iva
ls
Guest Arrivals Room Occupancy Rate Sept YE Occupancy Rates

Collie SuperTown Combined Report
Final Draft Report
20
expenditure can flow through the local economy without significant infrastructure requirements (which are needed to support permanent residents). Additionally, tourism expenditure often goes to small businesses in the area, so increases in tourism can aid the small business sector locally. Additionally, given the recreational nature of many of Collie’s attractions, there would be a considerable amount of local usage and visitors from Bunbury and the surrounding region may not be accurately captured in the survey instruments used, given the dispersed nature of where these visitors are located (i.e. many visitors would be camping or located in national forests).
3.3 Key Findings
Collie's key employers are the manufacturing, mining and electricity, gas, water and waste services sectors. Specifically, Collie employs around 45% of its workforce either in local coal mining, alumina refining or electricity generated from the local coal production activities. In short, Collie is easily characterised as a mining and industrial hub in the SWDC region.
Labour force and employment growth is steady but below regional and State averages, and is mainly dictated by the rate of investment and development of its leading sectors. Interestingly, unemployment rates are substantially higher in Collie than the SWDC region and the State. This could be a factor of Collie being relatively undiversified with limited opportunity for people to work in sectors outside of mining, manufacturing and energy generation - leaving limited potential for couple families to have both adults working in local jobs. This is supported by census data which indicated that on average Collie has 1.1 working adults per household compared to 1.8 in the SWDC region and 1.3 working adults per household for the State.
As a rural area, over 60% of Collie's businesses are small businesses and almost a quarter of all businesses undertake agriculture, forestry and fishing activities. Collie also has higher proportions of medium-sized businesses (20 to 49) as well as larger businesses (100+ employees) that the SWDC region and State averages. This is due to the presence of major industry players in the mining and manufacturing sector in Collie as well as a good representation of medium-sized construction businesses and supporting supply chain.
While tourism visitation to Collie is not as significant as other established tourist destinations, Collie does offer a wide range of recreational activities and attractions and tourism can provide some economic diversity. Collie’s tourism sector has seen a boost from recent major investments and the recreational amenities of the area are likely enjoyed by locals as well as visitors from around the surrounding region.

Collie SuperTown Combined Report
Final Draft Report
21
4. Investment & Major Projects
This section profiles activity and investment in the Collie economy. It includes review of residential and commercial building approvals, land releases and development and major proposed investments in the region.
4.1 Building Approvals & Property Market
4.1.1 Residential Approvals
The number and value of residential approvals have grown steadily in Collie over the past 10 years, rising from 24 approvals at a total value of $3.2 million in the 2002 financial year to a 10-year high of 75 residential approvals at a value of $18.7 million by the end of the 2010 financial year. Residential building approvals dropped back to a total of 44 at a value of $11.6 million by the end of the 2011 financial year.
While the historical trend in residential building approvals shows a general increase, considerably more development will be needed in the future in order to meet the SuperTown growth targets. Based on the population of the town doubling, an average of 121 new residential dwellings will be needed every year until 2031.
Figure 4.1: Residential Approvals (No.) and Value ($‘M), Collie LGA
Source: ABS (2011)
4.1.2 Non-Residential Approvals
Non-residential building activity was almost non-existent until the 2005 financial year when $14.8 million worth of building activity occurred. The 2008 financial year saw by far the greatest amount of investment in non-residential building to date, with $62.8 million worth of approvals recorded.
The strong growth in both the number and value of residential and non-residential building approvals reflects the improving economic conditions of the Collie area resulting from its booming mining, manufacturing and electricity, gas, water and waste services industries.
$-
$2.5
$5.0
$7.5
$10.0
$12.5
$15.0
$17.5
$20.0
0
10
20
30
40
50
60
70
80
Va
lue
of A
pp
rov
als
($'M
)
Nu
mb
er
of
Re
sid
en
tia
l A
pp
rov
als
Dwelling Approvals - Houses (No.) Dwelling Approvals - Other Residential (No.) Value of Approvals ($'M)

Collie SuperTown Combined Report
Final Draft Report
22
Figure 4.2: Non-Residential Building Approvals ($ ‘M)
Note: Major projects that must receive approval outside of the normal development application process are not recorded by the ABS. Source: ABS (2011)
4.1.3 Land Releases & Developments
Figure 4.3 shows that lot approvals, particularly residential and commercial, have substantially grown in Collie in recent years. Residential lot approvals have averaged 29 per year since 2006-07, whereas the five years preceding 2006-07 saw an average of only four lots being approved per year. An average of 121 new residential dwellings are required until 2031 in order to meet the SuperTown growth target.
Figure 4.3: Shire of Collie Lot Activity, Final Approvals, 2001-02 to 2010-11
Source: Shire of Collie Council (2011)
$0.0
$10.0
$20.0
$30.0
$40.0
$50.0
$60.0
$70.0
Va
lue
of
No
n-R
esid
en
tia
l A
pp
rov
als
($
'M)
Collie SLA
0
5
10
15
20
25
30
35
40
Ap
pro
va
ls
Commercial Industrial Residential Rural

Collie SuperTown Combined Report
Final Draft Report
23
4.2 Major Projects
4.2.1 Shotts Industrial Estate
The Shotts Industrial Estate is currently under development after receiving approval from the Western Australian State Government in late 2009. The 235ha site is located approximately seven kilometres to the east of Collie, adjacent to the Premier Coal mine. The estate is a strategic land project for coal related industrial uses and will look to accommodate five tenants, complementing the Coolangatta heavy industrial estate.
Perdaman Chemicals and Fertilisers and Premier Coal will be the major tenants of the estate. Perdaman is planning to develop a $3.8 billion urea manufacturing plant on a 125ha site to convert sub-bituminous coal to urea fertiliser. The development has the potential to create 1,500 jobs during the three year construction phase and 200 permanent jobs once the plant is fully operational. Wesfarmers, which currently employs approximately 300 people at its open cut mine, has proposed a coal char plant on a 55ha site (Landcorp, 2011).
In April 2011, the State Government provided an $83 million funding package for infrastructure upgrades to support Shotts Industrial Park. The funding package included:
$3.9 million towards main roads development between Bunbury Port and Shotts Industrial Park.
$65 million for Water Corporation to upgrade water pipelines and associated infrastructure to enable the transfer of water from Wellington Dam to the Shotts Industrial Park.
$14.6 million to LandCorp to assist in the development of Shotts Industrial Park (Government of Western Australia Department of State Development, 2011).
4.2.2 Worsley Alumina Refinery Expansion
Work on the expansion of the Worsley Alumina Refinery, located 17 kilometres west of Collie, has been ongoing since 2005 and on completion will lift the capacity of the Worsley Alumina Refinery from 3.5 million tonnes per annum to approximately 4.6 million tonnes. The expansion required an initial capital investment of $2.2 billion from joint venture partners, BHP Billiton (86%, Japan Alumina Associates (10%) and Sojitz Alumina (4%).
In June 2011, BHP announced that the expansion had suffered a $US1.3 billion construction cost increase and a 9 month production delay resulting in part from inflation and the strengthening Australian dollar (Chambers, 2011).
Table 4.1: Collie Major Developments
Project Description
Collie - Worsley Alumina Refinery Expansion
(BHP Billiton)
The Collie Worsley Alumina Refinery produces 3.5 million tonnes of refined alumina each year . In 2012, the facility will complete a $3 billion expansion, increasing production to 4.7 million tonnes per annum. $500 million will also be spent on a new multi fuel
cogeneration power plant at the refinery. Capital Value: $3.3 billion (a) Employment - Construction: 4,500 Employment - Operational: 200
Collie - Coal to Urea
Plant (Perdaman Chemicals & Fertilisers)
Perdaman Chemical and Fertilisers Pty Ltd has recently committed $3.5 billion to the
development of a coal to urea plan at the Shotts Industrial Park. The plant will use proven "best in class" coal gasification and fertiliser production technologies. Urea will be exported through the Bunbury Port. Capital Value: $3.5 billion Employment - Construction: 1,500
Employment - Operational: 200
Note: (a) Capital expenditure reported by the Australian Newspaper on June 25, 2011. Report cited cost overruns on original $2.2 billion project. Converted from USD at $1.054 (source: www.rba.gov.au) Source: SWDC (2011), BHP (2011)

Collie SuperTown Combined Report
Final Draft Report
24
5. Economic Growth
This section presents estimates of Collie's Gross Regional Product (GRP) and economic activity and also provides a foundation industry profile of Collie's leading sector - coal mining.
GRP estimates have been developed using AECgroup's proprietary GRP model. Estimates were generated for the entire SWDC region and Collie to understand the value of the economy, as well as the contribution of key industries over time. The GRP methodology can be found in Appendix A.
5.1 Current Gross Regional Product
Collie Gross Regional Product (GRP) estimates have grown steadily by an average of 8.8% per annum since 2006-07 to over $1.7 billion in 2010-11.
Collie's GRP experienced a slight dip in 2009-10 (down 5.7%) in line with State and regional trends. This decline was primarily driven by the international declines in coal prices at the time, however, prices have since recovered, influencing Collie's increase in GRP by 23.7% in the most recent year. Nevertheless, Collie’s exposure to the mining sector impacts the volatility of its GRP growth, which is much more volatile that the WA average – itself on the most volatile State economies in Australia.
Figure 5.1: Gross Regional Product (GRP), 2006-07 to 2010-11
Source: AECgroup (2011)
Collie's leading sector (by value) in 2010-11 was mining which generated 42.1% of the region's industry value add. Electricity, gas, water and waste services and manufacturing were also key contributors to the local economy, representing 20.2% and 18.7% of Collies contribution to GRP, respectively.
Overall, 90% of Collie's industry value add is generated by mining, electricity, manufacturing and construction types of activities - making Collie a mining and industrial focussed region with little diversification. While there is considerable value to the local economy from coal mining, electricity generation and alumina/bauxite refining, this level of reliance also poses a risk, as the entire economy is very reliant on these three industry sectors.
-10.0%
-5.0%
0.0%
5.0%
10.0%
15.0%
20.0%
25.0%
30.0%
$0
$250
$500
$750
$1,000
$1,250
$1,500
$1,750
$2,000
2006-07 2007-08 2008-09 2009-10 2010-11
% A
nn
ua
l Ch
an
geC
oll
ie G
RP
($
M)
Collie GRP Collie GRP % annual changeSWDC GRP % annual change Perth SD GRP % annual changeWestern Australia GRP % annual change

Collie SuperTown Combined Report
Final Draft Report
25
Figure 5.2: Collie GVA by Industry, 2010-11
Source: AECgroup (2011)
5.2 Foundation Industry - Coal Mining & Power Generation
Coal mining is the primary industry driving Collie’s local economy. The industry contributes to over 40% of the LGA’s GRP and accounts for more than a quarter of its total employment, directly and indirectly.
West Australia’s entire coal supplies come from Collie, the majority of which is used for electricity generation in the State. The unique qualities of the coal mined at Collie are ideal for reliable and efficient electricity generation. Seven million tonnes of coal, valued at over $330 million, was produced in Collie’s coal mines in 2010-11. Over the past decade the domestic coal price has seen an upward trend indicative of global and domestic demand for coal. Coal production in Collie has largely recorded an upward trend since 2001.
Figure 5.3: Coal Production, Collie LGA Estimates, 2001-10
Note: * Figures are for calendar years. Source: Government of WA Department of Mines and Petroleum (2011)
0.0% 9.0% 18.0% 27.0% 36.0% 45.0%
Ownership of dwellings
Arts and recreation services
Wholesale trade
Rental, hiring and real estate services
Agriculture, forestry and fishing
Information media and telecommunications
Accommodation and food services
Administrative and support services
Other services
Public administration and safety
Financial and insurance services
Transport, postal and warehousing
Professional, scientific and technical services
Retail trade
Health care and social assistance
Education and training
Construction
Manufacturing
Electricity, gas, water and waste services
Mining
Collie SWDC Perth SD Western Australia
$0.0
$50.0
$100.0
$150.0
$200.0
$250.0
$300.0
$350.0
$400.0
0.0
1.0
2.0
3.0
4.0
5.0
6.0
7.0
8.0
2001 2002 2003 2004 2005 2006 2007 2008 2009 2010
Co
al P
rod
ucti
on
($
Mil
lio
n)
Co
al P
rod
cu
tio
n (
Mil
lio
n T
on
ne
)
Quantity of Coal Produced (Million Tonne) Value of Coal Produced ($ Million)

Collie SuperTown Combined Report
Final Draft Report
26
Major coal mining companies operating in Collie include:
Premier Coal: The Premier Coal open-cut mine near Collie, 200 kilometres south of Perth, produces around four million tonnes of coal per annum. A leading coal producer, the company primarily sells coal to the State Government-owned Verve Energy for domestic power generation.
Griffin Coal: The company currently operates three major open cut mines, including Ewington 1 & 2 and Muja mines located in the Collie area. Producing more than 3 million tonnes of coal each year, these mines are key contributors to the economic success of Collie’s local economy.
Apart from contributing to the LGA’s employment and GRP, the growing resource sector has attracted huge investment facilitating development of industrial infrastructure including industrial estates and associated transport support infrastructure. For instance, the development of the Shott Industrial Estate adjacent to the Premier Coal mine has attracted over $80 billion from the West Australia State Government for support infrastructure upgrades. The Industrial Estate is expected to complement the Coolangatta heavy industrial estate and will be home to the $3.5 billion coal to urea manufacturing plant owned by Perdaman Chemical and Fertilisers Pty Ltd.
A significant portion of Western Australia’s power supply is generated from Collie coal through Collie’s three local power stations including the:
The Collie Power Station: Opened in 1999 and situated 10 km north of Collie. The Power Station is owned by Verve Energy and operated by Transfield Services and WorleyParsons and is capable of producing up to 340 megawatts of electricity (Verve Energy, 2006a).
The Muja Power Station: Opened in 1966 and situated 22 km east of Collie. The Power Station is capable of producing 854 megawatts of electricity (Verve Energy, 2006b).
Bluewaters Power Station: Owned by Griffin Energy and located within the Coolangatta Industrial Estate, 4.5 km north-east of Collie. The station is capable of producing 416 megawatts of electricity. An expansion of the station has been proposed, with two new base load generators planned for completion in 2013 and 2015 respectively. These new generators would increase the station’s capacity to an estimated 830 megawatts (Griffin Energy, 2007).
The robustness of an economy and its resilience to economic shocks is positively related to how diversified an economy is. Excessive reliance on a particular sector can have an adverse impact on the local economy. This is seemingly true in case of Collie. A largely resource based economy with limited economic diversity can have a number of negative impacts on the LGA, some of which are discussed below:
Limited economic diversity and employment opportunities in the LGA outside of mining and industrial focused activities have constrained population growth and resulted in relatively higher unemployment rates when compared to the wider SWDC region and the State.
Lack of industry and occupational diversification outside of blue-collar workers has contributed to the loss of young people, with large proportion of youth leaving the LGA for tertiary education or in search of better/ varied job opportunities elsewhere.
In order to create a robust and resilient local economy – one which can effectively address some of the aforementioned issues it is essential to diversify Collie’s economy and take necessary measures to create a varied employment base. Economic diversification and job creation are critical to support resident attraction (particularly the youth) and sustainable growth of the Collie’s population over the next two decades years.
5.3 Foundation Industry - Metals Manufacturing
The Worsley bauxite and alumina refinery is a significant driver of the Collie economy. The operation directly employs a total of 2,456 people, including 1,849 permanent employees and 607 full-time equivalent contractors (as at end of June 2011). The refinery is also responsible for considerable exports from Collie.

Collie SuperTown Combined Report
Final Draft Report
27
The plant generates considerable economic benefits locally and across the South West region, including:
$260 million in direct salaries and wages
$140 million in local contracts
Considerable amounts of royalties and taxes
The recent $2 billion expansion that is currently coming to an end has also provided considerable economic stimulus for the community. At its peak, the expansion employed 4,500 people and the project will result in $1.7 billion spent with local businesses across Western Australia (BHP, 2011).
5.4 Key Findings
The Collie economy is dominated by the activities of the coal mining sector and the associated supply chain as well as metals manufacturing. The resource sector brings wealth to the community in the form of capital and business investment, stability of jobs as well as higher incomes and prosperity to Collie's residents.
However, other aspects of the Collie economy are largely underdeveloped and undiversified which will limit the ability of the region to attract future residents and retain youth unless this can be overcome.
Lack of diversification also opens the Collie economy up to significant levels of risk due to the heavy reliance of all industry and residents upon the continued and sustained activity of the coal mining sector in Collie. If coal mining were to cease to be a viable operation in Collie - for whatever reason - Collie would cease to exist as it is today.
Future population growth and prosperity of Collie's residents is therefore hinged on the ongoing growth of the Collie economy and the diversification of its economic base.

Collie SuperTown Combined Report
Final Draft Report
28
6. Economic Outlook
The economic outlook for Collie is an integral component to identifying future growth opportunities and industries for development. Though the future is uncertain, socio-demographic changes and other macro-influences can, to some extent, be planned for in order to stabilise local economic dynamics.
This chapter analyses future economic drivers as well as provides an overview of the expected path for the local economy assuming Collie reaches projected population targets over the next 20 years. This chapter provides guidance on the possible implications of this future growth path for the local region.
6.1 Future Economic Drivers
Future economic drivers are sourced internally and externally. Internal factors are, to some extent, able to be influenced and manipulated by the Shire of Collie. External factors, however, tend to be of a macro nature and are outside of the control of the Shire of Collie. Whilst external drivers are outside of their control, strategic planning ahead of these potential opportunities and challenges can assist in amplifying or reducing their impact on the local economy.
6.1.1 Internal Drivers
6.1.1.1 Population growth
Population growth provides support for infrastructure and services demand. Australia's population increased by an average 0.3% per quarter between June 1981 and March 2011. The State of Western Australia has also experienced solid population growth over this time frame, of an average 0.7% per quarter (ABS, 2011i). Western Australia has benefited from both natural population growth (i.e. more births than deaths) and inter-State and overseas inward migration. Since March 2004, two thirds of Western Australia's population growth (65.8%) has been sourced from inter-state and overseas migration. Several factors have contributed to this performance, including the strong performance of the Western Australian mining industry.
Population growth in Collie LGA has averaged a slow 0.5% per annum since 2001 (ABS, 2011i). This is well below the growth of population in the broader South West Development Commission (SWDC) region, of 2.5% per annum. However, as a Supertown, it is hoped that the Town of Collie's population will at least double over the coming 20 years to reach 18,940 by 2031. Through the achievement of this goal, demand for key services and sectors of the economy are expected to increase substantially.
Population growth is a key factor in supporting the local economy. Population growth tends to support several sectors of the economy, including:
Retail trade
Construction
Education
Health Care and Social Assistance
6.1.2 External Drivers
6.1.2.1 Ageing Population
The Australian population is ageing. According to the 2006 Census, the number of persons aged over 65 had increased by 11% between 2001 and 2006 (ABS, 2007). The impact of an ageing population is felt in various sectors of the economy, particularly by increased strain on the health sector and a fall in the labour market participation rate. According to the Australian Government in the 2010 edition of the Inter-Generational Report, in 1970 “…there were 7.5 people of working age to support every person aged 65

Collie SuperTown Combined Report
Final Draft Report
29
and over. By 2010 this has fallen to an estimated 5 people of working age for every person aged 65 and over. By 2050 the number is projected to decline to 2.7 people of working age to support every person aged 65 and over”.
To some extent, the impact of the “baby boomers” leaving the work force has been delayed because of the negative impact on superannuation balances caused by the Global Financial Crisis. But this is only a short-term abatement of an acute pressure, with labour and skills shortages anticipated over the coming 20 years. Whilst Australia has experienced strong population growth over the past decade, due to increased life expectancy and immigration, the increase in the population is likely to be insufficient to reverse the trend of an ageing population.
Collie has a younger population (average age of 36.7 years) than the broader SWDC region (37.3 years). This is due to the higher proportion of persons aged under 19 years than the SWDC - an occurrence of Collie having higher proportions of families with children. Nevertheless, an ageing population is still likely to have an influence on Collie as a notable proportion of residents (over 25% in 2010) are in the 40-60 year age bracket.
The ageing of the population is expected to create some economic opportunities for Collie LGA. Increased demand for health services is projected by Commonwealth and State Governments over the next two decades which has already seen health and social assistance overtake retail as the largest employing industry in Australia. Demand for age specific housing is also expected to grow, with retirement villages and aged care facilities expected to play a greater role in accommodating and caring for older Australians.
An ageing population tends to result in:
Lower labour force participation rates
Higher economic dependency on those in the labour force
Lower disposable incomes
Lower taxation revenues
Growth in demand for healthcare and social assistance services
Increased requirement for retirement villages and aged care facilities
6.1.2.2 State & National Growth Outlook
Economic activity is contagious. Economic growth from one sector or geographical area tends to infiltrate other areas of the economy. The broader economic outlook is, therefore, often important in determining future growth sectors in smaller regions.
On a national scale, economic growth in Australia was estimated by the Commonwealth Department of Treasury (2011) in December to plateau over the coming years. The unemployment rate was expected to remain low, fuelling wages price growth. In recent months, the Reserve Bank of Australia has lowered interest rates - towards neutral settings - and highlighted the worsening in global economic sentiment and outcomes could, through trade relations, impact on the Australian economy (RBA, 2011). Concerns about inflation have also eased.
Table 6.1: Australian Economic Indicators, Estimates
Indicator 2011-12 2012-13 2013-14
Real GDP 3.25% 3.00% 3.00%
Unemployment rate 5.50% 5.00% 5.00%
CPI 3.25% 2.50% 2.50%
Wages Price Index 3.75% 3.75% nf
Note: Estimates are percentage change on preceding year. nf = not forecasted. Source: Department of Treasury (2011).
The Western Australia Department of Treasury (2011) is also bullish on the economy, expecting firm economic growth outcomes and low unemployment. These economic outcomes are likely to fuel further growth in the State's regions, including Collie.

Collie SuperTown Combined Report
Final Draft Report
30
Table 6.2: Western Australian Economic Indicators, Estimates
Indicator 2010-11 2011-12 2012-13
GSP 4.00% 4.50% 4.00%
Unemployment rate 4.50% 4.50% 4.25%
CPI 2.75% 3.00% 3.25%
Wages Price Index 4.00% 4.25% 4.50%
Note: percentages are annual grow over the year. Source: Western Australia Department of Treasury (2011).
The economy at the State and national level greatly impacts the economy of Collie. However, economic activity at the State and national level are outside the control of local economic development teams. However, planning for and accommodating expected shifts in the state and national economies could assist in stabilising the economic cycle.
6.1.3 Regional & Local Drivers
6.1.3.1 Mining & Electricity
The mining sector is the backbone to the Collie economy, providing over 16% of local jobs and over 40% of local economic activity. WA’s entire coal supplies come from Collie, the majority of which is used for electricity generation in the State. The unique qualities of the coal mined at Collie are ideal for reliable and efficient electricity generation. Seven million tonnes of coal, valued at over $330 million, was produced in Collie’s coal mines in 2010-11. Over the past decade the domestic coal prices have seen an upward trend indicative of global and domestic demand for coal. Coal production in Collie has largely recorded an upward trend since 2001. Significant major projects are planned for Collie over the coming years and are expected to further expand the power generation capacity of the LGA. Demand for electricity is expected to remain strong, fuelled by the combination of strong economic outcomes and population growth in the State. Collie LGA is a key mining and power generation area for not only Western Australia but the nation. Increased economic activity in terms of mining and power generation is expected to continue to provide strong support for local economic outcomes, particularly employment and GRP. Managing growth and ensuring adequate support services for these activities will be essential over time.
In July 2012, the Australian Carbon Tax will come into effect. The impact of this tax on Collie remains uncertain. The carbon footprint of Collie with its coal mining, electricity generation and alumina/bauxite refinery is significant. As highlighted in the Socio-Economic Profile, these industries make up the majority of the economy in Collie. Any negative impacts on these industries from the Carbon Tax would be a significant blow to the Collie economy. While it is currently unknown what the impact of the Carbon Tax will be, there is a possibility of future negative consequences. However, the importance of Collie in providing electricity for the State will likely outweigh this liability in the short term.
6.1.3.2 Bauxite & Alumina Refinery
The Worsley bauxite and alumina refinery is a core component to the local economy. Output from the refinery currently accounts for over 50% of the Collie LGA's total exports. The sector forms over 20% of the local GRP and employs around 18% of all Collie employees. The recent expansion of the facility, which is currently being completed, will see its importance to the regional economy increase further.
Economic development activities, whilst seeking to broaden the base of the economy through diversification, should also ensure that existing key growth sectors, such as bauxite/alumina refining in Collie remain strong. Ensuring key supply chains to critical industries are supported locally should be key components of the Collie Economic Development Plan. However, expansion of these support sectors must be efficient and align with the needs and demands of the industry, both now and into the future. Developing the skill set locally which can meet these future demands can also assist in supporting this core industry in Collie.

Collie SuperTown Combined Report
Final Draft Report
31
A major industrial development in Collie, the Shotts Industrial Estate, is likely to enable future economic diversity in the local economy. Perdaman Chemicals and Fertilisers is planning a $3.8 billion urea plant (using local coal) which will bring 1,500 new jobs into the region during construction and 200 jobs once operational.
6.1.3.3 National Broadband Network
Beyond core industries locally, internet infrastructure and access to broadband internet will be critical for the future. Use of the internet has infiltrated most aspects of day to day living as well as business operations.
Currently, ADSL services are provided over the existing Telstra copper network, which does not offer the same speed as a broadband connection over fibre optics. Speeds and availability also vary with the existing 3G mobile network. Given that Telstra has a current monopoly, there is no competition and incentive to invest in new infrastructure and offer better services at lower costs.
Access to broadband internet will be a key infrastructure development that will drive economic growth and increasing residential amenity across the LGA. A recent report commissioned by the SWDC3 identified that the National Broadband Network (NBN) would have a significant economic impact on the region, including:
Increased average industry revenue of 21%
Increased average industry employment of 5%
Increased average industry productivity of 6.3%
Modelling of the NBN in the South West region suggests between 2010 and 2030 the economy will benefits from (on average):
Increased output growth by 0.9 percentage points per annum
Increased Gross Value Add growth by 0.8 percentage points per annum
Increased wages and salaries growth by 0.5 percentage points per annum
Increased employment growth by 0.6 percentage points per annum
6.2 Potential Future Economic Growth Path
The potential future growth path of the Collie LGA has been estimated using AECgroup's proprietary economic growth model (see Appendix A). Three growth scenarios have been developed for comparison. These scenarios are based on population growth in the region, specifically:
Low: Assumes population growth aligns with estimates from the Western Australian Planning Commission for an average annual decline in the population of 0.4% per annum to 2031
Medium: Assumes population growth aligns with the estimates from the Commonwealth Department of Health and Ageing for an average annual decline in the population of 0.4% per annum to 2031.
High: Assumes population growth aligns with the Supertown target of a doubling in the population of Collie Town and continued historical trends for the remainder of the LGA, resulting in an average annual 3.0% expansion of the population.
Jobs creation will be a core component to achieving the SuperTowns population target over the coming 20 years. Employment outcomes for the Collie LGA are expected to be strong. Strong job creation in the key sectors of mining, manufacturing and construction will drive these outcomes. It is likely that the increased job creation will, to a large extent, be filled by imported labour (mostly of fly-in, fly-out or drive-in, drive-out nature). This is a trend which is already underway in the regions. Total employment in
3 Impact Assessment of the National Broadband Network in the South West Region (April 2011)

Collie SuperTown Combined Report
Final Draft Report
32
the Collie LGA is expected to grow to between 13,000 and 23,000 over the coming 20 years.
Figure 6.1: Estimated Employment Outcomes, Collie LGA, 2011 to 2031
Note: The population growth profile for low and medium scenarios are the same, which equates to the same employment growth path. Source: ABS (2010a, 2010b, 2011g, 2011h, 2011i), DHA (2007), WAPC (2005), AECgroup
Economic growth in the region is expected to be strong, regardless of population growth in the region. Leading industries, such as mining, manufacturing and transport, postal and warehousing are expected to drive growth in the region, rather than population-based industries. However, a core component of the growth outlook is economic diversification, in which the mining sector retains its position as the key industry, but by a lesser margin as other sectors receive stimulus from a broader population base.
Figure 6.2: Estimated GRP (M$), Collie LGA, 2011 to 2031
Note: The population growth profile for low and medium scenarios are the same, which equates to the same GRP growth path.
Source: ABS (2010a, 2010b, 2011g, 2011h, 2011i), DHA (2007), WAPC (2005), AECgroup
0
5,000
10,000
15,000
20,000
25,000
2011 2016 2021 2026 2031
Em
plo
ym
en
tLow Medium High
$0
$1,000
$2,000
$3,000
$4,000
$5,000
$6,000
$7,000
$8,000
$9,000
2011 2016 2021 2026 2031
Gro
ss R
eg
ion
al
Pro
du
ct
Low Medium High

Collie SuperTown Combined Report
Final Draft Report
33
6.3 Key Findings
The Collie LGA benefits from a range of key localised businesses and industry which are expected to continue to grow over the coming 20 years. A range of micro and macroeconomic factors are likely to play a role in the future development of the Collie LGA. These include population growth, and aging population, trends in the mining industry, and state and national economic growth. To some extent, these factors will need to be addressed and planned for in Collie LGA to ensure the region is able to reach its economic potential. In particular, the carbon liability of Collie is high, given its key industries and there is a risk of climate change policy negatively impacting on the economy in the long run. Ensuring adequate job opportunities for new residents is a key component to reaching the SuperTowns population target and this will assist in growing the local economy.

Collie SuperTown Combined Report
Final Draft Report
34
7. Regional Gap Analysis
Gap analysis provides an understanding of where existing services and infrastructure are short of estimated demand. This may be apparent in the high level of imports into a region or in the underperformance of a region against benchmarking regions. In order to develop an understanding of the gaps in the Collie LGA, the gap analysis undertaken involved:
Import and Export Analysis: Understanding which products and services are imported into the region (suggesting a lack of local supply) and which products or services are exported out of the region (after having met local supply).
Supply Chain Analysis: Understanding where in the supply chain the Collie LGA lies and which local industries add significant value.
Comparative Assessments: Analysing the composition of Collie LGA in comparison with three key benchmarking regions.
Journey to Work: Analysing where local residents work and where local workers are sourced from.
7.1 Import & Export Analysis
Understanding the major imports into a region can sometimes represent opportunities for local employment through substituting importing with local production, which would improve local industry supply chains and provide additional job opportunities for locals. In addition, improving the local supply chain can assist in retaining local wealth in the area. Prominent imports into the Collie LGA include:
Non-Ferrous Metal Ore Mining (i.e. mining of bauxite for alumina refining, $910.6 million or 52.6% of all imports).
Exploration and Mining Support Services ($81.3 million or 4.7%).
Oil and Gas Extraction ($72.3 million or 4.2%).
Electricity Transmission, Distribution, On selling and Electricity Market Operations ($59.1 million or 3.4%).
An appreciation of the scale of the Worsley Alumina operation and its impact on imports can be seen in Figure 14.7, as Bauxite is the dominant import. Many of the top ten importing industries are likely related to coal mining, which may present some opportunities for import replacement. Other opportunities may arise from construction and development services as well as some commercial office opportunities related to the mining and refinery processes.

Collie SuperTown Combined Report
Final Draft Report
35
Figure 7.1: Key Imports into Collie LGA, 2007-08 (Top Ten)
Source: ABS (2010a, 2011h), AECgroup
Key exports out of a region tend to be reflective of its competitive advantage and can represent opportunities for further growth and expansion. In the case of Collie, major exports include alumina, coal and electricity, which reflect the impact of foundation industries and major employers in the region.
Prominent exports from the Collie LGA include:
Basic Non-Ferrous Metal Manufacturing ($1,547.3 million or 56.6% of total exports).
Coal Mining ($585.0 million or 21.4%)4.
Electricity Generation ($383.1 million or 14.0%).
Heavy and Civil Engineering Construction ($66.4 million or 2.4%).
4 Export value captured in this analysis is estimated using transaction tables. Export value may differ from value
of coal products from the mine.
$29.1
$32.4
$35.7
$38.7
$40.4
$51.0
$59.1
$72.3
$81.3
$910.6
$0 $200 $400 $600 $800 $1,000
Petroleum and Coal Product Manufacturing
Non-Residential Property Operators and Real Estate Services
Wholesale Trade
Finance
Professional, Scientific and Technical Services
Construction Services
Electricity Transmission, Distribution, On Selling and Electricity Market Operation
Oil and gas extraction
Exploration and Mining Support Services
Non Ferrous Metal Ore Mining
Imports of Goods and Services by Industry ($M)

Collie SuperTown Combined Report
Final Draft Report
36
Figure 7.2: Key Exports out of Collie LGA, 2007-08 (Top Ten)
Source: ABS (2010a, 2011h), AECgroup
7.2 Supply Chain Analysis
The following tables provide a summary of the key upstream (imports and local purchases) and downstream (local sales to industry and consumption, as well as exports) markets for each industry. Care should be taken in interpreting these results as the values presented in the tables are indicative estimates only, and are designed to broadly identify the key inputs for each industry and potential targets for regional development rather than the specific quantum of each component.
The supply chain assessment has been conducted using Input Output transaction tables developed specifically for the Collie LGA, based on the 2007-08 National Input Output Tables developed by the Australian Bureau of Statistics (2011g) and employment by industry estimates provided by the Australian Bureau of Statistics (2010a). The method used for regionalising the national tables to the Collie LGA economy is consistent with the approach outlined in West (1993).
Key points of note:
Local purchases represent a small portion (just 26.4%) of the region's total inputs, with imports into the region forming 73.6% of all inputs. Imports tend to be supportive of the local mining industry (which forms over 40% of the local economy).
Key sectors which import into the region include the local manufacturing industry (such as aluminium smelting), coal mining and electricity generation. Together, these three industries account for over 83% of the LGA's total imports.
The local mining industry imports almost 80% of all inputs suggesting real existing demand for local replacements of these services, particularly exploration and mining support services and petroleum and coal product manufacturing.
Interpreting the Supply Chain Assessment Flow Diagram
The supply chain assessment identified in the following diagrams seeks to highlight the flow of goods and services from one industry to another in the region. The value of these goods and services as well as the flow of them across the economy are depicted demonstrating the supply chain. The industry being examined is in the middle of the diagram with its inputs highlighted on the left hand side of the diagram and the outputs on the right hand side. Inputs (upstream) and outputs (downstream) are made up of various components:
Upstream inputs to production:
$5.5
$6.6
$8.7
$9.9
$30.1
$36.6
$66.4
$383.1
$585.0
$1,547.3
$0 $400 $800 $1,200 $1,600
Retail Trade
Sheep, Grains, Beef and Dairy Cattle
Sawmill Product Manufacturing
Construction Services
Petroleum and Coal Product Manufacturing
Non Ferrous Metal Ore Mining
Heavy and Civil Engineering Construction
Electricity Generation
Coal mining
Basic Non-Ferrous Metal Manufacturing
Exports of Goods and Services by Industry ($M)
Collie SuperTown Combined Report
Final Draft Report
37
o Sourced locally, or
o Imported to the region
Downstream sales of product:
o Sold direct to local industry (and used elsewhere in value adding production)
o Consumed by the local economy (population based consumption), or
o Exported from the region
The following diagrams show the supply chain assessment for mining, metal production and electricity generation.
Key observations from this analysis include:
Mining
The dominance of coal mining is clear, representing 90% and 93% of mining industry imports and exports.
Out of a total of $380 million of inputs, $80 million (21%) is sourced locally, with the remainder imported to the region.
Out of the $300 million that is imported into the region, $81 million (27%) is in exploration and mining support services, which also consumes $11 million of goods and services locally.
Metal production
Alumina production (non-ferrous metal manufacturing) is the most prominent export for the region, representing $1.5 billion to the economy in 2007-08. These products from over 56% of the total product exported from Collie LGA.
Bauxite and other materials associated with the mining and refining of bauxite are the key imports into the region for this manufacturing, forming over 87% of all imports into the alumina refining industry. Local purchases of this input is minimal, suggesting limited opportunity for import replacement.
Electricity generation
The majority of all inputs into the electricity, gas, water and waste services industry is sourced locally. Coal mining represents over two thirds of total locally-sourced inputs to the industry.
The most prominent import into the industry is electricity transmission, distribution, on selling and electricity market generation ($27.3 million or 19% of all imports for the sector). However, due to the nature of this sector, import replacement is likely to be unfeasible.

Collie SuperTown Combined Report
Final Draft
38
Figure 7.3: Supply Chain, Mining, Collie LGA
Source: ABS (2010a, 2011h), AECgroup
LOCAL
CONSUMPTION
EXPORTS
Industry $M Industry $M Industry $M $M $M
Exploration and Mining Support
Services
$81.3 Petroleum and Coal Product
Manufacturing
$30.7 Electricity Generation $102.5
Petroleum and Coal Product
Manufacturing
$24.7 Exploration and Mining Support
Services
$10.7 Basic Non-Ferrous Metal
Manufacturing
$69.7
Non-Residential Property
Operators and Real Estate
Services
$15.2 Construction Services $6.5 Coal mining $9.1
Professional, Scientific and
Technical Services
$14.7 Electricity Generation $5.1 Non Ferrous Metal Ore Mining $3.7
Transport Support services and
storage
$12.9 Professional, Scientific and
Technical Services
$3.3 Petroleum and Coal Product
Manufacturing
$0.5
Other industries $151.6 Other industries $23.7 Other industries $0.8Total $300.4 Total $80.0 Total $186.3
Exploration and Mining Support
Services
$73.7 Petroleum and Coal Product
Manufacturing
$26.3 Electricity Generation $102.5
Petroleum and Coal Product
Manufacturing
$23.5 Exploration and Mining Support
Services
$8.2 Basic Non-Ferrous Metal
Manufacturing
$1.6
Non-Residential Property
Operators and Real Estate
Services
$15.0 Construction Services $5.3 Coal mining $0.6
Transport Support services and
storage
$12.7 Electricity Generation $4.2 Petroleum and Coal Product
Manufacturing
$0.5
Other industries $145.8 Other industries $21.2 Other industries $0.2Total $270.8 Total $65.2 Total $105.5
Exploration and Mining Support
Services
$7.4 Petroleum and Coal Product
Manufacturing
$3.1 Basic Non-Ferrous Metal
Manufacturing
$67.1
Construction Services $1.3 Exploration and Mining Support
Services
$2.3 Non Ferrous Metal Ore Mining $1.3
Petroleum and Coal Product
Manufacturing
$1.2 Non Ferrous Metal Ore Mining $1.3 Basic Chemical Manufacturing $0.1
Finance $1.2 Construction Services $0.9 Sawmill Product Manufacturing $0.0
Other industries $11.6 Other industries $3.3 Other industries $0.0Total $22.7 Total $10.9 Total $68.6
Road Transport $0.1 Petroleum and Coal Product
Manufacturing
$0.3 Basic Non-Ferrous Metal
Manufacturing
$1.0
Construction Services $0.1 Construction Services $0.2 Coal mining $0.2
Specialised and other Machinery
and Equipment Manufacturing
$0.1 Heavy and Civil Engineering
Construction
$0.2 Heavy and Civil Engineering
Construction
$0.1
Wholesale Trade $0.1 Exploration and Mining Support $0.1 Construction Services $0.1
Other industries $0.6 Other industries $0.3 Other industries $0.2Total $1.0 Total $1.1 Total $1.5
Professional, Scientific and $2.9 Petroleum and Coal Product $1.0 Coal mining $8.2
Other Repair and Maintenance $0.4 Professional, Scientific and
Technical Services
$0.8 Non Ferrous Metal Ore Mining $2.3
Water, Pipeline and Other $0.3 Construction Services $0.1 Exploration and Mining Support $0.1
Iron and Steel Manufacturing $0.2 Building Cleaning, Pest Control, $0.1 Non Metallic Mineral Mining $0.1
Other industries $2.2 Other industries $0.7 Other industries $0.0Total $6.0 Total $2.7 Total $10.7
Exploration and
Mining Support
Services
$0.0 $4.9
Non Ferrous
Metal Ore Mining$0.0 $36.6
Non Metallic
Mineral Mining$0.0 $1.3
MINING $0.1 $627.7
Coal Mining $0.0 $585.0
UPSTREAM INPUTS TO PRODUCTION
SECTOR OF INTEREST
DOWNSTREAM SALES OF PRODUCTIMPORTS LOCAL PURCHASES SALES TO LOCAL INDUSTRY

Collie SuperTown Combined Report
Final Draft
39
Figure 7.4: Supply Chain, Metal and Metal Product Manufacturing (Part A), Collie LGA
Source: ABS (2010a, 2011h), AECgroup
LOCAL
CONSUMPTION
EXPORTS
Industry $M Industry $M Industry $M $M $M
Non Ferrous Metal Ore Mining $909.4 Basic Non-Ferrous Metal
Manufacturing
$149.9 Basic Non-Ferrous Metal
Manufacturing
$149.7
Electricity Transmission,
Distribution, On Selling and
Electricity Market Operation
$26.9 Non Ferrous Metal Ore Mining $67.1 Coal mining $0.9
Road Transport $11.8 Electricity Generation $28.5 Heavy and Civil Engineering
Construction
$0.8
Basic Non-Ferrous Metal
Manufacturing
$10.2 Petroleum and Coal Product
Manufacturing
$1.9 Specialised and other Machinery
and Equipment Manufacturing
$0.4
Rail Transport $8.8 Road Transport $1.7 Structural Metal Product
Manufacturing
$0.4
Other industries $77.4 Other industries $11.8 Other industries $3.2Total $1,044.5 Total $260.9 Total $155.3
Iron Ore Mining $0.3 Iron and Steel Manufacturing $0.1 Basic Non-Ferrous Metal
Manufacturing
$0.2
Iron and Steel Manufacturing $0.2 Coal mining $0.1 Coal mining $0.2
Wholesale Trade $0.0 Non Metallic Mineral Mining $0.0 Heavy and Civil Engineering
Construction
$0.1
Non-Residential Property
Operators and Real Estate
$0.0 Road Transport $0.0 Iron and Steel Manufacturing $0.1
Other industries $0.2 Other industries $0.2 Other industries $0.6Total $0.7 Total $0.5 Total $1.2
Non Ferrous Metal Ore Mining $909.4 Basic Non-Ferrous Metal $149.4 Basic Non-Ferrous Metal $149.4
Electricity Transmission,
Distribution, On Selling and
Electricity Market Operation
$26.9 Non Ferrous Metal Ore Mining $67.1 Metal Containers and Other Sheet
Metal Product manufacturing
$0.2
Road Transport $11.7 Electricity Generation $28.5 Specialised and other Machinery $0.2
Basic Non-Ferrous Metal $10.2 Petroleum and Coal Product $1.8 Motor Vehicles and Parts; Other $0.1
Other industries $84.0 Other industries $12.1 Other industries $0.9Total $1,042.3 Total $258.9 Total $150.8
Iron and Steel Manufacturing $0.2 Basic Non-Ferrous Metal
Manufacturing
$0.1 Heavy and Civil Engineering
Construction
$0.3
Structural Metal Product
Manufacturing
$0.1 Structural Metal Product
Manufacturing
$0.1 Residential Building Construction $0.3
Wholesale Trade $0.1 Iron and Steel Manufacturing $0.1 Coal mining $0.3
Other Fabricated Metal Product
manufacturing
$0.0 Other Fabricated Metal Product
manufacturing
$0.0 Non-Residential Building
Construction
$0.2
Other industries $0.2 Other industries $0.3 Other industries $0.6Total $0.7 Total $0.7 Total $1.7
UPSTREAM INPUTS TO PRODUCTION
SECTOR OF INTEREST
DOWNSTREAM SALES OF PRODUCTIMPORTS LOCAL PURCHASES SALES TO LOCAL INDUSTRY
METAL AND
METAL
PRODUCTS
$0.2 $1,548.3
Iron and Steel
Manufacturing$0.0 $0.3
Basic Non-
Ferrous Metal
Manufacturing
$0.0 $1,547.3
Structural Metal
Product
Manufacturing
$0.0 $0.2

Collie SuperTown Combined Report
Final Draft
40
Figure 7.5: Supply Chain, Metal and Metal Product Manufacturing (Part B), Collie LGA
Source: ABS (2010a, 2011h), AECgroup
LOCAL
CONSUMPTION
EXPORTS
Industry $M Industry $M Industry $M $M $M
Iron and Steel Manufacturing $0.2 Basic Non-Ferrous Metal
Manufacturing
$0.2 Coal mining $0.1
Wholesale Trade $0.0 Iron and Steel Manufacturing $0.0 Heavy and Civil Engineering
Construction
$0.1
Transport Support services and
storage
$0.0 Building Cleaning, Pest Control,
Administrative and Other Support
Services
$0.0 Specialised and other Machinery
and Equipment Manufacturing
$0.1
Other Fabricated Metal Product
manufacturing
$0.0 Professional, Scientific and
Technical Services
$0.0 Residential Building Construction $0.0
Other industries $0.2 Other industries $0.1 Other industries $0.3Total $0.5 Total $0.4 Total $0.7
Iron and Steel Manufacturing $0.2 Basic Non-Ferrous Metal
Manufacturing
$0.1 Coal mining $0.2
Wholesale Trade $0.0 Iron and Steel Manufacturing $0.0 Heavy and Civil Engineering
Construction
$0.1
Other Fabricated Metal Product
manufacturing
$0.0 Other Fabricated Metal Product
manufacturing
$0.0 Non-Residential Building
Construction
$0.1
Structural Metal Product
Manufacturing
$0.0 Building Cleaning, Pest Control,
Administrative and Other Support
$0.0 Basic Non-Ferrous Metal
Manufacturing
$0.1
Other industries $0.1 Other industries $0.2 Other industries $0.5Total $0.4 Total $0.4 Total $0.9
Metal Containers
and Other Sheet
Metal Product
manufacturing
$0.1 $0.2
Other Fabricated
Metal Product
manufacturing
$0.1 $0.2
UPSTREAM INPUTS TO PRODUCTION
SECTOR OF INTEREST
DOWNSTREAM SALES OF PRODUCTIMPORTS LOCAL PURCHASES SALES TO LOCAL INDUSTRY

Collie SuperTown Combined Report
Final Draft
41
Figure 7.6: Supply Chain, Electricity, Gas, Water and Waste Services, Collie LGA
Source: ABS (2010a, 2011h), AECgroup
LOCAL
CONSUMPTION
EXPORTS
Industry $M Industry $M Industry $M $M $M
Electricity Transmission,
Distribution, On Selling and
Electricity Market Operation
$27.3 Coal mining $102.5 Electricity Generation $31.8
Finance $16.4 Electricity Generation $31.1 Basic Non-Ferrous Metal
Manufacturing
$30.1
Construction Services $14.1 Construction Services $7.0 Coal mining $4.8
Coal mining $14.0 Petroleum and Coal Product
Manufacturing
$2.5 Electricity Transmission,
Distribution, On Selling and
Electricity Market Operation
$1.4
Oil and gas extraction $10.4 Finance $2.0 Non Ferrous Metal Ore Mining $1.0
Other industries $60.7 Other industries $8.9 Other industries $5.5Total $142.9 Total $154.1 Total $74.6
Electricity Transmission,
Distribution, On Selling and
Electricity Market Operation
$26.9 Coal mining $102.5 Electricity Generation $30.1
Finance $15.6 Electricity Generation $30.1 Basic Non-Ferrous Metal
Manufacturing
$28.5
Coal mining $14.0 Construction Services $5.8 Coal mining $4.2
Construction Services $13.8 Petroleum and Coal Product
Manufacturing
$1.9 Electricity Transmission,
Distribution, On Selling and
Electricity Market Operation
$0.9
Other industries $67.9 Other industries $8.7 Other industries $2.5Total $138.2 Total $149.1 Total $66.2
Finance $0.4 Electricity Generation $0.9 Electricity Generation $1.3
Electricity Transmission,
Distribution, On Selling and
$0.4 Construction Services $0.7 Basic Non-Ferrous Metal
Manufacturing
$1.3
Electrical Equipment
Manufacturing
$0.2 Electricity Transmission,
Distribution, On Selling and
Electricity Market Operation
$0.4 Electricity Transmission,
Distribution, On Selling and
Electricity Market Operation
$0.4
Construction Services $0.2 Finance $0.2 Coal mining $0.2
Other industries $1.0 Other industries $0.7 Other industries $0.7Total $2.3 Total $2.8 Total $3.9
Finance $0.3 Construction Services $0.5 Electricity Generation $0.3
Professional, Scientific and
Technical Services
$0.3 Petroleum and Coal Product
Manufacturing
$0.3 Water Supply, Sewerage and
Drainage Services
$0.3
Basic Chemical Manufacturing $0.2 Water Supply, Sewerage and
Drainage Services
$0.3 Coal mining $0.3
Auxiliary Finance and Insurance $0.2 Professional, Scientific and $0.1 Professional, Scientific and $0.2
Other industries $1.2 Other industries $0.7 Other industries $1.6Total $2.2 Total $1.9 Total $2.6
Wholesale Trade $0.0 Petroleum and Coal Product
Manufacturing
$0.1 Heavy and Civil Engineering
Construction
$0.5
Telecommunication Services $0.0 Building Cleaning, Pest Control,
Administrative and Other Support
$0.0 Construction Services $0.5
Finance $0.0 Postal and Courier Pick-up and
Delivery Service
$0.0 Non-Residential Building
Construction
$0.2
Computer Systems Design and $0.0 Education and Training $0.0 Coal mining $0.2
Other industries $0.1 Other industries $0.1 Other industries $0.5Total $0.2 Total $0.2 Total $1.9
UPSTREAM INPUTS TO PRODUCTION
SECTOR OF INTEREST
DOWNSTREAM SALES OF PRODUCTIMPORTS LOCAL PURCHASES SALES TO LOCAL INDUSTRY
Electricity
Transmission,
Distribution, On
Selling and
Electricity
Market
Operation
$2.5 $0.9
ELECTRICITY,
GAS, WATER
AND WASTE
SERVICES
$8.5 $385.9
Electricity
Generation$2.5 $383.1
Water Supply,
Sewerage and
Drainage
Services
$3.0 $1.4
Waste
Collection,
Treatment and
Disposal Services
$0.5 $0.5

Collie SuperTown Combined Report
Final Draft
42
7.3 Comparative Assessments
The comparative assessment is a benchmarking approach which compares the Collie LGA to three regions of similar nature:
Singleton LGA: Major coal mining and service centre of the Hunter Valley, located approximately 80km northwest of Newcastle. Characterised by a strong industrial base and a population more than twice that of Collie. Experienced moderate population growth over the past decade.
Emerald SLA: Regional centre of the broader Central Highlands region located approximately 270km west of Rockhampton. Major agricultural and mining service centre characterised by growing industrial base. Current population equivalent with the target for the Collie SuperTown in 2031, with strong average population growth over the preceding decade.
Latrobe LGA: Large brown coal mining and domestic power generation centre, located approximately 165km east-south east of Melbourne CBD. Large population centre supported by regionally significant education and health service facilities. Characterised by a relatively low population growth.
These locations were selected as they represent examples of the potential growth profile of Collie as it becomes a SuperTown and continues to grow beyond 2031. As such, this comparative assessment analyses potential gaps in the current Collie community and economy that must be addressed if future growth is to be facilitated.
The comparative assessment works by comparing Collie LGA to each of the selected benchmark regions across the following key indicators:
GRP per capita
Number of businesses per capita
Unemployment rates
Average house price as a proportion of household income
Average income
Proportion of workers in white collar employment
Proportion of residents aged over 15 years with University qualifications
Percentage of households that are young families
Percentage of population aged 65+
Average annual population growth
These indicators cover population, demographic, socio-economic, investment, employment and economic characteristics of Collie, as summarised in the Socio-Economic Profile.
For each of these indicators, Collie is compared to the average across all four regions, thereby helping to address issues of the relative size of each region’s population and economy and local specific variable being smoothed, allowing for more fundamental gaps to be identified. As such, a result above 0% means that Collie LGA is currently performing better than the average of its peers, while a result below 0% means it is worse than its peers.
The outcomes of the assessment are outlined in the figure below.

Collie SuperTown Combined Report
Final Draft
43
Figure 7.7: Comparative Assessment, Collie LGA
Source: ABS (2007, 2011, 2011a, 2011f, 2011i), realestate.com.au (2011), Homepriceguide.com.au (2011), NSW Housing (2011), Department of Employment, Education and Workplace Relations (2011).
Figure 7.7 reveals a majority of negative scores for Collie when compared with the benchmarked regions. Areas of underperformance include:
Collie has fewer businesses per capita than the comparison regions, suggesting a less diversified commercial base and potential lack of support for small businesses and entrepreneurs.
Collie’s economy has a higher unemployment rate, despite stronger GRP per capita, suggesting local economic activity is generating local employment at a much lower rate than comparison regions and tends to import its workers from surrounding LGAs.
Collie has an underrepresentation of skilled residents, underperforming in terms of white collar workers and proportion of residents with a university degree. Education is a key social activity which enables local residents to attain higher-level employment positions and access higher incomes. Enabling access to higher education in the region through the expansion of the TAFE and other education institutes could assist in transforming the local economy. Ensuring that the education providers are closely linked with local industries is important to providing effective education/employment pathways for residents and ensuring the local workforce can meet industry’s demand.
The share of population aged 65+ is higher, meaning the negative implications of the aging of the baby boomer generation are likely to impact Collie more significantly than the benchmarked regions. However, this means that the benefits of this ageing in terms of health and social assistance employment growth are also likely to be more significant.
Collie has struggled to produce comparable population growth rates in the medium term, with the annual growth rate over the preceding decade sitting at less than one-third of the average of the benchmarked regions.
However, Collie LGA did perform well against the benchmarked regions across three of the indicators:
Housing in the Collie LGA is marginally more affordable than in the other comparative regions, assisted by the lower house prices and very slightly higher average incomes in the LGA.
-80% -60% -40% -20% 0% 20% 40% 60% 80%
Annual Population Growth Rate (2001 to 2010)
Share of Population Aged 65+ (2010)
Share of families with young children (2006)
Share of Residents (15+) with a University Degree (2006)
Share of Workers in White Collar employment (2009)
Average Individual Income (2008-09)
Housing Affordability - Median Multiple (2008-09)
Unemployment Rate (September Q 2011)
Number of Businesses per Capita (2009)
GRP per capita (2009-10)
Difference to Average
Ind
ica
tors

Collie SuperTown Combined Report
Final Draft
44
The Collie LGA currently has a 35.9% higher level of GRP per capita than the average of the benchmarked regions. The combination of non-ferrous metal production (alumina), large coal mining operations and utilities in the LGA is different from the benchmarked regions, which may only have one to two of these strengths. It is the combination of these three high value generating sectors that produces this larger GRP per capita.
Overall, Collie’s performance in the comparative assessment against potential benchmarks of its future growth profile reinforces key messages from other assessments in this Gap Analysis. Collie’s businesses, labour force and economic base requires increased diversification with greater focus on employment generation and skills development. However, the starkest issue is that of population growth, with considerable effort required to accelerate the residential population of Collie to achieve the SuperTown’s target by 2031.
7.4 Journey to Work
In 2006, the Collie LGA imported labour, predominantly from other LGAs within the SWDC region. A net 1,232 workers come into the region each day, with large numbers from LGAs in great proximity to Collie, such as Bunbury, Dardanup and Harvey.
Table 7.1: Journey to Work Movements by LGA, 2006
LGAs Lives in Collie and Works
in... Works in Collie and
Lives in... Difference
Bunbury 194 520 326
Augusta-Margaret River 0 3 3
Boyup Brook 4 12 8
Bridgetown-Greenbushes 4 0 -4
Busselton 0 22 22
Capel 21 151 130
Collie 2,683 2,683 0
Dardanup 26 298 272
Donnybrook-Balingup 21 82 61
Harvey 43 528 485
Manjimup 8 0 -8
Nannup 0 0 0
Other 236 172 -64
Total 3,239 4,471 1,232
Source: ABS (2007), AECgroup
Collie LGA attracts workers in to the region to work in its key industries, including Mining, Manufacturing, Electricity, Gas and Water Supply and Construction. The region also attracts workers in support industries such as property and business services. More detail on the key industries journey to work figures are provided in Appendix B.
Table 7.2: Journey to Work Movements by Industry, 2006
Industry Lives in Collie Works in Collie Difference
Agriculture, Forestry and Fishing 109 74 -35
Mining 543 678 136
Manufacturing 375 1,285 910
Electricity, Gas and Water Supply 192 310 118
Construction 255 309 54
Wholesale Trade 56 45 -11
Retail Trade 459 452 -7
Accommodation, Cafes and Restaurants 152 154 2
Transport and Storage 78 65 -13
Communication Services 24 20 -4
Finance and Insurance 38 38 0
Property and Business Services 155 200 45

Collie SuperTown Combined Report
Final Draft
45
Industry Lives in Collie Works in Collie Difference
Government Administration & Defence 121 126 5
Education 259 288 29
Health and Community Services 314 310 -4
Cultural and Recreational Services 22 25 3
Personal and Other Services 88 92 4
Total 3,239 4,471 1,232
Source: ABS (2007), AECgroup
7.5 Key Findings
The Collie economy is dominated by a combination of non-ferrous metal manufacturing (i.e. alumina), coal mining and electricity generation. This this reflected in both the import/export and supply chain profiles of the Collie LGA. The comparative assessment revealed the extent to which these activities support the local economy, with GRP per person well above the average for the comparison regions.
Unfortunately, this activity does not appear to be generating local employment opportunities, with Collie’s unemployment rate above the average for comparison regions. Part of the reason for this appears to be the fact that key employment opportunities, particularly those generated in non-ferrous metal manufacturing and to a lesser degree, electricity generation, are filled by workers living outside of Collie. Journey to work analysis revealed significant drive-in/drive-out travel patterns to Collie among workers living in Bunbury, Harvey, Dardanup and Capel LGAs.
Capturing employment opportunities locally, while continuing to reinforce strong economic interrelationships between Collie and the surrounding region, is therefore a critical challenge to Collie’s growth as a SuperTown.

Collie SuperTown Combined Report
Final Draft
46
8. Opportunities Assessment
Industry growth opportunities for Collie LGA have been identified by undertaking a desktop economic development opportunity assessment (refer to Appendix C for the detailed assessments). This assessment employs a number of analytical tools to draw out the economic strengths, strategic assets and opportunities for a region in the context of national industry growth trends in order to determine specific industry sector targets for future economic development activities.
The desktop assessment tools used include:
Location Quotient Analysis: Assesses the degree of labour specialisation in an economy (a competitive advantage) and is used to identify industry areas of relative strengths and weaknesses.
Competitive Assessment: Utilising a diamond assessment framework5, strengths and weakness of the Collie economy are considered.
Cluster Mapping Analysis: Allows for the identification of growth opportunities in specific industry sectors, where a natural competitive advantage already exists.
The outcome of the assessment is the list of identified target areas for economic development activities. These target areas focus on high value-adding, knowledge based activities that will drive and deliver real economic benefits to the community for the future and provide for sustainable economic development and employment growth over time.
When identifying key industry sectors for growth, it is important to keep in mind the need for high value development (i.e. business activities that bring a high degree of knowledge and generate products and services of a high value). At the same time, it is important that future development results in sustainable business, both in terms of their environmental responsibilities but also in terms of the competitiveness and feasibility of their operations in the long term. By focusing on these areas, economic development can generate greater economic returns for the community.
8.1 Location Quotients
In order to demonstrate the specialisation of the economy, location quotients based on employment have been calculated. The location quotients demonstrate the degree to which a local or regional economy is specialised by examining the proportion of employment (by industry sub-sector) compared to a larger economy (Australian economy). Location quotients can be used to indicate the relative strengths or weaknesses of a local or regional economy (i.e., a natural competitive advantage or disadvantage).
For the analysis, Collie LGA, SWDC region, Perth SD and Western Australia were compared against employment for Australia. Depictions of the Location Quotients for Collie LGA, Singleton LGA, Emerald LGA and La Trobe LGA are contained in Appendix C. A location quotient of “1” means that the economies being compared have an equal share of employment (compared to Australia) for a specific industry sector, thus no potential advantage or disadvantage. A location quotient above “1” indicates a specialisation of labour and therefore an area of potential competitive advantage. If the location quotient is below “1”, the area is under-represented compared to the national economic structure in this particular industry sector.
Figure 14.5 shows the Location Quotients across the 19 sectors of the economy. Figure 8.2, Figure 8.3 and Figure 14.6 provide a detailed assessment of the agriculture forestry and fishing, mining, manufacturing and business and professional services sectors, respectively.
5 As opposed to a traditional SWOT assessment, AECgroup has modified the diamond assessment framework, originally developed by Dr. Michael Porter, Harvard University, for examining the competitiveness (strengths and weaknesses) of nations. Dr. Porter has used this framework in advising numerous national and state government
agencies and has won numerous awards for his contribution to economic development.

Collie SuperTown Combined Report
Final Draft
47
Figure 8.1: Location Quotients, 2006, 1-Digit ANZSIC
Source: ABS (2007), AECgroup
Figure 8.2: Location Quotients, 2006, 2-Digit ANZSIC, Agriculture, Forestry and Fishing and Mining
Source: ABS (2007), AECgroup
0.0 1.0 2.0 3.0 4.0 5.0
Wholesale trade
Financial and insurance services
Information media and telecommunications
Professional, scientific and technical services
Transport, postal and warehousing
Arts and recreation services
Rental, hiring and real estate services
Administrative and support services
Public administration and safety
Agriculture, forestry and fishing
Other services
Health care and social assistance
Retail trade
Accommodation and food services
Education and training
Construction
Manufacturing
Electricity, gas, water and waste services
Mining
Collie
SWDC
Perth SD
WA
(12.6)
(7.0)
0.0 1.0 2.0 3.0 4.0 5.0 6.0 7.0
Agriculture, Forestry and Fishing Support Services
Agriculture
Non-Metallic Mineral Mining and Quarrying
Exploration and Other Mining Support Services
Forestry and Logging
Metal Ore Mining
Coal Mining
Collie
SWDC
Perth SD
WA
(39.6)

Collie SuperTown Combined Report
Final Draft
48
Figure 8.3: Location Quotients, 2006, 2-Digit ANZSIC, Manufacturing
Source: ABS (2007), AECgroup
Figure 8.4: Location Quotients, 2006, 2-Digit ANZSIC, Business and Professional Services
Note: Includes Professional Scientific Services, Financial and Insurance Services, Information Media and Telecommunications,
Administration and Support Services. Source: ABS (2007), AECgroup
Key findings:
The Collie LGA has significant labour specialisation in the industries of mining, electricity, gas, water and waste services and manufacturing. However, Collie LGA experiences underrepresentation in all other industries.
Manufacturing of primary metal and metal products, petroleum and coal products and wood products are specialisations of Collie LGA's labour force.
The Collie LGA has a dearth of professional and business services which are likely to be required to support future economic growth in the region.
0.0 1.0 2.0 3.0 4.0 5.0 6.0 7.0
Beverage and Tobacco Product …
Pulp, Paper and Converted Paper Product …
Printing (including the Reproduction of …
Polymer Product and Rubber Product …
Non-Metallic Mineral Product …
Furniture and Other Manufacturing
Food Product Manufacturing
Transport Equipment Manufacturing
Textile, Leather, Clothing and Footwear …
Fabricated Metal Product Manufacturing
Basic Chemical and Chemical Product …
Machinery & Equipment Manufacturing
Wood Product Manufacturing
Petroleum and Coal Product …
Primary Metal and Metal Product …
Collie
SWDC
Perth SD
WA
(27.9)
0.0 0.2 0.4 0.6 0.8 1.0 1.2 1.4
Motion Picture and Sound Recording Activities
Broadcasting (except Internet)
Internet Publishing and Broadcasting
Internet Service Providers, Web Search …
Library and Other Information Services
Insurance and Superannuation Funds
Telecommunications Services
Computer System Design and Related Services
Real Estate Services
Auxiliary Finance and Insurance Services
Administrative Services
Finance
Professional, Scientific and Technical …
Building Cleaning, Pest Control and Other …
Publishing (except Internet and Music …
Rental and Hiring Services (except Real Estate)
Collie
SWDC
Perth SD
WA

Collie SuperTown Combined Report
Final Draft
49
8.2 Competitive Assessment
A diamond assessment framework was used to assess the competitiveness of Collie LGA (HBS, 2010).
The diagram below highlights the four key points (factor conditions, demand conditions, supporting industry and firm strategy and rivalry) that form the basis for the diamond, with each one of these factors influencing and relying on the other and providing the foundation for a region’s competitiveness. The role of government is to influence all of these points and is represented by the ring around the diamond.
Innovation has been placed at the centre of the diamond to demonstrate its importance for economic development and the impact it can have on the four key points and the overall competitiveness of a region.
Figure 8.5: Competitive Assessment (Diamond) Framework
Source: NCC (2010)
The main components of the diamond model are listed and explained below.
Factor (input) Conditions: High quality specialised inputs to the economy such as workforce, education, capital and physical infrastructure. Factor inputs are characterised by their dynamic nature and their ability to become continuously upgraded and specialised.
Demand Conditions: Level of local demand for specific products and/or services. Demand influences the process of creating and improving products and services through the presence of sophisticated customers that demand the improvement of products.
Supporting & Related Industry: A critical mass of capable local suppliers and clusters instead of isolated industries to support key industry (supply chain). This element also includes the important role of clusters for economic development.
Firm Strategy & Rivalry: Economic environments which promote vigorous competition among locally based rivals and a local context that encourages sustained investment and upgrade of product and resources.
Role of Innovation: Innovation is influenced mainly by the presence of institutions that are often sought by business and industry for collaboration such as Universities,
Firm Strategy & Rivalry- Vigorous competition between
locally based rivals- A local context that encourages
sustained investment in upgrading
Demand Conditions- A core group of demanding local customers- Unusual local demand in specialised
segments that can be served globally- Customers whose needs anticipate those
elsewhere.
Supporting & Related Industry
- A critical mass of capable local suppliers
- Clusters instead of isolated industries
Factor Conditions-High quality specialised inputs such as:- Workforce- Education- Knowledge- Capital - Physical infrastructure
Role of Government- Encourage companies to raise their
performance- Stimulate early demand for advanced
products- Focus on specialised factor creation; and- Stimulate local rivalry by limiting direct
cooperation of firms
Innovation- Presence of specialised
-Research centres-Talent base-Training and education institutions

Collie SuperTown Combined Report
Final Draft
50
TAFE’s, research institutes and other education and training providers. Partnerships with these institutions facilitate creative flow of knowledge and information which facilitate research and development investment, create new products or services and generally allow a region to generate knowledge. Innovation is critical to the successful development of sustainable industry clusters.
Role of Government: Within the Diamond Model the role of government is to:
o Encourage companies to raise their performance
o Stimulate early demand for advanced products
o Focus on specialised factor creation (i.e. specific infrastructure, workforce programs, investments)
o Stimulate local rivalry by limiting direct cooperation and enforcing antitrust relationships
The results of a high level SWOT analysis have been analysed against the elements of the Diamond Framework. The results are outlined in Figure 8.6.
8.2.1 Competitive Edge
Collie has a number of competitive strengths which will need to be leveraged in order to generate meaningful economic development and employment outcomes. These include:
Significant mining, water and electricity-generation activities with relatively affordable housing in close proximity to Bunbury.
Strong national economy and ageing/recently growing population driving demand for service industries.
Strong demand for labour, which is often sourced outside the LGA, and outdoor leisure tourism could drive new demand and diversify industry.
Potential for tertiary education leveraging mining and utilities activities.
Significant recreational assets (i.e. Lake Kepwari, Wellington Dam, Kostecki Motorplex, Munda Biddi Trail, Bibbulmun Track, Honeymoon Pool) which can be leveraged to build the local tourism industry and provide increased numbers of local employment opportunities as well as economic diversification.
8.2.2 Areas for Improvement
The competitive assessment also highlights some relative weaknesses, where improvement could increase the Collie LGA's overall competitiveness. These include:
Divergence between local investment and jobs driving above-average unemployment, a lack of labour force critical mass and a lack of services diversity.
Need for better access to national and international markets through expanding overseas networks and streamlined transportation links and exploitation of supply chain opportunities.
Questions regarding long term viability of coal energy, particularly in light of political trends.
Visitor accommodation and facilities lack amenity, undermining ability to leverage outdoor/water related sport and recreation attractors.
Lack of internet connectivity capacity and tertiary education and research offerings

Collie SuperTown Combined Report
Final Draft
51
Figure 8.6: Competitive Assessment of Collie LGA
Source: AECgroup
Competitive Element Competitive Edge Regional Issues
Firm Strategy & Rivalry
Factor Conditions
Demand
Supporting & Related Industry
Innovation
• Major centre for water and electricity generation• Significant mining activity associated with coal deposits• Major investments in the form of Worlsey Alumina Refinery• Housing is comparatively inexpensive and affordable• Relative proximity to Bunbury and associated infrastructure (including
export infrastructure)
• Existing labour force lacks critical mass and experiencing skills shortages.
• Unemployment is above average, limiting opportunities for new labour market entrants
• Local investments in mining and resources not necessarily translating into local jobs
• Strong economic climate (Australia)• Utilities industries well placed to service South West growth• Existing opportunities to services growth industries are emerging and
taking place.
• Little competition between firms due to limited supply (small market)• Local business should seek to transition supply to national and global
markets
• Population growth has accelerated in recent years after declines mid decade, underpinning service demand growth
• Aging population and young families increasing health care demands and education (at all levels).
• Increased energy and water demand supports utilities and coal mining• FIFO mining workers living in Collie could drive strong demand for
retail/housing• Outdoor leisure tourism facilities diversifying attractions for visitors
• Currently lacking critical mass of population to attract diverse services, such as childcare and school options.
• Strong competition from major centre of Bunbury in providing regional services to South West.
• Policy shift in electricity generation to gas raised in media• Incomes are low across all occupations• Visitor accommodation and facilities lack amenity
• Leverage mining and utilities for university/tertiary education opportunities
• Proximity to Perth and Bussselton Airports has potential for Collie to accommodate FIFO workers
• Strong existing industry clusters in mining and utilities• Growing outdoor leisure tourism sector
• Below average proportion of professional services industry (property and business, finance, insurance, etc)
• Supply chain opportunities in mining and utiltiies not currently captured
• Very low State and national profiles
• Increased diversification of mining and utilities supply-chain has potential to drive innovation.
• Limited scope of tertiary education and research offering undermines whole-of-economy innovative.
• Internet connectivity lacks capacity and can negatively impact future growth of businesses and population

Collie SuperTown Combined Report
Final Draft
52
8.3 Cluster Mapping
Cluster mapping builds on the location quotient analysis by portraying the regional location quotients against future national industry estimated employment growth over time (from 2011 to 2016). By incorporating industry growth, cluster mapping allows for the identification of growth opportunities in specific industry sectors, where a natural competitive advantage already exists against a backdrop of an expanding sector nationally.
Industry clusters located above the “1” on the vertical axis indicate an existing industry concentration (strength or competitive advantage, as discussed previously) within the region being examined. The national industry employment growth estimate for 2011-12 to 2016-17 (IBIS World, 2011) is plotted along the horizontal axis, with 0% growth over the five years creating a midline. The further to the right of this central horizontal axis, the faster the industry is expected to expand. Similarly, the farther to the left of the zero percent midline, the faster it is expected to shed jobs during this five year period. The size of the cluster in the map demonstrates the size of the local workforce in that industry sector.
Collie LGA's employment is well established in a number of industries which are estimated to grow over the coming five years. In particular, it's employment specialisation in mining, electricity supply and electricity, gas, water and waste services and wood product manufacturing. Key opportunities exist in industries with currently low representation which are estimated to grow on a national level over the coming five years, such industries of opportunity include:
Health care and social assistance
Electricity, gas, water and waste services
Professional, scientific and technical services
Transport, postal and warehousing
Education and training

Collie SuperTown Combined Report
Final Draft
53
Figure 8.7: Collie LGA Cluster Map, 1-Digit ANZSIC1
Note: See Figure 8.8 for further details on boxed area. Source: ABS (2007, 2010a), IBIS World (2011), AECgroup
Retail trade
Manufacturing
Agriculture, forestry and fishing
Mining
Electricity, gas, water and waste
services
Wood Product Manufacturing
Other servicesArts and recreation services
Health care and social assistance
Education and training
Public administration and safety
Electricity Supply
Administrative and
support services
Professional, scientific and technical
servicesRental, hiring and
real estate services
Financial and insurance servicesInformation media and
telecommunicationsTransport, postal and warehousing
Accommodation
and food services
Wholesale trade
Construction
0.0
5.0
10.0
15.0
-5.0% 0.0% 5.0% 10.0% 15.0% 20.0% 25.0%
Clu
ste
r C
on
ce
ntr
ati
on
2
00
6 (
Co
mp
ari
so
n w
ith
Au
str
ali
a)
% Industry Employment Growth 2011-12 to 2016-17
= 300 employees
Well-represented/Low Growth Well-represented/High Growth
Under-represented/High GrowthUnder-represented/Low Growth

Collie SuperTown Combined Report
Final Draft
54
Figure 8.8: Collie LGA Cluster Map, 1-Digit ANZSIC (Insert)
Source: ABS (2007, 2010a), IBIS World (2011), AECgroup
Retail trade
Manufacturing
Agriculture, forestry and fishing
Petroleum and Coal Product
Manufacturing
Wood Product Manufacturing
Other services
Arts and recreation services
Health care and social assistance
Education and training
Public administration and safety
Administrative and
support services
Professional, scientific and technical
services
Transport, postal and warehousing
Accommodation
and food services
Wholesale trade
Construction
0.0
1.0
2.0
3.0
4.0
5.0
-15.0% -10.0% -5.0% 0.0% 5.0% 10.0% 15.0% 20.0%
Clu
ste
r C
on
ce
ntr
ati
on
2
00
6 (
Co
mp
ari
so
n w
ith
Au
str
ali
a)
% Industry Employment Growth 2011-12 to 2016-17
= 300 employees
Well-represented/Low Growth Well-represented/High Growth
Under-represented/High GrowthUnder-represented/Low Growth
= 300 employees

Collie SuperTown Combined Report
Final Draft
55
8.4 Key Findings
As expected, the location quotients revealed the dominance of utilities, manufacturing and mining industry activity in the Collie economy. As a consequence of this dominance, all other industry sectors are underrepresented in the Collie economy, when compared to the national average, raising concerns regarding economic diversity. Particularly poor are white collar professional industries such as Professional, Scientific and Technical Services, Information Median and Telecommunications, and Financial and Insurance Services. This represents a major gap in the Collie economy that reflects a combination of a blue collar workforce, lack of population critical mass and relative proximity to Bunbury.
However, transport and logistics activity is also poor. Normally areas with strong mining and manufacturing industries area also well represented in terms of transport, as such activity is a critical part of the economic supply chain. This appears to the reflect the relatively narrow base of Collie manufacturing and mining, which is concentrated in coal mining and primary metal and metal products (namely Worsley). Diversifying the manufacturing base of Collie, through the capture of local supply chains is therefore critical to generating economic activity and employment for Collie to transform into a SuperTown. The addition of urea production would greatly contribute to an increase in local transport services.
In addition to the industry sector opportunities identified in the Location Quotient assessment, health and education were identified in the Cluster Analysis as opportunities for the future. The growth of Collie’s population over the next 20 years during its evolution into a SuperTown will substantially increase demand for health and education services. This will be reinforced by increasing incomes and changing demographics (combination of population ageing and increased fertility rates).

Collie SuperTown Combined Report
Final Draft
56
9. Industrial Land Assessment
Industrial Land estimates have been developed using the GRP model and based on employment per hectare estimates for the industries of manufacturing, wholesale trade and transport and logistics (see Appendix A). This chapter provides an overview of the findings.
9.1 Existing Supply & Demand
In 2006, a review of existing industrial lands was conducted for the South West region, including Collie. Key assumptions of the study included the continuation of slow population growth in Collie and an assumption of a 30% productivity gain over time (in terms of land use density – i.e. jobs per hectare).
This study found a total of 175.2ha of industrial land in the Collie region. According to the study, almost 45% of this land was located in South West Collie, 33% of land was in West Collie and 22% of land was in North West Collie. Nearly 45% of the occupied industrial lands in Collie were used by the manufacturing industry. Over half the occupied industrial land in Collie was being used for purposes other than traditional industrial activity.
Figure 9.1: Industrial Lands, Collie, 2006
Source: Syme Marmion & Co. (2010)
9.2 Future Demand for Land
Estimates of future industrial land demand have been developed assuming Collie achieves its population target and pursues the industries of opportunity. The land demand results are aligned with the GRP and Employment estimates outlined in Section 6.2. The figure below assumes vacant industrial land is unchanged from 2006 and demonstrates a total net new demand for industrial land of 84ha. It should be noted that supplies of industrial land should always exceed demand in order to offer investors choice and flexibility. It is anticipated that Collie has sufficient industrial land for the future. However, based on the ability to offer a 10-15 year rolling supply of land to meet consumption in any one year, investigations to identify additional land may be needed close to 2031.
0
10
20
30
40
50
60
70
80
90
North West Collie South West Collie West Collie
Ind
ust
rial
Lan
d (
Ha)
Total Occupied Vacant Land

Collie SuperTown Combined Report
Final Draft
57
Figure 9.2: Industrial Land Supply and Demand (ha), Collie LGA, 2011 to 2031
Source: AECgroup
9.3 Key Findings
Expanded economic activity in Collie is expected to result in increased industrial land demand, to 143 ha by 2031. The majority of this demand is expected to be sourced from expanding manufacturing activity. Current industrial land supply is expected to be adequate to support this economic growth in the region, provided it is appropriate for desired uses and in desired locations.
0
20
40
60
80
100
120
140
160
180
200
2011 2016 2021 2026 2031
Industrial Demand for Land Supply

Collie SuperTown Combined Report
Final Draft
58
10. Retail Assessment
This section assesses current and future demand for retail floorspace and reconciles it with current and future supply to identify potential retail gaps and future retail needs.
10.1 Catchment Analysis
In defining the retail catchment for the township of Collie, a number of factors have been taken into consideration, including:
Current and future depth of retail offering within the township of Collie
Location and distance of competing centres
Retail offering available at competing centres
Typical travel flows of local households
Likely expenditure trends of local households
The township of Collie is the population, administrative and services centre for residents of the Shire of Collie (Collie LGA), with local retail facilities serving households within the township as well as households in the surrounding rural areas of the Shire.
The retail catchment for the township of Collie is expected to comprise the entire Collie LGA. The retail catchment is not expected to extend beyond the boundaries of the Shire given the significantly broader variety and depth of retail offering that is available in larger centres, which are easily accessible and are located at a short driving distance.
10.2 Population Growth
Collie LGA had a population of approximately 9,000 people in 1996, which increased by approximately 500 people to reach 9,500 people in 2010 (Figure 5.1).
Collie LGA has therefore experienced moderate population growth over the last 15 years, with an average annual growth rate of 0.4%. However, significantly higher population growth has occurred recently, in particular over the 2007 to 2010 period, where growth of 1.4% per annum was recorded. In comparison, Preston SSD had a population growth of 1.3% per annum over the 1996 to 2010 period, while Western Australia recorded even higher growth (1.9%).

Collie SuperTown Combined Report
Final Draft
59
Figure 10.1: Catchment Population Growth, 1996-2010
Source: ABS (2011i).
10.2.1 Population Projections
In forecasting population projections for the estimated catchment, it has been assumed that its population will double between 2010 and 2031 (Table 5.1). This yields an annual growth rate of 3.4% per annum over the period.
Therefore, it is assumed that the population of Collie LGA will reach approximately 19,000 people by 2031 (Figure 5.2).
Table 6.1: Catchment Population Projections
2011 2016 2021 2026 2031
Population
Collie LGA 9,788 11,544 13,615 16,059 18,940
Average Household Size
Collie LGA 2.48 2.46 2.44 2.42 2.40
Households
Collie LGA 3,947 4,693 5,580 6,636 7,892
Source: ABS (2011i), AECgroup.
-1.5%
-1.0%
-0.5%
0.0%
0.5%
1.0%
1.5%
2.0%
2.5%
3.0%
3.5%
8,500
8,600
8,700
8,800
8,900
9,000
9,100
9,200
9,300
9,400
9,500
1996 1997 1998 1999 2000 2001 2002 2003 2004 2005 2006 2007 2008 2009 2010
% A
nn
ua
l G
row
th
Po
pu
lati
on
Collie LGA Collie LGA Annual Growth (%) Preston SSD Annual Growth (%) WA Annual Growth (%)

Collie SuperTown Combined Report
Final Draft
60
Figure 5.2: Catchment Population Projections
Source: ABS (2011i), AECgroup.
10.3 Retail Supply
The Property Council of Australia classifies retail centres according to the following retail hierarchy (PCA, 2010):
Super Regional Centre: A major shopping centre incorporating two full line department stores, one or more full line discount department stores (DDS), two supermarkets and around 250 or more specialty shops, with a total Gross Lettable Area (GLA) of more than 85,000m2. Super Regional Centres provide a comprehensive coverage of the full range of retail needs, including a number of entertainment and leisure attractions.
Major Regional Centre: A major shopping centre comprising at least one full line department store, one or more full line DDS, one or more supermarkets and around 150 specialty shops, with a total GLA between 50,000-85,000m2. Such centres provide an extensive coverage of the full range of retail needs.
Regional Centre: A shopping centre comprising one full line department store, a full line DDS, one or more supermarkets and around 100 or more specialty shops, with a GLA between 30,000-50,000m2. Such centres provide a broad range of facilities and amenities.
Sub-Regional Centre: A medium-sized centre with at least one full line DDS, a major supermarket and approximately 40 or more specialty shops, with a GLA between 10,000 and 30,000m2.
Neighbourhood Centre: A local centre comprising a supermarket and up to 35 specialty shops, with a GLA typically under 10,000m2. Neighbourhood centres are generally located in residential areas and cater for day-to-day retail needs.
AECgroup undertook a desktop analysis of current retail floorspace within the township of Collie.
Collie Central Shopping Centre is a neighbourhood centre located on Forrest Street in Collie (PCA, 2010). The centre comprises approximately 4,500m2 of floorspace. The centre is anchored by a full-line Woolworths (3,100m2) and comprises 11 specialty shops, including a pharmacy, optical store, a bottle shop, food tenancies and other retailers.
0.0%
1.0%
2.0%
3.0%
4.0%
5.0%
0
2,500
5,000
7,500
10,000
12,500
15,000
17,500
20,000
An
nu
al
Gro
wth
Ra
te (
%)
Po
pu
lati
on
Gro
wth
Collie LGA Average Annual Growth Rate

Collie SuperTown Combined Report
Final Draft
61
Approximately 50 specialty shops were identified within the township (besides those found within the Collie Central Supermarket). These include a broad variety of retailers, such as hardware stores, take away shops, bottle shops, newsagencies and gift stores.
Some of the largest individual retailers within Collie include a Coles supermarket (2,400m2), Target (approximately 1,000m2), Home Timber and Hardware and Collie Home Improvement Centre.
10.3.1.1 Summary Existing Retail Supply
Total catchment retail supply floorspace has been grouped into the following categories:
Groceries and Specialty Food – includes food expenditure at supermarkets, delis, bottle shops, butchers, bakers, convenience stores and greengrocers, and tobacco products.
Food and Liquor Catering – includes expenditure on alcoholic beverages and meals in restaurants, hotels, clubs, fast foods, taverns and bottle shops.
Clothing and Accessories – includes expenditure on clothing, footwear and clothing and footwear services.
Furniture, Housewares and Appliances – includes expenditure on furniture, floor and household coverings, appliances, glassware and tableware.
Recreation and Entertainment Equipment – includes expenditure on recreational equipment such as audio-visual, home computer equipment, books and newspapers, and other equipment such as cameras, toys and camping equipment.
Garden and Hardware Goods – includes expenditure on gardening tools, accessories and products, hand and power tools, hardware products and cleaning products.
Other Goods Personal and Services – includes expenditure on personal care services (such as hair services, manicure services), stationary equipment, animal products, medicines, lottery tickets, and miscellaneous goods.
Retail expenditure can be generally grouped into two broad categories: food expenditure and non-food expenditure. Food expenditure comprises spending within the groceries and specialty food and food and liquor catering categories, while non-food expenditure is included in the remainder categories.
It is estimated that there is approximately 16,000m2 of retail floorspace, with approximately half of it (48%) taken up by food retailers. In particular, groceries and specialty shops comprise 5,300m2 of floorspace (or 33.5% of total retail supply), with the great majority of this taken up by the Coles and Woolworths supermarkets.
A total floorspace of 8,200m2 was identified across non-food retailers, approximately evenly distributed across the categories, with the exception of furniture, houseware and appliances (950m2).
Non-food expenditure is typically spread across specialty shops, department stores, discount department stores and bulky goods retailers. In particular, bulky goods retailers account for a large proportion of spending within the furniture, houseware and appliances, and garden and hardware goods categories.
As such, the approximate quantum of supportable bulky goods floorspace within a specific location can be estimated by analysing overall retail spending within the latter two categories. A total supply of approximately 2,900m2 is identified across these two categories.

Collie SuperTown Combined Report
Final Draft
62
Table 5.2: Summary of Existing Retail Supply, Catchment
Retail Type Lots (no) Floorspace (m2) Floorspace (%)
Groceries & Specialty Food 6 5,342 33.5%
Food and Liquor Catering 15 2,146 13.5%
Clothing & Accessories 6 1,450 9.1%
Furniture, Houseware & Appliances 3 952 6.0%
Recreation & Entertainment Equipment 8 1,796 11.3%
Garden & Hardware Goods 7 1,947 12.2%
Other Goods & Personal Services 14 2,054 12.9%
Vacant 2 238 1.5%
Total 61 15,923 100.0%
Source: AECgroup
10.3.2 Retail Supply Outside the Catchment
A number of larger centres located outside the catchment also service retail needs of local residents.
Many of these larger centres represent a convenient alternative to local shops for catchment residents given the significantly larger variety of goods and stores that can be found. Most of these centres are also conveniently located en route to Perth.
Larger centres outside the catchment appeal, in particular, for non-food shopping, or comparison shopping, for which households’ typically visit a number of stores before committing to a purchase. This is particularly the case for more expensive goods (i.e. white goods and electronics).
With many national brands and chains represented across the larger centres outside the catchment, a large proportion of non-food expenditure escapes from the catchment.
10.3.2.1 Bunbury
Bunbury is located approximately 55km west of Collie and is the closest major retail, business and services centre to local households. Bunbury and its surrounding area comprise two sub-regional centres and three neighbourhood centres.
The Bunbury Forum Shopping Centre, a sub-regional shopping centre of approximately 21,700m2, is located within Bunbury. It is anchored by a Discount Department Stores (DDS): Big W (8,300m2). It also comprises two full-line Supermarkets, Woolworths (3,800m2) and a SUPA IGA (3,000m2), in addition to over 50 specialty stores.
The other sub-regional shopping centre in Bunbury is the Bunbury Centrepoint Shopping Centre, which comprises a floorspace of approximately 16,800m2. It is anchored by Target (7,100m2) and a Coles supermarket (4,100m2) and includes approximately 50 retail specialty shops.
Other smaller retail centres, or neighbourhood centres include6:
Parks Centre – 10,000m2 centre anchored by Kmart (3,900m2) and Coles (2,900m2), with around 20 specialty shops.
Australind Shopping Centre – 6,200m2 centre located in Australind, approximately 8km north of Bunbury and anchored by Coles (3,300m2), with approximately 30 specialty shops.
Bunbury City Plaza Shopping Centre – neighbourhood centre of approximately 4,300m2, anchored by Woolworths (2,000m2) and comprising 18 specialty shops.
Bunbury also has a number of bulky goods retailers, including a Bunnings Warehouse, Harvey Norman and The Good Guys stores amongst others, with a broad range of retail, community and commercial tenancies located across other centres and premises.
6 Source: Property Council of Australia, Australian Shopping Centre Database, 2010

Collie SuperTown Combined Report
Final Draft
63
Bunbury is the closest and most conveniently located major retail centre for catchment residents, providing residents a broad range of retail services, including three major discount department stores (Big W, Kmart and Target). Accordingly, a significant proportion of catchment households’ retail expenditure, and in particular non-food expenditure, escapes to Bunbury. In particular, Bunbury is expected to attract the largest proportion of catchment households’ retail expenditure that escapes outside the catchment.
10.3.2.2 Mandurah
Mandurah is located 120km north of Collie, approximately two thirds of the way to Perth. It represents a major population and services centre, with a regional centre (Centro Mandurah) and various smaller centres.
Centro Mandurah is a 34,000m2 regional centre that is anchored by two DDS stores, Kmart (7,000m2), Big W (6,500m2) and two supermarkets, Woolworths (4,000m2) and Coles (3,200m2). In addition, the centre comprises over 100 retail specialty shops.
This represents the closest regional centre to catchment households and provides households a larger retail offering in a single centre than Bunbury.
There are also other smaller centres within Mandurah and its vicinity, such as Meadow Springs Boulevard (9,700m2), which is anchored by a Target (3,300m2) and Coles (3,000m2); Centro Halls Head (6,000m2); Erskine Central Shopping Centre (5,000m2); Smart Street Mall (3,100m2).
Mandurah in general is also home to an even larger number and variety of retail shops in general, as well as bulky goods stores than Bunbury.
Despite a broader retail offering, the overall catchment households’ retail expenditure that escapes to Mandurah is not expected to be as large as that escaping to Bunbury, given Mandurah’s relatively larger distance from Collie (over 100km). Nonetheless, Mandurah is conveniently located en route to Perth, providing a convenient shopping destination for catchment residents en route to or from Perth.
10.3.2.3 Busselton
Busselton is located approximately 100km south-west of Collie, and includes a few neighbourhood centres.
These include Busselton Central Shopping Centre (7,300m2), anchored by a SUPA IGA (4,500m2); Busselton Shopping Centre (5,000m2), anchored by Woolworths (2,800m2) and Busselton Boulevard (4,800m2), anchored by Coles (3,100m2).
Busselton is not expected to compete strongly with Collie given its relative distance from Collie and its limited retail offering compared to other larger centres, such as Bunbury and Mandurah, which are also strategically located en route to Perth.
10.3.2.4 Perth CBD and Perth Metropolitan Area
The Perth CBD and Perth Metropolitan Area offer a comprehensive range of retail and non-retail goods and services across a variety of centres, including major regional centres.
With numerous specialty shops, unique retail shops, supermarkets, department stores, discount department stores, and entertainment, tourism and leisure attractions, the Perth CBD and Perth Metropolitan area represent a unique retail destination that will continue to attract a proportion of retail expenditure from catchment households.
In summary, Bunbury attracts the largest proportion of catchment households’ retail expenditure outside the catchment, given its broader and more diverse retail offering than Collie, and its relative proximity to Collie.

Collie SuperTown Combined Report
Final Draft
64
10.4 Retail Expenditure
10.4.1 Average Household Retail Expenditure
Average household expenditure for catchment households was derived using AECgroup’s Retail model based on data from the 2006 Census and the ABS 2009-10 Household Expenditure Survey (ABS, 2011e).
Household retail expenditure has been grouped into the following categories:
Groceries and Specialty Food –food expenditure at supermarkets, delis, bottle shops, butchers, bakers, convenience stores and greengrocers, and tobacco products.
Food and Liquor Catering –expenditure on alcoholic beverages and meals in restaurants, hotels, clubs, fast foods, taverns and bottle shops.
Clothing and Accessories –expenditure on clothing, footwear and clothing and footwear services.
Furniture, Housewares and Appliances –expenditure on furniture, floor and household coverings, appliances, glassware and tableware.
Recreation and Entertainment Equipment –expenditure on recreational equipment such as audio-visual, home computer equipment, books and newspapers, and other equipment such as cameras, toys and camping equipment.
Garden and Hardware Goods –expenditure on gardening tools, accessories and products, hand and power tools, hardware products and cleaning products.
Other Goods Personal and Services–expenditure on personal care services (such as hair services, manicure services), stationary equipment, animal products, medicines, lottery tickets, and miscellaneous goods.
Average weekly household retail expenditure of catchment households was compiled for each of the abovementioned categories (Table 5.3), with Regional WA and WA figures also included for comparison. Estimates are expressed in 2011 dollar values.
It is estimated that the average weekly household retail expenditure within the catchment is $523, which is slightly below retail expenditure figures for regional WA ($513), but on par with figures for WA ($523).
Table 5.3: Weekly Household Retail Expenditure 2011, Catchment ($2011)
Expenditure Type Catchment Regional WA WA
Groceries & Specialty Food $191 $188 $182
Food and Liquor Catering $81 $79 $84
Clothing & Accessories $52 $51 $52
Furniture, Houseware & Appliances $62 $62 $57
Recreation & Entertainment Equipment $52 $50 $62
Garden & Hardware Goods $22 $22 $23
Other Goods & Personal Services $61 $61 $62
Total Weekly Expenditure $523 $513 $523
Source: AECgroup Retail Model
10.4.2 Forecast Household Retail Expenditure Potential
Multiplying the average household expenditure by the number of households within the catchment at 2011 yields retail expenditure potential at 2011 in the defined retail categories.
In estimating future retail expenditure potential, it has been conservatively assumed that real household retail expenditure will increase by 1.0% per annum between 2011 and 2031.
It is estimated that at June 2011 catchment households generated approximately $107.3 million in retail sales potential. Approximately half of this ($56.0 million) is estimated to be food expenditure.

Collie SuperTown Combined Report
Final Draft
65
Total catchment retail expenditure potential is forecast to increase to $167.6 million by 2021 (2011 dollar values) and to $261.8 million by 2031 (Table 5.4). Retail expenditure potential is therefore expected to more than double within the catchment.
Table 5.4: Total Retail Expenditure Potential, Catchment Households (2011 $ values)
Category 2011 2016 2021 2026 2031
Increase
2011-2031
Groceries & Specialty Food $39.3 $49.1 $61.4 $76.7 $95.9 $56.6
Food and Liquor Catering $16.7 $20.9 $26.1 $32.6 $40.7 $24.0
Clothing & Accessories $10.6 $13.3 $16.6 $20.7 $25.9 $15.3
Furniture, Houseware & Appliances $12.8 $16.0 $20.0 $25.0 $31.3 $18.5
Recreation & Entertainment Equipment $10.7 $13.4 $16.7 $20.9 $26.1 $15.4
Garden & Hardware Goods $4.6 $5.8 $7.2 $9.0 $11.2 $6.6
Other Goods & Personal Services $12.6 $15.7 $19.6 $24.5 $30.7 $18.1
Total $107.3 $134.1 $167.6 $209.5 $261.8 $154.5
Source: AECgroup Retail Model.
10.4.3 Market Share Analysis
To calculate retail expenditure that is spent within the catchment alone, the proportion of total retail expenditure potential that is retained within the catchment is estimated for each category - by assigning relevant market shares.
Market shares have been estimated based on a number of factors, such as: the existing supply and range of retail shops and services within the catchment, the location and function of competing centres, their distance from catchment households, and their retail offering.
In addition, likely household shopping patterns have been factored in, such as the propensity for catchment residents to travel to larger centres outside the catchment for larger purchases, especially non-food shopping (Table 5.5).
Table 5.5: Estimated Catchment Market Shares by Category
Category % Market Share
Groceries & Specialty Food 90%
Food and Liquor Catering 90%
Clothing & Accessories 25%
Furniture, Houseware & Appliances 25%
Recreation & Entertainment Equipment 25%
Garden & Hardware Goods 40%
Other Goods & Personal Services 75%
Total 65%
Source: AECgroup.
Market share of overall retail expenditure potential that is retained within the catchment is estimated at approximately 65%. Market shares however vary considerably between retail categories, and in particular between food and non-food categories.
Nearly all (90%) of catchment households’ food expenditure potential within the category of groceries and specialty food is expected to be retained within the catchment, given the presence of a Coles and Woolworths supermarkets in Collie, which are expected to meet the everyday food and grocery needs of catchment households. However, centres outside the catchment, are still expected to capture a small proportion of catchment households’ expenditure potential in this category, as local residents at times combine food shopping with non-food shopping when travelling to larger centres such as Bunbury.
Non-food expenditure market share is expected to be much lower – approximately 38%. Catchment residents will travel to centres outside the catchment for most non-food retail expenditure, given the limited provision within the catchment, and in particular to Bunbury, which offers residents a much larger variety and depth of goods and services at a relatively close driving distance.

Collie SuperTown Combined Report
Final Draft
66
Therefore, the majority of catchment households’ expenditure within clothing and accessories, furniture, housewares and appliances and recreation and entertainment equipment is expected to escape to centres outside the catchment, and in particular to Bunbury.
Regardless of the current and future non-food retail offering within the catchment, local households will always have a propensity to travel outside the catchment to make larger non-food purchases (i.e. white goods), as it provides the opportunity to easily compare prices from various retailers.
10.4.3.1 Rogue Expenditure
In addition to locally generated expenditure, retailers also often attract ‘rogue’ expenditure from non-residents, including visitors, travellers and non-resident workers. Rogue expenditure generally comprises 10-15% of retail expenditure within a designated area.
Collie is expected to draw some retail expenditure from residents and visitors outside the LGA, with rogue expenditure assumed to account for 15.0% of total catchment expenditure within most categories. However, it has been assumed to be slightly higher - or 20.0% for groceries and specialty food, given the presence of two full-line supermarkets to Collie, and their ability to draw customers from further afield, especially from the east.
10.4.4 Estimated Retail Expenditure within the Catchment
Multiplying the estimated market shares with the available retail expenditure potential of catchment households, and adding rouge expenditure, yields the estimated retail expenditure that is captured within the catchment (Table 5.6).
Table 5.6: Estimated Retail Expenditure Captured within the Catchment (2011 $ values)
Category 2011 2016 2021 2026 2031 Increase
2011-2031
Groceries & Specialty Food $35.4 $44.2 $55.2 $69.0 $86.3 $50.9
Food and Liquor Catering $15.0 $18.8 $23.5 $29.3 $36.6 $21.6
Clothing & Accessories $2.7 $3.3 $4.1 $5.2 $6.5 $3.8
Furniture, Houseware & Appliances $3.2 $4.0 $5.0 $6.3 $7.8 $4.6
Recreation & Entertainment Equipment $2.7 $3.3 $4.2 $5.2 $6.5 $3.9
Garden & Hardware Goods $1.8 $2.3 $2.9 $3.6 $4.5 $2.7
Other Goods & Personal Services $9.4 $11.8 $14.7 $18.4 $23.0 $13.6
Catchment Expenditure $70.2 $87.7 $109.6 $137.0 $171.2 $101.1
Rogue Expenditure $12.3 $15.4 $19.2 $24.0 $30.0 $17.7
Total Expenditure $82.5 $103.1 $128.8 $161.0 $201.2 $118.8
Source: AECgroup Retail Model.
It is estimated that total retail expenditure retained within the catchment is $82.5 million (2011 dollar values) in 2011, with approximately $12.3 million of this expenditure expected to come from residents, visitors and workers residing outside the defined catchment. The great majority of such rogue expenditure is expected to be retained within the groceries and specialty food category, as a result of the two supermarkets in Collie.
Total retail expenditure retained within the catchment is expected to increase to $128.8 million by 2021 (2011 dollar values) and $201.2 million by 2031.
10.5 Retail Demand
Demand for retail floorspace within the catchment has been calculated by applying benchmark turnover rates (Table 5.7) to expenditure captured within the catchment for each retail category (Table 5.6).

Collie SuperTown Combined Report
Final Draft
67
Table 5.7: Benchmark Turnover Rates - $/m2 (2011 $ values)
Category $/m2
Groceries & Specialty Food $9,000
Food and Liquor Catering $6,500
Clothing & Accessories $5,000
Furniture, Houseware & Appliances $4,500
Recreation & Entertainment Equipment $4,500
Garden & Hardware Goods $4,000
Other Goods & Personal Services $6,000
Source: AECgroup.
There is an estimated demand for approximately 11,800m2 of retail floorspace within the catchment. Over half of the supportable floorspace (7,300 m2) is within food categories and in particular groceries and specialty food (approximately 4,700m2). Generally, most of the floorspace in this category is taken up by supermarkets, such as in Collie. There is also an estimated demand for approximately 4,500m2 of non-food retail floorspace.
Given the significant forecast population growth, demand for retail floorspace is expected to more than double, reaching approximately 18,500m2 by 2021 and 28,800m2 by 2031. The largest growth in floorspace requirements is expected to be within the groceries and specialty food category.
Assuming that the majority of bulky goods floorspace is contained within the categories of furniture, houseware and appliances and garden and hardware goods, it is estimated that there is demand for approximately 1,400m2 of bulky goods floorspace in 2011. This is expected to increase to approximately 3,300m2 by 2031.
However, retail demand modelling has been based on household expenditure, and as such, does not include business to business transactions, which can make up a relatively large proportion of trade in the Garden and Hardware category. As such, bulky goods floorspace requirements are expected to be somewhat underestimated.
Bulky goods retailers typically have different storage, locational, parking and accessibility requirements compared to traditional retailers. For example, they often demand large storage areas, premises with sufficient load access, adequate car parking. They also differ from traditional retailers as they are often located in clusters, either within homemaker centres or in out-of-centre developments, allowing customers the opportunity to easily compare prices and products in one location. As such, when planning for the future provision of bulky goods within the catchment, it is important to take into account such requirements.
Table 5.8: Demand for Retail Floorspace (m2), Catchment
Category 2011 2016 2021 2026 2031 Increase
2011-2031
Groceries & Specialty Food 4,714 5,891 7,362 9,202 11,502 7,022
Food and Liquor Catering 2,658 3,321 4,150 5,188 6,484 3,959
Clothing & Accessories 611 764 954 1,193 1,491 910
Furniture, Houseware & Appliances 819 1,024 1,279 1,599 1,999 1,220
Recreation & Entertainment Equipment 684 854 1,068 1,335 1,668 1,018
Garden & Hardware Goods 530 663 828 1,035 1,294 790
Other Goods & Personal Services 1,806 2,257 2,821 3,526 4,407 2,690
Total 11,822 14,774 18,463 23,077 28,844 17,610
Source: AECgroup.
10.6 Current Demand Vs Supply
It appears that the catchment is well served by existing retailers, with approximately 4,100m2 of retail floorspace supply above the estimated retail floorspace requirements.
However, this this figure should be read with caution as it does not necessarily imply a significant oversupply of retail floorspace within the catchment. In particular, such surplus may be overstated for a number of reasons, such as:

Collie SuperTown Combined Report
Final Draft
68
A number of stores are likely to operate at lower than expected productivity levels. There are a number of reasons for this: some shops may not open every day, others may not open throughout the whole year; rents can also be relatively inexpensive, allowing tenants to have below average productivity levels.
A few retailers are located in non-traditional retail premises i.e. industrial areas or sheds, which would not be suitable for other retail tenancies. Such floorspace therefore should not be technically included in the retail inventory, hence lowering potential retail floorspace surplus within the catchment once these tenancies are excluded.
The retail demand model has been based on household expenditure, and as such, does not include business to business transactions, which can make up a relatively large proportion of trade in certain retail categories. This is particularly the case for the Garden and Hardware category, where household trade only comprises a relatively small component of their overall trade. As such, overall retail floorspace demand in this category in particular, and to a lesser extent in other non-food categories, are expected to be somewhat understated.
Table 5.9: Current Retail Floorspace (m2) Variance, Catchment
Category 2011
Groceries & Specialty Food 627
Food and Liquor Catering -512
Clothing & Accessories 839
Furniture, Houseware & Appliances 133
Recreation & Entertainment Equipment 1,112
Garden & Hardware Goods 1,416
Other Goods & Personal Services -1,568
Total 4,101
Source: AECgroup.
However, figures overall indicate that the market is currently well supplied and has the capacity to absorb additional retail floorspace requirements, which are to be generated by the population growth that is forecast within the catchment.
10.7 Future Demand Vs Supply
Future retail floorspace demand (Section 5.5) has been reconciled with retail supply to provide an indication of future retail floorspace requirements within the catchment.
It is forecast that there will be an overall shortage of retail floorspace by 2021. Given significant population growth that is forecast for the catchment, and hence growth in floorspace demand, such shortage will become much more significant by 2031, with an estimated retail floorspace deficit of approximately 12,900m2.
Approximately half of the floorspace deficit by 2031 is expected to occur in the groceries and specialty food category (6,200m2), followed by food and liquor catering (4,400m2).
Demand (and therefore deficit) of floorspace in non-food categories, and in particular in garden and hardware goods, is expected to be understated given that the business to business transactions are not included in the demand model. As such, additional floorspace requirements may have to be taken into account for non-food categories, above those outlined in Table 5.10.
The analysis did not take into account existing vacant floorspace. However, given the limited quantum of vacant space (250m2), it is unlikely that it will have any impact on future retail floorspace requirements.
Table 5.10: Future Retail Floorspace (m2) Variance, Catchment
Category 2011 2016 2021 2026 2031
Groceries & Specialty Food 627 -550 -2,021 -3,861 -6,161
Food and Liquor Catering -512 -1,175 -2,004 -3,042 -4,338
Clothing & Accessories 839 686 496 257 -41
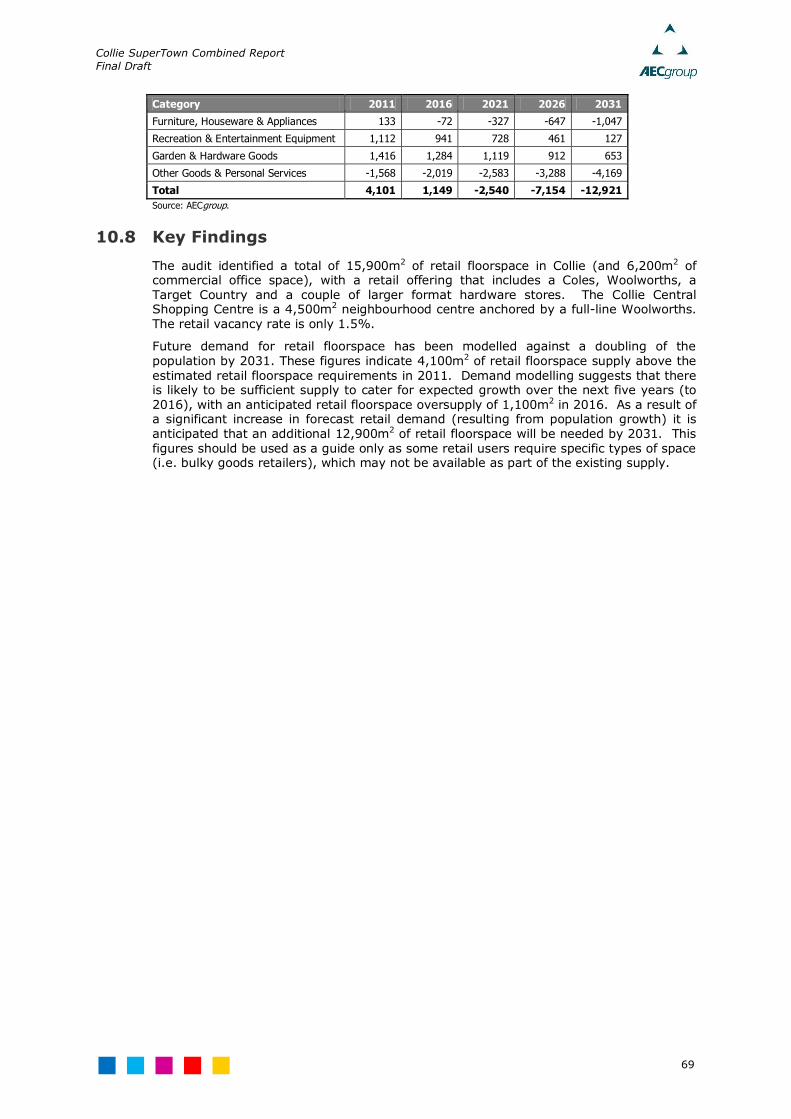
Collie SuperTown Combined Report
Final Draft
69
Category 2011 2016 2021 2026 2031
Furniture, Houseware & Appliances 133 -72 -327 -647 -1,047
Recreation & Entertainment Equipment 1,112 941 728 461 127
Garden & Hardware Goods 1,416 1,284 1,119 912 653
Other Goods & Personal Services -1,568 -2,019 -2,583 -3,288 -4,169
Total 4,101 1,149 -2,540 -7,154 -12,921
Source: AECgroup.
10.8 Key Findings
The audit identified a total of 15,900m2 of retail floorspace in Collie (and 6,200m2 of commercial office space), with a retail offering that includes a Coles, Woolworths, a Target Country and a couple of larger format hardware stores. The Collie Central Shopping Centre is a 4,500m2 neighbourhood centre anchored by a full-line Woolworths. The retail vacancy rate is only 1.5%.
Future demand for retail floorspace has been modelled against a doubling of the population by 2031. These figures indicate 4,100m2 of retail floorspace supply above the estimated retail floorspace requirements in 2011. Demand modelling suggests that there is likely to be sufficient supply to cater for expected growth over the next five years (to 2016), with an anticipated retail floorspace oversupply of 1,100m2 in 2016. As a result of a significant increase in forecast retail demand (resulting from population growth) it is anticipated that an additional 12,900m2 of retail floorspace will be needed by 2031. This figures should be used as a guide only as some retail users require specific types of space (i.e. bulky goods retailers), which may not be available as part of the existing supply.

Collie SuperTown Combined Report
Final Draft
70
11. Commercial & Government Offices
This chapter assesses the market for commercial and Government office floorspace in Collie over the next 20 years. It uses a labour force-based methodology to estimate the amount office floorspace required to accommodate current and future office workers.
11.1 Methodology
In this assessment, future commercial and government office floorspace demand over the next 20 years is forecasted. The methodology utilised for projecting commercial floorspace demand is comprised of the following steps.
Figure 11.1: Commercial Office Demand Methodology
Source: AECgroup
Note that this methodology applies only to commercial office floorspace and does not take into consideration office demand for Government tenants.
•Estimates of population based on various sources.
Population
•Estimate of Local Working Age Population (15+) based on population estimates and assumed ageing profile
Working Age Population
•Application of a labour force participation rate to working age population based on historical labour force participation rates for the area
Labour Force Size
•Application of assumed share of labour force in core office-based occupation based on previous census data
Office-Based Workers
•Adjustment of local office labour force to office jobs through application of assumed office-specific employment self-sufficiency ratio
Office-Based Jobs
•Conversion of office empoyment to floorspace based on assumed workspace ratio (sqm per worker) of 20sqm
Core Office Floorspace

Collie SuperTown Combined Report
Final Draft
71
The methodology for projecting government floorspace demand is comprised of the following steps.
Figure 11.2: Government Office Demand Methodology
Source: AECgroup
Two separate methodologies have been used to gauge commercial and Government office floorspace requirements as the factors driving demand for each are assumed to be quite different. The major variation lies behind the lack of application of a labour force participation rate to calculate demand for Government office space. This is based on the idea that the demand for Government office space, and hence demand for Government employment grows more directly in-line with population. This is assumed to be the case due to the need for Government employment to act as a service to the population.
11.2 Current Demand
11.2.1 Commercial Office Space Demand
11.2.1.1 Office-Based Labour Force
Collie’s residential population is currently 9,470. Approximately 80% of the Collie population currently is aged 15 years and over (ABS 2011), representing the total working age population in the township. This equates to 7,600 people in 2011. Of this working age population, approximately 4,846 people are estimated to be in the labour force, which is based on an assumed participation rate of 64% (ignoring public sector employees) (ABS 2011).
In 2006, 4.6% of the labour force in Collie worked in an office (ABS 2006). Applying this proportion to the current labour force number shows that there are currently 225 office workers in Collies resident population. Comparing this value to the total population number shows that currently 2.4% of Collies population is in core office industries and occupations. This is illustrated in the figure below.
•Estimates of population based on various sources.
Population
•Estimate the number of government sector employees based on previous census data
Government Employment
•Application of assumed share of government workers in core office-based occupation based on previous census data
Office-Based Workers
•Sum of Core Office Floorspace
Total Office Floorspace
•Conversion of office empoyment to floorspace based on assumed workspace ratio (sqm per worker) of 15sqm
Core Office Floorspace

Collie SuperTown Combined Report
Final Draft
72
Figure 11.3: Population Distribution
Source: AECgroup
11.2.1.2 Workspace Ratios
Not all of these office workers live in Collie. Worker mobility means that many of these workers travel to Collie for work. For this assessment, an employment self-sufficiency rate (number of people that work in a location divided by the number of workers that live there) for office workers of 91% has been assumed. This means that the total office labour force that needs to be accommodated in offices within the precinct is equal to 91% of the resident office labour force7. This currently represents 205 core office jobs.
11.2.1.3 Current Floorspace Demand
Assuming an average workspace ratio for commercial office workers in a regional centre of 20m2, core office demand for floorspace in Collie is currently 4,096m2. This accounts for all office workers in occupations and industries most commonly associated with office accommodation (i.e. core office workers) which work outside of the public sector realm.
11.2.1.4 Commercial Space Audit
The commercial survey undertaken by AECgroup indicates that there are 20 tenancies occupied by commercial offices in Collie, totalling approximately 6,200m2. No survey of government offices was undertaken in Collie, however, the Shire is likely to be the largest government tenant. Some of the largest office tenancies include a medical centre (450m2) and banks (up to 500m2).
Table 6.1: Office Floorspace Supply, Collie
Floorspace Supply (GFA m2) 2011
Commercial Office 6,184
Government Office N/A
Total Office 6,184
Note: NA – no specific audit of government office space was undertaken, however, some government uses did appear in the commercial space. Source: AECgroup
7 Collie may have both an inflow and outflow of office workers, but on a net basis, 91% of their resident office
labour force works within the precinct – the remainder work elsewhere.
Not in Labour Force, 4624, 48.8%
Non-Office Labour Force, 4621, 48.8%
Office Labour Force, 225, 2.4%

Collie SuperTown Combined Report
Final Draft
73
Table 6.2: Office Floorspace Demand, Collie
Floorspace Demand (GFA m2) 2011 2016 2021 2026 2031
Commercial Office 4,515 6,278 8,625 11,912 16,311
Government Office 1,718 2,026 2,389 2,818 3,324
Total Office 6,233 8,304 11,014 14,730 19,634
Source: AECgroup
Reconciling current commercial office demand with current supply indicates that supply exceeds demand. Therefore, the market can absorb some of the future growth in demand for commercial office space that is forecast by 2031.
It is forecast that there is a requirement for an additional 10,100m2 of commercial office space by 2031 in Collie.
Table 6.3: Future Office Floorspace Variance (m2), Collie
Floorspace Supply (GFA m2) 2011 2016 2021 2026 2031
Commercial Office 1,669 -94 -2,441 -5,728 -10,127
Source: AECgroup
11.2.2 Government Office Space Demand
11.2.2.1 Public Admin & Safety Workers
As mentioned, Collie’s residential population is currently 9,470. In 2006, there were approximately 37.7 public administration and safety workers per 1,000 residents in Collie (ABS 2006). This represents the servicing ratio of public administration and safety workers in Collie. Assuming this ratio remains relevant to the current year, there are currently 357 public administration and safety workers within Collie.
11.2.2.2 Office Share of Public Administration & Safety Workers
For this assessment an office share of 60% has been assumed for public administration and safety workers (ABS 2006). That is, 60% of the total amount of public administration and safety employees in Collie are assumed to work in an office. This translates to 213 core office jobs for public administration and safety workers in the current year within Collie.
11.2.2.3 Current Floorspace Demand
Assuming an average workspace ratio for office based public administration and safety workers of 15m2, core office public sector demand for floorspace in Collie is currently 3,190m2. This accounts for all office workers within the public administration and safety sector.
11.3 Projected Future Demand
11.3.1 Collie Labour Force Growth
According to the Commonwealth Department of Health and Ageing, Collie’s resident population is expected to decrease from the current level of 9,470 to 8,898 by 2031. However, for the purpose of forecasting labour force growth in Collie, AECgroup has utilised the projected aspirational population growth target which is equivalent to a doubling of the population. This translates to a resident population of 18,940 in 2031.

Collie SuperTown Combined Report
Final Draft
74
Figure 11.4: Resident Population, by Labour Force Participation and Office/Non-Office Labour Force, Collie, 2011 to 2031
Source: AECgroup
As illustrated in the figure above, the local labour force in Collie will growth to 10,375 workers by 2031. Assuming the current share of commercial office-based workers remains constant over this period, the number of core commercial office workers is expected to also increase to 895 over the next two decades.
11.3.2 Future Commercial Floorspace Demand
Applying the assumed employment self-sufficiency rate for office workers identified in section 11.2.1.2, the total number of core commercial office jobs in Collie in 2031 is projected to be 816. Assuming a 20m2 per workers workspace ratio, this equates to demand for 16,311m2 of commercial office floorspace from core office workers. This total is outlined in the figure below.
0
2000
4000
6000
8000
10000
12000
14000
16000
18000
20000
2010 2011 2012 2013 2014 2015 2016 2017 2018 2019 2020 2021 2022 2023 2024 2025 2026 2027 2028 2029 2030 2031
Re
sid
en
tia
l P
op
ula
tio
n
Not in Labour Force Non-Office Labour Force Office Labour Force

Collie SuperTown Combined Report
Final Draft
75
Figure 11.5: Total Commercial Office Floorspace Demand, Collie, 2011 to 2031
Source: AECgroup
11.3.3 Future Government Floorspace Demand
Applying the assumed public administration and safety worker to resident ratio shows that the amount of office based government employees in Collie is expected to reach 222 in 2031. Assuming a 15m2 per workers workspace ratio, this equates to demand for 3,324m2 of government office floorspace. This total is outlined in the figure below.
Figure 11.6: Total Government Office Floorspace Demand, Collie, 2011 to 2031
Source: AECgroup
0
2000
4000
6000
8000
10000
12000
14000
16000
18000
2010 2011 2012 2013 2014 2015 2016 2017 2018 2019 2020 2021 2022 2023 2024 2025 2026 2027 2028 2029 2030 2031
To
tal
Co
mm
eri
ca
l Flo
ors
pa
ce
De
ma
nd
(sq
m)
0
500
1000
1500
2000
2500
3000
3500
2010 2011 2012 2013 2014 2015 2016 2017 2018 2019 2020 2021 2022 2023 2024 2025 2026 2027 2028 2029 2030 2031
To
tal
Co
mm
eri
ca
l Flo
ors
pa
ce
De
ma
nd
(sq
m)

Collie SuperTown Combined Report
Final Draft
76
11.4 Key Findings
Over the next 20 years, Collie is expected to experience a four-fold increase in commercial office floorspace demand, with the growth in professional services in the SuperTown. In addition, Government office floorspace is expected to more than double over the same period. In total office floorspace demand is projected to grow by more than 13,500m2, a significant increase that will provide the necessary business accommodation to help diversify the Collie economy.

Collie SuperTown Combined Report
Final Draft
77
12. Future Opportunities & Gaps
This chapter outlines the opportunities for growth in Collie, to support its transformation into a SuperTown over the next two decades as well as the associated impediments that must be managed.
12.1 Economic Opportunities
Findings from each stage of the opportunities assessment have informed the identification of economic opportunities for Collie LGA. These opportunities enable the LGA to grow and support existing industries whilst also diversifying into new industries. These opportunities are outlined in Table 12.1. It should be noted that some of the town’s foundation industries are highlighted as an opportunity, given their significance to the economy and future potential for expansion (i.e. coal mining). The on-going success of these foundation industries will drive many of the opportunities so they have been included here for completeness.
The key areas of economic opportunity for the Collie LGA centre around:
expanding existing industries of strength (mining, heavy manufacturing and utilities).
providing supply chain depth for key industries (professional services and light industry, transport and logistics).
expanding new/emergent industries (tourism).
expanding population to drive increase in certain industry sectors (retail, education, health and community).

Collie SuperTown Combined Report
Final Draft
78
Table 12.1: Economic Opportunities for Collie
Opportunity/Growth Sector
High Value-Adding Activity Point of Differentiation Why Collie?
Mining Coal Mining (projected increase in local production to meet local and potentially global
energy demand growth)
Economically demonstrated resources
Existing established presence Proximity to local power
generation activity/
infrastructure
Geographic location: Geographically located close to major economic demonstrated resources.
Local and International Markets: Proximity to local electricity generation as well as Port of Bunbury for potential exports
Existing workforce: strong blue collar skill set available in local
market Historical Links: established and existing nature of mining activity
increases acceptance of future expansion.
Heavy Manufacturing
Alumina Manufacturing (associated with
Worsley Refinery)
Proximity to local power
generation activity/ infrastructure
Critical mass of operations
support efficiencies and competitiveness
Geographic location: Geographically located close to major economic
demonstrated resources. Local and International Markets: Proximity to local electricity
generation as well as Port of Bunbury for potential exports
Existing workforce: strong blue collar skill set available in local market
Historical Links: established and existing nature of mining activity
increases acceptance of future expansion.
Utilities Electricity Generation (primary electricity generation hub for South West supporting residential population growth and industrial expansion)
Water management (dewatering)
Established presence Central location in the South
West
Strong access to local resources
Geographic location: Collie is located in close proximity to major electricity generation in the South West.
Existing workforce: strong blue collar skill set available in local
market Strong Relationship with Heavy Manufacturing: electricity
generation capacity presents opportunities for heavy industrial cluster. Existing and Future Demand for Water: future demand for water
will increase as the population and economy expand.
Light Industry,
Transport and Logistics
Light Industry (fabrication, component
manufacturing, materials manufacturing, assembly and servicing manufacturing sector)
Logistics operations (warehousing and
distribution operations and servicing manufacturing sector with both import and export to and from the region)
Established major anchor
industries (mining and heavy metal manufacturing)
Geographic location: Centrally located in close proximity to mining
and manufacturing activity, with strong connectivity to major regional transport and international transport routes and infrastructure.
Population and business demand: Future population and economic growth in the region (and further abroad) is likely to support demand for transport and logistics services in the future.
Existing workforce: Transport and storage is currently an existing and growing employer in the region, suggesting availability of relevant skills in Collie LGA.
Small existing workforce: Collie has a small existing workforce in
these industries which can be further expanded over time, with a focus on reducing drive-in/drive out patterns and increasing residential settlement in town.

Collie SuperTown Combined Report
Final Draft
79
Opportunity/Growth
Sector
High Value-Adding Activity Point of Differentiation Why Collie?
Professional Services
Population-related professional services
(accounting, banking, legal, property, centralised office functions)
Business-related professional services (project management, design, architecture, consultancy services)
Position as a future services
centre for manufacturing supply chain support services as well as the local region and strong population growth.
High degree of local imports: There is currently a high degree of
these services being imported to the region. Strong economic growth: Regional and local economic growth is
anticipated to support the demand for new business services in the region.
Small existing workforce: Collie has a small existing workforce in these industries which can be further expanded over time, with a focus on reducing drive-in/drive out patterns and increasing residential
settlement in town.
Health &
Community
Health services (public and private hospitals, general practitioners (GPs))
Aged care services (retirement villages, respite and hospice care, in-home care services)
Allied health services (physiotherapy, general practitioners, diagnostic facilities, occupational therapy, dentists, mental health care)
Existing and future population
growth. Existing facilities.
Ageing demographic: The ageing population trend will result in
increased demand for health services, particularly aged care. In addition, the aging of existing healthcare practitioners is expected to leave a gap in the provision of services.
Population retention: provision of aged care in Collie may assist in retaining population and reducing import purchases.
Increasing quality of service: Quality of health care is increasing and
with population growth, there will be increasing demand for healthcare services.
Critical mass: As the population of Collie LGA increases, demand for
additional healthcare services will increase, resulting in a shift of demand away from Bunbury to the town.
Education High quality secondary schooling (including boarding school, residential high school)
Industry-oriented tertiary education (including
further investment into the existing facilities)
Existing and future population growth.
Growing population base: The Collie LGA population is expected to increase over time, supporting demand for local education facilities.
Growing demand for skilled workers: As the structure of the
economy changes, demand for new skills will be required, supporting demand for higher education in the region.
Collocation with Major Industries: opportunities to support existing
major industries.
Retail Food retailing (supermarkets, greengrocers, farmers markets)
Other Retailing (clothes, bulky goods, etc)
Existing and future population growth.
Large secondary regional
catchment.
Growing population base: The Collie LGA population is expected to increase over time, supporting demand for all retailed goods.
Consumerism: Consumerism remains strong in Australia, supporting
the long-term trends in retail sales growth. Extended Trading Hours: recent approval of extended trading hours
in Collie will support its role as a major retail centre in the Avon.
Employment generation: can present employment diversity and opportunities for Collie residents.

Collie SuperTown Combined Report
Final Draft
80
Opportunity/Growth
Sector
High Value-Adding Activity Point of Differentiation Why Collie?
Tourism Outdoor Leisure and Water-Activities (such as
water skiing, camping etc) Cafes and Restaurants (visitor expenditure
supplementing local expenditure)
Existence of major water-based
and outdoor recreation attractions including Lake Kepwari, Wellington Dam, Kostecki Motorplex, Munda Biddi
Trail, Honeymoon Point
Geographical Location: Position of Collie in South West close to
Bunbury provides a strong catchment for outdoor-leisure visitors. Outdoor Culture: Collie residents have a strong outdoor leisure and
recreation culture. Increases in Natural and Urban Amenity: increases in amenity
associated with population growth will also enhance the attractiveness of the town to visitors.
Employment generation: can present employment diversity and
opportunities for Collie residents.
Source: AECgroup

Collie SuperTown Combined Report
Final Draft
81
12.2 Potential Impediments
As identified in the analysis contained in this report, there are numerous potential impediments that could prevent Collie from achieving the aspirations of the SuperTown initiative. Effectively managing and overcoming these impediments or economic gaps will assist Collie in leveraging the identified economic opportunities.
The identified impediments or gaps include:
An underrepresentation of skilled labour in the region, presenting capacity constraints to local business and industry growth and resulting in the inability to leverage the opportunity to become a major service centre.
Lack of translation of economic activity into local employment, with a combination of strong Drive-In/Drive-Out travel patterns to Collie from the surrounding region and Bunbury.
Low population growth and an ageing population demographic.
Lack of professional service delivery in Collie, due to the relative small size of the town and its local labour force as well as strong competition from Bunbury.
Poor residential amenity, in terms of public realm and retail/service offering.
Lack of broadband internet connections.
Lack of local education and health services as Collie is located within Bunbury’s regional catchment.
Gaps in the supply chain with regards to industrial and professional services.

Collie SuperTown Combined Report
Final Draft
82
13. Key Economic Drivers & Important Trends
Key economic trends are expected to have an impact on the economic development of Collie. This chapter outlines these key trends and their potential implications for the economic development of Collie. Key trends analysed include:
Increased Demand for Coal and Electricity
Coal and Alumina Sector Expansion
Climate Change and Carbon
Internet
13.1 Increased Demand for Coal & Electricity
The mining and electricity industries are highly important to the Collie economy, with approximately 54.1% of industry contribution to Gross Value Add (GVA) and 22.4% of employment coming from the two industries. These industries are also important to the South West region.
Over the last 20 years, energy consumption in Western Australia has doubled (Office of Energy, 2011). The Department of Health and Ageing estimates that the Western Australian State’s population will reach approximately 3,310,200 by 2031, an annual growth rate of 1.8% per annum. The state’s population growth, and growing household incomes, in addition to Collie Town’s proposed population growth over the next 20 years, is expected to increase demand for electricity generation and subsequently coal mining – two of Collie’s primary industries. In addition to population growth, economic growth will also fuel demand for electricity. Currently Western Australia’s entire coal supplies come from Collie, a significant portion of which is used for electricity generation. Fossil fuels are expected to continue to be the core source of energy over the coming 20 years. However, collie has an opportunity to also pay a key role in the delivery of renewable energy to the Western Australian energy market over the coming 20 years, a key focus of the State Government (Office of Energy, 2011). However, this portion of the energy market is expected to grow to 20% by 2020 (Office of Energy, 2011)
Population growth across Western Australia is expected to drive demand for electricity generation and coal production, two of Collie’s foundation industries.
13.2 Coal & Alumina Sector Expansion
The coal sector in Collie is currently under expansion with several projects either newly completed or underway. Perdaman Chemicals and Fertilisers and Premier Coal will be major tenants of the new Shotts Industrial Estate which is currently under development 7km east of Collie. Perdaman is planning to develop a $3.8 billion urea manufacturing plant on a 125ha site to convert sub-bituminous coal to urea fertiliser. The development has the potential to create 1,500 jobs during the three year construction phase and 200 permanent jobs once the plant is fully operational. Anecdotal evidence suggests that Premier Coal expect to employ an additional 100 people over 2 years in their business as usual model. Lanco (Griffin Coal) has plans to ramp up coal production from the existing 4 Mtpa8 to 17-20 Mtpa by 2015, which could include considerable investment and future employment.
8 Mtpa – million tonnes per annum

Collie SuperTown Combined Report
Final Draft
83
Table 13.1: Collie Major Developments
Project Description
Collie - Worsley Alumina Refinery
Expansion (BHP Billiton)
The Collie Worsley Alumina Refinery produces 3.5 million tonnes of refined alumina each year. In 2012, the facility will complete a $3 billion expansion, increasing production to 4.7
million tonnes per annum. $500 million will also be spent on a new multi fuel cogeneration power plant at the refinery.
Capital Value: $3.3 billion (a) Employment - Construction: 4,500 Employment - Operational: 200
Collie - Coal to Urea Plant
(Perdaman Chemicals & Fertilisers)
Perdaman Chemical and Fertilisers Pty Ltd has recently committed $3.5 billion to the development of a coal to urea plan at the Shotts Industrial Park. The plant will use proven
"best in class" coal gasification and fertiliser production technologies. Urea will be exported through the Bunbury Port. Capital Value: $3.5 billion Employment - Construction: 1,500
Employment - Operational: 200
Note: (a) Capital expenditure reported by the Australian Newspaper on June 25, 2011. Report cited cost overruns on original $2.2 billion project. Converted from USD at $1.054 (source: www.rba.gov.au) Source: SWDC (2011), BHP (2011)
Work on the expansion of the Worsley Alumina Refinery, located 17 kilometres west of Collie, has been ongoing since 2005 and on completion will lift the capacity of the Worsley Alumina Refinery from 3.5 million tonnes per annum to approximately 4.6 million tonnes. Although the construction impact of the expansion is largely finished, the increased capacity and the on-going impact of the expansion will to be an important part of the economy and drive economic growth.
Both the coal and energy sectors will continue to provide economic stimulus moving forward.
13.3 Climate Change & Carbon Tax Impacts
Climate change is a global issue which will impact on the global environment into the future. According to the National Aeronautics and Space Administration (2011), climate change is currently presenting itself in:
Sea level rise (up 17 centimetres last century)
Global temperature rise (the 20 warmest years on earth have all occurred since 1980)
Warming oceans (the top 700m of oceans have warmed 0.302 degrees Fahrenheit since 1969)
Shrinking ice sheets (Antarctica lost 152 cubic kilometres of ice between 2002 and 2005)
Declining arctic sea ice (in terms of extent and thickness)
Glacial retreat (globally)
Extreme weather events (including, heat, cold and rain events)
Ocean acidification (down by 30% since the beginning of the industrial revolution)
Human activity is widely considered to be driving the rapidity of climate change. As climate change is increasingly in focus, governments across the globe are enacting laws to tax carbon emissions. The Australian Labour Government has recently passed climate change reform in the form of a carbon pricing mechanism. Starting 1 July 2012, the carbon price mechanism will apply to all companies producing at least 25,000 tonnes of CO2 per year, excluding electricity and fuels used for transportation. The government estimates a carbon price of approximately $1.40 per tonne of coal. To assist with the transition, the Government has announced assistance of $1.3 billion over 6 years for existing mines (Australian Government, 2012). The introduction of the Carbon Tax could be a catalyst to investigations of renewable energy options in Collie.
The new climate change reform and regulation could have a direct impact on the Collie economy, given its significant carbon footprint from its foundation industries.

Collie SuperTown Combined Report
Final Draft
84
13.4 Internet
The internet has changed the way we live, work and play. The internet has changed how we communicate with others, how we purchase goods and services and how we conduct our business. The influences of the internet are expected to continue to infiltrate our every-day lives into the future, providing greater amounts of information at faster speeds. The internet has already enabled businesses to grow their product target market exponentially. As highlighted in the table below (Table 13.2), the pace at which the internet has infiltrated all aspects of our lives is tremendous. Accessing this technology will be important for future economic growth.
Table 13.2: Technology Adoption Timelines Comparison
Technology/Application Years to Reach
50 Million Users
Electricity 50
Telephone 50
Radio 38
Personal Computers 16
Televisions 13
Sony Walkmans 10
Video Cassette Recorders 10
Digital Cameras 9
eBay 6
DVD players 5
iPods 5
Internet 4
Skype 2
MySpace 1
Source: Pollen Strategy (2006)
The internet will play a fundamental role in the local economy moving forward.

Collie SuperTown Combined Report
Final Draft
85
14. Economic Issues & Challenges
There are numerous issues and challenges that must be addressed in order achieve a vibrant economy that supports the SuperTowns’ initiative.
The identified impediments or gaps include:
An under representation of skilled labour in the region, presenting capacity constraints to local business and industry growth and resulting in the inability to leverage the opportunity to become a major service centre.
Lack of translation of economic activity into local employment, with a combination of strong Drive-In/Drive-Out travel patterns to Collie from the surrounding region and Bunbury.
Low population growth and an ageing population demographic.
Lack of professional service delivery in Collie, due to the relative small size of the town and its local labour force as well as strong competition from Bunbury.
Lack of broadband internet connections.
Gaps in the supply chain with regards to industrial and professional services.
14.1 Skilled Labour Shortage
The Issue:
Collie has had historically higher levels of unemployment than the SWDC average. This is partly due to the lack of skilled labour in the area and the ability of people outside of the LGA to access the jobs. Low levels of skill presents capacity constraints to local business and industry growth and resulting in the inability to leverage the opportunity to become a major service centre.
The Evidence:
19.8% of Collie residents are employed in unskilled labouring work, slightly greater than the average across the SWDC and a significantly greater proportion than the average across Western Australia. Conversely, Collie has a substantial undersupply of professionals relative to the broader SWDC region and state averages.
The under-supply of skilled labour as well as the growth in mining sector jobs has also caused wages to rise for those in Collie. As a result Collie has one of the highest average wages in the SWDC region.
Figure 14.1 highlights the lack of skilled labour affecting both Collie town and Collie LGA. Collie has a significantly higher proportion of working aged residents that have certificate qualifications than the SWDC region and state averages, which is consistent with the high proportion of technicians, trade workers and machinery operators and drivers working in the area.

Collie SuperTown Combined Report
Final Draft
86
Figure 14.1: School & Post-School Qualifications, 2006
Source: ABS (2007)
The Response:
Efforts need to be made to increase the range of educational and training opportunities within the Collie LGA. Up-skilling residents will better prepare them to take advantage of future opportunities that arise within the Collie economy, particularly in white-collar jobs which are significantly under-represented.
14.2 Economic Dependence on the Coal Industry
The Issue:
Coal mining is the premier industry in Collie, directly providing 40% of the LGA's GRP and employing over a quarter of the labour force. Economic diversification is therefore required to reduce the area's reliance on once single sector, to stabilise the economic cycle over the longer term.
The Evidence:
Western Australia's entire coal supplies are sourced from Collie, with over $350.0 million worth of Coal produced in 2010. Overall, 90% of Collie's industry value add is generated by mining, electricity, manufacturing and construction types of activities - making Collie a mining and industrial focussed region with little diversification. The lack of economic diversification is having two resultant impacts:
Limiting the range of employment options for locals
Greater volatility (both upside and downside) to the economic cycle
Providing a wide range of employment opportunities and maintaining a steady economic cycle will be essential to attracting new residents to the area. Diversifying the economy does not equate to reducing the size of the coal industry. Rather, economic diversification will require the attraction of new businesses, industries and skills to the region. By growing the overall economy and employment and expanding other industries, the economic reliance on the coal industry would be expected to reduce.
0.0% 10.0% 20.0% 30.0% 40.0% 50.0% 60.0%
Postgraduate Degree
Graduate Diploma and Graduate Certificate
Bachelor Degree
Advanced Diploma and Diploma
Certificate
% Finished Year 12
Collie SLACollie Urban Centre Collie (S) SWDC Perth SD Western Australia

Collie SuperTown Combined Report
Final Draft
87
The Response:
Economic diversification, through business and resident attraction is essential to diversifying the Collie economy. These activities would be expected to growth the local economy, provide a greater range of skills and employment opportunities in the region and stabilise the economic growth cycle.
14.3 Translation of Economic Activity into Local Employment
The Issue:
Despite Collie being an economic hub of the greater SWDC region, it is has a consistently higher unemployment rate than the average across the SWDC. This is partly due to strong Drive-In/Drive-Out travel patterns to Collie from the surrounding region and Bunbury. The recent economic prosperity has not been shared equally and more local jobs are needed for local residents.
The Evidence:
Collie LGA’s GRP has recorded a strong average annual growth rate of 6.6% since 2006-07, which accounted for close to a third of the SWDC region’s total GRP.
However, despite the strong economic growth in the region, unemployment remains high. Figure 14.2 shows the respective unemployment rates of the Collie LGA and the average across the SWDC region from the September 2006 quarter to the June 2011 quarter. Collie’s unemployment rate has consistently been close to 2% higher than the SWDC average, despite Collie being an economic hub of the region.
Figure 14.2: Unemployment Rate Comparison
Source: DEEWR (2011)
One of the reasons for the high unemployment rate amongst Collie residents is the number of people living outside of Collie that travel in to work. Journey to work data shows that only 42% of local jobs are held by residents or conversely that 58% of the local workforce lives outside of Collie. The Shire of Harvey, City of Bunbury and the Shire of Dardanup are the largest contributors of workers in Collie.
0.0%
1.0%
2.0%
3.0%
4.0%
5.0%
6.0%
7.0%
8.0%
Un
em
plo
ym
en
t R
ate
(%
)
Collie (S) SWDC Region

Collie SuperTown Combined Report
Final Draft
88
The Response:
Similar to dealing with the issue surrounding the lack of skilled labour in the region, efforts need to be made to increase the range of educational and training opportunities within the Collie LGA to provide education-career pathways. At the same time, large existing employers can also encourage future workers to consider living in Collie and work together with the Shire to present Collie as an attractive family destination as part of the employment recruitment process.
14.4 Broadband Internet Connections
The Issue:
Internet speed and cost of internet service cannot compete on a level playing field against capital cities. The internet will be an essential part of everyday life for businesses and residents.
The Evidence:
Currently, ADSL services are provided over the existing Telstra copper network, which does not offer the same speed as a broadband connection over fibre optics. Speeds and availability also vary with the existing 3G mobile network. Given that Telstra has a current monopoly, there is no competition and incentive to invest in new infrastructure and offer better services at lower costs.
On March 29, 2012, the Australian Government announced the Australian Government announced the three year construction plan for the fibre component of the National Broadband Network. The plan included 3,400 homes and businesses in Allanson and Collie.
The Response:
Collie and Allanson will receive fibre optic cable as part of the NBN rollout plan. This will assist in bringing fast-speed internet connections into the region to service both businesses and residents in the area. In order to leverage this infrastructure, businesses need to understand the potential and how to implement it.
14.5 Low Population Growth & Ageing Population Demographic
The Issue:
Collie had a population of 7,790 people in 2010, having grown at an average annual rate of 1.0% per annum since 2006. This annual average growth rate is vastly slower than the average population growth across the SWDC region. In addition, Collie has an older population (although in line with the SWDC regional average) due to a lack of residents aged between 20 to 34 years.
The Evidence:
Figure 14.3 shows that Collie LGA has experienced slow (and at times negative) annual population growth since 2001 relative to SWDC regional average. Collie town makes up approximately 82.3% of the LGA’s population and also follows a similar growth pattern.

Collie SuperTown Combined Report
Final Draft
89
Figure 14.3: Collie Population Growth, 2001-2010
Source: ABS (2011)
Figure 14.4 highlights the older nature of the Collie population relative to the Western Australian average. Despite recording a higher proportion of residents aged under 20, Collie has a substantially smaller proportion of its population aged 20 to 39 than the state average. Likewise, Collie has a higher proportion of residents aged 50 years and over than the State average.
Figure 14.4: Age Structure, 2010
Source: ABS (2011)
-1.5%
-1.0%
-0.5%
0.0%
0.5%
1.0%
1.5%
2.0%
2.5%
3.0%
3.5%
4.0%
0
1,000
2,000
3,000
4,000
5,000
6,000
7,000
8,000
9,000
10,000
11,000
2001 2002 2003 2004 2005 2006 2007 2008 2009 2010
An
nu
al %
Ch
an
ge
Co
llie
LG
A P
op
ula
tio
n
Collie LGA Collie LGA SWDC
12.9%
13.3%
15.1%
14.3%
14.4%
12.6%
9.0%
5.1%
3.2%
13.9%
15.5%
12.0%
12.7%
14.1%
13.9%
9.6%
5.4%
3.0%
20.0% 15.0% 10.0% 5.0% 0.0% 5.0% 10.0% 15.0% 20.0%
0 to 9
10 to 19
20 to 29
30 to 39
40 to 49
50 to 59
60 to 69
70 to 79
80 and over
Age StructureCollie (S) Western Australia

Collie SuperTown Combined Report
Final Draft
90
The Response:
Retention of young adults is essential in order to accelerate population growth in Collie. Undertaking research to understand the drivers of this migration away from Collie and addressing core issues will be required to future population retention.
14.6 Professional Service Delivery
The Issue:
Utilities, manufacturing and mining industry activity dominate the Collie economy. As a consequence of this dominance, all other industry sectors are underrepresented in the Collie economy when compared to the national average, raising concerns regarding economic diversity. Particularly poor are white collar professional industries such as Professional, Scientific and Technical Services, Information Median and Telecommunications, and Financial and Insurance Services. This represents a major gap in the economy.
The Evidence:
The location quotients shown below demonstrate the specialisation of the Collie economy location. Location quotients demonstrate the degree to which a local or regional economy is specialised by examining the proportion of employment (by industry sub-sector) compared to a larger economy (Australian economy).
Figure 14.5 shows the location quotients across the 19 sectors of the economy, highlighting Collie’s reliance on the mining, electricity, gas, water and waste services and manufacturing sectors and the under-representation of the remaining sections of the economy.
Figure 14.5: Location Quotients, 2006, 1-Digit ANZSIC
Source: ABS (2007), AECgroup
0.0 1.0 2.0 3.0 4.0 5.0
Wholesale trade
Financial and insurance services
Information media and telecommunications
Professional, scientific and technical services
Transport, postal and warehousing
Arts and recreation services
Rental, hiring and real estate services
Administrative and support services
Public administration and safety
Agriculture, forestry and fishing
Other services
Health care and social assistance
Retail trade
Accommodation and food services
Education and training
Construction
Manufacturing
Electricity, gas, water and waste services
Mining
Collie
SWDC
Perth SD
WA
(12.6)
(7.0)

Collie SuperTown Combined Report
Final Draft
91
Figure 14.6: Location Quotients, 2006, 2-Digit ANZSIC, Business and Professional Services
Note: Includes Professional Scientific Services, Financial and Insurance Services, Information Media and Telecommunications, Administration and Support Services. Source: ABS (2007), AECgroup
The Response:
Diversification of the Collie economy and up-skilling residents will give local alternatives to goods and services that currently need to be imported by Collie businesses. Marketing and investment attraction will be critical to replacing these gaps.
14.7 Supply Chain of Industrial & Professional Services
The Issue:
Gaps exist in Collie’s supply chain due to much of the goods and services required by major industries being imported. Opportunities exist for Collie’s businesses to offer local alternatives to these heavily imported goods and services or to develop local capacities which are currently imported.
The Evidence:
Major imports into a region can sometimes represent opportunities for local employment through substituting importing with local production, which would improve local industry supply chains and provide additional job opportunities for locals.
0.0 0.2 0.4 0.6 0.8 1.0 1.2 1.4
Motion Picture and Sound Recording Activities
Broadcasting (except Internet)
Internet Publishing and Broadcasting
Internet Service Providers, Web Search …
Library and Other Information Services
Insurance and Superannuation Funds
Telecommunications Services
Computer System Design and Related Services
Real Estate Services
Auxiliary Finance and Insurance Services
Administrative Services
Finance
Professional, Scientific and Technical …
Building Cleaning, Pest Control and Other …
Publishing (except Internet and Music …
Rental and Hiring Services (except Real Estate)
Collie
SWDC
Perth SD
WA

Collie SuperTown Combined Report
Final Draft
92
Figure 14.7: Key Imports into Collie LGA, 2007-08 (Top Ten)
Source: ABS (2010, 2011), AECgroup
The Response:
Many of the top ten importing industries are likely related to coal mining and heavy industry, which may present some opportunities for import replacement. Consultation with industry would support the idea of future developments to replace or to build on current imports. Providing these gaps in the supply chain through investment attraction, business development and engaging with major industries in Collie will help to generate more local jobs.
$29.1
$32.4
$35.7
$38.7
$40.4
$51.0
$59.1
$72.3
$81.3
$910.6
$0 $200 $400 $600 $800 $1,000
Petroleum and Coal Product Manufacturing
Non-Residential Property Operators and Real Estate Services
Wholesale Trade
Finance
Professional, Scientific and Technical Services
Construction Services
Electricity Transmission, Distribution, On Selling and Electricity Market Operation
Oil and gas extraction
Exploration and Mining Support Services
Non Ferrous Metal Ore Mining
Imports of Goods and Services by Industry ($M)

Collie SuperTown Economic Development Plan
Final Draft Report
93
15. Economic Development Plan
This chapter provides a detailed overview of the Economic Development Plan for Collie. An overview of the strategy is provided followed by a detailed assessment of each step of the process.
15.1 Overview
The Economic Development Plan for Collie is outlined in Figure 15.1. The plan is informed by the SuperTowns Vision and the specific needs of Collie in order to become a SuperTown.
The Economic Development Plan is enacted through a series of Strategic Initiatives which include transformational projects which will guide the town towards the desired outcomes. Each of these transformational projects is closely linked with the Economic Development Initiatives which will provide ongoing direction to the Capes Shire Council for local economic development.

Collie SuperTown Economic Development Plan
Final Draft Report
94
Figure 15.1: Economic Development Plan Overview
Source: AECgroup
SuperTowns Vision: “To have balanced, well-connected regional communities, with lifestyle options and access to services – SuperTowns
will have affordable, quality housing and a growing and diverse range of job opportunities. They will offer more choices for people living in regional areas and an attractive alternative to living in the metropolitan area”
What Does it Take to
Become a SuperTown?
Improve amenity.
Grow the population.
Secure jobs locally.
Diversify the economy.
Change perceptions.
Economic Development Plan
Strategic Projects
1. Redevelopment of CBD: transforming the CBD including improving amenity of the river, redevelopment of the Wallsend Precinct, revitalisation of CBD and new community swimming pool.
2. Tourism Precincts Improvements: including new Motorplex and Lake Kepwari.
3. Wilson Park Redevelopment: urban renewal project to reinvigorate neighbourhood and raise socio-economic standing.
Economic Development Initiatives
1. Support Existing Business: develop programs to proactively engage with and assist the growth of local companies.
2. Market the Shire: marketing the Shire for new residences and businesses.
3. Attract and Facilitate New Investment: through pro-active business attraction and support.
4. Develop the Local Workforce: develop and attract new skills in the region.
Outcomes
Increased economic prosperity.
Improved economic capacity.
Increased retention of economic benefits in the local
region.
Increased opportunities.
Improved sustainability.
Increased service provision.

Collie SuperTown Economic Development Plan
Final Draft Report
95
15.2 Strategic Projects
The identified strategic projects will act as a catalyst for future activity and assist in addressing many of the key tasks that Collie must undertake to become a SuperTown (i.e. improve amenity, secure jobs locally, diversify the economy and change perceptions). Each of these projects individually and collectively will provide support for Collie to transform its economy, as highlighted in the diagram below.
Figure 15.2: Strategic Project Linkages
Source: AECgroup
Critical Factors
Strategic Projects
Economic Opportunities
Improve Amenity Secure Jobs Locally Diversify the Economy
Redevelopment of the CBD Tourism Precincts Improvements Wilson Park Redevelopment
Mining
Retail
Education
Health & Community
Professional Services
Light Industries, Logistics
Utilities
Heavy Manufacturing
Change Perceptions
Tourism

Collie SuperTown Economic Development Plan
Final Draft Report
96
Table 15.1: Strategic Project Overview, Collie
Strategic
Project Description Strategic Importance
Relation to Long-term Economic
Development
Redevelopment of the CBD
A plan to revitalise the CBD by delivering residential
accommodation, retail amenity, a swimming pool and removing the rail line. The plan includes the redevelopment of the
Wallsend precinct and revitalisation of the riverfront.
This project will play a fundamental role in the attraction of residents to
Collie. The project is anticipated to also increase tourism appeal. Because it significantly improves residential and retail amenity the
project will assist in ensuring that residents have access to all the services required.
The project acts as a
catalyst of change by transforming the CBD and assisting in changing perceptions
and attracting residents.
Tourism Precincts
Improvements
This project includes a new motorplex precinct as well as
improvements to the Lake Kepwari precinct.
These projects will greatly assist in building the tourism capacity of Collie, which will help to diversify the
economy as well as improve local amenity for residents
This project acts as a catalyst because of its opportunity to
diversify the economy and help to change perceptions of Collie.
Wilson Park Redevelopment
This project is an urban renewal project which will
include street scaping, public art, development of building design guidelines and higher density residential.
This project will revitalise an area of the town which is in greatest need,
assisting to retain existing local residents and attract new residents and businesses to the area by increasing the amenity.
This project will assist in changing perceptions of Collie,
both internally and externally and could assist in building the tourism industry in the
area.
Source: AECgroup
15.3 Economic Development Initiatives
The economic development initiatives provide long-term activities to support the on-going transformation of the Collie economy into a SuperTown. These initiatives will build on the strategic projects as catalysts for future development that assist in changing the nature of Collie and preparing it for future economic growth.
15.3.1 Supporting Existing Businesses
Objective: Support existing businesses to grow and prosper.
Rationale: Existing businesses are the backbone of any economy. In most developed economies, existing businesses provide between 60%-80% of new investment and jobs. Interacting in a proactive manner with local businesses will assist to understand current issues, needs and opportunities to facilitate business growth. While the Shire cannot grow businesses it can help to facilitate growth through a range of activities. Engaging with local businesses can also support local job growth.
Key Initiatives: Key initiatives to support existing businesses include:
Form an industrial business committee of key businesses from mining, manufacturing and electricity generation to provide on-going input and feedback regarding economic development. The committee would be informal and meet on a regular basis (i.e. monthly or quarterly). Discussions would focus on activities to recruit new businesses to Collie, new opportunities arising, any key issues emerging, workforce development opportunities, regulatory issues or other matters. The function of the committee is to offer on-going and regular interaction between the key industries in Collie and the Shire. The committee should act as a sounding board for new initiatives.
Continue to understand the specific supply chains of key industries. In discussion with key local businesses, identify specific companies that are providing goods and services locally but who are based outside of the Shire. These companies should be approached regarding opportunities to locate to the Shire. This is an initiative which is currently underway.
Continue to host regular events, with partners such as the Chamber of Commerce and Bunbury Wellington Small Business Centre, to engage broadly with business community. Events, such as breakfasts and lunches, can provide an efficient way to

Collie SuperTown Economic Development Plan
Final Draft Report
97
communicate to the business community at large as well as receive feedback and on-going input into economic development activities. A relevant and interesting topic should be chosen for each event and the networking opportunities for local businesses to engage with each other provide an important chance to link into local opportunities and ensure local businesses use local services. Wherever possible, these events should be done in partnership with other organisations.
Facilitate access to business support programs. There are numerous business support programs from the federal and state government that can provide real value to local businesses. However, often times, small to medium sized businesses are consumed by running their business and do not have the time investigate these programs and identify the appropriate path to access the support. Providing this link can assist businesses greatly.
15.3.2 Market the Shire
Objective: Over the medium-term, rebrand the Shire to increase awareness and its profile as a business and residential destination.
Rationale: Collie has a strong industrial base and room to grow local businesses across industrial, professional and retail sectors. At the same time, residents surveyed are very satisfied living in Collie. With outdoor and recreational amenity in abundance as well as the strategic projects to transform Collie, the value proposition of Collie can be strong. It is important that this message get out and assist in transforming any existing perceptions of Collie into the accurate understanding of all that Collie has to offer. A strong and consistent marketing campaign is required over many years.
Key Initiatives: Key initiatives to market the Shire include:
Undertake perception research into the attraction of families into the region and to identify any potential pitfalls or major concerns.
Using perception research, undertake a rebranding campaign of Collie to change perceptions and reposition the town.
Develop necessary suite of marketing materials, including a general business location profile as well as a general residential information guide. These general marketing pieces should be further supported by specific profiles for investment opportunities as well as tourism opportunities around the recreational amenity in Collie. This material should be used to assist in attracting residents and businesses.
Develop marketing material for each strategic project to highlight the efforts of the Shire to transform into a SuperTown and to support future investments in retail, residential services, health and education.
Participate in targeted conferences and industry exhibitions in order to build profile and network with potential investors in key industries. Conferences, trade shows and exhibitions can be good opportunities to network with a large number of targeted industry people at one time. Opportunities should be thoroughly researched to ensure they align with industry opportunities and preparation should be conducted to proactively identify businesses to approach.
Proactively approach newspaper and industry publications identifying recent investments and activities of the Shire to grow and support the economy. Third party reports can assist in raising the profile of the area and attract attention from prospective investors and potential future residents.
15.3.3 Attract & Facilitate New Investment
Objective: To ensure new investments and new jobs are generated locally.
Rationale: In order for the economy to grow and transform, new jobs and new investment will be required. New businesses will also help diversify the economy and relieve the reliance on the foundation industries. It is also important that the Shire play a proactive role in facilitating new investments and ensuring that the local environment is attractive to businesses and provides a high level of confidence regarding future investment.

Collie SuperTown Economic Development Plan
Final Draft Report
98
Key Initiatives: Key initiatives to attract and facilitate new investment include:
Property development opportunities
Retail, residential services, health and education.
Proactively approaching suppliers of existing businesses (using marketing material)
Provide investor services
Consider incentives
15.3.4 Develop the Local Workforce
Objective: Ensuring that local jobs can be met by local residents.
Rationale: The Collie economy is set to grow on the back of on-going growth and expansion of key existing industries. Ensuring that future local jobs can be met by future local residents will require recruiting some skills (and new residents) as well as ensuring there are effective education to career pathways for existing residents.
Key Initiatives: Key initiatives to develop the local workforce include:
Regularly liaise with industry and education / ensure education and industry are closely linked.
Proactively recruit future employees of existing businesses that are expanding.
Provide a welcome to Collie service for families considering to move to Collie.

Collie SuperTown Combined Report
Final Draft Report
99
16. Implementation Plan
The following implementation plan has been established to carry out the Economic Development Plan and link together with the Collie Growth Plan.
Table 16.1: Economic Development Implementation Plan, Collie
Project
Description Scope Recommended Action
Key Agency / Lead
Responsibility
Timeframe for Delivery Estimated
Costs (subject to
detailed
costing)
Funding
Source
Contingency
Funding
Population Threshold
(where
relevant)
Delivery
Mechanism
Agency
Consultation Short 0-5 years
Medium 5-10 years
Long Term 10-20 years
Industry and
Community Partnerships
Shire Engage with main
industries in the Shire of Collie to contribute to key infrastructure
development and facilities in the town as part of their respective
ongoing operations.
Shire of Collie &
Bunbury Wellington Economic
Alliance
NA - - - In House SWDC
Dept of Mines
Shire Formulate an “Industry Council” independent of the Shire which
incorporates a mandate to align with the Environmental
Strategy’s objectives and ensure ongoing monitoring and review of
identified environmental impact risks are carried out appropriately.
Bunbury Wellington Economic
Alliance
In House Key Industry Groups
SWDC - Implement strategic outcomes and
resolutions
Dept of Mines DEC
Shire Prepare and implement
a Strategy with Industry Groups to promote the benefits of employees
working and living in Collie.
Shire of Collie $50,000 Royalties
for Regions
(ST)
Local
Authority Key Industry
Groups
- Implement
strategies for partnerships
SWDC

Collie SuperTown Combined Report
Final Draft Report
100
Project Description
Scope Recommended Action Key Agency / Lead Responsibility
Timeframe for Delivery Estimated
Costs (subject to
detailed costing)
Funding
Source
Contingency
Funding
Population Threshold (where relevant)
Delivery Mechanism
Agency Consultation Short
0-5 years
Medium 5-10 years
Long Term 10-20 years
CBD Promote increased awareness and presence of Collie’s
industrial base by providing relevance back into the CBD
through associated development and/or business activities from
the main groups such as Yancol, Lanco, BHP and potentially Perdaman.
Shire of Collie Subject to project cost estimates
Private Sector
Local Authority
- Implement targeted marketing
Chamber of Commerce Industry
Council
CBD Re-engage the community and visitors alike, many of whom are
employed by industry, through the provision of identifiable built
infrastructure or specific promotion in the form of public art.
Shire of Collie Subject to project cost estimates
Royalties for
Regions
(ST) SWDC
Private Sector Local
Authority
- Implement strategic initiatives
Local Community Groups
Economic:
Support Existing Businesses
Shire Understand the specific
supply chains of key industries in order to identify prospective
investors in coordination with key location industries.
Shire of Collie In House Local
Authority
- - Implement
strategic plan
Chamber of
Commerce SWDC
Shire Host regular events to
engage broadly with business community, such as breakfasts and
lunches, to provide a forum to engage with all local businesses.
Shire of Collie
Collie Chamber of Commerce & Industry
$10,000 pa Royalties
for Regions
(ST)
Chamber of
Commerce
Local
Authority
- Implement
strategies for partnerships
SWDC
Chamber of Commerce members
Industry Groups

Collie SuperTown Combined Report
Final Draft Report
101
Project Description
Scope Recommended Action Key Agency / Lead Responsibility
Timeframe for Delivery Estimated
Costs (subject to
detailed costing)
Funding
Source
Contingency
Funding
Population Threshold (where relevant)
Delivery Mechanism
Agency Consultation Short
0-5 years
Medium 5-10 years
Long Term 10-20 years
Shire Facilitate access to business support programs through an
active engagement program with local businesses.
Shire of Collie Collie Chamber of Commerce &
Industry
$10,000 pa Chamber of
Commerce
Local Authority
- Implement strategies for partnerships
Chamber of Commerce members
SWDC
Economic: Attract and Facilitate
New Investment
Shire Market property development projects and attract investment
as well as recruit retail, residential services, health and education
providers.
Shire of Collie $40,000 pa Chamber of
Commerce
DET DoH
SWDC
Local Authority
- Implement strategies for partnerships
DET WACHS Chamber of
Commerce members SWDC
Shire Conduct business development activities to approach suppliers of
existing businesses and other potential investors.
Shire of Collie $40,000 pa SWDC Private Sector
Local Authority
- Implement strategic initiatives
Chamber of Commerce SWDC
Shire Facilitate investment through client
management and good customer service.
Shire of Collie In House - - - Implement strategic
initiatives
Chamber of Commerce
Shire Evaluate the need to offer incentives to
encourage investment in Collie
Shire of Collie $35,000 SWDC Local Authority
- In House or appointed
consultant
Chamber of Commerce

Collie SuperTown Combined Report
Final Draft Report
102
Project Description
Scope Recommended Action Key Agency / Lead Responsibility
Timeframe for Delivery Estimated
Costs (subject to
detailed costing)
Funding
Source
Contingency
Funding
Population Threshold (where relevant)
Delivery Mechanism
Agency Consultation Short
0-5 years
Medium 5-10 years
Long Term 10-20 years
Tourism Shire Undertake and Implement Local Tourism Strategy in
order to provide a framework for tourist development in the
Shire including identification of specific tourist sites and
activities. (e.g. caravan parks, nature based camping, short stay
accommodation, tourist recreational facilities etc).
Shire of Collie & WAPC
$100,000 Royalties for
Regions
(ST)
Local Authority
- In House or appointed consultant
Tourism WA SWDC WAPC
Shire Amend Local Planning Scheme in accordance with adopted Local
Tourism Strategy, as required.
Shire of Collie $30,000 Royalties for
Regions
(ST)
Local Authority
Private Sector
- Endorsement of Local Tourism
Strategy
Department of Planning
Shire Identify Tourism Initiatives, Partnerships
and Events to promote Tourism in the Shire including synergies with
other nearby towns and regions such as the Ferguson Valley, Boyup
Brook Darkan and Williams.
Shire of Collie $20,000 Royalties for
Regions (ST)
Relevant Local
Authorities Private Sector
- Implement strategies for
partnerships
Tourism WA SWDC
Local Authorities

Collie SuperTown Combined Report
Final Draft Report
103
Project Description
Scope Recommended Action Key Agency / Lead Responsibility
Timeframe for Delivery Estimated
Costs (subject to
detailed costing)
Funding
Source
Contingency
Funding
Population Threshold (where relevant)
Delivery Mechanism
Agency Consultation Short
0-5 years
Medium 5-10 years
Long Term 10-20 years
Shire Promote and progress improved road linkages to Boyup Brook via
Mcalinden Road to facilitate greater access into the Blackwood
Region and back towards Lake Kepwari and the Motorplex.
Similarly improved links into the Ferguson Valley via Pile Road thus
providing a tourist loop through Wellington Dam and the Wellington
National Park.
Shire of Collie TBC Royalties for
Regions
(ST) Federal
Relevant Local
Authorities
- Implement endorsed plans
Main Roads WA Neighbouring
Local Govts DEC
Shire Progress planning and development of an
additional Caravan Park and short stay accommodation facilities
on selected site(s)
Shire of Collie $3-4m Local Authority
Private Sector
- - Stakeholder Consultation
outcomes
Tourism WA SWDC
Collie Golf Course
Review identified golf course redevelopment options for potential
resort style accommodation and seek private investment
interest.
Shire of Collie $30,000 Private Sector
Local Authority
- Local Authority release
Department of Regional Development
& Lands

Collie SuperTown Combined Report
Final Draft Report
104
Project Description
Scope Recommended Action Key Agency / Lead Responsibility
Timeframe for Delivery Estimated
Costs (subject to
detailed costing)
Funding
Source
Contingency
Funding
Population Threshold (where relevant)
Delivery Mechanism
Agency Consultation Short
0-5 years
Medium 5-10 years
Long Term 10-20 years
Shire Investigate opportunities for a range of nature based and recreation
tourism uses and activities either on public or private land and
progress strategic planning and land tenure arrangements (if
required) to facilitate delivery through private and public investment
and efficient marketing.
Shire of Collie $50,000 Royalties for
Regions
(ST)
DEC Private Sector
Local
Authority
- Implement strategies for partnerships
DEC Tourism WA
Economic: Develop the
Local Workforce
Shire Regularly liaise with industry and education /
ensure education and industry are closely linked.
Shire of Collie $10,000 pa Royalties for
Regions (ST)
Local Authority
Industry Council
DEC
- Implement strategies for
partnerships
Industry Groups
DET Local Community
Groups
Shire Provide a welcome to Collie service for families considering a
move to Collie.
Shire of Collie $10,000 pa Royalties for
Regions
(ST)
Local Authority
- Continued growth
Industry Groups Chamber of
Commerce Department of Housing
Marketing Shire Review current
Marketing Plan and prepare a Marketing Strategy to improve
perceptions of the town and encourage economic growth
through local business, tourism, education, health services, lifestyle
opportunities and employment.
Shire of Collie $70,000 Royalties
for Regions
(ST)
Local
Authority Tourism WA
SWDC
Private Industry Groups
- In House or
appointed consultant
Chamber of
Commerce SWDC DET
WACHS

Collie SuperTown Combined Report
Final Draft Report
105
Project Description
Scope Recommended Action Key Agency / Lead Responsibility
Timeframe for Delivery Estimated
Costs (subject to
detailed costing)
Funding
Source
Contingency
Funding
Population Threshold (where relevant)
Delivery Mechanism
Agency Consultation Short
0-5 years
Medium 5-10 years
Long Term 10-20 years
Shire Ensure suitable amount of product development has been established
and implement Market Strategy Initiatives to promote Collie as a
place to live.
Shire of Collie In House - - - Local Authority
Chamber of Commerce
Shire Appoint Shire Business Development and
Marketing officer to coordinate and review shire promotional
initiatives and facilitate business relationships between the public and
private sector and promote and coordinate supply chain
opportunities to increase local provision of services and equipment
to the industry groups.
Shire of Collie $80,000 pa Local Authority
- - Implement marketing
initiatives
Chamber of Commerce
SWDC
Economic: Market the Shire
Shire Develop necessary suite of marketing materials, including print and
online media as well as a web presence
Shire of Collie $60,000 pa Royalties for Regions
(ST)
Local Authority
- Local Authority
Chamber of Commerce SWDC
News Groups
Shire Participate in targeted conferences and
industry exhibitions in order to build profile and network with potential
investors in key industries.
Shire of Collie $50,000 pa Royalties for
Regions (ST)
Local Authority
- Local Authority
Industry Groups
Chamber of Commerce

Collie SuperTown Combined Report
Final Draft Report
106
Project Description
Scope Recommended Action Key Agency / Lead Responsibility
Timeframe for Delivery Estimated
Costs (subject to
detailed costing)
Funding
Source
Contingency
Funding
Population Threshold (where relevant)
Delivery Mechanism
Agency Consultation Short
0-5 years
Medium 5-10 years
Long Term 10-20 years
Shire Proactively approach newspaper and industry publications identifying
recent investments and activities of the Shire to grow and support the
economy.
Shire of Collie $20,000 pa Royalties for Regions
(ST)
Local Authority
- Local Authority
SWDC
Source: AECgroup

Collie SuperTown Combined Report
Final Draft Report
107
References
AECgroup (2011). Impact Assessment of the National Broadband Network in the South West Region. Prepared for the South West Development Commission. April 2011.
Australian Bureau of Statistics. (2007). Census of Population and Housing, 2006. Cat. No. 2068.0 ABS, Canberra.
Australian Bureau of Statistics (2010). Household and Family Projections, Australia, 2006-2031. Cat. No. 3236.0, ABS, Canberra.
Australian Bureau of Statistics (2010a). Number of Employed Persons by Industry of Employment (ANZSIC 93 all 4 digit classification levels) by all Place of Work LGAs in Australia. Data provided by Information Consultancy Services, ABS, GPO Box 9817, Brisbane, QLD, 4001.
Australian Bureau of Statistics (ABS, 2010b). Experimental Estimates of Industry Multi-Factor Productivity Growth. Cat. No. 5260.0, ABS, Canberra.
Australian Bureau of Statistics. (2011). Population by Age and Sex 2010, Cat. No. 3235.0, ABS, Canberra.
Australian Bureau of Statistics. (2011a). Wage and Salary Earner Statistics for Small Areas, Australia, 2008-2009. Cat. No. 5673.0, ABS, Canberra.
Australian Bureau of Statistics (2011b). Counts of Australian Businesses, Including Entries and Exits, June 2007 to June 2009. Cat. No. 8165.0, ABS, Canberra.
Australian Bureau of Statistics (2011c). Building Approvals, Australia, WA SLA data cube, August 2011, Cat. No. 8731.0, ABS, Canberra.
Australian Bureau of Statistics (2011d). Tourism Accommodation, Small Area Data, Western Australia. Cat. No. 8635.5.55.001, ABS, Canberra.
Australian Bureau of Statistics (2011e). Household Expenditure Survey, Australia, 2009-10. Cat. No. 6530.0, ABS, Canberra.
Australian Bureau of Statistics (2011f). Australian National Accounts: State Accounts, 2010-11. Cat. no. 5220.0, ABS, Canberra.
Australian Bureau of Statistics (2011g). Australian National Accounts: Input-Output Tables - Electronic Publication, 2007-08 Final. Cat. No. 5209.0.55.001, ABS, Canberra.
Australian Bureau of Statistics (2011h). Australian National Accounts: National Income, Expenditure and Product, Cat. No. 5206.0, ABS, Canberra.
Australian Bureau of Statistics (2011i). Regional Population Growth, Australia, 2009-10. Cat. No. 3218.0, ABS, Canberra.
Australian Government. Assistance for Industry. Available From: http://www.cleanenergyfuture.gov.au/helping-business/assistance-for-industry-2/. Last Accessed: 20 February 2012.
Australian Government. Department of Broadband, Communications and the Digital Economy. South West at a Glance. 29 March 2012.
BHP (2011). BHP Billiton Worsley Alumina Health, Safety, Environment and Community Report. BHP, Worsley.
Chambers, M (2011) Delay, $1.2bn cost blowout hits BHP’s Worsley alumina project. Available from http://www.theaustralian.com.au/business/delay-12bn-cost-blowout-hits-bhps-worsley-alumina-project/story-e6frg8zx-1226081624524. Accessed: 2 December, 2011.
Collie River Valley (2007). Invest. Available from: http://www.collierivervalley.com/. Accessed: 6 February, 2012.
Department of Education, Employment and Workplace Relations (2011). Small Area Labour Markets June 2011, Australia, Canberra.

Collie SuperTown Combined Report
Final Draft Report
108
Department of Environment and Conservation (2011). DEC Campgrounds. Available from http://www.dec.wa.gov.au/campgrounds/component/jomres/?task=viewproperty&property_uid=87. Accessed 6 February, 2012.
Department of Health and Ageing (2007), Statistical Local Area Population Projections, Australia 2007-2027, Canberra.
Department of Resources, Energy and Tourism. (2011). IVS Trips 1999 onwards, NVS Daytrip 1998 onwards, NVS Overnight Trips 1998 onwards. Available from http://www.traonline.ret.gov.au/superweb/login.do. Accessed 24 January, 2012.
Department of Treasury (2011). Mid-Year Economic and Fiscal Outlook 2011-12. Australian Government, Canberra.
Government of WA Department of Mines and Petroleum (2011). Quantity and Value of Major Commodities - Minerals and Petroleum. Government of WA, East Perth, WA. Available from http://www.dmp.wa.gov.au/1521.aspx#1559 Accessed: 2 December 2011.
Government of Western Australia Department of State Development (2011) Shotts Industrial Park and the Collie Urea Manufacturing Project. Available from http://www.dsd.wa.gov.au/8358.aspx. Accessed: 1 December, 2011.
Griffin Energy (2007). Bluewaters Power Station. Available from http://griffinenergy.com.au/default.aspx?MenuID=76. Accessed 3 January, 2011.
Hames Sharley (2011). Collie Development Plan Report, Perth.
IBIS World (2011). Various Industry Reports. IBIS World, Melbourne, Australia.
Lanco (2012). Lanco Infratech Ltd. Natural Resources. Available from www.lancogroup.com. Accessed: 9 April 2012.
Landcorp (2011) Shotts Industrial Park, Available from http://www.landcorp.com.au/_document/Shotts-Industrial-Park/COLLS-2011-11-30-Fact-Sheet-FINAL.pdf. Accessed: 1 December, 2011.
Munda Biddi Trail Foundation (2011). About the Trail. Available from http://www.mundabiddi.org.au/explore-the-trail/about-the-trail.html. Accessed 6 February, 2012.
National Aeronautics and Space Administration (2011). Climate Change: How do we Know? Available from: http://climate.nasa.gov/evidence/ Accessed: 16 February, 2012.
Office of Energy (2011). Stategic Energy Initiative, Energy2031. Western Australian Government, Perth.
Pollen Strategy (2006). Diffusion of Innovations. Pollen Strategy, Perth.
Property Council of Australia (2010), Australian Shopping Centre Database, September 2010.
Real Estate Institute of Western Australia. (2011). Dwelling Prices Collie and WA, Available from http://reiwa.com.au, Accessed: 28 October 2011.
South West Life (2010). Wellington Dam Drive. Available from http://www.southwestlife.com.au/articles/wellington-dam-drive.html. Accessed 6 February, 2012.
SWDC (2011). Major Projects. Available from: http://www.swdc.wa.gov.au/projects/resources-sector.aspx. Last viewed: 24 Jan 2012.
Syme Marmion & Co (2010). South West Region Industrial Land Study - December 2010. Syme Marmion & Co, Perth
TRA (2011). National Visitor Survey and International Visitor Survey, September 2011. Available from: http://www.traonline.ret.gov.au. Last Accessed February 2012.
Verve Energy (2006a). Collie Power Station. Available from http://www.verveenergy.com.au/mainContent/powerStations/Collie.html. Accessed 3 January, 2011.

Collie SuperTown Combined Report
Final Draft Report
109
Verve Energy (2006b). Muja Power Station. Available from http://www.verveenergy.com.au/mainContent/powerStations/muja.html.http://griffinenergy.com.au/default.aspx?MenuID=76 Accessed 3 January, 2011.
Western Australia Department of Treasury (2011). State Budget 2011-12. Western Australian
Western Australia Planning Commission (2005), Population Projections 2004-2031, Perth.
West, G. (1993). Input-Output Analysis for Practitioners, Version 7.1, User’s Guide. Department of Economics, University of Queensland, Brisbane.

Collie SuperTown Combined Report
Final Draft Report
110
Appendix A: Modelling Approach
Projections of labour demand by industry for the Manjimup LGA have been developed utilising projections of Gross Regional Product (GRP) based on expected real industry growth rates, using 2010-11 as a base. In developing industry growth rates, industries are classified into one of three categories:
Leading Economic Drivers (LEDs): LEDs are the industries that are either expected to be a focus for economic growth in the region or that are drivers of growth in other industries;
Population Driven (PDs): PDs are industries that are driven almost entirely by population growth and consumption; and
Business Activity and Population Driven (BAPDs): BAPDs are industries that are driven by some combination of activity in other sectors and household consumption.
The following types of information will be used to develop growth estimates for each industry within the three types of industry categories:
LEDs: Expected real growth rates for LEDs have been developed based on a combination of historic national growth and performance, industry consultation, desktop research regarding growth potential for each LED in the Manjimup LGA from published sources and the professional judgment of AECgroup staff;
PDs: Projections of population growth from Department of Health and Ageing, Western Australian Planning Commission and the Supertowns population growth targets for Manjimup LGA all have been used to identify low, medium and high population growth rates for the Manjimup LGA. Industry growth rates for PDs have then been developed based on the historic relationship between population growth in Western Australia (ABS, 2011i) and overall growth in Gross State Product (ABS, 2011g). This modelling approach supports the assumption that, as the Manjimup LGA economy expands, it will trend towards the State economic structure; and
BAPDs: Expected real growth rates for BAPDs are developed based on a combination of growth in demand from households (population) and business activity in other sectors that demand goods and services from BAPDs. The relationship between BAPDs, other industry and household demand has been estimated using an Input Output table specifically developed for the Manjimup LGA (described below), and this relationship has been applied to growth projections of industry and population to develop individual BAPD industry growth rates.
Input-Output Transaction Table Development
An Input Output transaction table specific to the Manjimup LGA economy has been developed for this project. The process of developing a regional transaction table involves the development of regional estimates of gross production and the development of purchasing patterns based on a parent table, in this case the 2007-08 Australian transaction table (ABS, 2011h).
Estimates of gross production (by industry) for the Manjimup LGA economy were developed based on the percent contribution to employment (by place of work) of the Manjimup region to the Australian economy (ABS, 2010a), and applied to Australian gross output identified in the 2007-08 Australian table. Industry purchasing patterns within the Manjimup LGA were then developed using cross industry location quotients and demand-supply pool production functions, consistent with the approach outlined in West (1993).
Employment projections by industry are developed based on GRP projections by industry and historic estimates of value added production per employee from the transaction tables developed specifically for the Manjimup LGA, with consideration of any potential changes in productivity in line with historic multi-factor productivity growth (ABS, 2010b). The figure below summarises the modelling approach utilised to estimate employment by occupation requirements in the Manjimup LGA to 2031.
Employment projections in key industrial sectors were then used to calculate industrial land demand assuming a 20 employee per hectare standard, incorporating productivity gains over time.

Collie SuperTown Combined Report
Final Draft Report
111
Figure A.1: Manjimup LGA Economic Modelling Approach
Source: AECgroup
Economic DriversVision/ Industry Growth Scenarios
Low Population Growth
-Uses Department of Health and Ageing
population estimates over the forecast
horizon.
Medium Population Growth
-Assumes the Manjimup Town's populatoion
doubles by 2031 and the remainder of the
LGA continues along historical trends.
Leading Economic Drivers (LEDs)Industries that are expected to be a focus for
economic growth in the region or that are drivers of growth in other industries, e.g.:
-Agriculture-Manufacturing
-Wholesale trade-Transport, postal and warehousing
Business Activity & Population Driven (BAPDs)
Industries that are driven by some combination of activity in other sectors and population, e.g.:
-Electricity, gas, water and waste services-Construction
-Financial and insurance services-Professional, scientific and technical services
Population Driven (PDs)Industries that are driven almost entirely by
population growth and consumption, e.g.:-Retail trade
-Accommodation and food services-Education and training
-Health care and social services
Population Growth Projections
Outputs
High Population Growth
-Assumes the Manjimup Town's populatoion
grows by 4.2%pa to 2031 and the remainder
of the LGA continues along historical trends.
Gross Regional Product & Employment
ProjectionsEconomic drivers and
growth expectations will be used to develop gross
regional production projections by industry
through to 2031. Employment projections
can then be calculated based on value added
activity per employee, factoring in labour
productivity improvements.
Industrial land demand estimates were calculated
based on average amployee per hectare
benchmarks in key industries.

Collie SuperTown Combined Report
Final Draft Report
112
Appendix B: Journey to Work Details
Table B. 1: Journey to Work Movements by LGA, Agriculture, Forestry and Fishing, 2006
LGAs Lives in Manjimup and Works in...
Works in Manjimup and Lives in... Difference
Bunbury 15 0 -15
Augusta-Margaret River 0 0 0
Boyup Brook 0 0 0
Bridgetown-Greenbushes 11 16 6
Busselton 0 8 8
Capel 0 0 0
Collie 0 0 0
Dardanup 0 0 0
Donnybrook-Balingup 0 0 0
Harvey 0 4 4
Manjimup 727 727 0
Nannup 11 0 -11
Other 42 25 -17
Total 806 781 -25
Source: ABS (2007), AECgroup
Table B. 2: Journey to Work Movements by LGA, Manufacturing, 2006
LGAs Lives in Manjimup and Works in...
Works in Manjimup and Lives in... Difference
Bunbury 6 0 -6
Augusta-Margaret River 4 0 -4
Boyup Brook 0 0 0
Bridgetown-Greenbushes 10 16 7
Busselton 0 0 0
Capel 0 0 0
Collie 0 0 0
Dardanup 0 0 0
Donnybrook-Balingup 0 0 0
Harvey 0 3 3
Manjimup 434 434 0
Nannup 0 0 0
Other 14 14 0
Total 467 467 0
Source: ABS (2007), AECgroup
Table B. 3: Journey to Work Movements by LGA, Construction, 2006
LGAs Lives in Manjimup and Works in...
Works in Manjimup and Lives in... Difference
Bunbury 10 3 -7
Augusta-Margaret River 0 0 0
Boyup Brook 0 0 0
Bridgetown-Greenbushes 7 0 -7
Busselton 0 0 0
Capel 0 0 0
Collie 0 0 0
Dardanup 0 0 0
Donnybrook-Balingup 7 0 -7
Harvey 0 0 0
Manjimup 132 132 0

Collie SuperTown Combined Report
Final Draft Report
113
LGAs Lives in Manjimup and Works in...
Works in Manjimup and Lives in... Difference
Nannup 0 0 0
Other 39 3 -36
Total 196 138 -58
Source: ABS (2007), AECgroup

Collie SuperTown Combined Report
Final Draft Report
114
Appendix C: Detailed Location Quotients
Figure C.1: Location Quotients, 2006, 1-Digit ANZSIC
Source: ABS (2007), AECgroup
Figure C.2: Location Quotients, 2006, 2-Digit ANZSIC, Agriculture, Forestry and Fishing, and Mining
Source: ABS (2007), AECgroup
0.0 1.0 2.0 3.0 4.0 5.0
Mining
Information media and telecommunications
Professional, scientific and technical services
Electricity, gas, water and waste services
Financial and insurance services
Construction
Arts and recreation services
Administrative and support services
Other services
Wholesale trade
Transport, postal and warehousing
Health care and social assistance
Rental, hiring and real estate services
Retail trade
Manufacturing
Education and training
Accommodation and food services
Public administration and safety
Agriculture, forestry and fishing
Manjimup
Lockyer Valley
Gympie
Casino/Lismore
(6.2, 6.8)
0.0 5.0 10.0 15.0
Non-Metallic Mineral Mining and Quarrying
Agriculture, Forestry and Fishing Support Services
Agriculture
Aquaculture
Forestry and Logging
Manjimup
Lockyer Valley
Gympie
Casino/Lismore

Collie SuperTown Combined Report
Final Draft Report
115
Figure C.3: Location Quotients, 2006, 2-Digit ANZSIC, Manufacturing
Source: ABS (2007), AECgroup
Figure C.4: Location Quotients, 2006, 2-Digit ANZSIC, Business and Professional Services
Note: Includes Professional Scientific Services, Financial and Insurance Services, Information Media and Telecommunications, Administration and Support Services. Source: ABS (2007), AECgroup
0.0 1.0 2.0 3.0 4.0 5.0 6.0 7.0 8.0
Pulp, Paper and Converted Paper Product …
Petroleum and Coal Product Manufacturing
Polymer Product and Rubber Product …
Transport Equipment Manufacturing
Printing (including the Reproduction of …
Primary Metal and Metal Product …
Textile, Leather, Clothing and Footwear …
Food Product Manufacturing
Machinery & Equipment Manufacturing
Fabricated Metal Product Manufacturing
Non-Metallic Mineral Product Manufacturing
Furniture and Other Manufacturing
Basic Chemical and Chemical Product …
Beverage and Tobacco Product …
Wood Product Manufacturing
Manjimup
Lockyer Valley
Gympie
Casino/Lismore
(11.7)
0.0 0.5 1.0 1.5 2.0
Motion Picture and Sound Recording …
Broadcasting (except Internet)
Internet Publishing and Broadcasting
Computer System Design and Related …
Publishing (except Internet and Music …
Insurance and Superannuation Funds
Telecommunications Services
Auxiliary Finance and Insurance Services
Professional, Scientific and Technical …
Finance
Administrative Services
Rental and Hiring Services (except Real …
Building Cleaning, Pest Control and Other …
Internet Service Providers, Web Search …
Real Estate Services
Library and Other Information Services
Manjimup
Lockyer Valley
Gympie
Casino/Lismore

Collie SuperTown Combined Report
Final Draft Report
116
Appendix D: GRP Methodology
This document briefly outlines AECgroup’s methodology for developing 2010-11 Gross Regional Product (GRP) estimates for Manjimup.
Gross Domestic Product (GDP) and Gross State Product (GSP) figures are produced on a regular basis and published by the Australian Bureau of Statistics and the relevant State and Territory Government departments. However, regular official estimates of production for sub-State regions do not exist (Gross Regional Product, GRP9).
The Australian Bureau of Statistics (ABS) use three approaches to calculate GDP / GSP (Australian Bureau of Statistics, 2000):
Value added approach: represents the difference between taking the market value of the goods and services produced by an industry (gross output) and deducting the cost of goods and services used up by the industry in the productive process (intermediate consumption);
Income approach: calculates the cost of producing GRP by summing the incomes accruing from domestic production. These income components can be viewed as the market costs of production consisting of the compensation of employees (wages, salaries and supplements), provision for the consumption of fixed capital (depreciation), net operating surplus, and net indirect taxes; and
Expenditure approach: sums all final expenditures (ignoring expenditure on intermediate consumption) on goods and services, add on the contribution of exports and deduct the value of imports. Final expenditures are known as final demand and include final consumption expenditure by households, gross fixed capital expenditure by producers (i.e. durable assets), investment stocks and exports to the rest of the world.
Due to data limitations it is not possible to calculate GRP using the same approach as national or State values. As such, a different approach is required that effectively utilises national or State figures and attempts to apportion these estimates to the constituent regions.
There are a number of different “top-down” approaches that can be employed to disaggregate national or State estimates. AECgroup estimate GRP at factor cost using an indirect, top-down approach to disaggregate official State GSP totals from the State Accounts, utilising a number of data sources to apportion GSP to sub-regions. AECgroup’s approach is discussed in further detail below.
All GRP estimates, regardless of the approach, will be subject to a combination of any errors in the national/ State GSP estimates as well as those introduced by the methodology and data limitations used to allocate GSP to the constituent regions.
To allocate a State’s GSP to its constituent regions, a number of data sources are used, including State Accounts (ABS, 2010a), National Input-Output transaction tables (ABS, 2010b), the Census of Population and Housing (in particular employment by industry estimates by place of work) (ABS, 2010c), the Australian Labour Force Survey (ABS, 2011) and Small Area Labour Market data (DEEWR, 2011).
Disaggregation is undertaken through the following process:
Transaction tables for each region and the State of interest were generated from the 2006-07 national Input-Output transaction table to develop preliminary gross production estimates for each region. Estimates of gross production (by industry) in the study areas were developed based on the percent contribution to employment (by place of work) of the study areas to the Australian economy, and applied to Australian gross output identified in the 2006-07 Australian table. This provides gross
9 GRP at factor cost is that part of the cost of producing the gross regional product which consists of gross payments to factors of production (labour, land, capital and enterprise). It represents the value added by these
factors in the process of production and is equivalent to gross regional product less indirect taxes plus subsidies.

Collie SuperTown Combined Report
Final Draft Report
117
value added and gross product estimates across 111 industries, which are then aggregated to the 19 major ANZSIC categories plus ownership of dwellings.
2006-07 regional estimates developed from the transaction tables were equalized to State Account estimates of gross value added production by industry for the corresponding year (i.e., estimates were inflated/ deflated by an appropriate multiplier to ensure that aggregating each region would equate to the State figure for 2006-07).
Preliminary growth rates for the State and Statistical Divisions to 2010-11 for each industry were taken from the State Accounts figures (for the State) and regional differences in growth in employment by industry as outlined in the Labour Force Survey10 (for the SDs).
Preliminary growth estimates for each local government area of interest is generated based on growth in employment estimates between 2006-07 and 2010-11 as outlined in the Small Area Labour Market Data, with industry structure assumed to change from 2006-07 to 2010-11 in line with estimated change in structure for the SD in which it is located (i.e., if the SWDC region is estimated to have doubled its presence of construction since 2006-07, then this factor was applied to the 2006-07 industry contribution of construction to Manjimup).
All preliminary 2010-11 estimates were then equalized to the State Account estimates of gross value added production by industry using an appropriate multiplier to ensure that aggregating each region would equate to the State figure for 2010-11.
AECgroup’s methodology for estimating GRP is subject to the following key limitations:
The use of the transaction tables provides preliminary 2006-07 estimates across 111 industries which allows for a greater richness in industry composition (and differences in value add by industry) than the traditional 19 sector approach. However, this approach does assume that production functions for each of the 111 industries are the same across all regions.
The relative difference between each regions’ value add per employee and that of the State is assumed to remain relatively constant across regions and over time, which may not be an accurate reflection of regional differences and changes in the actual economy.
Annual employment counts in the Labour Force Survey and Small Area Labour Market data are based on usual place of residence, not place of work, which can misrepresent the actual level of employment in some regions and industries. To overcome this issue to some degree, AECgroup apply growth rates in these data sets only, rather than using these data sets to understand actual employment in each region.
These limitations can act to artificially inflate (or deflate) a region’s or industry’s GRP contributions. As such, the GRP estimates provided in this report should be used with caution, and are intended as a guide to the level of economic activity and growth in the region relative to other areas and the State.
10 A smoothing technique using a Henderson Moving Average is applied to the Labour Force Survey to remove
some of the volatility in this data series.

E [email protected] W www.aecgroupltd.com ABN 84 087 828 902
Economics, Planning & Development
Business Strategy & Finance
Community Research & Strategy
Design, Marketing & Advertising
Information & Knowledge Management