Noise Figure Measurements -...
57
Group/Presentation Title Agilent Restricted Month November, 2005 Noise Figure Measurements • Y-Factor • Cold source • Correcting for Source Impedance Mismatch • Correcting for Receiver Mismatch and Noise VNA Noise Figure Measurements • Setup (S) • Setting Input (Fwd) and Output (Rev) Powers • Choosing Noise Bandwidth • Setting Noise Averaging Factor • Choosing the Receiver Gain Setting Objectives
Transcript of Noise Figure Measurements -...

Group/Presentation TitleAgilent Restricted
Month November, 2005
Noise Figure Measurements
• Y-Factor
• Cold source
• Correcting for Source Impedance Mismatch
• Correcting for Receiver Mismatch and Noise
VNA Noise Figure Measurements
• Setup (S)
• Setting Input (Fwd) and Output (Rev) Powers
• Choosing Noise Bandwidth
• Setting Noise Averaging Factor
• Choosing the Receiver Gain Setting
Objectives

Group/Presentation TitleAgilent Restricted
Month November, 2005
Calibration
• Noise Source Calibration (S)
• S-parameter Calibration (S)
• Noise Tuner Calibration (S)
Measurement
• Noise Figure Formats (S)
• Noise Factor
• Noise Figure
• Noise Temperature
• Noise Power Density
Objectives (cont)
Group/Presentation TitleAgilent Restricted
Month November, 2005
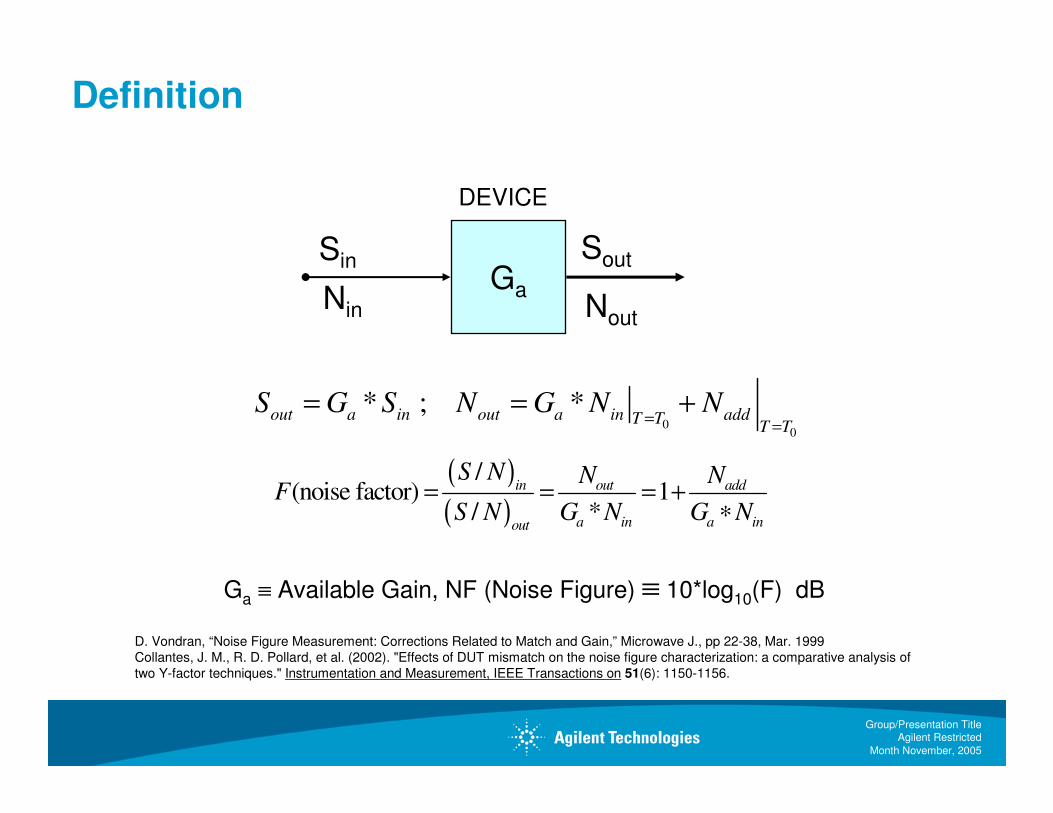
Definition
( )
( )
/(noise factor) 1
/ *= = = +
∗
in out add
a in a inout
S N N NF
S N G N G N
Ga
Sin
Nin Nout
Sout
00
* ; *=
=
= = +out a in out a in addT T
T T
S G S N G N N
DEVICE
Ga ≡ Available Gain, NF (Noise Figure) ≡ 10*log10(F) dB
D. Vondran, “Noise Figure Measurement: Corrections Related to Match and Gain,” Microwave J., pp 22-38, Mar. 1999
Collantes, J. M., R. D. Pollard, et al. (2002). "Effects of DUT mismatch on the noise figure characterization: a comparative analysis of
two Y-factor techniques." Instrumentation and Measurement, IEEE Transactions on 51(6): 1150-1156.

Group/Presentation TitleAgilent Restricted
Month November, 2005
Definition in Terms of Noise Temperature
0
1*
= = +out e
a in
N TF
G N T
T0 Nout
0* ; * * *= ∗ =in add a e
N k T B N G k T B
DEVICE
0
-23
290 ; bandwidth
Boltzmann's constant = 1.380 6505×10 joule/kelvin
effective input noise temperature of device
≡ ≡
≡
≡e
T K B
k
T
Te, Ga

Group/Presentation TitleAgilent Restricted
Month November, 2005
Definition In Terms Of Noise Parameters
2
si sYn
e
ni
Noiseless
two-port
( )
2
2
min min 2 20
4
1 1
Γ − Γ = + − = +
+ Γ − Γ
opt sn ns opt
s opt s
R RF F Y Y F
G Z
2
si sYNoisy
two-port
IRE Subcommittee 7.9 On Noise: “Representation Of Noise In Linear Two-ports,” Proc. IRE, Vol. 48, Pp. 69-74, Jan. 1960

Group/Presentation TitleAgilent Restricted
Month November, 2005
Noise parameters Definition (cont)
Γopt ≡ optimum input noise matchZ0 = reference impedance
Γs = source match
( )
2
2
min min 2 20
4
1 1
Γ − Γ = + − = +
+ Γ − Γ
opt sn ns opt
s opt s
R RF F Y Y F
G Z
Yopt ≡ optimum input admittanceYs = source admittanceGs = real part of Ys
Fmin ≡ minimum noise factor
Rn ≡ noise resistance

Group/Presentation TitleAgilent Restricted
Month November, 2005
Noise Source ENR – Excess Noise Ratio
h c
10
0
T TENR 10log
T
−≡
Th = Hot Noise Temperature
Tc = Cold Noise TemperatureT0 = 290 K
Tc = T0 when noise sources are calibrated by reference labs.
Noise sources��346C 10 MHz – 26.5 GHz

Group/Presentation TitleAgilent Restricted
Month November, 2005
Y factor Method
( )0 0
*1 1
* 1 *
−= = + = +
−
out e hot cold
a in
N T T Y TF
G N T Y T
Thot
Pout
DEVICE
Te, GaTcold
Pout,hot=kBGa(Thot + Te)Pout,cold=kBGa(Tcold + Te)
,
,
1
out hot hot colde
out cold
P T YTY T
P Y
−= =
−
Assumes ALL Reflections are the same.
“Fundamentals of RF and Microwave Noise Figure Measurements,” Hewlett-Packard Application Note 57-1, Palo Alto, CA July 1983

Group/Presentation TitleAgilent Restricted
Month November, 2005
Actual Y factor Measurement Calibration
Ga(R)
Thot
Nout(R)
RECEIVER
Te(R)Tcold
Pout
Γi(rec)
Γs(cold)
Γs(hot)
Receiver Calibration
( )( ) ( )
( )
( ) 0 0
*1 1
* 1 *Γ
−= = + = +
−s
out R e R hot coldR
a R in
N T T Y TF
G N T Y T
Assumes Γs(hot) = Γs(cold)

Group/Presentation TitleAgilent Restricted
Month November, 2005
The Early Days

Group/Presentation TitleAgilent Restricted
Month November, 2005
Actual Y factor Measurement
Ga(D)
Thot
Nout(D)
DEVICE
Te(D)Tcold Nout(all)
RECEIVER
Pout
Γs(hot)
Γs(cold) Γo(device) Γi(rec)
Γi(device)
Ga(R)Te(R)
( )( )
0
*1
1 *Γ
−= +
−s
hot coldall
T Y TF
Y T
( )( )
( ) ( )
( )
1Γ
Γ
−= −
o device
s
R
device all
a D
NFF NF
G
Note that ( )( ) ( )Γ Γ
≠o device sR R
F F

Group/Presentation TitleAgilent Restricted
Month November, 2005
Some Y factor Measurement Assumptions
( ) ( )
( )
( ) ( )
−=
−
hot all cold all
a device
hot R cold R
N NG
N N
( )( ) ( )Γ Γ=
o device sR RF F
( ) ( )Γ = Γs hot s cold
Notes:
Ga (available gain) is a function of S11, S22 and Γs
Γs ≡ source reflection of the incident signal
True only if S11 and S22 are <<1

Group/Presentation TitleAgilent Restricted
Month November, 2005
Using the ESA to measure Noise Figure:Requires option 219

Group/Presentation TitleAgilent Restricted
Month November, 2005
Using the ESA to measure Noise Figure
Step 1: Setup frequencies, averaging, number of points
Step 2: Connect the Noise source, and Calibrate
Step 3: Connect the Amplifier (DUT) between the Noise Source and the ESA, and measure the Noise Figure
Data may be saved to a floppy disc
The data can be in CSV (comma separated) or as a .GIF
For more Training see document:
S800NFSA.pdf

Group/Presentation TitleAgilent Restricted
Month November, 2005
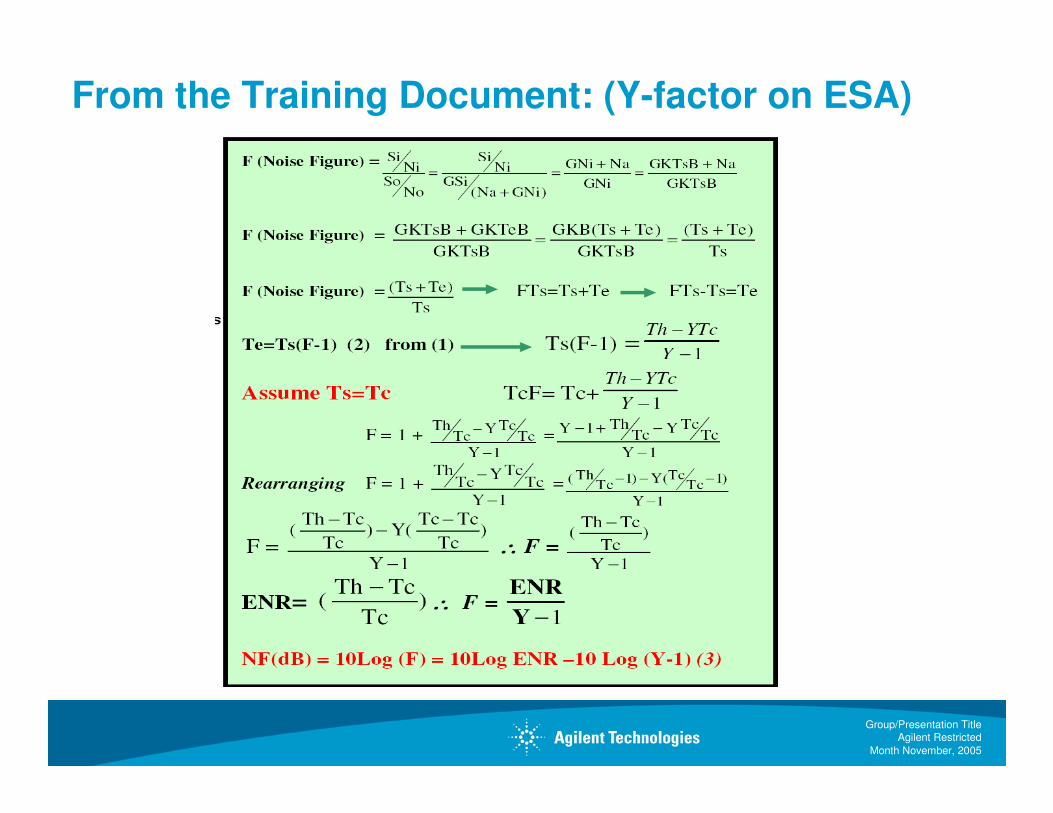
From the Training Document: (Y-factor on ESA)
Group/Presentation TitleAgilent Restricted
Month November, 2005
From the Training Document: (Y-factor on ESA)

Group/Presentation TitleAgilent Restricted
Month November, 2005
From the Training Document: Entering ENR data

Group/Presentation TitleAgilent Restricted
Month November, 2005
From the Training Document: Correcting for Second Stage Noise

Group/Presentation TitleAgilent Restricted
Month November, 2005
From the Training Document: How does the ESA measure gain?

Group/Presentation TitleAgilent Restricted
Month November, 2005
Let’s look at some measurement results:
LNA: 26.5 GHz, ~1.5 dB NF, 15 dB Gain, S11~2-3 dB (bad)

Group/Presentation TitleAgilent Restricted
Month November, 2005
You can also use an NFA (Noise Figure Analyzer) in a very similar way:
SA base optimized for NF measurements:
Includes low noise pre-amp for all frequencies
Optimized IF path amplifiers/attenuators for best response
Specialized NF digitizer for faster response.

Group/Presentation TitleAgilent Restricted
Month November, 2005
Same Amplifier: Measurement Results
12:04:11 Oct 31, 2007
A:TST00122.GIF file saved
Load
Save
File Manager
File
DUT Amplifier Sys Downconv Off
10.00
NFIGScale/1.000
dB
0.000
20.00
GAINScale/2.000
dB
0.000
Start 250.00 MHz BW 4 MHz Points 201 Stop 26.50000 GHz
Tcold 302.43 K Avgs 2 Att 0/0 dB Loss Off Corr

Group/Presentation TitleAgilent Restricted
Month November, 2005
Comparison: ESA to NFA (noise figure)
0
1
2
3
4
5
6
7
8
9
10
1.0 26.0 51.0 76.0 101.0 126.0 151.0 176.0 201.0
ESA-NF
NFA-NF

Group/Presentation TitleAgilent Restricted
Month November, 2005
Comparison: ESA to NFA (Available Gain)
0
2
4
6
8
10
12
14
16
18
20
1.0 26.0 51.0 76.0 101.0 126.0 151.0 176.0 201.0
ESA-Gain
NFA-Gain

Group/Presentation TitleAgilent Restricted
Month November, 2005
Newer techniques: Using PNA-X (VNA) to measure noise figure
Full VNA PLUS Noise Figure reciever.
Group/Presentation TitleAgilent Restricted
Month November, 2005
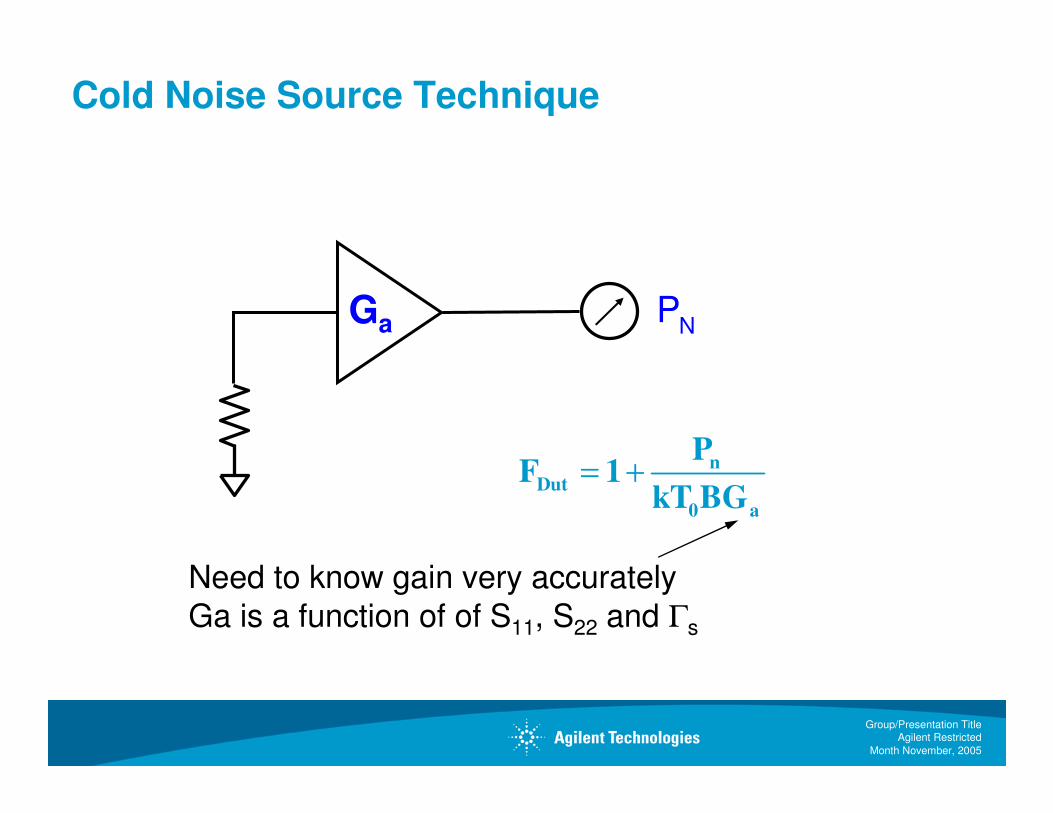
Cold Noise Source Technique
Ga PN
n
Dut
0 a
PF 1
kT BG= +
Need to know gain very accurately
Ga is a function of of S11, S22 and Γs

Group/Presentation TitleAgilent Restricted
Month November, 2005
T = Tcal
PN
T ~ 10,000K
DUT
T = Tmeas
PN
Calibrate
Measure
Cold Noise Figure Cal and Measurement
kGB k Gain Bandwidth= ⋅ ⋅
hot cold
hot cold
P PkGB
T T
−=
−
hot 0
r
nhot0
ncold
T T 1F
PT1
P
−= ⋅
−
n
Dut r
a
P1F F 1
G kGB
= ⋅ − +
ΓsΓo(device)
Γi(rec)
Γi(device)

Group/Presentation TitleAgilent Restricted
Month November, 2005
Noise parameters Definition
Γopt ≡ optimum input noise matchZ0 = reference impedance
Γs = source match
( )
2
2
min min 2 20
4
1 1
Γ − Γ = + − = +
+ Γ − Γ
opt sn ns opt
s opt s
R RF F Y Y F
G Z
Yopt ≡ optimum input admittanceYs = source admittanceGs = real part of Ys
Fmin ≡ minimum noise factorRn ≡ noise resistance

Group/Presentation TitleAgilent Restricted
Month November, 2005
Noise parameters Definition –Noise Temperature
Γopt ≡ optimum input noise matchZ0 = reference impedance
Γs = source match
( )
( )
2 2
0 0min min 2 2
0
4
1 1
− Γ − Γ= + = +
+ Γ − Γ
n s opt opt snn
s opt s
R T Y Y T RT T T
G Z
Yopt ≡ optimum input admittanceYs = source admittanceGs = real part of Ys
Tmin ≡ minimum noise Temperature
Rn ≡ noise resistance
T0 ≡ 290°K
Group/Presentation TitleAgilent Restricted
Month November, 2005
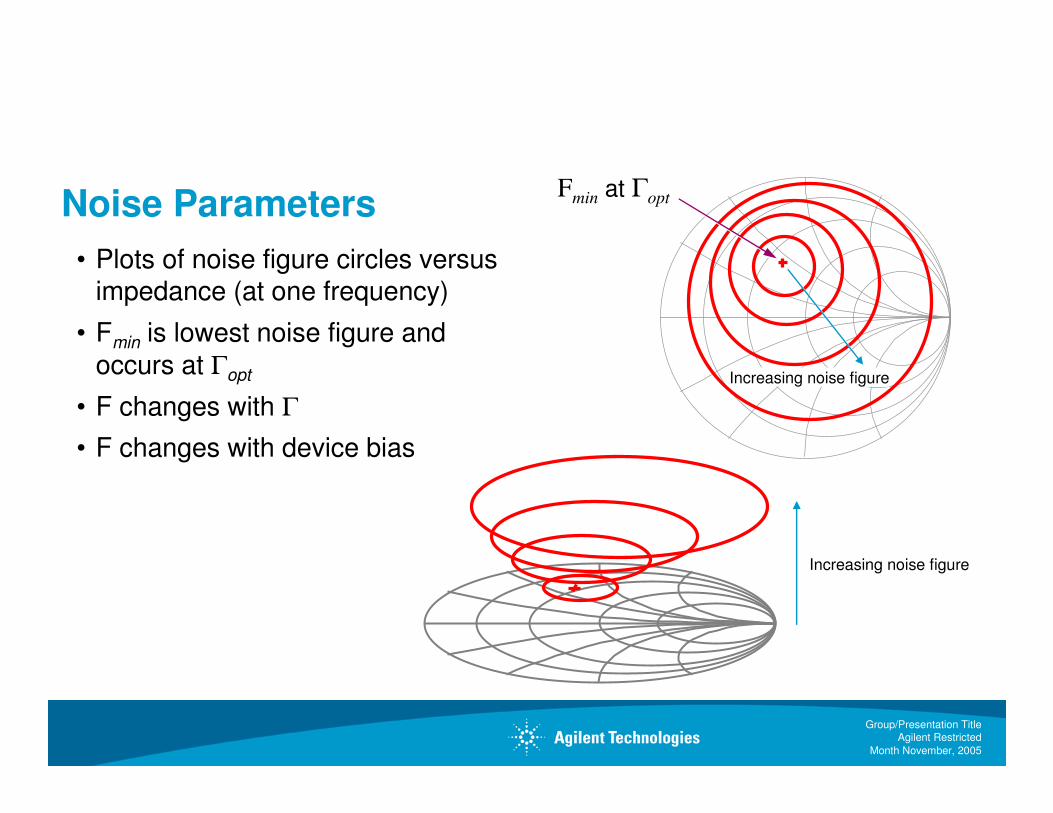
• Plots of noise figure circles versus impedance (at one frequency)
• Fmin is lowest noise figure and
occurs at Γopt
• F changes with Γ
• F changes with device bias
Noise ParametersFmin at Γopt
Increasing noise figure
Increasing noise figure

Group/Presentation TitleAgilent Restricted
Month November, 2005
Noise wave representations
a1
b1
a2
b2[S]
bn1bn2
11 11 12 1
22 21 22 2
n
n
bb s s a
bb s s a
= +
P. Penfield, Jr "Wave Representation of Amplifier Noise." IRE Transactions On Circuit Theory: Mach (1962) pp. 84-86
K. Hartmann, “Noise Characterization of Linear Circuits,” IEEE Transactions on Circuits and Systems, Vol. cAS-23, No. 10, Oct. 1976, pp. 581-590
R.P. Meys, “A Wave Approach to the Noise Properties of Linar Microwave Devices,” IEEE Transactions on Microwave Theory and Techniques, Vol.
MTT-26, No. 1, Jan. 1978, pp 34-37
S. W. Wedg ,and D. B. Rutledge (1992). "Wave techniques for noise modeling and measurement." Microwave Theory and Techniques, IEEE
Transactions on 40(11): 2004-2012.

Group/Presentation TitleAgilent Restricted
Month November, 2005
Noise correlation matrix – S-parameters
2 *
1 1 2 11 12
2*21 22
2 1 2
C
= =
n n n
s
n n n
b b b cs cs
cs csb b b

Group/Presentation TitleAgilent Restricted
Month November, 2005
Noise wave representations – T parameters
11 11 12 2
11 21 22 2
n
n
aa t t b
bb t t a
= +
a1
b1
a2
b2[Tn]
an1
bn1

Group/Presentation TitleAgilent Restricted
Month November, 2005
Noise correlation matrix – T-parameters
2 *
1 1 1 11 12
2*21 22
1 1 1
C
= =
n n n
t
n n n
a a b ct ct
ct ctb a b

Group/Presentation TitleAgilent Restricted
Month November, 2005
Noise Wave and Cascading Networks
a1a
b1a a2a
b2a
[Tna]
ana
bna
a1b
b1b a2b
b2b
[Tnb]
anb
bnb
[ Tnc ] = [ Tna ] [ Tnb ]
[ Ctc ] = [ Cta ] + [ Tna ] [ Ctb ] [ Tna ]T

Group/Presentation TitleAgilent Restricted
Month November, 2005
Noise correlation matrix (S) in terms of noise parameters
( )( ) ( )( )
( )( )
2
2 11 11
min 11 21 min 112 2
0 0
2
211
21 min 11 21 min2 2
0 0
1 4 141 1 1
1 1
4 1 41 1
1 1
sC
− Γ Γ − Γ − − + − − + Γ + Γ
= Γ − Γ Γ − − − + Γ + Γ
opt n opt optn
opt opt
n opt opt n opt
opt opt
S R SRF s S F S
Z Z
R S RS F S S F
Z Z

Group/Presentation TitleAgilent Restricted
Month November, 2005
Measurement using (S) noise matrix
( )
( )
2 22
121
2 2 *11 11 2 11 3
2 *2 2 1 222 12
1 1 11 2 32 2 * *
21 2121 21
1
1 1 2 Re 1
, ,
− Γ + Γ + = − Γ − Γ + − Γ Γ
= = = = = =
s s s
out
s s s s
n n nn
T XkB SP
S S X S X
b b bcs csX b cs X X
S SS S
Noise output power from two-port is
assumes termination is ideal
J. Randa, W. Wiatr, “Monte Carlo Estimation of Noise Parameter Uncertainties,” IEE Proc. Sci. Meas. Technology, Vol. 149, No. 6, Nov. 2002, pp. 333-337
Group/Presentation TitleAgilent Restricted
Month November, 2005
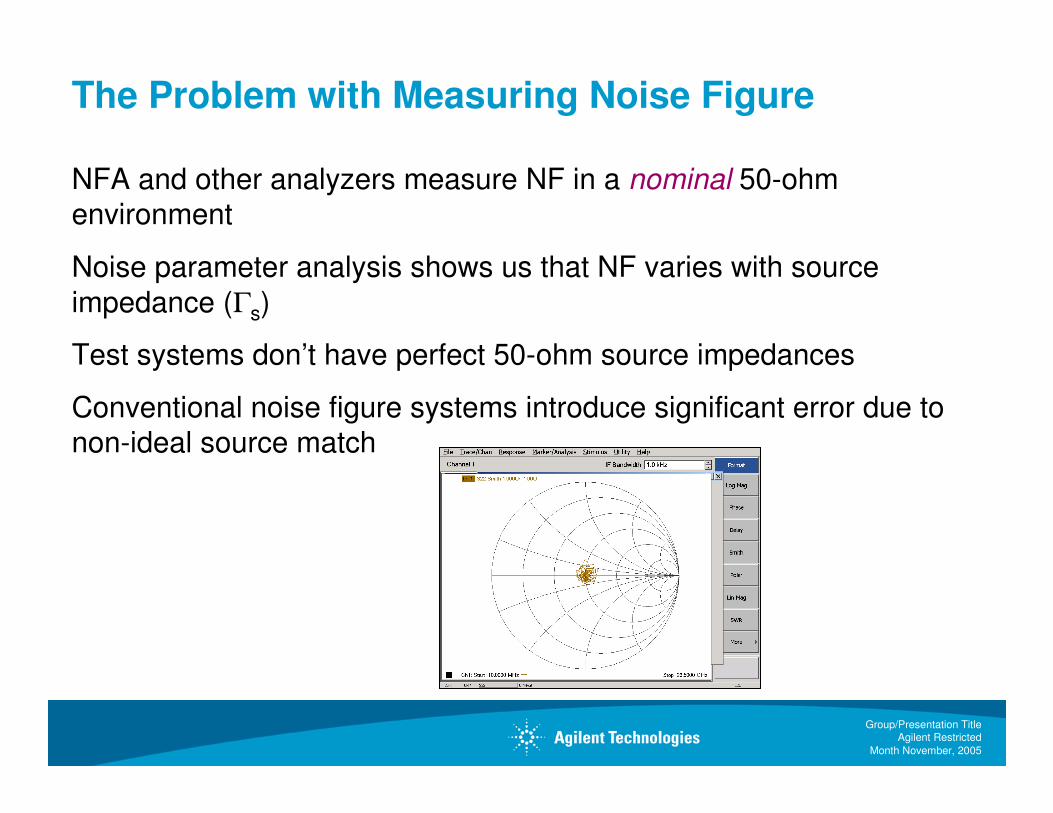
The Problem with Measuring Noise Figure
NFA and other analyzers measure NF in a nominal 50-ohm
environment
Noise parameter analysis shows us that NF varies with source
impedance (Γs)
Test systems don’t have perfect 50-ohm source impedances
Conventional noise figure systems introduce significant error due to
non-ideal source match

Group/Presentation TitleAgilent Restricted
Month November, 2005
New Noise Measurement System
DUT
Noise Tuner
Noise Receiver
Inside
ADAPTER Noise Source

Group/Presentation TitleAgilent Restricted
Month November, 2005
Test port 1
R1
Source 1
OUT 1OUT 2
Source 2
OUT 1 OUT 2
Test port 2
R2
35 dB
65 dB
65 dB
Rear panel
A
35 dB
B
Source 2
Output 1
Source 2
Output 2
Noise receivers
10 MHz -3 GHz
3 - 26.5 GHz
DUT
Noise Source
28V DC

Group/Presentation TitleAgilent Restricted
Month November, 2005
Calibration of the receiver
5 unknowns, linear equation
i
( )
( )
2 2
2 2
1
2 21
*11 11 11
2
211
1 1 2 Re 1
− Γ + Γ + = − Γ − Γ + − Γ Γ
s s s
out
s s s s
TkP
X S
X
S XS
B S
Note: The PNA-X uses a different form of the above equation.

Group/Presentation TitleAgilent Restricted
Month November, 2005
S11P1
S21P1
S11S22
S21
S12
“DUT”
S12P1
S22P1
S11P2
S21P2
S12P2
S22P2S11D S22D
S21D
S12D
PROBE 1 ACTUAL DUT PROBE 2
[ TA ]
[ TAD ] [ TP2 ][ TP1 ]
Probe or Fixture De-embedding – S-Parameters
[ TA ] = [ TP1 ]∗∗∗∗[ TAD ]∗∗∗∗[ TP2 ]
[ TAD ] = [ TP1 ]-1∗∗∗∗[ TA ]∗∗∗∗[ TP2 ]-1
41
41
1 2 3 4

Group/Presentation TitleAgilent Restricted
Month November, 2005
S11P1
S21P1
S11S22
S21
S12
S12P1
S22P1
S11P2
S21P2
S12P2
S22P2S11D S22D
S21D
S12D
[ TA ]
[ TAD ] [ TP2 ][ TP1 ]
Probe or Fixture De-embedding – Nose-Parameters
[CtA]
[CtP2][CtAD][CtP1]
T
1 1 1combined 2C C T C T= + i i
Noise Correlation Matrix Propagation:

Group/Presentation TitleAgilent Restricted
Month November, 2005
PNA-X: “Noise Pulling”
PNA-X will vary source match around 50 ohms using an ECal module (source pull)
With resulting noise-figure circle and vector error terms, very accurate 50-ohm noise figure (NF50) can be calculated
Initial implementation will not provide full noise-parameter analysis, as the range of source impedances is too small (won’t cover enough of Smith chart)
F1, F2, …

Group/Presentation TitleAgilent Restricted
Month November, 2005
Data Comparison: PNA vs ESA or NFA (Noise Fig.)
0
1
2
3
4
5
6
7
8
9
10
0.3 3.5 6.8 10.1 13.4 16.7 19.9 23.2 26.5
PNA-NF
ESA-NF
NFA-NF

Group/Presentation TitleAgilent Restricted
Month November, 2005
Data Comparison: PNA vs ESA or NFA (Gain)
0
2
4
6
8
10
12
14
16
18
20
0.3 3.5 6.8 10.1 13.4 16.7 19.9 23.2 26.5
PNA-S21
ESA-Gain
NFA-Gain

Group/Presentation TitleAgilent Restricted
Month November, 2005
Noise Figure Uncertainty Example (ATE Setup)
2.000
2.500
3.000
3.500
4.000
4.500
0.5 2.5 4.5 6.5 8.5 10.5 12.5 14.5 16.5 18.5 20.5 22.5 24.5 26.5
GHz
NF
(d
B)
PNA-X
Y-factor with noise source connected to DUT via switch
matrix
Amplifier:Gain = 15 dB
Input/output match = 10 dBNF = 3 dB
Gamma opt = 0.268 ∠ 0o
Fmin = 1.87 dB
Rn = 12 – 33
0.2 dB
0.75 dB
0.5 dBY-factor with noise source
directly at DUT input

Group/Presentation TitleAgilent Restricted
Month November, 2005
References:
[1] D. Vondran, “Noise Figure Measurement: Corrections Related to Match and Gain,” Microwave J., pp 22-38, Mar. 1999
[2] Collantes, J. M., R. D. Pollard, et al. (2002). "Effects of DUT mismatch on the noise figure characterization: a comparative analysis of two Y-factor techniques." Instrumentation and Measurement, IEEE Transactions on 51(6): 1150-1156.
[3] “Fundamentals of RF and Microwave Noise Figure Measurements,” Hewlett-Packard Application Note 57-1, Palo Alto, CA July 1983
[4] IRE Subcommittee 7.9 On Noise: “Representation Of Noise In Linear Two-ports,” Proc. IRE, Vol. 48, Pp. 69-74, Jan. 1960
[4] A. C. Davidson, B. W. Leake, et al. (1989). "Accuracy improvements in microwave noise parameter measurements." Microwave Theory and Techniques, IEEE Transactions on 37(12): 1973-1978.
[5] R.Q. Lane, “The Determination of Device Noise Parameters,” Proceedings of the IEEE, Aug. 1969, pp. 1461-1462
[6] P. Penfield, Jr "Wave Representation of Amplifier Noise." IRE Transactions On Circuit Theory: Mach (1962) pp. 84-86
[7] K. Hartmann, “Noise Characterization of Linear Circuits,” IEEE Transactions on Circuits and Systems, Vol. cAS-23, No. 10, Oct. 1976, pp. 581-590
[8] R.P. Meys, “A Wave Approach to the Noise Properties of Linar Microwave Devices,” IEEE Transactions on Microwave Theory and Techniques, Vol. MTT-26, No. 1, Jan. 1978, pp 34-37
[9] S. W. Wedg ,and D. B. Rutledge (1992). "Wave techniques for noise modeling and measurement." Microwave Theory and Techniques, IEEE Transactions on 40(11): 2004-2012.
[10] J. Randa, W. Wiatr, “Conte Carlo Estimation of Noise Parameter Uncertainties,” IEE Proc. Sci. Meas. Technology, Vol. 149, No. 6, Nov. 2002, pp. 333-337
[11] E.C. Valk, D. Routledge, J.F. Vaneldik, T.L. Landecker, “De-Embedding Two-Port Noise Parameters Using a Noise Wave Model,” IEEE Transactions on Instrumentation and Measurement, vol. 37, no. 2, June 1988, pp 195-200

Group/Presentation TitleAgilent Restricted
Month November, 2005
Calibration of receiver- solution of equations
Require Minimum Of 5 Equations To Solve
Can Be Over-determined
At Least One Measurement Must Be Made With Different Source Temperature
Use Noise Source (Known ENR, Measure ΓCold, ΓHot)
ECal Module Provides 7 Terminations

Group/Presentation TitleAgilent Restricted
Month November, 2005
Noise Figure Mode Instrument Default Settings
S-parameter Mode Source Power � -30 dBm
Noise RF BW � 4 MHz
Noise IF BW � 2 MHz
Noise Averaging � Point to Point (1 = 10K)
Noise Receiver Gain � 30 dB
Factory Receiver Cal � ON

Group/Presentation TitleAgilent Restricted
Month November, 2005
Noise Figure Measurement Instrument Setup

Group/Presentation TitleAgilent Restricted
Month November, 2005
Noise Measurement Softkeys

Group/Presentation TitleAgilent Restricted
Month November, 2005
Noise Set Up

Group/Presentation TitleAgilent Restricted
Month November, 2005
Noise Set Up

Group/Presentation TitleAgilent Restricted
Month November, 2005
Noise Figure Measurement Calibration

Group/Presentation TitleAgilent Restricted
Month November, 2005
Noise Cal

ERROR: stackunderflow
OFFENDING COMMAND: ~
STACK: