NOISE AND FLIGHT PATH MONITORING SYSTEM
191
Department of Defence RAAF BASE DARWIN NOISE AND FLIGHT PATH MONITORING SYSTEM Q2 2011 REPORT
Transcript of NOISE AND FLIGHT PATH MONITORING SYSTEM

Department of
Defence
RAAF BASE DARWIN
NOISE AND FLIGHT PATH MONITORING SYSTEM
Q2 2011 REPORT

ii
14 March 2012 RAAF Base Darwin – Noise and Flight Path Monitoring System Q2 2011 Report File name: DWN NFPMS Q2 2011 Report V2.1.doc
Disclaimer
This report contains a summary of data collected over the specified period and is intended to
convey the best information available from the NFPMS at the time. The system databases are
to some extent dependent upon external sources and errors may occur. All care is taken in
preparation of the report but its complete accuracy cannot be guaranteed. The Department of
Defence and the NFPMS project contractors do not accept any legal liability for any losses
arising from reliance upon data in this report which may be found to be inaccurate.
The NFPMS does not provide “Aircraft noise levels” as defined in AS2021-2000.


iv
14 March 2012 RAAF Base Darwin – Noise and Flight Path Monitoring System Q2 2011 Report File name: DWN NFPMS Q2 2011 Report V2.1.doc
BLANK PAGE

v
RAAF Base Darwin – Noise and Flight Path Monitoring System 14 March 2012 File name: DWN NFPMS Q2 2011 Report V2.1.doc Q2 2011 Report
RAAF BASE DARWIN
Noise and Flight Path Monitoring System
Q2 2011 Report
Executive Summary
The Department of Defence has engaged Bruel & Kjaer EMS (Australia) Pty Ltd to install,
maintain and operate a noise and flight path monitoring system at RAAF Base Darwin, NT.
The objective of the RAAF Base Darwin Noise and Flight Path Monitoring System (DAR
NFPMS) project is to monitor and record flight information and the noise levels of aircraft
operations. The system provides detailed information on aircraft noise events and assists the
Department of Defence to communicate details of the flying activities to the community.
During the operational reporting period, 1 April – 30 June 2011, the DAR NFPMS recorded a
total of 24,191 aircraft movements; being 10,758 (44.5%) arrivals, 10,726 (44.3%) departures
and 2,707 (11.2%) circuit movements. Of the 24,191 recorded aircraft movements, 91 (0.4%)
were by Military Fast Jets, 112 (0.5%) by Military Other, 203 (0.8%) by Military Propeller
Aircraft, and 3 (0.01%) by Military Helicopters. 15,053 (62.2%) of the recorded aircraft
movements were by civil aircraft. Unidentified aircraft accounted for 8,729 (36.1%) of the
recorded aircraft movements.
Runway 11 was the dominant runway accounting for 16,975 (70.2%) of the recorded aircraft
movements.
The aircraft noise exposure levels vary from day to day. Annex C presents the range of noise
levels recorded at the community based NMTs.
During Quarter 2 2011 the logarithmic average of the 24 hour LAeq levels recorded were
52.1dB(A) at the Berrimah Farm NMT, 43.1dB(A) at Karama Primary School NMT,
42.8dB(A) at Jingili Primary School NMT and 55.6 dB(A) at Ludmilla Primary School NMT.
Similarly the average N70 for all recorded aircraft at the four NMTs varied from 2.8 at the
Berrimah Farm NMT to 4.6 at the Ludmilla Primary School NMT, whilst for military
operational days the average N70 varied from 0.2 at Karama Primary School NMT to 0.6 at
Ludmilla Primary School NMT for military aircraft.
Further information on aircraft noise is detailed in Chapter 3 – Aircraft Noise.

vi
14 March 2012 RAAF Base Darwin – Noise and Flight Path Monitoring System Q2 2011 Report File name: DWN NFPMS Q2 2011 Report V2.1.doc
BLANK PAGE

vii
RAAF Base Darwin – Noise and Flight Path Monitoring System 14 March 2012 File name: DWN NFPMS Q2 2011 Report V2.1.doc Q2 2011 Report
RAAF Base Darwin
Noise and Flight Path Monitoring System
Q2 2011 Report
TABLE OF CONTENTS PAGE
Executive Summary v
1. INTRODUCTION 1
1.1 RAAF Base Darwin Noise and Flight Path Monitoring System 1
1.2 RAAF Base Darwin 1
1.3 The NFPMS Components 10
2. AIRCRAFT OPERATIONS 15
2.1 Aircraft Movements 15
2.2 Aircraft Flight Tracks 19
3. AIRCRAFT NOISE 123
3.1 Measurement of Aircraft Noise 123
3.2 Factors Affecting the Propagation of Aircraft Noise 128
3.3 Noise Environment at RAAF Base Darwin 130
ANNEXES
A. Glossary
B. Aircraft Movement Details
C. Community Exposure to Aircraft Noise
viii
14 March 2012 RAAF Base Darwin – Noise and Flight Path Monitoring System Q2 2011 Report File name: DWN NFPMS Q2 2011 Report V2.1.doc
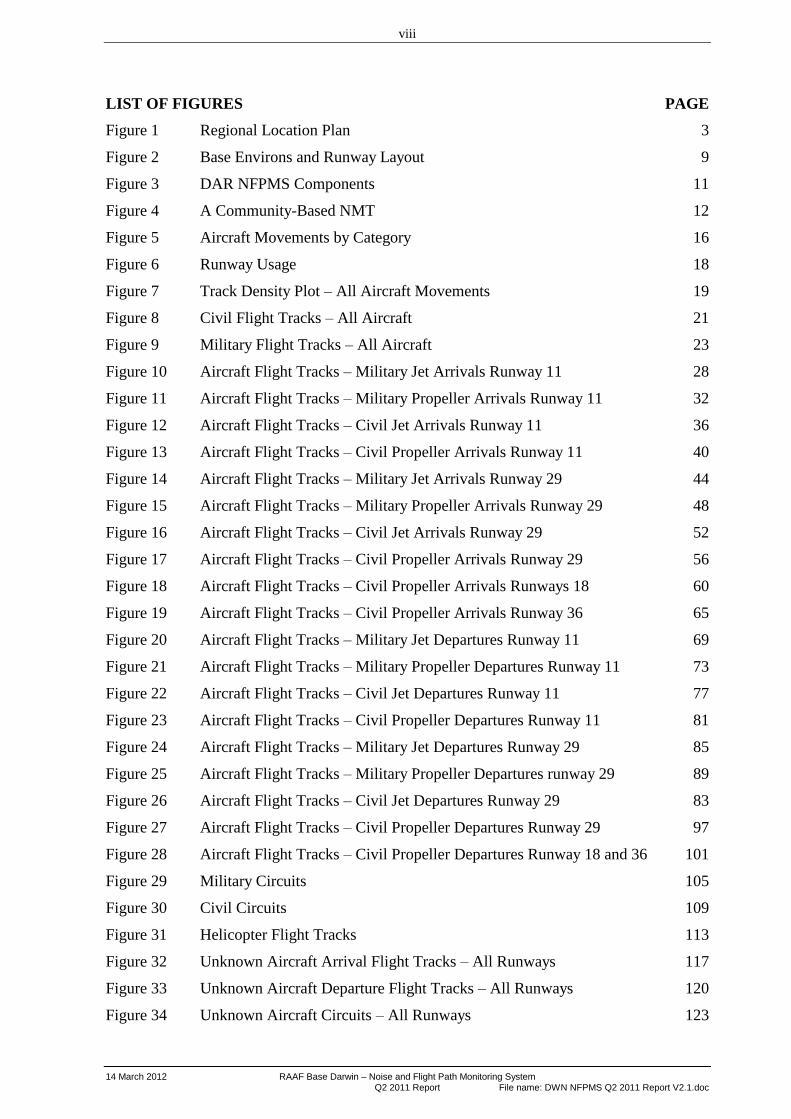
LIST OF FIGURES PAGE
Figure 1 Regional Location Plan 3
Figure 2 Base Environs and Runway Layout 9
Figure 3 DAR NFPMS Components 11
Figure 4 A Community-Based NMT 12
Figure 5 Aircraft Movements by Category 16
Figure 6 Runway Usage 18
Figure 7 Track Density Plot – All Aircraft Movements 19
Figure 8 Civil Flight Tracks – All Aircraft 21
Figure 9 Military Flight Tracks – All Aircraft 23
Figure 10 Aircraft Flight Tracks – Military Jet Arrivals Runway 11 28
Figure 11 Aircraft Flight Tracks – Military Propeller Arrivals Runway 11 32
Figure 12 Aircraft Flight Tracks – Civil Jet Arrivals Runway 11 36
Figure 13 Aircraft Flight Tracks – Civil Propeller Arrivals Runway 11 40
Figure 14 Aircraft Flight Tracks – Military Jet Arrivals Runway 29 44
Figure 15 Aircraft Flight Tracks – Military Propeller Arrivals Runway 29 48
Figure 16 Aircraft Flight Tracks – Civil Jet Arrivals Runway 29 52
Figure 17 Aircraft Flight Tracks – Civil Propeller Arrivals Runway 29 56
Figure 18 Aircraft Flight Tracks – Civil Propeller Arrivals Runways 18 60
Figure 19 Aircraft Flight Tracks – Civil Propeller Arrivals Runway 36 65
Figure 20 Aircraft Flight Tracks – Military Jet Departures Runway 11 69
Figure 21 Aircraft Flight Tracks – Military Propeller Departures Runway 11 73
Figure 22 Aircraft Flight Tracks – Civil Jet Departures Runway 11 77
Figure 23 Aircraft Flight Tracks – Civil Propeller Departures Runway 11 81
Figure 24 Aircraft Flight Tracks – Military Jet Departures Runway 29 85
Figure 25 Aircraft Flight Tracks – Military Propeller Departures runway 29 89
Figure 26 Aircraft Flight Tracks – Civil Jet Departures Runway 29 83
Figure 27 Aircraft Flight Tracks – Civil Propeller Departures Runway 29 97
Figure 28 Aircraft Flight Tracks – Civil Propeller Departures Runway 18 and 36 101
Figure 29 Military Circuits 105
Figure 30 Civil Circuits 109
Figure 31 Helicopter Flight Tracks 113
Figure 32 Unknown Aircraft Arrival Flight Tracks – All Runways 117
Figure 33 Unknown Aircraft Departure Flight Tracks – All Runways 120
Figure 34 Unknown Aircraft Circuits – All Runways 123
ix
RAAF Base Darwin – Noise and Flight Path Monitoring System 14 March 2012 File name: DWN NFPMS Q2 2011 Report V2.1.doc Q2 2011 Report
Figure 35 NMT Location Plan 133

x
14 March 2012 RAAF Base Darwin – Noise and Flight Path Monitoring System Q2 2011 Report File name: DWN NFPMS Q2 2011 Report V2.1.doc
LIST OF TABLES PAGE
Table 1 Recorded Aircraft Movements by Category – Quarter 4 2010 15
Table 2 Quarterly Aircraft Movements by Category 17
Table 3 Runway Usage – Quarter 4 2010 18
Table 4 Average 24 Hour LAeq Aircraft Noise– Quarter 4 2010 141
Table 5 Quarterly Average 24 Hour LAeq 142
Table 6 Average LAmax – Arrivals – Quarter 4 2010 143
Table 7 Average LAmax – Departures – Quarter 4 2010 145
Table 8 Average LAmax – Circuits – Quarter 4 2010 147
Table 9 N70 and N85 Noise Events for All Aircraft for Quarter 4 2010 148
Table 10 N70 and N85 Noise Events for Military Aircraft for Quarter 4 2010 148
Table 11 N70 and N85 Noise Events for Civil Aircraft for Quarter 4 2010 149
xi
RAAF Base Darwin – Noise and Flight Path Monitoring System 14 March 2012 File name: DWN NFPMS Q2 2011 Report V2.1.doc Q2 2011 Report
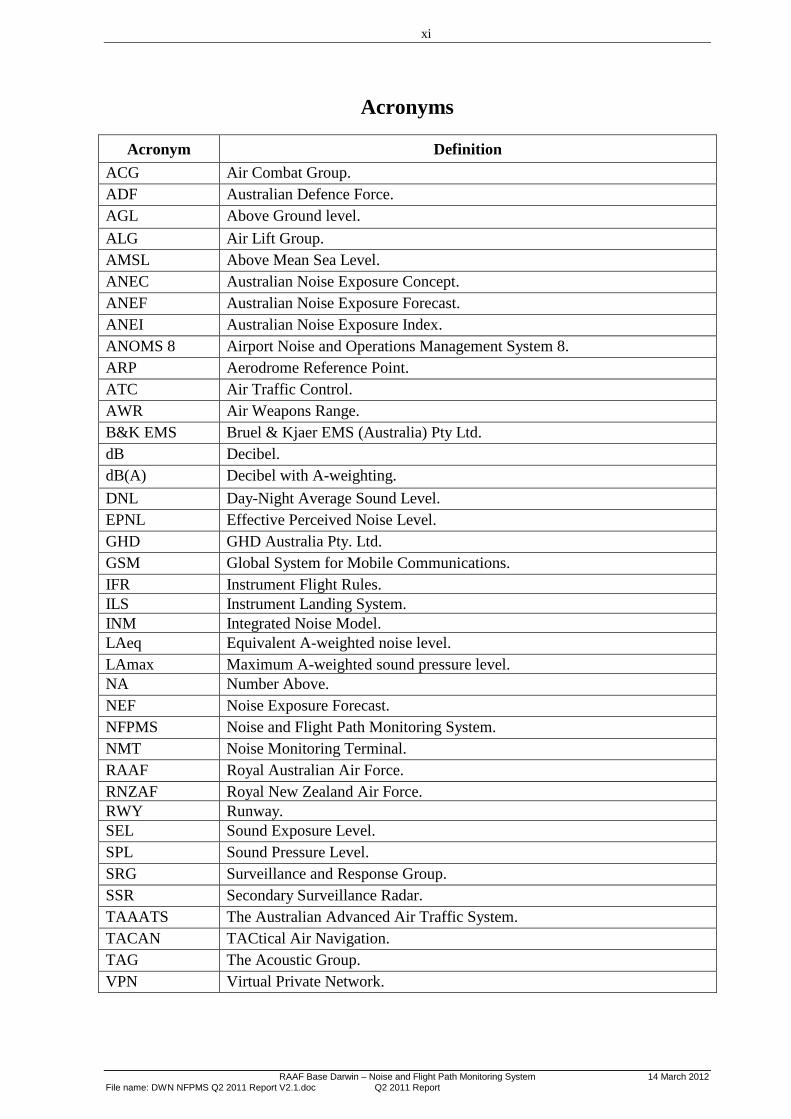
Acronyms
Acronym Definition
ACG Air Combat Group.
ADF Australian Defence Force.
AGL Above Ground level.
ALG Air Lift Group.
AMSL Above Mean Sea Level.
ANEC Australian Noise Exposure Concept.
ANEF Australian Noise Exposure Forecast.
ANEI Australian Noise Exposure Index.
ANOMS 8 Airport Noise and Operations Management System 8.
ARP Aerodrome Reference Point.
ATC Air Traffic Control.
AWR Air Weapons Range.
B&K EMS Bruel & Kjaer EMS (Australia) Pty Ltd.
dB Decibel.
dB(A) Decibel with A-weighting.
DNL Day-Night Average Sound Level.
EPNL Effective Perceived Noise Level.
GHD GHD Australia Pty. Ltd.
GSM Global System for Mobile Communications.
IFR Instrument Flight Rules.
ILS Instrument Landing System.
INM Integrated Noise Model.
LAeq Equivalent A-weighted noise level.
LAmax Maximum A-weighted sound pressure level.
NA Number Above.
NEF Noise Exposure Forecast.
NFPMS Noise and Flight Path Monitoring System.
NMT Noise Monitoring Terminal.
RAAF Royal Australian Air Force.
RNZAF Royal New Zealand Air Force.
RWY Runway.
SEL Sound Exposure Level.
SPL Sound Pressure Level.
SRG Surveillance and Response Group.
SSR Secondary Surveillance Radar.
TAAATS The Australian Advanced Air Traffic System.
TACAN TACtical Air Navigation.
TAG The Acoustic Group.
VPN Virtual Private Network.

1
RAAF Base Darwin – Noise and Flight Path Monitoring System 14 March 2012 File name: DWN NFPMS Q2 2011 Report V2.1.doc Q2 2011 Report
1. INTRODUCTION
1.1 RAAF Base Darwin Noise and Flight Path Monitoring System
1.1.1 The objective of the RAAF Base Darwin Noise and Flight Path Monitoring System
(NFPMS) project is to monitor and record flight information and the noise levels of aircraft
operations. The system provides detailed information on aircraft noise events and assists the
Department of Defence (Defence) to communicate details of the flying activities to the
community.
1.1.2 In December 2009, the Defence engaged Bruel & Kjaer EMS (Australia) Pty Ltd
(B&K EMS) as the prime contractor to install, maintain and operate a noise and flight path
monitoring system at RAAF Base Darwin, Northern Territory. B&K EMS has engaged GHD
Australia Pty Ltd (GHD) and The Acoustic Group Pty Ltd (TAG) as sub-consultants to
provide technical services and advice.
1.1.3 This report details the aircraft operations, flight tracks and noise recorded at the
community-based Noise Monitoring Terminal (NMT) locations for the period 1 April to 30
June 2011. Consistent with the reporting of aircraft noise at other Australian Airports, the
report shows the average 24 hour LAeq and LAmax values. The N70 and N85 average daily
values are also reported.
1.2 RAAF Base Darwin
Location
1.2.1 RAAF Base Darwin/Darwin International Airport is located on the Stuart Highway
approximately seven kilometres to the north of the business centre of Darwin and adjacent to a
number of the suburbs of Darwin. RAAF Base Darwin is situated on land 31.4 metres above
mean sea level.
Use and Activity
1.2.2 RAAF Base Darwin accommodates both military and civil aircraft operations
1.2.3 The military aircraft operations at RAAF Base Darwin consist of operations by the
RAAF, Australian Army Aviation Corp and visiting overseas military forces. No flying
squadrons are normally based at RAAF Base Darwin and therefore all RAAF movements are
normally by visiting aircraft. However, since 2004, a 92WG detachment of P-3C aircraft have
been based at RAAF Base Darwin undertaking surveillance and border security duties.
1.2.4 Army helicopters operated by 1 AVN Regt are currently based at Robertson Barracks
and operate to and from RAAF Base Darwin.
1.2.5 RAAF Base Darwin is extensively used for training exercises by military aircraft.
There are three main training areas used by the visiting military aircraft: R230 to the north,
R264 to the west and the training areas associated with RAAF Base Tindal to the south.
2
14 March 2012 RAAF Base Darwin – Noise and Flight Path Monitoring System Q2 2011 Report File name: DWN NFPMS Q2 2011 Report V2.1.doc
1.2.6 RAAF Base Darwin is home to:
a. No 396 Expeditionary Combat Support Wing
b. No 321 Expeditionary Combat Support Squadron
c. No 92 Wing Detachment Darwin - surveillance and response
d. No 452 Squadron Headquarters
e. No 452 Sqaudron Darwin Flight
f. No 13 (City of Darwin) Squadron - Air Force Reserve
g. No 1 Airfield Operations Support Squadron Detachment Darwin - airfield
engineering
h. No 3 Combat Support Hospital Detachment Darwin
i. No 114 Mobile Control and Reporting Unit Darwin - radar operations

3
RAAF Base Darwin – Noise and Flight Path Monitoring System 14 March 2012 File name: DWN NFPMS Q2 2011 Report V2.1.doc Q2 2011 Report
INSERT FIGURE 1 (REGIONAL LOCATION PLAN)

4
14 March 2012 RAAF Base Darwin – Noise and Flight Path Monitoring System Q2 2011 Report File name: DWN NFPMS Q2 2011 Report V2.1.doc
BLANK PAGE

5
RAAF Base Darwin – Noise and Flight Path Monitoring System 14 March 2012 File name: DWN NFPMS Q2 2011 Report V2.1.doc Q2 2011 Report
1.2.7 Military fixed wing aircraft operations include RAAF transport operations, RAAF
exercises and visiting military aircraft. RAAF transport aircraft operate throughout the year
whereas the aircraft associated with RAAF exercises are concentrated during particular
periods of time.
1.2.8 The Base also supports periodic short term deployments by overseas military forces.
1.2.9 Visiting military aircraft to RAAF Base Darwin may include the following:
a. AP-3C Orion
a. B-52
b. BBJ (Boeing Business Jet)
c. Beechcraft King Air 350
d. Blackhawk Helicopter
e. Boeing 737 AEW&C
f. C-130 Hercules
g. C-17 Globemaster III
h. Challenger CL-604
i. E-3 Sentry
j. EA-6B Prowler
k. F-15 Eagle
l. F-16 Falcon
m. F/A-18 E/F Super Hornet
n. F/A-18 Hornet
o. KC-135 Stratotanker,
p. MRH-90 Multi Role Helicopter
q. USN E-2
1.2.10 Details on Australian Military aircraft are available on the Defence website
(www.defence.gov.au).
1.2.11 As well as the military aircraft operations at RAAF Base Darwin, civil aircraft
operate from Darwin International Airport on the northern side of the base. Darwin
International Airport is serviced by airlines such as: Airnorth, AirAsia, Jetstar, Qantas
Skywest, Vincent Aviation and Virgin Blue. These fly to all mainland Australian states and
internationally to Indonesia, East Timor, Malaysia, Philippines, Vietnam and Singapore.

6
14 March 2012 RAAF Base Darwin – Noise and Flight Path Monitoring System Q2 2011 Report File name: DWN NFPMS Q2 2011 Report V2.1.doc
1.2.12 Aircraft movements in this report are categorised as follows:
a. Military Jet,
(i) Military Fast Jet,
(ii) Military Other Jet,
b. Military Propeller,
c. Military Helicopter,
d. Civil Jet,
(i) Civil Heavy Jet,
(ii) Civil Medium Jet,
(iii) Civil Light Jet,
e. Civil Propeller,
(i) Civil Medium Propeller,
(ii) Civil Light Propeller,
f. Civil Helicopters, and
g. Unknown.
1.2.13 The unknown aircraft movements are those which occur when no record of the
details of the aircraft type is recorded, although the NFPMS records the flight track and
associated aircraft noise.
Future Uses and Activities
1.2.14 The number of civil aircraft movements at Darwin Airport is anticipated to increase
in line with the projected growth in passenger numbers identified in the Darwin Airport
Master Plan.
Runway Layout
1.2.15 Figure 2 – Base Environs and Runway Layout illustrates the orientation of the
runway in relation to the surrounding environs. The main east-west runway is known as
Runway 11/29 and is 3,354 metres long and 60 metres wide. The north-south runway is
known as Runway 18/36 and is 1,524 metres long, 30 metres wide and is mostly used by civil
turboprop aircraft.
1.2.16 The use of each runway direction is dependent on the wind direction at the time and
other operational considerations, such as runway works, other traffic etc.

7
RAAF Base Darwin – Noise and Flight Path Monitoring System 14 March 2012 File name: DWN NFPMS Q2 2011 Report V2.1.doc Q2 2011 Report
BLANK PAGE

8
14 March 2012 RAAF Base Darwin – Noise and Flight Path Monitoring System Q2 2011 Report File name: DWN NFPMS Q2 2011 Report V2.1.doc
INSERT FIGURE 2 (BASE ENVIRONS AND RUNWAY LAYOUT)

9
RAAF Base Darwin – Noise and Flight Path Monitoring System 14 March 2012 File name: DWN NFPMS Q2 2011 Report V2.1.doc Q2 2011 Report
BLANK PAGE

10
14 March 2012 RAAF Base Darwin – Noise and Flight Path Monitoring System Q2 2011 Report File name: DWN NFPMS Q2 2011 Report V2.1.doc
1.3 The NFPMS Components
1.3.1 The Noise and Flight Path Monitoring System (NFPMS) is a state of the art
automated system which is installed, maintained and operated by Bruel & Kjaer EMS
(Australia) Pty Ltd. The purpose of the NFPMS is to monitor, record and report on the noise
exposure from aircraft operations on the community in the vicinity of the Base or associated
flying training areas. The NFPMS utilises permanent noise monitoring stations on the Base
and temporary noise monitoring stations in the community. The system collects data on
aircraft operations associated with the Base and reports the noise exposure at particular
locations in the community.
1.3.2 Through the air traffic control radar system, the NFPMS acquires flight track data
and operational information on aircraft operating in and out of the airfield and within a
defined radius of the airfield.
1.3.3 The NFPMS provides Defence with the ability to capture data on the aircraft
operations (arrivals/departures/circuits), flight tracks and aircraft noise events.
1.3.4 The NFPMS is made up of a number of components, including:
a. Noise Monitoring Terminals (NMTs),
b. Flight Operations Interface,
c. Radar Data Logger, and
d. ANOMS 8 Data Server.
1.3.5 Figure 3 shows the components of the NFPMS and their relationships.
Figure 3 – NFPMS Components
11
RAAF Base Darwin – Noise and Flight Path Monitoring System 14 March 2012 File name: DWN NFPMS Q2 2011 Report V2.1.doc Q2 2011 Report
Noise Monitoring Terminals
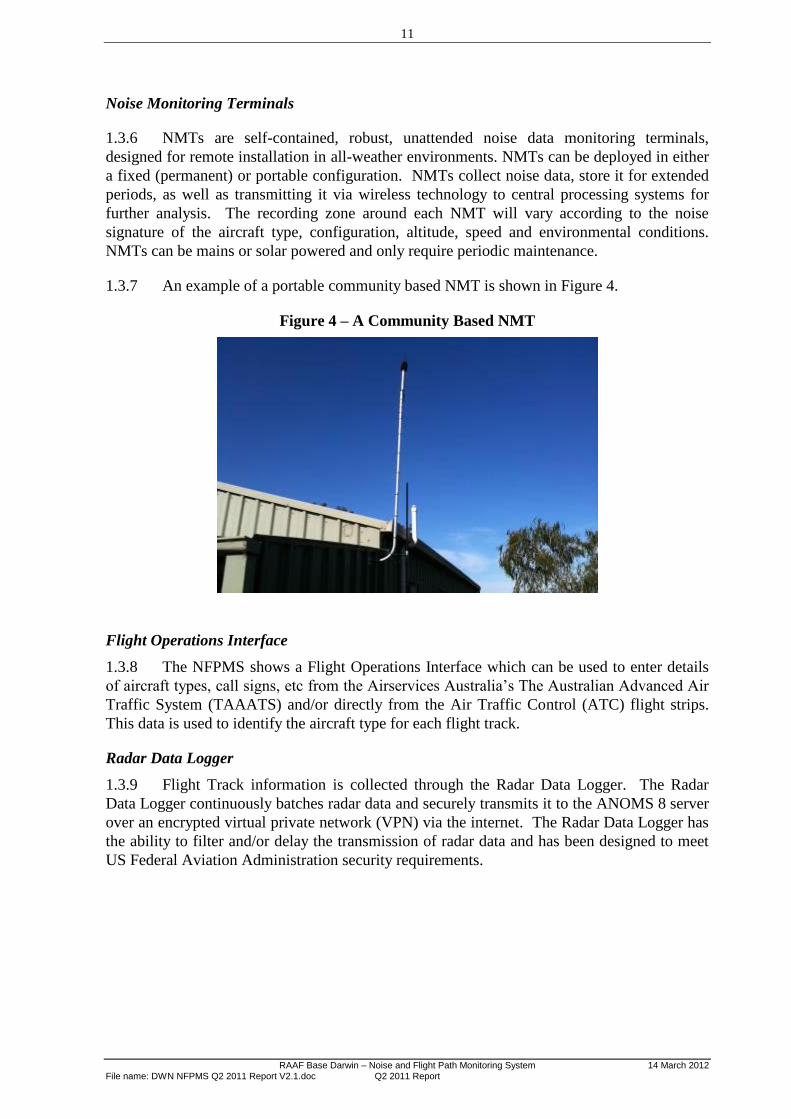
1.3.6 NMTs are self-contained, robust, unattended noise data monitoring terminals,
designed for remote installation in all-weather environments. NMTs can be deployed in either
a fixed (permanent) or portable configuration. NMTs collect noise data, store it for extended
periods, as well as transmitting it via wireless technology to central processing systems for
further analysis. The recording zone around each NMT will vary according to the noise
signature of the aircraft type, configuration, altitude, speed and environmental conditions.
NMTs can be mains or solar powered and only require periodic maintenance.
1.3.7 An example of a portable community based NMT is shown in Figure 4.
Figure 4 – A Community Based NMT
Flight Operations Interface
1.3.8 The NFPMS shows a Flight Operations Interface which can be used to enter details
of aircraft types, call signs, etc from the Airservices Australia’s The Australian Advanced Air
Traffic System (TAAATS) and/or directly from the Air Traffic Control (ATC) flight strips.
This data is used to identify the aircraft type for each flight track.
Radar Data Logger
1.3.9 Flight Track information is collected through the Radar Data Logger. The Radar
Data Logger continuously batches radar data and securely transmits it to the ANOMS 8 server
over an encrypted virtual private network (VPN) via the internet. The Radar Data Logger has
the ability to filter and/or delay the transmission of radar data and has been designed to meet
US Federal Aviation Administration security requirements.

12
14 March 2012 RAAF Base Darwin – Noise and Flight Path Monitoring System Q2 2011 Report File name: DWN NFPMS Q2 2011 Report V2.1.doc
ANOMS 8
1.3.10 ANOMS 8 is the heart of NFPMS. ANOMS 8 supports and integrates a range of
data sources, including the NMTs noise data, radar plots and aircraft movement data to create
a comprehensive view of airfield operations and the noise environment. ANOMS 8 allows the
operator to comprehensively analyse the recorded aircraft noise events, generate standard
reports and present that data. ANOMS 8 complies with the specifications set out in ICAO
Annex 16 and complies with all international aircraft noise measurement standards.
Limitations of the NFPMS
1.3.11 As with any remote monitoring system, the NFPMS has some limitations.
1.3.12 A fundamental issue in terms of the identification of an aircraft noise event is the
correlation of the noise event recorded by the NMT to an aircraft movement. There are many
noise events which occur on a daily basis at NMT locations in the community which are not
associated with an aircraft movement. Adjacent motor vehicle movements and bird calls can
give rise to noise levels similar to or greater than aircraft operations. As the intent of the
NFPMS is to report on the noise contribution of aircraft operations, it is important that noise
events are correctly correlated to aircraft movements.
1.3.13 Flight tracks are collected from radar plots from the Secondary Surveillance Radar
(SSR). The SSR picks up the position of the aircraft by the transponder return signal
transmitted by the aircraft.
1.3.14 Some aircraft will have their transponders switched off in which case the aircraft is
not detected by the SSR, resulting in no record of the aircraft movement or flight track being
collected. In other cases, the transponder may be switched off or moved to the standby mode
during flight, or the aircraft may turn so that the transponder faces away from the radar,
resulting in the flight track seemingly to suddenly end.
1.3.15 Light General Aviation aircraft may use transponder code 1200. Although the
NFPMS collects flight tracks for these aircraft, no aircraft type information (e.g. Piper 38;
Cessna 172) is available. The NFPMS therefore reports these aircraft under the category
‘unidentified’ or ‘unknown’ aircraft.
1.3.16 Military operations include multiple aircraft formations with as many as four aircraft
in a formation. Only the lead aircraft in a formation will have its transponder turned on
resulting in only one aircraft noise event being detected. The formation flying will lead to an
underestimate of the total aircraft movements being reported by the NFPMS.
1.3.17 During periods of radar outage, due to power failure or maintenance, there are no
records of aircraft movements.
1.3.18 During periods of maintenance or power outage at the NMT, no noise events are
recorded.
1.3.19 Atmospheric conditions such as temperature inversion or high wind conditions can
affect the propagation of the aircraft noise so that the noise level at the NMT is reduced to a
level where it may not be correlated to an aircraft movement.
13
RAAF Base Darwin – Noise and Flight Path Monitoring System 14 March 2012 File name: DWN NFPMS Q2 2011 Report V2.1.doc Q2 2011 Report
1.3.20 In some cases, the flight tracks do not connect exactly on to the runway threshold due
the rotation of the radar head and the height of the radar above the airfield often missing some
segments of the flight track.

14
14 March 2012 RAAF Base Darwin – Noise and Flight Path Monitoring System Q2 2011 Report File name: DWN NFPMS Q2 2011 Report V2.1.doc
BLANK PAGE

15
RAAF Base Darwin – Noise and Flight Path Monitoring System 14 March 2012 File name: DWN NFPMS Q2 2011 Report V2.1.doc Q2 2011 Report
2. AIRCRAFT OPERATIONS
2.1 Aircraft Movements
2.1.1 Table 1 categorises the number of aircraft movements which were identified by the
NFPMS by aircraft type. The number of aircraft movements shows arrivals, departures and
circuit movements.
Table 1 – Recorded Aircraft Movements by Category – Quarter 2 2011
Aircraft Movements
Aircraft Category April
2011
May
2011
June
2011
Total for the
Quarter
Military Jet
Military Fast Jet 42 36 13 91
Military Other Jet 32 35 45 112
Military Propeller 64 88 51 203
Military Helicopters 1 2 - 3
Civil Jet
Civil Heavy Jet 86 90 165 341
Civil Medium Jet 1,634 1,620 1,580 4,834
Civil Light Jet - 9 13 22
Civil Propeller
Civil Medium Propeller 916 1,023 1,050 2,989
Civil Light Propeller 2,188 2,237 2,337 6,762
Civil Helicopter 50 37 18 105
Unknown 2,671 2,965 3,093 8,729
All Aircraft Categories 7,684 8,142 8,365 24,191
2.1.2 There were 24,191 recorded aircraft movements at RAAF Base Darwin in Quarter 2
2011. Of the total recorded aircraft movements, 409 (1.7%) were by military aircraft and
15,053 (62.2%) were by civil aircraft.
2.1.3 Unidentified aircraft accounted for 8,729 (36.1%) of the aircraft movements recorded
during the quarter. Some of the unidentified aircraft would be military helicopters that
undertake local area flying within the RAAF Base Darwin controlled airspace. Additionally,
some of the unidentified aircraft were most likely civilian light aircraft and military
helicopters undertaking flying operations.
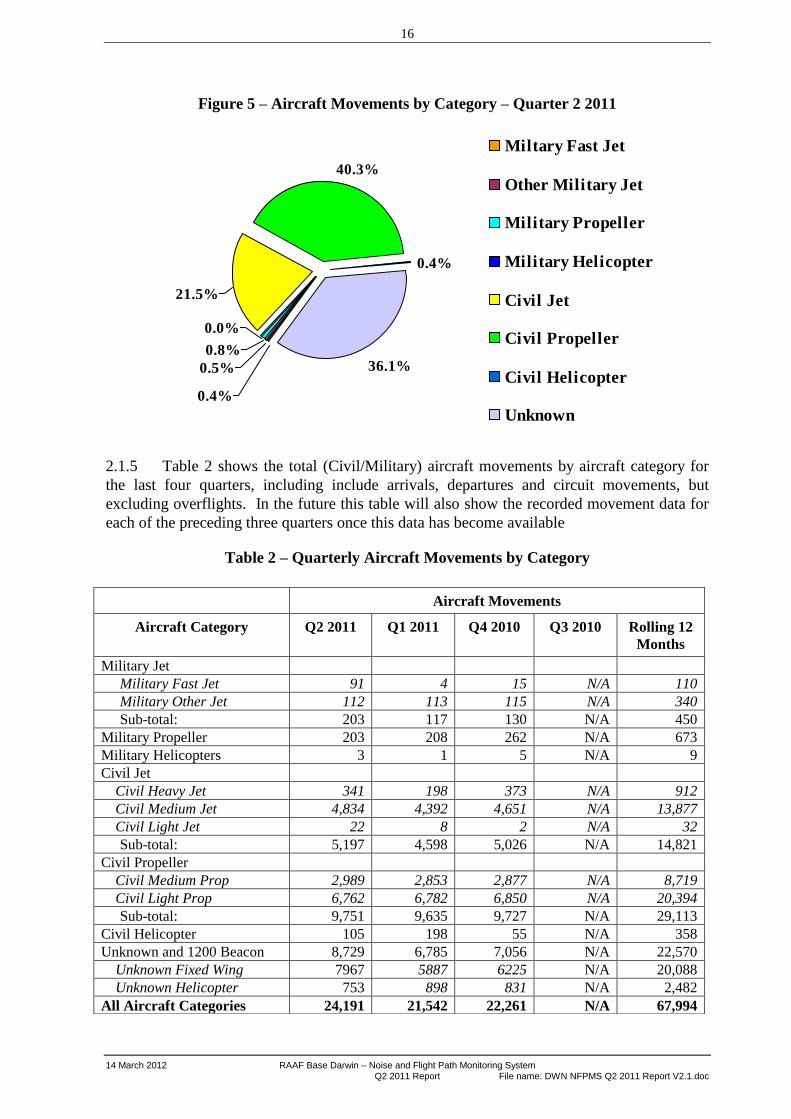
2.1.4 Figure 5 illustrates the aircraft movements by Category for Quarter 2 2011. A
detailed breakdown of movements by aircraft types can be found in Annex B – Aircraft
Movement Details.
16
14 March 2012 RAAF Base Darwin – Noise and Flight Path Monitoring System Q2 2011 Report File name: DWN NFPMS Q2 2011 Report V2.1.doc
Figure 5 – Aircraft Movements by Category – Quarter 2 2011
40.3%
0.4%
36.1%0.8%
21.5%
0.4%
0.5%
0.0%
Miltary Fast Jet
Other Military Jet
Military Propeller
Military Helicopter
Civil Jet
Civil Propeller
Civil Helicopter
Unknown
2.1.5 Table 2 shows the total (Civil/Military) aircraft movements by aircraft category for
the last four quarters, including include arrivals, departures and circuit movements, but
excluding overflights. In the future this table will also show the recorded movement data for
each of the preceding three quarters once this data has become available
Table 2 – Quarterly Aircraft Movements by Category
Aircraft Movements
Aircraft Category Q2 2011 Q1 2011 Q4 2010 Q3 2010 Rolling 12
Months
Military Jet
Military Fast Jet 91 4 15 N/A 110
Military Other Jet 112 113 115 N/A 340
Sub-total: 203 117 130 N/A 450
Military Propeller 203 208 262 N/A 673
Military Helicopters 3 1 5 N/A 9
Civil Jet
Civil Heavy Jet 341 198 373 N/A 912
Civil Medium Jet 4,834 4,392 4,651 N/A 13,877
Civil Light Jet 22 8 2 N/A 32
Sub-total: 5,197 4,598 5,026 N/A 14,821
Civil Propeller
Civil Medium Prop 2,989 2,853 2,877 N/A 8,719
Civil Light Prop 6,762 6,782 6,850 N/A 20,394
Sub-total: 9,751 9,635 9,727 N/A 29,113
Civil Helicopter 105 198 55 N/A 358
Unknown and 1200 Beacon 8,729 6,785 7,056 N/A 22,570
Unknown Fixed Wing 7967 5887 6225 N/A 20,088
Unknown Helicopter 753 898 831 N/A 2,482
All Aircraft Categories 24,191 21,542 22,261 N/A 67,994

17
RAAF Base Darwin – Noise and Flight Path Monitoring System 14 March 2012 File name: DWN NFPMS Q2 2011 Report V2.1.doc Q2 2011 Report
18
14 March 2012 RAAF Base Darwin – Noise and Flight Path Monitoring System Q2 2011 Report File name: DWN NFPMS Q2 2011 Report V2.1.doc
Runway usage
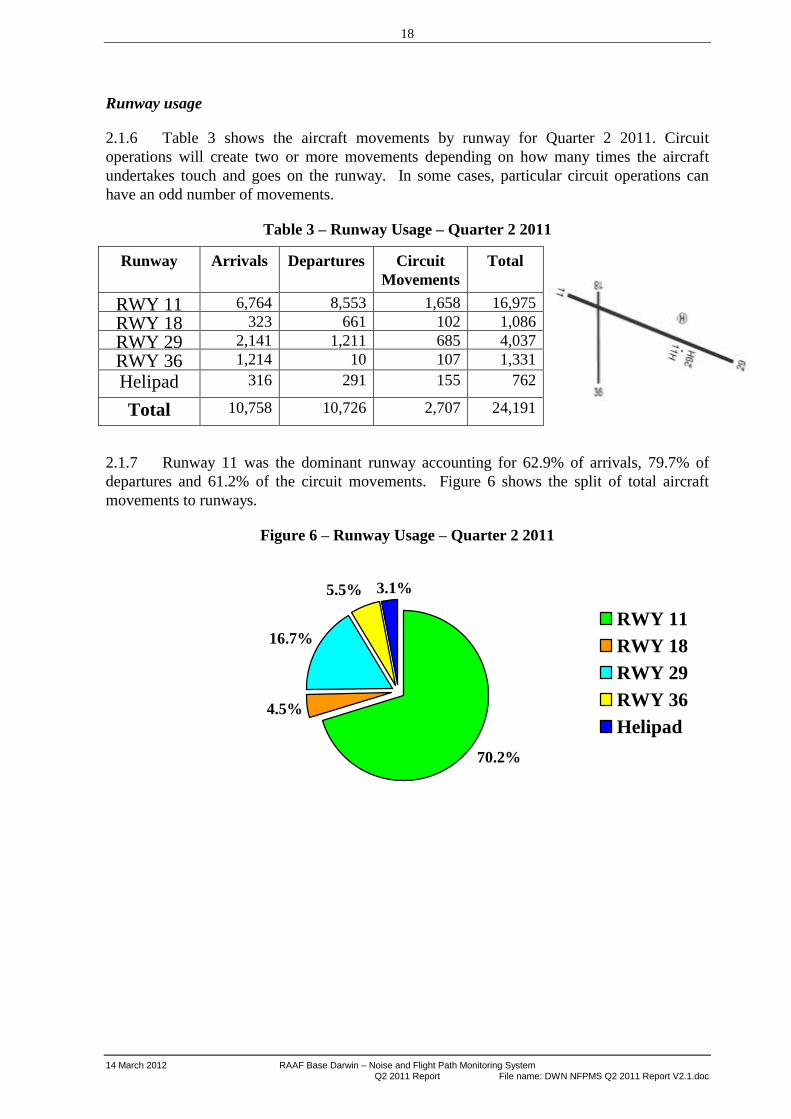
2.1.6 Table 3 shows the aircraft movements by runway for Quarter 2 2011. Circuit
operations will create two or more movements depending on how many times the aircraft
undertakes touch and goes on the runway. In some cases, particular circuit operations can
have an odd number of movements.
Table 3 – Runway Usage – Quarter 2 2011
Runway Arrivals Departures Circuit
Movements
Total
RWY 11 6,764 8,553 1,658 16,975
RWY 18 323 661 102 1,086
RWY 29 2,141 1,211 685 4,037
RWY 36 1,214 10 107 1,331
Helipad 316 291 155 762
Total 10,758 10,726 2,707 24,191
2.1.7 Runway 11 was the dominant runway accounting for 62.9% of arrivals, 79.7% of
departures and 61.2% of the circuit movements. Figure 6 shows the split of total aircraft
movements to runways.
Figure 6 – Runway Usage – Quarter 2 2011
70.2%
4.5%
16.7%
5.5% 3.1%
RWY 11
RWY 18
RWY 29
RWY 36
Helipad

19
RAAF Base Darwin – Noise and Flight Path Monitoring System 14 March 2012 File name: DWN NFPMS Q2 2011 Report V2.1.doc Q2 2011 Report
2.2 Aircraft Flight Tracks
Aircraft Flight Track Density Plot
2.2.1 The track density plots are maps of the surrounds of the Base which show the pattern
of the aircraft flight tracks. The system analyses the number of aircraft movements which
pass over a grid 18 metres by 18 metres. As the density of aircraft flight tracks increase the
colour of the flight tracks changes.
2.2.2 All Aircraft Movements. Figure 7 – Track Density Plot – All Aircraft Movements
shows the track density plot for all recorded aircraft movements for all runways at RAAF
Base Darwin. The track density plot shows the dominance of aircraft arrivals using Runway
11 or 29 straight in approaches. It also shows a number of aircraft using Runway 36.
Figure 7 – Track Density Plot - All Aircraft Movements – Quarter 2 2011

20
14 March 2012 RAAF Base Darwin – Noise and Flight Path Monitoring System Q2 2011 Report File name: DWN NFPMS Q2 2011 Report V2.1.doc
Aircraft Flight Tracks Plots
2.2.3 Figure 8 – Civil Aircraft Flight Tracks shows the flight track plots for all recorded
civil aircraft movements at RAAF Base Darwin for Quarter 2 2011.
2.2.4 Figure 9 – Military Aircraft Flight Tracks shows the flight track plots for all
recorded military aircraft movements at RAAF Base Darwin for Quarter 2 2011.
2.2.5 Arrivals are depicted with red flight tracks, departures with blue flight tracks and
circuits with green flight tracks, although the density of tracks on Figure 8 has resulted in the
departure and circuit tracks being somewhat overwritten by red arrival tracks.
2.2.6 Although Figure 7 shows the concentration of flight tracks on the straight-in
approaches, Figures 8 and 9 illustrate that within that overall pattern, there is a wide
dispersion of individual flight tracks in the airspace around RAAF Base Darwin.
21
RAAF Base Darwin – Noise and Flight Path Monitoring System 14 March 2012 File name: DWN NFPMS Q2 2011 Report V2.1.doc Q2 2011 Report
INSERT FIGURE 8 (CIVIL AIRCRAFT FLIGHT TRACKS)
22
14 March 2012 RAAF Base Darwin – Noise and Flight Path Monitoring System Q2 2011 Report File name: DWN NFPMS Q2 2011 Report V2.1.doc
BLANK PAGE

23
RAAF Base Darwin – Noise and Flight Path Monitoring System 14 March 2012 File name: DWN NFPMS Q2 2011 Report V2.1.doc Q2 2011 Report
INSERT FIGURE 9 (MILITARY AIRCRAFT FLIGHT TRACKS)

24
14 March 2012 RAAF Base Darwin – Noise and Flight Path Monitoring System Q2 2011 Report File name: DWN NFPMS Q2 2011 Report V2.1.doc
BLANK PAGE

25
RAAF Base Darwin – Noise and Flight Path Monitoring System 14 March 2012 File name: DWN NFPMS Q2 2011 Report V2.1.doc Q2 2011 Report
Aircraft Arrival Flight Tracks
2.2.7 Aircraft arrival flight track plots to Runway 11, 29, 36 and 18 are shown in the
following figures:
a. Figure 10 – Aircraft Flight Tracks – Military Jet Arrivals Runway 11,
b. Figure 11 – Aircraft Flight Tracks – Military Propeller Arrivals Runway 11,
c. Figure 12 – Aircraft Flight Tracks – Civil Jet Arrivals Runway 11,
d. Figure 13 – Aircraft Flight Tracks – Civil Propeller Arrivals Runway 11,
e. Figure 14 – Aircraft Flight Tracks – Military Jet Arrivals Runway 29,
f. Figure 15 – Aircraft Flight Tracks – Military Propeller Arrivals Runway 29,
g. Figure 16 – Aircraft Flight Tracks – Civil Jet Arrivals Runway 29.
h. Figure 17 – Aircraft Flight Tracks – Civil Propeller Arrivals Runway 29.
i. Figure 18 – Aircraft Flight Tracks – Civil Propeller Arrivals Runway 36
j. Figure 19 – Aircraft Flight Tracks – Civil Propeller Arrivals Runway 18
2.2.8 The flight tracks have been colour coded according to the altitude of the aircraft in
feet AMSL as the aircraft arrives at the airfield. Red designates an altitude of the aircraft up
to 500 feet, orange for an altitude between 500 and 1,000 feet, yellow for an altitude between
1,000 and 2,500 feet and light green for an altitude above 2,500 feet. These plots of the flight
tracks have been generated from the aircraft movement data recorded during the Quarter 2
2011 reporting period.
2.2.9 Refer to Annex B – Aircraft Movement Details, Table B2 – Aircraft Types Arrivals
for details of the aircraft arrival movements.

26
14 March 2012 RAAF Base Darwin – Noise and Flight Path Monitoring System Q2 2011 Report File name: DWN NFPMS Q2 2011 Report V2.1.doc
2.2.10 Figure 10 - Military Jet Arrivals to Runway 11 shows the flight track plots for all
recorded military jet arrivals to Runway 11 at RAAF Base Darwin.
2.2.11 Most aircraft landing on Runway 11 made their final approach from the north-west
over Beagle Gulf. Aircraft entering the area from the south and south-east overflew the Port
of Darwin before turning right over the Cox Peninsula to make their final approach to the
runway.
2.2.12 Approximately half of the arrivals shown on the map were made by United States Air
Force and Republic of Singapore Air Force McDonnell Douglas F-15 Eagle aircraft and
RAAF FA-18 Hornets. This activity was associated with the Aces North and Talisman Sabre
military exercises being held at Darwin and Tindal during the reporting period.
2.2.13 Eight of the military fast jets performed an initial and pitch manoeuvre prior to
landing. With one exception, these aircraft approached the base from Beagle Gulf, flew past
the runway and then over Winellie, the Narrows and north of Fannie Bay before landing.
2.2.14 The NFPMS also recorded movements by larger military jet aircraft supporting the
exercises. These included RAAF Boeing C-17 Globemaster IIIs, a USAF KC-135
Stratotanker and a Republic of Singapore C-135 Stratolifter.
2.2.15 A number of other flight tracks shown on the map were made by Bombardier
Challenger 604 (7 arrivals), RNZAF Boeing 757 (8 arrivals) and Boeing C-17 Globemaster III
(13 arrivals) not associated with military exercises. These aircraft generally arrived from the
south and east.
2.2.16 The two flight tracks passing over Palmerston were made by RAAF FA-18 Hornets.
These aircraft overflew Palmerston at an altitude above 5000 and 10,000 feet.

27
RAAF Base Darwin – Noise and Flight Path Monitoring System 14 March 2012 File name: DWN NFPMS Q2 2011 Report V2.1.doc Q2 2011 Report
INSERT FIGURE 10 (FLIGHT TRACKS FOR MILITARY JET ARRIVALS TO RUNWAY
11)

28
14 March 2012 RAAF Base Darwin – Noise and Flight Path Monitoring System Q2 2011 Report File name: DWN NFPMS Q2 2011 Report V2.1.doc
BLANK PAGE

29
RAAF Base Darwin – Noise and Flight Path Monitoring System 14 March 2012 File name: DWN NFPMS Q2 2011 Report V2.1.doc Q2 2011 Report
INTENTIONALLY LEFT BLANK
30
14 March 2012 RAAF Base Darwin – Noise and Flight Path Monitoring System Q2 2011 Report File name: DWN NFPMS Q2 2011 Report V2.1.doc
2.2.17 Figure 11 - Military Propeller Arrivals to Runway 11 shows the recorded flight
track plots for military propeller arrivals to Runway 11 at RAAF Base Darwin consisting of
visual approaches and instrument arrivals.
2.2.18 The majority of the arrivals shown on the map were made by large aircraft such as
the C130 Hercules and P-3 Orion. Most of these entered the area from the south-east and the
south and overflew the Cox Penninsula before making their final approach in the vicinity of
Beagle Gulf.
2.2.19 Aircraft arriving from the north and the north-west joined their final approach over
Beagle Gulf.
2.2.20 A number of aircraft overflew Shoal Bay at an altitude of less than 2,500 feet and
joined the final approach path near East Point. Four C130 Hercules aircraft overflew East
Point at an altitude of less than 1,000 feet..
2.2.21 The majority of the 63 arrivals shown on the map were made by large aircraft such as
the C-130 Hercules and Lockheed P-3 Orion.
2.2.22 One C-130 Hercules entered the area from the north, before manoeuvring at low
altitude over the sea to make an approach to Runway 11. The aircraft then made an initial-and-
pitch arrival, overflying the base, turning right and overflying Winnellie, Bayview and Fannie
Bay at an altitude of less than 500 feet prior to final approach and landing.
2.2.23 A Pilatus PC-9 aircraft overflew the northern part of the base, Marrara and Coconut
Grove at an altitude between 500 and 2,500 feet then turned left for final approach and
landing.

31
RAAF Base Darwin – Noise and Flight Path Monitoring System 14 March 2012 File name: DWN NFPMS Q2 2011 Report V2.1.doc Q2 2011 Report
INSERT FIGURE 11 (FLIGHT TRACKS FOR MILITARY PROPELLER ARRIVALS TO
RUNWAYS 11)

32
14 March 2012 RAAF Base Darwin – Noise and Flight Path Monitoring System Q2 2011 Report File name: DWN NFPMS Q2 2011 Report V2.1.doc
BLANK PAGE

33
RAAF Base Darwin – Noise and Flight Path Monitoring System 14 March 2012 File name: DWN NFPMS Q2 2011 Report V2.1.doc Q2 2011 Report
INTENTIONALLY LEFT BLANK

34
14 March 2012 RAAF Base Darwin – Noise and Flight Path Monitoring System Q2 2011 Report File name: DWN NFPMS Q2 2011 Report V2.1.doc
2.2.24 Figure 12 - Civil Jet Arrivals to Runway 11 shows the recorded flight track plots
for civil jet arrivals to Runway 11 at RAAF Base Darwin. Civil jet aircraft tend to follow
published standard approach paths in the Darwin area.
2.2.25 Aircraft arriving from Australian airports generally approached from the south and
east, descended over Waigut Beach and Mandoorah, and made a right hand turn over Beagle
Gulf to make their final approach.
2.2.26 Aircraft arriving from overseas ports (such as Vietnam, Indonesia, and Singapore)
entered the area from the west and did not overfly Darwin prior to landing.
2.2.27 During the quarter, three aircraft (one Boeing 737, One Boeing 717, and a DC10)
overflew suburbs east and north of RAAF Base Darwin at an altitude above 2,500 feet.
2.2.28 Several aircraft, in making comparatively tight final turns, overflew suburbs south of
RAAF Base Darwin at altitudes of between 500 and 2,500 feet and one Beech 400 aircraft
overflew Ludmilla at an altitude of less than 500 feet before making their final turn for
landing.

35
RAAF Base Darwin – Noise and Flight Path Monitoring System 14 March 2012 File name: DWN NFPMS Q2 2011 Report V2.1.doc Q2 2011 Report
INSERT FIGURE 12 (FLIGHT TRACKS FOR CIVIL JET ARRIVALS TO RUNWAY 11)

36
14 March 2012 RAAF Base Darwin – Noise and Flight Path Monitoring System Q2 2011 Report File name: DWN NFPMS Q2 2011 Report V2.1.doc
BLANK PAGE

37
RAAF Base Darwin – Noise and Flight Path Monitoring System 14 March 2012 File name: DWN NFPMS Q2 2011 Report V2.1.doc Q2 2011 Report
INTENTIONALLY LEFT BLANK
38
14 March 2012 RAAF Base Darwin – Noise and Flight Path Monitoring System Q2 2011 Report File name: DWN NFPMS Q2 2011 Report V2.1.doc
2.2.29 Figure 13 - Civil Propeller Arrivals to Runway 11 shows 3,200 flight tracks in
total and demonstrates that civil propeller aircraft overfly the suburbs of Darwin more
frequently than military aircraft or civil jet aircraft.
2.2.30 The majority of civil propeller aircraft recorded during Q2 2011 were light commuter
aircraft. Most of this traffic comes from three areas - Arnhem Land (east), the Tiwi Islands
(north) and from smaller towns and airfields south of Darwin and in Western Australia.
Because civil light propeller aircraft usually fly directly to the airfield for a visual approach to
the runway, they tend to overfly Darwin suburbs regularly.
2.2.31 Larger civil propeller aircraft (i.e. Dash 8, Embraer 120) tended to fly along standard
arrival routes to RAAF Base Darwin and generally did not fly low over Darwin suburbs
during their approach to Runway 11.
2.2.32 A number of civil light propeller aircraft flew over a number of Darwin suburbs at
altitudes of less than 1,000 feet before they made their final approach. Four general aviation
aircraft overflew the Narrows and Charles Darwin at altitudes of less than 500ft.

39
RAAF Base Darwin – Noise and Flight Path Monitoring System 14 March 2012 File name: DWN NFPMS Q2 2011 Report V2.1.doc Q2 2011 Report
INSERT FIGURE 13 (FLIGHT TRACKS FOR CIVIL PROPELLER ARRIVALS TO
RUNWAY 11)

40
14 March 2012 RAAF Base Darwin – Noise and Flight Path Monitoring System Q2 2011 Report File name: DWN NFPMS Q2 2011 Report V2.1.doc
BLANK PAGE

41
RAAF Base Darwin – Noise and Flight Path Monitoring System 14 March 2012 File name: DWN NFPMS Q2 2011 Report V2.1.doc Q2 2011 Report
INTENTIONALLY LEFT BLANK

42
14 March 2012 RAAF Base Darwin – Noise and Flight Path Monitoring System Q2 2011 Report File name: DWN NFPMS Q2 2011 Report V2.1.doc
2.2.33 Figure 14 - Military Jet Aircraft Arrivals to Runway 29 shows the recorded flight
track plots for military jet aircraft arrivals to Runway 29 at RAAF Base Darwin. The map
shows that the majority of the military jet arrivals to Runway 29 joined final approach in the
vicinity of the Howard Springs navigation aid.
2.2.34 Aircraft approaching along this flight path included eight RAAF C-17 Globemaster,
eight Republic of Singapore Air Force McDonnell Douglas F-15 Eagle, seven Bombardier
Challenger 604 aircraft, four Boeing 737 aircraft and three RNZAF Boeing 757 aircraft
2.2.35 One F/A-18 Hornet aircraft landed on Runway 29 after an ‘initial and pitch’
manoeuvre to the south of the runway.
43
RAAF Base Darwin – Noise and Flight Path Monitoring System 14 March 2012 File name: DWN NFPMS Q2 2011 Report V2.1.doc Q2 2011 Report
INSERT FIGURE 14 (FLIGHT TRACKS FOR MILITARY JET ARRIVALS TO RUNWAY
29)

44
14 March 2012 RAAF Base Darwin – Noise and Flight Path Monitoring System Q2 2011 Report File name: DWN NFPMS Q2 2011 Report V2.1.doc
BLANK PAGE

45
RAAF Base Darwin – Noise and Flight Path Monitoring System 14 March 2012 File name: DWN NFPMS Q2 2011 Report V2.1.doc Q2 2011 Report
INTENTIONALLY LEFT BLANK

46
14 March 2012 RAAF Base Darwin – Noise and Flight Path Monitoring System Q2 2011 Report File name: DWN NFPMS Q2 2011 Report V2.1.doc
2.2.36 Figure 15 - Military Propeller Aircraft Arrivals to Runway 29 shows the
recorded flight track plots for the military propeller aircraft arrivals to Runway 29 at RAAF
Base Darwin. Military propeller aircraft landing on Runway 29 generally began their final
approach from the south-east via the Howard Springs navigation aid.
2.2.37 Twenty-six Lockheed C-130 Hercules and Lockheed P-3 Orion aircraft military
propeller aircraft visited RAAF Base Darwin during the reporting period.
2.2.38 Six Lockheed C-130 Hercules overflew Knuckey Lagoon at altitudes between 500
and 1,000 feet prior to landing. One Lockheed C-130 Hercules overflew the northern suburbs
of Tiwi and Leanyer at an altitude exceeding 1,000.
2.2.39 One P-3 Orion overflew Hidden Valley at an altitude between 500 and 1,000 feet
prior to landing. One Lockheed C-130 Hercules overflew the southern suburbs of Gunn and
Yarrawonga at an altitude between 500 and 1,000 feet prior to final approach.

47
RAAF Base Darwin – Noise and Flight Path Monitoring System 14 March 2012 File name: DWN NFPMS Q2 2011 Report V2.1.doc Q2 2011 Report
INSERT FIGURE 15 (FLIGHT TRACKS FOR MILITARY PROPELLER ARRIVALS TO
RUNWAY 29)

48
14 March 2012 RAAF Base Darwin – Noise and Flight Path Monitoring System Q2 2011 Report File name: DWN NFPMS Q2 2011 Report V2.1.doc
BLANK PAGE

49
RAAF Base Darwin – Noise and Flight Path Monitoring System 14 March 2012 File name: DWN NFPMS Q2 2011 Report V2.1.doc Q2 2011 Report
INTENTIONALLY LEFT BLANK

50
14 March 2012 RAAF Base Darwin – Noise and Flight Path Monitoring System Q2 2011 Report File name: DWN NFPMS Q2 2011 Report V2.1.doc
2.2.40 Figure 16 - Civil Jet Aircraft Arrivals to Runway 29 shows the recorded flight
track plots for the civil jet aircraft arrivals to Runway 29 at RAAF Base Darwin.
2.2.41 Most civil jet arrivals to Runway 29 originated from Australian airports. Civil jets
from the south and south-east generally flew to the Howard Springs navigation aid prior to
approaching the runway. Those from Perth, Broome, and Kunanurra generally followed
routes that took them over Darwin Harbour at an altitude exceeding 2,500 feet before making
a left hand turn to begin their final approach in the vicinity of Howard Springs.
2.2.42 Aircraft approaching from the north-west overflew Lee Point and Shoal Bay before
turning right to approach Runway 29. These aircraft were generally at a high level and did not
overfly Darwin suburbs.
2.2.43 Two civil jet aircraft overflew the northern suburbs of Darwin at altitudes between
1,000 and 2,500 feet during the reporting period.
51
RAAF Base Darwin – Noise and Flight Path Monitoring System 14 March 2012 File name: DWN NFPMS Q2 2011 Report V2.1.doc Q2 2011 Report
INSERT FIGURE 16 (FLIGHT TRACKS FOR CIVIL JET ARRIVALS TO RUNWAY 29)

52
14 March 2012 RAAF Base Darwin – Noise and Flight Path Monitoring System Q2 2011 Report File name: DWN NFPMS Q2 2011 Report V2.1.doc
BLANK PAGE

53
RAAF Base Darwin – Noise and Flight Path Monitoring System 14 March 2012 File name: DWN NFPMS Q2 2011 Report V2.1.doc Q2 2011 Report
INTENTIONALLY LEFT BLANK

54
14 March 2012 RAAF Base Darwin – Noise and Flight Path Monitoring System Q2 2011 Report File name: DWN NFPMS Q2 2011 Report V2.1.doc
2.2.44 Figure 17 - Civil Propeller Arrivals to Runway 29 shows 930 flight tracks in total
and demonstrates that civil propeller aircraft overfly the suburbs of Darwin more frequently
than military jet aircraft or civil jet aircraft.
2.2.45 As with traffic arriving on Runway 11, the majority of the civil propeller aircraft
recorded during Q2 2011 were light commuter aircraft coming from three areas - Arnhem
Land (east), the Tiwi Islands (north) and from smaller towns and airfields south of Darwin and
in Western Australia.
2.2.46 Some traffic from the Tiwi Islands overflew Darwin’s northern suburbs as the civil
light propeller aircraft used on these flights appear to take the shortest available route to the
airfield.
2.2.47 The larger civil propeller aircraft (i.e. Dash 8, Embraer 120) generally approached
Runway 29 along the standard instrument approach used by civil jet aircraft. Because of their
slower speed, however, civil propeller aircraft flying along this route were generally at a lower
altitude.
2.2.48 Land east of the runway threshold experienced the most overflights during the
reporting period, with most civil light propeller aircraft flying over Berrimah and Knuckey
Lagoon at an altitude of less than 1,000 feet.
2.2.49 The map also shows that Palmerston was often overflown by civil light propeller
aircraft at an altitude of less than 2,500 feet. This activity was not associated with a single
flight path.

55
RAAF Base Darwin – Noise and Flight Path Monitoring System 14 March 2012 File name: DWN NFPMS Q2 2011 Report V2.1.doc Q2 2011 Report
INSERT FIGURE 17 (FLIGHT TRACKS FOR CIVIL PROPELLER ARRIVALS TO
RUNWAY 29)

56
14 March 2012 RAAF Base Darwin – Noise and Flight Path Monitoring System Q2 2011 Report File name: DWN NFPMS Q2 2011 Report V2.1.doc
BLANK PAGE

57
RAAF Base Darwin – Noise and Flight Path Monitoring System 14 March 2012 File name: DWN NFPMS Q2 2011 Report V2.1.doc Q2 2011 Report
INTENTIONALLY LEFT BLANK
58
14 March 2012 RAAF Base Darwin – Noise and Flight Path Monitoring System Q2 2011 Report File name: DWN NFPMS Q2 2011 Report V2.1.doc
Figure 18 - Civil Propeller Aircraft Arrivals to Runway 18 shows 120 flight tracks in total
and demonstrates that civil propeller aircraft make their final approach from the north and east
over Beagle Gulf and the northern suburbs of Darwin.
2.2.50 The majority of the civil propeller aircraft recorded during Q2 2011 were light
commuter aircraft coming from Arnhem Land (east) and the Tiwi Islands (north). Most of
these aircraft approached the runway from the vicinity of Lee Point.
2.2.51 Land north of the runway threshold experienced the most overflights during the
reporting period, with most of the civil light propeller aircraft flying over Jingili at an altitude
of less than 500 feet.
2.2.52 A small number of aircraft approached the airfield via the suburbs of Coconut Grove,
Nightcliffe, Rapid Creek and Millner. Aircraft approaching Runway 18 from this area were
between 500 feet and 1,000 feet in altitude over these suburbs.
59
RAAF Base Darwin – Noise and Flight Path Monitoring System 14 March 2012 File name: DWN NFPMS Q2 2011 Report V2.1.doc Q2 2011 Report
INSERT FIGURE 18 (FLIGHT TRACKS FOR CIVIL PROPELLER ARRIVALS TO
RUNWAY 18)

60
14 March 2012 RAAF Base Darwin – Noise and Flight Path Monitoring System Q2 2011 Report File name: DWN NFPMS Q2 2011 Report V2.1.doc
BLANK PAGE

61
RAAF Base Darwin – Noise and Flight Path Monitoring System 14 March 2012 File name: DWN NFPMS Q2 2011 Report V2.1.doc Q2 2011 Report
INTENTIONALLY LEFT BLANK

62
14 March 2012 RAAF Base Darwin – Noise and Flight Path Monitoring System Q2 2011 Report File name: DWN NFPMS Q2 2011 Report V2.1.doc
2.2.53 Figure 19 - Civil Propeller Aircraft Arrivals to Runway 36 shows 672 flight
tracks in total and demonstrates that civil propeller aircraft make their final approach from the
south over Francis Bay.
2.2.54 The majority of the civil propeller aircraft arriving on Runway 36 during Q2 2011
were light commuter aircraft coming from smaller towns and airfields south of Darwin and in
Western Australia. These aircraft generally did not fly over residential suburbs.
2.2.55 While most civil propeller aircraft arriving on Runway 36 arrived from the south,
some of those arriving from the north (such as the Tiwi Islands) overflew Darwin as they
approached their final turning point south of the airfield. These aircraft overflew suburbs such
as Fannie Bay and Bay View or Casuarina and Anula at altitudes of less than 2,500 feet.
2.2.56 Some civil propeller aircraft appeared to be approaching Runway 11 before making a
turning south to overfly the suburbs of Darwin at altitudes between 500 feet and 1,000 feet
before making a final turn to land on Runway 36.

63
RAAF Base Darwin – Noise and Flight Path Monitoring System 14 March 2012 File name: DWN NFPMS Q2 2011 Report V2.1.doc Q2 2011 Report
INSERT FIGURE 19 (FLIGHT TRACKS FOR CIVIL PROPELLER ARRIVALS TO
RUNWAY 36)

64
14 March 2012 RAAF Base Darwin – Noise and Flight Path Monitoring System Q2 2011 Report File name: DWN NFPMS Q2 2011 Report V2.1.doc
BLANK PAGE

65
RAAF Base Darwin – Noise and Flight Path Monitoring System 14 March 2012 File name: DWN NFPMS Q2 2011 Report V2.1.doc Q2 2011 Report
INTENTIONALLY LEFT BLANK

66
14 March 2012 RAAF Base Darwin – Noise and Flight Path Monitoring System Q2 2011 Report File name: DWN NFPMS Q2 2011 Report V2.1.doc
Aircraft Departure Flight Tracks Aircraft departure flight track plots from Runway 11, 18,
29 and Runway 36 are shown in following figures:
a. Figure 20 – Aircraft Flight Tracks – Military Jet Departures Runway 11,
b. Figure 21 – Aircraft Flight Tracks – Military Propeller Departures Runways
11,
c. Figure 22 – Aircraft Flight Tracks – Civil Jet Departures Runway 11,
d. Figure 23 – Aircraft Flight Tracks – Civil Propeller Departures Runway 11,
e. Figure 24 – Aircraft Flight Tracks – Military Jet Departures Runway 29
f. Figure 25 – Aircraft Flight Tracks – Military Propeller Departures Runway
29,
g. Figure 26 – Aircraft Flight Tracks – Civil Jet Departures Runway 29,
h. Figure 27 – Aircraft Flight Tracks – Civil Propeller Departures Runway 29.
i. Figure 28 – Aircraft Flight Tracks- Civil Propeller Departures Runways 18
and 36
2.2.57 These flight tracks have been colour coded according to the altitude of the aircraft in
feet above mean sea level (AMSL) as the aircraft departs the airfield. Red designates an
altitude of the aircraft up to 500 feet, orange for an altitude between 500 and 1,000 feet,
yellow for an altitude between 1,000 and 2,500 feet and light green for an altitude above 2,500
feet. These plots of the flight tracks have been generated from the aircraft movement data
recorded during the Quarter 4 2010 reporting period.
2.2.58 Refer to Annex B – Aircraft Movement Details, Table B3 – Aircraft Types
Departures for details of the aircraft departure movements.

67
RAAF Base Darwin – Noise and Flight Path Monitoring System 14 March 2012 File name: DWN NFPMS Q2 2011 Report V2.1.doc Q2 2011 Report
2.2.59 Figure 20 – Military Jet Aircraft Departures from Runway 11 shows the
recorded flight track plots for military jet aircraft departures from Runway 11 at RAAF Base
Darwin.
2.2.60 The majority of the military jet departures maintained runway heading until they
reached the vicinity of Holtze. From here, most aircraft either continued east or turned to the
south. The majority of military jet departures were by Boeing C-17 Globemaster, Bombardier
Challenger 604 and a small number of Boeing 737 (7) and RNZAF Boeing 757 (10) aircraft.
2.2.61 While a small number of departures turned n ear Berrimah enroute to overseas
airports in Singapore, Malaysia and Japan, these generally did not overfly residential suburbs.
2.2.62 Four F/A-18 Hornets departed from Runway 11 to bases to the east and south-east
and two departures by United States Air Force KC-135 Stratotankers.
2.2.63 There were two departures by United States Air Force KC-135 Stratotankers. One to
a base to the south-east and another to an airport in Singapore.
2.2.64 There were also two departures by Republic of Singapore Air Force McDonnell
Douglas F-15 Eagle aircraft. Both of these aircraft turned left and headed to the north-west to
a base in Singapore.

68
14 March 2012 RAAF Base Darwin – Noise and Flight Path Monitoring System Q2 2011 Report File name: DWN NFPMS Q2 2011 Report V2.1.doc
INSERT FIGURE 20 (FLIGHT TRACKS FOR MILITARY JET DEPARTURES FROM
RUNWAY 11)

69
RAAF Base Darwin – Noise and Flight Path Monitoring System 14 March 2012 File name: DWN NFPMS Q2 2011 Report V2.1.doc Q2 2011 Report
BLANK PAGE

70
14 March 2012 RAAF Base Darwin – Noise and Flight Path Monitoring System Q2 2011 Report File name: DWN NFPMS Q2 2011 Report V2.1.doc
INTENTIONALLY LEFT BLANK

71
RAAF Base Darwin – Noise and Flight Path Monitoring System 14 March 2012 File name: DWN NFPMS Q2 2011 Report V2.1.doc Q2 2011 Report
2.2.65 Figure 21 – Military Propeller Aircraft Departures from Runway 11 shows the
recorded flight track plots for military propeller departures from Runway 11 at RAAF Base
Darwin.
2.2.66 The majority of departing aircraft maintained runway heading until at least 2000 feet
and four kilometres from the airfield before they turned towards their final destination. Most
of these departures were by larger aircraft such as the Lockheed C-130 Hercules (49) and the
Lockheed P-3 Orion (23).
2.2.67 Lockheed C130 Hercules aircraft departing Runway 11 generally turned towards the
south-east and south-west towards Australian bases, or to the north headed for airports in
Brunei, East Timor, Malaysia and Singapore. Most Lockheed P-3Orions headed south-west,
west or north towards their operational areas.
2.2.68 There were also 17 departures by Beechcraft 350 Super King Air aircraftand two
departures by Pilatus PC-9 aircraft.
INSERT FIGURE 21 (FLIGHT TRACKS FOR MILITARY PROPELLER DEPARTURES
FROM RUNWAY 11)

72
14 March 2012 RAAF Base Darwin – Noise and Flight Path Monitoring System Q2 2011 Report File name: DWN NFPMS Q2 2011 Report V2.1.doc
BLANK PAGE

73
RAAF Base Darwin – Noise and Flight Path Monitoring System 14 March 2012 File name: DWN NFPMS Q2 2011 Report V2.1.doc Q2 2011 Report
INTENTIONALLY LEFT BLANK

74
14 March 2012 RAAF Base Darwin – Noise and Flight Path Monitoring System Q2 2011 Report File name: DWN NFPMS Q2 2011 Report V2.1.doc
2.2.69 Figure 22 – Civil Jet Aircraft Departures from Runway 11 shows the recorded
flight track plots for civil jet aircraft departures from Runway 11 at RAAF Base Darwin.
Civil jet aircraft tended to follow published standard departure flight paths in the Darwin area.
2.2.70 Aircraft headed to Australian airports generally maintained runway heading or turned
to the south near the Howard Springs navigation aid. This activity can be seen in the strong
corridors of traffic exiting to the south and south-east.
2.2.71 Aircraft headed to overseas airports (such as Vietnam, Indonesia, and Singapore)
usually made their first turn between Knuckey Lagoon and Holtze. These aircraft were
generally Airbus 320s and did not overfly Darwin.
2.2.72 The suburbs of Palmerston were overflown by scheduled passenger services on a
regular basis. Most aircraft that flew over Palmerston were between 2,500 feet and 5,000 feet
on their way to other Australian airports.

75
RAAF Base Darwin – Noise and Flight Path Monitoring System 14 March 2012 File name: DWN NFPMS Q2 2011 Report V2.1.doc Q2 2011 Report
INSERT FIGURE 22 (FLIGHT TRACKS FOR CIVIL JET DEPARTURES FROM
RUNWAY 11)

76
14 March 2012 RAAF Base Darwin – Noise and Flight Path Monitoring System Q2 2011 Report File name: DWN NFPMS Q2 2011 Report V2.1.doc
BLANK PAGE

77
RAAF Base Darwin – Noise and Flight Path Monitoring System 14 March 2012 File name: DWN NFPMS Q2 2011 Report V2.1.doc Q2 2011 Report
INTENTIONALLY LEFT BLANK

78
14 March 2012 RAAF Base Darwin – Noise and Flight Path Monitoring System Q2 2011 Report File name: DWN NFPMS Q2 2011 Report V2.1.doc
2.2.73 Figure 23 – Civil Propeller Aircraft Departures from Runway 11 shows 3,851
flight tracks in total and demonstrates that civil propeller aircraft overfly the suburbs of
Darwin more frequently than military aircraft or civil jet aircraft.
2.2.74 The majority of the civil propeller aircraft departures were to the north-east, east and
south-east and involved aircraft headed to airports in the Northern Territory and Queensland.
These aircraft generally did not fly over populated suburbs below 2,500 feet.
2.2.75 Aircraft that turned right after departure near Coonawarra and exited to the south
were enroute to Alice Springs, Derby and other smaller airports in the Northern Territory and
Western Australia.
2.2.76 Approximately 800 aircraft turned left after departure near Knuckey Lagoon and
exited to the north over Shoal Bay. These aircraft consisted of medium-sized propeller
aircraft, such as the Bombardier Dash 8, enroute to the Dili, East Timor or alternatively light
propeller aircraft enroute to the Tiwi Islands and small airports in the Northern Territory.
Medium propeller aircraft (e.g. Bombardier Dash-8) aircraft that overflew suburbs were
generally at a higher altitude than light propeller aircraft.
79
RAAF Base Darwin – Noise and Flight Path Monitoring System 14 March 2012 File name: DWN NFPMS Q2 2011 Report V2.1.doc Q2 2011 Report
INSERT FIGURE 23 (FLIGHT TRACKS FOR CIVIL PROPELLER DEPARTURES FROM
RUNWAY 11)

80
14 March 2012 RAAF Base Darwin – Noise and Flight Path Monitoring System Q2 2011 Report File name: DWN NFPMS Q2 2011 Report V2.1.doc
BLANK PAGE

81
RAAF Base Darwin – Noise and Flight Path Monitoring System 14 March 2012 File name: DWN NFPMS Q2 2011 Report V2.1.doc Q2 2011 Report
INTENTIONALLY LEFT BLANK

82
14 March 2012 RAAF Base Darwin – Noise and Flight Path Monitoring System Q2 2011 Report File name: DWN NFPMS Q2 2011 Report V2.1.doc
2.2.77 Figure 24 – Military Jet Aircraft Departures from Runway 29 shows the
recorded flight track plots for Military Jet aircraft departures from Runway 29 at RAAF Base
Darwin. During the reporting period, four F/A-18 Hornet aircraft, three Bombardier
Challenger 604, one Boeing 737 BBJ and one Boeing C-17 Globemaster aircraft departed
from Runway 29
2.2.78 All of the departures from Runway 29 maintained runway heading and headed out
toward Beagle Gulf. The majority of departures then turned south over Shoal Bay for bases
and airports to the south. None of these aircraft overflew Darwin at low altitude.

83
RAAF Base Darwin – Noise and Flight Path Monitoring System 14 March 2012 File name: DWN NFPMS Q2 2011 Report V2.1.doc Q2 2011 Report
INSERT FIGURE 24 (FLIGHT TRACKS FOR MILITARY JET DEPARTURES FROM
RUNWAY 29)

84
14 March 2012 RAAF Base Darwin – Noise and Flight Path Monitoring System Q2 2011 Report File name: DWN NFPMS Q2 2011 Report V2.1.doc
BLANK PAGE

85
RAAF Base Darwin – Noise and Flight Path Monitoring System 14 March 2012 File name: DWN NFPMS Q2 2011 Report V2.1.doc Q2 2011 Report
INTENTIONALLY LEFT BLANK

86
14 March 2012 RAAF Base Darwin – Noise and Flight Path Monitoring System Q2 2011 Report File name: DWN NFPMS Q2 2011 Report V2.1.doc
2.2.79 Figure 25 – Military Propeller Aircraft Departures from Runway 29 shows the
recorded flight track plots for military propeller aircraft departures from Runway 29 at RAAF
Base Darwin.
2.2.80 The departures were by Lockheed P-3 Orions and Lockheed C-130 aircraft that
maintained runway heading out over Beagle Gulf then exited the area to the west, south and
east.

87
RAAF Base Darwin – Noise and Flight Path Monitoring System 14 March 2012 File name: DWN NFPMS Q2 2011 Report V2.1.doc Q2 2011 Report
INSERT FIGURE 25 (FLIGHT TRACKS FOR MILITARY PROPELLER DEPARTURES
FROM RUNWAY 29)

88
14 March 2012 RAAF Base Darwin – Noise and Flight Path Monitoring System Q2 2011 Report File name: DWN NFPMS Q2 2011 Report V2.1.doc
BLANK PAGE
89
RAAF Base Darwin – Noise and Flight Path Monitoring System 14 March 2012 File name: DWN NFPMS Q2 2011 Report V2.1.doc Q2 2011 Report
INTENTIONALLY LEFT BLANK

90
14 March 2012 RAAF Base Darwin – Noise and Flight Path Monitoring System Q2 2011 Report File name: DWN NFPMS Q2 2011 Report V2.1.doc
2.2.81 Figure 26 – Civil Jet Aircraft Departures from Runway 29 shows the recorded
flight track plots for civil jet aircraft departures from Runway 29 at RAAF Base Darwin.
Civil jet aircraft tended to follow published standard departure flight paths in the Darwin area.
2.2.82 The majority of the departures maintained runway heading out over Beagle Gulf then
turned left over Shoal Bay/Port Darwin and exited the local area to the south-east. A small
number of these flights overflew Darwin and surrounding suburbs at an altitude below 2,500
feet.
2.2.83 A small number of aircraft turned right after departure over Beagle Bay and circled
back over Lee Point to exit the area to the south-east. These flights overflew the northern
suburbs of Darwin at altitudes generally exceeding 2,500 feet.

91
RAAF Base Darwin – Noise and Flight Path Monitoring System 14 March 2012 File name: DWN NFPMS Q2 2011 Report V2.1.doc Q2 2011 Report
INSERT FIGURE 26 (FLIGHT TRACKS FOR CIVIL JET DEPARTURES FROM
RUNWAY 29)

92
14 March 2012 RAAF Base Darwin – Noise and Flight Path Monitoring System Q2 2011 Report File name: DWN NFPMS Q2 2011 Report V2.1.doc
BLANK PAGE

93
RAAF Base Darwin – Noise and Flight Path Monitoring System 14 March 2012 File name: DWN NFPMS Q2 2011 Report V2.1.doc Q2 2011 Report
INTENTIONALLY LEFT BLANK
94
14 March 2012 RAAF Base Darwin – Noise and Flight Path Monitoring System Q2 2011 Report File name: DWN NFPMS Q2 2011 Report V2.1.doc
2.2.84 Figure 27 – Civil Propeller Aircraft Departures from Runway 29 shows 506
flight tracks which is only 12% of the total number of departures from the main 11/29
Runway and a significant reduction from the 3,310 movements in the previous quarter. Such a
change in utilisation is usually caused by prevailing wind and weather conditions.
2.2.85 The majority of the departures maintained runway heading out over Beagle Gulf then
turned right over Lee Point and exited the area to the east enroute to small airports in the
Northern Territory. A number of these flights by light propeller aircraft overflew Darwin and
surrounding suburbs at altitudes above 1,000 feet.
2.2.86 A large number of aircraft turned left after departure over Beagle Bay and exited the
area to the south and south-west enroute to Alice Springs, Derby and other smaller airports in
the Northern Territory and Western Australia. A number of these flights by light propeller
aircraft overflew the northern suburbs of Darwin at above 1,000 feet altitude.
2.2.87 A large number of aircraft turned right after departure over Beagle Bay to exit the
area to the north-west out into the Timor Sea. These aircraft consisted of medium-sized
propeller aircraft, such as the Bombardier Dash 8, enroute to Dili, East Timor or alternatively
light propeller aircraft enroute to the Tiwi Islands and small airports in the Northern Territory.

95
RAAF Base Darwin – Noise and Flight Path Monitoring System 14 March 2012 File name: DWN NFPMS Q2 2011 Report V2.1.doc Q2 2011 Report
INSERT FIGURE 27 (FLIGHT TRACKS FOR CIVIL PROPELLER DEPARTURES FROM
RUNWAY 29)

96
14 March 2012 RAAF Base Darwin – Noise and Flight Path Monitoring System Q2 2011 Report File name: DWN NFPMS Q2 2011 Report V2.1.doc
BLANK PAGE

97
RAAF Base Darwin – Noise and Flight Path Monitoring System 14 March 2012 File name: DWN NFPMS Q2 2011 Report V2.1.doc Q2 2011 Report
INTENTIONALLY LEFT BLANK
98
14 March 2012 RAAF Base Darwin – Noise and Flight Path Monitoring System Q2 2011 Report File name: DWN NFPMS Q2 2011 Report V2.1.doc
2.2.88 Figure 28 – Civil Propeller Aircraft Departures from Runway 18 and 36 shows
the recorded flight track plots for civil propeller aircraft departures from Runway 18 and 36 at
RAAF Base Darwin and shows 331 departures from Runway 18 and one departure from
Runway 36.
2.2.89 Most of aircraft the departing Runway 18 maintained runway heading or turned right
over Darwin Harbour and exited the area to the south or south-west enroute to regional
airports in the Northern Territory and Western Australia.
2.2.90 An aircraft that took off from Runway 18 turned to the north and overflew the
suburbs of Darwin at altitudes exceeding 1,000 feet.
2.2.91 Thirteen aircraft departed Runway 36 during Quarter 2 2011. These aircraft overflew
the northern suburbs of Darwin before turning towards their destinations.
99
RAAF Base Darwin – Noise and Flight Path Monitoring System 14 March 2012 File name: DWN NFPMS Q2 2011 Report V2.1.doc Q2 2011 Report
INSERT FIGURE 28 (FLIGHT TRACKS FOR CIVIL PROPELLER DEPARTURES FROM
RUNWAYS 18 AND 36)

100
14 March 2012 RAAF Base Darwin – Noise and Flight Path Monitoring System Q2 2011 Report File name: DWN NFPMS Q2 2011 Report V2.1.doc
BLANK PAGE
101
RAAF Base Darwin – Noise and Flight Path Monitoring System 14 March 2012 File name: DWN NFPMS Q2 2011 Report V2.1.doc Q2 2011 Report
Circuit Flight Tracks
2.2.92 Aircraft circuit flight track plots for all Runways are shown on in the following
figures:
a. Figure 29 – Aircraft Flight Tracks – Military Propeller Circuits, and
b. Figure 30 – Aircraft Flight Tracks – Civil Jet Circuits.
c. Figure 31 – Aircraft Flight Tracks – Civil Propeller Circuits
2.2.93 These flight tracks have been colour coded according to the altitude of the aircraft in
feet AMSL as the aircraft undertakes the circuit training. Red designates an altitude of the
aircraft up to 500 feet, orange for an altitude between 500 and 1,000 feet, yellow for an
altitude between 1,000 and 2,500 feet and light green for an altitude above 2,500 feet. The
aircraft undertaking circuit training fly at an altitude of 1,500 feet AMSL. These plots of the
flight tracks have been generated from the aircraft movement data recorded during the Quarter
2 2011 reporting period.
2.2.94 Refer to Annex B – Aircraft Movement Details, Table B4 – Aircraft Types Circuit
Movements for details of the aircraft circuit movements.

102
14 March 2012 RAAF Base Darwin – Noise and Flight Path Monitoring System Q2 2011 Report File name: DWN NFPMS Q2 2011 Report V2.1.doc
2.2.95 Figure 29 – Military Circuits shows the recorded flight track plots for military
aircraft circuits at RAAF Base Darwin.
2.2.96 Seven Lockheed P-3 Orions conducted circuits south of Runway 11/29. A number of
these aircraft made a straight in approach to Runway 11 or 29 before the circuits.
103
RAAF Base Darwin – Noise and Flight Path Monitoring System 14 March 2012 File name: DWN NFPMS Q2 2011 Report V2.1.doc Q2 2011 Report
INSERT FIGURE 29 (MILITARY PROPELLER CIRCUIT TRACKS)

104
14 March 2012 RAAF Base Darwin – Noise and Flight Path Monitoring System Q2 2011 Report File name: DWN NFPMS Q2 2011 Report V2.1.doc
BLANK PAGE

105
RAAF Base Darwin – Noise and Flight Path Monitoring System 14 March 2012 File name: DWN NFPMS Q2 2011 Report V2.1.doc Q2 2011 Report
INTENTIONALLY LEFT BLANK

106
14 March 2012 RAAF Base Darwin – Noise and Flight Path Monitoring System Q2 2011 Report File name: DWN NFPMS Q2 2011 Report V2.1.doc
2.2.97 Figure 30 – Civil Circuits shows the recorded flight track plots for civil aircraft
circuits at RAAF Base Darwin.
2.2.98 Many of these flight tracks appear to be local area operations eg. tourist flights.
2.2.99 There are also a few apparent missed approaches, which is where an aircraft may
elect to abort its initial approach and “go around” for a second approach. This can occur for
various operational reasons, including weather, or airport congestion.
107
RAAF Base Darwin – Noise and Flight Path Monitoring System 14 March 2012 File name: DWN NFPMS Q2 2011 Report V2.1.doc Q2 2011 Report
INSERT FIGURE 30 (CIVIL CIRCUIT TRACKS)

108
14 March 2012 RAAF Base Darwin – Noise and Flight Path Monitoring System Q2 2011 Report File name: DWN NFPMS Q2 2011 Report V2.1.doc
BLANK PAGE

109
RAAF Base Darwin – Noise and Flight Path Monitoring System 14 March 2012 File name: DWN NFPMS Q2 2011 Report V2.1.doc Q2 2011 Report
INTENTIONALLY LEFT BLANK
110
14 March 2012 RAAF Base Darwin – Noise and Flight Path Monitoring System Q2 2011 Report File name: DWN NFPMS Q2 2011 Report V2.1.doc
Helicopter Flight Tracks
2.2.100 Figure 31 – Helicopter Flight Tracks illustrates the recorded helicopter flight tracks
to and from the helicopter landing areas at RAAF Base Darwin for the Quarter 2 2011.
2.2.101 Circuits are flown in three general areas around the airfield, south over Winnellie and
Hidden Valley, north-east over Karama and Knuckey Lagoon and to the north-west over
Nightcliff and Moil.

111
RAAF Base Darwin – Noise and Flight Path Monitoring System 14 March 2012 File name: DWN NFPMS Q2 2011 Report V2.1.doc Q2 2011 Report
INSERT FIGURE 31 (HELICOPTER FLIGHT TRACKS)

112
14 March 2012 RAAF Base Darwin – Noise and Flight Path Monitoring System Q2 2011 Report File name: DWN NFPMS Q2 2011 Report V2.1.doc
BLANK PAGE

113
RAAF Base Darwin – Noise and Flight Path Monitoring System 14 March 2012 File name: DWN NFPMS Q2 2011 Report V2.1.doc Q2 2011 Report
INTENTIONALLY LEFT BLANK
114
14 March 2012 RAAF Base Darwin – Noise and Flight Path Monitoring System Q2 2011 Report File name: DWN NFPMS Q2 2011 Report V2.1.doc
Unknown Aircraft Flight Tracks All Runways
2.3 Unidentified aircraft accounted for 7,056 (31.7%) of the aircraft movements recorded
during the quarter. As discussed in Chapter 1, “Unknown” flight tracks are those for which
the NFPMS is unable to identify the aircraft type. This is usually because the aircraft is not
transmitting a unique transponder beacon code such as a light propeller aircraft using
transponder code 1200 or has not lodged flight plan information that includes the aircraft type.
2.4 The following three Figures demonstrate that flying activity by unknown and
unidentified aircraft broadly matches the activity shown earlier in this report. For example,
aircraft arriving or departing RAAF Base Darwin tended to follow standard published fight
procedures and aircraft that performed a circuit generally did so on the southern side of the
runway.
2.5 Although the vast majority of the unknown and unidentified flight tracks were made
by civil aircraft, some military aircraft flight tracks may be included on these maps. Based
upon the overall numbers of military aircraft operating at RAAF Base Darwin during the
reporting period, the number of military aircraft included on the following maps is estimated
to be very low.
2.6 Figure 32 – Unknown Aircraft Arrival Flight Tracks – All Runways depicts arrivals
by unknown and unidentified aircraft in red.
2.7 Figure 33 – Unknown Aircraft Departure Flight Tracks – All Runways depicts
departures by unknown and unidentified aircraft in blue.
2.8 Figure 34 – Unknown Aircraft Circuit Flight Tracks – All Runways depicts
circuits by unknown and unidentified aircraft in green.

115
RAAF Base Darwin – Noise and Flight Path Monitoring System 14 March 2012 File name: DWN NFPMS Q2 2011 Report V2.1.doc Q2 2011 Report
INSERT FIGURE 32 (UNKNOWN AIRCRAFT ARRIVAL FLIGHT TRACKS – ALL
RUNWAYS)

116
14 March 2012 RAAF Base Darwin – Noise and Flight Path Monitoring System Q2 2011 Report File name: DWN NFPMS Q2 2011 Report V2.1.doc
BLANK PAGE

117
RAAF Base Darwin – Noise and Flight Path Monitoring System 14 March 2012 File name: DWN NFPMS Q2 2011 Report V2.1.doc Q2 2011 Report
INTENTIONALLY LEFT BLANK
118
14 March 2012 RAAF Base Darwin – Noise and Flight Path Monitoring System Q2 2011 Report File name: DWN NFPMS Q2 2011 Report V2.1.doc
INSERT FIGURE 33 (UNKNOWN AIRCRAFT DEPARTURE FLIGHT TRACKS – ALL
RUNWAYS)

119
RAAF Base Darwin – Noise and Flight Path Monitoring System 14 March 2012 File name: DWN NFPMS Q2 2011 Report V2.1.doc Q2 2011 Report
BLANK PAGE

120
14 March 2012 RAAF Base Darwin – Noise and Flight Path Monitoring System Q2 2011 Report File name: DWN NFPMS Q2 2011 Report V2.1.doc
INTENTIONALLY LEFT BLANK

121
RAAF Base Darwin – Noise and Flight Path Monitoring System 14 March 2012 File name: DWN NFPMS Q2 2011 Report V2.1.doc Q2 2011 Report
INSERT FIGURE 34 (UNKNOWN AIRCRAFT CIRCUIT FLIGHT TRACKS – ALL
RUNWAYS)

122
14 March 2012 RAAF Base Darwin – Noise and Flight Path Monitoring System Q2 2011 Report File name: DWN NFPMS Q2 2011 Report V2.1.doc
BLANK PAGE

123
RAAF Base Darwin – Noise and Flight Path Monitoring System 14 March 2012 File name: DWN NFPMS Q2 2011 Report V2.1.doc Q2 2011 Report
3. AIRCRAFT NOISE
3.1 Measurement of Aircraft Noise
3.1.1 Noise is described as unwanted sound. The two main components of a sound event
are the loudness and pitch. The loudness is related to the energy of the sound wave and pitch
is related to the frequency of the sound.
3.1.2 The human ear relates the loudness to the Sound Pressure, which is an easy
parameter to measure with a noise measurement instrument. The loudness of actual sound
levels is made by comparison to a standard pressure of 2x10⁻⁵ Pascals (Newtons per square
metre) taken at a reference frequency of 1,000 Hz. This sound pressure has been set as the
lower threshold of hearing; with the upper threshold of the hearing pressure range being 1,000
Pa, where permanent damage would be done to the eardrum. Because of this very large range
of sound pressures, a logarithmic scale was developed which, for typical noise events,
consolidated the range of sound pressures from 0 to 140 dB. This expression of the level of
sound is referenced as the Sound Pressure Level (SPL) and is measured in decibels (dB).
3.1.3 Within the human auditory system, for similar pressure levels, the pitch, or
technically the frequency, determines the interpretation of the loudness. At equal sound
pressures, low frequencies are perceived as less loud than middle frequencies in the 1,000 to
4,000 Hz range. At frequencies above 4,000 Hz, sensitivity decreases.
3.1.4 The human ear of a young person corresponds to a frequency range of 20 Hz to
20,000 Hz. This is called the audible range. One general trend is that as people age they are
less able to hear the higher frequencies, so that the high frequency limit may be reduced to
15,000 Hz or in extreme cases down to 10,000 Hz.
3.1.5 The human ear is better equipped to hear the mid frequency ranges and therefore
people can find noises in this frequency band more annoying. The “A” filter approximates the
sensitivity of the ear and relates the relative loudness of the various noises at different
frequencies to the human ear’s response to those noises. The “A weighted” decibel scale,
referenced as dB(A) has generally been adopted as the relevant parameter for the measurement
of community noise and has been adopted for aircraft noise, due primarily to the simple nature
of obtaining an A-weighted noise level.
3.1.6 There are a large number of descriptors which have been developed to describe
aircraft noise. These include:
a. single event descriptors which can be measured or calculated by a noise
monitoring instrument, and
b. equal energy parameters which accumulate a number of noise events over
time and need to be calculated.
3.1.7 Refer to Annex A – Glossary for a description of the common acoustic parameters
used in the measurement of the community’s exposure to aircraft noise.
3.1.8 Two commonly used single event noise descriptors of aircraft and community noise
are the “maximum” A-weighted sound pressure level (LAmax) and the “equivalent” A-
weighted noise level (LAeq).
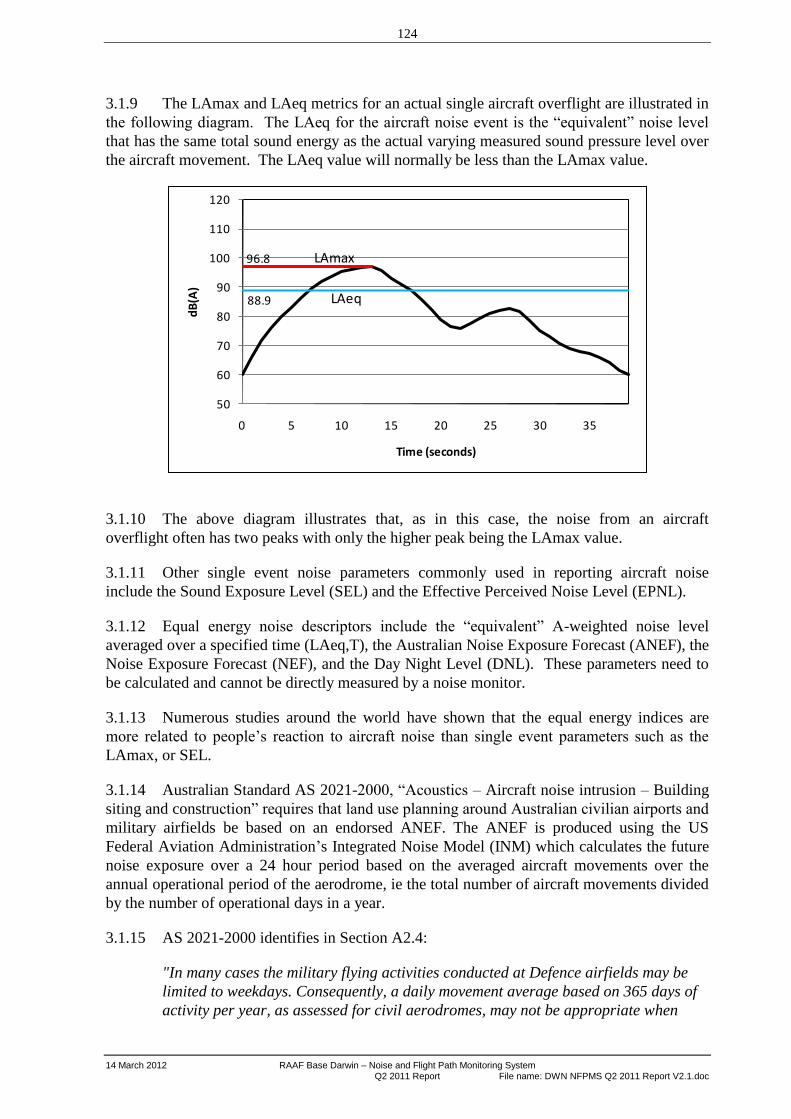
124
14 March 2012 RAAF Base Darwin – Noise and Flight Path Monitoring System Q2 2011 Report File name: DWN NFPMS Q2 2011 Report V2.1.doc
3.1.9 The LAmax and LAeq metrics for an actual single aircraft overflight are illustrated in
the following diagram. The LAeq for the aircraft noise event is the “equivalent” noise level
that has the same total sound energy as the actual varying measured sound pressure level over
the aircraft movement. The LAeq value will normally be less than the LAmax value.
50
60
70
80
90
100
110
120
0 5 10 15 20 25 30 35
dB
(A)
Time (seconds)
LAmax
LAeq88.9
96.8
3.1.10 The above diagram illustrates that, as in this case, the noise from an aircraft
overflight often has two peaks with only the higher peak being the LAmax value.
3.1.11 Other single event noise parameters commonly used in reporting aircraft noise
include the Sound Exposure Level (SEL) and the Effective Perceived Noise Level (EPNL).
3.1.12 Equal energy noise descriptors include the “equivalent” A-weighted noise level
averaged over a specified time (LAeq,T), the Australian Noise Exposure Forecast (ANEF), the
Noise Exposure Forecast (NEF), and the Day Night Level (DNL). These parameters need to
be calculated and cannot be directly measured by a noise monitor.
3.1.13 Numerous studies around the world have shown that the equal energy indices are
more related to people’s reaction to aircraft noise than single event parameters such as the
LAmax, or SEL.
3.1.14 Australian Standard AS 2021-2000, “Acoustics – Aircraft noise intrusion – Building
siting and construction” requires that land use planning around Australian civilian airports and
military airfields be based on an endorsed ANEF. The ANEF is produced using the US
Federal Aviation Administration’s Integrated Noise Model (INM) which calculates the future
noise exposure over a 24 hour period based on the averaged aircraft movements over the
annual operational period of the aerodrome, ie the total number of aircraft movements divided
by the number of operational days in a year.
3.1.15 AS 2021-2000 identifies in Section A2.4:
"In many cases the military flying activities conducted at Defence airfields may be
limited to weekdays. Consequently, a daily movement average based on 365 days of
activity per year, as assessed for civil aerodromes, may not be appropriate when

125
RAAF Base Darwin – Noise and Flight Path Monitoring System 14 March 2012 File name: DWN NFPMS Q2 2011 Report V2.1.doc Q2 2011 Report
producing the ANEF for military airfields and joint Defence/civil airports. When
military flying activities at an airfield are expected to occur for less than 365 days
per year, average daily movement numbers for military aircraft may be assessed on
the basis of average aircraft movements during operating days only."
3.1.16 AS2021 does not identify the determination of an average day for a mixed use
aerodrome. As the intent of an ANEF map for a military aerodrome is to identify the noise
impact of military operations, which tend to produce higher noise levels than for civilian
operations at the same aerodrome, the average daily operations used for the ANEF must be
different to a domestic or international civilian airport.
3.1.17 For the preparation of the Hawk LIF EIS the Commonwealth Department of
Environment required the ANEF to utilise:
a. the average daily civil aircraft movements calculated by dividing the
forecast annual civil aircraft movements by 365 flying days.
b. the average daily military aircraft movements calculated by dividing the
forecast annual military aircraft military aircraft movements by 240 flying
days at RAAF Base Darwin, and
3.1.18 In a layman’s sense the ANEF for RAAF Base Darwin shows the aircraft noise
exposure on days when military operations occur. Therefore on days when military operations
do not occur, the noise exposure will be less, and for weekends may be further reduced by a
lower number of civilian aircraft movements. The Leq and maximum levels appended to this
report reflect that position.
3.1.19 The future exposure to aircraft noise is illustrated as ANEF contours drawn on a map
of the environs around the aerodrome. The contours show increasing aircraft noise exposure
from 20 ANEF to 40 ANEF. These ANEF contour numbers are not related to any value of the
single event noise parameters and cannot be directly measured.
3.1.20 In addition to an ANEF, there is an Australian Noise Exposure Index (ANEI). The
ANEI is produced using the INM and is a calculation of the noise exposure of actual aircraft
operations from a previous year (as distinct from a forecast of future operations). The ANEI
has the same units as the ANEF and is the average daily aircraft noise exposure around the
aerodrome for that year. As the ANEI represents the predicted noise exposure for operations
in the past, any comparison with existing aircraft noise levels can only relate to an ANEI
rather than a future ANEF.
3.1.21 For the insulation of buildings within the 20 ANEF contour, the Australian Standard
AS2021-2000 utilises the “Aircraft noise level” as the highest external level determined for
each aircraft operation and mode. The “Aircraft noise level” is location specific. The
maximum levels in Tables C4, C5 and C6 provide an arithmetic average, the minimum and
the maximum of the range of aircraft maximum levels recorded for the different aircraft types.
The aircraft maximum levels in Tables C4, C5 and C6 are not “Aircraft noise levels” as
defined in AS2021-2000.
3.1.22 The inquiry by the Senate Select Committee on Aircraft Noise in Sydney (Falling on
Deaf Ears - 1995) found that the ANEF System was not generally understood and
recommended that the ANEF be supplemented by additional acoustic metrics.

126
14 March 2012 RAAF Base Darwin – Noise and Flight Path Monitoring System Q2 2011 Report File name: DWN NFPMS Q2 2011 Report V2.1.doc
3.1.23 Whilst not required by AS 2021-2000 for measuring noise exposure, the LAeq,T
parameter may be used as a supplementary acoustic for the measurement of aircraft noise
exposure in Australia. The LAeq,T parameter is the summation of all the LAeq values for
each aircraft operation, logarithmically averaged over a period of time typically 16 or 24
hours. The LAeq may also be referenced as Leq. A 24 hour LAeq is often referenced as
Leq 24.
3.1.24 Many acoustic studies around the world have confirmed that there is a direct
relationship with the 24 hour LAeq parameter and people’s reaction to aircraft noise, with one
study in the UK (The Aircraft Noise Index Study - 1985) identified a step in people’s reaction
at a LAeq of 57 dB(A). Based on this report, the UK Government adopted the LAeq
parameter as a measure of aircraft noise and used 57 dB(A) as the approximate value where
there is general community annoyance from aircraft noise. Evidence from the study showed
that people become moderately disturbed at LAeq 65 dB(A) and were considered highly
disturbed at LAeq 70 dB(A).
3.1.25 The World Health Organisation (WHO) recommends that, for transportation
activities, the noise exposure should be measured in terms of the average 24 hour LAeq and
recommends an external 55dB(A) as the value where people start to became annoyed with
aircraft noise.
3.1.26 The Leq and some derived parameters are used by many other countries around the
world as the simplest means of measuring people’s reaction to aircraft noise. Most of Europe
use the WHO LAeq recommendations. Canada uses the NEF system which is similar to the
ANEF system but with a different night weighting. The USA and New Zealand use the DNL
system which is a LAeq with a night weighting from 10 pm to 7 am.
3.1.27 Airservices Australia has reported (refer to pages 7-8 of the Q2 2005 NFPMS report
for RAAF Base Darwin) that an order of magnitude estimate for comparison with the ANEI
value can be obtained by subtracting 35 dB(A) from the average 24 hour LAeq value. The
WHO external noise recommendation of 55 dB(A) would therefore approximate an ANEI
value of 20. An average 24 hour LAeq value of 60 dB(A) would approximate an ANEI value
of 25 being the “unacceptable” limit for residential housing under AS 2021-2000. Similarly
for comparison purposes, a LAeq value of 65 dB(A) would approximate ANEI 30 and LAeq
70 dB(A) would approximate ANEI 35.
3.1.28 Because the equal energy parameters are not easily understood, additional
supplementary parameters have also been used to further describe aircraft noise. The LAmax
metric is the most common supplementary aircraft noise parameter used around the world.
The WHO recommends that for aviation operations, in addition to the LAeq, additional
descriptors such as LAmax should also be reported.
127
RAAF Base Darwin – Noise and Flight Path Monitoring System 14 March 2012 File name: DWN NFPMS Q2 2011 Report V2.1.doc Q2 2011 Report
3.1.29 In 2000, the then Australian Department of Transport and Regional Services
(DOTARS) suggested the Number Above (NA) parameter also be used as an additional
indicator of the community’s exposure to aircraft noise. This parameter provides an average
daily number of aircraft noise events above a certain LAmax dB(A) level. The N70 parameter
represents the daily average number of aircraft noise events greater than a LAmax of
70 dB(A), N85 for average aircraft noise events greater than 85 dB(A) etc. DOTARS
recommended that the N70 parameter be used as 70 dB(A) is the LAmax level where speech
communication can be disrupted by aircraft noise. The benefit of the NA parameter is yet to
be quantified as the relationship between a particular NA value and people’s annoyance or
disturbance has not been established.
3.1.30 This quarterly report on the noise exposure of existing aircraft operations on the local
community documents the quarterly average 24 hour LAeq value. The NA parameters of N70
and N85 are also documented.
128
14 March 2012 RAAF Base Darwin – Noise and Flight Path Monitoring System Q2 2011 Report File name: DWN NFPMS Q2 2011 Report V2.1.doc
3.2 Factors Affecting the Propagation of Aircraft Noise
3.2.1 The noise level measured at each NMT can vary considerably between similar
operations by the same aircraft type. The variation can be in excess of a sound pressure level
of 10 dB(A) – a doubling of the subjective loudness of a particular sound.
3.2.2 The factors affecting the measured noise level at a particular location include the
following:
a. thrust setting of the aircraft,
b. attitude,
c. configuration of the aircraft,
d. flight track flown,
e. distance of the monitor to the aircraft position, and
f. environmental (weather) considerations.
3.2.3 The thrust setting of the engines of the aircraft is probably the most important
consideration as this represents the noise power at the source. The thrust setting will be
dependent on payload, range, configuration, pilot technique, weather conditions (particularly
wind and temperature) and whether the aircraft is accelerating, decelerating or in a constant
power setting. This is particularly important for military aircraft, which may use afterburner
power which may significantly increase the noise level.
3.2.4 The attitude of the aircraft can also affect the propagation of the noise level from the
aircraft. The noise level can be dependent on whether the aircraft is climbing, descending,
banking or in level flight. Banking, in particular, can shield the noise output from the engines
from the observer.
3.2.5 The configuration of the aircraft such as flap settings and exposed undercarriage alter
the power settings and can affect the noise generated by the aircraft. The lowering of flaps and
undercarriage will usually result in an increase in aircraft noise from the disturbed airflow,
turbulence or additional engine thrust when compared with the situation of no flaps or
exposed undercarriage..
3.2.6 The flight track flown and the distance of the noise monitor from the actual aircraft
position also have a bearing on the recorded noise level. The noise is dissipated through the
atmosphere in proportion to the square of the distance. A doubling of the distance will result
in a decrease in the noise level by approximately 6 dB(A).
3.2.7 Environmental considerations affecting the propagation of aircraft noise through the
atmosphere include the following:
a. atmospheric absorption,
b. wind,
c. temperature gradient, and
d. lateral attenuation.

129
RAAF Base Darwin – Noise and Flight Path Monitoring System 14 March 2012 File name: DWN NFPMS Q2 2011 Report V2.1.doc Q2 2011 Report
3.2.8 Atmospheric absorption influences the propagation of aircraft noise and hence the
impact on the community. Temperature and humidity affect the absorptive properties of the
atmosphere; this in turn affects change in the rate of the attenuation, which is not the same
over the audible frequency spectrum. For example, over distances lower frequency sounds are
less attenuated than higher frequency sounds. Cloud cover affects how aircraft noise is
reflected and carried through the atmosphere. For example, cloud cover tends to reflect
aircraft noise and therefore on a cloudy day aircraft noise will be carried over a longer
distance.
3.2.9 Wind direction and strength can also impact on the propagation of the aircraft noise
through the atmosphere. The propagation of noise from source to receiver will vary whether
the receiver is upwind, downwind or crosswind from the source. Similarly, the strength of the
wind can increase or decrease the sound depending on the relative positions of the source and
the receiver.
3.2.10 Temperature gradient, particularly where there is an occurrence of temperature
inversion, will also impact on the noise received at a monitor from a particular aircraft
operation. Depending on the conditions existing at the time the sound waves may be
dispersed upwards, downwards, towards or away from the receiver.
3.2.11 Lateral attenuation is described as being the absorption of aircraft noise from the
ground, diffraction and directivity effects. Lateral attenuation is considered as excess
attenuation, whereas by the same token the noise may be reflected from water bodies;
expanses of hard surfaces etc. and cause an increase in the noise level thereby reducing the
attenuation.
3.2.12 Weather data for RAAF Base Darwin is collected by the Darwin RAAF
Meteorological Office. The relevant monthly weather data can be compared with the long
term average over the last 70 years to determine whether there have been any abnormal
weather conditions. Detailed weather information for RAAF Base Darwin for the previous 14
months is available on the internet at the following site:
http://www.bom.gov.au/climate/dwo/IDCJDW2145.latest.shtml.

130
14 March 2012 RAAF Base Darwin – Noise and Flight Path Monitoring System Q2 2011 Report File name: DWN NFPMS Q2 2011 Report V2.1.doc
3.3 Noise Environment at RAAF Base Darwin
NMT Locations
3.3.1 The community-based NMT locations in the vicinity of RAAF Base Darwin have
been located to report the noise exposure from aircraft operations associated with the Base.
The noise exposure at each community-based NMT location is assessed in this report and
details of the aircraft operations which triggered a noise event documented.
3.3.2 4 NMTs have been located outside the Base within communities in the vicinity of the
airfield. These NMTs are illustrated on Figure 36 – NMT Location Plan and have
been installed at the following locations:
a. Ludmilla Primary School
b. Jingili Primary School
c. Karama Primary School
d. Berrimah Farm
3.3.3 Figure 36 shows graduated shading with a radius of up to 3.5 km from each NMT
location. This zone identifies the area where aircraft are likely to generate a noise
event at the NMT location. Analysis of the NFPMS data revealed that an aircraft
with a high noise signature such as a F/A-18 Hornet can register a noise event at a
NMT as far away as 3.5 km, whereas less noisy aircraft such as light civil aircraft
needed to be much closer to the NMT to register a noise event.

131
RAAF Base Darwin – Noise and Flight Path Monitoring System 14 March 2012 File name: DWN NFPMS Q2 2011 Report V2.1.doc Q2 2011 Report
INSERT FIGURE 36 (NMT LOCATION PLAN)

132
14 March 2012 RAAF Base Darwin – Noise and Flight Path Monitoring System Q2 2011 Report File name: DWN NFPMS Q2 2011 Report V2.1.doc
BLANK PAGE

133
RAAF Base Darwin – Noise and Flight Path Monitoring System 14 March 2012 File name: DWN NFPMS Q2 2011 Report V2.1.doc Q2 2011 Report
24 Hour Average LAeq
3.3.4 Table 4 shows the monthly and quarterly average 24 hour LAeq of all correlated
aircraft noise events recorded for each of the NMTs at RAAF Base Darwin, including those by
unknown aircraft. The average 24 hour LAeq value is the logarithmic average of all the
recorded aircraft noise events. The logarithmic averages are calculated by converting the daily
LAeq values to the equivalent acoustic energy and then averaging the acoustic energy over the
total time period. The resultant average acoustic energy is then converted back to a LAeq
value (in dB(A)). A more detailed breakdown of the 24 hour LAeq for each day of each
month for each NMT can be found in Annex C – Community Exposure to Aircraft Noise,
Tables C1 to C3.
Table 4 – Average 24 Hour LAeq Aircraft Noise – Quarter 2 2011
NMT April
2011
May
2011
June
2011
Average for
Q2 2011
Berrimah Farm 51.7 51.7 52.8 52.1
Karama Primary School 39.8 46.2 39.6 43.1
Jingili Primary School 41.9 42.6 43.7 42.8
Ludmilla Primary School 52.4 51.4 58.9 55.6

134
14 March 2012 RAAF Base Darwin – Noise and Flight Path Monitoring System Q2 2011 Report File name: DWN NFPMS Q2 2011 Report V2.1.doc
3.3.5 Table 5 shows the quarterly average 24 hour LAeq of all correlated aircraft noise
events recorded for each of the NMTs for Quarter 4 and each of the preceding three quarters.
This table shows all recorded noise events including those by unknown aircraft.
Table 5 – Quarterly Average 24 Hour LAeq Aircraft Noise
NMT Q2 2011 Q1 2011 Q4 2010 Q3 2010
Berrimah Farm 52.1 44.2 45.3 N/A
Karama Primary School 43.1 40.5 45.5 N/A
Jingili Primary School 42.8 41.7 43.0 N/A
Ludmilla Primary School 55.6 44.1 42.7 N/A
3.3.6 The highest average 24 hour LAeq reading of 55.6 dB(A) for Quarter 2 2011 was
recorded at the Ludmilla Primary School location. The lowest average 24 hour LAeq reading
of 42.8 dB(A) for Quarter 2 2011 was recorded at the Jingili Primary School location.

135
RAAF Base Darwin – Noise and Flight Path Monitoring System 14 March 2012 File name: DWN NFPMS Q2 2011 Report V2.1.doc Q2 2011 Report
Average LAmax
3.3.7 Tables 6 to 8 summarise the aircraft noise events recorded by the DAR NFPMS at the
community-based NMT locations. These tables include all correlated aircraft noise events
including those by unknown aircraft. The average LAmax value is the arithmetic average
(mean) of all the events. A more detailed breakdown of aircraft noise events by NMT can be
found in Annex C – Community Exposure to Aircraft Noise, Table C4 to C6.
3.3.8 Table 6 details the arithmetic average LAmax at the community-based NMT locations
for arrivals at RAAF Base Darwin.
Table 6 – Average LAmax – Arrivals – Quarter 2 2011
Aircraft RWY Berrimah
Farm NMT
Karama
Primary
School NMT
Jingili
Primary
School NMT
Ludmilla
Primary
School NMT
F/A-18 11 62.8 70.0 79.2 88.4
F-15 11 - - - 71.0
C-130/30J 11 - - - 76.5
C-135 11 - 72.3 - -
CL60 11 - - - 70.8
A320/321 11 - - - 71.1
B737 Series 11 54.8 - 55.4 67.1
Boeing 757-200 11 - - 56.3 -
Embraer 170/190 11 - - - 69.8
Beechcraft 1900D 11 - - 68.9 67.9
Dash 8 11 58.0 66.2 74.2 71.5
F100 11 - - - 68.0
F900 11 - - 73.3 -
Learjet 35/45 11 - - - 74.6
Metroliner 11 - 74.1 71.6 72.4
SAAB 340 11 - - 69.3 -
Light Civil 11 61.1 65.8 68.2 70.1
Helicopter 11 - - 73.0 66.5
Unknown 11 - 64.4 72.7 84.5
Beechcraft 1900D 18 - - 71.0 -
Dash 8 18 - - 69.1 -
Metroliner 18 - - 69.0 -
Light Civil 18 - - 69.6 -
Helicopter 18 - - 79.9 82.7
Unknown 18 - 71.2 69.8 71.5
F/A-18 29 65.4 - - 75.6
F15 29 59.7 - - -
C-130/30J 29 58.3 63.5 - -
C17 29 58.3 - - -
CL60 29 56.7 - - -
P-3C 29 61.7 - - -
A320/321 29 55.1 - - -
A340-300 29 56.0 - - -
Boeing 707-320 29 61.4 - - -
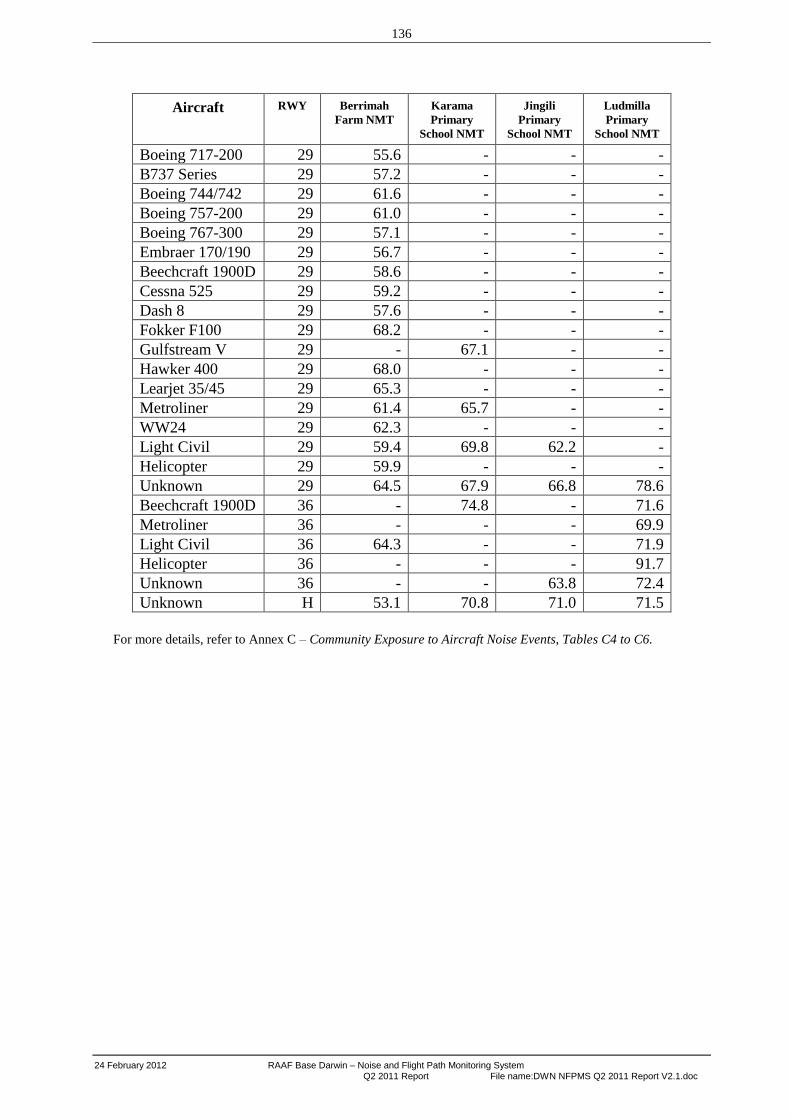
136
24 February 2012 RAAF Base Darwin – Noise and Flight Path Monitoring System Q2 2011 Report File name:DWN NFPMS Q2 2011 Report V2.1.doc
Aircraft RWY Berrimah
Farm NMT
Karama
Primary
School NMT
Jingili
Primary
School NMT
Ludmilla
Primary
School NMT
Boeing 717-200 29 55.6 - - -
B737 Series 29 57.2 - - -
Boeing 744/742 29 61.6 - - -
Boeing 757-200 29 61.0 - - -
Boeing 767-300 29 57.1 - - -
Embraer 170/190 29 56.7 - - -
Beechcraft 1900D 29 58.6 - - -
Cessna 525 29 59.2 - - -
Dash 8 29 57.6 - - -
Fokker F100 29 68.2 - - -
Gulfstream V 29 - 67.1 - -
Hawker 400 29 68.0 - - -
Learjet 35/45 29 65.3 - - -
Metroliner 29 61.4 65.7 - -
WW24 29 62.3 - - -
Light Civil 29 59.4 69.8 62.2 -
Helicopter 29 59.9 - - -
Unknown 29 64.5 67.9 66.8 78.6
Beechcraft 1900D 36 - 74.8 - 71.6
Metroliner 36 - - - 69.9
Light Civil 36 64.3 - - 71.9
Helicopter 36 - - - 91.7
Unknown 36 - - 63.8 72.4
Unknown H 53.1 70.8 71.0 71.5
For more details, refer to Annex C – Community Exposure to Aircraft Noise Events, Tables C4 to C6.

137
RAAF Base Darwin – Noise and Flight Path Monitoring System 14 March 2012 File name: DWN NFPMS Q2 2011 Report V2.1.doc Q2 2011 Report
3.3.9 Table 7 details the arithmetic average LAmax at the community-based NMT locations
for departures at RAAF Base Darwin.
Table 7 – Average LAmax – Departures – Quarter 2 2011
Aircraft RWY Berrimah
Farm NMT
Karama
Primary
School NMT
Jingili
Primary
School NMT
Ludmilla
Primary
School NMT
F/A-18 11 88.9 79.6 83.6 92.6
F-15 11 86.8 83.7 81.3 84.7
C-17 11 72.1 - - -
C-130/30J 11 67.8 - - 71.2
CL60 11 67.3 - - -
P-3C 11 65.6 - - -
PC9 11 66.4 - - -
A320/321 11 65.5 61.3 64.9 71.2
A330-300 11 68.5 - - -
A340-300 11 68.8 56.9 59.6 63.1
Boeing 707-320 11 78.7 - - -
Boeing 717-200 11 64.0 - - -
B737 Series 11 67.0 - - 67.1
Boeing 744/742 11 70.7 - - -
Boeing 757-200 11 66.8 57.6 60.0 -
Boeing 767-300 11 68.4 - - -
Boeing KC-135 11 72.6 - - -
Cessna 525 11 64.1 - - -
Embraer 170/190 11 65.3 64.6 - -
Fokker F100 11 64.7 - - -
F2TH 11 58.8 - 54.7 -
GL5T 11 66.5 - - -
Gulfstream V 11 63.6 - - -
D328 11 56.6 - - -
Dash 8 11 - 78.7 64.4 -
DC-10 11 72.7 - - -
DC-93 11 78.0 - - -
Beechcraft 1900D 11 65.9 68.2 - 68.7
Ilyushin –II-76 11 71.9 - - -
Learjet 35/45 11 66.9 - - 72.4
Metroliner 11 65.6 71.1 66.2 70.0
Hawker 400 11 65.5 - - -
Hawker 800 11 65.0 - - -
SAAB 340 11 65.9 - - -
WW24 11 65.5 - - -
Light Civil 11 64.5 68.1 66.6 69.0
Unknown 11 76.1 72.1 75.2 82.4
Helicopter 11 62.5 59.0 64.6 68.5
Metroliner 18 - - 70.9 69.0
Light Civil 18 - - 71.0 69.1
Unknown 18 - - 68.4 71.0
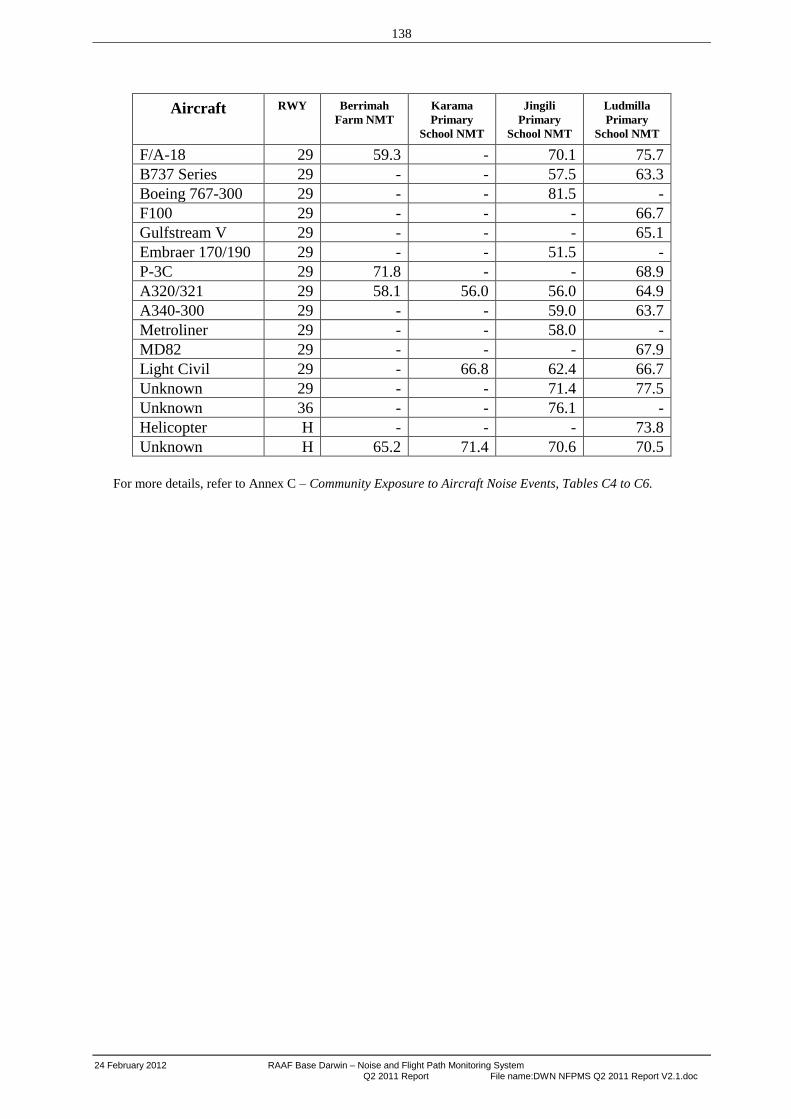
138
24 February 2012 RAAF Base Darwin – Noise and Flight Path Monitoring System Q2 2011 Report File name:DWN NFPMS Q2 2011 Report V2.1.doc
Aircraft RWY Berrimah
Farm NMT
Karama
Primary
School NMT
Jingili
Primary
School NMT
Ludmilla
Primary
School NMT
F/A-18 29 59.3 - 70.1 75.7
B737 Series 29 - - 57.5 63.3
Boeing 767-300 29 - - 81.5 -
F100 29 - - - 66.7
Gulfstream V 29 - - - 65.1
Embraer 170/190 29 - - 51.5 -
P-3C 29 71.8 - - 68.9
A320/321 29 58.1 56.0 56.0 64.9
A340-300 29 - - 59.0 63.7
Metroliner 29 - - 58.0 -
MD82 29 - - - 67.9
Light Civil 29 - 66.8 62.4 66.7
Unknown 29 - - 71.4 77.5
Unknown 36 - - 76.1 -
Helicopter H - - - 73.8
Unknown H 65.2 71.4 70.6 70.5
For more details, refer to Annex C – Community Exposure to Aircraft Noise Events, Tables C4 to C6.

139
RAAF Base Darwin – Noise and Flight Path Monitoring System 14 March 2012 File name: DWN NFPMS Q2 2011 Report V2.1.doc Q2 2011 Report
3.3.10 Table 8 details the arithmetic average LAmax at the community-based NMT locations
for circuit movements at RAAF Base Darwin.
Table 8 – Average LAmax – Circuits – Quarter 2 2011
Aircraft RWY Berrimah
Farm NMT
Karama
Primary
School NMT
Jingili
Primary
School NMT
Ludmilla
Primary
School NMT
A320/321 11 61.5 - - 68.1
C130/30J 11 - 76.5 - -
Embraer 170/190 11 61.5 - - 79.8
Hawker 800 11 55.6 - - -
B737 Series 11 61.9 - - -
Boeing 717-200 11 62.6 - - -
Dash 8 11 - - 72.4 -
D328 11 54.1 - - -
Light Civil 11 66.2 65.1 74.4 80.3
Unknown 11 66.0 69.2 69.4 70.1
Light Civil 18 - - 65.9 65.9
Unknown 18 - - 72.6 68.4
F-15 29 - - 77.9 83.5
A320/321 29 53.4 - - -
Beechcraft 1900D 29 - - 71.6 -
Dash 8 29 78.4 - - -
Light Civil 29 66.4 66.8 71.1 78.8
Helicopter 29 60.4 - - 67.7
Unknown 29 64.0 67.2 68.2 69.7
Beechcraft 1900D 36 - - 72.6 -
Metroliner 36 - - 64.7 -
Light Civil 36 63.8 - 66.2 -
Unknown 36 67.3 69.6 70.2 68.4
Unknown H 64.1 67.9 70.5 71.0
For more details, refer to Annex C – Community Exposure to Aircraft Noise Events, Tables C4 to C6.
3.3.11 For more details, refer to Annex C – Community Exposure to Aircraft Noise Events,
Table C4 to C6.

140
24 February 2012 RAAF Base Darwin – Noise and Flight Path Monitoring System Q2 2011 Report File name:DWN NFPMS Q2 2011 Report V2.1.doc
NA Noise Events
3.3.12 Table 9 details the noise events from all recorded aircraft (military, civil and unknown)
in terms of N70 and N85 for Quarter 2 2011. There were 91 days in the quarter, so the average
number of aircraft noise events per day is simply the total number of events divided by 91.
Table 9 – N70 and N85 Noise Events for All Aircraft for Quarter 2 2011
Berrimah
Farm NMT
Karaman
Primary School
NMT
Jingili
Primary
School
NMT
Ludmilla
Primary
School
NMT
Total N70 Events 262 335 255 419
Average N70 Events 2.9 3.7 2.8 4.6
Total N85 Events 70 8 8 106
Average N85 Events 0.8 0.1 0.1 1.2 Note – Average N70 and N85 events calculated based on 91 days
3.3.13 Table 10 details the noise events from known military aircraft movements in terms of
N70 and N85 for Quarter 2 2011. Some military aircraft movements may be classified in the
unknown category and therefore are not included in Table 10. There were 65 operational days
in the quarter, so the average number of aircraft noise events per day is simply the total number
of noise events from military aircraft movements divided by 65.
Table 10 – N70 and N85 Noise Events for Military Aircraft for Quarter 2 2011
Berrimah
Farm NMT
Karama
Primary
School
NMT
Jingili
Primary
School
NMT
Ludmilla
Primary
School
NMT
Total N70 Events 29 12 17 37
Average N70 Events 0.5 0.2 0.3 0.6
Total N85 Events 7 2 2 13
Average N85 Events 0.1 0.1 0.1 0.2 Note – Average N70 and N85 events calculated based on 65 days

141
RAAF Base Darwin – Noise and Flight Path Monitoring System 14 March 2012 File name: DWN NFPMS Q2 2011 Report V2.1.doc Q2 2011 Report
Table 11 details the noise events from known civil aircraft movements in terms of N70 and N85
for Quarter 2 2011. Some civil aircraft movements may be classified in the unknown category
and therefore are not be included in Table 11. There were 91 days in the quarter so the average
number of aircraft noise events per day is simply the total number of noise events from civil
aircraft movements divided by 91.
Table 11 – N70 and N85 Noise Events for Civil Aircraft for Quarter 2 2011
Berrimah
Farm NMT
Karama
Primary
School
NMT
Jingili
Primary
School
NMT
Ludmilla
Primary
School
NMT
Total N70 Events 125 113 65 79
Average N70 Events 1.4 1.2 0.7 0.9
Total N85 Events 1 - - 2
Average N85 Events 0.01 - - 0.02 Note – Average N70 and N85 events calculated based on 91 days in the quarter.

142
24 February 2012 RAAF Base Darwin – Noise and Flight Path Monitoring System Q2 2011 Report File name:DWN NFPMS Q2 2011 Report V2.1.doc
BLANK PAGE

RAAF Base Darwin – Noise and Flight Path Monitoring System 24 February 2012 File name: DWN NFPMS Q2 2011 Report V2.1.doc Q2 2011 Report
Annex A
Glossary

24 February 2012 RAAF Base Darwin – Noise and Flight Path Monitoring System Q2 2011 Report File name:DWN NFPMS Q2 2011 Report V2.1.doc
BLANK PAGE
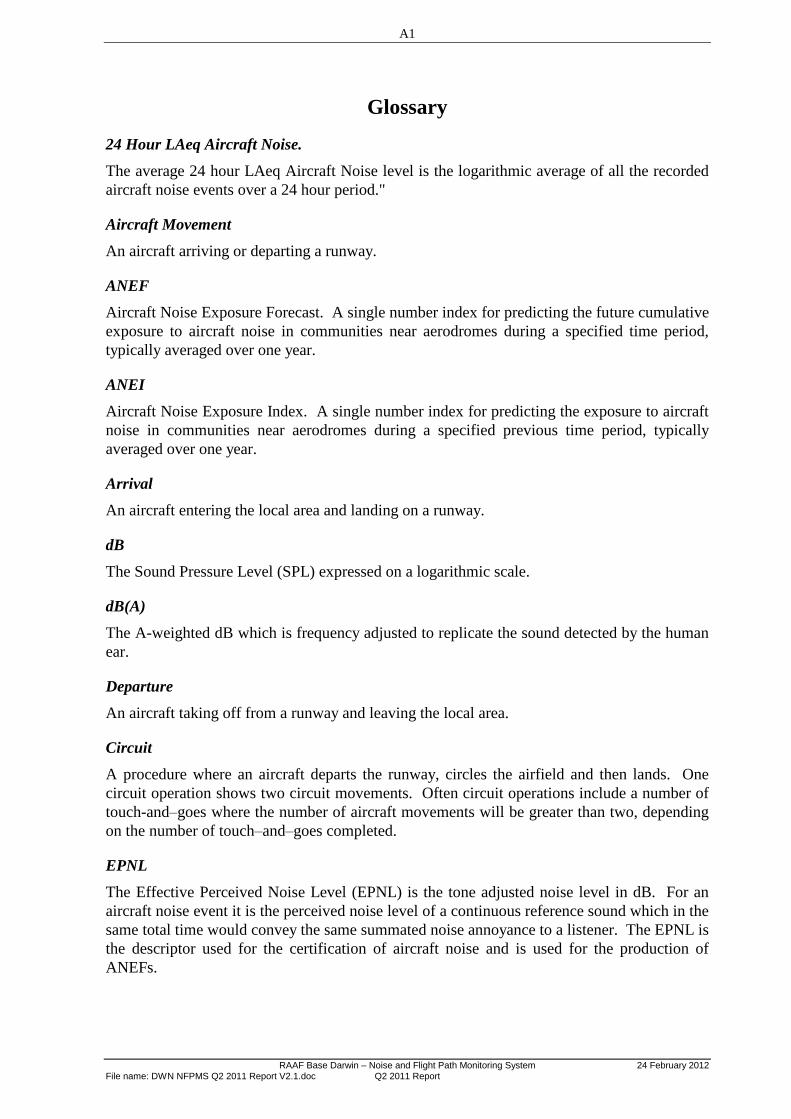
A1
RAAF Base Darwin – Noise and Flight Path Monitoring System 24 February 2012 File name: DWN NFPMS Q2 2011 Report V2.1.doc Q2 2011 Report
Glossary
24 Hour LAeq Aircraft Noise.
The average 24 hour LAeq Aircraft Noise level is the logarithmic average of all the recorded
aircraft noise events over a 24 hour period."
Aircraft Movement
An aircraft arriving or departing a runway.
ANEF
Aircraft Noise Exposure Forecast. A single number index for predicting the future cumulative
exposure to aircraft noise in communities near aerodromes during a specified time period,
typically averaged over one year.
ANEI
Aircraft Noise Exposure Index. A single number index for predicting the exposure to aircraft
noise in communities near aerodromes during a specified previous time period, typically
averaged over one year.
Arrival
An aircraft entering the local area and landing on a runway.
dB
The Sound Pressure Level (SPL) expressed on a logarithmic scale.
dB(A)
The A-weighted dB which is frequency adjusted to replicate the sound detected by the human
ear.
Departure
An aircraft taking off from a runway and leaving the local area.
Circuit
A procedure where an aircraft departs the runway, circles the airfield and then lands. One
circuit operation shows two circuit movements. Often circuit operations include a number of
touch-and–goes where the number of aircraft movements will be greater than two, depending
on the number of touch–and–goes completed.
EPNL
The Effective Perceived Noise Level (EPNL) is the tone adjusted noise level in dB. For an
aircraft noise event it is the perceived noise level of a continuous reference sound which in the
same total time would convey the same summated noise annoyance to a listener. The EPNL is
the descriptor used for the certification of aircraft noise and is used for the production of
ANEFs.

A2
24 February 2012 RAAF Base Darwin – Noise and Flight Path Monitoring System Q2 2011 Report File name:DWN NFPMS Q2 2011 Report V2.1.doc
LAmax
LAmax is the single event maximum A-weighted sound level reached during an aircraft
movement.
LAmax low value
This is the lowest LAmax value in a range of LAmax values for particular operations.
LAmax high value
This is the highest LAmax value in a range of LAmax values for particular operations.
LAmax average value
This is the arithmetically average of a range of LAmax values from the LAmax low value to
the LAmax high value for particular operations.
LAeq
The “equivalent noise level” (LAeq) is the energy equivalent noise level measured in A-
weighted decibels (dB(A)). It is a time-averaged sound level; a single-number value that
expresses the time-varying sound level for the specified period as though it were a constant
sound level with the same total sound energy as the time-varying level. Consequently the
LAeq is the constant noise level that if continued over the sample period would have the same
energy as the actual varying, measured sound level. The time period needs to be specified and
can be one hour, 24 hours or the operational hours of the Base.
Number Above (NA)
The NA contour for an airport represents the number of noise events occurring greater than a
particular dB(A) level over a specified time period. The greatest numbers of occurrences are
closer to aircraft flight tracks and the airport runway, and decreases as the distance from the
vicinity of these is increased. The N70 is the number of aircraft noise events above 70 dB(A)
for an average day. The 70 dB(A) is seen as a critical threshold value as it is equivalent to a
single internal noise event of 60 dB(A), assuming that the aircraft noise is attenuated by
approximately 10dB(A) by the fabric of a house with open windows. An aircraft noise event
of 60 dB(A) in a domestic dwelling will likely interfere with a conversation or listening of a
radio or television. An aircraft noise level of 70 dB(A) outside would require a person to raise
their voice noticeably.
The N70 is a good indication of aircraft noise because it represents the way in which aircraft
noise is generally perceived and experienced. The N70 contour is scalar, and as the number of
flights on a flight track doubles, the N70 event occurrence doubles. However like other noise
metrics, the N70 contour can give the impression that no aircraft noise occurs outside the
contours, which is not the case.
Other NA parameters are often produced such as the N80, N85, N90, N95 and N100. The
N85 parameter is important as 85 dB(A) is the noise level which represents the practical limit
where residential building noise insulation can reduce the internal noise to an acceptable level.
A Noise and Flight Path Monitoring Systems (NFPMS) gathers the noise information with
respect to the monitoring site. The measured NA values provide information that is preferred
by some people as an aircraft noise descriptor, and provides a tool for checking the position of
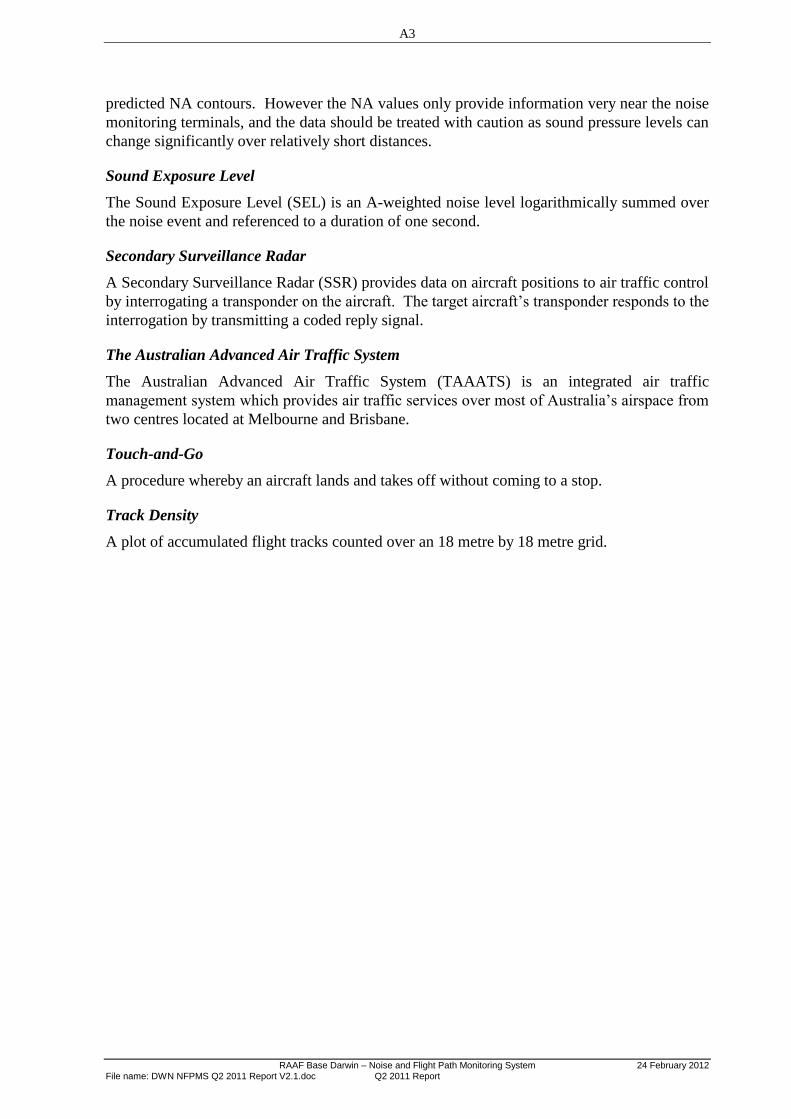
A3
RAAF Base Darwin – Noise and Flight Path Monitoring System 24 February 2012 File name: DWN NFPMS Q2 2011 Report V2.1.doc Q2 2011 Report
predicted NA contours. However the NA values only provide information very near the noise
monitoring terminals, and the data should be treated with caution as sound pressure levels can
change significantly over relatively short distances.
Sound Exposure Level
The Sound Exposure Level (SEL) is an A-weighted noise level logarithmically summed over
the noise event and referenced to a duration of one second.
Secondary Surveillance Radar
A Secondary Surveillance Radar (SSR) provides data on aircraft positions to air traffic control
by interrogating a transponder on the aircraft. The target aircraft’s transponder responds to the
interrogation by transmitting a coded reply signal.
The Australian Advanced Air Traffic System
The Australian Advanced Air Traffic System (TAAATS) is an integrated air traffic
management system which provides air traffic services over most of Australia’s airspace from
two centres located at Melbourne and Brisbane.
Touch-and-Go
A procedure whereby an aircraft lands and takes off without coming to a stop.
Track Density
A plot of accumulated flight tracks counted over an 18 metre by 18 metre grid.

A4
24 February 2012 RAAF Base Darwin – Noise and Flight Path Monitoring System Q2 2011 Report File name:DWN NFPMS Q2 2011 Report V2.1.doc
BLANK PAGE

RAAF Base Darwin – Noise and Flight Path Monitoring System 24 February 2012 File name: DWN NFPMS Q2 2011 Report V2.1.doc Q2 2011 Report
Annex B
Aircraft Movement Details

24 February 2012 RAAF Base Darwin – Noise and Flight Path Monitoring System Q2 2011 Report File name:DWN NFPMS Q2 2011 Report V2.1.doc
BLANK PAGE
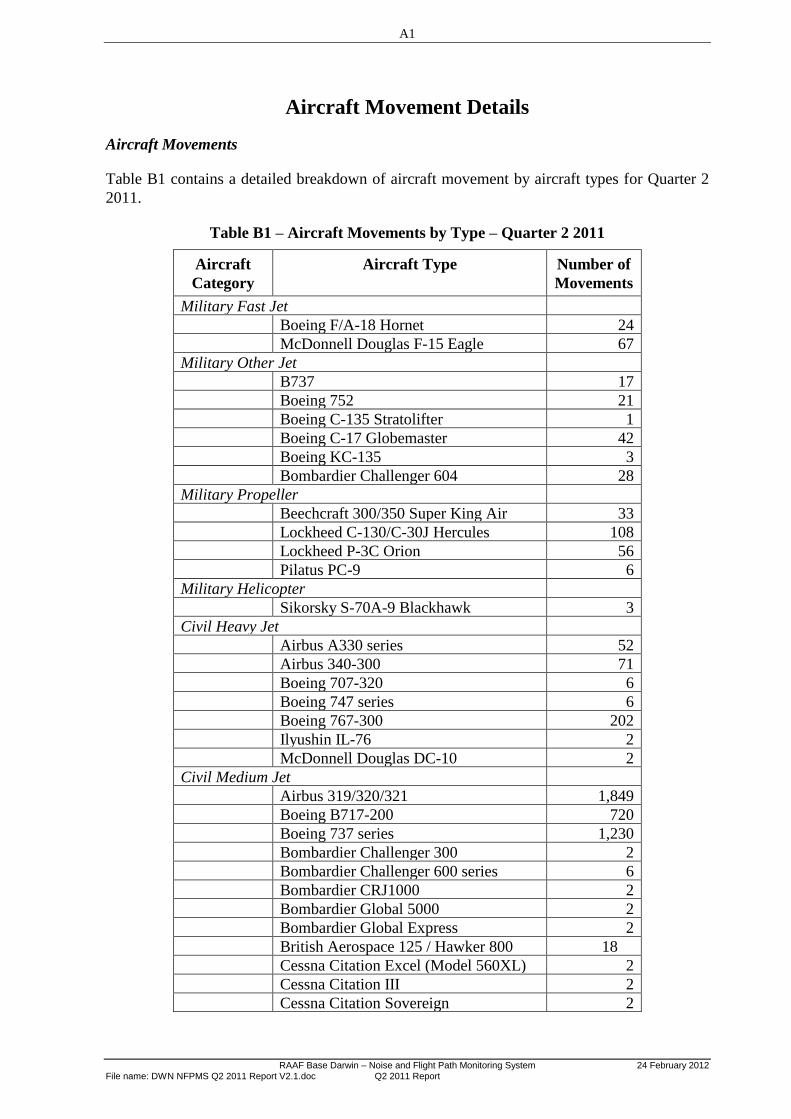
A1
RAAF Base Darwin – Noise and Flight Path Monitoring System 24 February 2012 File name: DWN NFPMS Q2 2011 Report V2.1.doc Q2 2011 Report
Aircraft Movement Details
Aircraft Movements
Table B1 contains a detailed breakdown of aircraft movement by aircraft types for Quarter 2
2011.
Table B1 – Aircraft Movements by Type – Quarter 2 2011
Aircraft
Category
Aircraft Type Number of
Movements
Military Fast Jet
Boeing F/A-18 Hornet 24
McDonnell Douglas F-15 Eagle 67
Military Other Jet
B737 17
Boeing 752 21
Boeing C-135 Stratolifter 1
Boeing C-17 Globemaster 42
Boeing KC-135 3
Bombardier Challenger 604 28
Military Propeller
Beechcraft 300/350 Super King Air 33
Lockheed C-130/C-30J Hercules 108
Lockheed P-3C Orion 56
Pilatus PC-9 6
Military Helicopter
Sikorsky S-70A-9 Blackhawk 3
Civil Heavy Jet
Airbus A330 series 52
Airbus 340-300 71
Boeing 707-320 6
Boeing 747 series 6
Boeing 767-300 202
Ilyushin IL-76 2
McDonnell Douglas DC-10 2
Civil Medium Jet
Airbus 319/320/321 1,849
Boeing B717-200 720
Boeing 737 series 1,230
Bombardier Challenger 300 2
Bombardier Challenger 600 series 6
Bombardier CRJ1000 2
Bombardier Global 5000 2
Bombardier Global Express 2
British Aerospace 125 / Hawker 800 18
Cessna Citation Excel (Model 560XL) 2
Cessna Citation III 2
Cessna Citation Sovereign 2

A2
24 February 2012 RAAF Base Darwin – Noise and Flight Path Monitoring System Q2 2011 Report File name:DWN NFPMS Q2 2011 Report V2.1.doc
Aircraft
Category
Aircraft Type Number of
Movements
Cessna Citation X 4
Dassault Falcon 900 4
Dassault Falcon 2000 8
Douglas DC-9-30 3
Embraer E-170/190 708
Fokker 100 89
Fokker F28 Fellowship 2
Gulfstream IV 2
Gulfstream V 4
Hawker 400 14
Hawker 4000 2
Learjet 35/45 121
Learjet 60 5
McDonnell Douglas DC-9 1
McDonnell Douglas MD-82 2
Israel Aircraft Industries Westwind 24 28
Civil Business Jet
Cessna Citation CJ2 (Model 525A) 20
Embraer Phenom 100-E50P 2
Civil Commuter Propeller
Beechcraft 1900D 1,020
Bombardier Dash 8- 100/200/300/Q400 376
Dornier 328 43
Fairchild Swearingen Metroliner 1,315
SAAB 340 235
Civil Light Propeller
AeroCommander 500 7
Beechcraft 200 King Air 835
Beechcraft 350 Super King Air 6
Beechcraft 55/58 Baron 336
Beechcraft Bonanza 36 1
Britten Norman BN-2A/B Islander 2
Britten Norman BN-2T Islander 2
Cessna 182 Skylane 2
Cessna 310 377
Cessna 402 1,111
Cessna 404 Titan 1,378
Cessna Caravan 2
Cessna C414 Chancellor 1
Cessna 441 Conquest II 608
Cessna Centurion 21
Cirrus SR22 1
Embraer EMB 120 Brasilia 723
Grumman G-73 Mallard 172
Pilatus PC-12 356
Piper PA-28 Arrow 2

A3
RAAF Base Darwin – Noise and Flight Path Monitoring System 24 February 2012 File name: DWN NFPMS Q2 2011 Report V2.1.doc Q2 2011 Report
Aircraft
Category
Aircraft Type Number of
Movements
Piper PA-31 Navajo 810
Piper PA-32 Lance 2/Saratoga 3
Piper PA-32R Saratoga 1
Piper PA-46 Malibu 3
Socata TBM 700 2
Civil Helicopter
Aerospatial AS-332 Super Puma 16
Bell 212 Twin Huey 2
MBB/Kawasaki BK 117 9
Sikorsky S-76 Spirit 3
Sikorsky S-92 75
Unknown aircraft type
Unknown aircraft type 8,729
TOTAL: 24,191

A4
24 February 2012 RAAF Base Darwin – Noise and Flight Path Monitoring System Q2 2011 Report File name:DWN NFPMS Q2 2011 Report V2.1.doc
Table B2 contains a detailed breakdown of aircraft arrival movements by aircraft types to each
of the two runways and helipads.
Table B2 – Aircraft Types – Arrivals – Quarter 2 2011
Aircraft Type RWY
11
RWY
18
RWY
29
RWY
36
RWY
H
Total
Military Fast Jet
Boeing F/A-18 Hornet 12 - 3 - - 15
McDonnell Douglas F-15 Eagle 55 - 8 - - 63
Military Other Jet
B737 5 - 4 - - 9
Boeing 752 8 - 3 - - 11
Boeing C-135 Stratolifter 1 - - - - 1
Boeing C-17 Globemaster 13 - 8 - - 21
Boeing KC-135 1 - - - - 1
Bombardier Challenger 604 7 - 7 - - 14
Military Propeller
Beechcraft 300/350 Super King Air 16 - - - - 16
Lockheed C-130/C-30J Hercules 33 - 19 - - 52
Lockheed P-3C Orion 13 - 7 - - 20
Pilatus PC-9 1 - - - - 1
Military Helicopter
Sikorsky S-70A-9 Blackhawk 2 - 1 - - 3
Civil Heavy Jet
Airbus A330 series 24 - 2 - - 26
Airbus 340-300 22 - 14 - - 36
Boeing 707-320 2 - 1 - - 3
Boeing 747 series 2 - 1 - - 3
Boeing 767-300 93 - 6 - - 99
Ilyushin IL-76 1 - - - - 1
McDonnell Douglas DC-10 1 - - - - 1
Civil Medium Jet
Airbus 319/320/321 687 - 229 - - 916
Boeing B717-200 179 - 177 - - 356
Boeing 737 series 456 - 154 - - 610
Bombardier Challenger 300 - - 1 - - 1
Bombardier Challenger 600 series 3 - - - - 3
Bombardier CRJ1000 1 - - - - 1
Bombardier Global 5000 1 - - - - 1
Bombardier Global Express 1 - - - - 1
British Aerospace 125 / Hawker 800 4 - 3 - - 7
Cessna Citation Excel (Model 560XL) - - 1 - - 1
Cessna Citation III 1 - - - - 1
Cessna Citation Sovereign 1 - - - - 1
Cessna Citation X - - 2 - - 2
Dassault Falcon 900 2 - - - - 2
Dassault Falcon 2000 4 - - - - 4
Douglas DC-9-30 1 - - - - 1

A5
RAAF Base Darwin – Noise and Flight Path Monitoring System 24 February 2012 File name: DWN NFPMS Q2 2011 Report V2.1.doc Q2 2011 Report
Aircraft Type RWY
11
RWY
18
RWY
29
RWY
36
RWY
H
Total
Embraer E-170/190 243 - 108 1 - 352
Fokker 100 27 - 17 - - 44
Fokker F28 Fellowship 1 - - - - 1
Gulfstream IV 1 - - - - 1
Gulfstream V 1 - 1 - - 2
Hawker 400 5 - 2 - - 7
Hawker 4000 1 - - - - 1
Learjet 35/45 29 - 31 - - 60
Learjet 60 2 - - - - 2
McDonnell Douglas DC-9 1 - - - - 1
McDonnell Douglas MD-82 - - 1 - - 1
Israel Aircraft Industries Westwind 24 12 - 5 - - 17
Civil Business Jet
Cessna Citation CJ2 (Model 525A) 8 - 2 - - 10
Embraer Phenom 100-E50P 1 - - - - 1
Civil Commuter Propeller
Beechcraft 1900D 383 6 90 19 - 498
Bombardier Dash 8- 100/200/300/Q400 181 1 95 15 - 292
Dornier 328 13 1 1 1 - 16
Fairchild Swearingen Metroliner 463 13 86 92 - 654
SAAB 340 80 1 31 6 - 118
Civil Light Propeller
Civil Light Propeller sub-total 2,065 98 627 539 - 3,329
Civil Helicopter
Aerospatial AS-332 Super Puma 6 1 - - 1 8
Bell 212 Twin Huey - - - - 1 1
MBB/Kawasaki BK 117 2 - 1 - - 3
Sikorsky S-76 Spirit - - - 1 - 1
Sikorsky S-92 33 1 - 2 - 36
Unknown aircraft type
Unknown 1,553 201 392 538 314 2,998
Total 6,764 323 2,141 1,214 316 10,758
The unknown aircraft type made up 27.9% of the total arrivals.
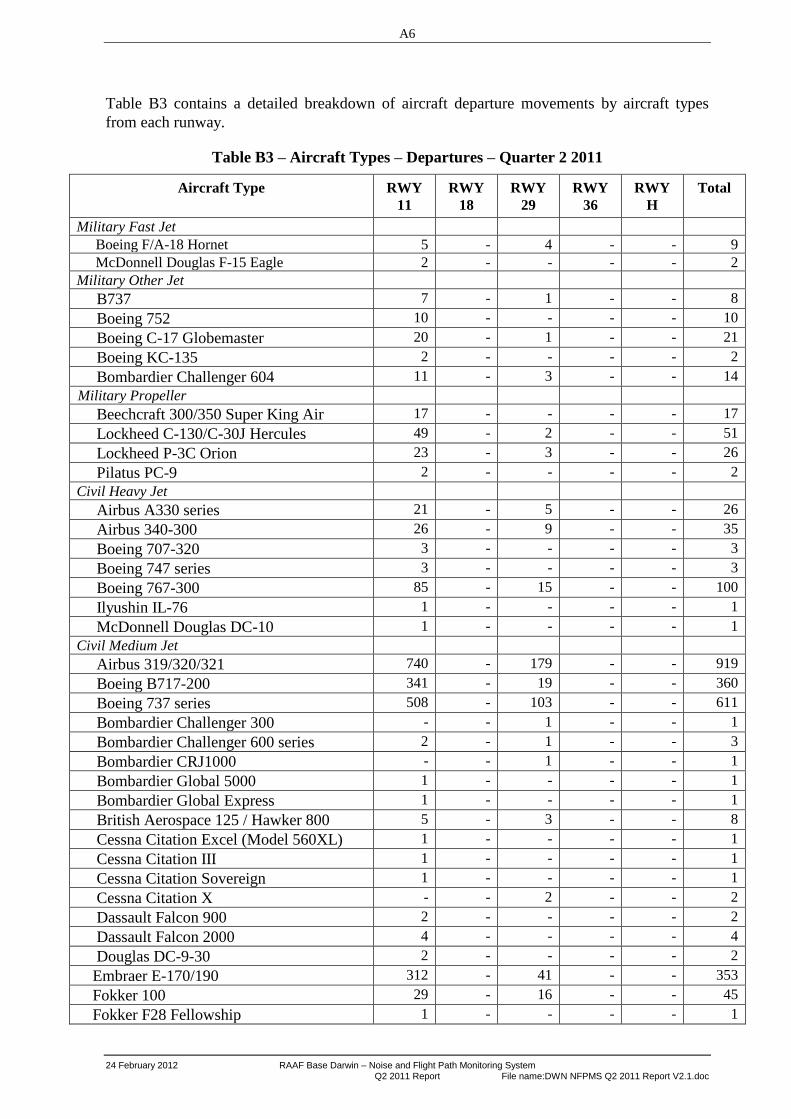
A6
24 February 2012 RAAF Base Darwin – Noise and Flight Path Monitoring System Q2 2011 Report File name:DWN NFPMS Q2 2011 Report V2.1.doc
Table B3 contains a detailed breakdown of aircraft departure movements by aircraft types
from each runway.
Table B3 – Aircraft Types – Departures – Quarter 2 2011
Aircraft Type RWY
11
RWY
18
RWY
29
RWY
36
RWY
H
Total
Military Fast Jet
Boeing F/A-18 Hornet 5 - 4 - - 9
McDonnell Douglas F-15 Eagle 2 - - - - 2
Military Other Jet
B737 7 - 1 - - 8
Boeing 752 10 - - - - 10
Boeing C-17 Globemaster 20 - 1 - - 21
Boeing KC-135 2 - - - - 2
Bombardier Challenger 604 11 - 3 - - 14
Military Propeller
Beechcraft 300/350 Super King Air 17 - - - - 17
Lockheed C-130/C-30J Hercules 49 - 2 - - 51
Lockheed P-3C Orion 23 - 3 - - 26
Pilatus PC-9 2 - - - - 2
Civil Heavy Jet
Airbus A330 series 21 - 5 - - 26
Airbus 340-300 26 - 9 - - 35
Boeing 707-320 3 - - - - 3
Boeing 747 series 3 - - - - 3
Boeing 767-300 85 - 15 - - 100
Ilyushin IL-76 1 - - - - 1
McDonnell Douglas DC-10 1 - - - - 1
Civil Medium Jet
Airbus 319/320/321 740 - 179 - - 919
Boeing B717-200 341 - 19 - - 360
Boeing 737 series 508 - 103 - - 611
Bombardier Challenger 300 - - 1 - - 1
Bombardier Challenger 600 series 2 - 1 - - 3
Bombardier CRJ1000 - - 1 - - 1
Bombardier Global 5000 1 - - - - 1
Bombardier Global Express 1 - - - - 1
British Aerospace 125 / Hawker 800 5 - 3 - - 8
Cessna Citation Excel (Model 560XL) 1 - - - - 1
Cessna Citation III 1 - - - - 1
Cessna Citation Sovereign 1 - - - - 1
Cessna Citation X - - 2 - - 2
Dassault Falcon 900 2 - - - - 2
Dassault Falcon 2000 4 - - - - 4
Douglas DC-9-30 2 - - - - 2
Embraer E-170/190 312 - 41 - - 353
Fokker 100 29 - 16 - - 45
Fokker F28 Fellowship 1 - - - - 1

A7
RAAF Base Darwin – Noise and Flight Path Monitoring System 24 February 2012 File name: DWN NFPMS Q2 2011 Report V2.1.doc Q2 2011 Report
Aircraft Type RWY
11
RWY
18
RWY
29
RWY
36
RWY
H
Total
Gulfstream IV 1 - - - - 1
Gulfstream V 1 - 1 - - 2
Hawker 400 5 - 2 - - 7
Hawker 4000 1 - - - - 1
Learjet 35/45 42 - 12 - - 54
Learjet 60 3 - - - - 3
McDonnell Douglas MD-82 - - 1 - - 1
Israel Aircraft Industries Westwind 24 9 - 2 - - 11
Civil Business Jet
Cessna Citation CJ2 (Model 525A) 9 - 1 - - 10
Embraer Phenom 100-E50P 1 - - - - 1
Civil Commuter Propeller
Beechcraft 1900D 462 - 45 - - 507
Bombardier Dash 8- 100/200/300/Q400 68 - 7 - - 75
Dornier 328 7 - - - - 7
Fairchild Swearingen Metroliner 528 60 62 1 - 651
SAAB 340 102 2 13 - - 117
Civil Light Propeller
Civil Light Propeller sub-total 2,668 268 379 1 - 3,316
Civil Helicopter
Aerospatial AS-332 Super Puma 4 - 3 - 1 8
Bell 212 Twin Huey - - - - 1 1
MBB/Kawasaki BK 117 3 - - - 1 4
Sikorsky S-76 Spirit - - - - 2 2
Sikorsky S-92 29 - 6 - - 35
Unknown aircraft type
Unknown 2,371 331 268 8 286 3,264
Total 8,553 661 1,211 10 291 10,726
The unknown aircraft type made up 30.4% of the total departures.

A8
24 February 2012 RAAF Base Darwin – Noise and Flight Path Monitoring System Q2 2011 Report File name:DWN NFPMS Q2 2011 Report V2.1.doc
Table B4 contains a detailed breakdown of circuit movements by aircraft types on each
runway.
Table B4 – Aircraft Types – Circuit Movements – Quarter 2 2011
Aircraft Type RWY
11
RWY
18
RWY
29
RWY
36
H Total
Military Fast Jet
McDonnell Douglas F-15 Eagle - - 2 - - 2
Military Propeller
Lockheed C-130/C-30J Hercules 5 - - - - 5
Lockheed P-3C Orion 10 - - - - 10
Pilatus PC-9 3 - - - - 3
Civil Heavy Jet
Boeing 767-300 3 - - - - 3
Civil Medium Jet
Airbus 319/320/321 3 - 11 - - 14
Boeing B717-200 4 - - - - 4
Boeing 737 series 9 - - - - 9
Embraer E-170/190 3 - - - - 3
British Aerospace 125 / Hawker 800 3 - - - - 3
Learjet 35/45 5 - 2 - - 7
Civil Commuter Propeller
Beechcraft 1900D 5 - 2 8 - 15
Bombardier Dash 8- 100/200/300/Q400 2 - 5 2 - 9
Dornier 328 16 - 4 - - 20
Fairchild Swearingen Metroliner 7 - - 3 - 10
Civil Light Propeller
Civil Light Propeller sub-total 60 8 41 8 - 117
Civil Helicopter
MBB/Kawasaki BK 117 - - - - 2 2
Sikorsky S-92 - - 4 - - 4
Unknown aircraft type
Unknown 1,520 94 614 86 153 2,467
Total 1,658 102 685 107 155 2,707
The unknown aircraft type made up 91.1% of the total circuit movements.
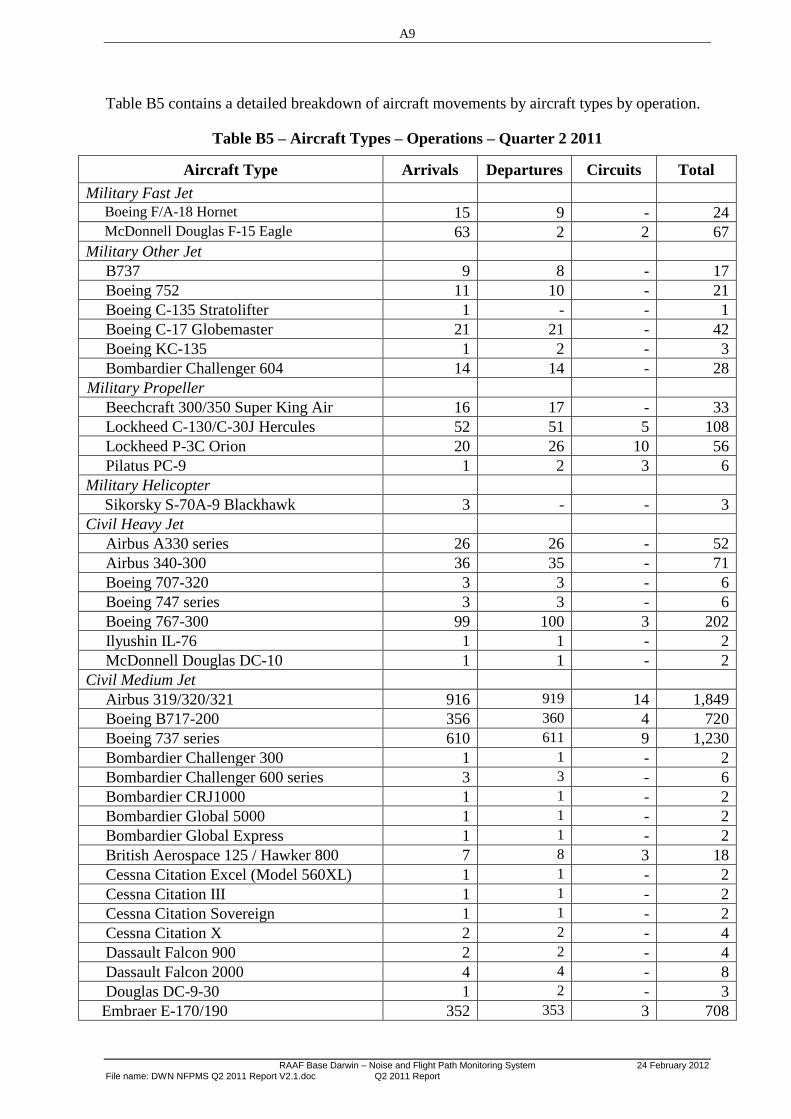
A9
RAAF Base Darwin – Noise and Flight Path Monitoring System 24 February 2012 File name: DWN NFPMS Q2 2011 Report V2.1.doc Q2 2011 Report
Table B5 contains a detailed breakdown of aircraft movements by aircraft types by operation.
Table B5 – Aircraft Types – Operations – Quarter 2 2011
Aircraft Type Arrivals Departures Circuits Total
Military Fast Jet
Boeing F/A-18 Hornet 15 9 - 24
McDonnell Douglas F-15 Eagle 63 2 2 67
Military Other Jet
B737 9 8 - 17
Boeing 752 11 10 - 21
Boeing C-135 Stratolifter 1 - - 1
Boeing C-17 Globemaster 21 21 - 42
Boeing KC-135 1 2 - 3
Bombardier Challenger 604 14 14 - 28
Military Propeller
Beechcraft 300/350 Super King Air 16 17 - 33
Lockheed C-130/C-30J Hercules 52 51 5 108
Lockheed P-3C Orion 20 26 10 56
Pilatus PC-9 1 2 3 6
Military Helicopter
Sikorsky S-70A-9 Blackhawk 3 - - 3
Civil Heavy Jet
Airbus A330 series 26 26 - 52
Airbus 340-300 36 35 - 71
Boeing 707-320 3 3 - 6
Boeing 747 series 3 3 - 6
Boeing 767-300 99 100 3 202
Ilyushin IL-76 1 1 - 2
McDonnell Douglas DC-10 1 1 - 2
Civil Medium Jet
Airbus 319/320/321 916 919 14 1,849
Boeing B717-200 356 360 4 720
Boeing 737 series 610 611 9 1,230
Bombardier Challenger 300 1 1 - 2
Bombardier Challenger 600 series 3 3 - 6
Bombardier CRJ1000 1 1 - 2
Bombardier Global 5000 1 1 - 2
Bombardier Global Express 1 1 - 2
British Aerospace 125 / Hawker 800 7 8 3 18
Cessna Citation Excel (Model 560XL) 1 1 - 2
Cessna Citation III 1 1 - 2
Cessna Citation Sovereign 1 1 - 2
Cessna Citation X 2 2 - 4
Dassault Falcon 900 2 2 - 4
Dassault Falcon 2000 4 4 - 8
Douglas DC-9-30 1 2 - 3
Embraer E-170/190 352 353 3 708
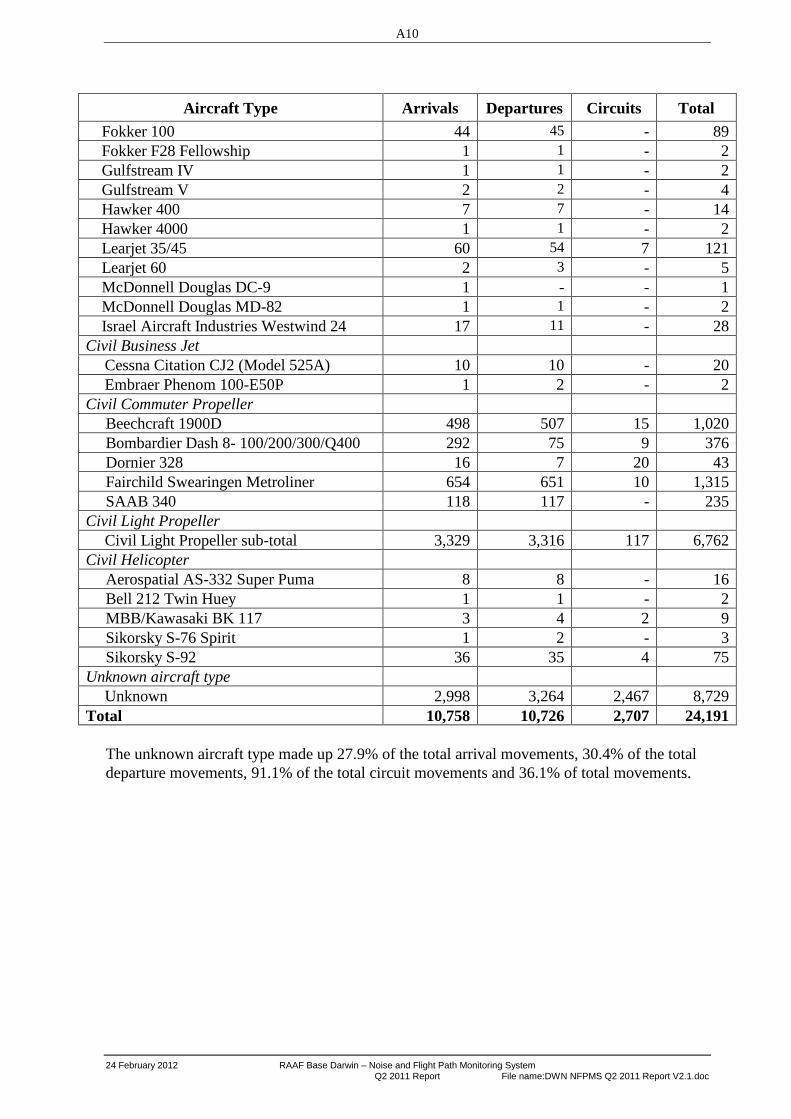
A10
24 February 2012 RAAF Base Darwin – Noise and Flight Path Monitoring System Q2 2011 Report File name:DWN NFPMS Q2 2011 Report V2.1.doc
Aircraft Type Arrivals Departures Circuits Total
Fokker 100 44 45 - 89
Fokker F28 Fellowship 1 1 - 2
Gulfstream IV 1 1 - 2
Gulfstream V 2 2 - 4
Hawker 400 7 7 - 14
Hawker 4000 1 1 - 2
Learjet 35/45 60 54 7 121
Learjet 60 2 3 - 5
McDonnell Douglas DC-9 1 - - 1
McDonnell Douglas MD-82 1 1 - 2
Israel Aircraft Industries Westwind 24 17 11 - 28
Civil Business Jet
Cessna Citation CJ2 (Model 525A) 10 10 - 20
Embraer Phenom 100-E50P 1 2 - 2
Civil Commuter Propeller
Beechcraft 1900D 498 507 15 1,020
Bombardier Dash 8- 100/200/300/Q400 292 75 9 376
Dornier 328 16 7 20 43
Fairchild Swearingen Metroliner 654 651 10 1,315
SAAB 340 118 117 - 235
Civil Light Propeller
Civil Light Propeller sub-total 3,329 3,316 117 6,762
Civil Helicopter
Aerospatial AS-332 Super Puma 8 8 - 16
Bell 212 Twin Huey 1 1 - 2
MBB/Kawasaki BK 117 3 4 2 9
Sikorsky S-76 Spirit 1 2 - 3
Sikorsky S-92 36 35 4 75
Unknown aircraft type
Unknown 2,998 3,264 2,467 8,729
Total 10,758 10,726 2,707 24,191
The unknown aircraft type made up 27.9% of the total arrival movements, 30.4% of the total
departure movements, 91.1% of the total circuit movements and 36.1% of total movements.
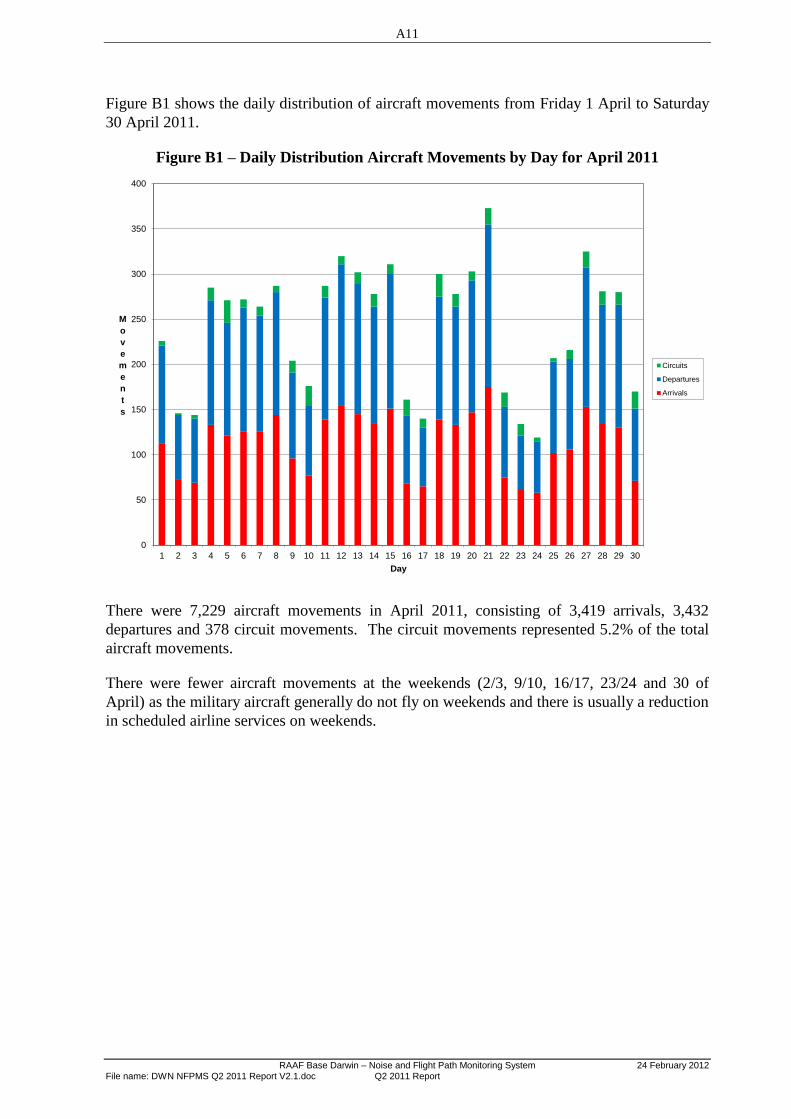
A11
RAAF Base Darwin – Noise and Flight Path Monitoring System 24 February 2012 File name: DWN NFPMS Q2 2011 Report V2.1.doc Q2 2011 Report
Figure B1 shows the daily distribution of aircraft movements from Friday 1 April to Saturday
30 April 2011.
Figure B1 – Daily Distribution Aircraft Movements by Day for April 2011
0
50
100
150
200
250
300
350
400
1 2 3 4 5 6 7 8 9 10 11 12 13 14 15 16 17 18 19 20 21 22 23 24 25 26 27 28 29 30
M
o
v
e
m
e
n
t
s
Day
Circuits
Departures
Arrivals
There were 7,229 aircraft movements in April 2011, consisting of 3,419 arrivals, 3,432
departures and 378 circuit movements. The circuit movements represented 5.2% of the total
aircraft movements.
There were fewer aircraft movements at the weekends (2/3, 9/10, 16/17, 23/24 and 30 of
April) as the military aircraft generally do not fly on weekends and there is usually a reduction
in scheduled airline services on weekends.
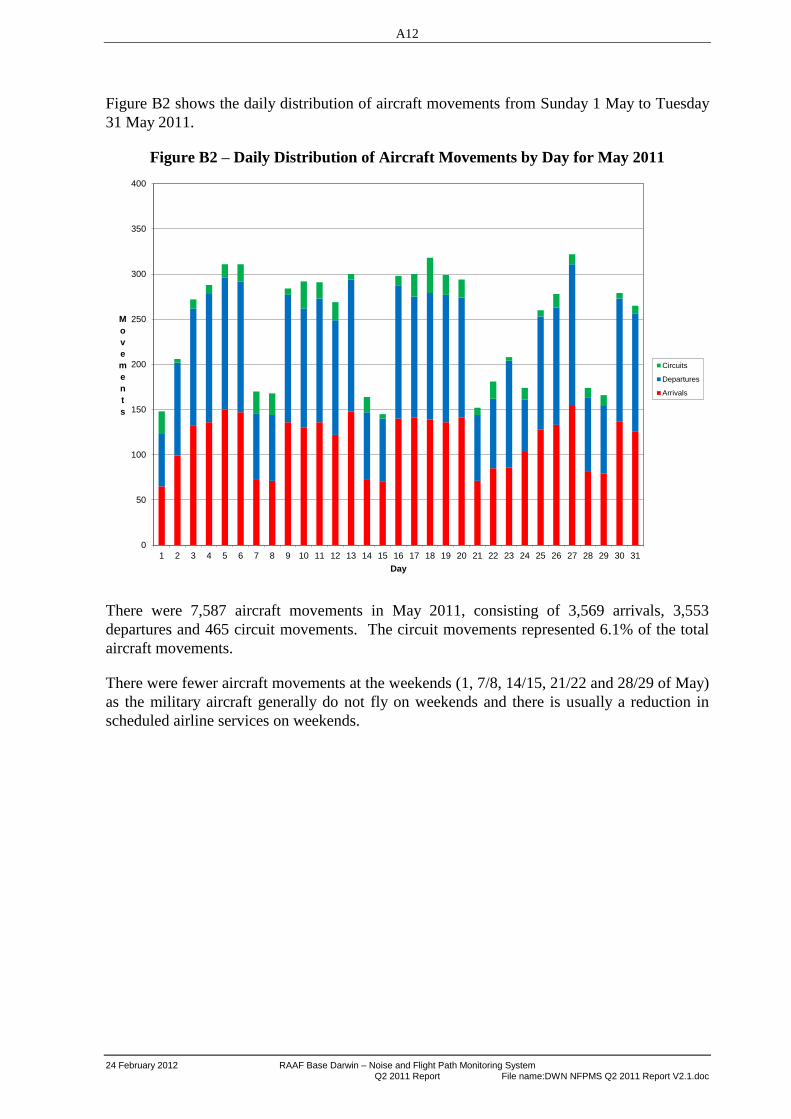
A12
24 February 2012 RAAF Base Darwin – Noise and Flight Path Monitoring System Q2 2011 Report File name:DWN NFPMS Q2 2011 Report V2.1.doc
Figure B2 shows the daily distribution of aircraft movements from Sunday 1 May to Tuesday
31 May 2011.
Figure B2 – Daily Distribution of Aircraft Movements by Day for May 2011
0
50
100
150
200
250
300
350
400
1 2 3 4 5 6 7 8 9 10 11 12 13 14 15 16 17 18 19 20 21 22 23 24 25 26 27 28 29 30 31
M
o
v
e
m
e
n
t
s
Day
Circuits
Departures
Arrivals
There were 7,587 aircraft movements in May 2011, consisting of 3,569 arrivals, 3,553
departures and 465 circuit movements. The circuit movements represented 6.1% of the total
aircraft movements.
There were fewer aircraft movements at the weekends (1, 7/8, 14/15, 21/22 and 28/29 of May)
as the military aircraft generally do not fly on weekends and there is usually a reduction in
scheduled airline services on weekends.

A13
RAAF Base Darwin – Noise and Flight Path Monitoring System 24 February 2012 File name: DWN NFPMS Q2 2011 Report V2.1.doc Q2 2011 Report
Figure B3 shows the daily distribution of aircraft movements from Wednesday 1 June to
Thursday 30 June 2011.
Figure B3 –Daily Distribution of Aircraft Movements by Day for June 2011
0
50
100
150
200
250
300
350
400
1 2 3 4 5 6 7 8 9 10 11 12 13 14 15 16 17 18 19 20 21 22 23 24 25 26 27 28 29 30
M
o
v
e
m
e
n
t
s
Day
Circuits
Departures
Arrivals
There were 7,899 aircraft movements in June 2011, consisting of 3,770 arrivals, 3,741
departures and 388 circuit movements. The circuit movements represented 4.9% of the total
aircraft movements.
There were generally fewer aircraft movements at the weekends (4/5, 11/12, 18/19 and 25/26
of June) as the military aircraft generally do not fly on weekends and there is usually a
reduction in scheduled airline services on weekends.

A14
24 February 2012 RAAF Base Darwin – Noise and Flight Path Monitoring System Q2 2011 Report File name:DWN NFPMS Q2 2011 Report V2.1.doc
Figure B4 shows the aggregation of aircraft movements by time of day for the whole of the
period from Friday 1 April to Saturday 30 April 2011. Generally, most flights after 1700 h or
before 0700 h are likely to be civil aircraft operating to and from RAAF Base Darwin.
Figure B4 –Distribution of Aircraft Movements by Time of Day for April 2011
0
100
200
300
400
500
600
700
800
0 1 2 3 4 5 6 7 8 9 10 11 12 13 14 15 16 17 18 19 20 21 22 23
H
o
u
r
l
y
M
o
v
m
e
n
e
t
s
Hour of the Day
Circuits
Departures
Arrivals
In the early morning period between 0000 h and 0700 h, 7 military aircraft operations took
place in the month of April 2011. There were 4 operations by the RNZAF Boeing 752 during
the month of April, a departure of a P3 Orion at 0250 h on Friday 8 April, a departure of a
Bombardier Challenger 600 at approximately 0640 h on Friday 15 April and a departure of a
P3 Orion at approximately 0510 on Wednesday 20 April 2011.
Between 0000 h and 0600 h, there were 6 operations by civil heavy jet aircraft (Boeing 747
and Airbus 343), 395 operations by civil medium jet aircraft (such as Boeing 738, Learjet 35
and Airbus 320/321), 17 operations by civil medium propeller aircraft (such as Beechcraft
1900D and Bombardier Dash8), 75 operations by civil light aircraft, 2 operations by civil
helicopters and 6 operations by unknown aircraft during April 2011. Between 0600 h and
0700 h, there were a significant number of scheduled civil airline operations and 29 unknown
aircraft operations.
In the evening period between 1900 h and 2400 h, there were 12 military aircraft operations (1
C-130 Hurcules, 1 Bombardier Challenger 604, 6 F-15 Eagle aircraft and 4 P3 Orion), and
there were 443 civil aircraft operations during April 2011. Additionally, there were 105
aircraft operations by unknown aircraft the evening period between 1900 h and 2400 h during
April 2011.

A15
RAAF Base Darwin – Noise and Flight Path Monitoring System 24 February 2012 File name: DWN NFPMS Q2 2011 Report V2.1.doc Q2 2011 Report
Figure B5 shows the aggregation of aircraft movements by time of day for the whole of the
reporting period from Sunday 1 May to Tuesday 31 May 2011. Generally, most flights after
1700 h or before 0700 h are likely to be civil aircraft operating to and from RAAF Base
Darwin.
Figure B5 –Distribution of Aircraft Movements by Time of Day for May 2011
0
100
200
300
400
500
600
700
800
0 1 2 3 4 5 6 7 8 9 10 11 12 13 14 15 16 17 18 19 20 21 22 23
H
o
u
r
l
y
M
o
v
m
e
n
e
t
s
Hour of the Day
Circuits
Departures
Arrivals
In the early morning period between 0000 h and 0700 h, no military aircraft operations took
place in the month of May 2011.
Between 0000 h and 0600 h, there were 10 operations by civil heavy jet aircraft (Airbus 343
and Boeing 747), 357 operations by civil medium jet aircraft (such as Airbus 320/321, Boeing
738 and Hawker 400), 27 operations by civil medium propeller aircraft (Metroliner,
Beechcraft 1900D and Bombardier Dash8), 61 operations by civil light aircraft, 4 operations
by civil helicopters and 20 operations by unknown aircraft during May 2011. Between 0600 h
and 0700 h, there were a significant number of scheduled civil airline operations and 25
unknown aircraft operations.
In the evening period between 1900 h and 2400 h, there were 9 military aircraft operations (1
Beechcraft 350, 5 C-17 Globemaster and 3 C-130/30J Hercules), and there were 455 civil
aircraft operations during May 2011. Additionally, there were 158 aircraft operations by
unknown aircraft the evening period between 1900 h and 2400 h during May 2011.

A16
24 February 2012 RAAF Base Darwin – Noise and Flight Path Monitoring System Q2 2011 Report File name:DWN NFPMS Q2 2011 Report V2.1.doc
Figure B6 shows the aggregation of aircraft movements by time of day for the whole of the
reporting period from Wednesday 1 June to Thursday 30 June 2011. Generally, most flights
after 1700 h or before 0700 h are likely to be civil aircraft operating to and from RAAF Base
Darwin.
Figure B6 –Distribution of Aircraft Movements by Time of Day for June 2011
0
100
200
300
400
500
600
700
800
0 1 2 3 4 5 6 7 8 9 10 11 12 13 14 15 16 17 18 19 20 21 22 23
H
o
u
r
l
y
M
o
v
m
e
n
e
t
s
Hour of the Day
Circuits
Departures
Arrivals
In the early morning period between 0000 h and 0700 h, the were 4 military aircraft operations
in June 2011. A departure of a Beechcraft 350 at 0505 h on Saturday 18 June, A departure of a
C-130 Hercules at 0530 h on Tuesday 21 June, a departure of an FA-18 at approximately 0515
h on Wednesday 22 June and a departure of a Bombardier Challenger 604 at approximately
0600 h on Thursday 30 June 2011.
Between 0000 h and 0600 h, there were 17 operations by civil heavy jet aircraft (Airbus 343
and DC-10), 364 operations by civil medium jet aircraft (such as Airbus 320/321 and Boeing
738), 36 operations by civil medium propeller aircraft (Metroliner, Beechcraft 1900D, Dornier
328 and Bombardier Dash8), 63 operations by civil light aircraft, 2 operations by civil
helicopters and 20 operations by unknown aircraft during June 2011. Between 0600 h and
0700 h, there were a significant number of scheduled civil airline operations and 27 unknown
aircraft operations.
In the evening period between 1900 h and 2400 h, there were 11 military aircraft operations (1
Beechcraft 350, 1 RNZAF B752, 1 C-17 Globemaster, 1 C-130 Hercules, 3 Bombardier
Challenger 604 and 4 FA-18 aircraft), there were 507 civil aircraft operations during June
2011. Additionally, there were 152 aircraft operations by unknown aircraft the evening period
between 1900 h and 2400 h during June 2011.

RAAF Base Darwin – Noise and Flight Path Monitoring System 24 February 2012 File name: DWN NFPMS Q2 2011 Report V2.1.doc Q2 2011 Report
Annex C
Community Exposure to Aircraft Noise

24 February 2012 RAAF Base Darwin – Noise and Flight Path Monitoring System Q2 2011 Report File name:DWN NFPMS Q2 2011 Report V2.1.doc
BLANK PAGE
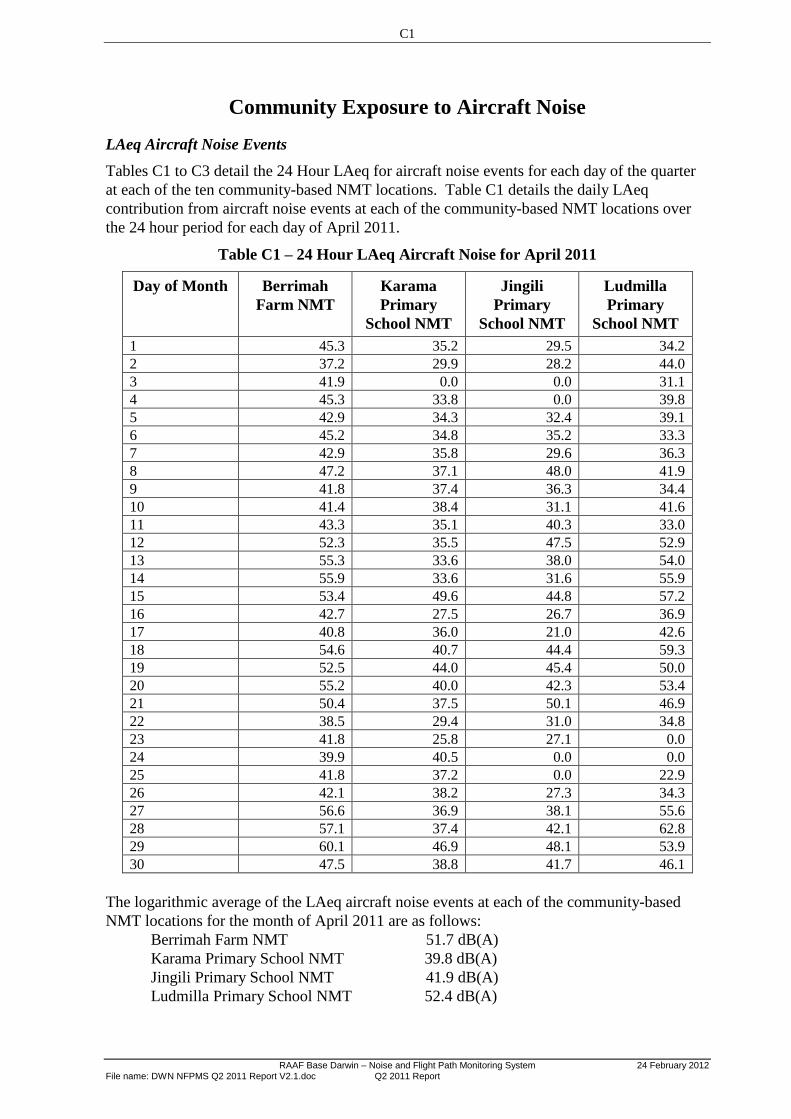
C1
RAAF Base Darwin – Noise and Flight Path Monitoring System 24 February 2012 File name: DWN NFPMS Q2 2011 Report V2.1.doc Q2 2011 Report
Community Exposure to Aircraft Noise
LAeq Aircraft Noise Events
Tables C1 to C3 detail the 24 Hour LAeq for aircraft noise events for each day of the quarter
at each of the ten community-based NMT locations. Table C1 details the daily LAeq
contribution from aircraft noise events at each of the community-based NMT locations over
the 24 hour period for each day of April 2011.
Table C1 – 24 Hour LAeq Aircraft Noise for April 2011
Day of Month Berrimah
Farm NMT
Karama
Primary
School NMT
Jingili
Primary
School NMT
Ludmilla
Primary
School NMT
1 45.3 35.2 29.5 34.2
2 37.2 29.9 28.2 44.0
3 41.9 0.0 0.0 31.1
4 45.3 33.8 0.0 39.8
5 42.9 34.3 32.4 39.1
6 45.2 34.8 35.2 33.3
7 42.9 35.8 29.6 36.3
8 47.2 37.1 48.0 41.9
9 41.8 37.4 36.3 34.4
10 41.4 38.4 31.1 41.6
11 43.3 35.1 40.3 33.0
12 52.3 35.5 47.5 52.9
13 55.3 33.6 38.0 54.0
14 55.9 33.6 31.6 55.9
15 53.4 49.6 44.8 57.2
16 42.7 27.5 26.7 36.9
17 40.8 36.0 21.0 42.6
18 54.6 40.7 44.4 59.3
19 52.5 44.0 45.4 50.0
20 55.2 40.0 42.3 53.4
21 50.4 37.5 50.1 46.9
22 38.5 29.4 31.0 34.8
23 41.8 25.8 27.1 0.0
24 39.9 40.5 0.0 0.0
25 41.8 37.2 0.0 22.9
26 42.1 38.2 27.3 34.3
27 56.6 36.9 38.1 55.6
28 57.1 37.4 42.1 62.8
29 60.1 46.9 48.1 53.9
30 47.5 38.8 41.7 46.1
The logarithmic average of the LAeq aircraft noise events at each of the community-based
NMT locations for the month of April 2011 are as follows:
Berrimah Farm NMT 51.7 dB(A)
Karama Primary School NMT 39.8 dB(A)
Jingili Primary School NMT 41.9 dB(A)
Ludmilla Primary School NMT 52.4 dB(A)

C2
24 February 2012 RAAF Base Darwin – Noise and Flight Path Monitoring System Q2 2011 Report File name:DWN NFPMS Q2 2011 Report V2.1.doc
Table C2 details the daily LAeq contribution from aircraft noise events at each of the
community-based NMT locations over the 24 hour period for each day of May 2011.
Table C2 – 24 Hour LAeq Aircraft Noise Events for May 2011
Day of Month Berrimah
Farm NMT
Karama
Primary
School NMT
Jingili
Primary
School NMT
Ludmilla
Primary
School NMT
1 39.3 33.3 22.5 36.8
2 53.6 33.4 38.7 50.6
3 50.4 33.8 45.1 44.9
4 54.7 38.0 23.5 50.9
5 55.2 37.7 37.7 47.8
6 55.6 44.5 43.5 51.2
7 41.6 35.3 38.8 32.2
8 40.4 43.9 43.5 30.4
9 53.5 44.9 47.7 50.1
10 54.9 41.7 37.3 45.5
11 54.4 53.1 37.1 47.7
12 55.9 54.5 40.4 52.0
13 52.8 39.0 44.6 51.9
14 42.4 37.2 42.9 57.8
15 57.9 48.8 47.3 51.4
16 53.8 43.0 38.5 48.6
17 49.4 52.0 36.3 51.6
18 41.2 36.4 32.9 35.7
19 54.5 55.4 47.6 50.3
20 41.7 34.0 38.4 43.5
21 40.7 37.4 31.9 0.0
22 39.1 31.9 35.5 40.5
23 41.1 36.0 38.8 34.5
24 38.9 39.6 39.9 42.6
25 44.3 38.1 37.8 31.9
26 43.6 35.0 52.0 50.4
27 47.9 43.5 40.8 51.5
28 41.8 35.8 28.8 29.0
29 41.0 37.8 32.5 33.8
30 55.8 36.1 36.6 62.9
31 46.9 37.2 0.0 59.2
The logarithmic average of the LAeq aircraft noise events at each of the community-based
NMT locations for the month of May 2011 are as follows:
Berrimah Farm NMT 51.7 dB(A)
Karama Primary School NMT 46.2 dB(A)
Jingili Primary School NMT 42.6 dB(A)
Ludmilla Primary School NMT 51.4 dB(A)

C3
RAAF Base Darwin – Noise and Flight Path Monitoring System 24 February 2012 File name: DWN NFPMS Q2 2011 Report V2.1.doc Q2 2011 Report
Table C3 details the daily LAeq contribution from aircraft noise events at each of the
community-based NMT locations over the 24 hour period for each day of June 2011.
Table C3 – 24 Hour LAeq Aircraft Noise for June 2011
Day of Month Berrimah
Farm NMT
Karama
Primary
School NMT
Jingili
Primary
School NMT
Ludmilla
Primary
School NMT
1 56.7 41.5 37.5 63.4
2 59.1 40.9 34.1 63.8
3 54.5 35.7 48.3 58.5
4 44.5 39.0 36.6 55.5
5 41.2 36.6 0.0 40.3
6 56.4 41.2 39.2 63.7
7 56.7 39.2 41.7 58.9
8 47.8 38.3 38.6 45.2
9 55.9 41.2 36.7 56.0
10 55.8 34.3 43.1 62.2
11 42.7 31.5 30.2 37.1
12 42.5 30.1 36.0 0.0
13 46.2 35.6 49.2 53.6
14 55.1 20.3 38.8 56.9
15 57.9 41.1 43.6 64.0
16 55.6 47.1 40.4 56.5
17 54.3 46.7 54.6 63.4
18 44.2 37.1 31.5 34.7
19 52.1 34.8 22.1 37.0
20 44.2 41.8 46.1 61.0
21 42.4 41.0 33.6 37.9
22 55.9 39.0 49.6 67.1
23 43.6 41.7 33.6 40.8
24 43.7 37.4 36.6 38.9
25 44.2 34.3 26.4 29.3
26 40.7 34.7 26.5 34.0
27 41.6 32.9 0.0 36.8
28 41.6 35.9 30.7 39.3
29 43.4 40.3 44.7 35.5
30 41.3 51.0 33.8 34.4
The logarithmic average of the LAeq aircraft noise events at each of the community-based
NMT locations for the month of June 2011 are as follows:
Berrimah Farm NMT 52.8 dB(A)
Karama Primary School NMT 39.6 dB(A)
Jingili Primary School NMT 43.7 dB(A)
Ludmilla Primary School NMT 58.9 dB(A)

C4
24 February 2012 RAAF Base Darwin – Noise and Flight Path Monitoring System Q2 2011 Report File name:DWN NFPMS Q2 2011 Report V2.1.doc
Maximum Aircraft Noise Events
Tables C4 to C13 detail the range of maximum noise levels recorded by the DAR NFPMS at
each of the four community-based NMT locations. The average LAmax value is the
arithmetic average of all the recorded aircraft noise events. The tables show noise events for
aircraft that are based at RAAF Base Darwin or regularly operate from RAAF Base Darwin.
The Standard Deviation of a data set is defined as the square root of the variance. It is a
widely used parameter for the variability or dispersion of data points from the mean
(arithmetic average). A low standard deviation indicates that the data points tend to be very
close together, whereas a high standard deviation indicates that the data points are spread over
a large range of values.
AS2021-2000 specifies for the purpose of noise control the use of the “Aircraft noise level” –
the average maximum noise level which is determined for each aircraft type on the specific
flight mode or track relevant to the receiver location. The NFPMS report does not provide
“Aircraft noise levels” as defined in AS2021-2000.

C5
RAAF Base Darwin – Noise and Flight Path Monitoring System 24 February 2012 File name: DWN NFPMS Q2 2011 Report V2.1.doc Q2 2011 Report
Berrimah Farm
Table C4 summarizes the maximum aircraft noise events recorded by the DAR NFPMS for
Berrimah Farm NMT for the Quarter 2 2011 reporting period.
Table C4 – Maximum Aircraft Noise Events – Berrimah Farm NMT
Aircraft Operation RWY LAmax
Low
LAmax
High
LAmax
Average
Standard
Deviation
No of
Records
FA-18 Arrival 11 62.8 62.8 62.8 - 1
FA-18 Arrival 29 60.7 69.3 65.4 3.5 4
FA-18 Departure 11 85.3 94.2 88.9 3.7 5
FA-18 Departure 29 59.3 59.3 59.3 - 1
F-15 Arrival 29 57.5 62.1 59.7 2.0 5
F-15 Departure 11 83.9 89.7 86.8 4.1 2
Airbus 340-300 Arrival 29 54.3 61.5 56.0 2.3 8
Airbus 340-300 Departure 11 65 77.5 68.8 2.8 26
Airbus 330-300 Departure 11 65.9 71 68.5 1.4 21
Airbus 320 Arrival 29 52.4 61.3 55.1 1.8 76
Airbus 320 Departure 11 58.2 76.3 65.5 1.8 728
Airbus 320 Departure 29 58.1 58.1 58.1 - 1
Airbus 320 Circuit 11 61.5 61.5 61.5 - 1
Airbus 320 Circuit 29 53.4 53.4 53.4 - 1
B190 Arrival 29 53.8 64.7 58.6 2.3 22
B190 Departure 11 59.1 75.6 65.9 2.7 65
Boeing 717-200 Arrival 29 52.6 67.7 55.6 3.9 18
Boeing 717-200 Departure 11 61.7 73.3 64.0 1.4 176
Boeing 717-200 Circuit 11 62.5 62.6 62.6 0.1 2
Boeing 737 Arrival 11 54.8 54.8 54.8 0.0 1
Boeing 737 Arrival 29 53.8 64.4 57.2 1.9 96
Boeing 737 Departure 11 62.3 77.7 67.0 2.0 504
Boeing 737 Circuit 11 61.9 61.9 61.9 - 1
Boeing 747-400 Arrival 29 61.6 61.6 61.6 - 1
Boeing 747-400 Departure 11 70.5 71.1 70.7 0.3 3
Boeing 757-200 Arrival 29 58 64 61.0 4.2 2
Boeing 757-200 Departure 11 63.8 74.5 66.8 3.4 8
Boeing 767-300 Arrival 29 57.1 57.1 57.1 - 1
Boeing 767-300 Departure 11 65.6 78.6 68.4 1.7 85
BE40 Arrival 29 68 68 68.0 - 1
BE40 Departure 11 59.8 71.2 65.5 8.1 2
C130/30J Arrival 29 57.8 58.7 58.3 0.6 2
C130/30J Departure 11 63 74.4 67.8 2.8 35
C17 Arrival 29 58 58.6 58.3 0.4 2
C17 Departure 11 67.2 82.5 72.1 4.3 19
C525 Arrival 29 59.2 59.2 59.2 - 1
C525 Departure 11 64.1 64.1 64.1 - 1
CL60 Arrival 29 56.7 56.7 56.7 - 1
CL60 Departure 11 67.3 67.3 67.3 - 1

C6
24 February 2012 RAAF Base Darwin – Noise and Flight Path Monitoring System Q2 2011 Report File name:DWN NFPMS Q2 2011 Report V2.1.doc
D328 Departure 11 54.7 59 56.6 2.2 3
D328 Circuit 11 54.1 54.1 54.1 - 1
DC-10 Departure 11 72.7 72.7 72.7 - 1
DC-93 Departure 11 77.8 78.2 78.0 0.3 2
DHC8 Series Arrival 11 58 58 58.0 - 1
DHC8 Series Arrival 29 53.2 73.2 57.6 4.1 24
DHC8 Series Circuit 29 78.4 78.4 78.4 - 1
E170-190 Arrival 29 52.9 66 56.7 5.0 7
E170-190 Departure 11 60.9 73.4 65.3 2.0 222
E170-190 Circuit 11 61.5 61.5 61.5 - 1
F2TH Departure 11 58.8 58.8 58.8 - 1
F100 Arrival 11 64.3 72 68.2 5.4 2
F100 Departure 29 61.1 69.5 64.7 2.1 21
GL5T Departure 11 66.5 66.5 66.5 - 1
GLF5 Departure 11 63.6 63.6 63.6 - 1
H25B Departure 11 59.7 72.2 65.0 5.2 5
H25B Circuit 11 55.6 55.6 55.6 - 1
IL76 Departure 11 71.9 71.9 71.9 - 1
K35R Departure 11 71.4 73.7 72.6 1.6 2
Lear 35/45 Arrival 29 53.1 71.5 65.3 7.3 5
Lear 35/45 Departure 11 57.6 70.8 66.9 3.4 17
PC9 Departure 11 66.4 66.4 66.4 - 1
P3 Arrival 29 61.7 61.7 61.7 - 1
P3 Departure 11 62.3 73.2 65.6 2.7 14
P3 Departure 29 71.8 71.8 71.8 - 1
SF34 Departure 11 62.8 69.7 65.9 2.0 13
SW4 Arrival 29 53.8 80.8 61.4 6.8 13
SW4 Departure 11 56.7 75.7 65.6 3.0 143
WW24 Arrival 29 59.6 65 62.3 3.8 2
WW24 Departure 11 63.9 66.3 65.5 1.4 3
Helicopter Arrival 29 59.9 59.9 59.9 - 1
Helicopter Departure 11 55.9 69.7 62.5 5.7 8
Helicopter Circuit 29 59.1 61.6 60.4 1.8 2
Unknown Arrival 29 53.9 77.1 64.5 5.9 42
Unknown Arrival H 53.1 53.1 53.1 - 1
Unknown Departure 11 53.9 92.8 76.1 10.6 226
Unknown Departure H 56 79.7 65.2 8.1 6
Unknown Circuit 11 56.2 85.9 66.0 7.4 47
Unknown Circuit 29 53 81.7 64.0 6.6 53
Unknown Circuit 36 65.1 68.7 67.3 1.9 3
Unknown Circuit H 55.4 74 64.1 7.6 6

C7
RAAF Base Darwin – Noise and Flight Path Monitoring System 24 February 2012 File name: DWN NFPMS Q2 2011 Report V2.1.doc Q2 2011 Report
Karama Primary School
Table C5 summarizes the maximum aircraft noise events recorded by the DAR NFPMS for
Karama Primary School NMT for the Quarter 2 2011 reporting period.
Table C5 – Maximum Aircraft Noise Events – Karama Primary School NMT
Aircraft Operation RWY LAmax
Low
LAmax
High
LAmax
Average
Standard
Deviation
No of
Records
FA-18 Arrival 11 67.7 72.3 70.0 3.3 2
FA-18 Departure 11 70.2 87.1 79.6 7.0 4
F-15 Departure 11 77.8 89.5 83.7 8.3 2
Airbus 320 Departure 11 56.2 66.4 61.3 5.1 3
Airbus 320 Departure 29 56 56 56.0 - 1
Airbus 340-300 Departure 11 53.9 59.5 56.9 2.3 6
B190 Arrival 36 74.8 74.8 74.8 - 1
B190 Departure 11 62.2 74.2 68.2 8.5 2
Boeing 757-200 Departure 11 57.3 57.9 57.6 0.4 2
C130/30J Arrival 29 63.5 63.5 63.5 - 1
C130/30J Circuit 11 76.5 76.5 76.5 - 1
C135 Arrival 11 72.3 72.3 72.3 - 1
DHC8 Series Arrival 11 58.9 74.8 66.2 8.0 3
DHC8 Series Departure 11 78.7 78.7 78.7 - 1
E170-190 Departure 11 64.3 65 64.6 0.4 3
GLF5 Arrival 29 67.1 67.1 67.1 1.0 1
SW4 Arrival 11 74.1 74.1 74.1 - 1
SW4 Departure 11 64.1 82.1 71.1 6.1 9
SW4 Arrival 29 64.5 66.8 65.7 1.6 2
Helicopter Departure 11 54.4 64.7 59.0 5.2 3
Unknown Arrival 11 62.4 66.3 64.4 2.8 2
Unknown Arrival 18 70.5 71.8 71.2 0.9 2
Unknown Arrival 29 62.8 76.4 67.9 3.6 26
Unknown Arrival H 63.5 75.8 70.8 4.2 12
Unknown Departure 11 55.6 92.1 72.1 5.1 180
Unknown Departure H 66.5 78.2 71.4 3.1 14
Unknown Circuit 11 54.7 82.1 69.2 5.1 58
Unknown Circuit 29 58.7 77.9 67.2 3.9 29
Unknown Circuit 36 68.3 70.9 69.6 1.8 2
Unknown Circuit H 56.3 76.9 67.9 7.2 19
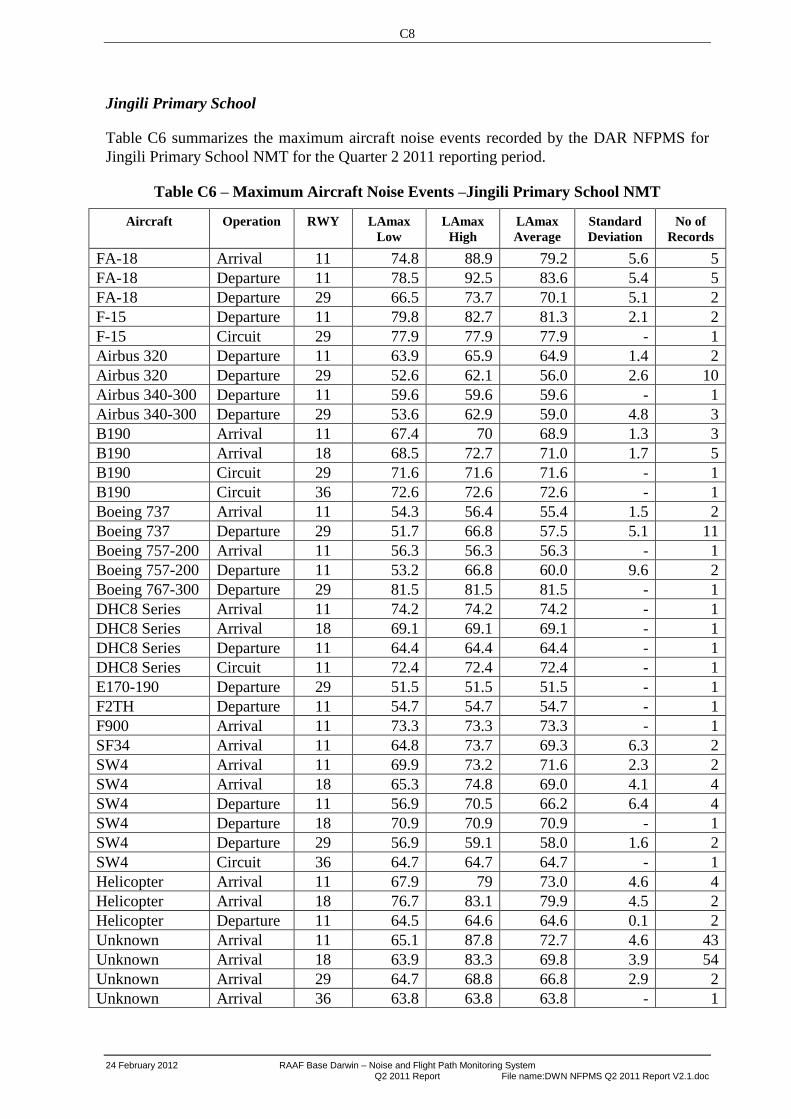
C8
24 February 2012 RAAF Base Darwin – Noise and Flight Path Monitoring System Q2 2011 Report File name:DWN NFPMS Q2 2011 Report V2.1.doc
Jingili Primary School
Table C6 summarizes the maximum aircraft noise events recorded by the DAR NFPMS for
Jingili Primary School NMT for the Quarter 2 2011 reporting period.
Table C6 – Maximum Aircraft Noise Events –Jingili Primary School NMT
Aircraft Operation RWY LAmax
Low
LAmax
High
LAmax
Average
Standard
Deviation
No of
Records
FA-18 Arrival 11 74.8 88.9 79.2 5.6 5
FA-18 Departure 11 78.5 92.5 83.6 5.4 5
FA-18 Departure 29 66.5 73.7 70.1 5.1 2
F-15 Departure 11 79.8 82.7 81.3 2.1 2
F-15 Circuit 29 77.9 77.9 77.9 - 1
Airbus 320 Departure 11 63.9 65.9 64.9 1.4 2
Airbus 320 Departure 29 52.6 62.1 56.0 2.6 10
Airbus 340-300 Departure 11 59.6 59.6 59.6 - 1
Airbus 340-300 Departure 29 53.6 62.9 59.0 4.8 3
B190 Arrival 11 67.4 70 68.9 1.3 3
B190 Arrival 18 68.5 72.7 71.0 1.7 5
B190 Circuit 29 71.6 71.6 71.6 - 1
B190 Circuit 36 72.6 72.6 72.6 - 1
Boeing 737 Arrival 11 54.3 56.4 55.4 1.5 2
Boeing 737 Departure 29 51.7 66.8 57.5 5.1 11
Boeing 757-200 Arrival 11 56.3 56.3 56.3 - 1
Boeing 757-200 Departure 11 53.2 66.8 60.0 9.6 2
Boeing 767-300 Departure 29 81.5 81.5 81.5 - 1
DHC8 Series Arrival 11 74.2 74.2 74.2 - 1
DHC8 Series Arrival 18 69.1 69.1 69.1 - 1
DHC8 Series Departure 11 64.4 64.4 64.4 - 1
DHC8 Series Circuit 11 72.4 72.4 72.4 - 1
E170-190 Departure 29 51.5 51.5 51.5 - 1
F2TH Departure 11 54.7 54.7 54.7 - 1
F900 Arrival 11 73.3 73.3 73.3 - 1
SF34 Arrival 11 64.8 73.7 69.3 6.3 2
SW4 Arrival 11 69.9 73.2 71.6 2.3 2
SW4 Arrival 18 65.3 74.8 69.0 4.1 4
SW4 Departure 11 56.9 70.5 66.2 6.4 4
SW4 Departure 18 70.9 70.9 70.9 - 1
SW4 Departure 29 56.9 59.1 58.0 1.6 2
SW4 Circuit 36 64.7 64.7 64.7 - 1
Helicopter Arrival 11 67.9 79 73.0 4.6 4
Helicopter Arrival 18 76.7 83.1 79.9 4.5 2
Helicopter Departure 11 64.5 64.6 64.6 0.1 2
Unknown Arrival 11 65.1 87.8 72.7 4.6 43
Unknown Arrival 18 63.9 83.3 69.8 3.9 54
Unknown Arrival 29 64.7 68.8 66.8 2.9 2
Unknown Arrival 36 63.8 63.8 63.8 - 1

C9
RAAF Base Darwin – Noise and Flight Path Monitoring System 24 February 2012 File name: DWN NFPMS Q2 2011 Report V2.1.doc Q2 2011 Report
Unknown Arrival H 54.8 81 71.0 7.2 18
Unknown Departure 11 56.3 89.3 75.2 8.8 24
Unknown Departure 18 68.4 68.4 68.4 - 1
Unknown Departure 29 66.1 80.5 71.4 5.3 8
Unknown Departure 36 72.3 84.2 76.1 5.4 4
Unknown Departure H 66.6 74.7 70.6 2.5 12
Unknown Circuit 11 53.7 82.4 69.4 5.1 59
Unknown Circuit 18 68.3 81.6 72.6 5.4 5
Unknown Circuit 29 63.2 78.2 68.2 4.1 22
Unknown Circuit 36 64.3 77.3 70.2 3.4 20
Unknown Circuit H 58.3 79.7 70.5 5.0 12

C10
24 February 2012 RAAF Base Darwin – Noise and Flight Path Monitoring System Q2 2011 Report File name:DWN NFPMS Q2 2011 Report V2.1.doc
Ludmilla Primary School
Table C7 summarizes the maximum aircraft noise events recorded by the DAR NFPMS for
Ludmilla Primary School NMT for the Quarter 2 2011 reporting period.
Table C7 – Maximum Aircraft Noise Events – Ludmilla Primary School NMT
Aircraft Operation RWY LAmax
Low
LAmax
High
LAmax
Average
Standard
Deviation
No of
Records
FA-18 Arrival 11 69.1 98.5 88.4 8.1 11
FA-18 Arrival 29 75.6 75.6 75.6 - 1
FA-18 Departure 11 83.9 99.2 92.6 6.9 5
FA-18 Departure 29 73 82 75.7 4.2 4
F-15 Arrival 11 71 71 71.0 - 1
F-15 Departure 11 83.9 85.5 84.7 1.1 2
F-15 Circuit 29 83.5 83.5 83.5 - 1
Airbus 320 Arrival 11 62.2 81.8 71.1 6.8 6
Airbus 320 Departure 11 68.7 73.7 71.2 3.5 2
Airbus 320 Departure 29 61 68.6 64.9 2.2 13
Airbus 320 Circuit 11 68.1 68.1 68.1 - 1
Airbus 340-300 Departure 11 63.1 63.1 63.1 - 1
Airbus 340-300 Departure 29 62.1 65.2 63.7 2.2 2
B190 Arrival 11 65.4 71.3 67.9 2.5 4
B190 Arrival 36 70.6 72.6 71.6 1.4 2
B190 Departure 11 68.7 68.7 68.7 - 1
B737 Arrival 11 60.4 73 67.1 6.3 3
B737 Departure 29 61 67.7 63.3 1.7 15
C130/30J Arrival 11 72.5 80.5 76.5 5.7 2
C130/30J Departure 11 67.9 74.4 71.2 4.6 2
CL60 Arrival 11 70.8 70.8 70.8 - 1
DHC8 Series Arrival 11 71.5 71.5 71.5 1.0 1
E170-190 Arrival 11 67.9 71.6 69.8 2.6 2
E170-190 Circuit 11 79.8 79.8 79.8 - 1
F100 Arrival 11 68 68 68.0 - 1
F100 Departure 29 66.7 66.7 66.7 - 1
GLF5 Departure 29 65.1 65.1 65.1 - 1
Lear 35/45 Arrival 11 74.6 74.6 74.6 - 1
Lear 35/45 Departure 11 72.4 72.4 72.4 - 1
MD82 Departure 29 67.9 67.9 67.9 - 1
P3 Departure 29 68.9 68.9 68.9 - 1
SW4 Arrival 11 66.1 81.6 72.4 4.8 7
SW4 Arrival 36 69.3 70.4 69.9 0.8 2
SW4 Departure 11 61.5 75.9 70.0 5.7 5
SW4 Departure 18 66.2 70.9 69.0 2.5 3
Helicopter Arrival 11 66.5 66.5 66.5 - 1
Helicopter Arrival 18 82.7 82.7 82.7 - 1
Helicopter Arrival 36 91.7 91.7 91.7 - 1
Helicopter Departure 11 63.9 71.1 68.5 2.6 6
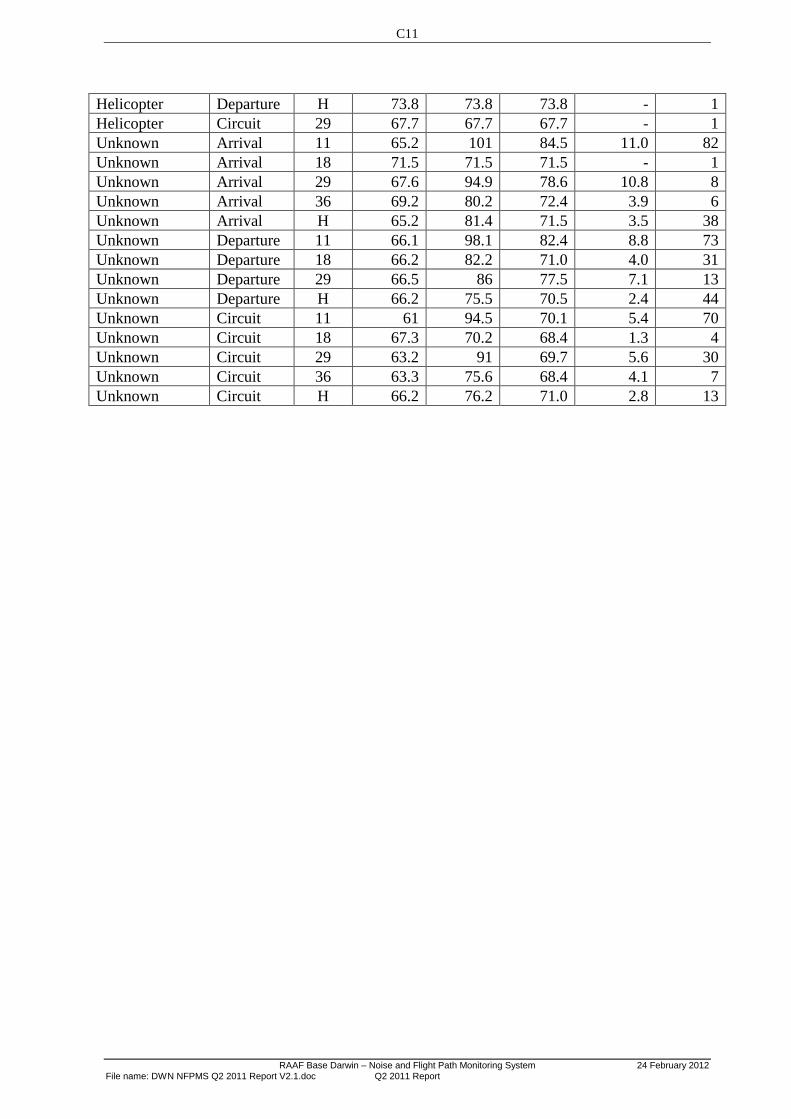
C11
RAAF Base Darwin – Noise and Flight Path Monitoring System 24 February 2012 File name: DWN NFPMS Q2 2011 Report V2.1.doc Q2 2011 Report
Helicopter Departure H 73.8 73.8 73.8 - 1
Helicopter Circuit 29 67.7 67.7 67.7 - 1
Unknown Arrival 11 65.2 101 84.5 11.0 82
Unknown Arrival 18 71.5 71.5 71.5 - 1
Unknown Arrival 29 67.6 94.9 78.6 10.8 8
Unknown Arrival 36 69.2 80.2 72.4 3.9 6
Unknown Arrival H 65.2 81.4 71.5 3.5 38
Unknown Departure 11 66.1 98.1 82.4 8.8 73
Unknown Departure 18 66.2 82.2 71.0 4.0 31
Unknown Departure 29 66.5 86 77.5 7.1 13
Unknown Departure H 66.2 75.5 70.5 2.4 44
Unknown Circuit 11 61 94.5 70.1 5.4 70
Unknown Circuit 18 67.3 70.2 68.4 1.3 4
Unknown Circuit 29 63.2 91 69.7 5.6 30
Unknown Circuit 36 63.3 75.6 68.4 4.1 7
Unknown Circuit H 66.2 76.2 71.0 2.8 13