EXPERIMENTAL STUDY OF VERTICAL FLIGHT PATH MO DE …
28
EXPERIMENTAL STUDY OF VERTICAL FLIGHT PATH MO DE AWARENESS Eric N. Johnson & Amy R. Pritchett Aeronautical Systems Laboratory Department of Aeronautics & Astronautics Massachusetts Institute of Technology Cambridge, Massachusetts USA March 1995 ASL-95-3
Transcript of EXPERIMENTAL STUDY OF VERTICAL FLIGHT PATH MO DE …
EXPERIMENTAL STUDY OF VERTICAL FLIGHT PATH MODE AWARENESS
Eric N. Johnson & Amy R. PritchettAeronautical Systems Laboratory
Department of Aeronautics & AstronauticsMassachusetts Institute of Technology
Cambridge, Massachusetts USA
March 1995
ASL-95-3
MIT AERONAUTICAL SYSTEMS LABORATORY
EXPERIMENTAL STUDY OF VERTICAL FLIGHT PATH MODE AWARENESS
Eric N. Johnson & Amy R. Pritchett
Aeronautical Systems LaboratoryDepartment of Aeronautics & Astronautics
Massachusetts Institute of TechnologyCambridge, Massachusetts USA
An experimental simulator study was run to test pilot detection of an error in autopilot mode selection. Active airline air crew were asked to fly landing approaches by commanding the Flight Path Angle mode while monitoring the approach with both a Head Up Display and Head Down Displays. During one approach, the Vertical Speed mode was intentionally triggered by an experimenter instead, causing a high rate of descent below the intended glide path. Of the 12 pilots, 10 were unable to detect the high descent rate prior to significant glide path deviation.
March, 1995
ASL-95-3

Table of Contents
1. Introduction......................................................................................................1
1.1 Motivation..........................................................................................1
1.2 Background ........................................................................................3
1.3 Objectives...........................................................................................5
2. Experiment Design...........................................................................................6
2.1 Simulator Setup..................................................................................6
2.2 Experiment Procedure........................................................................12
3. Results..............................................................................................................15
3.1 Subjects ..............................................................................................15
3.2 Recognition of Severe Descent and Incorrect Descent Mode............15
3.3 Variations in Recognition Based on Pilot Characteristics .................16
3.4 Primary and Secondary Cues of Extreme Descent ............................17
3.5 Pilot Subjective Opinions on Mode Presentation ..............................18
3.6 Simulation Fidelity.............................................................................18
4. Conclusions......................................................................................................20
Appendix A: Pilot Questionnaire........................................................................22
References............................................................................................................23

1. Introduction
Loss of pilot awareness about the commanded autopilot descent modes is a speculated or reported cause in several recent incidents involving Airbus A320 aircraft [Lenorovitz, 1992b; Sparaco, 1994; Bateman, 1991]. With the new autopilot systems of this aircraft, the pilot can command several vertical flight path modes, including a specified Flight Path Angle or a specified Vertical Speed. These two modes share the same selector knob and display, have only a simple push-button toggle to switch between them, and have similar mode indicators. Therefore, the presentation and selection of these modes combined with the potentially severe consequences of an error generate several serious questions about the supervisory control task required of the pilot by these new systems.
1.1 Motivation
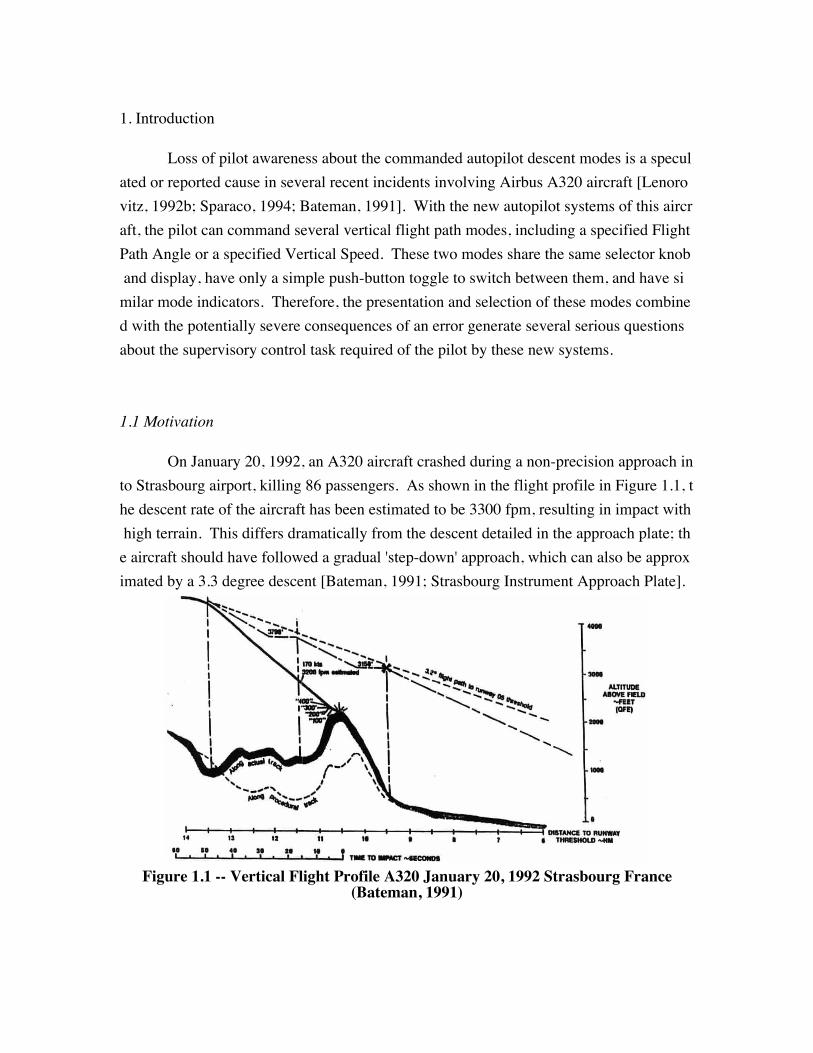
On January 20, 1992, an A320 aircraft crashed during a non-precision approach into Strasbourg airport, killing 86 passengers. As shown in the flight profile in Figure 1.1, the descent rate of the aircraft has been estimated to be 3300 fpm, resulting in impact with high terrain. This differs dramatically from the descent detailed in the approach plate; the aircraft should have followed a gradual 'step-down' approach, which can also be approximated by a 3.3 degree descent [Bateman, 1991; Strasbourg Instrument Approach Plate].
Figure 1.1 -- Vertical Flight Profile A320 January 20, 1992 Strasbourg France(Bateman, 1991)
It is speculated the flight crew inadvertently placed the aircraft into the wrong descent mode and did not recognize the problem during the following (approximately) 47 seconds up to impact. This problem with mode awareness may have been influenced by the command pilot's likely primary flight reference, a Heads Up Display (HUD) with no mode annunciation, and by the lack of a Ground Proximity Warning System (GPWS) providing early notification of an excessive descent rate (Lenorovitz, 1992a).
Two other incidents involved the same confusion about descent mode during approach [Bateman, 1991]. Fortunately, the errors were recognized in time to prevent ground impact and were later reported by the pilots of the aircraft. In the first case, a localizer approach into Gatwick airport on July 3, 1988, a three degree descent was intended but the autopilot inadvertently was commanded to follow a vertical speed mode. The aircraft descended well below its nominal flight path and triggered a GPWS warning, at which time the pilot executed a missed approach.
In the second case, a localizer backcourse approach into San Diego in June 1990, the intended flight path was also a three degree descent but the autopilot was commanded to follow a vertical speed mode. The flight crew was distracted and first reduced the commanded vertical speed to 1200fpm, then descended well below their allowable altitudes still in vertical speed mode. The error was recognized after approximately ten seconds and the pilot was able to pull-up and execute a visual approach.
In all cases, the same excessive descent rate was commanded (or speculated to have been commanded) by inadvertently selecting a vertical speed rate corresponding to the desired flight path angle. Although the time to recognize the erroneous descent mode differed, a significant amount of time passed in each case, at best requiring recovery substantially below 'safe' altitudes.
1.2 Background
In modern air carrier aircraft, the aircraft trajectory can be controlled in three ways: manual control by the pilot, automatic flight guidance over a specified route by a Flight Management System, and selected autopilot control over specified aircraft states. This selected autopilot control is commanded by setting specified 'Modes'; for the vertical flight path these modes include Altitude Hold, Altitude Select, Vertical Speed, Approach, and Missed Approach. In some of the new air transport aircraft, a new mode, Flight Path Angle, is also available.
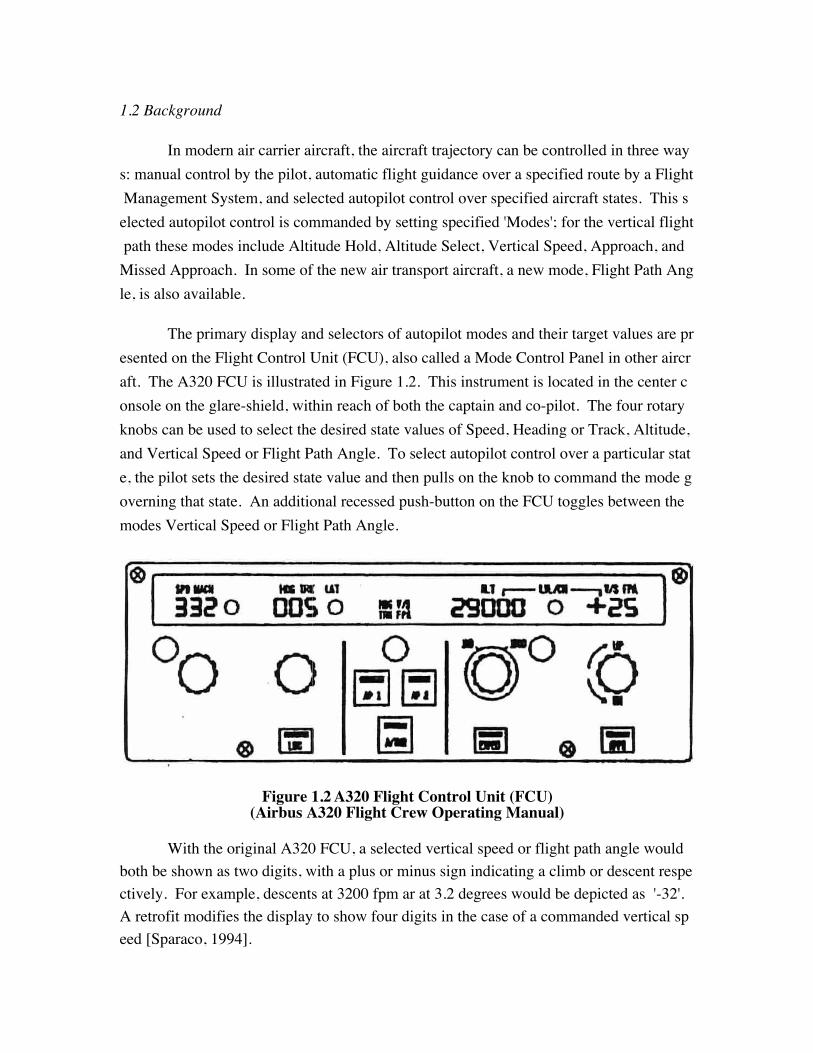
The primary display and selectors of autopilot modes and their target values are presented on the Flight Control Unit (FCU), also called a Mode Control Panel in other aircraft. The A320 FCU is illustrated in Figure 1.2. This instrument is located in the center console on the glare-shield, within reach of both the captain and co-pilot. The four rotary knobs can be used to select the desired state values of Speed, Heading or Track, Altitude, and Vertical Speed or Flight Path Angle. To select autopilot control over a particular state, the pilot sets the desired state value and then pulls on the knob to command the mode governing that state. An additional recessed push-button on the FCU toggles between the modes Vertical Speed or Flight Path Angle.
Figure 1.2 A320 Flight Control Unit (FCU)(Airbus A320 Flight Crew Operating Manual)
With the original A320 FCU, a selected vertical speed or flight path angle would both be shown as two digits, with a plus or minus sign indicating a climb or descent respectively. For example, descents at 3200 fpm ar at 3.2 degrees would be depicted as '-32'. A retrofit modifies the display to show four digits in the case of a commanded vertical speed [Sparaco, 1994].

When a mode is selected on the FCU, its target value is shown in its respective window. In addition, a text annunciation “VS” is shown on the FCU in white if Vertical Speed is commanded. If Flight Path Angle is selected, an “FPA” is shown, also in white, in the same area. The current autopilot modes are also annunciated at the top of each pilot's Primary Flight Display (PFD). With flight directors selected, a standard flight director is shown on the PFD when the aircraft is in Vertical Speed mode, and an aircraft symbol shows the actual flight path vector relative to that selected on the FCU.
The pilot in the Strasbourg accident had a Heads Up Display (HUD) available for use as his primary flight reference [Lenorovitz, 1992b], depicted in Figure 1.3. Mounted on top of the instrument panel, this display presents essential state information to the pilot while also allowing the pilot to see, through its glass surface, the forward out-the-window view. However, the HUD does not display any of the autopilot mode annunciations. In certain conditions either the selected flight path angle or a default 3° flight path angle is shown by two sets of horizontal dashes, shown in Figure 1.3 at the 3° down position.
Figure 1.3 Airbus A320 HUD(Baud & Tarnowski, 1990)
The pilots' vertical flight path mode awareness may be determined by several different factors. First, the pilot is responsible for determining each autopilot mode through FCU selectors; when the selectors are distinct, this process becomes both functional (programming the autopilot) and symbolic (establishing a pilot awareness of the exact autopilo
t modes commanded). Once the mode has been selected, the mode can be displayed through both explicit autopilot mode annunciation and through presentation of the current and commanded aircraft states.
Finally, the attention the pilot can dedicate to supervising the autopilot can affect his/her awareness of the commanded autopilot modes. The Vertical Speed and Flight Path Angle modes are often commanded during Terminal Area operations and on Final Approach. These phases of flight have a high pilot workload and require frequent changes in the aircraft guidance commands as the aircraft transitions from high-altitude cruise to the low-level approach and landing. On a non-precision approach, the pilot must also be concerned with obtaining visual contact with the runway, requiring significant 'Heads Up' time. Therefore, on Final Approach the pilot's available attention to supervisory roles may be limited.
1.3 Objectives
For the issues of vertical flight path mode awareness, the objectives of this study were:
1) To examine the length of time required by pilots to recognize both - a problem with the aircraft state (excessive vertical speed)- the cause of the problem (incorrect autopilot mode), and
2) To determine the primary and secondary display cues the pilots used for vertical flight path mode awareness.
In order to accomplish these objectives, a part-task simulation was developed on the MIT Advanced Cockpit Simulator. This simulation was used to examine an inadvertent selection of Vertical Speed when a desired Flight Path Angle was intended, roughly modeling the situation speculated in the Strasbourg accident.
2. Experiment Design
Using the MIT Advanced Cockpit Simulator (ACS), active airline pilots flew a series of non-precision approaches with reference to a Heads Up Display (HUD), a Flight Control Unit (FCU) and other necessary instruments such as a Primary Flight Display (PFD), and gear and flap indications. During subject briefing, the pilots were told the use of the Flight Path Angle autopilot mode was being tested to allow for lower minimums in non-precision approaches. They were asked to command the flight path angle, supervise the approach and complete the approach manually when visual contact was made with the runway. During the fourth approach, an experimenter, acting as Pilot Not Flying, commanded Vertical Speed mode instead, and the pilots’ recognition time of the excessive vertical rate and its cause was recorded. During a debriefing, the pilots were also asked for subjective comments about autopilot modes and their display.
This section details the setup of the MIT ACS and its displays. Then the procedures followed during the experiment are described.
2.1 Simulator Setup
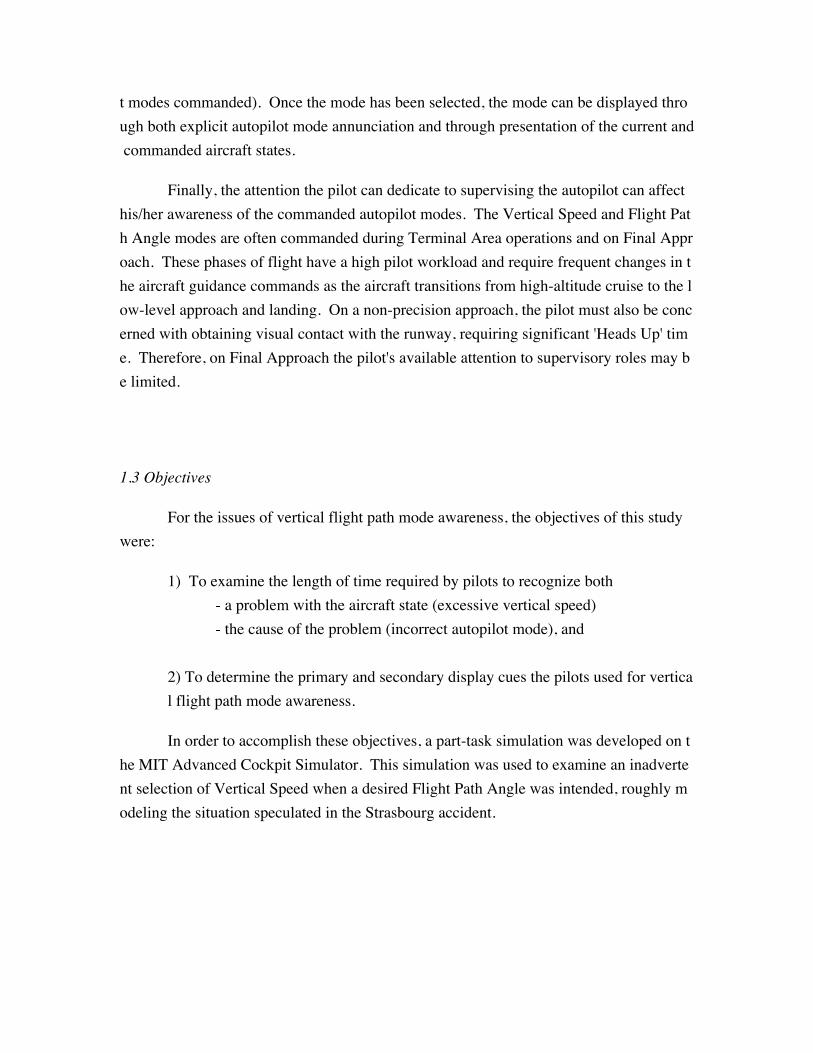
The MIT ACS is based upon two Silicon Graphics workstations. The computers provide both the graphics emulating the cockpit displays and the computation to simulate the aircraft dynamics and to drive the ancillary controls. This configuration used is illustrated in Figure 2.1. A system of memory sharing between the two computers was developed in order to spread the computational load and to allow for two synchronized graphics displays presenting the same state information. The aircraft has the level of performance approximating a Boeing 737. A side-stick was provided for manual control.
HUD/Window View
MCP/PFD
Other Controls
Figure 2.1 Advanced Cockpit Simulator (ACS) Setup
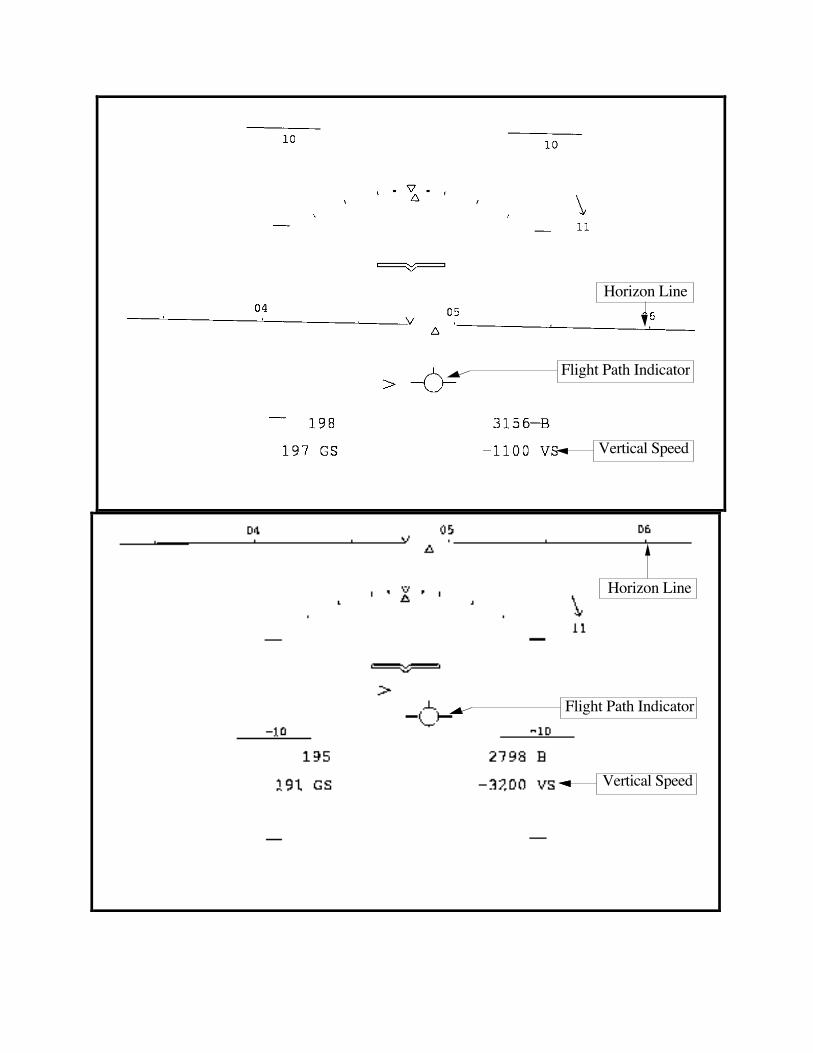
A Head Up Display (HUD), based on the Flight Dynamics HUD, was situated in front of the pilot. Although it differs somewhat from the Sextant HUD shown in figure 1.3, it presents similiar information. A radar altimeter indication was shown at heights below 500 feet above ground and no ground proximity aural alerts were given, imitating the Air Inter A320’s lack of a Ground Proximity Warning System (GPWS). The HUD’s in both the 3.2 degree and 3200 fpm descents are shown in Figure 2.2. For the 3.2 degree descent, the flight path indicator is on the 3.2 degree position on the pitch angle scale. For the 3200 fpm descent, the flight path angle is much steeper and the numerical value of -3200 appears on the lower right.
Horizon Line
Flight Path Indicator
Vertical Speed
Horizon Line
Flight Path Indicator
Vertical Speed
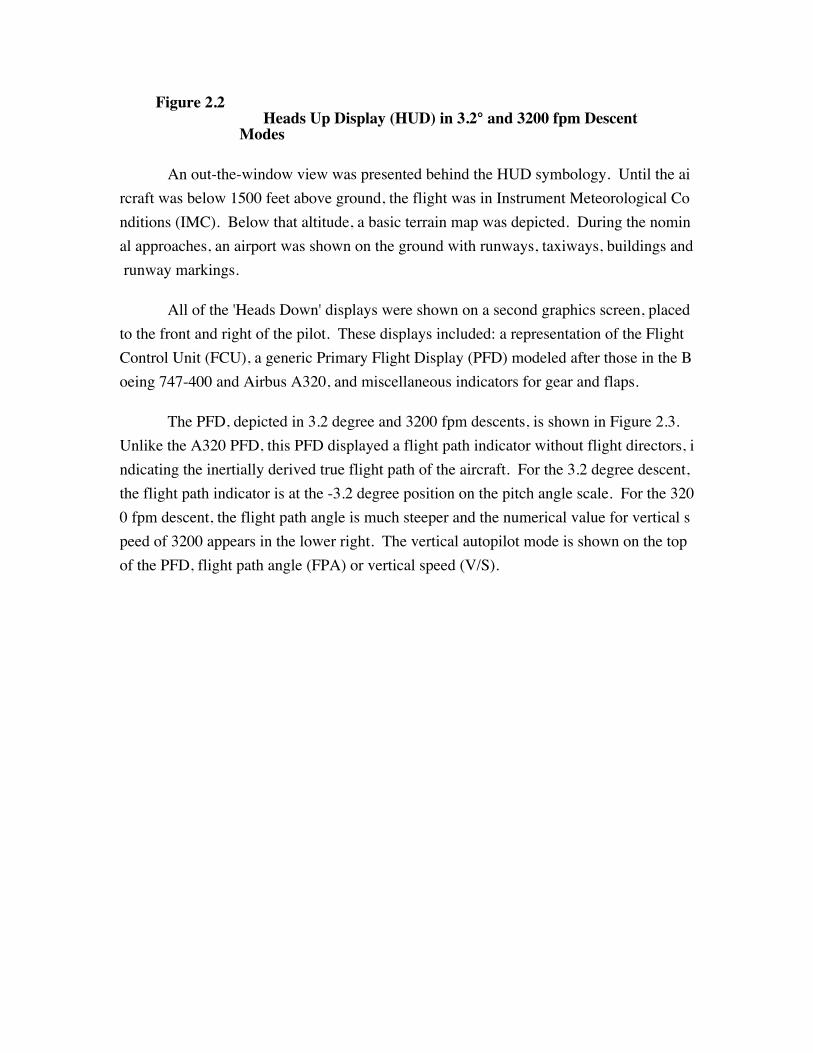
Figure 2.2Heads Up Display (HUD) in 3.2° and 3200 fpm Descent
Modes
An out-the-window view was presented behind the HUD symbology. Until the aircraft was below 1500 feet above ground, the flight was in Instrument Meteorological Conditions (IMC). Below that altitude, a basic terrain map was depicted. During the nominal approaches, an airport was shown on the ground with runways, taxiways, buildings and runway markings.
All of the 'Heads Down' displays were shown on a second graphics screen, placed to the front and right of the pilot. These displays included: a representation of the Flight Control Unit (FCU), a generic Primary Flight Display (PFD) modeled after those in the Boeing 747-400 and Airbus A320, and miscellaneous indicators for gear and flaps.
The PFD, depicted in 3.2 degree and 3200 fpm descents, is shown in Figure 2.3. Unlike the A320 PFD, this PFD displayed a flight path indicator without flight directors, indicating the inertially derived true flight path of the aircraft. For the 3.2 degree descent, the flight path indicator is at the -3.2 degree position on the pitch angle scale. For the 3200 fpm descent, the flight path angle is much steeper and the numerical value for vertical speed of 3200 appears in the lower right. The vertical autopilot mode is shown on the top of the PFD, flight path angle (FPA) or vertical speed (V/S).

0
0
1
Figure 2.3Primary Flight Display (PFD) in 3.2° and 3200 fpm Des
cent Modes
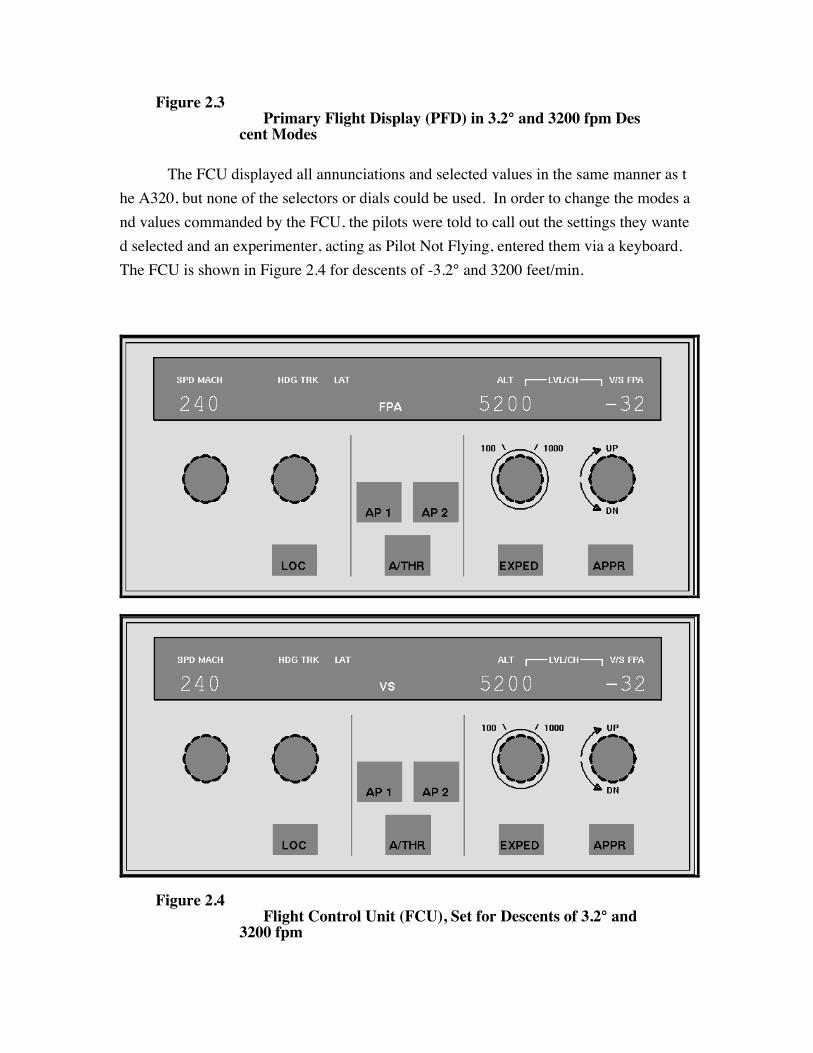
The FCU displayed all annunciations and selected values in the same manner as the A320, but none of the selectors or dials could be used. In order to change the modes and values commanded by the FCU, the pilots were told to call out the settings they wanted selected and an experimenter, acting as Pilot Not Flying, entered them via a keyboard. The FCU is shown in Figure 2.4 for descents of -3.2° and 3200 feet/min.
Figure 2.4 Flight Control Unit (FCU), Set for Descents of 3.2° and
3200 fpm

2
2
3
2.2 Experiment Procedure
The 12 subjects were current airline pilots. They were briefed before the flights on the displays and controls of the simulator. Special care was taken in explaining the HUD, including the speed, pitch, altitude and vertical speed indicators, and in describing the modes available on the A320 and their differences from the subject pilot's normal aircraft.
The subjects were then told that the objectives of the study were to: Test use of Heads Up Display (HUD) and new autopilot systems for non-precision approaches in low visibility. They were told to execute a sequence of five final approaches in low visibility conditions by commanding the autopilot to follow a localizer and a specified flight path angle. After making visual contact with the runway they were to take manual control of the aircraft and, during the briefing, they were told that the point at which they took manual control was the metric of interest.
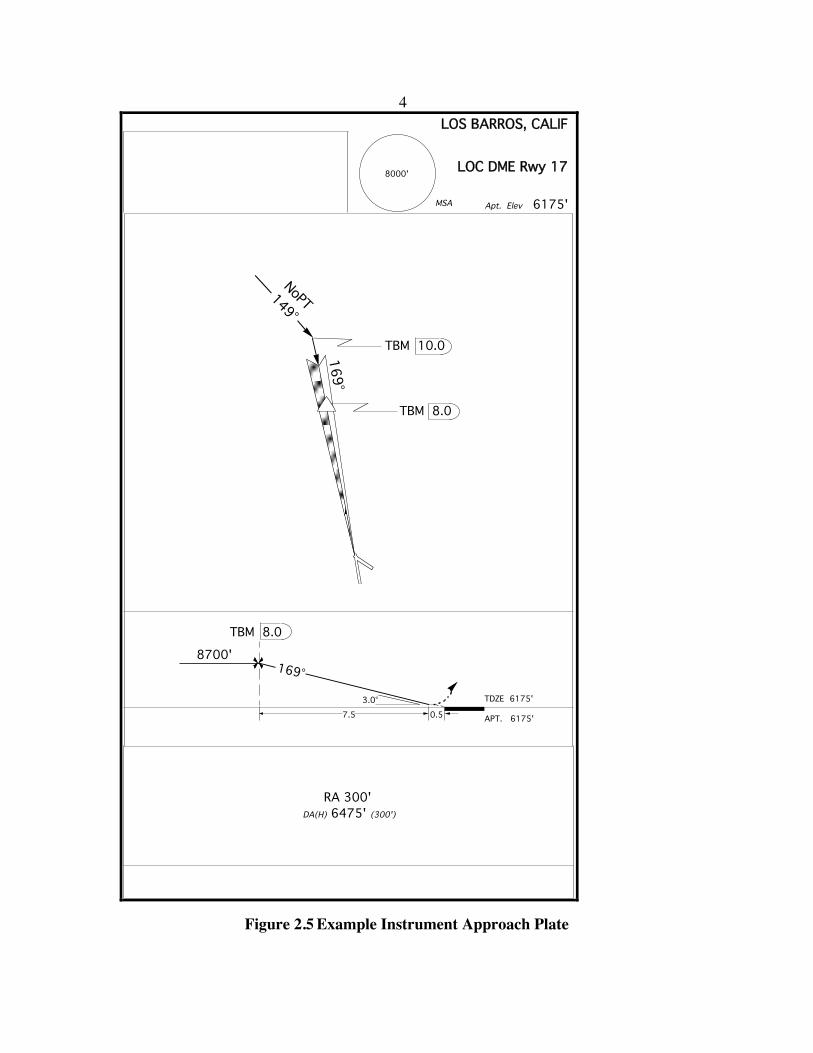
The pilots were given the Instrument Approach Plates for each approach. These approach plates show the correct flight path angle, and the DME distance at which it should be commanded. An example approach plate is shown in Figure 2.5. Then, the pilots were allowed to both manually control the airplane at altitude and fly a practice approach.
4
4
7.5
TDZE 6175'
APT. 6175'
169°
8000' LOC DME Rwy 17
Apt. Elev 6175'MSA
LOS BARROS, CALIF
8700'
169°
RA 300'DA(H) 6475' (300')
TBM 8.0
TBM 8.0
3.0°
149°
NoPT
0.5
TBM 10.0
Figure 2.5 Example Instrument Approach Plate
5
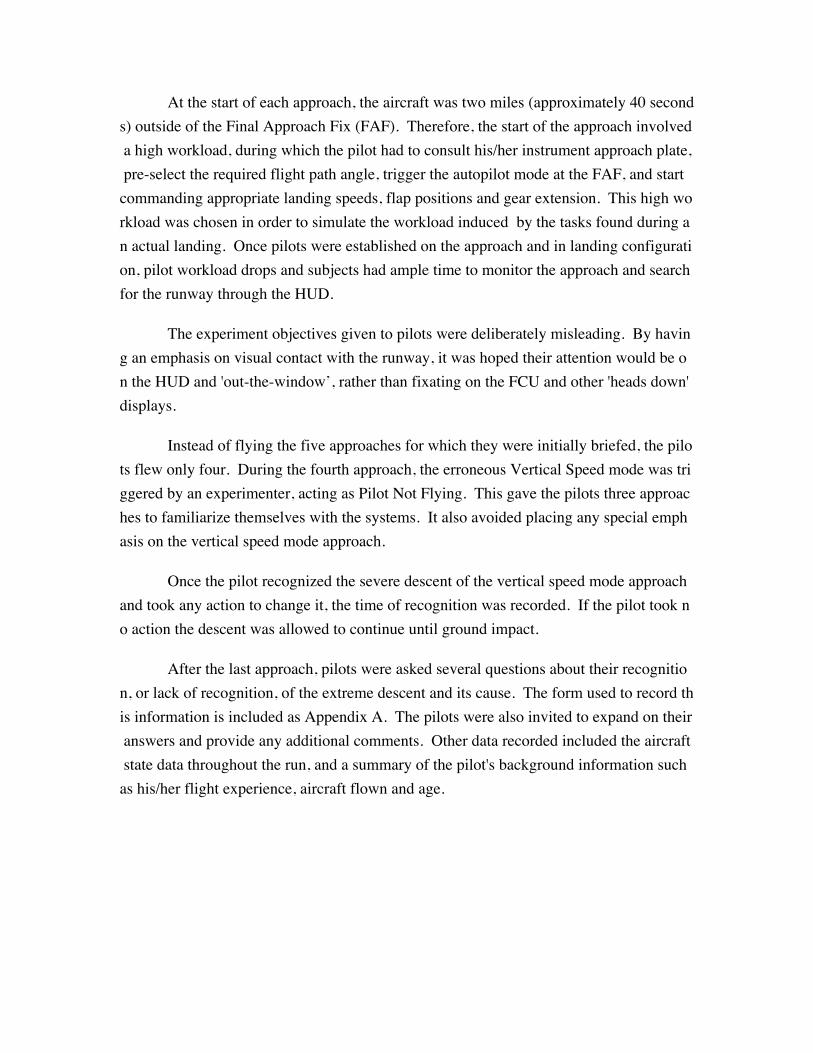
At the start of each approach, the aircraft was two miles (approximately 40 seconds) outside of the Final Approach Fix (FAF). Therefore, the start of the approach involved a high workload, during which the pilot had to consult his/her instrument approach plate, pre-select the required flight path angle, trigger the autopilot mode at the FAF, and start commanding appropriate landing speeds, flap positions and gear extension. This high workload was chosen in order to simulate the workload induced by the tasks found during an actual landing. Once pilots were established on the approach and in landing configuration, pilot workload drops and subjects had ample time to monitor the approach and search for the runway through the HUD.
The experiment objectives given to pilots were deliberately misleading. By having an emphasis on visual contact with the runway, it was hoped their attention would be on the HUD and 'out-the-window’, rather than fixating on the FCU and other 'heads down' displays.
Instead of flying the five approaches for which they were initially briefed, the pilots flew only four. During the fourth approach, the erroneous Vertical Speed mode was triggered by an experimenter, acting as Pilot Not Flying. This gave the pilots three approaches to familiarize themselves with the systems. It also avoided placing any special emphasis on the vertical speed mode approach.
Once the pilot recognized the severe descent of the vertical speed mode approach and took any action to change it, the time of recognition was recorded. If the pilot took no action the descent was allowed to continue until ground impact.
After the last approach, pilots were asked several questions about their recognition, or lack of recognition, of the extreme descent and its cause. The form used to record this information is included as Appendix A. The pilots were also invited to expand on their answers and provide any additional comments. Other data recorded included the aircraft state data throughout the run, and a summary of the pilot's background information such as his/her flight experience, aircraft flown and age.
6
6
3. Results
3.1 Subjects
Twelve air carrier pilots participated in this study. Ten flew larger transport aircraft such as the MD-80 or Boeing 767; the remaining two flew commuter aircraft with glass cockpits. Seven were captains and five were first officers, with an average of 9800 flight hours (the least experienced had 2200 hours, the most had 18,500 flight hours). Seven had received their initial flight training as civilians, the remaining five had originally been military pilots. None of the pilots had flight experience in the Airbus A320 or had flown HUD equipped aircraft.
3.2 Recognition of Severe Descent and Incorrect Descent Mode
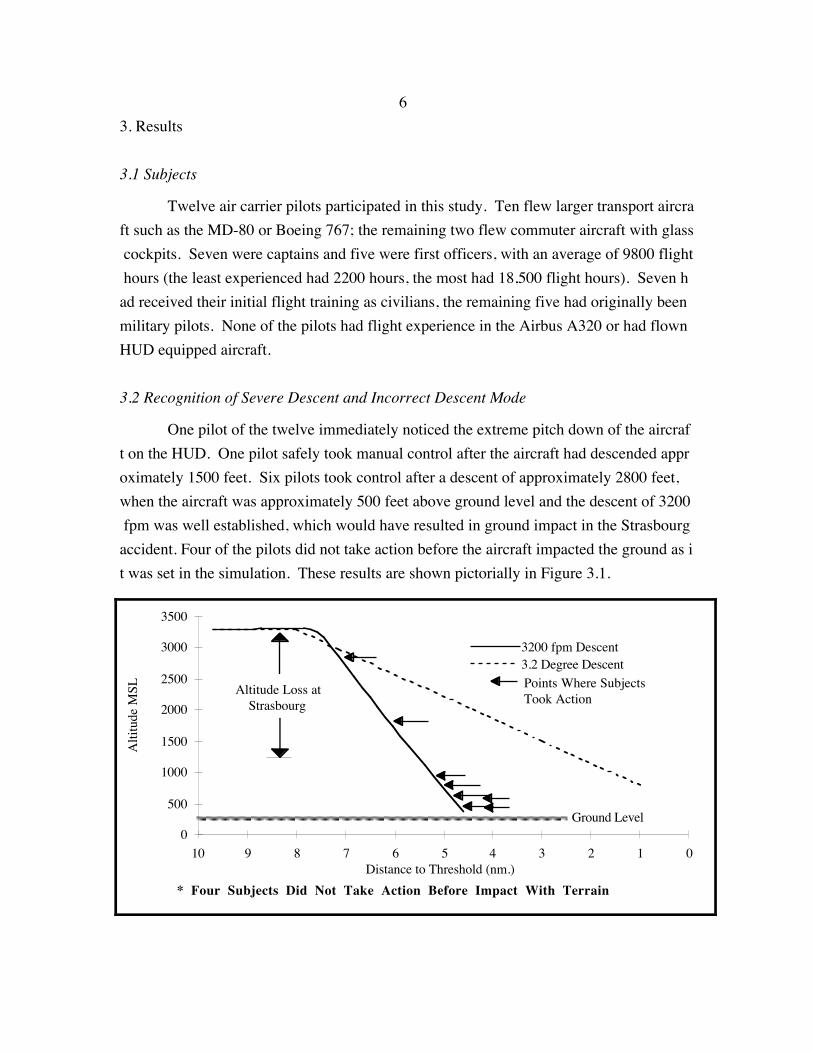
One pilot of the twelve immediately noticed the extreme pitch down of the aircraft on the HUD. One pilot safely took manual control after the aircraft had descended approximately 1500 feet. Six pilots took control after a descent of approximately 2800 feet, when the aircraft was approximately 500 feet above ground level and the descent of 3200 fpm was well established, which would have resulted in ground impact in the Strasbourg accident. Four of the pilots did not take action before the aircraft impacted the ground as it was set in the simulation. These results are shown pictorially in Figure 3.1.
0
500
1000
1500
2000
2500
3000
3500
012345678910
3200 fpm Descent3.2 Degree Descent
Altitude Loss at Strasbourg
Points Where Subjects Took Action
Alti
tude
MSL
Distance to Threshold (nm.)* Four Subjects Did Not Take Action Before Impact With Terrain
Ground Level
7
Figure 3.1Descent Profile, Showing Points Where Subjects Took Action t
o End Severe Descent
The depicted altitudes indicate only the points at which the pilots were aware that a serious problem existed with the aircraft configuration and took action. The pilots’ actions in all but one case were to take manual control of the aircraft; the subject who immediately recognized the incorrect mode needed only to request that the mode be corrected, since the aircraft had not yet descended signficantly below the glideslope. Questioning revealed that pilots who took manual control were reacting to the severe descent, the cause of which they had not been able to identify. The pilots intended to stabilize the aircraft manually and then attempt to ascertain the cause of this severe descent.
All of the pilots, even those who did not take any action, were confused and concerned by the increasing descent rate and its accompanying speed build up when in the unanticipated Vertical Speed mode. Some pilots attempted to reduce these particular aircraft states directly by requesting speed brakes and/or a somewhat shallower flight path angle (not noticing the aircraft was in Vertical Speed Mode).
In summary, only one pilot of the twelve recognized the incorrect autopilot mode before the simulation was stopped. This pilot and one other took action at sufficient altitude to avoid ground impact. Seven other pilots took action at 500 feet above ground, too low to avoid ground impact and after an altitude loss greater than in the Strasbourg accident. The remaining four pilots collided with the ground in their simulation runs. Although only two pilots took adequate action, all the pilots indicated a great deal of confusion and concern about the high descent rate and its accompanying nose-down attitude and build-up of speed.
3.3 Variations in Recognition Based on Pilot Characteristics
The altitude at which pilots took action has been examined for differences between pilots with different characteristics. No significant differences can be found between pilots with high and low levels of experience (as indicated by their flight hours), nor can differences be found between pilots of different ages.
Five of the twelve pilots received their initial flight training in the military. Only two of these five took action before the aircraft reached the ground, and at very low altitud
8
8
es. Of the seven pilots whose initial training was not military, two pilots recognized the error at safe altitudes, four took action at low altitudes and only one did not take action. The number samples is too small to provide any statistical significance.
Six pilots identified themselves as captains; four pilots identified themselves as first officers. Of the four flight officers, only one pilot took action (at a ‘safe’ altitude). Of the six captains, only one pilot did not take action. Again, there is not enough data to provide statistical significance.
3.4 Primary and Secondary Cues of Extreme Descent
By noting what the pilots said during the experiment, their simulation runs and the following debriefings, the dominant and supporting cues to the pilot of the extreme descent were identified. These did not appear to vary between the pilots who did or did not take action, nor did they vary between pilots with any other identified characteristic.
During the simulation runs, all of the pilots commented on the high descent rate. During the debriefing, five of the eight pilots who took action cited it as the strongest cue to take action. Another four pilots also cited it as a secondary cue. The indication of the high descent rate was described by six of the pilots as exceeding a certain threshold (e.g. “The vertical speed shouldn’t be more than about 1000 fpm this low on an approach”) and by the other three as not conforming to a formula or cross-check they are accustomed to performing on approach (e.g. “Vertical speed should be about five times the ground speed.”) One of the pilots indicated concern over the descent but then attributed it to the flight path angle mode he believed was commanded at the time.
Another cue that was commented on by most of the pilots, once the descent rate was established, was the speed buildup that occurred as the autopilot attempted to maintain the high rate of descent. In the debriefing, one pilot who took manual control cited this as the first cue of an abnormal situation; another two pilots also cited it as a supporting cue.
Once the 3200 fpm vertical speed is established, the aircraft descends at a flight path angle of approximately eight degrees. This steep descent prevents the aircraft from maintaining the commanded approach speed. With flaps fully extended, this caused the H
9
UD’s aircraft attitude indicator to drop below the flight path vector. This appearance of the HUD was cited by two pilots as the compelling cue for them to take action. Another four pilots cited the extreme nose down attitude as a supporting cue in the debriefing.
The appearance of the radar altimeter on the HUD at 500 feet AGL was cited during the debriefing by only one pilot as a supporting cue. However, seven of the pilots took action soon after this indication appeared on the HUD, suggesting that this indication was more compelling than the pilots’ after-the-fact responses indicate.
Another supporting cue, mentioned by two pilots, was a cross-check of the altitude with the distance to the threshold as shown by the Distance Measuring Equipment (DME). These cross-checks were quite simple, usually a comparison between the fraction of altitude descended to the fraction of the distance covered.
The mode annunciators on the PFD or FCU were noticed by only two pilots, and only after they had taken action. Pilot comments indicate they did not feel the annunciators were compelling because of their ‘heads-down’ location and similar appearances for different modes.
3.5 Pilot Subjective Opinions on Mode Presentation
During the debriefing, all the pilots felt the presentation of Flight Path Angle and Vertical Speed modes could be improved. In free responses, six pilots stated that the mode annunciations should be made more distinct and identifiable. Three pilots stated the selector for these two modes should be physically separated. One suggestion was to use a different color to highlight the ‘non-normal’ mode, although no opinion was given about what should be the ‘normal’ mode.
Six pilots suggested mode annunciation or graphical cues on the HUD, although three also expressed concerns about cluttering the HUD and information overload. Two pilots suggested aural alerts for ‘stupid’ mode selections. One pilot suggested changes in the procedures used for selecting modes, such as calling out the mode and commanded state value, with a response from the pilot-not-flying.
3.6 Simulation Fidelity

0
0
During the debriefing, pilots were asked questions about the simulation fidelity. Eight of the pilots felt they understood the HUD and 10 of the pilots felt they understood the FCU. 10 of the pilots felt the workload in the simulation was realistic; one differing pilot felt the workload was too low, the other differing pilot felt the workload was too high. Overall, the pilots felt the simulation was realistic.
One aspect of the simulation that differs from normal approaches was the emphasis on the subject-pilot to recognize the error without relying on the experimenter-copilot. Recognition of the extreme descent and its cause would presumably happen more quickly in a two-crew cockpit.
Finally, the pilots used in this study were new to HUD’s, the mode Flight Path Angle and the A320 Mode Control Panel. Being relatively untrained in the use of Flight Path Angle mode, their recognition may have been slower than that expected from flight crew trained on these systems.

1
4. CONCLUSIONS
Several valuable conclusions about issues with vertical flight path mode awareness can be made. However, this experiment was not intended to examine any one aircraft’s exact displays or systems; any such studies would require further simulation with exact displays and pilots trained on these the specific systems.
1) Most pilots showed a lack of awareness of the commanded descent mode and were confused by the resulting aircraft states.
All but one of the subjects allowed the aircraft to deviate significantly from the intended glide path, with ten pilots allowing the aircraft to reach altitudes where ground impact either happened or would be difficult to avoid. This indicates that pilots had a serious lack of autopilot mode and aircraft state awareness when given the displays used in the study. All of the pilots were concerned and confused by the vertical speed, pitch attitude and speed buildup that ensued from the descent, but many were reluctant to act because of confusion or a belief that these extreme states were required to maintain the expected flight path angle.
2) Pilots evaluated the condition of the aircraft by supervising aircraft states.
When flying the aircraft, the pilots monitored the aircraft states on their customary primary flight displays, rather than monitoring the commanded modes on the Mode Control Panel. This was shown by the pilots’ comments during the simulations, when all of them mentioned the numerical value of the vertical speed, and most mentioned airspeed and/or altitude checks. These states were evaluated in two ways: as comparisons to allowable thresholds, such as “We should not be descending this fast”; and simple memorized rule manipulations, such as “Vertical speed should be five times the ground speed”.
3) The display cues cited by the pilots and the instruments in their scan suggest study of some changes in mode presentation and pilot training.
2
2
To monitor autopilot conformance, pilots must compare between mode annunciations, commanded values selected on the Mode Control Panel, and the aircraft states shown on their Primary Flight Displays and HUD. This requires the pilot to reference several displays and compare between displays in different formats on different screens, sometimes referencing states that are not distinctly quantified (such as Flight Path Angle).
Several simple display improvements were suggested by the pilots, including: physical separation of the descent mode selectors and mode annunciations, more identifiable mode annunciations than just two or three letter identifiers, and the use of different colors for different modes.
More elaborate display improvements also warrant investigation. For autopilot modes involving altitude and speed, the commanded state values are shown graphically on the same displays as the actual aircraft states. This method of presentation reinforces the pilot’s awareness of the commanded modes and their target states, and allows for easy supervision of autopilot conformance. These types of displays could also be shown when the autopilot is tracking a flight path angle or commanded vertical speed. In addition, this type of display could be included in a HUD type display without adding text annunciators.
Improvements in training and procedures were also suggested by some of the pilots. For example, pilots frequently called out altitudes, DME distance and vertical speeds, but did not have a standard protocol for cross-checking these values with those selected on the Mode Control Panel. Also, none of the pilots cross-checked the mode that was selected by experimenter who was acting as co-pilot; such a procedure would help in quick detection of erroneous mode selection.
Finally, Flight Path Angle is a new autopilot mode that pilots are not accustomed to control manually. Only in the most recent glass cockpit aircraft is any indication of the flight path vector shown, and then only in reference to a pitch ladder on the direction indicator. This autopilot mode and any other mode referencing unfamiliar states requires additional pilot training so that they can quickly predict the underlying dynamics of the aircraft condition they are commanding, and thus monitor its conformance.
Appendix A: Pilot Questionnaire
3
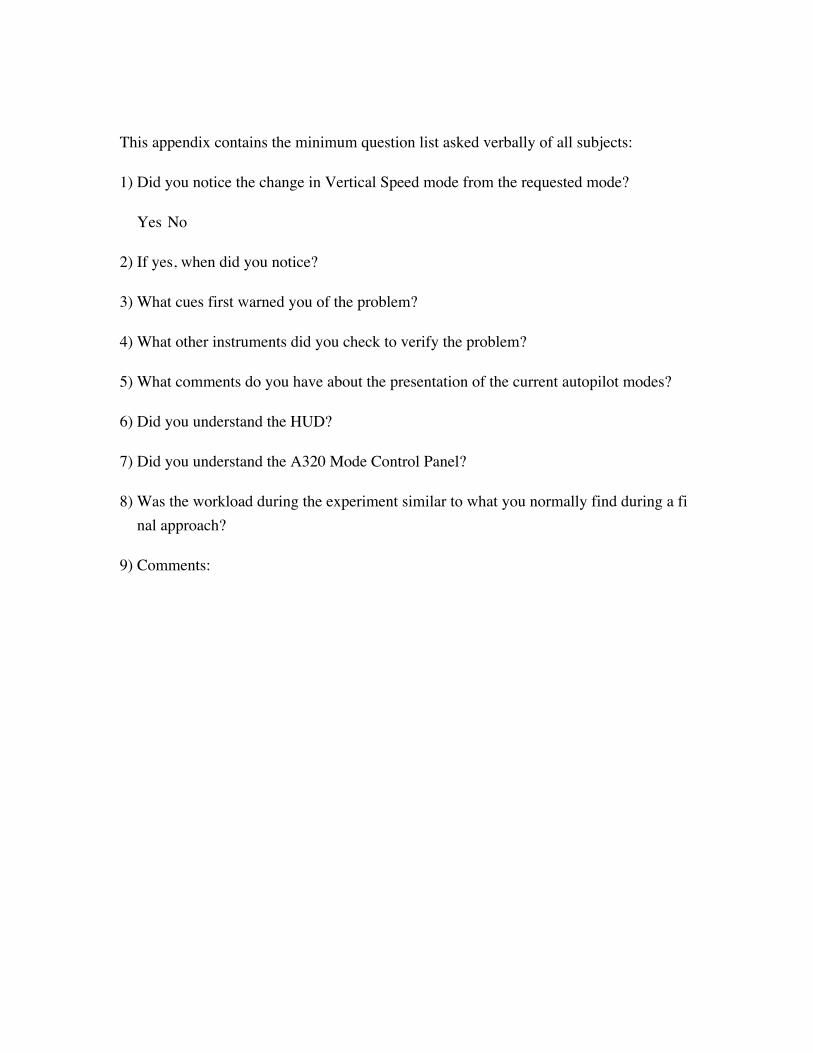
This appendix contains the minimum question list asked verbally of all subjects:
1) Did you notice the change in Vertical Speed mode from the requested mode?
Yes No
2) If yes, when did you notice?
3) What cues first warned you of the problem?
4) What other instruments did you check to verify the problem?
5) What comments do you have about the presentation of the current autopilot modes?
6) Did you understand the HUD?
7) Did you understand the A320 Mode Control Panel?
8) Was the workload during the experiment similar to what you normally find during a final approach?
9) Comments:
4
4
References
Airbus Industries A320 Flight Crew Operations Manual Updated through Revision 10, 1990
Bateman, Don (1991) Flight Into Terrain and the Ground Proximity Warning System Sundstrand Engineering Report 070-4251
Baud, Pierre & Tarnowski, Etienne (1990) “The A320 Head Up Display” Airbus 6th Performance and Operations Conference May 1990, Cairo
Lenorovitz, Jeffrey (1992a) “French Investigators Seek Cause of Rapid Descent” Aviation Week and Space Technology January 27, 1992. P. 32-33
Lenorovitz, Jeffrey (1992b) “Confusion Over Flight Mode May Have Role in A320 Crash” Aviation Week and Space Technology February 3, 1992. P. 29-30
Sparaco, Pierre (1994) “Human Factors Cited in French A320 Crash” Aviation Week and Space Technology January 3, 1994. p. 30-31