NOAA Coral Reef Ecosystem Integrated Observing System ...
68
NOAA Coral Reef Ecosystem Integrated Observing System (CREIOS) Workshops Report J.A. Morgan and J.E. Waddell (eds.) National Oceanic and Atmospheric Administration NOAA Technical Memorandum CRCP 9 November 2009 United States Department of National Oceanic and National Ocean Service Commerce Atmospheric Administration Gary Locke Jane Lubchenco John H. Dunnigan Secretary Administrator Assistant Administrator
Transcript of NOAA Coral Reef Ecosystem Integrated Observing System ...

NOAA Coral Reef Ecosystem Integrated Observing System (CREIOS) Workshops Report J.A. Morgan and J.E. Waddell (eds.) National Oceanic and Atmospheric Administration
NOAA Technical Memorandum CRCP 9
November 2009
United States Department of National Oceanic and National Ocean Service Commerce Atmospheric Administration Gary Locke Jane Lubchenco John H. Dunnigan Secretary Administrator Assistant Administrator

CITATION: Morgan, J.A. and J.E. Waddell (eds.). 2009. NOAA Coral Reef Ecosystem Integrated Observing System (CREIOS) Workshops Report. NOAA Technical Memorandum CRCP 9. NOAA Coral Reef Conservation Program. Silver Spring, MD. 68 pp. ACKNOWLEDGEMENTS: We wish to express gratitude to all of the people who contributed to this Report, and in particular, thanks go to the workshop facilitators for getting the document started; the regional team members who spent many hours writing and editing the jurisdiction chapters; the workshop participants who commented on the document; and most of all to the headquarters team who coordinated, drafted, and edited this document. This Report was made possible with support from NOAA's Coral Reef Conservation Program. WORKSHOPS STEERING COMMITTEE: Chairs: Jessica Morgan (Hawai’i workshop) and Jenny Waddell (Puerto Rico workshop) Headquarters Team: Felipe Arzayus, Alicia Clarke, Sarah O’Connor, Britt Parker, Tracy Parsons,
Anita Pritchett, Steve Thur, John Tomczuk, Cecilia Torres, and Dana Wusinich-Mendez Pacific Regional Team: Valerie Brown, Kathy Chaston, Gerry Davis, Alan Everson, Meghan
Gombos, Kris McElwee, Joyce Miller, Jason Philibotte, and Fatima Sauafea-Leau Atlantic/Caribbean Regional Team: Eileen Alicea, Chris Caldow, Lisamarie Carrubba, Jocelyn
Karazsia, Greg Piniak, Simon Pittman, and Jennifer Schull Facilitators: Stephanie Kavanaugh and Nancy Wallace
FOR MORE INFORMATION: For more information about this report or to request a copy, please email ([email protected]) or fax (301-713-4389) your request to NOAA’s Coral Reef Conservation Program or visit www.coralreef.noaa.gov. DISCLAIMER: Mention of trade names or commercial products does not constitute endorsement or recommendation for their use by the United States government.

i
Table of Contents Executive Summary ................................................................................................................................. ii Section I: Introduction
Key Points ............................................................................................................................................. 1 Workshop Structure ............................................................................................................................. 3
Section II: Summary of Mapping and Monitoring Needs
American Samoa ................................................................................................................................... 6 Commonwealth of the Northern Mariana Islands ........................................................................ 10 Guam.................................................................................................................................................... 13 Hawai’i ................................................................................................................................................. 16 Florida .................................................................................................................................................. 19 U.S. Virgin Islands.............................................................................................................................. 24 Puerto Rico .......................................................................................................................................... 28 Atlantic/Caribbean Region ............................................................................................................... 34
Section III: Summary of NOAA Capabilities and Potential Solutions
Mapping ............................................................................................................................................... 38 Physical and Chemical Oceanographic Monitoring ...................................................................... 41 Biological Monitoring ........................................................................................................................ 42 Near-shore Water Quality Monitoring ............................................................................................ 43 Data Dissemination ........................................................................................................................... 44 National-level Mapping and Monitoring ........................................................................................ 44
Section IV: Conclusion ....................................................................................................................... 46 Appendices
Appendix A: Pacific Workshop Agenda ..................................................................................... A-1 Appendix B: Atlantic/Caribbean Workshop Agenda ................................................................ B-1 Appendix C: Participant List ........................................................................................................ C-1 Appendix D: Workshop Presentations ....................................................................................... D-1 Appendix E: References Cited ..................................................................................................... E-1 Appendix F: Acronyms and Abbreviations ................................................................................. F-1

ii
EXECUTIVE SUMMARY The NOAA Coral Reef Conservation Program (CRCP) conducted two regional workshops in Hawai’i (November 2008) and Puerto Rico (May 2009) to address its national-level mapping and monitoring activities under the Coral Reef Ecosystem Integrated Observing System (CREIOS). NOAA scientists with technical expertise in mapping and monitoring coral reef ecosystems met with resource managers and local scientists from all U.S. coral reef jurisdictions, as well as representatives from Federal agencies and Fishery Management Councils. The facilitated workshops were successful in eliciting priority information needs from managers, and highlighting important issues of concern. This document presents a summary of the discussions held during both workshops, major outcomes, and next steps. The objectives of the workshops were to:
1) identify mapping and monitoring needs to address management for coral reef conservation 2) identify possible products and solutions to meet management needs
Representatives from the following locations made presentations and participated in plenary and breakout discussions with the NOAA service providers: American Samoa, the Commonwealth of the Northern Mariana Islands, Guam, Hawai’i, the Pacific Remote Island Areas, Florida, U.S. Virgin Islands, Puerto Rico, and the Atlantic/Caribbean Region (including Navassa Island and Flower Garden Banks). NOAA scientists presented on the following topics: bathymetric and benthic habitat mapping, physical and chemical monitoring, biological monitoring and assessment, near-shore water quality monitoring of land-based sources of pollution, and data dissemination. It is clear from the results of the workshops that there is a need for:
increased technical capacity within jurisdictions, improved communication of scientific information to general audiences, improved dissemination of NOAA data and information products, and increased emphasis on mapping and monitoring at finer scales in specific areas of
importance to managers. The information gathered at these workshops will help inform the CRCP about the most effective ways to build capacity and provide support for successful and productive partnerships to meet mapping and monitoring needs.

INTRODUCTION
1
Section I: Introduction The United States National Oceanic and Atmospheric Administration (NOAA) Coral Reef Conservation Program (CRCP) is reviewing and revising long-term plans for its monitoring, mapping, and assessment activities, collectively known as the Coral Reef Ecosystem Integrated Observing System (CREIOS), to ensure they are cost-effective, aligned with management needs, and allow for the timely delivery of required products and services to all essential users, given funding constraints. As a first step in a strategic planning effort to strengthen the link between science and management goals, two workshops were held to address needs of coral reef managers in the U.S. Pacific and Atlantic/Caribbean States and Territories:
Pacific CREIOS workshop, November 18-20, 2008, in Honolulu, Hawai’i Atlantic/Caribbean CREIOS Workshop, May 13-14, 2009, in San Juan, Puerto Rico
The purpose of these workshops was to gather input to guide the future direction of the CRCP’s mapping, monitoring, and assessment activities, including:
Bathymetric and benthic habitat mapping Physical oceanographic monitoring Biological monitoring Near-shore water quality monitoring of land-based sources of pollution (LBSP) Data dissemination
The objectives of the workshops were to:
1) identify mapping and monitoring needs to address management for coral reef conservation; and
2) identify possible products and solutions to meet management needs
The outcomes from these workshops are expected to inform strategic long-term funding decisions with regard to the CRCP’s CREIOS program. These workshops were an opportunity for the local managers and NOAA service providers to provide input that will be used to frame various funding scenarios to be considered for fiscal year (FY) 2010 planning and beyond, together with the CRCP Roadmap for the Future and Goals and Objectives, and other strategic planning efforts currently underway.
Key Points
The CREIOS Workshops were successful in gathering information from participants on their priority needs for information. It is clear from the results of the workshops that there is a need for increased technical capacity within jurisdictions, improved communication of scientific information to general audiences, improved dissemination of NOAA data and information products, and increased emphasis on mapping and monitoring at finer scales in specific areas of importance to managers. Specific monitoring and mapping needs developed by each management entity will be critical for the CRCP to evaluate its mapping and monitoring activities. These workshops gave participants from

INTRODUCTION
2
the management entities the opportunity to share their top mapping and monitoring needs with NOAA scientists and staff. The following is a summary of top needs for each location. More detailed information and a list of all needs described by each management entity can be found in Section II of this report. American Samoa’s top mapping and monitoring needs to support management are:
Mapping of marine resource distributions to support Marine Protected Area (MPA) design and the ‘Two Samoas’ initiative
Information on near-shore oceanic currents to better understand connectivity among sites within and surrounding American Samoa
Information on nutrient and sediment loading in near-shore waters
CNMI’s top mapping and monitoring needs to support management are: Bathymetric data to fill gaps in critical shallow-water areas An archipelago-wide hydrographic model to investigate larval connectivity
Guam’s top mapping and monitoring needs to support management are:
Maps of Apra Harbor to assist with planning, assessment, and mitigation efforts associated with the military expansion
Hydrographic data (i.e., currents) to support planning many management efforts
Additionally, CNMI and Guam both indicated that they need assistance with integrating various types of data and information (benthic, oceanographic and fisheries) contained in the upcoming Mariana Archipelago Reef Assessment and Monitoring Program (RAMP) (MARAMP) report for 2003-2007. Hawai’i’s top mapping and monitoring needs to support management are:
Improved satellite imagery for critical areas in the Northwestern Hawai’ian Islands (NWHI) Filling in bathymetric data gaps in the Main Hawai’ian Islands (MHI) Acoustic surveys to understand the magnitude of legal fishing pressure and as a tool for
enforcement in MPAs Integration of watershed information and addressing information gaps
Florida’s top mapping and monitoring needs to support management are:
Consistent bathymetric and benthic habitat maps of unsurveyed areas Acropora monitoring and mapping Increased physical, chemical, and water quality properties monitoring Increased coverage for fishery dependent and fishery independent monitoring Hydrodynamic models for scenario testing and hindcasting
USVI’s top mapping and monitoring needs to support management are:
Hydrodynamic models and water quality monitoring to understand LBSP issues Bathymetric and benthic habitat maps of near-shore marine environments and shallow bays

INTRODUCTION
3
PR’s top mapping and monitoring needs to support management are: Consistent high-resolution bathymetric and benthic habitat maps of priority watersheds Predictive hydrodynamic models to understand watershed and LBSP issues
The Atlantic/Caribbean Regional/Connectivity team’s mapping and monitoring priorities are:
Consistent bathymetric and benthic habitat maps of unsurveyed areas Hydrodynamic modeling to understand connectivity, LBSP, and resilience to climate change Fish tracking and water quality monitoring in all jurisdictions Monitoring of reference sites with relatively low human impacts Centralized access to datasets from multiple sources
All jurisdictions indicated a need for hydrodynamic modeling at various scales (basin- to bay-) to investigate many issues, including larval connectivity, sediment and contaminant transport, thermal stress and capacitance (as a proxy for resilience to climate change), scenario testing and hindcasting to understand detrimental events (algal blooms, runoff events, bleaching events, alien invasions), management planning efforts, and determining locations for coastal uses. The information gathered at these workshops will help inform the CRCP about the most effective ways to build capacity and provide support for successful and productive partnerships to meet mapping and monitoring needs. This report will be used by the CRCP in examining its portfolio of mapping, monitoring, and assessment activities, and be used as a preamble to the identification of priorities and the capacity assessments for each location (see Section IV for more information). An initial outcome of this workshop has been improvements in communication between NOAA service providers and managers. Numerous short-term actions were identified and continue to be addressed by the CRCP. These are the first steps in continuing the after-workshop dialogue as implementation of the CRCP’s Roadmap for the Future.
Workshop Structure More than 50 representatives from local agencies of Hawai’i (HI), Guam, the Commonwealth of the Northern Mariana Islands (CNMI), American Samoa (AS), Florida (FL), the U.S. Virgin Islands (USVI), and Puerto Rico (PR), as well as the following entities, attended these workshops (see Appendix C for a full list of participants):
Papahānaumokuākea Marine National Monument (PMNM) Fagatele Bay National Marine Sanctuary (FBNMS) Florida Keys National Marine Sanctuary (FKNMS) Flower Garden Banks National Marine Sanctuary (FGNMS) Western Pacific Fishery Management Council (WESPAC) South Atlantic Fishery Management Council (SAFMC) Gulf of Mexico Fishery Management Council (GMFMC) Caribbean Fishery Management Council (CFMC) Environmental Protection Agency (EPA)

INTRODUCTION
4
Department of Agriculture (USDA) Department of the Interior (DOI), including the National Park Service (NPS), the Fish and
Wildlife Service (FWS), and the U.S. Geological Survey (USGS) NOAA scientists and service providers from the National Environmental Satellite, Data, and Information Service (NESDIS), the National Marine Fisheries Service (NMFS), the National Ocean Service (NOS), and the Office of Oceanic and Atmospheric Research (OAR) participated in order to discuss scientific capabilities and understand location-specific needs directly from the managers. The following offices were represented (see Appendix C for a full list of participants):
NESDIS Coral Information System (CoRIS) NESDIS Coral Reef Watch (CRW) NMFS Coral Reef Ecosystem Division (CRED) NMFS Office of Habitat Conservation (OHC) NMFS Pacific Islands Fisheries Science Center (PIFSC) NMFS Pacific Islands Regional Office (PIRO) NMFS Southeast Fisheries Science Center (SEFSC) NMFS Southeast Regional Office (SERO) NOS Center for Coastal Monitoring & Assessment (CCMA) Biogeography Branch NOS Center for Coastal Fisheries and Habitat Research (CCFHR) NOS Office of Coastal Resource Management (OCRM) Coral Conservation Division (CCD) NOS Office of National Marine Sanctuaries (ONMS) OAR Coral Health and Monitoring Program (CHAMP) OAR Ocean Chemistry Division (OCD)
Prior to the workshop, preparation was required by both the managers and NOAA service providers to articulate management needs and evaluate current activities. The CRCP’s “site visits” (a combination of one-on-one phone calls, group conference calls, email requests, and in-person meetings at each location) engaged decision-makers, managers, and scientists in developing location-specific lists of management and monitoring needs. The information collected from the pre-workshop site visits is summarized in the workshop materials and panel presentations, available on the CRCP website (see Appendix D for details). Following these site visits, the facilitated workshops were intended to be fora for discussing managers’ needs for monitoring and mapping data to achieve the common goals of increasing understanding of coral reef ecosystems and improving coral reef ecosystem condition. NOAA and other scientists participated alongside the managers in order to discuss scientific capabilities and identify location-specific needs directly from the managers. The full agendas can be found in Appendices A and B. Breakout Groups: Defining Needs Participants from the management entities met in breakout groups by location. Prior to the workshop, presentations were developed by each group to share with all workshop participants on the mapping and monitoring needs to address management efforts. During this first breakout session, the presentations were reviewed and participants from each location agreed on primary topics to focus on during the workshop.

INTRODUCTION
5
Panel Presentation and Discussion: Mapping and Monitoring Needs Each group presented their mapping and monitoring needs and participated in a panel discussion. The complete presentations can be viewed on the CRCP website (see Appendix D for details). A summary of the primary management needs was synthesized by location. There was a discussion period after each presentation. Panel Presentation and Discussion: NOAA’s Solutions to Address Management Needs NOAA scientists shared information on NOAA capabilities and services that can address management needs for coral mapping and monitoring. NOAA panelists presented on the following topics:
Mapping Physical Monitoring Biological Monitoring Near-shore Water Quality Monitoring Data Dissemination
See Section III of this report for summaries of these presentations. Breakout Groups: Brainstorming Potential Products and Solutions To develop solutions for specific management needs, each jurisdiction met with each NOAA technical group. The groups discussed NOAA products and services available to address their management needs and what could be developed in the future. See Section II of this report for summaries of these discussions. Breakout Groups: Refining Potential Solutions After the management communities met with all of the technical groups, they identified the primary products and solutions that would best fit their management needs. This information was then shared with all workshop participants. This information is also contained in Section II of this report.

AMERICAN SAMOA
6
Section II: Summary of Mapping and Monitoring Needs NOAA capabilities for mapping and monitoring can be found in Section III. Presentations on mapping and monitoring needs, and NOAA presentations on capabilities, can be found on the CRCP website (see Appendix D for details).
American Samoa CONTEXT The AS team began the workshop by reviewing the results from the site visit interviews, and identifying priority needs for AS coral reef management and conservation that can be addressed via mapping, monitoring and assessment. AS’s management priorities are:
Building local capacity Fisheries management Establishment of an MPA Network Habitat degradation and land-based pollution Population growth
AS’s top mapping and monitoring needs to support management are:
Information on near-shore oceanic currents to better understand connectivity among sites within and surrounding American Samoa
Mapping of marine resource distributions to support MPA design and the ‘Two Samoas’ initiative
Information on nutrient and sediment loading in near-shore waters AS also has the following related needs:
Increased technical staff capacity in order to better utilize the available data, including possible reestablishment of the NOAA Geographic Information System (GIS) fellowship program sponsored by the NOAA Pacific Services Center
Better data dissemination and increased communication on product availability from NOAA scientists
Staff exchanges and personnel sharing among partners. An FBNMS Research Coordinator position should be backfilled and a NOAA Coral Reef Ecosystem Division (CRED) staff member could be located in American Samoa on a 1-2 year rotation to communicate monitoring results to the community and managers; AS proposed a shared position between Fagatele Bay National Marine Sanctuary (FBNMS), CRED, and the American Samoa Government (ASG), which would benefit all parties, and would support National Park Service’s work servicing sensor

AMERICAN SAMOA
7
MAPPING Information gaps for MPA process: A major management priority is the governmental mandate
for establishing MPAs. The lack of base maps is a significant hindrance to choosing areas for MPAs. AS needs information in some areas, including integrated shallow-to-deep maps, habitat maps for the seamounts and banks around Tutuila, and maps of areas that have not been mapped (about 15% of the National Park) due to cloud cover over the island.
Bathymetric data: AS needs good bathymetric data for hydrodynamic modeling. AS also needs a pseudo-bathymetric product; a composite product is available but may not include all the area and data needed. AS needs access to Light Detection and Ranging (LIDAR) data from the Navy. Both Samoa and American Samoa need access to digital topographic data (for terrestrial areas) collected by New Zealand. AS National Park Service (NPS) has imagery but needs assistance to sort or process it. The priority is to gather data from multiple sources and begin integrating Samoa and American Samoa data.
Benthic habitat map products: AS needs greater ground-truthing and evolution away from the coral-centric classification. AS needs help identifying what products (i.e., maps, imagery) are available and applying the maps to support local monitoring and management via GIS expertise. Graduate student projects and partnerships with the NOAA Pacific Services Center (PSC) could help disseminate imagery, conduct analyses and re-interpret data. The priority is to develop seamless simplified substrate maps (i.e., hard vs. soft surfaces) from the shoreline to 1000 m. AS does not necessarily need higher resolution.
Airport expansion: AS needs an integrated GIS product that could inform this process. PHYSICAL MONITORING Current modeling for larval dispersal/connectivity: AS needs coarse surface circulation
information that could be used to identify finer-scale areas of interest, and information on currents and flushing for areas like Pago Pago Harbor and Vatia Bay. Several models could provide this information: Office of Naval Research (ONR) model, Hybrid Coordinate Ocean Model (HYCOM), Ocean Surface Current Simulations (OSCURS) model, and Delft3D model. AS needs ocean current and circulation data in areas of interest, and dedicated staff time and expertise to apply and validate models with existing in situ and satellite data.
Hydrographic data for water quality modeling: AS needs data on flushing rates and water residency times for key embayments and near-shore areas, including Fagasa, Fagaalu Bay, and Alofau. AS Coastal Zone Management (CZM) has approached the Army Corps of Engineers about this work; U.S. Department of Agriculture (USDA) Natural Resources Conservation Service (NRCS) is active in Alofau, but does not have sufficient technical expertise to conduct this work.
BIOLOGICAL MONITORING Regulatory Environmental Assessments: AS needs accurate coral growth rate measurements to
be used in modeling recovery rates after vessel groundings or other disturbances (e.g., airport expansion). AS Environmental Protection Agency (EPA) may request assistance on this; U.S. EPA may also be able to help.
AMERICAN SAMOA
8
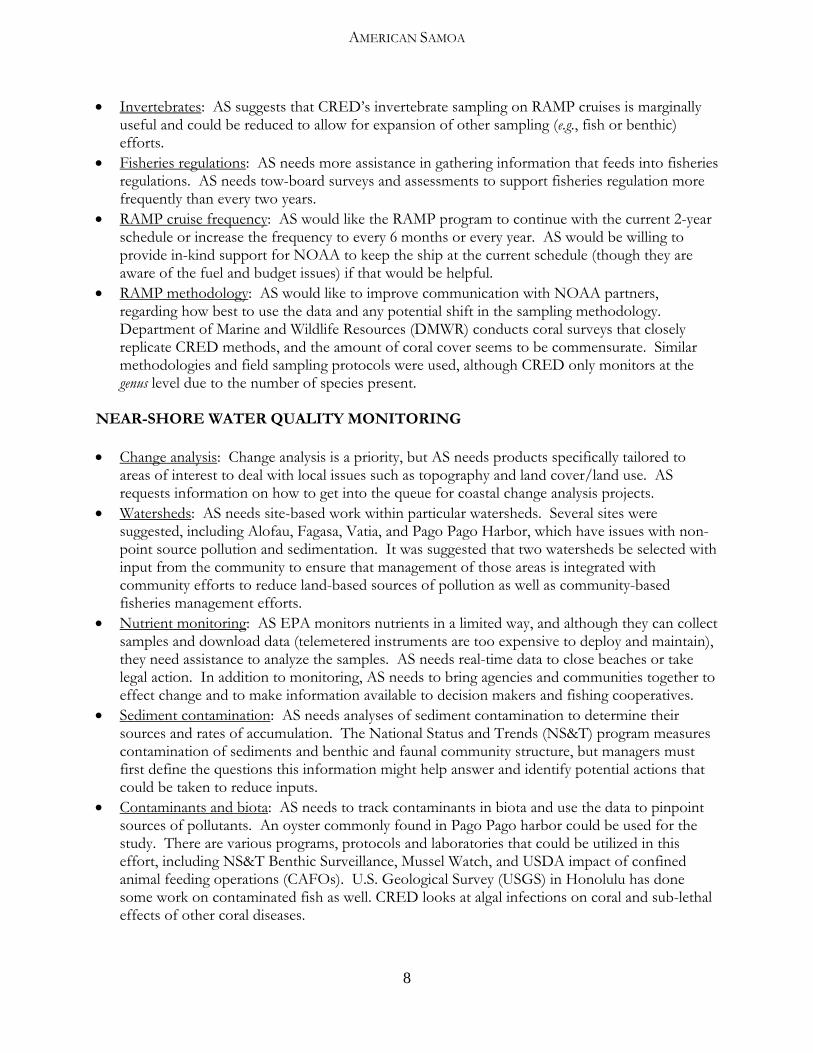
Invertebrates: AS suggests that CRED’s invertebrate sampling on RAMP cruises is marginally useful and could be reduced to allow for expansion of other sampling (e.g., fish or benthic) efforts.
Fisheries regulations: AS needs more assistance in gathering information that feeds into fisheries regulations. AS needs tow-board surveys and assessments to support fisheries regulation more frequently than every two years.
RAMP cruise frequency: AS would like the RAMP program to continue with the current 2-year schedule or increase the frequency to every 6 months or every year. AS would be willing to provide in-kind support for NOAA to keep the ship at the current schedule (though they are aware of the fuel and budget issues) if that would be helpful.
RAMP methodology: AS would like to improve communication with NOAA partners, regarding how best to use the data and any potential shift in the sampling methodology. Department of Marine and Wildlife Resources (DMWR) conducts coral surveys that closely replicate CRED methods, and the amount of coral cover seems to be commensurate. Similar methodologies and field sampling protocols were used, although CRED only monitors at the genus level due to the number of species present.
NEAR-SHORE WATER QUALITY MONITORING Change analysis: Change analysis is a priority, but AS needs products specifically tailored to
areas of interest to deal with local issues such as topography and land cover/land use. AS requests information on how to get into the queue for coastal change analysis projects.
Watersheds: AS needs site-based work within particular watersheds. Several sites were suggested, including Alofau, Fagasa, Vatia, and Pago Pago Harbor, which have issues with non-point source pollution and sedimentation. It was suggested that two watersheds be selected with input from the community to ensure that management of those areas is integrated with community efforts to reduce land-based sources of pollution as well as community-based fisheries management efforts.
Nutrient monitoring: AS EPA monitors nutrients in a limited way, and although they can collect samples and download data (telemetered instruments are too expensive to deploy and maintain), they need assistance to analyze the samples. AS needs real-time data to close beaches or take legal action. In addition to monitoring, AS needs to bring agencies and communities together to effect change and to make information available to decision makers and fishing cooperatives.
Sediment contamination: AS needs analyses of sediment contamination to determine their sources and rates of accumulation. The National Status and Trends (NS&T) program measures contamination of sediments and benthic and faunal community structure, but managers must first define the questions this information might help answer and identify potential actions that could be taken to reduce inputs.
Contaminants and biota: AS needs to track contaminants in biota and use the data to pinpoint sources of pollutants. An oyster commonly found in Pago Pago harbor could be used for the study. There are various programs, protocols and laboratories that could be utilized in this effort, including NS&T Benthic Surveillance, Mussel Watch, and USDA impact of confined animal feeding operations (CAFOs). U.S. Geological Survey (USGS) in Honolulu has done some work on contaminated fish as well. CRED looks at algal infections on coral and sub-lethal effects of other coral diseases.

AMERICAN SAMOA
9
NOAA’s Coral Reef Ecosystem Monitoring Report for American Samoa (2002-2006)
Accessibility and analyses: AS needs a simplified Coral Reef Ecosystem Monitoring Report that is
more accessible to readers. It would be useful to have training or a workshop to share the outcomes so that managers understand the implications of the data and can use the information to support management decisions. A first step would be translation of the information into an expanded executive summary. AS also needs further directed analysis of the monitoring data to answer local management questions.
Feedback and evaluation: A report template was discussed with jurisdictions long ago, but there needs to be an evaluation form included during report distribution to make sure the template provides the information needed by the jurisdiction. The report template should be adaptable and more flexible. One way to do this would be to have a more formal review process on how to improve the process for the template.

CNMI
10
Commonwealth of the Northern Mariana Islands CONTEXT The CNMI team began the workshop by reviewing the results from the site visit interviews, and identifying priority management needs for the CNMI coral reef conservation initiative. After identifying their priorities they met with the Guam team to compare results, recognizing that they share similar goals and are both part of larger regional efforts (i.e., the Micronesia Challenge). Through this discussion it was obvious that CNMI and Guam share similar management priorities and agreed management efforts should be carried out in a more regional context where appropriate. CNMI’s management priorities are:
Land-based sources of pollution Fisheries management, fish and coral population issues, and connectivity Ecosystem links between trophic groups, understanding life history, and stock assessments
CNMI’s top mapping and monitoring needs to support management are:
An archipelago-wide hydrographic model to investigate larval connectivity Bathymetric data to fill gaps in critical shallow-water areas Assistance with integration of various types of data and information (benthic, oceanographic
and fisheries) contained in the upcoming MARAMP report for 2003-2007 CNMI also has the following related needs:
Training for on-island managers, including having dedicated staff on the ground or having NOAA available to respond to requests when needed
Social monitoring work is important and would help make education and outreach efforts more effective in causing behavior change
MAPPING Habitat maps: Benthic shallow water habitat mapping is being done by NOAA Center for
Coastal Monitoring & Assessment (CCMA) at a smaller mapping unit in the Caribbean (funded by the NPS) and using a new classification system which is a dominant habitat cover scheme combining structure and cover (though it does not differentiate coral habitat by dominant species). CNMI expressed interest in learning more about this new classification system once it is finalized in the Caribbean.
Change analysis: CNMI is interested in using maps and remote sensing imagery for change detection and expressed interest in leveraging purchasing power for new imagery through NOAA. The National Aeronautics and Space Administration (NASA) had previously offered support with hyperspectral data.
Bathymetric data: Bathymetric data has been collected by CRED in water depths of 15-1000 m, which leaves a gap in critical near-shore areas (<15 m) that are too shallow for the ship to enter, and to date has been filled by estimated depths derived from IKONOS imagery and shallow-water habitat maps. CNMI would like access to the Navy’s LIDAR data to fill additional gaps in bathymetric data for some locations.

CNMI
11
Benthic habitat map products: CNMI needs to receive technical support on any new or updated map products, and requests more involvement in the design of future mapping surveys. CRED has addressed classification issues in deeper waters via a GIS database using a variety of layers (e.g., rugosity and benthic complexity) rather than producing a final benthic habitat map. CNMI also needs a process for rapid and on-demand creation of GIS maps for managers to address specific and immediate questions.
Map resolution: CNMI needs increased spatial resolution on their baseline shallow water habitat maps in selected areas, especially Saipan Lagoon (15-20 meters).
Instrumentation: CNMI expressed interest in using the R/V AHI (Acoustic Habitat Investigator), as well as the independent use of the Towed Optical Assessment Device (TOAD).
PHYSICAL MONITORING Current modeling for larval dispersal/connectivity: An archipelago-wide hydrographic model is
a high priority for CNMI to investigate connectivity questions (currents, larvae/plankton sources and sinks). A variety of modeling methods and options were discussed, some of which would include biological and physical data.
ICON/CREWS Station: NOAA is funding the installation of an Integrated Coral Observing Network (ICON) /Coral Reef Early Warning (CREWS) station in CNMI. NOAA should continue coordination with CNMI to ensure that the location of the station is based on CNMI’s specific data needs and objectives.
Instrumentation: CNMI is interested in both archival data (to understand dynamics) and near-real-time data (for current conditions) but questioned the need for some of the CRED instrumentation in CNMI. Clarification of the management questions will help determine if archival data or (much more expensive) near-real-time data would be appropriate.
Data delivery: CNMI expressed concerns with formatting of the CRED data available through the file transfer protocol (FTP) site. CNMI needs to have rapid access to the data to be able to make its own graphs and maps. CRED is working on making the data accessible in network common data form (NetCDF) format rather than as raw data.
BIOLOGICAL MONITORING Change analysis: CNMI needs change analyses, and cause and effect information, which is
critical to engage legislators into making management decisions. Fisheries data: CNMI needs information on fisheries life history that can be used for stock
assessments, particularly in relation to the deeper depth ranges (i.e., from 30-100 meters), where the fish stock size and structures are unknown. Options were discussed including the addition of fishery-focused RAMP cruises or the harvest of fish during regular RAMP cruises. CRED will have increased capacity to get information on deeper ranges (>100 meters) through a partnership with Woods Hole to use an autonomous underwater vehicle (AUV) for benthic still photography, which would benefit CNMI if the technology allows for assessment of fish.
RAMP objectives: CNMI needs to understand NOAA’s national mandates and responsibilities, the purpose for the RAMP cruises, the questions driving federal research efforts, and how CNMI fits within those priorities. CNMI would like NOAA to clarify its objectives so that both can work together better. CNMI views NOAA monitoring activities as focusing on regional questions not local ones, and voiced concern about current products not meeting their local

CNMI
12
needs. CNMI is concerned that CRED’s regional focus may not address local management questions.
RAMP methodology: CNMI expressed concerns about CRED’s monitoring sampling design and statistical robustness of the resulting data, as well as concerns with the lack of flexibility to modify methodologies. CNMI prefers that monitoring efforts spend more time and gather more details in specific sites, rather than do more assessments in a higher number of sites. CNMI is concerned about the excessive variety of information gathered by CRED at the cost of more focused, detailed and higher quality data.
RAMP data dissemination: CNMI is concerned with NOAA’s timeliness in providing data. Although the need for quality assurance/quality control (QA/QC) is well understood, data that is 1-2 years old is no longer timely or useful to managers. Inquiries were made about NOAA’s policy on data management and whether there are any time requirements for release of federally-funded data. Since CNMI participates in the acquisition of that data, it is seen as an inefficient use of their time. CNMI is interested in quick resource feedback before the final polished product is available.
RAMP report: CRED is working on development of the MARAMP report, which is modeled after the American Samoa report. CRED will be adding more socioeconomic information. CNMI reiterated the need for assistance with the integration of the various types of data (benthic, oceanographic and fisheries), since they do not have enough resources to dedicate to data analysis and interpretation or pulling out the information that will be of interest to managers. CRED is working with Hawai’i Institute of Marine Biology (HIMB) to create better linkages between the data, and is working with CNMI and Guam to discuss other improvements to the report.
NEAR-SHORE WATER QUALITY MONITORING Watersheds: CNMI needs an inventory of watersheds with land-use classifications to allow
them to begin focusing their efforts on priority areas. Contaminants: CNMI is interested in the NOAA tools and services related to conducting
pollution and water quality monitoring, including Mussel Watch and the Jobos Bay partnership with USDA; CNMI needs information on what services are available and how to access them. CNMI also requested information regarding costs of analytical chemistry.
Science funding: CNMI voiced concern about the loss of CZM funding for the 310 Program, which allowed for funding of land-based sources of pollution (LBSP) -related projects that are not currently eligible for funding under the CRCP management grant program.

GUAM
13
Guam CONTEXT The Guam team began the workshop by reviewing the results from the site visit interviews, summarizing Guam’s priority management needs, and identifying specific case studies to discuss with the NOAA technical teams. After this review, they met with the CNMI team to compare results, recognizing that they share similar goals and are both part of larger regional efforts (i.e., the Micronesia Challenge). Through this discussion it was obvious that Guam and CNMI share similar management priorities and both jurisdictions agreed that a regional approach to management efforts should be pursued where appropriate. Guam’s management priorities are:
Watershed impacts Fisheries management Military expansion Reef resiliency Bridging social and scientific aspects of coral reef management
Guam’s top mapping and monitoring needs to support management are:
Maps of Apra Harbor to assist with planning, assessment, and mitigation efforts associated with the military expansion
Hydrographic data (i.e., currents) to support planning many management efforts Assistance with integration of various types of data (benthic, oceanographic and fisheries) in
the upcoming MARAMP report for 2003-2007
Guam also has the following related needs: Assistance from NOAA to address capacity building issues, the lack of funding for
assessments and water quality monitoring, and funding mechanisms (such as contracts) to expedite activities
Assistance from NOAA to develop alternate means for outreach to convey conservation messages (e.g., YouTube or MySpace), and
Assistance from NOAA to leverage opportunities with other agencies, U.S. Coral Reef Task Force (CRTF) partners, and non-governmental organizations
Guam specifically needs to build capacity via a specialist in statistical and survey design to assist with local plans, and a facilitation specialist to help develop and prioritize specific questions for mapping and monitoring needs
Guam is challenged by its legal mandates’ all-encompassing purview which result in difficulties in setting targeted management activities, monitoring, and research
Guam expressed the importance of augmenting science with a better understanding of the social components to deal with the root problems of why people do what they do

GUAM
14
MAPPING Apra Harbor: Guam has an immediate need for maps of Apra Harbor to assist with planning,
assessment, and mitigation efforts associated with the military expansion. The Department of Defense (DoD) and Port Authority of Guam are planning large dredge projects in Apra Harbor soon, which could cause significant changes to the harbor and the unique coral reef ecosystems found within it.
Bathymetric data: Guam needs to obtain, better understand, and apply multibeam, backscatter, and LIDAR data products to management questions.
Benthic habitat map products: Guam requests more information about NOAA’s benthic habitat mapping capabilities, including higher resolution mapping, assessment accuracy, and repeat mapping as a basis for change detection.
Map resolution: NOAA capabilities may be suitable for particular high priority sites, but not for island wide assessments. Guam needs focused application such as the creation of higher resolution maps to address management concerns regarding Acropora as a signature in early warnings for bleaching, and to tease out the difference among soft and hard coral areas. Guam recognizes their reliance on NOAA for these data sets, but wants to better understand how they can get their local priority needs addressed by NOAA.
PHYSICAL MONITORING Hydrographic data: Guam needs technical assistance and critical data about currents to support
the planning processes for major efforts such as the military buildup and Micronesia Challenge. This lack of data has made it especially challenging to address issues associated with near-shore pollution, resiliency, and connectivity (both locally and regionally).
Current modeling for larval dispersal/connectivity: Guam needs hydrographic information to support hydrodynamic modeling at several scales, including: embayment-scale (coral settlement and recruitment), island-scale integrating embayment- to archipelago-scale models (larval dispersal), archipelago-scale (large-scale connectivity, large-scale resilience and connectivity planning), regional-scale (supports regional planning in accordance with Micronesia Challenge goals, connectivity linkages to other islands).
Hydrographic data for water quality modeling: Guam needs hydrographic information to support water quality modeling: embayment-scale (LBSP and watershed restoration work, sediment dynamics), and island-scale (sediment and nutrient transport around the island).
ICON/CREWS Station: Guam needs technical assistance to increase its capacity for collecting physical water quality data parameters, particularly sediments and nutrients. Guam would benefit from continuous near-real-time data sets. Guam expressed interest in exploring the ICON/CREWS station capabilities (i.e., data types and timescales) in relation to watershed restoration efforts.
BIOLOGICAL MONITORING Trend analysis: Guam needs monitoring information that is capable of determining the trends. Data tools: Guam needs a data integration product to alleviate the time and workforce burdens
of piecing multiple data sets and project information together.

GUAM
15
RAMP objectives: Guam is concerned with all the information that is collected from CRED cruises and how it is used to address management driven needs. Guam reiterated the need for better communication between scientists and managers when developing and prioritizing needs. Guam is interested in getting at the source of problems with targeted research to understand correlations for causality to drive management actions.
RAMP methodology: Guam expressed concerns with the statistical robustness of the data provided by CRED.
NEAR-SHORE WATER QUALITY MONITORING Watersheds: Guam needs more information on the types of data NOAA could provide for
watershed activities. Guam’s goals for watershed restoration are to restore lost ecological function, regain diversity, and return to a more robust and resilient coral reef ecosystem. Guam needs data or information that clearly demonstrates the linkages between terrestrial activities such as reforestation or engineering features that have directly resulted in a positive impact on the adjacent reef environment; this information is necessary to get both community and fiduciary support for further restoration work.
HAWAI’I
16
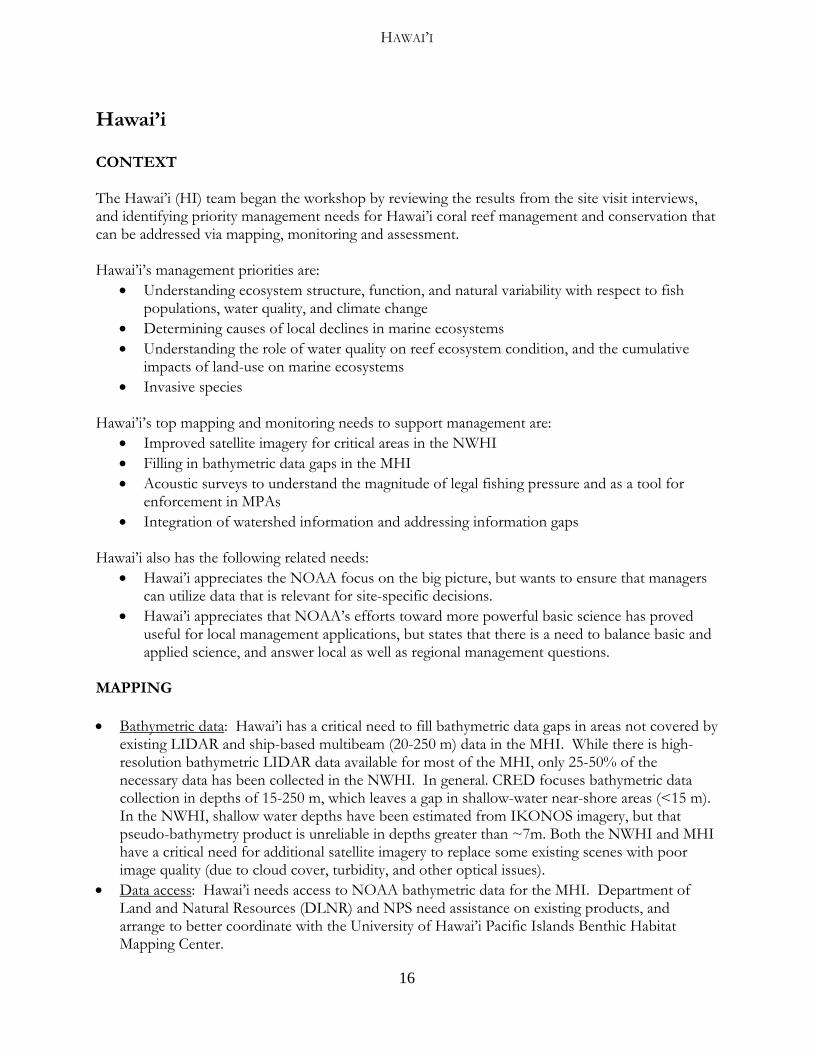
Hawai’i CONTEXT The Hawai’i (HI) team began the workshop by reviewing the results from the site visit interviews, and identifying priority management needs for Hawai’i coral reef management and conservation that can be addressed via mapping, monitoring and assessment. Hawai’i’s management priorities are:
Understanding ecosystem structure, function, and natural variability with respect to fish populations, water quality, and climate change
Determining causes of local declines in marine ecosystems Understanding the role of water quality on reef ecosystem condition, and the cumulative
impacts of land-use on marine ecosystems Invasive species
Hawai’i’s top mapping and monitoring needs to support management are:
Improved satellite imagery for critical areas in the NWHI Filling in bathymetric data gaps in the MHI Acoustic surveys to understand the magnitude of legal fishing pressure and as a tool for
enforcement in MPAs Integration of watershed information and addressing information gaps
Hawai’i also has the following related needs:
Hawai’i appreciates the NOAA focus on the big picture, but wants to ensure that managers can utilize data that is relevant for site-specific decisions.
Hawai’i appreciates that NOAA’s efforts toward more powerful basic science has proved useful for local management applications, but states that there is a need to balance basic and applied science, and answer local as well as regional management questions.
MAPPING Bathymetric data: Hawai’i has a critical need to fill bathymetric data gaps in areas not covered by
existing LIDAR and ship-based multibeam (20-250 m) data in the MHI. While there is high-resolution bathymetric LIDAR data available for most of the MHI, only 25-50% of the necessary data has been collected in the NWHI. In general. CRED focuses bathymetric data collection in depths of 15-250 m, which leaves a gap in shallow-water near-shore areas (<15 m). In the NWHI, shallow water depths have been estimated from IKONOS imagery, but that pseudo-bathymetry product is unreliable in depths greater than ~7m. Both the NWHI and MHI have a critical need for additional satellite imagery to replace some existing scenes with poor image quality (due to cloud cover, turbidity, and other optical issues).
Data access: Hawai’i needs access to NOAA bathymetric data for the MHI. Department of Land and Natural Resources (DLNR) and NPS need assistance on existing products, and arrange to better coordinate with the University of Hawai’i Pacific Islands Benthic Habitat Mapping Center.

HAWAI’I
17
Instrumentation: Hawai’i expressed interest using the R/V AHI (Acoustic Habitat Investigator) to identify and assess critical fish habitat.
PHYSICAL MONITORING Current modeling for larval dispersal/connectivity: Hawai’i needs integrated offshore and near-
shore current models to inform management decisions regarding MPAs and fisheries management. Bringing these models together could assist HI managers with understanding connectivity, determining how much annual variability (changes in recruitment) is driven by physical processes, and answering questions such as whether larvae are getting off the reef. This information could also be used to identify areas more resilient for potential protection from climate change.
Instrumentation: Hawai’i has a priority need for acoustic surveys (such as the Ecological Acoustic Recorders), both to understand the magnitude of legal fishing pressure and as a tool for enforcement in MPAs.
BIOLOGICAL MONITORING Fisheries data: Hawai’i needs NOAA assistance with fishery information, ranging from
estimates of fishing pressure to analysis of 20 years of creel survey data. RAMP methodology: Hawai’i suggests that RAMP sampling design be modified to integrate
better with other data and improve statistical robustness. Other options discussed include possible calibration methods to make data more comparable. This continues to be a subject of much debate, as a variety of methodologies are being utilized. A mini-workshop held just prior to the CREIOS workshop examined fish monitoring methodologies and illustrated the wide range of methods used even within a specific type of monitoring (such as belt transects).
RAMP data dissemination: Hawai’i requested assistance with improving dissemination of NOAA data, specifically a clear conduit for exchange (i.e., who should they go through), and access in more useful formats. CRED has initiated a Scientific Liaison program to provide a main technical point of contact for each jurisdiction, including one liaison each for MHI and the NWHI.
NEAR-SHORE WATER QUALITY MONITORING Watersheds: Hawai’i is interested in expanding integrated watershed studies such as the Jobos
Bay partnership to specific sites in Hawai’i. This information and the partnerships with stakeholder agencies would allow prioritization of sites for management actions to reduce nutrient loading/sedimentation. Hawai’i would like to continue discussions with a wider suite of partners, such as the Army Corps of Engineers, the Hawai’i Department of Health, the DLNR liaison, the CZM program, and non-governmental organizations (NGOs). NOAA and the EPA are willing and able to assist, but the State needs to prioritize activities/locations and in some cases specifically request assistance.
Watershed information gaps: A necessary step in site prioritization is integration of watershed information from sources such as USGS (impervious surface maps), the EPA (National Pollutant Discharge Elimination System [NPDES] permits), etc. Gaps include unmapped storm drainage systems and a more general understanding of what happens before and after stream

HAWAI’I
18
channelization or management actions. Potential differences in response along a gradient of severely impacted to more pristine watersheds are also unknown. Turbidity analyses using remote sensing (analysis of Landsat imagery) may be a promising avenue for quantifying turbidity plumes resulting from stream channelizations.
Contaminants: Hawai’i needs to increase capacity to monitor for toxins and pollutants (e.g., Mussel Watch).

FLORIDA
19
Florida CONTEXT This section was written using information recorded during the pre-workshop discussions with Florida reef managers and scientists from over 25 entities, the workshop rotating breakout sessions with NOAA technical panels and the post-breakout group report out by Florida participants on their priority mapping and monitoring needs. The Florida Reef Tract exhibits a major change in latitude from north to south and runs from southeast central Florida (Martin County) to the Tortugas Bank. The reef tract includes the following areas: Southeast Florida Coral Reef Initiative (SEFCRI) Area, Biscayne National Park, Everglades and the Dry Tortugas National Parks, and the NOAA Florida Keys National Marine Sanctuary (FKNMS). The Southwest Florida Shelf and Florida Bay are also areas of interest. The high-latitude Florida Reef Tract is unique for many reasons and is often considered the third largest reef complex in the world (NOAA, 2002; Porter and Porter, 2002). Myriad organisms characterize the wide variety of habitats found along Florida reefs, including algae, octocorals, and varied hard coral populations. The various reef architectural and compositional components create an environment that is ecologically diverse and productive, one that supports many other aquatic plants and animals. Unlike other jurisdictions, the Florida region is supported by two Fishery Management Councils – the Gulf of Mexico and the South Atlantic. In addition, the Florida reef system is an economic engine. Millions of tourists and local residents enjoy scuba diving, snorkeling, and fishing on Florida's coral reefs. These activities provide a major source of income for Florida and its coastal communities. From June 2000 to May 2001, reef-related expenditures generated $6.1 billion and 71,000 jobs (Johns et al., 2001; Johns et al., 2004). Furthermore, over 6 million people live in southeast Florida within 3 miles of the coast (U.S. Census). This dense population places enormous pressure on the reef system through coastal construction activities, land-based sources of pollution, in addition to the activities listed above. A recent publication (Rohmann et al., 2005) estimated distribution of potential coral ecosystems within the U.S. territorial sea and exclusive economic zone and found that coral ecosystems of South Florida represented had 30,801 square km or 84% of U.S. holdings. Florida workshop participants agreed that overall, Florida needs to be looked at as a ‘holistic system’, and would benefit greatly from enhanced communication amongst all players in order to maximize limited individual capacities and increase opportunities for collaboration. They also agreed that Florida has much of the technical capacity to complete the priorities discussed at the workshop, but lacks the fiscal capacity to operationalize them. Florida’s management priorities for mapping and monitoring are:
Develop high quality coral reef mapping and monitoring products to generate knowledge about the status and trends of existing coral ecosystem resources and to support informed management that pertain to (but are not limited to): endangered species recovery

FLORIDA
20
reef and seagrass restoration marine spatial planning design of monitoring programs and research projects anchorage relocation
Mapping and monitoring products will be used to better understand and manage impacts associated with: climate change overfishing land-based sources of pollution (LBSP) marine construction development of general management plans and science plans Essential Fish Habitat and Endangered Species Act consultations
Florida’s top mapping and monitoring needs to support management are:
Mapping Mapping (bathymetry) and benthic habitat layers of unsurveyed areas Development of a single, consistent reef tract habitat map Mapping location of ‘thickets’ of Acropora colonies Inclusion of reef data on navigational charts Physical Monitoring Chlorophyll a and optical properties monitoring Improved sea surface temperature (SST) and bottom temperature data Hydrodynamic models for scenario testing and hindcasting Ocean acidification monitoring packages Biological Monitoring Increased coverage for fishery dependent and fishery independent monitoring Increase the number of Southeast Florida Coral Reef Evaluation and Monitoring Project
(SECREMP) sites Inclusion of coral recruitment in the CREMP and SECREMP activities Acropora monitoring LBSP and near-shore water quality (WQ) monitoring Tiered WQ monitoring at high temporal resolution for select sites Increase water quality monitoring effort in the SEFCRI area
Florida also has the following related needs:
The importance of having an emergency fund available to respond to disturbance events was mentioned in the context of biological monitoring and LBSP. This type of funding is difficult to obtain given the current constraints on CRCP grants. Participants suggested looking into establishing a State of Florida (e.g., State Park) trust fund or looking to the NOAA Marine Mammal Stranding Program as an example. Participants also suggested increasing the use of volunteers to report coral bleaching, algal blooms and other events. An example model program to examine is the MEERA (Marine Ecosystem Event Response and Assessment) program, which is being expanded for this use.

FLORIDA
21
Florida participants see the need for a Florida-focused benthic ecology workshop. Topics at the workshop would include discussions on standardizing high priority monitoring across the jurisdiction; ways to ensure monitoring programs are comprehensive enough to capture impacts of LBSP, Fishing, and Climate; creation of comparable indicators and analyses; and improved Acropora monitoring, data distribution and reporting.
A central repository for mapping and monitoring data with broad access to users FACE (Florida Area Coastal Environment) program data accessibility
MAPPING Mapping of unknown areas: Maps of Palm Beach, Broward and Miami-Dade County are already
complete and used on a daily basis to make reef management decisions. Martin County and virtually all of the FKNMS still need to be completed. Bathymetry layers should be included in this effort to assist with vessel grounding damage assessment and site restoration, zoning, etc.; however the bathymetry does not have to be at the IHO1 NOAA standard to be useful to the management community. It was suggested that a significant investment would be needed to complete the mapping of unknown areas. Completion of, and access to mapping surveys of unmapped areas near the Port of Miami anchorage by NOAA Hydrographic Services. While priority areas are focused on coral reef locations, associated locations such as Florida Bay and the west coast (Cape Sable to the Ten Thousand Islands) lack bathymetric information that would assist those managers. Mapping of Hawk Channel, and the Back Country area of the Keys to support Key Deer management.
Single, consistent reef tract map: The creation of single, reef tract map (including bathymetry) with consistent classification schemes is also priority for Florida. Limited funds are a barrier to accomplishing this priority.
Collection of benthic habitat data and refinement of existing maps: Martin County and FKNMS are priority areas for collection of benthic habitat data, which is a critical layer on the above mentioned maps. Finer scale resolution (<1 acre minimum mapping unit) benthic habitat maps are needed in certain areas.
Mapping locations of Acropora colonies: Managers need maps of Acropora presence/absence and demographics. Federally designated critical habitat also needs to be mapped. This information would be useful in recovery planning and determining population trends. Florida participants suggested that imagery, optical and backscatter could be used to predict Acropora presence and verify.
Inclusion of reef data on navigational charts: Florida participants would like to see reef data on navigational charts, but understand the challenges associated with this task. Florida participants suggested that the primary reason for inclusion would be for enforcement purposes, i.e., dropping anchor on a reef displayed on a chart. If the Coral Reef Conservation Act is reauthorized, provisions of the Act could be used to justify this task.
Impact assessments: Florida participants would like to see maps to support impact assessment of boating, fishing and hurricane impacts on reefs and seagrass beds.
PHYSICAL MONITORING Chlorophyll a and optical properties monitoring: Managers agreed on the need for chlorophyll a
and related optical monitoring data collected via remote sensing, as well as the need for

FLORIDA
22
improved regional algorithms, in order to characterize water properties such as clarity, turbidity, light attenuation, photosynthetically active radiation (PAR), and to understand events such as algal blooms, sediment plumes, and discharge/runoff events. These events may influence the growth and condition of coral reefs on relatively short time scales, so automated monitoring is needed to provide information that field surveys may not capture.
Improved SST and bottom temperature data: Managers requested improved water temperature data, including data from cross-shelf gradients and eddies, in order to characterize water masses and understand warming and cooling events that may impact coral reefs. Models that correlate SST data with benthic temperatures, if possible, would provide managers with a valuable tool for predicting and responding to climate-related impacts.
Hydrodynamic models for scenario testing and hindcasting: Such models would be useful to predict and explain the impacts of poor water quality events, algal blooms, sediment plumes, discharge/runoff events, and bleaching events. Hindcasting would provide context and understanding of effects observed on the reefs following poorly monitored hydrographic events, and perhaps suggest management actions appropriate to reduce the impact of future events. Hydrodynamic model development should be coordinated between NOAA and the managers to ensure these models are relevant to management questions.
Ocean acidification monitoring: Florida managers want to use sentinel sites to monitor trends in ocean chemistry and understand the factors contributing to changes in reef condition.
BIOLOGICAL MONITORING Increased geographic and species coverage for fishery dependent and fishery independent
monitoring: Fishery dependent monitoring is needed for Dry Tortugas, for juvenile reef species in Florida Bay, and for sportfish populations in the national parks. Fishery independent monitoring is needed for the SEFCRI area, Biscayne National Park and Florida Bay. This information is needed to assess the health of the larger ecosystem and to guide management action, e.g., marine zoning. Currently, Florida has the capacity to conduct fisheries independent monitoring along the northern section of the Florida reef tract, but lacks the funding. Participants also discussed that fishery independent monitoring could be integrated into existing CREMP and SECREMP activities, which currently focus exclusively on benthic composition. It would be beneficial to use the Reef Visual Census (RVC) method along the entire reef tract in order to facilitate coordinated management.
Increasing the number of SECREMP sites: Additional sites need to be added in the overall assessment area. Currently, there are not enough sites to statistically determine any changes that are occurring in different habitat types or distinguish between ecological and human-induced impacts.
Inclusion of coral recruitment in CREMP and SECREMP: Participants emphasized the need to determine coral recruitment rates in order to analyze the coral population budget and determine larval supply or post-settlement bottlenecks. Such information would help to inform restoration strategies, e.g., to determine the appropriate size for coral relocation. Recruitment information would help determine recovery rates, which is a high priority management need for regulating impacts to reefs and evaluating groundings cases. Managers and scientists noted that plot-based methodologies would be helpful for Acropora as well.
Enhanced Acropora monitoring: Enhanced monitoring (presence/absence and fate tracking) of Acropora is needed across the Florida reef tract. This effort needs to be consistent throughout

FLORIDA
23
the region. This information would be useful in recovery planning and in determining the effectiveness of conservation actions.
Targeted monitoring: In order to understand causality between stressors and effects on reef condition, specific monitoring studies should be conducted to assess near-shore areas most impacted by coastal development and dredge and fill projects, spread of invasive species (lionfish, Tubastrea), disease monitoring and outbreak prediction throughout the region, and level of effort and impacts of recreational fishing.
NEAR-SHORE WATER QUALITY MONITORING Florida participants agreed on the following LBSP/WQ priorities to support management, but were careful to add that there are different LBSP/WQ issues across the region. For example in the SEFCRI area, degraded WQ may be caused by more local (versus regional) sources, e.g., pollutants from inlets, wastewater outfalls, seasonal upwelling, groundwater discharge, etc.; while the FKNMS water quality problems may be more associated with regional (versus local) sources, such as Gulf of Mexico advection. Additionally, the Florida participants felt that they could order these priorities by importance, as represented in descending order below. Development of tiered WQ monitoring at a higher temporal resolution for select sites: Florida
participants expressed a need to have a subset of sites throughout the reef tract with more temporally intensive monitoring capabilities, using a tiered sampling approach. This should include hourly, real-time and deployment of auto samplers. They also suggested that coupling water quality monitoring, nutrient sampling and remote sensing would provide opportunities for collaboration – for example, the ground-truthing of satellite imagery (see below). Participants also noted the opportunity to collaborate with Everglades restoration initiatives. The ability to take management action to abate water quality degradation is limited without this type of monitoring program.
Increase WQ monitoring in SEFCRI: A long-term, targeted WQ monitoring program needs to be expanded into the SEFCRI area. Only one year of quarterly water quality monitoring (a pilot-scale effort) has been funded in the SEFCRI area. The paucity of data on this issue may preclude management action.
Develop collaborations among in situ WQ monitoring and remote sensing activities: Collaboration with remote sensing (both hindcasting and nowcasting) for ground-truthing is needed in order to make large-scale observations and inform management.
Determine effects of WQ on HAB development: Florida managers need to know more about the relationship between water quality and biota to further the predictive capabilities for when Harmful Algal Blooms (HAB) are likely to occur and understand their impact on coral reef condition.
WQ metrics: Develop numeric criteria for nutrient levels in waters adjacent to coral reefs.

USVI
24
U.S. Virgin Islands CONTEXT The coral reef ecosystems of the U.S. Virgin Islands (USVI) are made up of a variety of different habitat types including coral reefs and other hardbottom areas, seagrasses, mangroves and sandy sediments. Generally, the coral reefs display fringing, patch or spur and groove growth patterns distributed around the three geologically distinct islands of the USVI (St. John, St. Thomas and St. Croix). Recent estimates put the extent of coral reef ecosystems at approximately 344 km2 at depths up to 18 m, and 2,126 km2 in depths ranging from 18-183 m (Rothenberger et al., 2008). In order to maximize the benefits of the CREIOS workshop, the USVI team began by reviewing the results from the site visit interviews, and identifying priority needs for USVI coral reef management and conservation that can be addressed via mapping, monitoring and assessment. USVI delegates recognized that the solutions to several priority needs are best approached through development of integrated and interdisciplinary solutions across the main technical groups defined for the CREIOS workshop. Thus some overlap exists between technical groups. USVI’s management priorities are:
Understanding the linkages between watershed patterns and processes and marine ecosystem health to inform planning actions and strategies that can control stressors
Understanding how material is dispersed in near-shore areas to support assessment of threats from land-based sources
Understanding ecological connectivity through dispersal of eggs and larvae to identify key sources and sinks, assess connectivity between marine protected areas (MPAs) and between spawning aggregations and juvenile habitat
Understanding more about the distribution of resources including diversity and productivity hotspots, Acropora distributions and key coral refugia to support priority setting
Identifying ecologically meaningful water quality thresholds for marine organisms including corals and seagrasses to guide strategies to protect ecosystem integrity
Evaluating the threat from contaminants in the marine environment, especially in close proximity to industrial sources of pollution to prioritize restoration activities
USVI’s top mapping and monitoring needs to support management are:
Development of coupled watershed and near-shore hydrodynamic models to quantify runoff and model the subsequent dispersion of land-based sources of pollution in the marine environment
Assessment of threats to marine ecosystem health from land-based sources including chemical contaminants and sediments through targeted sampling in priority areas
Support in the development of water quality standards that are relevant to corals, seagrasses and other marine organisms to direct water quality monitoring and regulations
Bathymetric mapping of near-shore marine environments including shallow bays to provide: 1) habitat information, 2) facilitate development of higher resolution hydrodynamic models to track the fate of material entering the sea, and 3) provide updated navigational charts to minimize vessel groundings

USVI
25
Bathymetric mapping and benthic habitat maps are needed for the extensive coral reefs and important spawning aggregation areas around the USVI to help define essential fish habitat and prioritize management actions with regard to MPA designation and fisheries management
USVI also has the following related needs:
USVI DPNR request technical support and training in processing of existing side-scan data and training in benthic habitat mapping. Additionally, USVI requests that DPNR staff be trained in the relevant hydrodynamic and ocean circulation modeling techniques so that simulations can be run and parameterized as needed.
Establishment of a community network/reporting system for gathering monitoring information.
Field support and analytical support on the biological monitoring of EEMP is requested by DPNR to support assessment of health and the ecological importance of specific zones in relation to their stated objectives.
Technical assistance for analysis of historical water quality data, analysis of DFW fishery data and GIS/mapping tasks to make better use of existing data and provide training of local staff
Support for ecosystem goods and services valuations to assist DPNR with their plans to evaluate marine ecosystems of the USVI
MAPPING Identification of biological hotspots: USVI needs to identify all biological hotspots to prioritize
protection including high diversity areas and highly productive areas such as spawning aggregations and areas with high live coral cover that may function as important refugia for corals.
Mapping presence/absence of acroporids: USVI needs to identify all areas with federally protected Acropora palmata and A. cervicornis species presence to evaluate threats and prioritize protection from human impacts.
Map resolution: USVI needs higher resolution benthic habitat maps for high priority areas including Areas of Particular Concern, offshore cays (land and sea) and national parks, and monuments. Additionally, the USVI needs high resolution bathymetry for near-shore areas to facilitate development of circulation and dispersal models that can be coupled to broader scale circulation models.
Imagery: USVI requests historical aerial photography (1940s onward) and technical support with image georeferencing to support change analysis.
Change analysis: Due to rapid coastal development and marine environmental change, USVI needs support for change detection analysis and synthesis to track changes and identify key areas with major changes in both coastal development (e.g., urban) and marine habitats (e.g., seagrasses, coral reefs).
Bathymetric data: USVI needs to fill in the gaps in bathymetry including the Virgin Passage, an area with high coral cover, the shelf edges that support important spawning aggregations, and the East End Marine Park (EEMP). Additionally, existing bathymetry needs to be integrated and processed to provide benthic habitat maps to increase their utility to resource managers.

USVI
26
Coastal vulnerability modeling/mapping: Due to the potential of sea level rise in the coming decades, analysis of affected areas under different scenarios would help inform USVI coastal planning and mitigate for hazards and threatened resources.
PRIORITY MAPPING LOCATIONS Areas of Particular Concern with high development pressure: Magen’s Bay; Mandahl Bay;
Botany Bay; Western St. Croix – Fredericksted Reef System including Sprat Hole; Sandy Point to Hovensa
Existing MPAs: EEMP, St. Croix; East End Reserve, St. Thomas Offshore cays threatened by development: Great St. James, Little St. James, Thatch Cay, Mingo
Cay, Lovango Cay, Inner Brass Cay, and Hans Lollick Important areas for coral reefs and reef fisheries: South shelf edge from Vieques to St. John;
South shelf of St. Croix; Virgin Passage Area of Interest; North shelf of St. Thomas Priority Locations For LBSP: St. Thomas East End Reserve, St. Thomas (major gut, marinas
and landfill site); Coral Bay and Fish Bay, St. John (rapid residential development); Magen’s Bay, St. Thomas (rapid residential development); Salt River, Teague Bay and Great Pond, St. Croix (residential and agricultural impact)
PHYSICAL MONITORING Current modeling for larval dispersal and connectivity: Near-shore ocean circulation models are
needed to understand the dispersal of biological and physical material from the land and to map connectivity between regions of interest such as between MPA’s. Additionally, coupled physical and biological dispersal models are needed to understand the connectivity between Buck Island Reef National Monument, EEMP and Lang Bank for groupers and snapper populations and between USVI and neighboring areas such as the British Virgin Islands. Finally, dispersal models are also needed to understand connectivity between deeper water corals and shallow water corals since deeper areas may function as important refugia.
Climate change impact analysis: An enhanced near-shore array is needed to measure key parameters related to climate change that will impact coral reef ecosystem health (i.e., temperature, acidification related parameters). Additionally, USVI needs support in compiling, synthesizing and communicating relevant information on climate change to assess the threats to the local marine environment and ecosystem services including fisheries, coastal defense, coral reef related tourism.
Climate change predictions: Climate change predictions are needed at an appropriate scale for the USVI and surrounding areas.
Resiliency: More information is needed on the linkages between climate change and the health of coral reef ecosystems, particularly on identifying spatial patterns of resiliency and identifying spatial patterns in the magnitude of threats within the USVI region.
BIOLOGICAL MONITORING Fisheries data: USVI needs support for quantifying fishing mortality (commercial and non-
commercial) and the spatial and temporal patterns of fishing effort across the USVI.

USVI
27
Protected area efficacy analysis: USVI needs to know if existing protected areas are working to enhance productivity and ecosystem functions, this is particularly important information to evaluate the efficacy of no-take areas such as National Monuments and certain zones with St. Thomas East End Reserve and St. Croix EEMP as well as other fishery closures.
Coral disease research: USVI needs to better understand the threat to coral reefs from diseases through determination of causative agents, spatial patterns of disease and links to physical and anthropogenic factors.
Bio-indicators: USVI needs support in the development and implementation of bio-indicators to assess status and trends in coral reef ecosystem health that are both practical and relevant to the USVI.
Spiny lobster monitoring: USVI seeks support for spiny lobster monitoring at EEMP and assessment of patterns of larval supply, habitat use and connectivity between EEMP and Buck Island Reef Monument on St. Croix.
Area-specific biological data: USVI needs biological monitoring data (fish, macro-invertebrates and benthic habitat) for data poor areas around St. Thomas, EEMP, south shore St. Croix and offshore cays.
Invasive species assessments: Lionfish are spreading rapidly through the region and several have been sighted on St. Croix in the past year. USVI needs support with threat assessment for invasive lionfish.
NEAR-SHORE WATER QUALITY MONITORING Causality studies: USVI needs to know more about the causal links between stressors and
ecosystem condition, particularly sedimentation, temperature, nutrient input , chemical contaminants and fishing.
Implementation of water quality standards: USVI needs support for the development and implementation of water quality standards for local coral reef ecosystems since existing standards relate primarily to human health.
Common watershed analysis metrics: USVI needs support in the development of common watershed metrics to evaluate USVI watersheds based on impervious surfaces, slope, vegetation cover, etc. to be used in planning, prioritizing restoration efforts and for optimizing monitoring activities. This could be an index of watershed integrity, but needs to integrate EPA and USGS processes/information and must be designed in conjunction with USVI DPNR.
Modeling: USVI needs to evaluate and model the delivery of stormwater, sediments and chemical pollutants in high priority areas such as close to MPAs and sensitive near-shore environments. Support for development of mitigation and restoration strategies is needed. Research to establish sediment total maximum daily loads (TMDLs) is also needed.
Contaminant analysis: USVI has never comprehensively assessed contaminants in the marine environment although some potential sources of pollution are known. USVI needs to characterize contaminants particularly in sensitive habitats in close proximity to sources of pollution and determine the threat to specific organisms (e.g., coral, fish) and to the marine ecosystem in general. In collaboration with DPNR, the development of standards, threshold levels and restoration strategies are high priorities for USVI.
Evaluation of monitoring strategies: USVI DPNR requests increased collaboration/ coordination between DPNR, NOAA and EPA to help re-evaluate water quality monitoring strategies for the USVI and communicate LBSP problem to the public.

PUERTO RICO
28
Puerto Rico CONTEXT Puerto Rico’s shallow coral reef ecosystem and associated habitats were recently estimated to encompass 500,967 ha, with coral reef and colonized hardbottom making up 15.1% of this total and seagrass habitat 12.5 % (Kendall et al. 2001). The Puerto Rico (PR) team began the workshop by reviewing the results of the Away Team Report. The team then identified priority needs for coral reef management and conservation in PR that can be addressed via mapping, monitoring, and assessment. However, because the PR team that attended the workshop was primarily composed of academics, the priorities reported during the workshop do not reflect the spectrum of priorities identified by the PR Away Team, which captured a broad spectrum of managers and scientists working in the coral reef ecosystem. For this reason, some of the priorities presented in this report were taken from the PR Away Team Report in order to reflect the perspective of the general PR management community. PR’s management priorities are:
Information on status of stocks and key species, especially fisheries independent data and fisheries dependent data that includes subsistence and recreational fishing to improve fisheries management.
The management priority should be to mange fisheries stocks to optimize catch relative to the constraint of maintaining the necessary ecological functions (e.g., herbivory) necessary to maintain healthy coral reefs
Targeted before/after studies to evaluate effectiveness of management actions. Integration of physical, chemical, and biological data at the watershed scale to better
understand causality between land based inputs, water quality, and reef condition, and effectively manage LBSP
Predict potential impacts of sea level rise to important coral reef ecosystem habitats, and conduct change analysis to quantify and predict shoreline erosion and potential changes in distribution of these habitats to guide land use management in priority areas
Characterization of resilient areas in order to focus management, with particular interest in reef-building corals such as Montastrea and Acropora
Understanding connections between shallow and mesophotic reefs in order to prioritize fisheries management actions
PR’s top mapping and monitoring needs to support management are:
Seamless mapping at higher resolution than current benthic maps from the coast to the deep areas for priority watersheds; create watershed maps that include locations of acroporid corals and ESI maps
Use mapping to link habitats to human uses and map links between habitats and important fisheries species, as well as habitats as mitigating sediment and pollutant effects on reefs, to better define management priorities and strategies
Monitor and use predictive models of sediment and contaminant delivery and dispersal at watershed scale and out to reefs

PUERTO RICO
29
Coordinate data collection between remotely sensed and in situ data to help quantify the magnitude and distribution of climate-related effects
Develop a rigorous sampling approach and monitoring methods for assessing reef fisheries PR also has the following related needs:
Improve connections between those who generate data products and those who need to apply data products for management decisions by making formats available to non-technical users and having a central repository and format for data.
Stimulate cooperation between users and generators of products and across jurisdictions, including the establishment of communication links (points-of-contact) for submission of data and data exchange.
Integrate various data layers to elucidate connections between impacts from multiple threats to reef ecosystems. As part of mapping efforts, different types of data compiled by NOAA, such as ESI maps, benthic maps, and ESA-related maps, need to be united in products available to users.
Assist PR with gaining access to hydrographic information from NOAA OCS for key port areas.
The delegation requested access to a poster presented at the workshop (T. Battista, Biogeo) showing a comprehensive picture of areas encompassed by various ongoing mapping programs in Puerto Rico.
Cruises are excellent opportunities for outreach and education and should continue to be used to educate the public and generate support for coastal mapping efforts.
Users of mapping data (bathymetric and benthic habitat maps) should increase communication and collaboration with NOAA scientists in order to ensure appropriate use of the data, e.g., backscatter information.
Better collaboration between NOAA and other Federal Agencies (EPA, NASA, etc.) is needed. NASA may have data that could be used as a proxy to calculate terrestrial runoff. EPA data is difficult to access and use, so Puerto Rico requested assistance in getting water quality data from EPA before during and after an event to better understand links between various conditions, e.g., how precipitation levels and intensity contribute to near-shore bacteria levels.
An accessible, centralized data repository and more standardized data formats is desired. Integration of various data streams within a GIS system would help illuminate connections among them. An example would be linking habitat data to SEAMAP data.
MAPPING Bathymetric Information
Hydrographic information can be used for management activities such as investigating groundings, determining the optimal locations for various coastal uses (cruise ship anchorages, submarine cables and other infrastructure, etc.).
Particular areas in need of bathymetric information include Fajardo, Vieques, and Culebra for Acropora; suspected spawning locations; shelf areas between Puerto Rico, Vieques, Culebra, and St. Thomas, USVI, and adjacent to Roosevelt Roads Naval Station; natural reserves, near shore areas, and shallow reefs in the North Coast; and fisheries closure areas.

PUERTO RICO
30
Puerto Rico would like NOAA to pursue an increased allocation of time on NOAA ships and other NOAA resources that collect bathymetric data.
The Navy (in Panama City, FL) may have LIDAR and AUV resources that would support bathymetric data collection in Puerto Rico and has previously expressed an interest in this type of work.
High-resolution bathymetric maps are needed for mesophotic reefs (to 50-70 m) to characterize the seafloor, help identify important fish spawning aggregation sites, and enable predictive modeling of the marine environment in Puerto Rico.
Benthic Habitat Information Benthic habitat information is needed for better management, such as during permit review
for development proposals. Having benthic habitat information added to the ESI maps, which are widely used in Puerto Rico, would be helpful.
Particular regions where habitat information is needed include shelf areas, fisheries closure areas and oceanic islands on the west coast as well as the extensive shelf between Puerto Rico and St Thomas, USVI, which includes shelf areas surrounding the islands of Vieques and Culebra, Puerto Rico.
Puerto Rico’s delegation prioritized filling gaps in areas that are presently classified as unknown.
Benthic habitat maps with higher spatial resolution are needed in natural reserves, in near-shore areas, at spawning aggregation sites, and in shallow habitats along the north coast.
There should be an easily-accessed online source of information to catalog where Acroporids corals are located. Identification of locations that currently support Acroporid corals is needed in order to protect them from coastal development that leads to LBSP via MPAs and during permit reviews.
An increase in the amount of ground validation conducted would increase the accuracy of NOAA’s interpretation of the backscatter signal as well as thematic accuracy of the resulting maps. PR needs maps focusing on priority areas and areas of concern that go out to the shelf edge and have a higher resolution than the current benthic maps.
PHYSICAL MONITORING Fine-scale current patterns: Need fine scale current monitoring for near-shore transport and
determining water quality and when beaches should be closed. This would include increasing in situ monitoring in specific locations as well as increasing the resolution and timeliness of satellite data so that near-real-time information on current speed and direction is available in the event of disturbances requiring rapid response such as oil spills. Additional in situ data is needed to validate the satellite data since its accuracy is less reliable near-shore. Profile modeling will be useful to relate surface modeling to the water column and benthos.
Analysis of past events and links to ecosystem condition: Hindcasting of past events could shed light on connections between storm/precipitation events and effects on near-shore areas. This could be used to justify restrictions on certain construction or land use activities during rainy periods. Hindcasting with existing data could also help explain patterns documented with respect to dispersal and recruitment among key marine species and reef fish populations.
Use of existing data: Puerto Rico requested additional training and information on how to extrapolate measurements collected at a limited number of buoys to the entire seascape. Researchers had concerns about the utility of buoy data collected in one area to describe the

PUERTO RICO
31
conditions at distant locations subject to different conditions. What can buoys tell us about the water column? If they are primarily used to measure conditions at the surface, how do those measurements relate to the rest of the water column?
Instruments/Buoys: Installation of an additional instrument(s) (i.e., ICON station) on the east coast of Puerto Rico would potentially benefit researchers working in that area, who currently use data collected at buoys located many kilometers away (La Parguera, PR or St Croix, USVI).
Additional parameters: Participants noted the need to add sensors to measure additional parameters, such as turbidity, PAR, chlorophyll, and bacteriological parameters.
BIOLOGICAL MONITORING Ecosystem monitoring: Need island-wide spatially comprehensive ecosystem-level monitoring
of fish, coral and other habitat metrics. Fish parameters should include determining growth and longevity, as well as catch/population monitoring. This will most likely be achieved through a series of partnerships. Additional targeted shallow-water coral reef monitoring needs to be directed in particular areas, especially those proposed for development. Repeating surveys originally done by Carlos Goenaga would help identify trends.
Monitoring in Natural Reserves: Monitoring at natural reserves should be continued and the frequency increased, since these sites can potentially be used as control sites in studies. Other well-monitored control sites need to be established as well. Monitoring at natural reserves should be expanded to incorporate methods for measuring coral recruitment into the study design. MPAs and other managed areas need to be evaluated to determine if current levels of protection are effective.
Identification of Resilient Reefs: The locations of resilient reef complexes need to be identified for greater protection. Montastraea reefs near Culebra and Abrir la Sierra may be more resilient than other reefs and should be investigated further and included in monitoring efforts.
Assessment of previously impacted reefs: Locations that may need greater protection include areas between Culebra and St. Thomas which have been impacted by the installation of large cables.
Acroporid corals: Long-term monitoring of robust populations of Acopora palmata should be a focus, particularly in certain areas, e.g., Vega Baja, Manati, Isabela, Tres Palmas, Gallardo, El Ron. North coast aerial surveys of Acropora palmata reefs need to be validated with in situ surveys. Identification of low-tech approaches for propagating and transplanting Acropora cervicornis and other important coral species will contribute to restoration efforts, which need to be accompanied by monitoring to determine if restored areas are regaining adequate ecosystem function.
Reef fish populations and spawning aggregations: Fishery independent data is very limited on eastern shelf areas (compared to west coast). Standard methods should be developed to allow for U.S. Caribbean-wide comparisons and integration of data collection efforts and analysis. Acoustic monitoring of particular areas can identify or confirm the locations of fish spawning aggregations for further investigation, monitoring, and management action. Acoustic monitoring needs in situ validation to confirm the abundance and species present. Determining the effects of specific gear types could help narrow manager’s focus to address specific fishing methods and allow less-destructive fishing methods to continue instead of full closure to fishing. For example, spearfishing within the Fajardo reserve is believed to have depleted grouper

PUERTO RICO
32
populations, but the effects have not been well documented. Standardized methods for fisheries monitoring are needed.
Integration of data sets: Data on coral communities need to be collected to further classify habitats. Because the composition of habitat types such as ‘colonized pavement’ varies widely, it is difficult to use the maps to predict the location of important fisheries habitats.
Mesophotic reefs: Most mesophotic reef areas (between 70-100 ft) have not been surveyed, but should be studied to determine onshore-offshore and deep-shallow links among key fish and benthic (i.e., coral) species.
Response and restoration: A rapid response assessment capability needs to be developed to document and respond to disturbance events, such as vessel groundings, oil spills, bleaching events, etc. NOAA can support this by developing a way to set aside grant funds for this type of activity. There is also a need for assessment capacity for small vessel (> 65ft) groundings as well as large vessel grounding events. New best management practices should be developed since removal of vessels often causes more damage than the initial grounding. Increasing education and outreach among boaters regarding what to do in the event of contact with the reef or seagrass beds would help.
NEAR-SHORE WATER QUALITY MONITORING All the priorities identified under LBSP have one thing in common, the need for improved education and outreach in order to ensure that management efforts are effective. PR would need to build capacity in order to strengthen its education and outreach capabilities. Watersheds: In order to target LBSP, PR needs to continue work at a watershed scale using the
JBNERR work as a model. Priority watersheds include areas within the Natural Reserve System. In particular, PR identified the watersheds associated with the following Natural Reserves as priorities: Finca Belvedere; La Cordillera Reefs and Ceiba State Forest in Fajardo; Culebra (southeastern portion); and Mayagüez Bay and Tourmaline Reefs. The Fajardo River watershed should be the next priority watershed for study because the river is about to be channelized as part of an Army Corps of Engineers flood control project. Work has begun to address impacts in the Guayanilla/Guánica watershed, which includes the Guánica State Forest and Biosphere Reserve. Overall, there is a need in PR to integrate physical, chemical, and biological data to understand and manage impacts to reefs, including through pinpointing of sources of sediments and contaminants
Best Management Practices: In PR, the evaluation of the effectiveness of BMPs is a priority. At the watershed scale, such as in JBNERR, studies have been done to set a baseline for contaminants and sediments, implement BMPs to address the levels of these constituents, and then evaluate the effectiveness of BMPs. PR needs studies pre-and post-development and implementation of BMPs in order to identify what works, where it works, and how methods can be adapted to specific sites. The only way to track effectiveness of BMPs, as well as monitor sites in general, is to increase monitoring effort to be more frequent than once per year.
WQ and biological monitoring: PR needs monitoring of water quality to include both spatial and temporal variables in order to determine changes over time and based on geographic location. As part of water quality monitoring efforts, PR needs emergency response capabilities, defined in this case to mean the ability to respond to an environmental emergency, such as a ruptured sewage outfall, in order to monitor the emergency and its effects on water quality and surrounding biota and potentially take action to reduce impacts to the marine environment.

PUERTO RICO
33
Studies of the impacts of sewage discharge on the marine environment are seriously lacking. A priority in PR is the development of water quality standards that adequately protect the health of the coral reef ecosystem, in particular corals, and that are developed using methods appropriate to the tropics. In order to strengthen coral protections, water quality monitoring needs to identify “hot spots” where problems such as fecal coliform contamination are occurring. Need interaction with regulators in order to monitor in areas where projects are proposed or permits have already been issued to study impacts of coastal development and use this information to shape future permitting actions.
Modeling: Models are useful tools for PR team in terms of being able to look at “what if” scenarios, but some may be more appropriate than others in the Caribbean or may need to be tweaked considerably to be used in PR. PR really needs models and studies that look at fate and effects of pollutant transport from the river mouth out to reefs, to include hydrodynamics, including incorporating longshore transport. This also requires high resolution images, which are not currently available, in order to support modeling efforts.
Evaluating effectiveness: Targeted before/after studies to analyze impacts of sediment and contaminant transport to reefs to evaluate effectiveness of management actions at the watershed scale in order to and improve controls on coastal development.
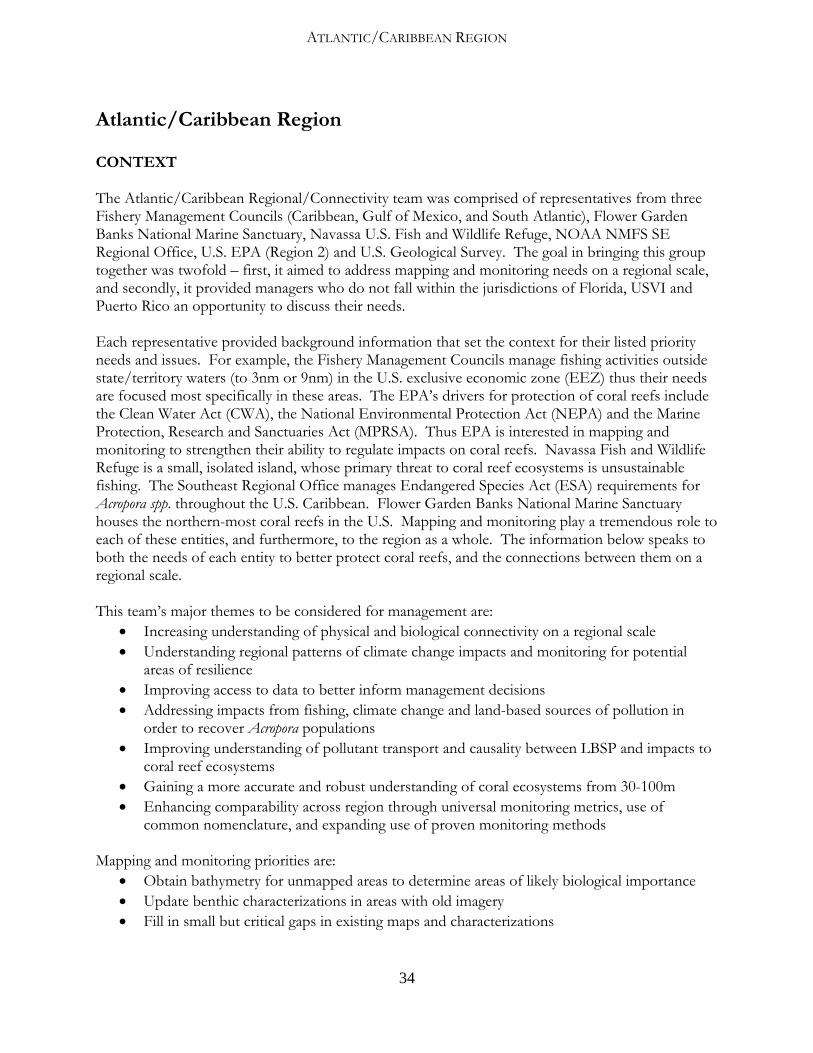
ATLANTIC/CARIBBEAN REGION
34
Atlantic/Caribbean Region CONTEXT The Atlantic/Caribbean Regional/Connectivity team was comprised of representatives from three Fishery Management Councils (Caribbean, Gulf of Mexico, and South Atlantic), Flower Garden Banks National Marine Sanctuary, Navassa U.S. Fish and Wildlife Refuge, NOAA NMFS SE Regional Office, U.S. EPA (Region 2) and U.S. Geological Survey. The goal in bringing this group together was twofold – first, it aimed to address mapping and monitoring needs on a regional scale, and secondly, it provided managers who do not fall within the jurisdictions of Florida, USVI and Puerto Rico an opportunity to discuss their needs. Each representative provided background information that set the context for their listed priority needs and issues. For example, the Fishery Management Councils manage fishing activities outside state/territory waters (to 3nm or 9nm) in the U.S. exclusive economic zone (EEZ) thus their needs are focused most specifically in these areas. The EPA’s drivers for protection of coral reefs include the Clean Water Act (CWA), the National Environmental Protection Act (NEPA) and the Marine Protection, Research and Sanctuaries Act (MPRSA). Thus EPA is interested in mapping and monitoring to strengthen their ability to regulate impacts on coral reefs. Navassa Fish and Wildlife Refuge is a small, isolated island, whose primary threat to coral reef ecosystems is unsustainable fishing. The Southeast Regional Office manages Endangered Species Act (ESA) requirements for Acropora spp. throughout the U.S. Caribbean. Flower Garden Banks National Marine Sanctuary houses the northern-most coral reefs in the U.S. Mapping and monitoring play a tremendous role to each of these entities, and furthermore, to the region as a whole. The information below speaks to both the needs of each entity to better protect coral reefs, and the connections between them on a regional scale. This team’s major themes to be considered for management are:
Increasing understanding of physical and biological connectivity on a regional scale Understanding regional patterns of climate change impacts and monitoring for potential
areas of resilience Improving access to data to better inform management decisions Addressing impacts from fishing, climate change and land-based sources of pollution in
order to recover Acropora populations Improving understanding of pollutant transport and causality between LBSP and impacts to
coral reef ecosystems Gaining a more accurate and robust understanding of coral ecosystems from 30-100m Enhancing comparability across region through universal monitoring metrics, use of
common nomenclature, and expanding use of proven monitoring methods Mapping and monitoring priorities are:
Obtain bathymetry for unmapped areas to determine areas of likely biological importance Update benthic characterizations in areas with old imagery Fill in small but critical gaps in existing maps and characterizations

ATLANTIC/CARIBBEAN REGION
35
Increase hydrodynamic modeling to understand larval source/sink dynamics of existing MPAs/reserves
Monitor water movement around reefs to understand or predict if areas with better flushing are more resilient to climate change
Expand water quality monitoring capacity and scope in all jurisdictions Conduct fish tracking and monitoring to understand habitat/life history connections Monitor MPA effectiveness of Council closed areas Utilize monitoring and research to understand connections between loss of coral cover and
changes to fish assemblages Monitor reference sites with relatively low human impacts Develop pollutant transport models that are better suited for tropical high islands Expand satellite monitoring to supplement near-shore models (chlorophyll, sediment,
salinity, etc.) Monitor habitat and biological impacts of LBSP to better understand causality Support centralized data access – e.g., maps with bathymetric datasets from multiple sources Co-locate biological, water quality, physical, chemical parameter monitoring (tied in with
maps) at priority sites Utilize standardized monitoring metrics or methods throughout the region
Related needs:
Support centralized data access. Participants found NCCOS maps of existing bathymetric datasets very useful during the workshop and requested improved mechanisms to access mapping and monitoring data, both from the CRCP and other entities working in the region.
Co-locate biological, water quality, physical, chemical parameter monitoring (tied in with maps) at priority sites. In many cases the need is not for monitoring in more places but for maximizing existing efforts. For priority sites, the need is to gather sufficient cross-disciplinary information to begin to tease out causality between specific threats and changes in coral reef condition.
Utilize standardized monitoring metrics or methods throughout the region. MAPPING Obtain bathymetry for unmapped areas to determine areas of likely biological importance:
Several areas of the region (e.g., 30-100m depths, shelf edge between Puerto Rico and St. Thomas, reefs and banks in or near FGBNMS, area between Tampa and Ft. Meyers in FL) do not currently have bathymetric data at sufficient resolution to model potential locations of reef fish spawning aggregations. This information is critical to identify priority areas for management actions. Address priority areas of the CFMC and FGBNMS in depths 30-100m and at seamounts and banks. The use of ROV/AUV technology will benefit characterization efforts in deeper habitats.
Update benthic characterizations in areas with old imagery: Existing benthic habitat characterizations in some areas are based on data over 10 years old. Updated information would support activities such as predictive models for location of threatened acroporids. Refining this knowledge would allow improved guidance for the public on areas to avoid and better support enforcement actions.

ATLANTIC/CARIBBEAN REGION
36
Fill in small but critical gaps in existing maps and characterizations: Bathymetry and habitat characterization in some areas (e.g., Buck Island Reef National Monument) are nearly complete, requiring only a few gaps to be filled to have a complete package for management purposes, including designating anchorages and other use zones, estimating damages from groundings, structuring monitoring and research activities, etc.
Additions to existing maps: Incorporating the locations of CSO (combined sewer outfalls) and industrial outfalls on benthic habitat and bathymetric layers can help identify hardbottom areas for water quality monitoring.
PHYSICAL MONITORING Increase hydrodynamic modeling to understand larval source/sink dynamics of existing
MPAs/reserves: Participants requested physical monitoring, modeling, and research at a variety of scales (long-term/short-term, near-shore/regional) to understand whether networks of MPAs are actually connected, and if so, are they effective. Efforts in this vein would inform management of current MPAs and siting of new MPAs and MPA networks. One suggestion for better understanding regional hydrodynamics was to monitor the spread of alien invasive lionfish throughout the Caribbean basin.
Monitor water movement around reefs to understand or predict if areas with better flushing are more resilient to climate change: Localized patterns of coral bleaching are often thought to be influenced by the degree of water movement around a reef. Fine-scale measurements of water flow would be used to understand if greater water movement is correlated with increased resilience to bleaching, and if so, to predict areas likely to be resilient to future events.
BIOLOGICAL MONITORING Conduct fish tracking and monitoring to understand habitat/life history connections:
Continued study and monitoring of habitat utilization by reef fish at different stages in their life cycles is necessary to identify population bottlenecks and prioritize areas for protection.
Monitor MPA effectiveness of Council closed areas: New or continued monitoring of Fishery Management Council closed areas is needed to understand the impacts of closures on fish populations and habitat and evaluate effectiveness of these management actions.
Utilize monitoring and research to understand connections between loss of coral cover and changes to fish assemblages: Some areas have experienced greater than 50% loss of coral cover within the past few years, and information about the resulting impacts on associated fish assemblages is requested.
Monitor reference sites with relatively low human impacts: Given the many threats affecting coral reef ecosystems, monitoring of reference sites with limited human impacts is needed in order to better separate impacts of LBSP climate change, fishing, or other threats. Establishing “baselines” of what the impacts of one threat look like will assist managers in prioritizing actions in areas facing multiple threats.
Acropora: Monitoring needs to integrate both targeted and opportunistic data and include demographic monitoring information.
Navassa fishery data: Initiate fisheries catch and effort monitoring for Navassa. Ecological and trophic linkages: Improve understanding of predator-prey interactions.

ATLANTIC/CARIBBEAN REGION
37
NEAR-SHORE WATER QUALITY MONITORING Develop pollutant transport models that are better suited for tropical high islands: The models
currently being used to analyze and predict pollutant transport were not developed with the particular characteristics of high islands in mind, such as rapid transport of pollutant loads to the ocean from rainfall events. A high priority of the regional group is refining existing models, including coefficients that characterize variables for island topographies.
Expand satellite monitoring to supplement near-shore models (chlorophyll, sediment, salinity, etc.): Satellite monitoring would be helpful to focus in-water monitoring efforts adjacent to reef areas, based on location and time series of upstream inputs. For instance, existing “snapshot” water quality monitoring cannot establish if local rivers (in Puerto Rico) are significant sources of land-based sources of pollution. Additionally, satellite monitoring is needed to characterize events such as Orinoco River inputs and harmful algal blooms. Continue use of satellite data to understand green-water/runoff episodes
Monitor habitat and biological impacts of LBSP to better understand causality: More work is needed to link ecosystem parameters to coral condition and inform potential management actions. For example, understanding the impacts of sediments vs. contaminated sediments would be helpful for teasing out the contribution of each in declining coral condition

NOAA CAPABILITIES
38
Section III: Summary of NOAA Capabilities and Potential Solutions NOAA scientists at the workshop shared information on NOAA capabilities and services that can address management needs of the jurisdictions for coral mapping and monitoring. NOAA panelists presented on the following topics:
Mapping Physical Monitoring Biological Monitoring Near-shore Water Quality Monitoring Data Dissemination National-level Mapping and Monitoring
Mapping The CRCP has established mapping goals to:
Provide a comprehensive suite of digital map products for U.S. coral reefs Support management and monitoring needs through mapping the spatial extent and
characterization of coral ecosystems Develop and provide a range of data products and capabilities to support coral ecosystem
management and conservation Develop advanced technologies and techniques to more efficiently map coral habitats
The CRCP funds two types of mapping efforts in coral reef areas:
Shallow-water near-shore benthic habitat mapping, which is based on visual interpretation of satellite imagery and aerial photos, which provide information about the underlying geologic structure and biological cover within different habitats in water depths from 0-30 m
Mid- and deep-water surveys, which utilize a variety of acoustic technologies and optical validation instruments, provide high-resolution bathymetry and derivative products (e.g., backscatter, slope, rugosity) in water depths between ~15-1000+ m
CRCP products meet national-level requirements while providing critical information to regional, state, and local coastal managers. Most U.S Pacific (Figure 1) and Atlantic/Caribbean (Figure 1) locations now have shallow water benthic habitat maps and moderate depth acoustic and optical maps (see Tables 1 and 2).

NOAA CAPABILITIES
39
Figure 1. U.S. Pacific jurisdictions.
Table 1. Mapping progress to date in the U.S. Pacific.
Jurisdiction Benthic Habitat Maps Bathymetric Maps
Shallow-water(<30 m)
Moderate depth(30-1000 m)
Shallow-water (<30 m)
Moderate depth(30-1000 m)
Main Hawai’ian Islands 75-100% 0-25% 75-100% 75-100% Northwestern Hawai’ian Islands 50-75% 0-25% 25-50% 25-50% American Samoa 75-100% 0-25% 25-50% 75-100% Pacific Remote Island Areas 0-25% 0-25% 0-25% 75-100% CNMI 75-100% 0-25% 50-75% 75-100% Guam 75-100% 0-25% 75-100% 75-100%

NOAA CAPABILITIES
40
Figure 2. U.S. Atlantic/Caribbean jurisdictions.
Table 2. NOAA mapping progress to date in the U.S. Atlantic/Caribbean.
Jurisdiction
Benthic Habitat Maps Bathymetric Maps Shallow-water (<30 m)
Moderate depth (30-100 m)
Shallow-water (<30 m)
Moderate depth (30-100 m)
U.S. Virgin Islands 75-100% 0-25% 25-50% 25-50% Puerto Rico 75-100% 0-25% 75-100% 0-25% Navassa Island 25-50% 0-25% 75-100% 75-100% SE Florida 75-100% 0-25% 0-25% 0-25% Florida Keys 50-75% 0-25% 0-25% 0-25% Flower Garden Banks N/A 0-25% N/A 75-100% The CRCP has identified various solutions to the needs identified by managers:
Develop a standard suite of habitat mapping schemes (GIS layers) that are seamless from the shoreline to 1000 m
Initiate iterative mapping for change analysis in targeted locations Provide training to managers on how to use products Improve information distribution to managers Develop and foster capabilities ecosystem change analysis

NOAA CAPABILITIES
41
Utilize new methods (Autonomous Underwater Vehicles, Unmanned Autonomous Systems, Bathymetric LIDAR, small boats, etc.) for better, faster, and more cost-effective mapping
Conduct mapping of unknown areas based on management priorities. Continue fine-scale remapping of targeted areas based on management needs Conduct syntheses of existing map products Increase watershed and near-shore mapping
Physical and Chemical Oceanographic Monitoring The CRCP’s physical and chemical oceanographic monitoring efforts provide information on:
Ocean acidification Spatial structure of oceanographic, physical, and chemical parameters Near-real-time environmental conditions Small- to large-scale patterns of currents and waves Nowcasting and forecasting for potentially detrimental events (e.g., coral bleaching).
The CRCP supports four sets of activities that are components of physical monitoring of coral reef environments (see Table 3):
Ship-based spatial oceanographic and near-shore surveys In situ instrumentation Satellite observations and derived products Regional physical, chemical, hydrodynamic, and ecological modeling
The CRCP has identified various solutions to the needs identified by managers:
Tailor information products to management needs Improve access and ensure timely delivery Increase spatial and temporal resolution to answer management questions Better integrate data within and across disciplines Provide automated observations where needed for management Improve detection, modeling, and prediction of climate change impacts Develop and foster hydrodynamic modeling capabilities for connectivity and LBSP Develop new instruments to address known gaps

NOAA CAPABILITIES
42
Table 3. Physical oceanographic capabilities, and their roles in monitoring key parameters.
Capability
Tools Ship-based
surveys
In situ instru-
mentation
Satellite products Modeling
Long-term environmental trends Regional comparisons Causes of ecological change Ocean acidification Coral bleaching condition nowcasting Bleaching event forecasting Sea level rise Ecological modeling Spawning event prediction Biological indicators for alien species Vessel detection and poaching Connectivity and larval transport Land-based sources of pollution Water quality data Land use changes
Biological Monitoring The CRCP has established biological monitoring goals to measure temporal and spatial variations in:
Sustainable living resources Resource habitat composition Community and ecosystem condition Biological diversity Species of concern
There are five components to CRCP biological monitoring in the Pacific region:
Towed-diver observations Site-based rapid ecological assessments (REAs) Specimen collection for further biological analysis (e.g., life histories, stock assessment,
histology, species/biodiversity confirmation) In situ instrumentation Grant-supported biological monitoring conducted by local partner agencies
There are five components to CRCP biological monitoring in the Atlantic/Caribbean region:
Ecosystem-based assessments of habitats and living marine resources Reef fish surveys, stock assessments, and spawning aggregation monitoring

NOAA CAPABILITIES
43
Acropora monitoring in support of Endangered Species Act (ESA) requirements Mesophotic and deep reefs monitoring Grant-supported biological monitoring conducted by local partner agencies
There are a variety of applications of biological monitoring data for managers:
Baseline resource characterization Regional comparisons of ecosystems Understanding unexpected phenomena Responding to environmental and anthropogenic disturbances Defining and evaluating MPAs Assessing impacts of specific threats, i.e., pollution, overfishing, and fishing-related habitat
impacts
The CRCP has identified various solutions to the needs identified by managers: Improve monitoring reports to meet managers’ needs Increase spatial and temporal resolution to answer management questions Improve detection, modeling, and prediction of biological perturbations, including disease
outbreaks, invasive species, and community shifts Develop and foster hydrodynamic modeling capabilities that will contribute to our
understanding of connectivity factors among locations
Near-shore Water Quality Monitoring The CRCP has four core capabilities related to LBSP:
Monitoring and assessment of marine waters, sediments, etc. Ocean remote sensing Watershed modeling, assessment and planning Review, mitigation, and restoration
There are a variety of applications of water quality and LBSP monitoring data for managers:
Assessing environmental contamination, toxicity, and coral community condition Assessing coral disease and linkages with natural and anthropogenic impacts Evaluating the effectiveness of Best Management Practices (BMPs) Prioritizing areas for conservation Modeling nonpoint source pollution and erosion rates
The CRCP has identified various solutions to the needs identified by managers:
Increase spatial and temporal resolution for water quality data Develop and foster hydrodynamic modeling capabilities for LBSP

NOAA CAPABILITIES
44
Data Dissemination The CRCP has five core capabilities related to data dissemination:
The Coral Reef Information System (CoRIS) web portal includes searchable library catalog, metadata describing CRCP activities, datasets, and information products
Peer-reviewed publications and NOAA Technical Reports and Memos Web sites, web mapping services, online database applications Maps and databases available in hard copy and by CD/DVD Technology transfer trainings
CRCP data are available in a variety of formats to meet different user community needs. Custom datasets and formats can be created and made available upon request. CRCP also develops and provides software tools for data visualization and analysis. CRCP projects provide environmental data and information products which continue to be archived at appropriate NOAA National Data Centers to ensure long-term access.
The CRCP has identified various solutions to the needs identified by managers:
Improve data access and delivery mechanisms Improve integration of data sets Provide technology transfer training and capacity building for data manipulation Provide an annual list of proposed and funded CRCP projects by geographic region Support data recovery projects to ensure preservation of data from historical studies Promote the use of common data standards to allow for data interoperability between
similar data collection efforts in a region Develop a catalog of NOAA software tools, models and services
National-level Mapping and Monitoring The CRCP derives its mandates and responsibilities from the Coral Reef Conservation Act of 2000 (CRCA), including the following goals:
To preserve coral reef ecosystems To promote wise use and sustainable management To develop sound scientific information on the condition of ecosystems and the threats To assist preservation of coral reefs by supporting conservation programs To provide financial resources for programs and projects
The CRCP has national-level responsibilities to:
Administer the national program and grant programs Be responsive to Congress and NOAA leadership Partnership development National outreach, communications and education International program development

NOAA CAPABILITIES
45
Be able to answer the question “How are the reefs doing?” via basin-wide monitoring, mapping, assessment and data analysis
Assess efficacy of MPAs In an ideal world, the CRCP could support a national program to map, assess, monitor, understand, effectively manage, and conserve all U.S. coral reef ecosystems, which would answer the following questions:
Where are the reefs? (mapping) What are the reef resources there? (assessment) How are the reef resources changing over time? (monitoring) Why are the reef resources changing over time? (environmental and human dimension
monitoring) There are many benefits of having a national-level program:
Achieve a greater economy of scale for activities – federal investment in research vessels, satellites, data collection instruments
Promote consistency in data collection, analysis and dissemination Demonstrate status and trends in coral reef ecosystems across wide geographic range Compare changes across jurisdictions Increase the ability to forecast ecosystem-scale events (e.g., bleaching) Engage the general public, Congress and international partners in coral reef conservation
efforts.

CONCLUSION
46
Section IV: Conclusion The CRCP hosted this pair of workshops as an integral component of the process to realign the program with the direction outlined in the Roadmap for the Future, the CRCP’s response to recommendations made following an external review of the program in 2007. In an extensive self-assessment completed as a precursor to the external review, the CRCP analyzed the balance of its investments in a number of ways. Over the first seven years of the program, the CRCP spent nearly half of its budget on mapping, monitoring, assessment, and data management. The proportion of funding going to these activities has not significantly changed in the three years since the self-assessment was completed. The external review panel, composed of a diverse group of esteemed coral reef scientists and managers, deemed this level of expenditure completely appropriate given the state of knowledge of U.S. coral reef ecosystems at the time of the program’s inception. The panel praised the advancements in understanding of coral reefs that have been made as a result of CRCP-funded activities, and lauded the science that has been produced. However, a core recommendation of the panel is that the program shift from one focused primarily on assessment and monitoring of coral reefs to one that actively attempts to conserve the systems by reducing major threats. This recommendation was accepted by the CRCP’s Program Manager and Senior Management Council, and is at the core of the new direction outlined in the Roadmap for the Future. In order to implement this recommendation, the CRCP must, absent a significant increase in Congressional appropriations, decrease the proportion of funding devoted to mapping, monitoring, and assessment and shift these resources to activities that reduce threats to coral reef ecosystems. In so doing, the CRCP wishes to ensure the remaining portfolio of mapping, monitoring, and assessment activities meet the most critical national and local needs. The program is undertaking simultaneous top-down and bottom-up approaches to identify these critical needs and strategies to address the needs. The CRCP has identified three activities in the Roadmap that will, when complete, serve as the foundation for our continuing CREIOS investments:
1) this pair of workshops to specifically elicit local or site-based needs for mapping, monitoring, and assessment information and products;
2) the jurisdictional management priority-setting processes being conducted by CRCP consultants (which will be informed by the results of these workshops); and
3) an external consultant’s review of and recommendations for the national program’s mapping, monitoring, and assessment activities.
The workshops and the jurisdictional priority-setting processes represent the bottom-up approach. These efforts are designed to enable management needs to be articulated to the CRCP in a structured, comparative manner. The information gathered at these workshops will help inform the CRCP about the most effective ways to build capacity and provide support for successful and productive partnerships to meet mapping and monitoring needs. The CREIOS Workshops Report will be used by the CRCP in examining its portfolio of mapping, monitoring, and assessment activities, and be used as a preamble to the identification of priorities and the capacity assessments for each location. In reality, the outcomes of these workshops should directly feed into the jurisdictional priority setting processes, and the mapping, monitoring, and assessment needs from the workshops should be prioritized along with the other types of management needs. Because of the importance, significant funding, and technical nature of CREIOS activities, the CRCP determined it was best to

CONCLUSION
47
conduct dedicated workshops to these topics instead of allowing them to be dealt with solely by the consultants assisting with the jurisdictional priority setting processes. The top-down approach will determine the information and products necessary for the national program to generate. To date, the CRCP has not articulated the supra-jurisdictional questions it seeks to answer with national CREIOS activities. The program has contracted with Dr. John Boreman to complete an assessment of the CRCP’s existing mapping, monitoring, and assessment activities from the national perspective and make recommendations on the future of CREIOS activities. The CRCP will then 1) articulate the purposes of mapping, monitoring, and assessment actions that transcend individual management needs, 2) identify the spatial and temporal scale and scope of those activities, and 3) align to the extent practicable actions to address these nationally-relevant questions with actions undertaken in response to local management needs. These simultaneous activities will increase transparency in CRCP decision-making processes and ensure that the highest priority management needs for mapping, monitoring, and assessment information and products are addressed. Specific monitoring and mapping needs developed by each management entity will be critical for the CRCP to evaluate its mapping and monitoring activities. This information will guide the balancing of location-specific monitoring programs that are designed to address managers' data needs with CRCP’s national program needs, while taking advantage of existing monitoring expertise. Potential reallocation of monitoring efforts may redistribute responsibilities among agencies (i.e., via CRCP monitoring grants), NOAA service providers, and other relevant entities, but will ensure, to the extent practical, that monitoring efforts at all levels are aligned and working toward meeting coordinated management objectives. The purposes of the workshops were to 1) identify mapping and monitoring needs to address management needs for coral reef conservation and 2) identify possible products and solutions to meet these management needs. The CRCP believes the workshops were successful in achieving these objectives. Specifically, the workshops were successful in eliciting priority information needs from managers, and highlighted important issues of concern, including the need for:
increased technical capacity; improved information and data dissemination; improved communication of scientific information to non-scientific audiences; and increased emphasis on mapping, monitoring, and assessing resources at finer scales in
specific areas of importance to managers.
The CRCP clearly heard that there was much that can be done to increase the efficiency and effectiveness of its mapping, monitoring, and assessment activities. As articulated in the Roadmap for the Future, the CRCP’s primary objective is to meet strategic management needs. The information collected during these workshops, coupled with the jurisdictional priority setting process reports, will be used by the CRCP in striking the appropriate balance between answering nationally-important questions and fulfilling managers’ specific needs. It should also be recognized that the CRCP does not have the financial or human resources necessary to address all of the needs articulated during these workshops, and many of those needs fall outside the scope of the NOAA CRCP. While the CRCP will not be able to address everything that was raised, we are committed to working with other NOAA programs and other Federal agencies to bring their expertise and resources to bear on coral reef managers’ needs.

CONCLUSION
48
This will be a blank page to print correctly. Blank Page Blank Page Blank Page

APPENDIX A – PACIFIC WORKSHOP AGENDA
A-1
Appendix A: Pacific Workshop Agenda
NOAA Pacific CREIOS Workshop Honolulu, Hawai’i
November 18-20, 2008 Purpose of Workshop
Gather input to guide the future direction of mapping and monitoring activities of NOAA’s Coral Reef Conservation Program.
Workshop Objectives
1) Identify mapping and monitoring needs to address management for coral reef conservation
2) Identify possible products and solutions to meet management needs 3) Gather input on national mapping and monitoring needs
Weekly schedule at-a-glance
Monday November 17
Tuesday November 18
Wednesday November 19
Thursday November 20
Travel
8:00 - 12:25 Registration Welcome remarks from
Kacky Andrews Breakout groups: defining
needs Jurisdictional panel
presentations & discussion
8:30 - 12:10 NOAA technical panel
presentations & discussion
Breakout groups: potential
products and solutions
9:00 - 12:00 NOAA’s National Program presentation & Town Hall discussion Closing remarks from
Kacky Andrews
12:25 Lunch (on your own)
12:10 Lunch (on your own)
Travel
1:25 - 5:35 Jurisdictional panel
presentations & discussion
Breakout groups: refining
needs
1:10 - 5:35Breakout groups: potential
products and solutions Breakout groups: refining
solutions
Monday Evening - Social Event

APPENDIX A – PACIFIC WORKSHOP AGENDA
A-2
Day 1 - Tuesday, November 18 - Agenda 8:30 – 12:25 Morning Session Registration and Coffee
Welcome (Kacky Andrews)
Workshop Objectives, Expectations, and Introductions
Breakout Groups: Defining Needs Objective: Jurisdictions develop primary topics to focus discussion on. Participants from the 4 jurisdictions (CNMI, Guam, American Samoa, and Hawai’i) will break into groups by jurisdiction with a facilitator to discuss mapping and monitoring needs with respect to management issues and actions.
Panel Presentation and Discussion: Jurisdictional Mapping and Monitoring Needs to Address Management Efforts Objective: Share and clarify management needs from jurisdictions. Each jurisdiction will present their mapping and monitoring needs, followed by a facilitated panel discussion. Each panel will have 60 minutes, as follows:
(15 minutes) - Presentation of mapping and monitoring needs. (10 minutes) - Additional comments from the panel (30 minutes) - Discussion - questions and answers from audience.
10:15am Guam, 11:25am CNMI, 1:25pm American Samoa, 2:35pm Hawai’i
12:25 - 1:25 Lunch (on your own) 1:35 – 5:35 Afternoon Session Panel Presentation and Discussion: Jurisdictional Mapping and Monitoring Needs to
Address Management Efforts Breakout Groups: Refining Needs
Objective: Identify additional needs based on presentations from other jurisdictions and revisit primary topics. Participants will break into groups by jurisdiction with a facilitator to discuss the outcomes from the panel presentations and discussions.
Report Outs from Breakout Groups
Objective: Share refined information from break out groups with all participants. (15 minutes per group) - A representative from each group will present the results of the breakouts.
Wrap Up of Day 1
Evening (on your own)

APPENDIX A – PACIFIC WORKSHOP AGENDA
A-3
Day 2 - Wednesday, November 19 - Agenda 8:30 – 12:10 Morning Session Review Day 1 Outcomes and Objectives for Day 2 Panel Presentations and Discussions: NOAA’s Solutions to Address Management
Efforts Objective: Share information on NOAA’s capabilities and services, and clarify product and information needs from participants. NOAA experts in 4 areas of technical expertise (mapping, physical monitoring, biological monitoring, and water quality monitoring) will present NOAA’s capabilities and services, followed by a facilitated panel discussion. Each panel will have 30 minutes, as follows:
(20 minutes) - Presentation of current products and potential solutions. (10 minutes) - Discussion - questions and answers from audience.
9:00am Mapping, 9:30am Physical, 10:00am Biological, 10:45am Water Quality
Rotating Breakouts by Jurisdiction/Technical area: Brainstorming Potential Products and Solutions Objective: Jurisdictions and NOAA experts brainstorm and have dialogue about specific products and services needed to address management needs. Each jurisdiction will break out with each NOAA technical panel and a facilitator to discuss potential products and solutions.
12:10 - 1:10 Lunch (on your own) 1:35 – 5:35 Afternoon Session Rotating Breakouts by Jurisdiction/Technical area: Brainstorming Potential Products
and Solutions Breakout Groups: Refining Solutions
Objective: Identify primary products and solutions based on NOAA presentations and breakout group discussions. Participants will break into groups by jurisdiction with a facilitator to discuss the outcomes from the panel presentations and discussions.
Report Outs from Breakout Groups
Objective: Share refined information from break out groups with all participants. (15 minutes per group) - A representative from each group will present the results of the breakouts.
Wrap Up of Day 2
Evening - Social Event

APPENDIX A – PACIFIC WORKSHOP AGENDA
A-4
Day 3 - Thursday, November 20 - Agenda 9:00 – 12:00 Morning Session Review Day 2 Outcomes and Objectives for Day 3 “Town Hall” Presentation and Discussion: NOAA’s National-Scale Mapping and
Monitoring Goals, Needs, and Activities (Kacky Andrews) Objective: Gather input on national-level mapping and monitoring needs. A facilitated forum for comment on and discussion of NOAA’s national program for mapping and monitoring in U.S. coral reef areas.
Wrap Up Next Steps (Kacky Andrews)
12:00 Adjourn

APPENDIX B – ATLANTIC WORKSHOP AGENDA
B-1
Appendix B: Atlantic/Caribbean Workshop Agenda
NOAA Atlantic CREIOS Workshop San Juan, Puerto Rico
May 13-14, 2009 Purpose of Workshop
Gather input to guide the future direction of mapping and monitoring activities of NOAA’s Coral Reef Conservation Program.
Workshop Objectives
1) Identify mapping and monitoring needs to address management for coral reef conservation
2) Identify possible products and solutions to meet management needs Weekly schedule at-a-glance
Monday May 12
Tuesday May 13
8:00 – 5:30
Wednesday May 14
8:30 – 5:30
Travel
Registration Welcome & Objectives CRCP National Program Jurisdictional presentations & discussion
Convene NOAA technical panel presentations & discussion Rotating breakout groups: potential products and solutions
Lunch (on your own)
Lunch (on your own)
Jurisdictional presentations & discussion Breakout groups: refining needs
Rotating breakout groups: potential products and solutions Breakout groups: refining products

APPENDIX B – ATLANTIC WORKSHOP AGENDA
B-2
Day 1 – Wednesday, May 13 - Agenda 7:45 – 12:40 Morning Session
Registration and greeting (7:45-8:10)
Welcome and Presentation on NOAA CRCP and National Program (Kacky Andrews)
Introductions and Workshop Overview
Breakout Groups: Refining Presentations and Discussion Topics Participants from the 4 breakout groups (USVI, Puerto Rico, Florida, and the Regional Group) will break into groups by jurisdiction to finalize their presentation and discuss mapping and monitoring needs.
Panel Presentation and Discussion: Jurisdictional Mapping and Monitoring Needs to Address Management Efforts Objective: Share and clarify management needs from jurisdictions. Each jurisdiction will present their mapping and monitoring needs, followed by a facilitated panel discussion. Each panel will have 60 minutes, as follows:
(15 minutes) - Presentation of mapping and monitoring needs. (10 minutes) - Additional comments from the panel (30 minutes) - Discussion - questions and answers from audience. (5 minutes) - Wrap up - final comments from the panel.
12:40 - 1:40 Lunch (on your own) 1:40 – 4:30 Afternoon Session
Continue Panel Presentations and Discussions: Jurisdictional Mapping and Monitoring Needs to Address Management Efforts
Wrap Up of Day 1
Breakout Groups: Refining Needs (optional) Objective: Identify additional needs based on presentations from other jurisdictions and revisit primary topics.

APPENDIX B – ATLANTIC WORKSHOP AGENDA
B-3
Day 2 – Thursday May 14 - Agenda 7:45 – 12:40 Morning Session
Review Day 1 Outcomes and Objectives for Day 2
Review of NOAA’s Existing Capabilities for Mapping and Monitoring: NOAA Presentations by Area of Technical Expertise Objective: Share information on NOAA’s capabilities and services, and clarify product and information needs from participants. NOAA experts in 5 areas of technical expertise (mapping, physical monitoring, biological monitoring, land based sources of pollution, and data dissemination) will present NOAA’s capabilities and services. Each panel will have 20 minutes for their presentation and question and answer session.
Rotating Breakouts by Jurisdiction/Technical Area: Brainstorming Potential Products and Solutions Objective: Jurisdictions and NOAA experts brainstorm and have dialogue about specific products and services needed to address management needs. Each jurisdiction will break out with each NOAA technical panel and a facilitator on a rotating basis to discuss potential products and solutions.
12:40- 1:25 Lunch (catered in room) 1:25 – 5:30 Afternoon Session
Continue Rotating Breakouts by Jurisdiction/Technical Area: Brainstorming Potential Products and Solutions
Breakout Groups: Refining Solutions Objective: Identify primary products and solutions based on NOAA presentations and breakout group discussions. Participants will break into groups by jurisdiction with a facilitator to discuss the outcomes from the panel presentations and discussions.
Report Outs from Breakout Groups Objective: Share refined information from break out groups with all participants.
(10 minutes per group) - A representative from each group will present the results of the breakouts.
Closing Remarks and Next Steps (Kacky Andrews)
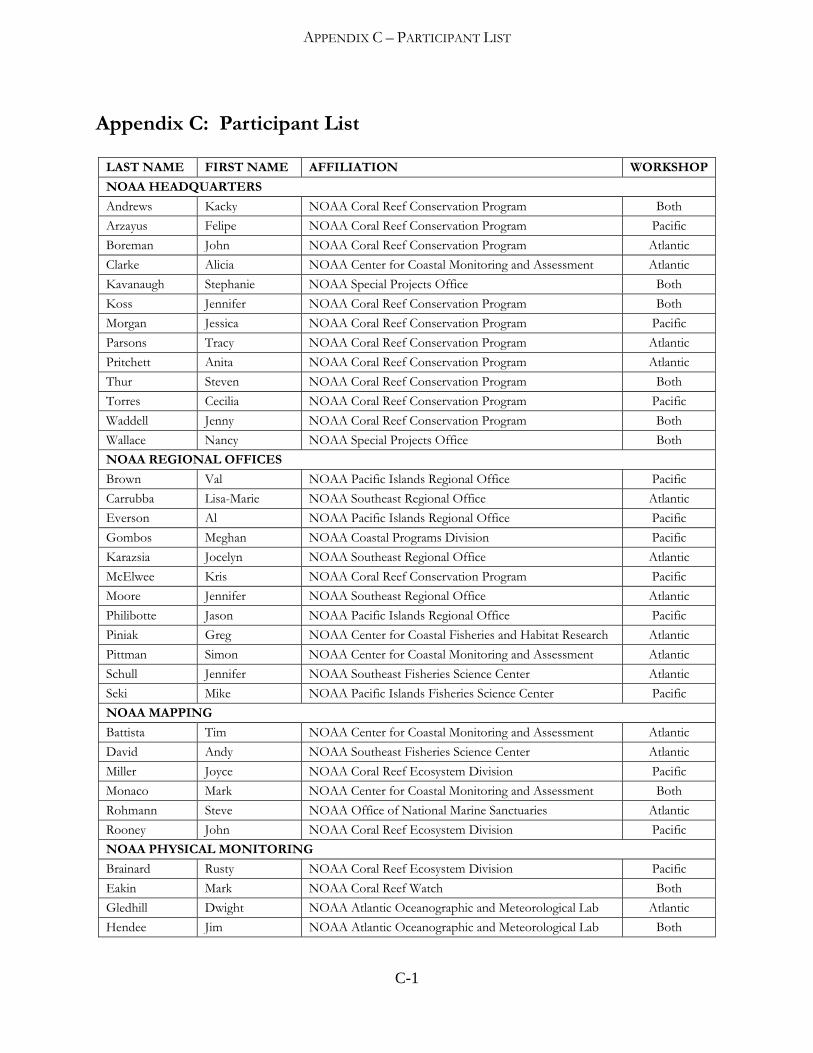
APPENDIX C – PARTICIPANT LIST
C-1
Appendix C: Participant List
LAST NAME FIRST NAME AFFILIATION WORKSHOP
NOAA HEADQUARTERS
Andrews Kacky NOAA Coral Reef Conservation Program Both
Arzayus Felipe NOAA Coral Reef Conservation Program Pacific
Boreman John NOAA Coral Reef Conservation Program Atlantic
Clarke Alicia NOAA Center for Coastal Monitoring and Assessment Atlantic
Kavanaugh Stephanie NOAA Special Projects Office Both
Koss Jennifer NOAA Coral Reef Conservation Program Both
Morgan Jessica NOAA Coral Reef Conservation Program Pacific
Parsons Tracy NOAA Coral Reef Conservation Program Atlantic
Pritchett Anita NOAA Coral Reef Conservation Program Atlantic
Thur Steven NOAA Coral Reef Conservation Program Both
Torres Cecilia NOAA Coral Reef Conservation Program Pacific
Waddell Jenny NOAA Coral Reef Conservation Program Both
Wallace Nancy NOAA Special Projects Office Both
NOAA REGIONAL OFFICES
Brown Val NOAA Pacific Islands Regional Office Pacific
Carrubba Lisa-Marie NOAA Southeast Regional Office Atlantic
Everson Al NOAA Pacific Islands Regional Office Pacific
Gombos Meghan NOAA Coastal Programs Division Pacific
Karazsia Jocelyn NOAA Southeast Regional Office Atlantic
McElwee Kris NOAA Coral Reef Conservation Program Pacific
Moore Jennifer NOAA Southeast Regional Office Atlantic
Philibotte Jason NOAA Pacific Islands Regional Office Pacific
Piniak Greg NOAA Center for Coastal Fisheries and Habitat Research Atlantic
Pittman Simon NOAA Center for Coastal Monitoring and Assessment Atlantic
Schull Jennifer NOAA Southeast Fisheries Science Center Atlantic
Seki Mike NOAA Pacific Islands Fisheries Science Center Pacific
NOAA MAPPING
Battista Tim NOAA Center for Coastal Monitoring and Assessment Atlantic
David Andy NOAA Southeast Fisheries Science Center Atlantic
Miller Joyce NOAA Coral Reef Ecosystem Division Pacific
Monaco Mark NOAA Center for Coastal Monitoring and Assessment Both
Rohmann Steve NOAA Office of National Marine Sanctuaries Atlantic
Rooney John NOAA Coral Reef Ecosystem Division Pacific
NOAA PHYSICAL MONITORING
Brainard Rusty NOAA Coral Reef Ecosystem Division Pacific
Eakin Mark NOAA Coral Reef Watch Both
Gledhill Dwight NOAA Atlantic Oceanographic and Meteorological Lab Atlantic
Hendee Jim NOAA Atlantic Oceanographic and Meteorological Lab Both

APPENDIX C – PARTICIPANT LIST
C-2
LAST NAME FIRST NAME AFFILIATION WORKSHOP
NOAA BIOLOGICAL MONITORING
Bohnsack Jim NOAA Southeast Fisheries Science Center Both
Caldow Chris NOAA Center for Coastal Monitoring and Assessment Both
Hill Ron NOAA Southeast Fisheries Science Center Atlantic
Kenyon Jean NOAA Coral Reef Ecosystem Division Pacific
Manzello Derek NOAA Atlantic Oceanographic and Meteorological Lab Atlantic
Miller Margaret NOAA Southeast Fisheries Science Center Atlantic
Schroeder Bob NOAA Coral Reef Ecosystem Division Pacific
NOAA WATER QUALITY / LBSP
Chaston Kathy NOAA Coastal Programs Division Pacific
Christensen John NOAA Center for Coastal Monitoring and Assessment Pacific
Davis Gerry NOAA Pacific Islands Regional Office Pacific
Griffin Sean NOAA Habitat Restoration Division Atlantic
Pait Tony NOAA Center for Coastal Monitoring and Assessment Atlantic
Vargas-Angel Bernardo NOAA Coral Reef Ecosystem Division Pacific
NOAA DATA DISSEMINATION
Newlin Michele NOAA Coral Reef Information System Pacific
O’Connor Sarah NOAA Coral Reef Information System Atlantic
AMERICAN SAMOA
Brighouse Gene NOAA Fagatele Bay National Marine Sanctuary Pacific
Brown Paul National Park Service - American Samoa Pacific
Carroll Ben AS Department of Marine and Wildlife Resources Pacific
Fenner Doug AS Department of Marine and Wildlife Resources Pacific
Goldberg Jeremy AS Department of Commerce Pacific
Peau Lelei AS Department of Commerce Pacific
COMMONWEALTH OF THE NORTHERN MARIANA ISLANDS
Castro Fran CNMI Division of Environmental Quality Pacific
Houk Peter CNMI Division of Environmental Quality Pacific
Starmer John CNMI Coastal Resources Management Office Pacific
Trianni Michael CNMI Division of Fish and Wildlife Pacific
GUAM
Burdick Dave Guam Coastal Management Program Pacific
Cruz Jesse Guam Environmental Protection Agency Pacific
Gutierrez Jay Guam Division of Aquatic and Wildlife Resources Pacific
Lujan Vange Guam Coastal Management Program Pacific
HAWAI’I
Brown Eric National Park Service - Hawai’i Pacific
Clark Athline Papahānaumokuākea Marine National Monument Pacific
Hamnett Mike University of Hawai’i Pacific
Jokiel Paul Hawai’i Institute of Marine Biology Pacific
Kosaki Randy Papahānaumokuākea Marine National Monument Pacific
MacGowan Petra Hawai’i Division of Aquatic Resources Pacific
Nishimoto Robert Hawai’i Division of Aquatic Resources Pacific
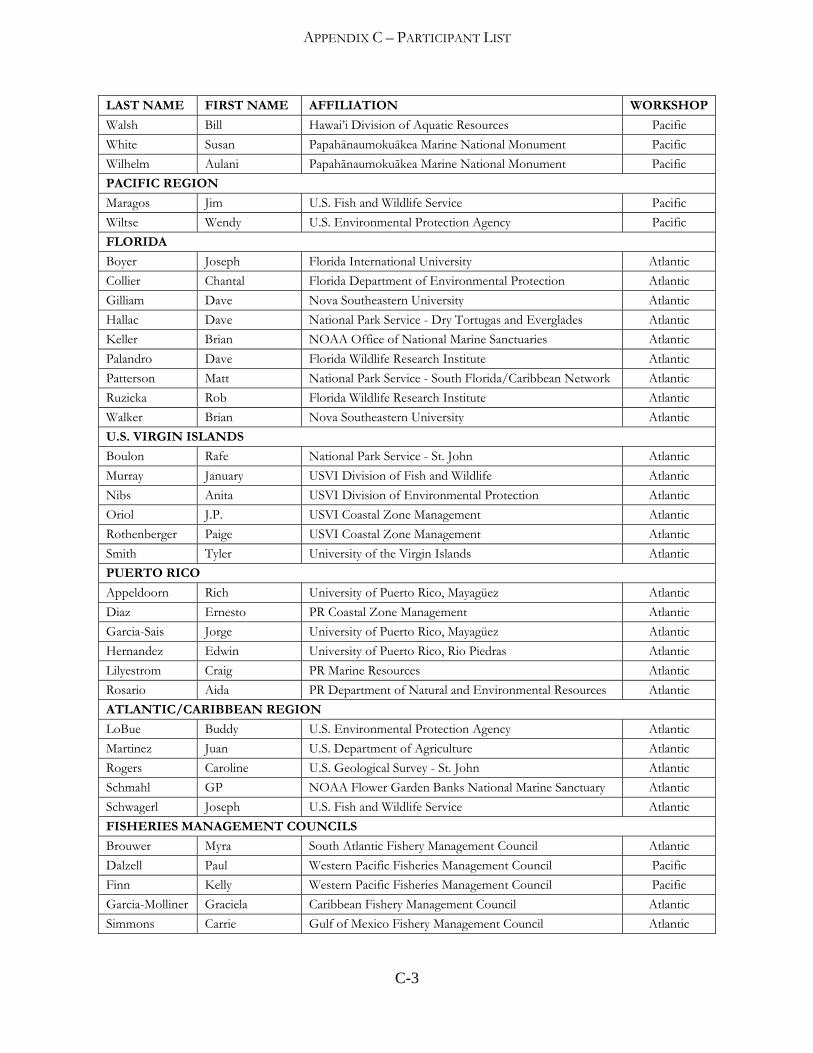
APPENDIX C – PARTICIPANT LIST
C-3
LAST NAME FIRST NAME AFFILIATION WORKSHOP
Walsh Bill Hawai’i Division of Aquatic Resources Pacific
White Susan Papahānaumokuākea Marine National Monument Pacific
Wilhelm Aulani Papahānaumokuākea Marine National Monument Pacific
PACIFIC REGION
Maragos Jim U.S. Fish and Wildlife Service Pacific
Wiltse Wendy U.S. Environmental Protection Agency Pacific
FLORIDA
Boyer Joseph Florida International University Atlantic
Collier Chantal Florida Department of Environmental Protection Atlantic
Gilliam Dave Nova Southeastern University Atlantic
Hallac Dave National Park Service - Dry Tortugas and Everglades Atlantic
Keller Brian NOAA Office of National Marine Sanctuaries Atlantic
Palandro Dave Florida Wildlife Research Institute Atlantic
Patterson Matt National Park Service - South Florida/Caribbean Network Atlantic
Ruzicka Rob Florida Wildlife Research Institute Atlantic
Walker Brian Nova Southeastern University Atlantic
U.S. VIRGIN ISLANDS
Boulon Rafe National Park Service - St. John Atlantic
Murray January USVI Division of Fish and Wildlife Atlantic
Nibs Anita USVI Division of Environmental Protection Atlantic
Oriol J.P. USVI Coastal Zone Management Atlantic
Rothenberger Paige USVI Coastal Zone Management Atlantic
Smith Tyler University of the Virgin Islands Atlantic
PUERTO RICO
Appeldoorn Rich University of Puerto Rico, Mayagüez Atlantic
Diaz Ernesto PR Coastal Zone Management Atlantic
Garcia-Sais Jorge University of Puerto Rico, Mayagüez Atlantic
Hernandez Edwin University of Puerto Rico, Rio Piedras Atlantic
Lilyestrom Craig PR Marine Resources Atlantic
Rosario Aida PR Department of Natural and Environmental Resources Atlantic
ATLANTIC/CARIBBEAN REGION
LoBue Buddy U.S. Environmental Protection Agency Atlantic
Martinez Juan U.S. Department of Agriculture Atlantic
Rogers Caroline U.S. Geological Survey - St. John Atlantic
Schmahl GP NOAA Flower Garden Banks National Marine Sanctuary Atlantic
Schwagerl Joseph U.S. Fish and Wildlife Service Atlantic
FISHERIES MANAGEMENT COUNCILS
Brouwer Myra South Atlantic Fishery Management Council Atlantic
Dalzell Paul Western Pacific Fisheries Management Council Pacific
Finn Kelly Western Pacific Fisheries Management Council Pacific
Garcia-Molliner Graciela Caribbean Fishery Management Council Atlantic
Simmons Carrie Gulf of Mexico Fishery Management Council Atlantic

APPENDIX D – PRESENTATIONS
D-1
Appendix D: Workshop Presentations The following presentations made during the workshop can be found on the web at http://coralreef.noaa.gov/aboutcrcp/strategy/reprioritization/creios/
Mapping and Monitoring Needs American Samoa Commonwealth of the Northern Mariana Islands Guam Hawai’i Florida U.S. Virgin Islands Puerto Rico Regional/Connectivity Team
NOAA’s capabilities (Pacific Workshop) Mapping Physical and Chemical Oceanographic Monitoring Biological Monitoring Water Quality and Land Based Sources of Pollution CRCP National Mapping and Monitoring Program
NOAA’s capabilities (Atlantic Workshop) Mapping Physical and Chemical Oceanographic Monitoring Biological Monitoring Water Quality and Land Based Sources of Pollution Data Dissemination CRCP National Mapping and Monitoring Program

APPENDIX E – REFERENCES
E-1
Appendix E: References Cited Johns, G. M., Leeworthy, V. R., Bell, F.W. & Bonn, M. A. (2001) Socioeconomic Study of Reefs in Southeast Florida. Final Report. Hazen and Sawyer Environmental Engineers & Scientists Johns, G. M., Milon, J. W. & Sayers D. (2004) Socioeconomic Study of Reefs in Martin County, FL. Final Report. Hazen and Sawyer Environmental Engineers & Scientists Kendall, M.S., C.R. Kruer, K.R. Buja, J.D. Christensten, M. Finkbeiner, and M.E. Monaco. 2001. NOAA Technical Memorandum NOS NCCOS CCMA 152. Methods Used to Map the Benthic Habitats of Puerto Rico and the U.S. Virgin Islands. NOAA, Silver Spring, MD. NOAA. 2002. The State of Coral Reef Ecosystems of the United States and Pacific Freely Associated States. URL: http://www.nccos.noaa.gov/documents/status_coralreef.pdf NOAA Coral Reef Conservation Program (2008). Roadmap for the Future: A Plan for Developing CRCP Direction Through 2015, NOAA, Silver Spring, MD, 15 p. NOAA Coral Reef Conservation Program (2009). NOAA Coral Reef Conservation Program Goals & Objectives 2010-2015, Silver Spring, MD, 40 p. NOAA Coral Reef Conservation Program (2009). NOAA Coral Reef Conservation Program International Strategy 2010-2015, NOAA, Silver Spring, MD, 20 p. Porter, J.W., K.G. Porter (eds). 2002. The Everglades, Florida Bay, and Coral Reefs of the Florida Keys, An Ecosystem Sourcebook. CRC Press, Boca Raton, FL. 1000 pp. Rohmann, S. O. J. J. Hayes, R. C. Newhall, M. E. Monaco, R. W. Grigg (2005). The area of potential shallow-water tropical and subtropical coral ecosystems in the United States, Coral Reefs, 24: 370–383 Rothenberger, P., J. Blondeau, C. Cox, S. Curtis, W. Fisher, V. Garriso, z. Hillis-Starr, C. Jeffrey, E. Kadison, I. Lundgren, W. Miller, E. Muller, R. Nemeth, S. Patterson, C. Rogers, T. Smith, A. Spitzack, M. Taylor, W. Toller, J. Wright, D. Wusinich-Mendez and J. Waddell. 2008. pp 29-73. In J.E. Waddell and A.M. Clarke (eds.), The State of Coral Reef Ecosystems of the United States and Pacific Freely Associated States: 2008. NOAA Technical Memorandum 73. NOS NCCOS Center for Coastal Monitoring and Assessment’s Biogeography Branch. Silver Spring, MD. 569 pp.

APPENDIX F – ACRONYMS
F-1
Appendix F: Acronyms and Abbreviations AHI Acoustic Habitat Investigator AS America Samoa ASG American Samoa Government AUV Autonomous Underwater Vehicle BMP Best Management Practice CAFO Confined Animal Feeding Operation CCD NOAA Coral Conservation Division CCFHR NOAA Center for Coastal Fisheries and Habitat Research CCMA NOAA Center for Coastal Monitoring & Assessment CFMC Caribbean Fishery Management Council CHAMP NOAA Coral Health and Monitoring Program CMP Guam Coastal Management Program CNMI Commonwealth of the Northern Mariana Islands CoRIS NOAA Coral Information System CRCA Coral Reef Conservation Act of 2000 CRCP NOAA Coral Reef Conservation Program CRED NOAA Coral Reef Ecosystem Division CREIOS NOAA CRCP Coral Reef Ecosystem Integrated Observing System CREMP Coral Reef Evaluation and Monitoring Project CREWS NOAA CRCP Coral Reef Early Warning System CRMO CNMI Coastal Resources Management Office CRTF U.S. Coral Reef Task Force CRW NOAA Coral Reef Watch CSO Combined Sewer Outfall CWA Clean Water Act CZM AS/CNMI/HI/PR/USVI Coastal Zone Management DAR HI Division of Aquatic Resources DAWR Guam Division of Aquatic and Wildlife Resources DEP FL/USVI Department of Environmental Protection DEQ CNMI Division of Environmental Quality DFW CNMI/USVI Division of Fish and Wildlife DLNR HI Department of Land and Natural Resources DMWR AS Department of Marine and Wildlife Resources DNER PR Department of Natural and Environmental Resources DOC U.S. Department of Commerce DoD U.S. Department of Defense DOI U.S. Department of the Interior DPNR USVI Department of Planning and Natural Resources EAR Ecological Acoustic Recorder EEMP East End Marine Park EEZ Exclusive Economic Zone

APPENDIX F – ACRONYMS
F-2
EPA U.S. Environmental Protection Agency ESA Endangered Species Act ESI Environmental Sensitivity Index FACE Florida Area Coastal Environment FBNMS NOAA Fagatele Bay National Marine Sanctuary FGNMS NOAA Flower Garden Banks National Marine Sanctuary FIU Florida International University FKNMS NOAA Florida Keys National Marine Sanctuary FL Florida FMC Fishery Management Council FTP File Transfer Protocol FWRI Florida Wildlife Research Institute FWS DOI Fish and Wildlife Service FY Fiscal Year GIS Geographic Information System GMFMC Gulf of Mexico Fishery Management Council HAB Harmful Algal Blooms HI Hawai’i HIMB Hawai’i Institute of Marine Biology HYCOM Hybrid Coordinate Ocean Model ICON NOAA CRCP Integrated Coral Observing Network IHO International Hydrographic Organization JBNERR Jobos Bay National Estuarine Research Reserve LBSP Land-Based Sources of Pollution LIDAR Light Detection and Ranging MARAMP Mariana Archipelago Reef Assessment and Monitoring Program MEERA Marine Ecosystem Event Response and Assessment MHI Main Hawai’ian Islands MPA Marine Protected Area MPRSA Marine Protection, Research and Sanctuaries Act NASA U.S. National Aeronautics and Space Administration NCCOS NOAA National Centers for Coastal Ocean Science NEPA National Environmental Protection Act NESDIS NOAA National Environmental Satellite, Data, and Information Service NetCDF Network Common Data Form NGO Non-Governmental Organization NMFS NOAA National Marine Fisheries Service NNDC NOAA National Data Centers NOAA National Oceanic and Atmospheric Administration NOS NOAA National Ocean Service NPDES National Pollutant Discharge Elimination System NPS DOI National Park Service NRCS USDA Natural Resources Conservation Service

APPENDIX F – ACRONYMS
F-3
NS&T National Status and Trends NWHI Northwestern Hawai’ian Islands OA Ocean Acidification OAR NOAA Office of Oceanic and Atmospheric Research OCD NOAA Ocean Chemistry Division OCRM NOAA Office of Coastal Resource Management OCS NOAA Office of Coast Survey OHC NOAA Office of Habitat Conservation ONMS NOAA Office of National Marine Sanctuaries ONR DOD Office of Naval Research OSCURS Ocean Surface Current Simulations PAR Photosynthetically Active Radiation PIFSC NOAA Pacific Islands Fisheries Science Center PIRO NOAA Pacific Islands Regional Office PMNM Papahānaumokuākea Marine National Monument PR Puerto Rico PRIA Pacific Remote Island Areas PSC NOAA Pacific Services Center QA/QC Quality Assurance/Quality Control RAMP NOAA CRCP Reef Assessment and Monitoring Program REA Rapid Ecological Assessment ROV Remotely Operated Underwater Vehicle RVC Reef Visual Census SAFMC South Atlantic Fishery Management Council SE Southeast SEAMAP Southeast Area Monitoring and Assessment Program SECREMP Southeast Florida Coral Reef Evaluation and Monitoring Project SEFCRI Southeast Florida Coral Reef Initiative SEFSC NOAA Southeast Fisheries Science Center SERO NOAA Southeast Regional Office SST Sea Surface Temperature TMDL Total Maximum Daily Load TOAD Towed Optical Assessment Device UAS Unmanned Autonomous Systems UH University of Hawai’i UPR University of Puerto Rico USDA U.S. Department of Agriculture USGS U.S. Geological Survey USVI U.S. Virgin Islands UVI University of the Virgin Islands WESPAC Western Pacific Fishery Management Council WQ Water Quality

United States Department of Commerce
Gary Locke Secretary
National Oceanic and Atmospheric Administration
Jane Lubchenco Under Secretary of Commerce for Oceans and Atmospheres
National Ocean Service
John H. Dunnigan Assistant Administrator for Ocean Service and Coastal Zone Management


![NOAA Coral Reef Information System - Glossary of …NOAA Coral Reef Information System - Glossary of Terminology 3/10/2016 11:56:15 AM] Acoelomate flatworms such ...](https://static.fdocuments.us/doc/165x107/5e5c550323ce2d54a374c37a/noaa-coral-reef-information-system-glossary-of-noaa-coral-reef-information-system.jpg)


![[U.S.] National Coral Reef Monitoring Program (NCRMP) · Photo credit, DOI NOAA Coral Reef Conservation Program National Coral Reef Monitoring Program Overview • NCRMP conducts](https://static.fdocuments.us/doc/165x107/5fc1666ed97a821ce14140e2/us-national-coral-reef-monitoring-program-ncrmp-photo-credit-doi-noaa-coral.jpg)