No-touch room disinfection (NTD) systems: when to use them ...€¦ · No-touch room disinfection...
72
No-touch room disinfection (NTD) systems: when to use them and how to choose between them… APIC New England, April 24 2014 Jon Otter, PhD Scientific Director, Healthcare, Bioquell Research Fellow, King‟s College London @jonotter, [email protected] www.micro-blog.info (Can you „C‟ the difference?)
Transcript of No-touch room disinfection (NTD) systems: when to use them ...€¦ · No-touch room disinfection...

No-touch room disinfection (NTD) systems: when to use them and how to choose between them…
APIC New England, April 24 2014
Jon Otter, PhD
Scientific Director, Healthcare, Bioquell
Research Fellow, King‟s College London
@jonotter, [email protected]
www.micro-blog.info
(Can you „C‟ the difference?)

Disclosures
I am employed part-time by Bioquell and have received payment from 3M for webinars.
I have received research funding from Pfizer, the Guy‟s and St. Thomas Charity and the Royal Commission for the Exhibition of 1851.

Question
Should all acute hospitals be using a „no-touch‟ automated room disinfection (NTD) system for terminal disinfection of some patient rooms?
• Yes
• No
• Not sure

Otter et al. Infect Control Hosp Epidemiol 2011;32:687-699.
Transmission routes

„The room lotto‟
Patient infected or colonised with a pathogen (e.g. C. difficile, MRSA, VRE, A. baumannii or P. aeruginosa)
Patient is discharged and the room is cleaned / disinfected; surfaces in the room remain contaminated with the pathogen
The next room occupant is at an increased risk of acquiring the pathogen

Shaughnessy et al. Infect Control Hosp Epidemiol 2011;32:201-206.
Setting & design: 18-month retrospective cohort study on an ICU, Ann Arbor, Michigan, USA.
Methods: 134 cases of C. difficile infection occured among 48 hours after ICU admission or with 30 days of discharge in 1,844 patients admitted to the ICU during the study.
0
2
4
6
8
10
12
C. difficile+ C. difficile-
Perc
enta
ge o
f patients
with C
DI
Hazard ratio 2.35, p=0.01
The C. difficile „room lotto‟

Increased risk from the prior room occupant
Otter et al. Am J Infect Control 2013;41(5 Suppl):S6-11.
0 1 2 3 4
Huang MRSA
Huang VRE
Nseir P. aeruginosa
Drees VRE (2 weeks)
Drees VRE
Shaughnessy C. difficile
Nseir A. baumannii
Odds ratio
+71%
+58%
+55%
+49%
+42%
+37%
+28%

© Bioquell UK Ltd (2010). All rights reserved.
86%
96%
58%
59%
93%
85%
French et al. J Hosp Infect 2004;57:31-37.

Surface survival
Otter and French. J Clin Microbiol 2009;47:205-207.
1400
Wagenvoort et al. J Hosp Infect 2011;77:282-283.

French et al. J Hosp Infect 2004;57:31-37.
Persist despite terminal cleaning / disinfection

Hand transfer without direct patient contact1-2
1. Boyce et al. Infect Control Hosp Epidemiol 1997;18:622-627.
2. Bhalla et al. Infect Cont Hosp Epidemiol 2004;25:164-167.
3. Hayden et al. Infect Control Hosp Epidemiol 2008;29:149-154.
4. Stiefel et al. Infect Control Hosp Epidemiol 2011;32:185-187.
5. Guerrero et al. Am J Infect Control 2012;40:556-558.
6. Randle et al. J Hosp Infect 2010;76:252-255.
52% of 23 HCW acquired VRE on their hands3
Contact with patient or surface = ~10% risk of acquiring VRE3
45% of 50 HCW acquired MRSA on their hands4
40% of 50 HCW acquired MRSA on their hands4
50% of 30 HCW acquired C. difficile on their hands5
50% of 30 HCW acquired C. difficile on their hands5
Compliance with hand hygiene: 50%6 Compliance with hand hygiene: 80%6

What is the goal of hospital disinfection?
Disinfection = to reduce contamination to „safe‟ levels.
Pragmatist Prior room occupantist
A reduction in contamination is good enough. A low level of residual contamination with pathogens represents a negligible risk and is acceptable.
Each patient should be admitted into a room free from contamination with pathogens. Residual contamination at any level represents unacceptable risk.

Tra
nsm
issio
n
Contamination level
Contamination level ∝transmission risk

0
1
2
3
4
5
6
7
8
9
10
0 5 10 15 20 25 30
Patients
with A
cin
eto
bacte
r per
cale
nder
month
Positive Acinetobacter environmental cultures per calender month
1
1. Denton et al. J Hosp Infect 2004;56:106-110.2. Salgado et al. Infect Control Hosp Epidemiol 2013;34:479-486.3. White et al. Am J Infect Control 2008;36:381-384.4. Samore et al. Am J Med 1996;100:32-40.
0
5
10
15
20
25
<500 501-2000 2001-8000 >8000
% p
ts a
cquir
ing a
n H
AI
Microbial burden / cfu per 100cm2
0
1
2
3
4
5
6
7
8
0 1 2 3 4 5
Tota
l hygie
ne f
ailure
s p
er
week
# SICU-acquired infections per week
0
5
10
15
20
25
30
35
40
0 1-25 26-50 >50
% h
ands p
ositiv
e for
C.
difficile
Environmental sites positive for C. difficile (%)
2
3 4

Tra
nsm
issio
n
Contamination level
Decontamination level ∝transmission reduction

0
20
40
60
80
100
0 1 2 3 4 5 6
C.
difficile
transm
issio
n e
ffic
iency %
C. difficile in vitro log reduction
Chlor-clean
HPV
Virusolve
Steri-7
Flash
70% alcohol
Untreated
Lawley et al. Appl Environ Microbiol 2010;76:6895-6900.

Emerging issues

Biofilms on dry hospital surfaces
Scanning electron microscopy identified biofilm on 5/6 dry hospital surfaces from an Australian ICU.
MRSA was identified on three of the surfaces.
Vickery et al. J Hosp Infect 2012;80:52-55.
Could explain why vegetative bacteria can survive on dry hospital surfaces for so long
Be part of the reason why they are so difficult to remove or inactivate using disinfectants
Explain (to some degree) the difficulty in recovering environmental pathogens by surface sampling

CRE – is surface contamination a risk?
Havill et al. Infect Control Hosp Epidemiol 2014;35:445-447.
0
1
2
3
4
5
6
7
8
0 5 10 15 20
log
(10
) cfu
pe
r d
isc
Time / days
K. pneumoniae (TSB)
K. pneumoniae (water)
C. freundii (TSB)
C. freundii (water)
Error bars represent plus one standard deviation of the mean.

Enterobacteriaceae are “less environmental”
Nseir et al. Clin Microbiol Infect 2011;17:1201-1208.Ajao et al. Infect Control Hosp Epidemiol 2013;34:453-458.
0
1
2
3
4
5
6
7
8
9
Nseir A.baumannii
Nseir P.aeruginosa
Nseir ESBL Ajao ESBL
Odds r
atio

Cleaning failure
External
ProductProcedure

Improve existing procedures
Try something new!

Persistent contamination
0
2
4
6
8
10
12
14
2 x bleach disinfection
4 x bleach disinfection
Bioquell
% s
ites c
on
tam
inate
d
% sites contaminated with A. baumannii
% sites contaminated with MRSA
Manian et al. Infect Control Hosp Epidemiol 2011;32:667-672.
140 samples from 9 rooms after 2xbleach
5705 samples from 312 rooms after 4xbleach
HPV
26.6% of rooms remained contaminated with either MRSA or A. baumannii following 4 rounds of bleach disinfection

‘Given the choice of improving technology or improving human behavior, technology is the better choice’.
Dr Bob Weinstein
Weinstein RA. Emerg Infect Dis 1998;4:416-420.

“No-touch” automated room disinfection (NTD)
Pros Cons
Reduce reliance on the operator for distribution, contact time and repeatability
Requires a room to be cleanedthen vacated for an additional period of time (typically 1-2 hrs)
Can eliminate pathogens from surfaces (e.g. 6-log reduction)
Health and safety risks need tobe managed appropriately
Monitoring and validation using BIs* / cycle data
Most systems are compatible with hospital materials including electronics
* BI = biological indicator, typically consisting of a >6-log loading of Geobacillus stearothermophilus spores
Otter et al. J Hosp Infect 2013;83:1-13.

Otter et al. J Hosp Infect 2013;83:1-13.

Hydrogen peroxide
vapour (HPV)
Aerosolised hydrogen
peroxide (AHP)
Ultraviolet radiation
(UVC)
Pulsed-xenon UV (PX-UV)
No-touch automated room disinfection (NTD) systems
Otter et al. J Hosp Infect 2013;83:1-13.

Question
Has your hospital has used the following NTD systems?
• Ultraviolet C radiation (UVC)
• Pulsed-xenon UV (PX-UV)
• Hydrogen peroxide vapor (HPV)
• Aerosolised hydrogen peroxide (AHP)
• Yes, other

Hydrogen peroxide vapor (HPV)
• Portable HPV generator + aeration unit for the healthcare industry
• Produces HPV from a 30% (w/w) H2O2 liquid solution (EPA-registered sterilant).
• Distributed as a vapour (gas) then condenses on surfaces.
• The process also generate hydroxyl free radicals (OH-) which kill microorganisms.
• At the end of the process HPV is catalytically broken down to water vapor and O2.
• Compatible with hospital materials including sensitive electronics.

HPV in vitro activity
Otter and French. J Clin Microbiol 2009;47:205-207.

Impact of HPV on persistent contamination
0
2
4
6
8
10
12
14
2 x bleach disinfection
4 x bleach disinfection
Bioquell
% s
ites c
on
tam
inate
d
% sites contaminated with A. baumannii
% sites contaminated with MRSA
Manian et al. Infect Control Hosp Epidemiol 2011;32:667-672.
140 samples from 9 rooms after 2xbleach
5705 samples from 312 rooms after 4xbleach
2680 sites from 134 rooms after HPV
HPV

HPV: in situ efficacy
1. French et al. J Hosp Infect 2004;57:31-37.2. Jeanes et al. J Hosp Infect 2005;61:85-86. 3. Bates & Pearse. J Hosp Infect 2005;61:364-366.4. Boyce et al. SHEA 2006.5. Hardy et al. J Hosp Infect 2007;66:360-368.
6. Otter et al. J Hosp Infect 2007;67:182-188.7. Otter et al. Am J Infect Control 2010;38:754-756.8. Manian et al. ICHE 2011;32:667-672.9. Barbut et al. Burns 2013;39;395–403.10. Landelle et al. ICHE 2013;34:119-124.
Year Author Pathogen* Surfacescontaminatedbefore HPV
Surfacescontaminatedafter HPV
%
reduction
2004 French et al.1 MRSA 61 (72%) of 85 1 (1%) of 85 98
2005 Jeanes et al.2 MRSA 8 (16%) of 50 None of 50 100
2005 Bates et al.3 Serratia 2 (4%) of 42 None of 25 100
2006 Boyce et al.4 C. difficile 11 (24%) of 45 None of 35 100
MRSA 9 (5%) of 165 None of 155 100
VRE 23 (14%) of 165 None of 155 100
2007 Hardy et al.5 MRSA 5 (17%) of 86 None of 86 100
2007 Otter et al.6 MRSA 12 (40%) of 30 1 (3%) of 30 92
VRE 1 (3%) of 30 None of 30 100
GNR 3 (10%) of 30 None of 30 100
2010 Otter et al.7 GNR 10 (48%) of 21 None of 63 100
2011 Manian et al.8 GNR 6 (2%) of 370 None of 370 100
MRSA 6 (2%) of 370 None of 370 100
2012 Barbut et al.9 MRSA 2 (2%) of 102 None of 102 100
GNR 6 (6%) of 102 None of 102 100
2013 Landelle et al.10 GNR 8 (62%) of 13 None of 29 100

Environmental contamination is often implicated in the continuation of outbreaks.
HPV can be used to decontaminate entire wards (after vacation) or high-risk rooms / bays.
HPV has been used to tackle outbreaks of:
MRSA1,2
Gram-negative rods (e.g. CRE,3,4 Serratia,5
Acinetobacter6,7)
C. difficile8
1. Jeanes et al. J Hosp Infect 2005;61:85-86.2. Dryden et al. J Hosp Infect 2008;68:190-192.3. Gopinath et al. Infect Control Hosp Epidemiol 2013;34:99-100.4. Snitkin et al. Sci Transl Med 2012;4:148ra116.5. Bates & Pearse. J Hosp Infect 2005;61:364-366.6. Otter et al. Am J Infect Cont 2011;38:754-756.7. Landelle et al. IHCE 2013;34:119-124.8. Cooper et al. J Hosp Infect 2011;78:238-240.
Clinical impact: outbreaks

Passaretti et al. Clin Infect Dis 2013;56:27-35.

Methods – clinical impact
A 30-month prospective cohort intervention study performed on 6 high-risk units (5 ICUs) at Johns Hopkins Hospital.
HPV was implemented on 3 of the units following a 12-month pre-intervention phase.
Clinical impact was assessed by a cohort study. Each patient admitted to any study unit during both phases was included in one of three cohorts:
„MDRO-standard‟Patients admitted to a room where the prior room occupant had an
MDRO and the room was disinfected using standard methods
„MDRO-HPV‟Patients admitted to a room where the prior room occupant had an
MDRO and the room was decontaminated using
HPV
„No MDRO-standard‟ Patients admitted to a
room where the prior room occupant was not known to
have an MDRO and the room was disinfected using
standard methods
Most important comparison

Results – clinical, MDROs combined
0
2
4
6
8
10
12
14
16
MDRO-standard No MDRO-standard MDRO-HPV
Acquis
itio
n r
ate
/ 1
000 p
tdays
* The difference between cohorts was adjusted for patient level variables such as length of stay, morbidities and other variables that could explain the difference. This means that the difference between cohorts is attributable to HPV alone.
Patients admitted to rooms decontaminated using HPV were 64% less likely to acquire any MDRO (incidence rate ratio [IRR]=0.36, CI=0.19-0.70, p<0.001)*
Passaretti et al. Clin Infect Dis 2013;56:27-35.

Results – clinical, MDROs combined
0
2
4
6
8
10
12
14
16
MDRO-standard No MDRO-standard MDRO-HPV
Acquis
itio
n r
ate
/ 1
000 p
tdays
Even when the prior room occupant was not known to have an MDRO, HPV reduced the risk of acquisition by 51%.
Passaretti et al. Clin Infect Dis 2013;56:27-35.

0 1 2 3 4
MDRO-HPV
Datta MRSA
Huang MRSA
Huang VRE
Nseir P. aeruginosa
Datta VRE
Drees VRE (2 weeks)
Drees VRE
Shaughnessy C. …
Nseir A. baumannii
Odds ratio
Mitigating the prior room occupant risk
a. In this study, enhanced conventional methods mitigated the increased risk for MRSA but not for VRE.
a
a
+71%
+58%
+55%
+49%
+42%
+37%
+28%
+43%
+0%
-85%

0.0 1.0 2.0 3.0 4.0
VRE HPV
C. difficile HPV
MRSA HPV
MDR-GNR HPV
Datta MRSA
Huang MRSA
Huang VRE
Nseir P. aeruginosa
Datta VRE
Drees VRE (2 weeks)
Drees VRE
Shaughnessy C. difficile
Nseir A. baumannii
Odds ratio
a
a
b
a. In this study, enhanced conventional methods mitigated the increased risk for MRSA but not for VRE.
b. The reduced acquisition of VRE was statistically significant; MDR-GNR, C. difficileand MRSA followed the same trend but were not individually statistically significant.
+71%
+58%
+55%
+49%
+42%
+37%
+28%
+43%
+0%
-8%
-78%
-129%
-176%
Mitigating the prior room occupant risk

Environmental impact
These changes are due to improved terminal disinfection using HPV
No HPV (n=170)
HPV(n=397)
% difference
p value
Rooms contaminated with MDROs 21.2% 13.9%2 -34% 0.03
Multiple MDROs 4.7% 0.8% -83% <0.01
MDRO from room differed from the room occupant‟s known MDRO
8.8% 3.3% -63% 0.01
MDROs from empty rooms 4.1% 1.3% -68% 0.05
The impact of HPV disinfection on the recovery of MDROs from rooms on 3 high-risk units. All patient rooms were sampled once per month for 3 months without HPV and for 6 months when HPV was in operation.1
1. No significant differences were observed in MDRO contamination on units not using HPV.2. Swabs were collected from all patient rooms, occupied or unoccupied, regardless of patient
status. 76% of rooms contaminated with MDROs from units where HPV was in operation matched the MDRO of the patient in the room.
Passaretti et al. Clin Infect Dis 2013;56:27-35.

Environmental1,2
Standard swabs:
Post: Bleach HPV
C.difficile 5% 0%
MRSA: 6% 0%
VRE: 14% 0%
CDC “sponges”:
Post: Bleach HPV
C.difficile 24% 0%
CDI rates3
1.89
0.88
0
0.2
0.4
0.6
0.8
1
1.2
1.4
1.6
1.8
2
Before trial During trialCD
I cases /
1,0
00 P
t days
53% reduction (p=0.047)
1. Boyce et al. SHEA 2006.2. Otter et al. Am J Infect Control 2009;37:517-518.3. Boyce et al. Infect Cont Hosp Epidemiol 2008;29:723-729.
Clinical impact: C. difficile

Clinical impact: SJMMC, St. Louis, USA
Manian et al. Am J Infect Control 2013;41:537-541.
0
0.1
0.2
0.3
0.4
0.5
0.6
0.7
0.8
0.9
1
2007 2008 2009
No
so
co
mia
l C
DI c
ase p
er
10
00
pati
en
t d
ays
Pre-intervention Intervention
11% increase, p=0.3 39% decrease, p<0.0001(rate ratio 0.63, 95% confidence interval 0.50-0.79)
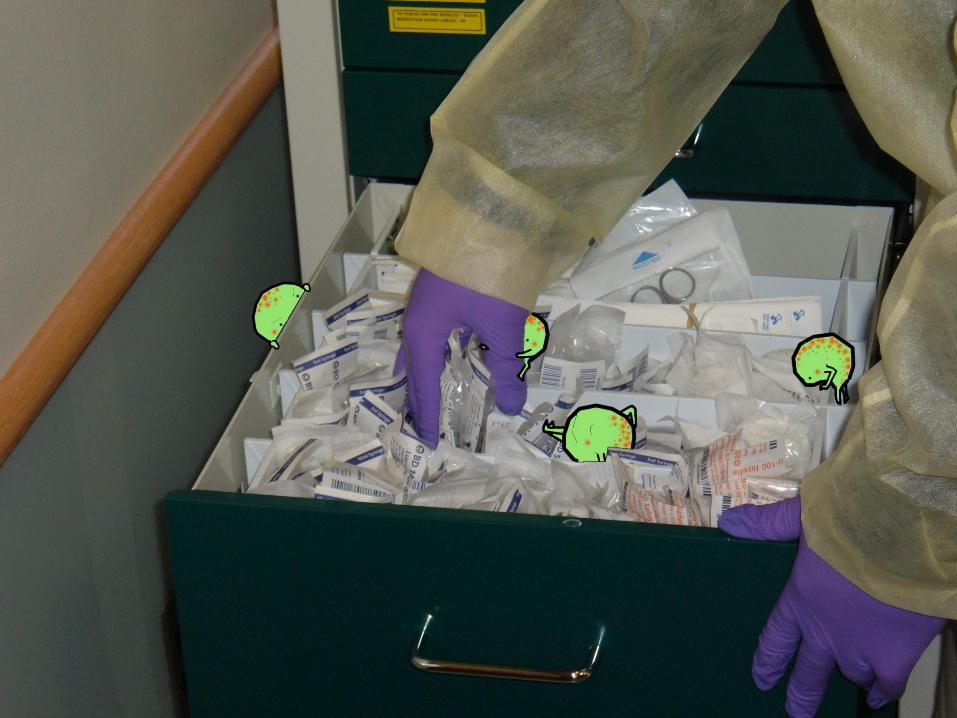

Organism MRSA R-GNR VRE Any pathogen
# positive 3 4 3 9*
Total sampled 100 100 100 100
* One of the supplies was contaminated with more than 1 organism.
No supplies were contaminated with MRSA, R-GNR or VRE after HPV (none of 100 vs. 9% of 100, p=0.003, Fisher‟s Exact Test).
Of the 12 individual MDROs isolates from supplies, only 6 matched the species of the patient in the room.
HPV disinfection of unopened supply packaging is warranted and works.
Annual savings of around $400,000 per annum identified on 6 ICUs.
Contamination of supply packaging
Otter et al. Infect Control Hosp Epidemiol 2013;34:472-478.

Aerosolised hydrogen peroxide (AHP)
The technology & process
• Portable H2O2 aerosolisers (e.g. ASP Glosair, Steris BioGienie).
• 5-6% hydrogen peroxide and 50-60ppm silver plus stabilisers.
• Aerosolised (droplets – not gas) particles size (8-12 μm).
• Passive aeration. H2O2 left to degrade naturally.
• Cycle time >2 hr for a single room.

Under bench
AHP – Tyvek pouched BIs*
Fu et al. J Hosp Infect 2012;80:199-205.
Benchtop
6-log BI: killed
6-log BI: grew
4-log BI: killed4-log BI: grew
* BIs = Geobacillus stearothermophilus biological indicators.
1 2
34
5
6
7
8
9
1011
Benchtop
93% of 6-log BIs grew.64% of 4-log BIs grew.

Under bench
HPV – Tyvek pouched BIs*
Fu et al. J Hosp Infect 2012;80:199-205.
Benchtop
6-log BI: killed
6-log BI: grew
4-log BI: killed4-log BI: grew
* BIs = Geobacillus stearothermophilus biological indicators.
1 2
34
5
6
7
8
9
1011
Benchtop
9% of 6-log BIs grew.5% of 4-log BIs grew.

0
1
2
3
4
5
6
1 2 3 4 5 6 7 8 9 10 11 3% BSA
10% BSA
3% BSA
10% BSA
Log
10
reduction
Bioquell
ASP
A. baumannii log10 reductions achieved by HPV vs. AHP at various locations in a test room
Room Bathroom „Challenge‟ Soiled
BSA*, room
BSA, bathroom
* BSA = bovine serum albumin.
Fu et al. J Hosp Infect 2012;80:199-205.
HPV
AHP

0
1
2
3
4
5
6
1 2 3 4 5 6 7 8 9 10 11 3% BSA
10% BSA
3% BSA
10% BSA
Log
10
reduction
Bioquell
ASP
MRSA log10 reductions achieved by HPV vs. AHP at various locations in a test room
Room Bathroom „Challenge‟ Soiled
* BSA = bovine serum albumin.
Fu et al. J Hosp Infect 2012;80:199-205.
BSA*, room
BSA, bathroom
HPV
AHP

0
1
2
3
4
5
1 2 3 4 5 6 7 8 9 10 11 3% BSA
10% BSA
3% BSA
10% BSA
Log
10
reduction
Bioquell
ASP
C. difficile log10 reductions achieved by HPV vs AHP at various locations in a test room
Room Bathroom „Challenge‟ Soiled
* BSA = bovine serum albumin.
Fu et al. J Hosp Infect 2012;80:199-205.
BSA*, room
BSA, bathroom
HPV
AHP
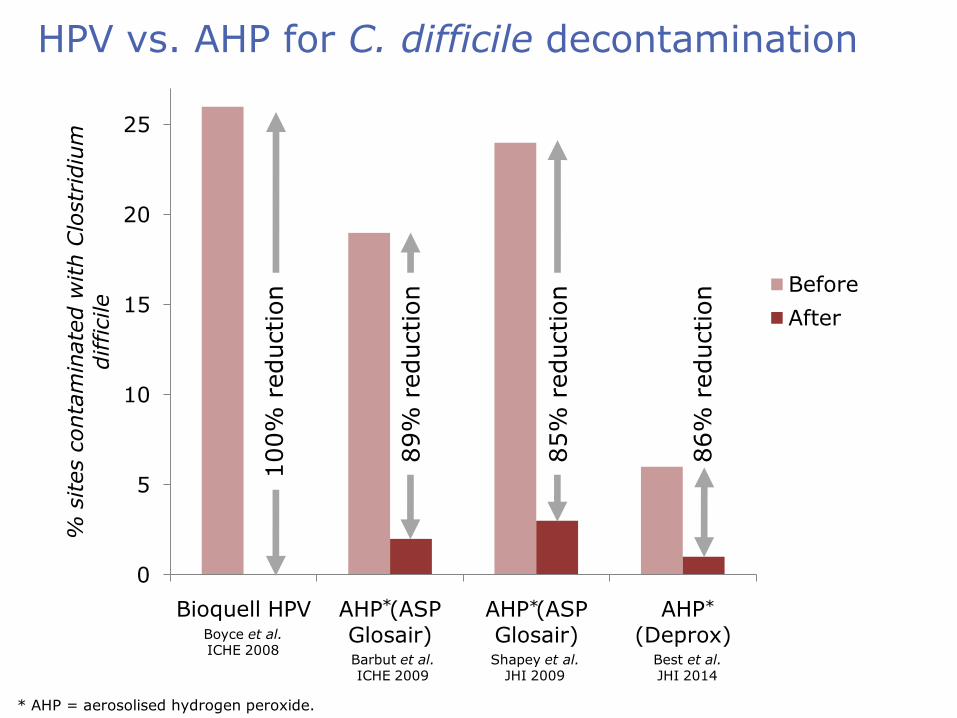
0
5
10
15
20
25
Bioquell HPV AHP (ASP Glosair)
AHP (ASP Glosair)
AHP (Deprox)
% s
ites c
onta
min
ate
d w
ith C
lostr
idiu
m
difficile
Before
After
HPV vs. AHP for C. difficile decontamination
100%
reduction
89%
reduction
85%
reduction
86%
reduction
* * *
* AHP = aerosolised hydrogen peroxide.
Boyce et al. ICHE 2008
Barbut et al. ICHE 2009
Shapey et al. JHI 2009
Best et al. JHI 2014

Pros and cons of hydrogen peroxide systems
HPV AHP
Efficacy High-level disinfection (>6-log reduction); complete inactivation of pathogens on surfaces.
Lower efficacy; catalase-positive bacteria problematic; does not eliminate pathogens.
Distribution Homogeneous (vapourphase).
Non-homogeneous(aerosol).
Ease of use Need to seal doors and air vents; 2 units plus cables.
Need to seal doors and air vents; 1 unit no cables.
Cycle time ~2 hrs for a single room (active aeration).
>2 hrs for a single room (passive aeration).
Cost Purchase and ongoing consumable costs.
Purchase and ongoing consumable costs.
Registration EPA-registered sterilant. Uncertain.
Published data Micro & clinical reductions, material compatibility, feasibility
Microbiological reductions.

UVC systems
The technology & process
• Mobile UV unit.
• Emits UVC (254nm), which damages DNA.
• Some systems control the dose of UV according to room topology.
• Multiple room locations recommended.
• Some have the option for multiple emitters.
• Single room cycle times range from ~30 mins to >90 mins depending on setting.1
1. Boyce et al. Infect Control Hosp Epidemiol 2011;32:737-742.

Microbiological efficacy:
• Most studies performed at a „sporicidal‟ dose (22,000mWs/cm2)
• 1-3 log in C. difficle and 3-4 log reduction in MRSA and VRE at the spore killing dose in vitro1-5 and incomplete inactivation of pathogens on hospital surfaces.1,4,6
• Significantly less effective out of direct line of sight, e.g. only 1 log reduction in C. difficile and Aspergillus sp.1-5
UVC
1. Nerandzic et al. BMC Infect Dis 2010;10:197.2. Mahida et al. J Hosp Infect 2013 in press.3. Boyce et al. Infect Control Hosp Epidemiol 2011;32:737-742.4. Rutala et al. Infect Control Hosp Epidemiol 2010;31:1025-1029.5. Havill et al. Infect Control Hosp Epidemiol 2012;33:507-512.6. Anderson et al. Infect Control Hosp Epidemiol 2013;34:466-471.

UVC cycle times
Study Room volume range (m3)
12,000 mWs/cm2
22,000 mWs/cm2
Mahida et al.1 39-80 ~30-40 mins ~60-90 mins
Anderson et al.2 - Median 25 mins Median 45 mins
Havill et al.3 46-86 - Mean 73 mins(range 39–100)
Boyce et al. (one stage)3
46-86 - Mean 68 mins(range 34-100)
Boyce et al. (two stage)4
57-80 - Mean 84 mins(range 72-146)
Nerandzic et al.5 - ~20 mins ~45 mins
Rutala et al.6 - ~15 mins ~50 mins*
* The „sporicidal‟ dose in this study was 36,000 mWs/cm2
1. Mahida et al. J Hosp Infect 2013 in press.2. Anderson et al. Infect Control Hosp Epidemiol 2013; 34:466-713. Havill et al. Infect Control Hosp Epidemiol 2012;33:507-512.4. Boyce et al. Infect Control Hosp Epidemiol 2011;32:737-742.5. Nerandzic et al. BMC Infect Dis 2010;10:197.6. Rutala et al. Infect Control Hosp Epidemiol 2010;31:1025-1029.

Time to redecorate your hospital rooms?
1. Rutala et al. Infect Control Hosp Epidemiol 2013;34:527-529.2. Rutala et al. Infect Control Hosp Epidemiol 2014;35:323-325.
0
5
10
15
20
25
30
35
40
45
50
MRSA C. difficile
Tim
e (
min
s)
to a
chie
ve
targ
ete
d d
ose
Without coating
With coating
Targeted dose = 12,000 µWs/cm2 for MRSA; 22,000 µWs/cm2 for C. difficile.

Or maybe not…
Increasing the efficiency of feedback to the unit does not influence direct dose to a
surface.

Efficacy of UVC (Lumalier TruD) and HPV (Bioquell) tested in 15 patient rooms, which were disinfected with each device separated by at least 2 months.
Efficacy was evaluated by: Aerobic colony counts from five standardized high-touch
sites. Metal discs inoculated with C. difficile spores. 6-log and 4-log Geobacillus stearothermophilus biological
indicator spores.
HPV vs. UVC
Havill et al. Infect Control Hosp Epidemiol 2012;33:507-512.

Bacterial growth
HPV: Direct vs out of direct line of sight (p = 1)
UVC: Direct vs out of direct line of sight (p <0.001)
Direct line of sight
Out of direct line of sight
Havill et al. Infect Control Hosp Epidemiol 2012;33:507-512.

C. difficile spores
Havill et al. Infect Control Hosp Epidemiol 2012;33:507-512.
Inactivation of C. difficile spores dried on metal discs.

Biological indicator spores
Havill et al. Infect Control Hosp Epidemiol 2012;33:507-512.
Inactivation of 4-log G. stearothermophilus BIs. Note, UVC did not inactivate any of the 6-log BIs.

UVC is considerably less efficacious than HPV for the inactivation of vegetative bacteria and spores.
UVC is less effective out of direct line of sight.
UVC is faster than HPV: Mean HPV cycle time 153 mins (range 140–177) Mean UVC cycle time 73 mins (range 39–100)
Havill et al. Summary
Havill et al. Infect Control Hosp Epidemiol 2012;33:507-512.

PX-UV systems
The technology & process
• Mobile UV unit.
• Produces flashes of UV light in the 200-320nm range.1
• The devices is placed in 3 room locations.
• Cycles are fast: 15 minutes (process times 60 mins for standard methods vs. 50 mins for PX-UV including pre-cleaning).1,2
• Limited published data.1-4
1. Stibich et al. Infect Control Hosp Epidemiol 2011;32:286-288.2. Jinadatha et al. BMC Infect Dis 2014;14:187 3. Simmons et al. J Infect Prevent 2013 in press.4. Levin et al. Am J Infect Control 2013;41:746-748.

PX-UV and CDI
0
2
4
6
8
10
2010 2011
HA-C
DI
per
10,0
00 p
atient
days
Levin et al. Am J Infect Control 2013;41:746-748.
53% significant reduction in rate, but…• Low rate, small n (33 vs. 15)• Changes in abx usage • Introduction of PCR test

PX-UV and MRSA
Jinadatha et al. BMC Infect Dis 2014;14:187.
0
20
40
60
80
100
Manual PX-UV
% s
ites c
onta
min
ate
d w
ith
MRSA
Before
After
HPC MRSA
Before After Before After
Manual 255 60 127 11
PX-UV 449 8 108 1

PX-UV and MRSA
Simmons et al. J Infect Prevent 2013 in press.
57% significant reduction, but…• Bundled intervention of active
surveillance, hand hygiene education and PX-UV
0
20
40
60
80
100
120
Pre-intervention Post-intervention
Num
ber
of
HA-M
RSA c
ases

Pros and cons of UV systemsUVC PX-UV
Efficacy 1-4 log reduction in vitro; reduces but does not eliminate pathogens.
Limited published data; reduces but does not eliminate pathogens.
Distribution Less effective out of direct line of sight.
Limited published data; likely less effective out of direct line of sight.
Ease of use No need to seal doors and air vents; single or multiple room locations; unknown capacity for larger areas.
No need to seal doors and air vents; multiple room locations; unknown capacity for larger areas.
Cycle time 15-50 mins (although may be longer in some rooms)
15 mins cycle time (5 minsin 3 locations).
Cost High purchase cost; low maintenance costs.
High purchase cost; low maintenance costs.
Registration None required (currently). None required (currently).
Published data In vitro and in situ microbiological reductions;clinical data coming.
In situ microbiological studies and clinical reductions study.

Which to choose?
Otter et al. J Hosp Infect 2013;83:1-13.
HPV AHP UVC PX-UV
Efficacy 1 2 3 4
Distribution 1 2 4 3
Ease of use 4 3 1 2
Cycle time 3 4 2 1
Purchase cost 2 1 3 3
Running costs 3 2 1 1

Scenario 1
A patient with carbapenem-resistant A. baumanniiis discharged from the ICU. Do you perform:
• Ultraviolet C radiation (UVC)
• Pulsed-xenon UV (PX-UV)
• Hydrogen peroxide vapor (HPV)
• Aerosolised hydrogen peroxide (AHP)
• Enhanced discharge disinfection
• Regular discharge disinfection

Scenario 2
A patient with MRSA colonization is discharged a general medical unit. Do you perform:
• Ultraviolet C radiation (UVC)
• Pulsed-xenon UV (PX-UV)
• Hydrogen peroxide vapor (HPV)
• Aerosolised hydrogen peroxide (AHP)
• Enhanced discharge disinfection
• Regular discharge disinfection

Scenario 3
A patient with recently resolved CDI is discharged from a general medical unit. Do you perform:
• Ultraviolet C radiation (UVC)
• Pulsed-xenon UV (PX-UV)
• Hydrogen peroxide vapor (HPV)
• Aerosolised hydrogen peroxide (AHP)
• Enhanced discharge disinfection
• Regular discharge disinfection

No-touch room disinfection (NTD) systems: when to use them and how to choose between them…
APIC New England, April 24 2014
Jon Otter, PhD
Scientific Director, Healthcare, Bioquell
Research Fellow, King‟s College London
@jonotter, [email protected]
www.micro-blog.info
(Can you „C‟ the difference?)