NMR Resonance Assignment of the Therapeutic RNA Aptamer ... · The final copy of this thesis has...
76
University of Colorado, Boulder CU Scholar Chemistry & Biochemistry Graduate eses & Dissertations Chemistry & Biochemistry Spring 1-1-2010 NMR Resonance Assignment of the erapeutic RNA Aptamer Macugen in Complex with its in Vivo Target, the Heparin Binding Domain of VEGF165 Andrew Eric Libby [email protected] Follow this and additional works at: hp://scholar.colorado.edu/chem_gradetds Part of the Medicinal-Pharmaceutical Chemistry Commons is esis is brought to you for free and open access by Chemistry & Biochemistry at CU Scholar. It has been accepted for inclusion in Chemistry & Biochemistry Graduate eses & Dissertations by an authorized administrator of CU Scholar. For more information, please contact [email protected]. Recommended Citation Libby, Andrew Eric, "NMR Resonance Assignment of the erapeutic RNA Aptamer Macugen in Complex with its in Vivo Target, the Heparin Binding Domain of VEGF165" (2010). Chemistry & Biochemistry Graduate eses & Dissertations. Paper 21.
Transcript of NMR Resonance Assignment of the Therapeutic RNA Aptamer ... · The final copy of this thesis has...
University of Colorado, BoulderCU ScholarChemistry & Biochemistry Graduate Theses &Dissertations Chemistry & Biochemistry
Spring 1-1-2010
NMR Resonance Assignment of the TherapeuticRNA Aptamer Macugen in Complex with its inVivo Target, the Heparin Binding Domain ofVEGF165Andrew Eric [email protected]
Follow this and additional works at: http://scholar.colorado.edu/chem_gradetds
Part of the Medicinal-Pharmaceutical Chemistry Commons
This Thesis is brought to you for free and open access by Chemistry & Biochemistry at CU Scholar. It has been accepted for inclusion in Chemistry &Biochemistry Graduate Theses & Dissertations by an authorized administrator of CU Scholar. For more information, please [email protected].
Recommended CitationLibby, Andrew Eric, "NMR Resonance Assignment of the Therapeutic RNA Aptamer Macugen in Complex with its in Vivo Target, theHeparin Binding Domain of VEGF165" (2010). Chemistry & Biochemistry Graduate Theses & Dissertations. Paper 21.

NMR RESONANCE ASSIGNMENT OF THE THERAPEUTIC RNA APTAMER
MACUGEN IN COMPLEX WITH ITS IN VIVO TARGET, THE HEPARIN
BINDING DOMAIN OF VEGF165
By
Andrew Eric Libby
B.S., University of Tulsa, 2006
A thesis submitted to the Graduate School
of the University of Colorado, Boulder in partial
fulfillment of the requirement for the degree of
Master‘s of Chemistry
2010

ii
This thesis entitled:
NMR Resonance Assignment of the Therapeutic RNA Aptamer Macugen in Complex
with its in Vivo Target, the Heparin Binding Domain of VEGF165
written by Andrew Eric Libby
has been approved for the Department of Chemistry and Biochemistry
___________________________________________
(Professor Arthur Pardi)
__________________________________________
(Professor Robert Batey)
Date______________
The final copy of this thesis has been examined by the signatories, and we
find both the content and the form meet acceptable presentation standards
of scholarly work in the above mentioned discipline.

iii
Libby, Andrew Eric (M.S., Chemistry)
NMR Resonance Assignment of the Therapeutic RNA Aptamer Macugen in
Complex with its in Vivo Target, the Heparin Binding Domain of VEGF165
Thesis directed by Professor Arthur Pardi
Aptamers consist of nucleic acids that are selected from an in vitro library in
order to bind a specific target or catalyze a reaction. Many aptamer-ligand structures
have been solved in recent years to characterize the molecular mechanisms that
explain the high affinity and specificity observed in these interactions. To this end,
NMR resonance assignment experiments were performed as a necessary first step to
calculating the solution structure of a therapeutically-active RNA aptamer, Macugen,
bound to its in vivo target, the heparin binding domain (HBD) of vascular endothelial
growth factor 165 (VEGF165). Though the resonance assignment of Macugen is
challenging due to its inability to be isotopically-labeled, techniques were employed
that take advantage of the unique chemical modifications of this nucleic acid that are
not present in traditional, unmodified RNA. Using the information obtained from
two-dimensional heteronuclear (19
F, 1H) and homonuclear (
1H,
1H) experiments,
assignments were made for a sizable number of Macugen atoms. The assignments
made in this work will be necessary to calculate a solution structure to better
understand the molecular mechanisms that give rise to the high affinity and
specificity observed in the Macugen-HBD complex.

iv
Acknowledgments
I sincerely thank Art and everyone in the Pardi Lab for their help and support; I am
very appreciative. I would also like to thank my committee members for reading my
thesis and providing constructive comments.
v
Table of Contents
CHAPTER 1: Background and Introduction…………………………….……...…....1
1.1 Introduction to aptamers and the SELEX process………………………........1
1.2 Vascular Endothelial Growth Factor (VEGF) as a SELEX target..………….3
1.3 Development of chemically-modified RNA aptamers to bind VEGF165….....7
1.4 Characteristics of the Macugen-VEGF165 complex and the role of the
HBD in binding…………………….……………..........................................8
1.5 The need for Macugen NMR resonance assignments…………...……...…..12
1.6 Project description and overview of thesis……………...……..…………....14
CHAPTER 2: Methods………….……………………………………......................15
2.1 Preparation of HBD of VEGF165 for NMR studies………..……………......15
2.2 Preparation of the Macugen-HBD complex for NMR studies…………...…15
2.3 Acquisition of 2D 1H,
1H TOCSY spectrum to identify pyrimidine H5/
H6 resonances in the Macugen-HBD complex………………......…........…16
2.4 Acquisition of 2D 19
F, 1H HMQC to identify pyrimidine H1‘, H2‘, H3‘
and 2‘-F resonances in the Macugen-HBD complex…………….…………17
2.5 Acquisition of 2D 19
F, 1H HOESY on the Macugen-HBD complex to
identify H1‘, H2‘, H3‘ and obtain sequential information………………....18
2.6 Collection of 2D 1H,
1H NOESY in D2O on the Macugen-HBD
complex to make sequential assignments………………………...…..……18
(CONTINUED)
vi
CHAPTER 3: Results and Discussion……….…………………....…………..........19
3.1 Comparison of traditional assignment strategy for unlabeled nucleic
acids with the Macugen assignment process……………......……...............19
3.2 Identification of pyrimidine H5/H6 resonances from the 2D 1H,
1H
TOCSY...……................................................................................................26
3.3 Identification of pyrimidine H1‘, H2‘, and H3‘resonances from the
2D 19
F, 1H HMQC……....…...........………………………..…..............…..29
3.4 Validation of pyrimidine H1‘, H2‘, and H3‘ resonances and analysis
of sequential information from the 2D 19
F, 1H HOESY…...…….…...........32
3.5 Analysis of the 2D 1H,
1H NOESY in D2O on the Macugen-HBD
complex to make sequential assignments………...…………………....…..37
3.6 Conclusions……………………………..…………........................................56
REFERENCE....................…….............……......………………..…………......…..59
APPENDIX: List of Directories and Filenames.........................................................66
A.1 Original 2D NMR data collected on the Macugen-HBD complex...........…66
A.2 Original Sparky project used to assign Macugen in the complex ................66
vii
List of Tables
Table 3.1 Final pyrimidine H5/H6 assignments in the 1H,
1H TOCSY spectrum
of the Macugen-HBD complex…............................................................…28
Table 3.2 Macugen assignments from the 19
F, 1H HOESY experiment ….................38
Table 3.3 Final Macugen assignments in the Macugen-HBD complex……...….......58
viii
List of Figures
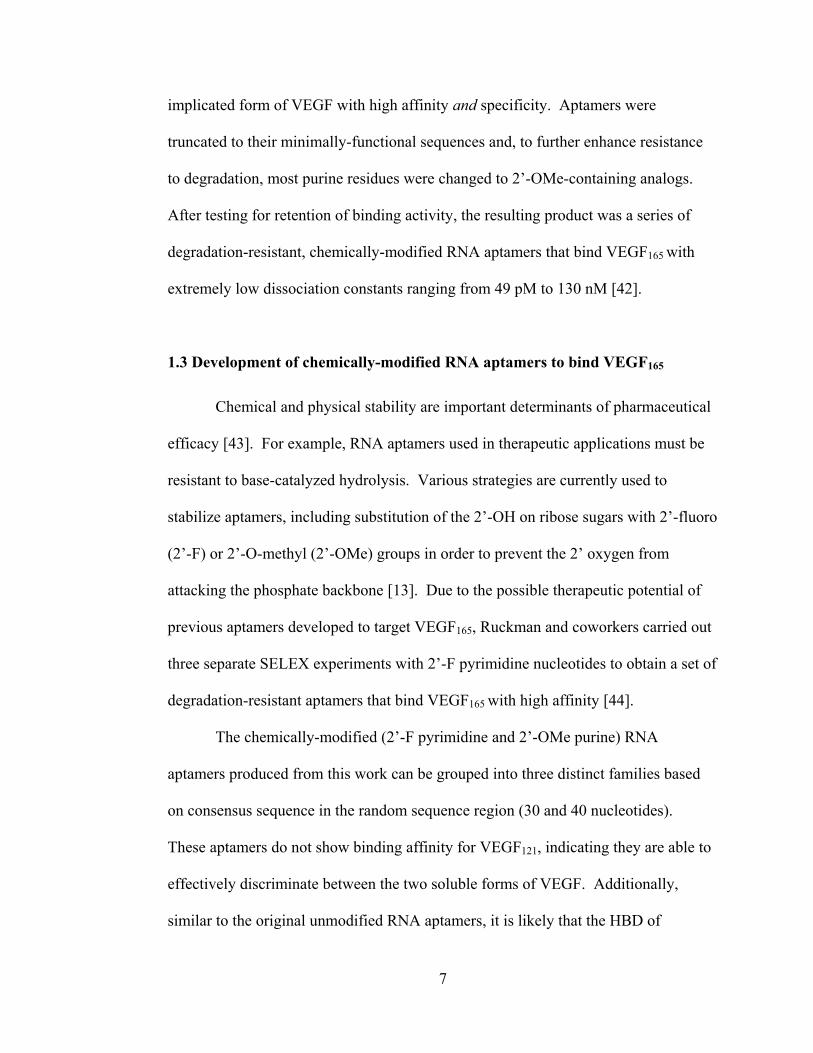
Figure 1.1 Unmodified RNA aptamers selected against VEGF165……….....….…..…6
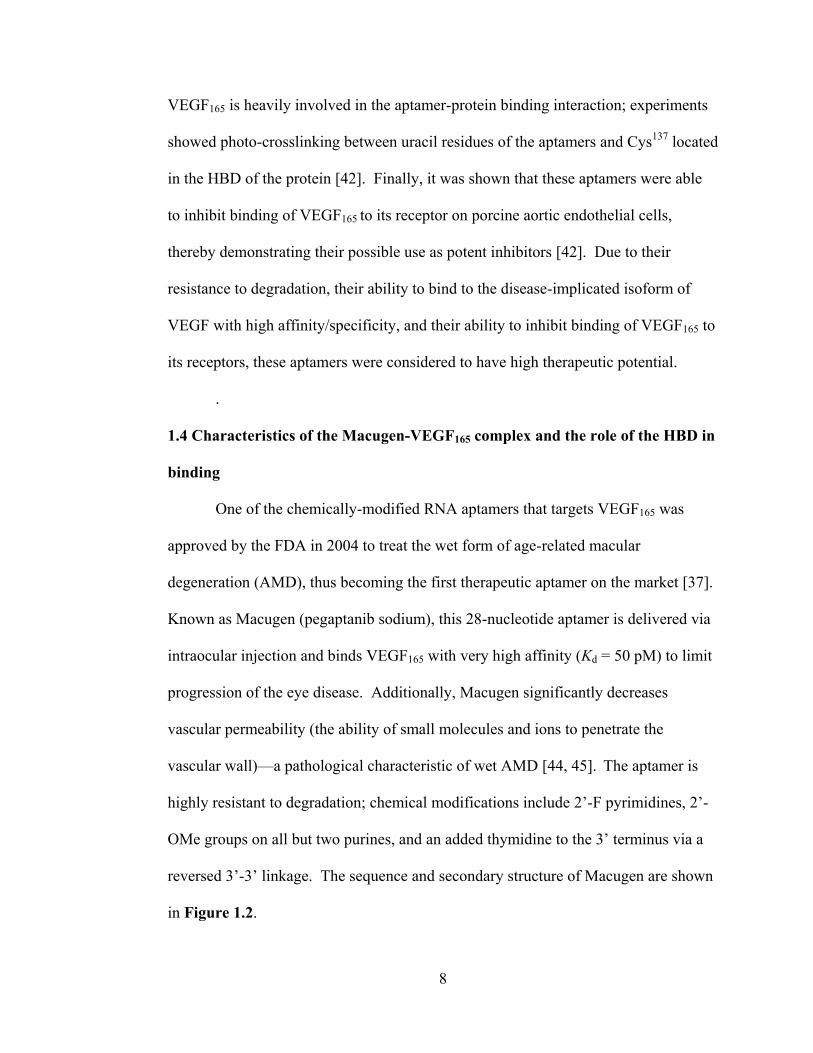
Figure 1.2 The sequence, secondary structure, and chemical modifications of
Macugen.....................................................................................................10
Figure 3.1 2D 1H,
1H TOCSY spectrum of the Macugen-HBD complex expanded
on pyrimidine H5/H6 resonances....………...………………….…....…..27
Figure 3.2 19
F, 1H HMQC collected on the Macugen-HBD complex…….......…......30
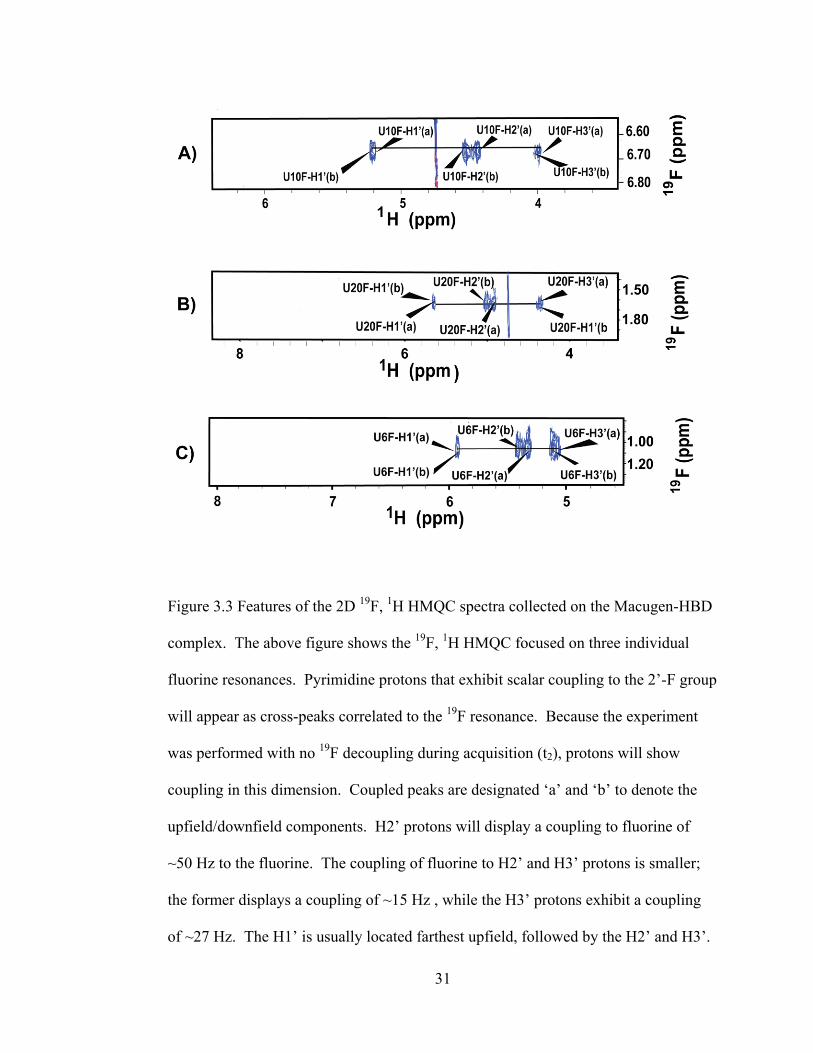
Figure 3.3 Features of the 2D 19
F, 1H HMQC spectra collected on the Macugen-
HBD complex…………....….……..……….…...........................….…….31
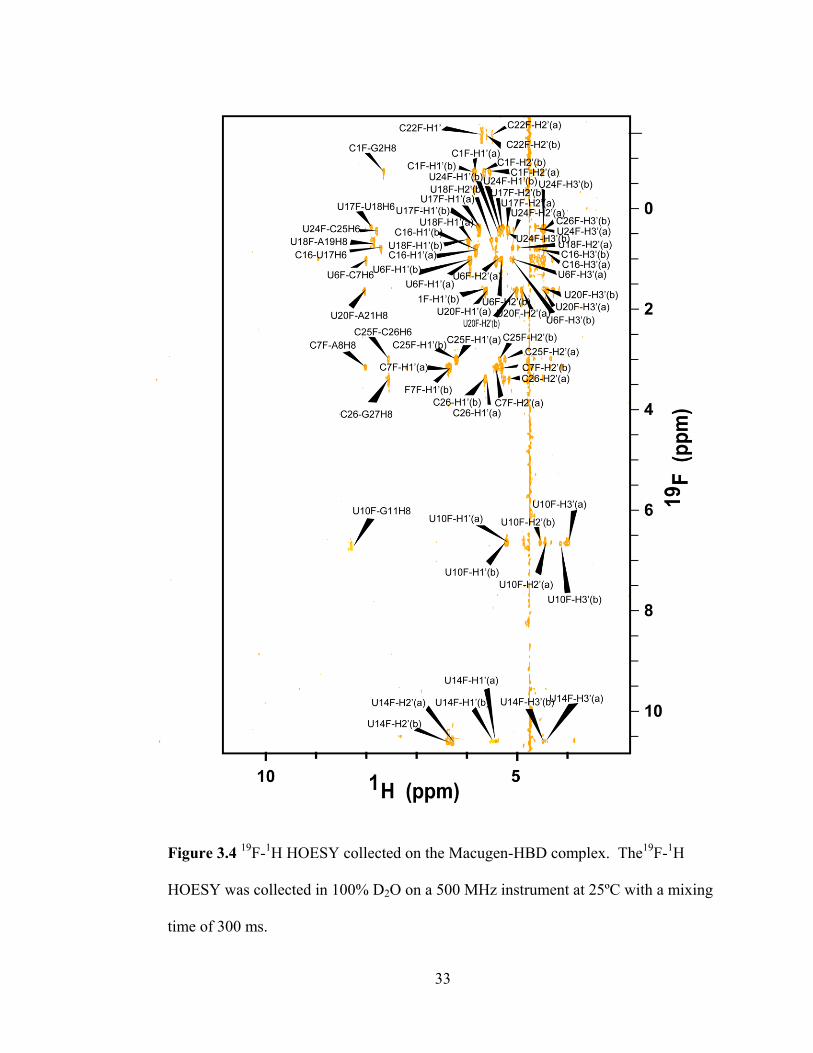
Figure 3.4 19
F, 1H HOESY collected on the Macugen-HBD complex….......…….....33
Figure 3.5 Observable Macugen NOEs in the 19
F, 1H HOESY spectrum…....……...35
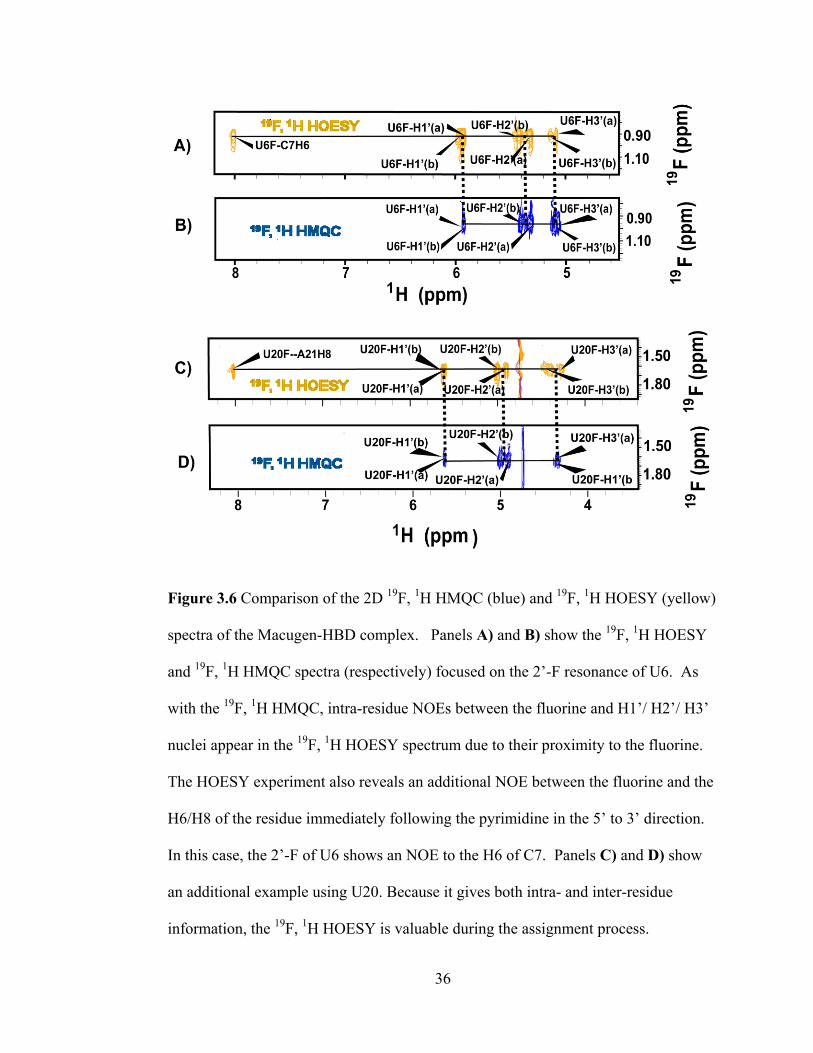
Figure 3.6 Comparison of 2D 19
F, 1H HMQC and
19F,
1H HOESY spectra of the
Macugen-HBD complex…...……………………….................….....……36
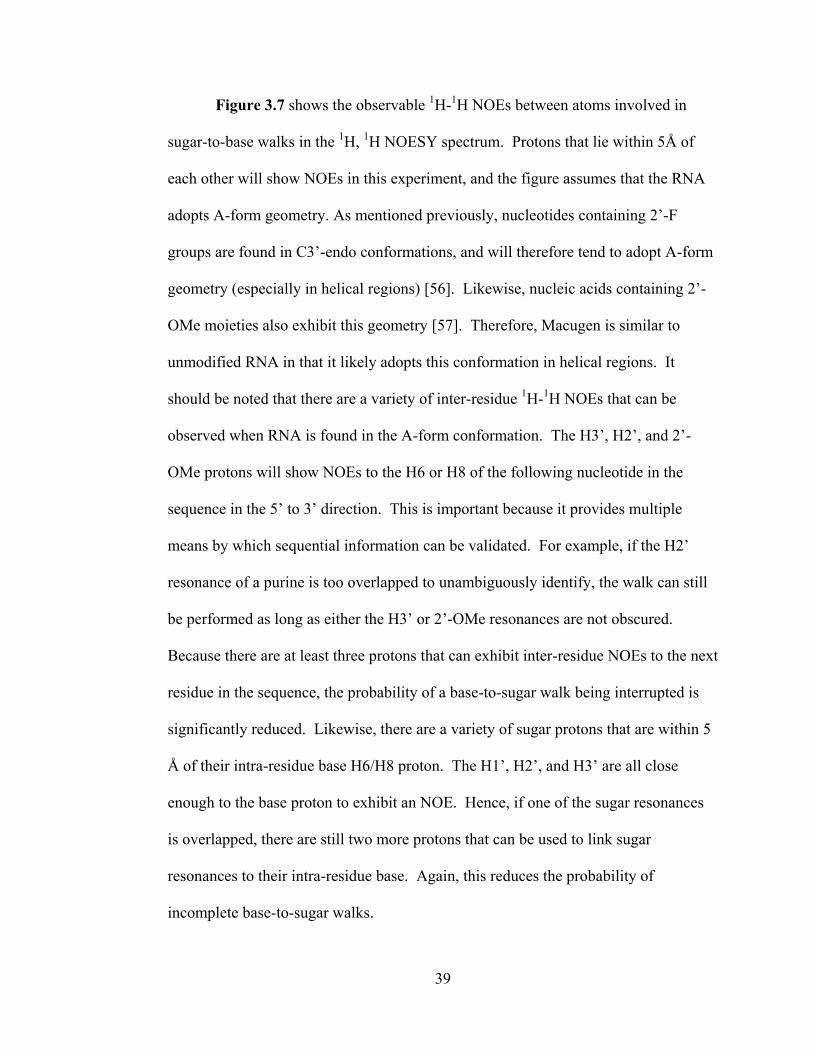
Figure 3.7 Observable 1H-
1H NOEs between atoms involved in sugar-to-base
walk in the1H,
1H NOESY spectrum…....……………………...…..……40
Figure 3.8 Intra-/inter-residue distances between base protons (H6 or H8) and
H1‘/H2‘ atoms in A-form RNA……………....………………………..…42
Figure 3.9 Intra-/inter-residue distances between base protons (H6 or H8) and
H3‘/2‘-OMe groups in A-form RNA…………...……………….….….…43
Figure 3.10 Spectral overlay of 2D 1H,
1H TOCSY onto
1H,
1H NOESY in the
sugar-to-base region for the Macugen-HBD complex………......…….….45
(CONTINUED)

ix
Figure 3.11 Combined use of 2D 19
F, 1H HMQC,
19F,
1H,
1HOESY ,
1H,
1H
NOESY, and 1H,
1H TOCSY collected on the Macugen-HBD
complex to correlate pyrimidine sugar resonances with intra-
residue base protons.............………....………………..…………......46
Figure 3.12 Another example of combined use of 2D 19
F, 1H HMQC,
19F,
1H,
HOESY , 1H,
1H NOESY, and
1H,
1H TOCSY collected on the
Macugen-HBD complex to correlate sugar resonances with intra-
residue base protons………...…..………………...............……...…..47
Figure 3.13 Inter-residue NOEs between G27 and dT28….……………….....……..50
Figure 3.14 Use of inter-nucleotide 1H-
1H NOEs to establish pyrimidine-
pyrimidine connectivities……………….....……………………….......52
Figure 3.15 Establishing pyrimidine-purine and purine-purine connectivities
through sequential NOEs……………....................................................54
Figure 3.16 Diagram of observed intra-molecular Macugen 1H-
1H and
1H-
19F
NOEs in the Macugen-HBD complex...…………..……….....………..57

1
CHAPTER 1
Background and Introduction
1.1 Introduction to aptamers and the SELEX process
Aptamers consist of RNA or DNA molecules that are produced in vitro with
the purpose of binding a specific target or catalyzing a certain reaction [1-3]. For
instance, there currently exist aptamers that bind a variety of biomolecules such as
proteins, viruses, nucleic acids, aminoglycosides, vitamins, cofactors, and even whole
tissues via cell-surface protein recognition [1, 4-6]. Additionally, aptamers have also
been developed to bind an assortment of synthetic molecules, including drugs and
organic dyes [7-9]. Like antibodies, aptamers have been shown to bind targets with
remarkable affinity and specificity [7, 9, 10]. Importantly, many aptamers have also
been produced to catalyze specific chemical reactions, such as the hydrolysis and
isomerization of small molecules [3, 11]. Thus, aptamers have potential for use in a
wide array of applications, including biosensing, therapeutics, bioanalytical
chemistry, and tools for the biotechnology industry [12-15].
The process by which aptamers are produced in vitro is known as Systematic
Evolution of Ligands by EXponential Enrichment, or SELEX. Functional RNA or
DNA molecules are obtained by first constructing large libraries of unique nucleic
acids (up to 1014
) containing regions of random sequence, and by then applying
selective pressures to isolate species within the library that are capable of binding a
ligand [1, 2]. For example, a large pool of randomized nucleic acids may be
incubated with a target protein ligand and then subjected to partitioning procedures
2
that sequester sequences that exhibit binding affinity to the protein [9]. The isolated
species are subsequently amplified and subjected to further rounds of selection,
resulting in an enriched fraction of nucleic acids from the original pool that are able
to bind a specific target with considerable affinity. If desired, the SELEX experiment
can be designed to produce species capable of catalyzing specific reactions (rather
than solely binding a target) [16].
The basis for the discrimination and affinity that aptamers display for ligands
has been a topic of great interest [17-19]. For example, considerable work has been
done to understand the binding mechanisms involved in complex formation. It has
been shown that many aptamers do not adopt rigid conformations prior to ligand
binding [20]. Rather, these complexes appear to form via induced-fit mechanisms, or
so-called conformational capture [19-22]. Importantly, this adaptive recognition
process closely parallels the mechanism by which many natural RNA molecules (and
enzymes) bind in vivo targets with high affinity and specificity, although it has been
proposed that aptamers selected purely for high affinity don‘t necessarily carry the
ability to completely discriminate between very closely-related targets [17, 18, 20,
21]. Utilizing high affinity and specificity as selective pressures in SELEX
experiments may be necessary to achieve high affinity/specificity for some aptamer-
ligand systems [18].
Also of interest are the types of molecular interactions that give rise to the
high affinity and specificity observed in aptamer-ligand complexes. Accordingly, a
variety of aptamer-ligand structures have been solved in order to elucidate these
interactions [4, 6, 22-26]. Features common to aptamer-ligand complexes include

3
shape/charge complementarity between aptamer/ligand binding surfaces, specific
hydrogen bonding networks, and unique aromatic stacking [8, 19]. It has also been
found that aptamers tend to fold around and enclose large areas of the ligand, thereby
allowing a significant number of specific intramolecular contacts to be made [19].
Interestingly, several novel RNA//DNA folds have been discovered by studying
aptamer-ligand complexes [24, 27]. The emergence of additional aptamer-ligand
structures continues to promote understanding of the molecular mechanisms by which
these nucleic acids bind to such diverse ligands with high specificity and affinity.
Indeed, it is a long-term goal of this project to understand the molecular basis for one
such complex by examining its structure.
1.2 Vascular Endothelial Growth Factor (VEGF) as a SELEX target
Vascular endothelial growth factor (VEGF) is a hypoxia-inducible angiogenic
growth factor which plays a vital role in many physiological processes [28]. Cells
deficient in oxygen express hypoxia-inducible factor (HIF), a transcription factor,
which stimulates the production and extracellular release of VEGF [29]. VEGF, a 45
kDa homodimer, binds to its receptors on the surface of vascular endothelial cells,
leading to phosphorylation of the receptors and a subsequent signaling pathway that
promotes nascent blood vessel growth [28, 30]. VEGF is a vital component of many
physiologically-important processes, including regular maintenance of the
vasculature, embryogenesis, and wound healing [31, 32]. However, in addition to its
normal functions, VEGF has also been widely implicated in a number of pathological
4
processes including inflammation, rheumatoid arthritis, cancer, and the wet form of
age-related macular degeneration (AMD) [33, 34].
In humans, four predominant VEGF splice-variants have been identified and
are designated according to their number of amino acids: VEGF121, VEGF165,
VEGF189, and VEGF206 [28]. All variants contain an identical N-terminal receptor
binding domain (RBD), though they are otherwise unique in their structural make-up
and functionality [28, 31]. VEGF189 and VEGF206 are almost exclusively segregated
to the extracellular matrix, whereas VEGF121 and VEGF165 are soluble and can
diffuse once exported. In addition, VEGF165 contains a unique 55-amino acid
heparin-binding domain (HBD) found at the C-terminus that is not present in the
other soluble variant, VEGF121 [35, 36]. Notably, VEGF165 has been identified as the
primary isoform implicated in disease [28].
Due to its prominent role in pathological conditions, VEGF has been
identified as a significant therapeutic target [37, 38]. One historical challenge to
designing VEGF inhibitors is that it is difficult to specifically target the disease-
implicated isoform (VEGF165) [39]. As stated previously, all VEGF variants contain
a receptor binding domain (RBD), and one of the first inhibitors developed against
VEGF was the soluble form of the VEGF receptor [40]. While limiting or possibly
halting the progression of disease, it is unknown whether species that therapeutically
target VEGF via the RBD may also negatively affect blood vessel formation during
normal, healthy processes since all isoforms contain this moiety [39]. Several
successful and clinically-effective agents have been produced that target all VEGF
variants indiscriminately, although development of inhibitors that bind only VEGF165

5
remains desirable [39, 41]. Importantly, because SELEX can produce species capable
of binding a ligand with high affinity and specificity, this method was viewed as a
fitting candidate for developing therapeutic agents that can effectively bind and
discriminate between various isoforms of a protein such as VEGF.
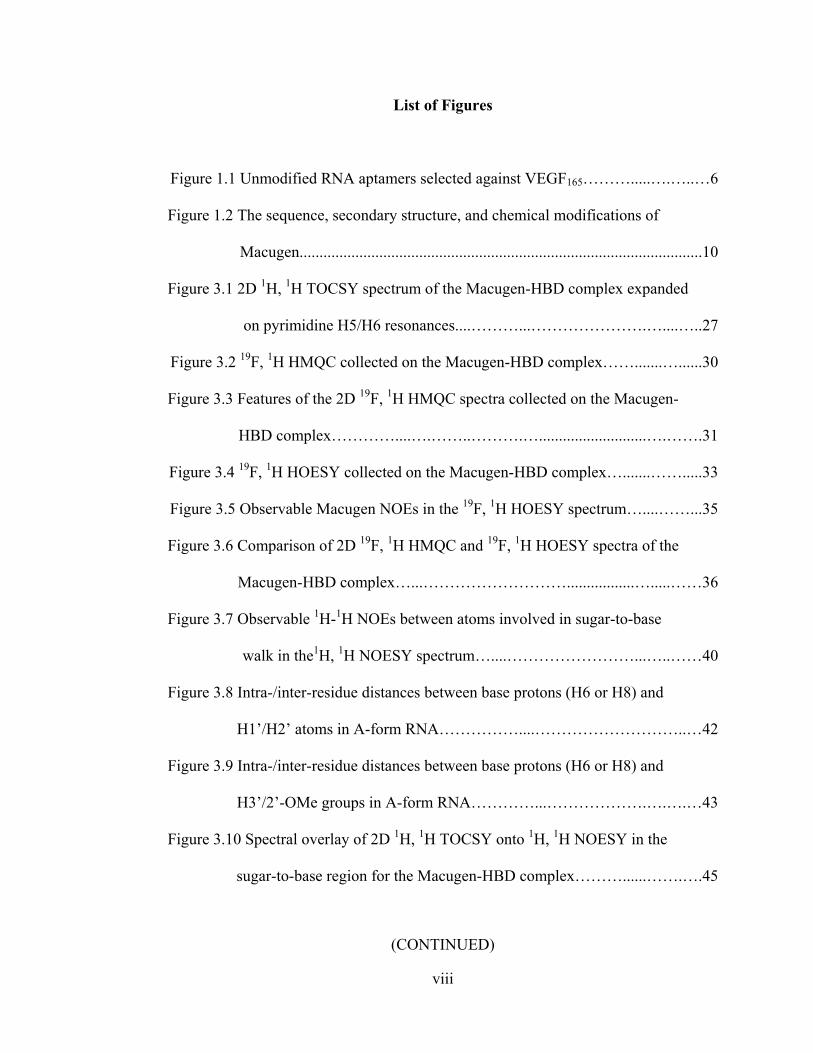
To this end, the SELEX process was employed by Jellinek and coworkers in
the mid-nineties to develop nucleic acid aptamers that bind the 165-amino acid VEGF
isoform [42]. The aptamers that were obtained from this original SELEX experiment
were enriched from a library of 1014
unique RNA molecules, each containing a region
of 30 randomized nucleotides (the evolved region). Aptamers were obtained that
bound VEGF165 with high affinities ranging from 0.2 nM to 20 nM, and can be
categorized into six main families based on consensus in sequence in the randomized
region. The aptamers from this experiment are shown in Figure 1.1.
Importantly, it was found that heparin effectively competes with these
aptamers for VEGF165 binding, suggesting that these nucleic acids may interact with
the heparin binding domain (HBD) of the protein (a unique component found in
VEGF165 that is not present in the other soluble isoform, VEGF121) [28, 42].
Therefore, it is likely that these aptamers possess the ability to discriminate between
the soluble isoforms of VEGF—a beneficial property that other inhibitors to the
growth factor did not previously exhibit at the time [39, 41]. In addition, the enriched
nucleic acids were shown to effectively inhibit binding of VEGF165 to its receptors on
human umbilical vein endothelial cells in a concentration-dependent manner [42].
Hence, this work provided robust evidence that the SELEX process could potentially
be employed to produce therapeutically-active species that target the disease-
6
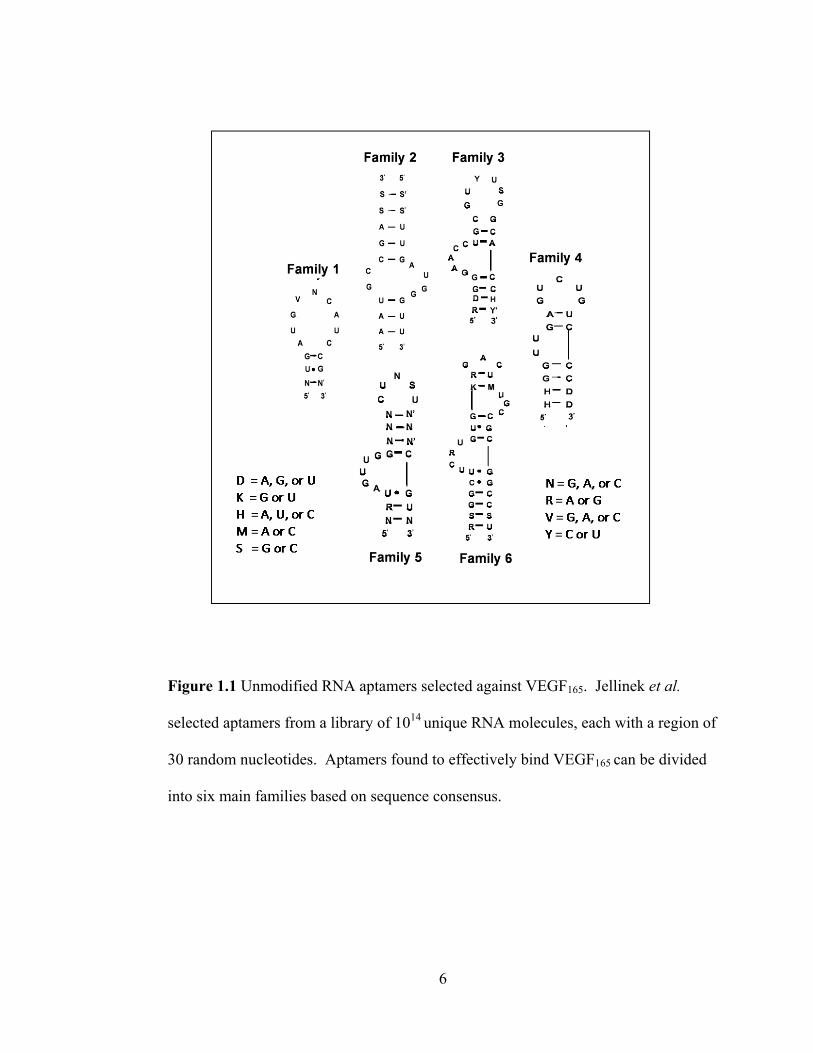
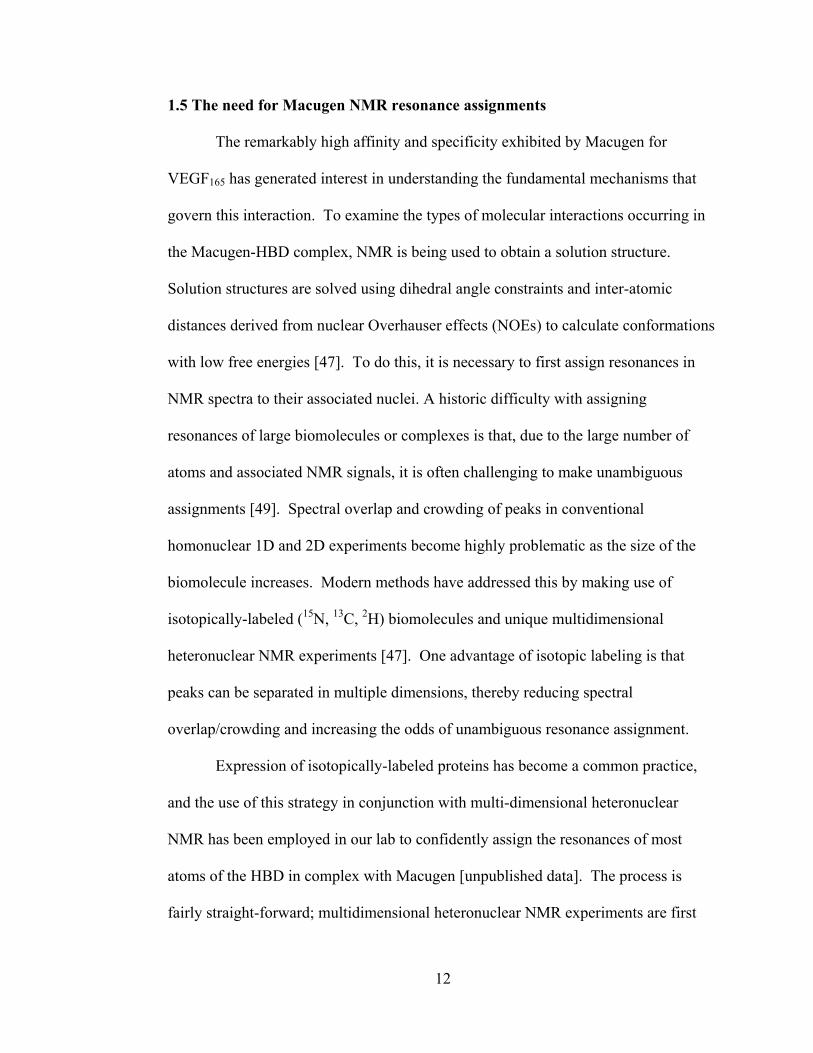
Figure 1.1 Unmodified RNA aptamers selected against VEGF165. Jellinek et al.
selected aptamers from a library of 1014
unique RNA molecules, each with a region of
30 random nucleotides. Aptamers found to effectively bind VEGF165 can be divided
into six main families based on sequence consensus.
7
implicated form of VEGF with high affinity and specificity. Aptamers were
truncated to their minimally-functional sequences and, to further enhance resistance
to degradation, most purine residues were changed to 2‘-OMe-containing analogs.
After testing for retention of binding activity, the resulting product was a series of
degradation-resistant, chemically-modified RNA aptamers that bind VEGF165 with
extremely low dissociation constants ranging from 49 pM to 130 nM [42].
1.3 Development of chemically-modified RNA aptamers to bind VEGF165
Chemical and physical stability are important determinants of pharmaceutical
efficacy [43]. For example, RNA aptamers used in therapeutic applications must be
resistant to base-catalyzed hydrolysis. Various strategies are currently used to
stabilize aptamers, including substitution of the 2‘-OH on ribose sugars with 2‘-fluoro
(2‘-F) or 2‘-O-methyl (2‘-OMe) groups in order to prevent the 2‘ oxygen from
attacking the phosphate backbone [13]. Due to the possible therapeutic potential of
previous aptamers developed to target VEGF165, Ruckman and coworkers carried out
three separate SELEX experiments with 2‘-F pyrimidine nucleotides to obtain a set of
degradation-resistant aptamers that bind VEGF165 with high affinity [44].
The chemically-modified (2‘-F pyrimidine and 2‘-OMe purine) RNA
aptamers produced from this work can be grouped into three distinct families based
on consensus sequence in the random sequence region (30 and 40 nucleotides).
These aptamers do not show binding affinity for VEGF121, indicating they are able to
effectively discriminate between the two soluble forms of VEGF. Additionally,
similar to the original unmodified RNA aptamers, it is likely that the HBD of
8
VEGF165 is heavily involved in the aptamer-protein binding interaction; experiments
showed photo-crosslinking between uracil residues of the aptamers and Cys137
located
in the HBD of the protein [42]. Finally, it was shown that these aptamers were able
to inhibit binding of VEGF165 to its receptor on porcine aortic endothelial cells,
thereby demonstrating their possible use as potent inhibitors [42]. Due to their
resistance to degradation, their ability to bind to the disease-implicated isoform of
VEGF with high affinity/specificity, and their ability to inhibit binding of VEGF165 to
its receptors, these aptamers were considered to have high therapeutic potential.
.
1.4 Characteristics of the Macugen-VEGF165 complex and the role of the HBD in
binding
One of the chemically-modified RNA aptamers that targets VEGF165 was
approved by the FDA in 2004 to treat the wet form of age-related macular
degeneration (AMD), thus becoming the first therapeutic aptamer on the market [37].
Known as Macugen (pegaptanib sodium), this 28-nucleotide aptamer is delivered via
intraocular injection and binds VEGF165 with very high affinity (Kd = 50 pM) to limit
progression of the eye disease. Additionally, Macugen significantly decreases
vascular permeability (the ability of small molecules and ions to penetrate the
vascular wall)—a pathological characteristic of wet AMD [44, 45]. The aptamer is
highly resistant to degradation; chemical modifications include 2‘-F pyrimidines, 2‘-
OMe groups on all but two purines, and an added thymidine to the 3‘ terminus via a
reversed 3‘-3‘ linkage. The sequence and secondary structure of Macugen are shown
in Figure 1.2.

9
Work has been done to show that Macugen specifically targets the 55-amino
acid HBD of VEGF165—an N-terminal domain that is not present in VEGF121, the
other soluble form of the growth factor [45]. The ability of Macugen to bind the HBD
likely gives rise to its ability to discriminate between the two soluble isoforms to
directly target the disease-implicated variant. As mentioned previously, Macugen
demonstrated photo-crosslinking between 5–iodo-modified U14 in the hairpin loop
and Cys137
of the HBD [44]. Additionally, in vivo experiments have shown that free
HBD can efficiently compete with the full-length protein for aptamer binding, thus
providing further evidence that this domain is targeted by Macugen [45].
Furthermore, studies have determined that the majority of the binding energy comes
from interactions between Macugen and the HBD; the aptamer binds free HBD with a
dissociation constant of 12 nM (∆Gº = -10.8 kcal/mol), compared to a Kd of 50 pM
(∆Gº = -14.0 kcal/mol) for the full-length protein [45].
Nuclear magnetic resonance (NMR) methods have also been employed to
confirm that the HBD is primarily targeted in the Macugen-VEGF165 interaction.
Chemical shifts of protein backbone amides can be monitored via 15
N -
1H
correlation
experiments (15
N, 1H
HSQC) to observe different folding patterns or changes in the
local chemical environment—common occurrences in complex formation [46, 47].
15N,
1H HSQC experiments have shown that the chemical shifts of many backbone
amide residues in the HBD are significantly perturbed upon binding to Macugen,
indicating that there are direct interactions between the HBD and aptamer [45].
10
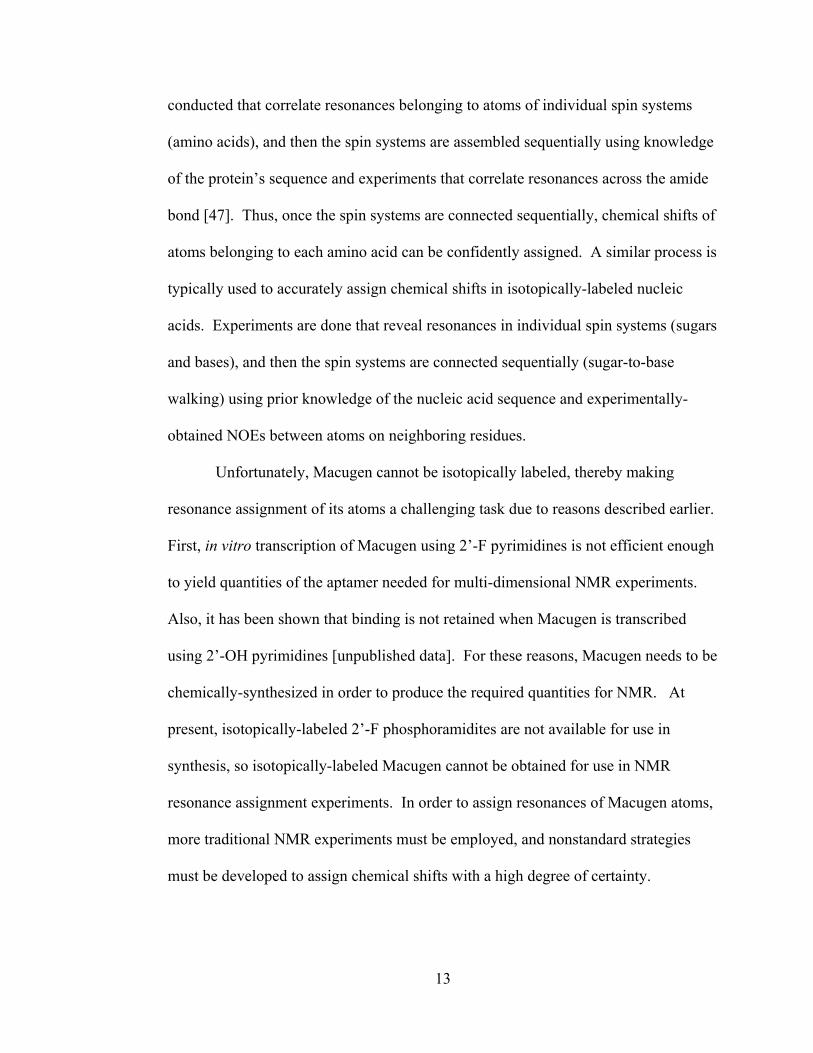
Figure 1.2 The sequence, secondary structure, and chemical modifications of
Macugen. This 28-nt, chemically-modified RNA was obtained through SELEX and
was found to effectively inhibit angiogenesis by targeting the heparin binding domain
(HBD) of VEGF165. Except for A4 and A5, all purines contain 2‘-O-methyl (2‘-
OMe) modifications for increased stability and nuclease resistance. All pyrimidines
contain a 2‘-fluoro (2‘-F) moiety. U14 was found to form a crosslink with Cys137
of
VEGF165. The 3‘ terminus of the aptamer contains a deoxythymidine (dT28)
reverse-linked (3‘—3‘) to G27 to protect against exonuclease activity.
BULGE
11
Equally important, the unique 15
N, 1H HSQC fingerprint of free HBD bound to
Macugen is also seen in the 15
N, 1H HSQC spectrum of the full-length protein bound
to the aptamer, demonstrating that the HBD adopts the same conformation in both the
Macugen-HBD and Macugen-VEGF165 complexes [45].
NMR studies have also shown that Macugen adopts the same conformation
when bound to either full-length VEGF165 or the HBD alone [45]. 1D imino proton
spectra of the HBD- and full-length-bound complexes are extremely similar,
suggesting that the nucleic acid‘s secondary structure is equivalent in the complexes
[45]. Additionally, 31
P NMR can be used as a sensitive probe for detecting even
slight conformational differences in ribose-phosphate backbones of nucleic acids
[48]. 1D 31
P NMR spectra of Macugen complexed with both the HBD and the full-
length VEGF165 are essentially identical, providing further evidence that Macugen
conformation is the same in these complexes [45]. Notably, Ca2+
is a required
component for Macugen-VEGF165 binding, and this dependence has also been
observed for Macugen-HBD complex formation [44, 45]. However, the presence of
Ca2+
does not affect NMR spectra of either free species (Macugen or HBD),
suggesting that this divalent cation is mediating an interaction between the aptamer
and HBD [45]. The above work provides solid evidence that the HBD is specifically
targeted by Macugen, and that this domain can be used for further studies in order to
understand the binding mechanisms/interactions of the aptamer with its protein
ligand.
12
1.5 The need for Macugen NMR resonance assignments
The remarkably high affinity and specificity exhibited by Macugen for
VEGF165 has generated interest in understanding the fundamental mechanisms that
govern this interaction. To examine the types of molecular interactions occurring in
the Macugen-HBD complex, NMR is being used to obtain a solution structure.
Solution structures are solved using dihedral angle constraints and inter-atomic
distances derived from nuclear Overhauser effects (NOEs) to calculate conformations
with low free energies [47]. To do this, it is necessary to first assign resonances in
NMR spectra to their associated nuclei. A historic difficulty with assigning
resonances of large biomolecules or complexes is that, due to the large number of
atoms and associated NMR signals, it is often challenging to make unambiguous
assignments [49]. Spectral overlap and crowding of peaks in conventional
homonuclear 1D and 2D experiments become highly problematic as the size of the
biomolecule increases. Modern methods have addressed this by making use of
isotopically-labeled (15
N, 13
C, 2H) biomolecules and unique multidimensional
heteronuclear NMR experiments [47]. One advantage of isotopic labeling is that
peaks can be separated in multiple dimensions, thereby reducing spectral
overlap/crowding and increasing the odds of unambiguous resonance assignment.
Expression of isotopically-labeled proteins has become a common practice,
and the use of this strategy in conjunction with multi-dimensional heteronuclear
NMR has been employed in our lab to confidently assign the resonances of most
atoms of the HBD in complex with Macugen [unpublished data]. The process is
fairly straight-forward; multidimensional heteronuclear NMR experiments are first
13
conducted that correlate resonances belonging to atoms of individual spin systems
(amino acids), and then the spin systems are assembled sequentially using knowledge
of the protein‘s sequence and experiments that correlate resonances across the amide
bond [47]. Thus, once the spin systems are connected sequentially, chemical shifts of
atoms belonging to each amino acid can be confidently assigned. A similar process is
typically used to accurately assign chemical shifts in isotopically-labeled nucleic
acids. Experiments are done that reveal resonances in individual spin systems (sugars
and bases), and then the spin systems are connected sequentially (sugar-to-base
walking) using prior knowledge of the nucleic acid sequence and experimentally-
obtained NOEs between atoms on neighboring residues.
Unfortunately, Macugen cannot be isotopically labeled, thereby making
resonance assignment of its atoms a challenging task due to reasons described earlier.
First, in vitro transcription of Macugen using 2‘-F pyrimidines is not efficient enough
to yield quantities of the aptamer needed for multi-dimensional NMR experiments.
Also, it has been shown that binding is not retained when Macugen is transcribed
using 2‘-OH pyrimidines [unpublished data]. For these reasons, Macugen needs to be
chemically-synthesized in order to produce the required quantities for NMR. At
present, isotopically-labeled 2‘-F phosphoramidites are not available for use in
synthesis, so isotopically-labeled Macugen cannot be obtained for use in NMR
resonance assignment experiments. In order to assign resonances of Macugen atoms,
more traditional NMR experiments must be employed, and nonstandard strategies
must be developed to assign chemical shifts with a high degree of certainty.
14
1.6 Project description and overview of thesis
The long-term goal of this project is to understand the types of molecular
interactions that allow Macugen to specifically target the HBD of VEGF165 with
extremely high affinity and specificity. To this end, work is being done to obtain a
solution structure of the Macugen-HBD complex. This thesis specifically addresses
the need for NMR resonance assignments of the bound aptamer with the goal of
obtaining a structure in the future. Assignments used in structure calculation must be
accurate, so a novel approach was devised that used the 2‘-F and 2‘-OMe chemical
modifications to strategically identify resonances. The modifications allow for more
confident assignment of Macugen compared to unmodified RNA of similar size.
15
CHAPTER 2
Methods
2.1 Preparation of HBD of VEGF165 for NMR studies
The 15
N-labeled HBD of VEGF165 was expressed and purified for NMR
experiments in complex with Macugen as described previously [45]. Protein was
expressed in P. Pastoris for a period of 48 hours (slightly differing from the original
protocol which calls for an expression time of 36 hours). Though the 15
N- labeling of
this protein is not necessary for sequential assignment of Macugen, it does allow for
future multidimensional NMR experiments that probe the behavior of the HBD in the
complex. The HBD was purified on a heparin Sepharose column and exchanged into
the following buffer (NMR buffer): 100% D2O, 100 mM NaCl, 10 mM Tris-d11
(pH=7.0), 1 mM CaCl2, 0.01 mM EDTA, and 0.05% NaN3. The protein was
concentrated using Centricon YM-3 centrifugal filter devices to a volume of 310 µL,
and the concentration was found to be 1 mM from a BCA assay.
2.2 Preparation of the Macugen-HBD complex for NMR studies
Non-pegylated Macugen was obtained from NeXstar pharmaceuticals. The
amount of aptamer necessary for producing a 0.95 mM NMR sample (at a volume of
310 µL) was aliquoted and buffer-exchanged into D2O (pH=7.0). After buffer
exchange, the aptamer was lyophilized and subsequently dissolved into the HBD
sample to form the complex. It is important to note that NMR studies conducted to
sequentially assign Macugen should optimally be performed in a slight excess of
16
HBD (as opposed to a 1:1 ratio). This excess helps to ensure that all Macugen is in
complex with HBD, and that signals obtained in NMR studies can confidently be
attributed to the bound form. The concentration of HBD in the experiments was 1
mM, thus Macugen was chosen to be at a concentration of 0.95 mM. To ensure that
all aptamer was bound, a 2D 1H,
1H TOCSY spectrum of this complex was obtained
and then compared to spectra previously acquired for free Macugen. No H5/H6
peaks arising from the free aptamer were seen in the prepared complex meaning all
aptamer was bound. Additionally, the TOCSY spectrum was compared to that of a
previously-prepared Macugen-HBD complex, and they were found to be identical.
Therefore, it was determined that the NMR sample was sufficient for assignment
studies.
2.3 Acquisition of a 2D 1H,
1H TOCSY spectrum to identify pyrimidine H5/H6
resonances in the Macugen-HBD complex
A 1H,
1H TOCSY spectrum was first collected to obtain H5/H6 resonances of
Macugen 2‘-F pyrimidines [50]. The experiment was performed at 25ºC on a 500
MHz Varian spectrometer using a 1H/
13C/
15N triple resonance probe with z-axis
pulsed field gradients. The sequence was run with a 48 ms mixing time (achieved by
using 24 MLEV-17 cycles with a 30 µs spinlock time), and a 32-step z-filter phase
cycle was applied to remove zero quantum peaks [27]. 2048 complex points were
taken in t2, and 195 complex points in t1. The sweep-width was set to 5006 Hz in
both dimensions. The data was processed using NMRPipe, and cosine bell window
functions were applied in each dimension. Cross-peaks corresponding to pyrimidine
17
H5/H6 resonances were located and temporarily given arbitrary designations until
they were assigned to specific pyrimidines.
2.4 Acquisition of a 2D 19
F, 1H HMQC to identify pyrimidine H1’, H2’, H3’ and
2’-F resonances in the Macugen-HBD complex
A unique property of Macugen that makes assignment easer compared to
unlabeled RNA of similar size is its chemical modifications. Fluorine is an NMR-
active nucleus, so experiments can be employed that use this nucleus to aid in
resonance assignment. One way in which this group can be exploited is to perform
through-bond heteronuclear correlation experiments to obtain assignments for
individual spin systems (i.e. sugars) [51]. A 2D 19
F, 1H HMQC was acquired to
identify chemical shifts of pyrimidine sugar protons (H1‘, H2‘, and H3‘) correlated to
the 2‘ fluorine resonance. The experiment was conducted at 25ºC on a 500 MHz
Varian spectrometer using a 19
F/1H probe, and
19F decoupling was not used during
acquisition (t2). For this experiment, 2048 complex points were collected in t2, and
106 complex points were acquired in t1. A sweep width of 5006 Hz was used for both
dimensions. The spectrum was processed using NMRPipe, and a cosine bell window
function was applied in each dimension. H1‘, H2‘, and H3‘ chemical shifts were
identified based on their location in the spectra and their observed couplings.
Resonances were given temporary designations until permanently assigned.

18
2.5 Acquisition of a 2D 19
F, 1H HOESY on the Macugen-HBD complex to
identify H1’, H2’, H3’ resonances and obtain sequence-specific information
2D 19
F, 1H heteronuclear Overhauser effect spectroscopy (HOESY) was
employed to compliment/confirm the information obtained from the 19
F, 1H HMQC,
and it was also used to identify the chemical shift of the H6 or H8 of nucleotides
directly following pyrimidines in the 5‘ to 3‘ direction in the sequence [52]. A 2D
19F,
1H HOESY was performed at 25ºC on a 500 MHz Varian spectrometer using a
19F/
1H probe and a mixing time of 300 ms. No
19F decoupling was applied during t2
(acquisition). The experiment was collected with 352 scans per increment, 160
complex data points in t1, and 4096 complex points in t2. A sweep width of 7400 Hz
was chosen for t1, while the sweep width for t2 was set to 6000 Hz. Using NMRPipe
for processing, baseline correction was achieved by polynomial time-domain solvent
subtraction. Furthermore, an exponential window function with a line broadening of
5 Hz was applied in the proton dimension while a cosine squared window function
was used for the fluorine dimension. The spectrum was compared to the 19
F, 1H
HMQC in order to validate the information obtained from that experiment, and it was
also used to locate chemical shifts of H6/H8 protons belonging to residues following
pyrimidines in the sequence.
2.6 Collection of a 2D 1H,
1H NOESY in D2O on the Macugen-HBD Complex to
make sequential assignments
A 2D 1H,
1H NOESY was acquired at 25ºC in 100% D2O. The spectrum was
acquired on an 800 MHz instrument equipped with a 1H/
13C/
15N triple resonance cold

19
probe with z-axis pulsed field gradients [53]. A 200 ms mixing time was utilized, and
water suppression was achieved through presaturation. NOESY data was collected
with 80 scans per increment, 400 complex points in the t1 dimension, and 4096
complex points in the t2 dimension. The spectral width was set to 10000 Hz in the t1
dimension and 12019 Hz in the t2 dimension. The data was processed with
NMRPipe. Baseline correction was achieved with polynomial time-domain solvent
subtraction, and a cosine bell window function was applied in each dimension.
Pyrimidine H6-H5 NOEs were identified by their direct overlap with H6-H5 TOCSY
cross-peaks. This spectrum was then used in conjunction with the 2D 1H,
1H
TOCSY, the 2D 19
F, 1H HMQC, and the 2D
19F,
1H HOESY to examine intra- and
inter-residue NOEs and make sequential assignments.
20
CHAPTER 3
Results and Discussion
3.1 Comparison of traditional assignment strategy for unlabeled nucleic acids
with the Macugen assignment process
The basic strategy for assigning unlabeled RNA consists of two phases. First,
through-bond experiments can be used to identify resonances belonging to individual
spin systems (sugars and bases). Homonuclear correlation experiments such as the
1H,
1H COSY and
1H,
1H TOCSY can be used to identify nucleobase resonances (i.e.
H5/H6) as well as resonances belonging to sugar resonances (H1‘, H2‘, H3‘, etc)
[49]. However, through-bond experiments do not provide enough information to
confidently assign resonances to specific residues in large, unlabeled RNAs [54]. For
example, a resonance may be identified as belonging to an H6 proton, but without the
availability of additional methods, this atom cannot be assigned to its individual
nucleotide in the sequence. Compounding this problem is the fact that it is difficult to
correlate nucleobase protons with their ribose counterparts using scalar techniques
(unless the RNA is double-labeled and multi-dimensional NMR techniques are
utilized). There has been some success with such experiments as the J-scaled COSY
for correlating sugar/base protons, but these experiments are restricted to small
nucleic acids [55].
To overcome these problems, through-space (dipolar) methods can be
employed to examine the specific position of spin systems within the sequence [53].
For example, the 1H,
1H NOESY can produce inter-spin system NOEs that can be
21
used to conduct a base-to-sugar walk. This technique involves following NOEs from
nucleobase protons to the intra-residue sugar H1‘, H2‘, and H3‘ atoms. From the
sugar atoms, inter-residue NOEs can be examined to continue the ‗walk‘ to the base
protons of the following nucleotide in the sequence. As long as there is a known
starting point (or if the identity of a residue within the walk can be confirmed),
sequence-specific assignments can be made with relative ease assuming the walk is
not interrupted. Though NOE-based methods overcome the sequence-specific
assignment problems that scalar techniques possess, they lack the confidence and
straightforward analysis that are central to through-bond methods. 1H,
1H NOESY
spectra of large RNAs often exhibit significant overlap, thereby making it difficult or
even impossible to perform extensive sugar-to-base walks. Additionally, NOESY
spectra are often rather ambiguous; multiple cross-peaks may be seen for the same
resonance [49]. As a result, confident assignment of all resonances is often
impractical. Homonuclear through-bond techniques are often less ambiguous since
they rely on J-couplings between bonded nuclei and because signals do not overlap to
the degree observed in NOESY spectra. Assignment of most large, unlabeled RNAs
relies on significant contributions from both homonuclear scalar methods and
through-space experiments.
Though homonuclear scalar and dipolar methods can be used in combination
to compensate for the individual limitations of each other, the information content of
these experiments is, nevertheless, often inadequate to achieve near-complete
assignment of large, unlabeled molecules with a high degree of certainty. This often
results in attempts to isotopically label the RNA of interest or the use of other

22
techniques to obtain a molecular structure. The situation can become rather
complicated if the RNA of interest is limited in quantity or if it cannot be isotopically
labeled. One example of such an RNA is Macugen, which can only be obtained in
small quantities and in unlabeled form. To assign nucleic acids such as Macugen,
strategies need to be developed to overcome the limitations of traditional
homonuclear NMR methods. Fortunately, Macugen possesses several chemical
modifications which make it more amenable to assignment compared to unmodified
counterparts of similar size. Foremost, 19
F is a spin-1/2 nucleus and is found at 100%
natural abundance, thereby making NMR studies of molecules containing this species
possible [53]. 19
F also displays excellent chemical shift dispersion and is one of the
most NMR-sensitive nuclei, exhibiting a gyromagnetic ratio very close to that of 1H
(the most sensitive) [53]. Because Macugen contains 2‘-F pyrimidines, unique NMR
experiments can be performed that are not otherwise utilized with assignment of
unmodified, unlabeled RNA
While traditional homonuclear scalar correlation experiments (such as the
1H,
1H TOCSY) described previously can still be successfully employed to obtain
valuable information such as H5/H6 resonances, the fluorine modification of
Macugen makes the use of more powerful heteronuclear experiments possible. In
these experiments, the fluorine is essentially acting as an additional dimension by
which resonances can be separated and identified. For example, a 2D 19
F, 1H
heteronuclear multiple quantum coherence (HMQC) spectrum can be used to identify
chemical shifts of pyrimidine sugar protons (H1‘, H2‘, and H3‘). Traditional
strategies used to assign unlabeled RNA may take advantage of a homonuclear 1H,
1H

23
TOCSY to help identify sugar protons. While this type of experiment does takes
advantage of multiple dimensions to ―separate‖ resonances, there are still several
limitation to using this type of experiment with large molecules. For instance, all
protons experiencing 1H-
1H coupling will produce signals, thereby increasing the
chances that spectral overlap will be problematic. Through use of the 19
F, 1H HMQC,
however, only protons that are coupled to fluorine will appear in the spectrum (rather
than all proton-proton coupled resonances). Additionally, the 2‘-F modification
allows pyrimidine sugar resonances to be easily distinguished from those of purines
in scalar experiments. Because Macugen does not contain any purine protons
coupled to fluorine, the signals produced in scalar correlation experiments must
necessarily come from pyrimidines.
The 2‘-F pyrimidine modification carries several other benefits. First, the
fluorine imparts a unique germinal coupling to the H2‘ protons that is absent from
unmodified (2‘-OH) RNA. H2‘ resonances in spectra that are not decoupled will
exhibit a splitting due to this germinal coupling, and they will be separated by ~50
Hz. Geminal coupling is not observed for the H2‘ proton in unmodified RNA because
the oxygen is not an NMR-active species. Furthermore, 2‘-OH proton undergoes
rapid exchange and is not bonded to the oxygen long enough to impart a vicinal
coupling (via the oxygen) to the H2‘. Consequently, the H2‘ of unmodified RNA
experiences only vicinal coupling to the H1‘ and H3‘, and these couplings are rather
small. For example, the JH1‘-H2‘ coupling in unmodified RNA ranges from 1 to 8 Hz
depending on the sugar pucker and associated torsion angle [49]. Thus, the rather
large and distinctive 19
F-1H coupling allows for easier assignment of H2‘ chemical

24
shifts in Macugen. The 2‘ fluorine of pyrimidines will also couple to the H1‘ and H3‘
protons, inducing a larger splitting in these signals than is normally seen. In Macugen
pyrimidines, H3‘ splitting is observed to be about 27 Hz, whereas the H1‘ splitting is
about 15Hz.
Unfortunately, the enhanced information obtained from heteronuclear scalar
experiments utilizing the 2‘-F group is still not sufficient to solve the traditional
problem of assigning resonances to their sequence-specific nucleotides. For instance,
resonances seen in the 19
F, 1H HMQC can be identified as sugar protons, but there is
insufficient information at this point to be able to assign these resonances to their
respective residues in the sequence. Likewise, there is no way to correlate these sugar
resonances with their intra-residue base protons (H5/H6). As with traditional
strategies for assigning unlabeled RNA, through-space (dipolar) techniques must still
be introduced in order to sequentially assign Macugen. Fortunately, the chemical
modifications of Macugen bring unique advantages to the table over traditional
unmodified RNA. First, the 2‘-F modification can be used to acquire a 2D 19
F, 1H
heteronuclear Overhauser effect (HOESY) spectrum. This method identifies
resonances that exhibit an NOE to the 2‘-F of pyrimidines. In other words, this
experiment can provide information about protons that are within ~5.0 Å from the
fluorine group. It is important to note that NMR of unmodified RNA does not
normally make use of the substituent at this position on the ribose; the 2‘-OH proton
in unmodified RNA undergoes rapid solvent exchange, and it is absent in spectra
taken in D2O. The most significant advantage of performing the 19
F, 1H HOESY is
that it can give vital sequential information about the position of a pyrimidine within
25
the sequence. This is because the 2‘-F group will exhibit NOEs to the H6/H8 of the
following residue in the 5‘ to 3‘ direction if the RNA is in A-form conformation (or if
the fluorine is positioned to do so in other conformations). Thus, the 19
F, 1H HOESY
provides inter-residue information about the H6/H8 resonance belonging to the next
nucleotide in the sequence. Though similar information can be obtained from the 2D
1H,
1H NOESY (via H2‘/H3‘ NOEs to the following residue), the
19F,
1H HOESY is
not subject to the severe overlap that the traditional proton-proton NOESY is.
Finally, the 19
F, 1H HOESY can be used to validate the information obtained from the
19F,
1H HMQC since ribose sugar protons (H1‘, H2‘, and H3‘) are in proximity to the
fluorine group.
The 2‘-OMe modification on Macugen purines is also of substantial
importance, and like the 2‘-F, this group has several benefits that make assignment
more amenable than unmodified (and unlabeled) RNA. Information derived from this
modification is extremely valuable due to the fact that this substituent occupies a
position on the ribose that is not normally utilized in NMR experiments (the proton of
2‘-OH is exchangeable). Next, the 2‘-OMe protons lie between 3 and 4 ppm and will
thus show signals in a region of the 1H,
1H NOESY where resonances are not
normally observed with unmodified RNA. Like the 2‘-F, the purine 2‘-OMe protons
can exhibit NOEs to the H6/H8 of neighboring (3‘) residues, thus providing
information regarding the position in the sequence. The 2‘-OMe protons can also
exhibit NOE cross-peaks to the H1‘ and H2‘ sugar protons, thus providing a means to
substantiate these assignments. In addition to looking for NOEs between the sugar
protons and the H8 of purines, NOEs can also be found between said protons and the

26
2‘-OMe group. Finally, Macugen also contains a deoxythymine (dT28) which is
reverse-linked (3‘—3‘) at the 3‘ terminus. Unlike traditional RNA that lacks such a
residue, distinct signals will be seen which can be attributed to dT28. For instance,
the C7 methyl protons of dT28 are found at 1.7 ppm. Because of the unique
heteronuclear experiments that can be performed using the 2‘-F, the special properties
that fluorine imparts (such as the distinct couplings), the advantages of the 2‘-OMe
groups, and the presence of a terminal deoxy residue, a large deal of Macugen
residues were able to be confidently assigned. Importantly, due to these
modifications, Macugen is more amenable to the assignment process than unlabeled,
unmodified RNA molecules of similar size.
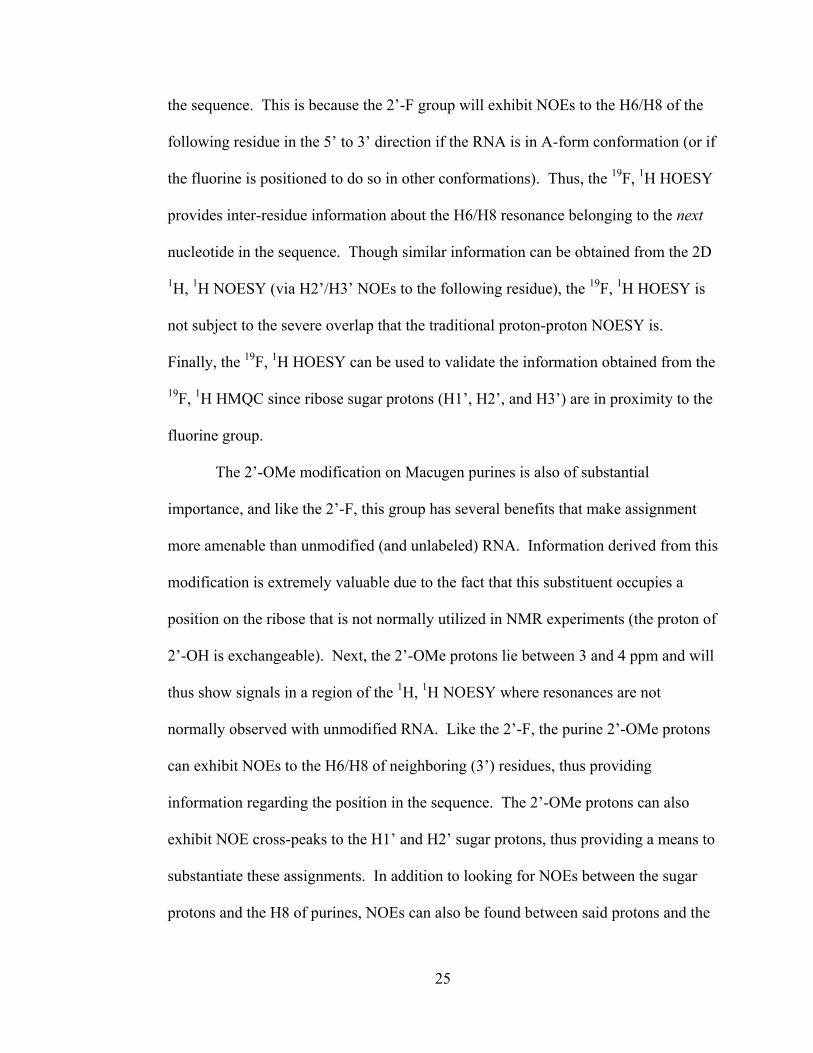
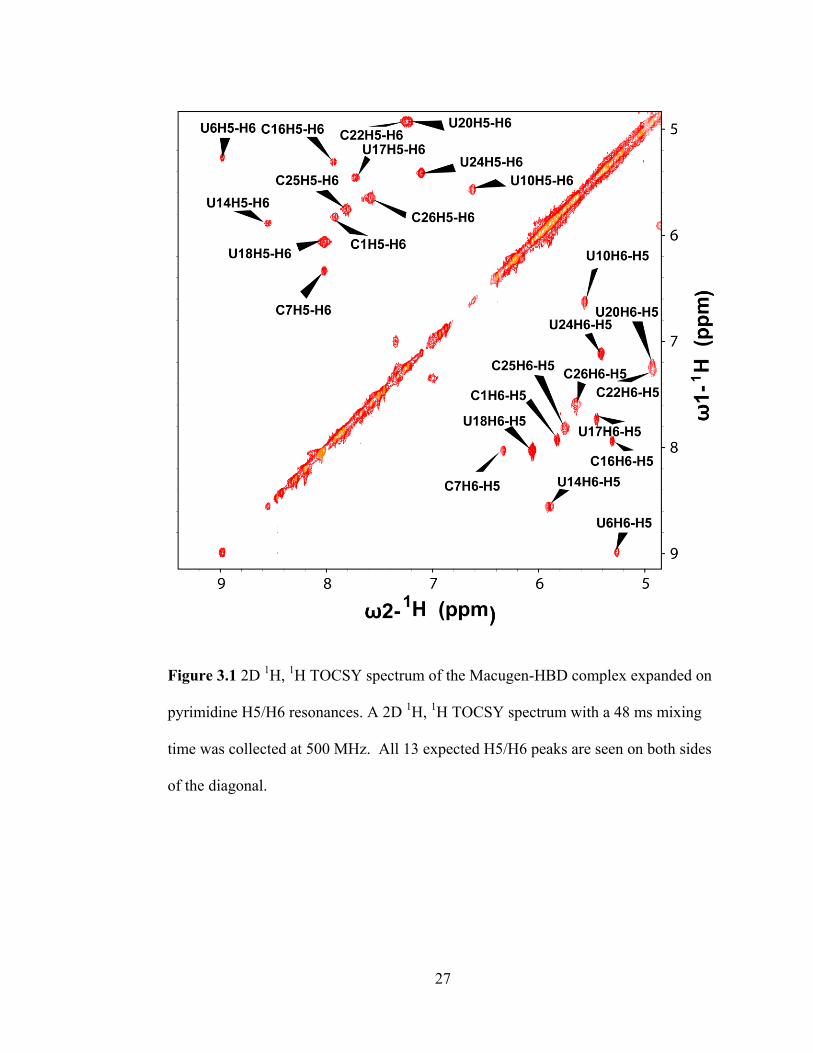
3.2 Identification of pyrimidine H5/H6 resonances from the 2D 1H,
1H TOCSY
A 2D 1H,
1H TOCSY was first collected to identify pyrimidine H5/H6
resonances. This through-bond experiment correlates multiple proton resonances that
are coupled within a spin system. Both C and U exhibit identical spin systems
consisting of the coupled H5 and H6 protons. Figure 3.1 shows the assigned 1H,
1H
TOCSY spectrum collected on the Macugen-HBD complex, and Table 3.1 gives the
chemical shifts for each assignment. The cross-peaks for these resonances are well-
dispersed and occur in a distinct region of the spectrum (~5.0-6.5 ppm for H5 and
~6.5-9.0 ppm for H6), so spectral crowding is not a problem. It should be noted that
purine nucleobase resonances cannot be established with this type of experiment
since there are no coupled protons in these spin systems (the labile imino/amino
protons are not coupled to the carbon-bound protons). Though the pyrimidine H5/H6
27
Figure 3.1 2D 1H,
1H TOCSY spectrum of the Macugen-HBD complex expanded on
pyrimidine H5/H6 resonances. A 2D 1H,
1H TOCSY spectrum with a 48 ms mixing
time was collected at 500 MHz. All 13 expected H5/H6 peaks are seen on both sides
of the diagonal.
28
Table 3.1 Final pyrimidine H5/H6 assignments in the 1H-
1H TOCSY spectrum of the
Macugen-HBD complex.
29
resonances obtained from the 1H,
1H TOCSY cannot be assigned to their sequence-
specific nucleotide from this spectrum alone, the experiment is necessary for several
reasons. First, acquisition of the 1H,
1H TOCSY provides resonances to which
pyrimidine sugar protons can be correlated to during initial base-to-sugar walks in the
1H,
1H NOESY spectrum. Additionally, acquisition of the
1H,
1H TOCSY allows the
H5/H6 NOESY cross-peaks to be easily located since it can simply be overlaid onto
the 1H,
1H NOESY spectrum.
3.3 Identification of pyrimidine H1’, H2’, and H3’resonances from the 2D 19
F, 1H
HMQC
Next, a 19
F, 1H HMQC was acquired to obtain resonances for pyrimidine
sugar protons, including the H1‘, H2‘, and H3‘. This experiment correlates protons
and fluorine atoms that are coupled within individual spin systems. Because only
pyrimidines contain the 2‘-F group, no purine sugar resonances will be seen in this
experiment. Figure 3.2 shows the full 19
F, 1H HMQC spectrum with final
assignments. There are several notable features of this spectrum as seen in Figure
3.3. First, with the exception of U14, H1‘ protons are located the farthest downfield
and the H3‘ protons are located the farthest upfield (with the H2‘ protons in between).
H2‘ protons exhibit a splitting of ~50Hz, while H1‘ and H3‘ protons are split by 15
Hz and 27 Hz, respectively. Except for U14, all pyrimidine H1‘ and H2‘ resonances
were located. All 13 fluorine resonances were observed in the spectrum.
Additionally, all but five of the 13 pyrimidine H3‘ resonances were observed. It is

30
Figure 3.2 19
F-1H HMQC collected on the Macugen-HBD complex. The
19F-
1H
HMQC was collected in 100% D2O on a 500 MHz instrument at 25ºC. The spectrum
is expanded in three regions and peaks are labeled with final assignments. Additional
details are given in Figure 3.3.
31
Figure 3.3 Features of the 2D 19
F, 1H HMQC spectra collected on the Macugen-HBD
complex. The above figure shows the 19
F, 1H HMQC focused on three individual
fluorine resonances. Pyrimidine protons that exhibit scalar coupling to the 2‘-F group
will appear as cross-peaks correlated to the 19
F resonance. Because the experiment
was performed with no 19
F decoupling during acquisition (t2), protons will show
coupling in this dimension. Coupled peaks are designated ‗a‘ and ‗b‘ to denote the
upfield/downfield components. H2‘ protons will display a coupling to fluorine of
~50 Hz to the fluorine. The coupling of fluorine to H2‘ and H3‘ protons is smaller;
the former displays a coupling of ~15 Hz , while the H3‘ protons exhibit a coupling
of ~27 Hz. The H1‘ is usually located farthest upfield, followed by the H2‘ and H3‘.

32
possible that some H3‘ resonances were not observed due to overlap with water.
Though the sample was in D2O, the presence of water is unavoidable. Because water
has a chemical shift of 4.77 ppm, it is possible its signal overlaps with some H3‘
resonances (3.9-5.0 ppm). Notably, only one resonance is seen for U14 (assigned
through process of elimination), and this was later found to correspond to its H2‘
proton. The extreme downfield shift of the H2‘ of U14 is discussed later in the text.
The signal-to-noise was not adequate to assign the coupled components of the H3‘ of
C22 in the 19
F, 1H HMQC, although the coupled pair was clearly defined in the
19F,
1H HOESY spectrum. The information obtained from this experiment was extremely
valuable. Although resonances were not able to be assigned to their sequence-
specific nucleotides from this experiment alone, the H1‘, H2‘, and H3‘ resonances
were identified with little ambiguity. Furthermore, identification of pyrimidine sugar
proton resonances from the 19
F, 1H HMQC was critical for correct analysis of
subsequent spectra.
3.4 Validation of pyrimidine H1’, H2’, and H3’ resonances and analysis of
sequential information from the 2D 19
F, 1H HOESY
2D 19
F, 1H heteronuclear Overhauser effect spectroscopy (HOESY) was used
to confirm the pyrimidine H1‘, H2‘, and H3‘ sugar resonances obtained from the
19F,
1H HMQC, and was also used to identify the chemical shift of the H6 or H8 of
residues directly following pyrimidines in the 5‘ to 3‘ direction. This experiment
identifies protons that are <5Å from the 2‘-F group of pyrimidines. Figure 3.4 shows
the 2D 19
F, 1H HOESY with final assignments. Importantly,
19F-
1H NOE cross-peaks
33
Figure 3.4 19
F-1H HOESY collected on the Macugen-HBD complex. The
19F-
1H
HOESY was collected in 100% D2O on a 500 MHz instrument at 25ºC with a mixing
time of 300 ms.
34
can be observed between intra-residue pyrimidine H1‘, H2‘, and H3‘ sugar protons
and the 2‘-F. Accordingly, this experiment can be used to validate the pyrimidine
sugar resonances that were identified through the 19
F, 1H HMQC experiment. All
pyrimidine sugar resonances identified in the 19
F, 1H HMQC were also observed in
this experiment, making these assignments robust. Additionally, the signal-to-noise
of this spectrum is better than that of the 19
F, 1H HMQC, so several additional sugar
assignments were made. U14 shows weak peaks for the H1‘ and H3‘ protons, and
they exhibit the expected splitting (15 Hz and 27 Hz, respectively) for these
resonances. Because these peaks lie at distinct chemical shifts, they cannot be
attributed to other pyrimidine sugar resonances. The better signal-to-noise of this
spectrum compared to the 19
F, 1H HMQC also provided for the assignment of the
coupled components of the H3‘ of C22.
The 19
F, 1H HOESY is a powerful tool because it can provide information
about the position of pyrimidines in the sequence. Like unmodified nucleotides, 2‘-F
pyrimidines exhibit C3‘-endo sugar puckers, and RNA containing this group will tend
to adopt A-form geometry (especially in helical regions) [56]. In this conformation,
the 2‘-F group will lie within 5 Å of the H6 or H8 of the following residue in the 5‘ to
3‘ direction, and an inter-residue 19
F-1H NOE should be observed in the
19F,
1H
HOESY. Figure 3.5 shows the observable intra- and inter-residue NOEs in the 19
F,
1H HOESY. Eleven such NOEs were observed in the spectrum. Figure 3.6 shows
how the 19
F, 1H HOESY can be used to both validate the sugar assignments made
from the 19
F, 1H HMQC and to obtain sequential information. In Macugen, it is
possible that some pyrimidines in the internal bulge and hairpin do not adopt A-form

35
Figure 3.5 Observable Macugen NOEs in the 19
F, 1H HOESY spectrum. Blue lines
indicate heteronuclear NOEs between the 2‘-F of pyrimidines and intra-residue ribose
protons (H1‘, H2‘, and H3‘). The 2‘-F group lies too far away from the intra-residue
H6 to exhibit an NOE to this proton, but it can show an NOE to the H6/H8 of the
following residue in the 5‘ to 3‘ direction (red line). The NOEs were predicted with
the assumption that the RNA adopts A-form geometry.
36
Figure 3.6 Comparison of the 2D 19
F, 1H HMQC (blue) and
19F,
1H HOESY (yellow)
spectra of the Macugen-HBD complex. Panels A) and B) show the 19
F, 1H HOESY
and 19
F, 1H HMQC spectra (respectively) focused on the 2‘-F resonance of U6. As
with the 19
F, 1H HMQC, intra-residue NOEs between the fluorine and H1‘/ H2‘/ H3‘
nuclei appear in the 19
F, 1H HOESY spectrum due to their proximity to the fluorine.
The HOESY experiment also reveals an additional NOE between the fluorine and the
H6/H8 of the residue immediately following the pyrimidine in the 5‘ to 3‘ direction.
In this case, the 2‘-F of U6 shows an NOE to the H6 of C7. Panels C) and D) show
an additional example using U20. Because it gives both intra- and inter-residue
information, the 19
F, 1H HOESY is valuable during the assignment process.

37
geometry, and these nucleotides may not show such inter-residue NOEs. Both
residues that did not exhibit these NOEs lie in these regions; U14 is located in the
hairpin loop while C22 is positioned in the internal bulge. Overall, this information
was extremely valuable because it helped to simplify base-to-sugar walks; there was
little ambiguity with regards to the base protons of residues following most
pyrimidines in the sequence. Table 3.2 provides the chemical shifts of the
resonances assigned in the 19
F, 1H HOESY experiment.
3.5 Analysis of the 2D 1H,
1H NOESY in D2O on the Macugen-HBD complex to
make sequential assignments
Though previous experiments were useful for identifying types of resonances,
until this point in the assignment process, not enough information existed to assign
resonances to specific residues of Macugen. A 2D 1H,
1H NOESY, in conjunction
with the previous experiments, was used to complete the assignment process. A
series of sugar-to-base walks were conducted in the 1H,
1H NOESY spectrum.
Pyrimidine sugar resonances were first correlated to their intra-residue base
resonances. Base-to-sugar walks were then used to piece together consecutive
pyrimidines and the spectrum was also used to identify H8 resonances of purines
following pyrimidines in the sequence. Also, by taking advantage of the unique 2‘-
OMe purine modifications in Macugen, residues following purines in the sequence
were readily identified. Additionally, T28, the sole 2‘-deoxy residue (found at the
terminus of the nucleic acid), provides additional unique features that were utilized to
obtain sequence-specific information from the 1H,
1H NOESY.

38
Tab
le 3
.2 M
acugen
ass
ignm
ents
fro
m t
he
19F
, 1H
HO
ES
Y e
xper
imen
t. a
/b r
efer
to u
pfi
eld/d
ow
nfi
eld c
om
ponen
ts o
f
double
ts (
couple
d p
eaks)
.
39
Figure 3.7 shows the observable 1H-
1H NOEs between atoms involved in
sugar-to-base walks in the 1H,
1H NOESY spectrum. Protons that lie within 5Å of
each other will show NOEs in this experiment, and the figure assumes that the RNA
adopts A-form geometry. As mentioned previously, nucleotides containing 2‘-F
groups are found in C3‘-endo conformations, and will therefore tend to adopt A-form
geometry (especially in helical regions) [56]. Likewise, nucleic acids containing 2‘-
OMe moieties also exhibit this geometry [57]. Therefore, Macugen is similar to
unmodified RNA in that it likely adopts this conformation in helical regions. It
should be noted that there are a variety of inter-residue 1H-
1H NOEs that can be
observed when RNA is found in the A-form conformation. The H3‘, H2‘, and 2‘-
OMe protons will show NOEs to the H6 or H8 of the following nucleotide in the
sequence in the 5‘ to 3‘ direction. This is important because it provides multiple
means by which sequential information can be validated. For example, if the H2‘
resonance of a purine is too overlapped to unambiguously identify, the walk can still
be performed as long as either the H3‘ or 2‘-OMe resonances are not obscured.
Because there are at least three protons that can exhibit inter-residue NOEs to the next
residue in the sequence, the probability of a base-to-sugar walk being interrupted is
significantly reduced. Likewise, there are a variety of sugar protons that are within 5
Å of their intra-residue base H6/H8 proton. The H1‘, H2‘, and H3‘ are all close
enough to the base proton to exhibit an NOE. Hence, if one of the sugar resonances
is overlapped, there are still two more protons that can be used to link sugar
resonances to their intra-residue base. Again, this reduces the probability of
incomplete base-to-sugar walks.

40
Figure 3.7 Observable 1H-
1H NOEs between atoms involved in sugar-to-base walk
in the 1H,
1H NOESY spectrum (assumes A-form geometry). Intra-residue NOEs are
depicted with solid blue arrows connecting the atoms. Solid red arrows depict inter-
residue (sequential) NOEs. The dashed blue arrow between the 2‘-OMe of the
adenosine and the intra-residue H8 indicates an NOE that likely results from spin
diffusion (due to the nuclei being separated by more than 5 Ǻ. Similarly, inter-
residue NOEs between the H1‘ and the H6/H8 of the following (5‘ to 3‘) residue are
also likely due to spin diffusion, and these NOEs are indicated with dashed red lines.
41
Figure 3.8 shows the distances between intra- and inter-residue base protons (H6 or
H8) and H1‘/H2‘ sugar protons, while Figure 3.9 shows the distances between intra-
and inter-residue base protons (H6 or H8) and H3‘/2‘-OMe sugar atoms.
NOEs can also be observed between protons if spin diffusion is occurring.
Spin diffusion is a process that results in an apparent NOE between atoms that may
be farther from each other than the 5Å limit for NOE formation [58]. For example,
even though the 2‘-OMe is about 5.2 Å from its intra-residue H6 base proton, an
NOE was observed between these nuclei in the spectra (Figure 3.9). Additionally,
spin diffusion NOEs may be seen between H1‘ protons and the H6/H8 of following
residues. Measurements indicate that this distance is ~5 Ǻ, and it is possible that
some NOEs observed between these nuclei may be the result of spin diffusion if the
distance is >5 Ǻ (Figure 3.8). Spin diffusion can occur in NOESY experiments with
long mixing times, and the 200 ms mixing time for the 1H,
1H NOESY experiment
provided ample time for spin diffusion to occur. Spin diffusion NOEs between the
2‘-OMe and its intra-residue H8 were observed in the 1H,
1H NOESY spectrum.
Though spin diffusion is sometimes unwanted, it is useful in the assignment of
Macugen because it provides another means by which intra and inter-residue NOEs
can be validated. For example, if the H3‘ of a purine is severely overlapped, the 2‘-
OMe or H1‘ can still be used to link the sugar with the intra-residue base. Likewise,
if pyrimidine H2‘ and H3‘ resonances are severely overlapped, a spin diffusion NOE
between its H1‘ and the H6/H8 of the following residue can avoid an interruption in
the sugar-to-base walk.
42
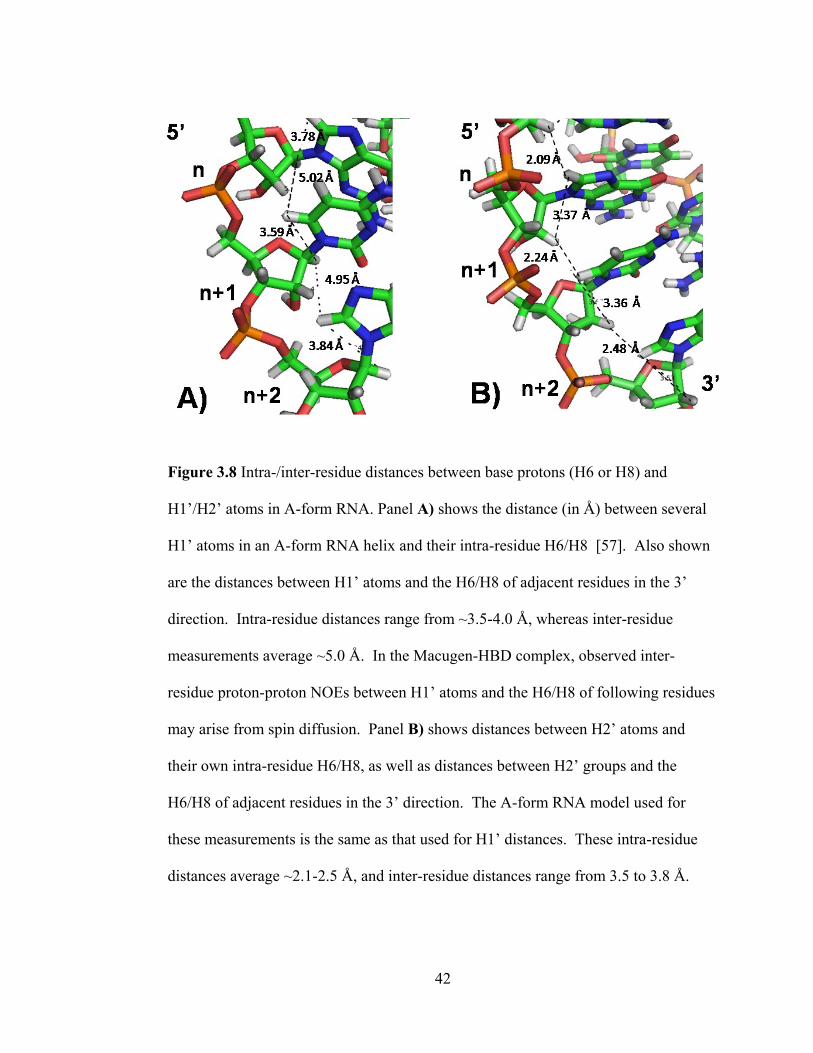
Figure 3.8 Intra-/inter-residue distances between base protons (H6 or H8) and
H1‘/H2‘ atoms in A-form RNA. Panel A) shows the distance (in Å) between several
H1‘ atoms in an A-form RNA helix and their intra-residue H6/H8 [57]. Also shown
are the distances between H1‘ atoms and the H6/H8 of adjacent residues in the 3‘
direction. Intra-residue distances range from ~3.5-4.0 Å, whereas inter-residue
measurements average ~5.0 Å. In the Macugen-HBD complex, observed inter-
residue proton-proton NOEs between H1‘ atoms and the H6/H8 of following residues
may arise from spin diffusion. Panel B) shows distances between H2‘ atoms and
their own intra-residue H6/H8, as well as distances between H2‘ groups and the
H6/H8 of adjacent residues in the 3‘ direction. The A-form RNA model used for
these measurements is the same as that used for H1‘ distances. These intra-residue
distances average ~2.1-2.5 Å, and inter-residue distances range from 3.5 to 3.8 Å.
43
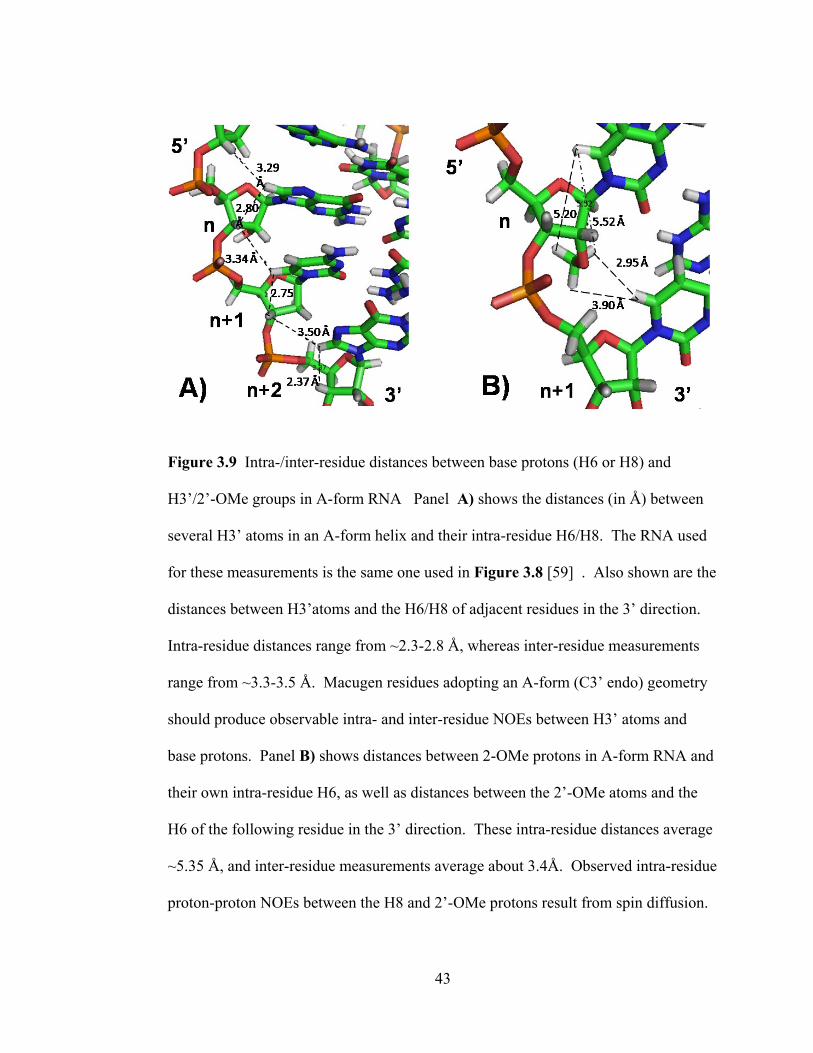
Figure 3.9 Intra-/inter-residue distances between base protons (H6 or H8) and
H3‘/2‘-OMe groups in A-form RNA Panel A) shows the distances (in Å) between
several H3‘ atoms in an A-form helix and their intra-residue H6/H8. The RNA used
for these measurements is the same one used in Figure 3.8 [59] . Also shown are the
distances between H3‘atoms and the H6/H8 of adjacent residues in the 3‘ direction.
Intra-residue distances range from ~2.3-2.8 Å, whereas inter-residue measurements
range from ~3.3-3.5 Å. Macugen residues adopting an A-form (C3‘ endo) geometry
should produce observable intra- and inter-residue NOEs between H3‘ atoms and
base protons. Panel B) shows distances between 2-OMe protons in A-form RNA and
their own intra-residue H6, as well as distances between the 2‘-OMe atoms and the
H6 of the following residue in the 3‘ direction. These intra-residue distances average
~5.35 Å, and inter-residue measurements average about 3.4Å. Observed intra-residue
proton-proton NOEs between the H8 and 2‘-OMe protons result from spin diffusion.
44
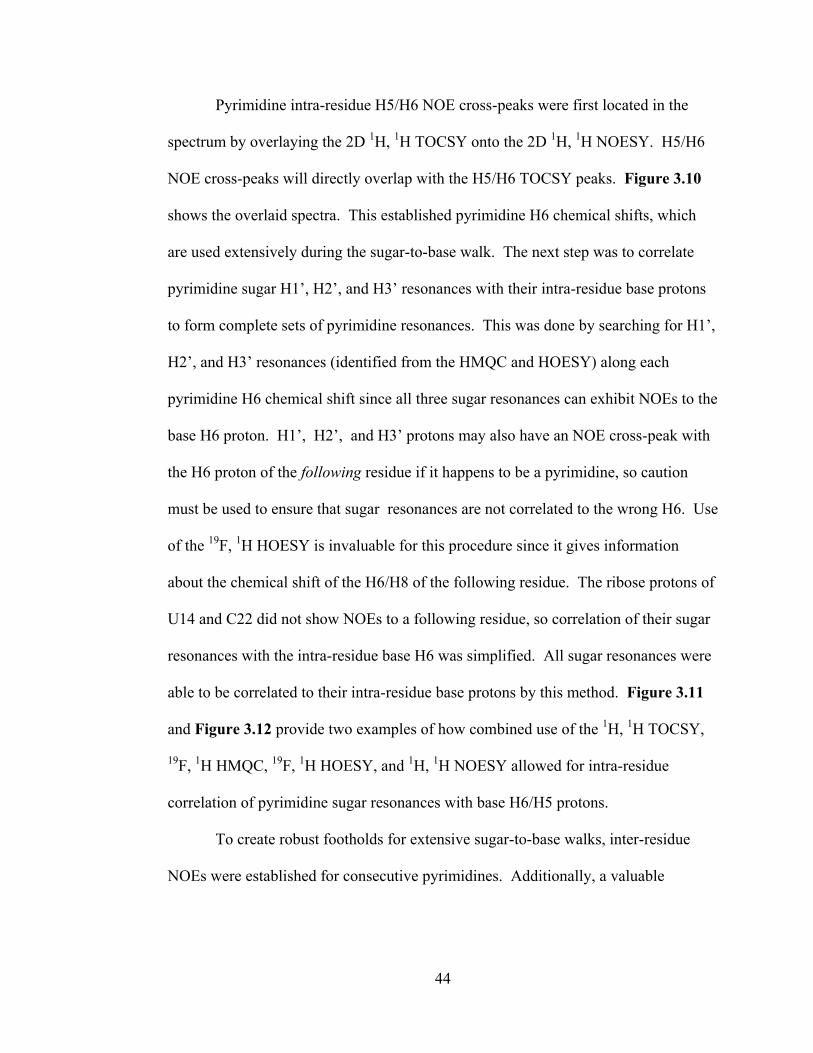
Pyrimidine intra-residue H5/H6 NOE cross-peaks were first located in the
spectrum by overlaying the 2D 1H,
1H TOCSY onto the 2D
1H,
1H NOESY. H5/H6
NOE cross-peaks will directly overlap with the H5/H6 TOCSY peaks. Figure 3.10
shows the overlaid spectra. This established pyrimidine H6 chemical shifts, which
are used extensively during the sugar-to-base walk. The next step was to correlate
pyrimidine sugar H1‘, H2‘, and H3‘ resonances with their intra-residue base protons
to form complete sets of pyrimidine resonances. This was done by searching for H1‘,
H2‘, and H3‘ resonances (identified from the HMQC and HOESY) along each
pyrimidine H6 chemical shift since all three sugar resonances can exhibit NOEs to the
base H6 proton. H1‘, H2‘, and H3‘ protons may also have an NOE cross-peak with
the H6 proton of the following residue if it happens to be a pyrimidine, so caution
must be used to ensure that sugar resonances are not correlated to the wrong H6. Use
of the 19
F, 1H HOESY is invaluable for this procedure since it gives information
about the chemical shift of the H6/H8 of the following residue. The ribose protons of
U14 and C22 did not show NOEs to a following residue, so correlation of their sugar
resonances with the intra-residue base H6 was simplified. All sugar resonances were
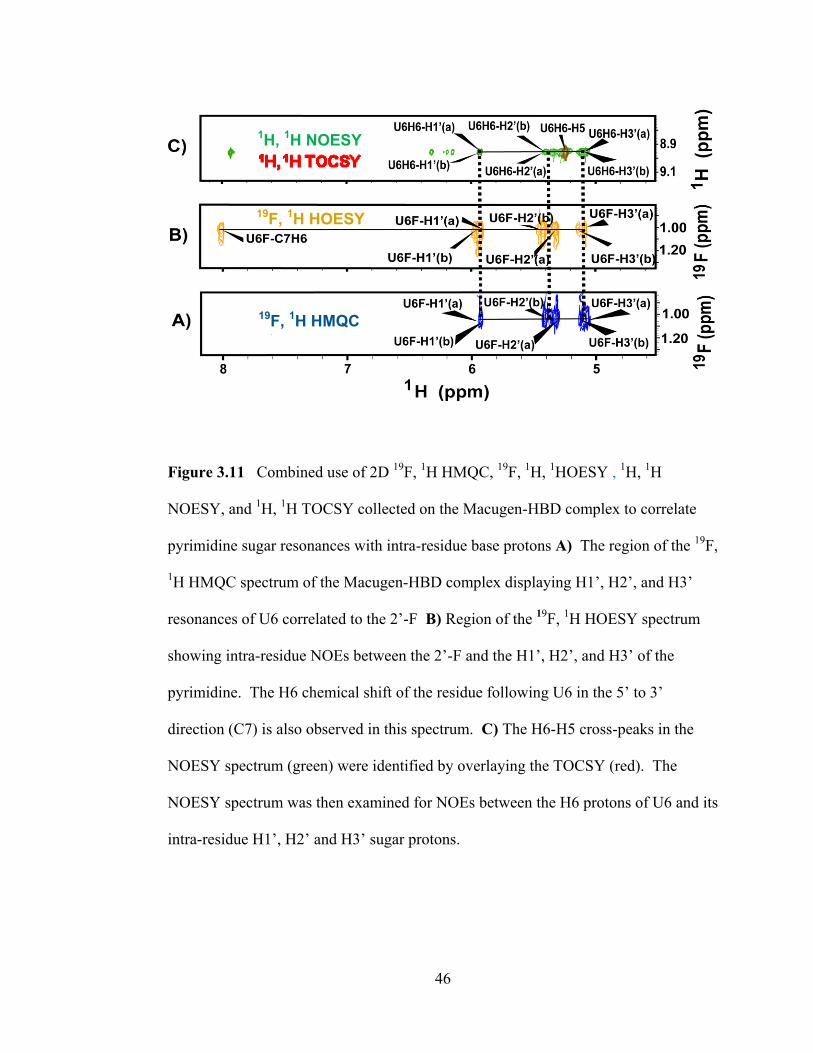
able to be correlated to their intra-residue base protons by this method. Figure 3.11
and Figure 3.12 provide two examples of how combined use of the 1H,
1H TOCSY,
19F,
1H HMQC,
19F,
1H HOESY, and
1H,
1H NOESY allowed for intra-residue
correlation of pyrimidine sugar resonances with base H6/H5 protons.
To create robust footholds for extensive sugar-to-base walks, inter-residue
NOEs were established for consecutive pyrimidines. Additionally, a valuable

45
with H6-H5 TOCSY cross-peaks.
Figure 3.10 Spectral overlay of the 2D 1H,
1H TOCSY (red) onto
1H,
1H NOESY
(green) in the sugar-to-base region of the Macugen-HBD complex. Both spectra of
the Macugen-HBD complex were collected at 25ºC in 100% D2O. The NOESY was
acquired on an 800 MHz instrument using a 200 ms mixing time and presaturation
water suppression. Pyrimidine H6-H5 NOEs are identified by their direct overlap
with H6-H5 TOCSY cross-peaks.
U6H6-H5
46
Figure 3.11 Combined use of 2D 19
F, 1H HMQC,
19F,
1H,
1HOESY ,
1H,
1H
NOESY, and 1H,
1H TOCSY collected on the Macugen-HBD complex to correlate
pyrimidine sugar resonances with intra-residue base protons A) The region of the 19
F,
1H HMQC spectrum of the Macugen-HBD complex displaying H1‘, H2‘, and H3‘
resonances of U6 correlated to the 2‘-F B) Region of the 19
F, 1H HOESY spectrum
showing intra-residue NOEs between the 2‘-F and the H1‘, H2‘, and H3‘ of the
pyrimidine. The H6 chemical shift of the residue following U6 in the 5‘ to 3‘
direction (C7) is also observed in this spectrum. C) The H6-H5 cross-peaks in the
NOESY spectrum (green) were identified by overlaying the TOCSY (red). The
NOESY spectrum was then examined for NOEs between the H6 protons of U6 and its
intra-residue H1‘, H2‘ and H3‘ sugar protons.
1H, 1H NOESY
19F, 1H HOESY
19F, 1H HMQC
47
Fig
ure
3.1
2 A
noth
er e
xam
ple
of
com
bin
ed u
se o
f 2D
19F
, 1H
HM
QC
, 1
9F
, 1H
, 1H
OE
SY
, 1
H,
1H
NO
ES
Y,
and 1
H,
1H
TO
CS
Y
coll
ecte
d o
n t
he
Mac
ugen
-HB
D c
om
ple
x t
o c
orr
elat
e su
gar
res
onan
ces
wit
h i
ntr
a-re
sidue
bas
e pro
tons
A)
A r
egio
n o
f th
e 1
9F
, 1H
HM
QC
spec
trum
of
the
Mac
ugen
-HB
D c
om
ple
x d
ispla
yin
g H
1‘,
H2‘,
and H
3‘r
esonan
ces
of
U10 c
orr
elat
ed t
o t
he
2‘-
F.
B)
19F
, 1H
HO
ES
Y s
pec
trum
show
ing i
ntr
a-re
sidue
NO
Es
bet
wee
n t
he
2‘-
F a
nd t
he
H1‘,
H2‘,
and H
3‘
of
U10. (
CO
NT
INU
ED
)
A)
B)
C)

48
(Figure 3.12 continued) The H8 chemical shift of the residue following this
pyrimidine in the 5‘ to 3‘direction (G11) is also observed. C) The 1H-
1H NOESY
spectrum (green) was examined for intra-residue NOEs between the H6 of U10 and
its H1‘, H2‘, and H3‘ protons.
49
foothold was established by assigning the resonances of G27 and dT28. Because
dT28 contains a deoxy residue, it has unique methyl resonances from the H7, and its
H2‘/H2‖ resonances can easily be found in the TOCSY and NOESY. Figure 3.13
shows the assignment of G27 and dT28. Piecing together all consecutive pyrimidines
was done with relative ease due to the fact that all sugar resonances had been defined
through the HOESY/HMQC and because the HOESY reveals the chemical shift of
the H6/H8 of the following residue. Figure 3.14 provides an example of how
pyrimidine-pyrimidine connectivities were established using the 1H,
1H NOESY.
Finally, pyrimidines followed by purines were linked together using identified
pyrimidine sugar resonances and information from the HOESY. At this point, the 2‘-
OMe group was used to establish purine-pyrimidine links as well as purine-purine
links. Figure 3.15 shows how the 2‘-OMe was used for sugar-to-base walks.

50
Fig
ure
3.1
3 I
nte
r-re
sidue
NO
Es
bet
wee
n G
27 a
nd d
T28. P
anel
A)
show
s par
t of
the
1H
, 1H
TO
CS
Y s
pec
trum
(re
d)
over
laid
onto
the
1H
, 1H
NO
ES
Y s
pec
trum
(gre
en).
B
eing t
he
only
deo
xy r
esid
ue
in M
acugen
, dT
28 s
how
s dis
tinct
ive
NO
Es
bet
wee
n t
he
H2‘-
H1‘
and
bet
wee
n H
2‖-
H1‘.
T
hes
e N
OE
s ar
e co
nfi
rmed
by t
he
pre
sence
of
dir
ectl
y-o
ver
lappin
g
TO
CS
Y p
eaks.
B
ecau
se b
oth
the
H2‘
and H
2‖
ar
e co
uple
d t
o t
he
H1‘,
they
show
corr
elat
ions
to t
he H
1‘
in t
he
TO
CS
Y
spec
trum
. A
ddit
ional
ly,
the
H1‘
of
dT
28 e
xhib
its
an N
OE
its
met
hyl
pro
ton. P
anel
A)
also
show
s in
ter-
resi
due
NO
Es
bet
wee
n th
e H
1‘
of
G27 a
nd t
he
H2‘/
H2‖
of
dT
28.
T
his
is
expec
ted d
ue
to t
he
rever
se l
inkag
e (3
‘—3‘)
(C
ON
TIN
UE
D)
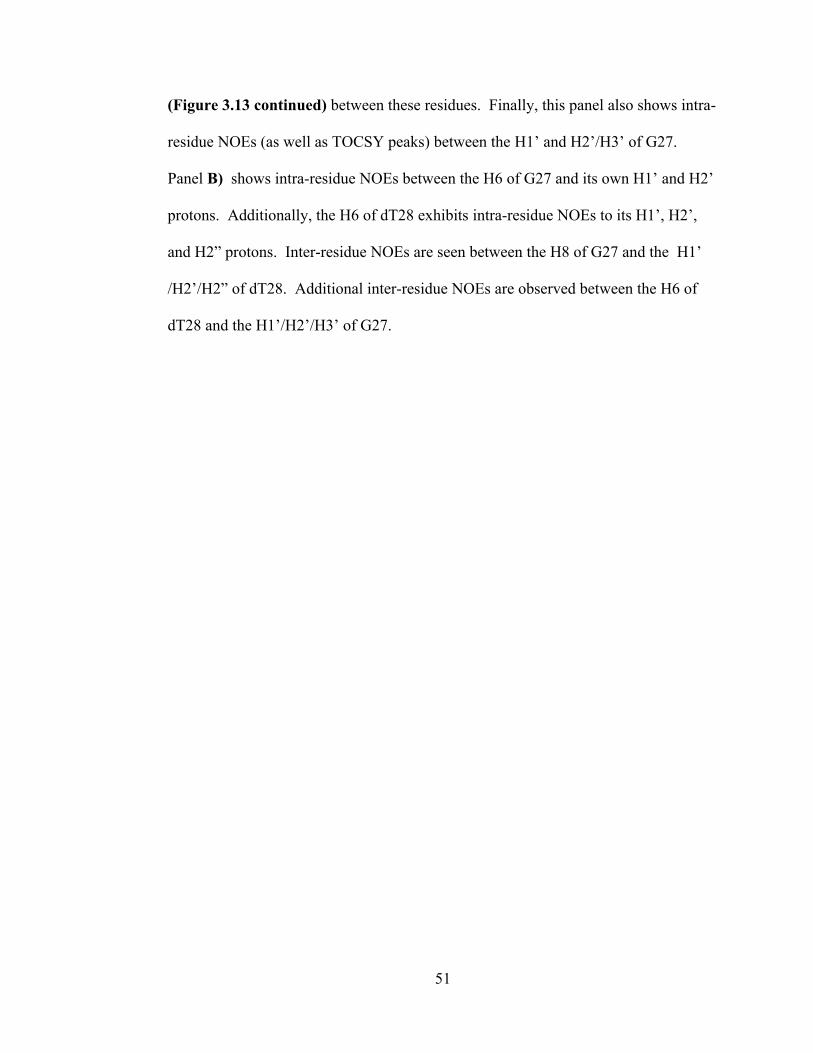
51
(Figure 3.13 continued) between these residues. Finally, this panel also shows intra-
residue NOEs (as well as TOCSY peaks) between the H1‘ and H2‘/H3‘ of G27.
Panel B) shows intra-residue NOEs between the H6 of G27 and its own H1‘ and H2‘
protons. Additionally, the H6 of dT28 exhibits intra-residue NOEs to its H1‘, H2‘,
and H2‖ protons. Inter-residue NOEs are seen between the H8 of G27 and the H1‘
/H2‘/H2‖ of dT28. Additional inter-residue NOEs are observed between the H6 of
dT28 and the H1‘/H2‘/H3‘ of G27.
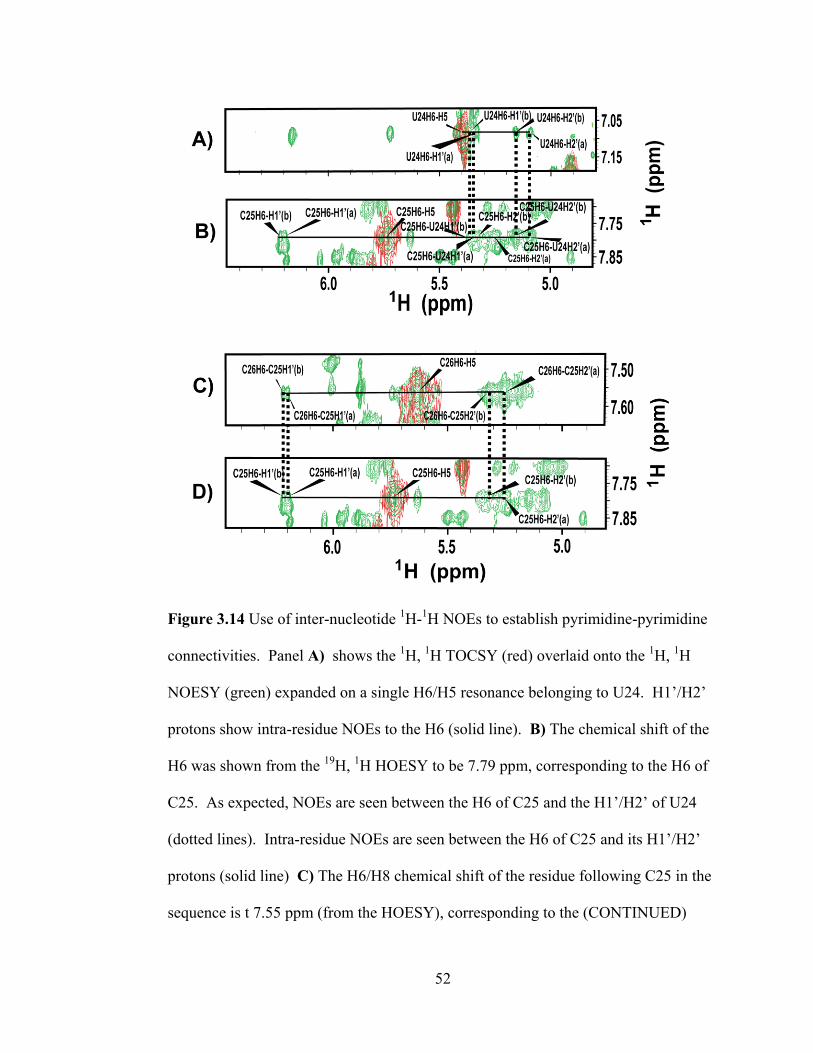
52
Figure 3.14 Use of inter-nucleotide 1H-
1H NOEs to establish pyrimidine-pyrimidine
connectivities. Panel A) shows the 1H,
1H TOCSY (red) overlaid onto the
1H,
1H
NOESY (green) expanded on a single H6/H5 resonance belonging to U24. H1‘/H2‘
protons show intra-residue NOEs to the H6 (solid line). B) The chemical shift of the
H6 was shown from the 19
H, 1H HOESY to be 7.79 ppm, corresponding to the H6 of
C25. As expected, NOEs are seen between the H6 of C25 and the H1‘/H2‘ of U24
(dotted lines). Intra-residue NOEs are seen between the H6 of C25 and its H1‘/H2‘
protons (solid line) C) The H6/H8 chemical shift of the residue following C25 in the
sequence is t 7.55 ppm (from the HOESY), corresponding to the (CONTINUED)

53
(Figure 3.14 continued) H6 of C26. D The H1‘/H2‘ of C25 show inter-residue
NOEs to the H6 of C26 (dotted lines). Completing the walk, the H6 of C26 has NOE
cross-peaks to its intra-residue H1‘/H2‘ atoms.
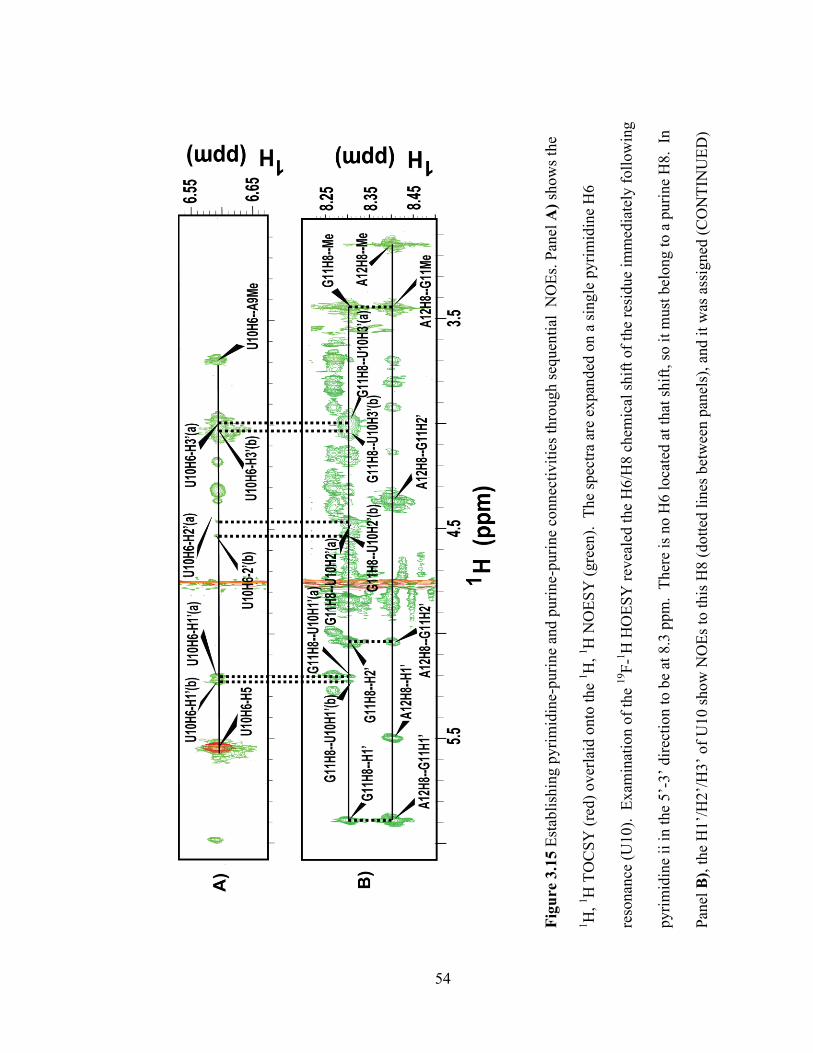
54
Fig
ure
3.1
5 E
stab
lish
ing p
yri
mid
ine-
puri
ne
and p
uri
ne-
puri
ne
connec
tivit
ies
thro
ugh s
equen
tial
N
OE
s. P
anel
A)
show
s th
e
1H
, 1H
TO
CS
Y (
red)
over
laid
onto
the
1H
, 1H
NO
ES
Y (
gre
en).
T
he
spec
tra
are
expan
ded
on a
sin
gle
pyri
mid
ine
H6
reso
nan
ce (
U10).
E
xam
inat
ion o
f th
e 1
9F
-1H
HO
ES
Y r
evea
led t
he
H6/H
8 c
hem
ical
shif
t of
the
resi
due
imm
edia
tely
foll
ow
ing
pyri
mid
ine
ii i
n t
he
5‘-
3‘
dir
ecti
on t
o b
e at
8.3
ppm
. T
her
e is
no H
6 l
oca
ted a
t th
at s
hif
t, s
o i
t m
ust
bel
ong t
o a
puri
ne
H8. I
n
Pan
el B
), t
he
H1‘/
H2‘/
H3‘
of
U10 s
how
NO
Es
to t
his
H8 (
dott
ed l
ines
bet
wee
n p
anel
s), an
d i
t w
as a
ssig
ned
(C
ON
TIN
UE
D)
55
(Figure 3.15 continued) to G11.Continuing the walk, the H8 of G11 shows NOEs to
its intra-residue H1‘, H2‘, and 2‘-OMe atoms, and the 2‘-OMe of G11 was located
via its intra-residue NOEs to the H1‘ and H2‘ (not shown) as well as its spin diffusion
NOE to the H8 (shown). The spectrum was examined for inter-residue NOEs
between the 2‘-OMe protons of G11 and the H6/H8 of the following (5‘ to 3‘)
residue, and they were located at 8.4 ppm (shown with dotted lines within panel B).
This corresponds to the H8 chemical shift of A12. Completing this stretch of the
base-to-sugar walk, the H8 of A12 exhibits intra-residue NOEs to its own H1‘ and
H2‘ protons. Thus, combined use of the intra- and inter-residue NOEs allowed for
the establishment of pyrimidine-purine and purine-purine connectivities.

56
3.6 Conclusions
This work led to the assignment of all but four residues of Macugen. These
nucleotides lie in the internal bulge and the hairpin loop, and are probably in regions
that do not exhibit A-form geometry. Additionally, an interesting feature is seen in
U14. It‘s H2‘ resonances lie the farthest downfield—contrary to the usual pattern
where H1‘ protons are found shifted the furthest downfield. This could be due to a
unique conformation of this residue since the H2‘ protons are likely experiencing the
most electronegative environment. Figure 3.16 shows final NOE connectivities from
sugar-to-base walks, and Table 3.3 gives the final assigned chemical shifts for all
assigned residues.
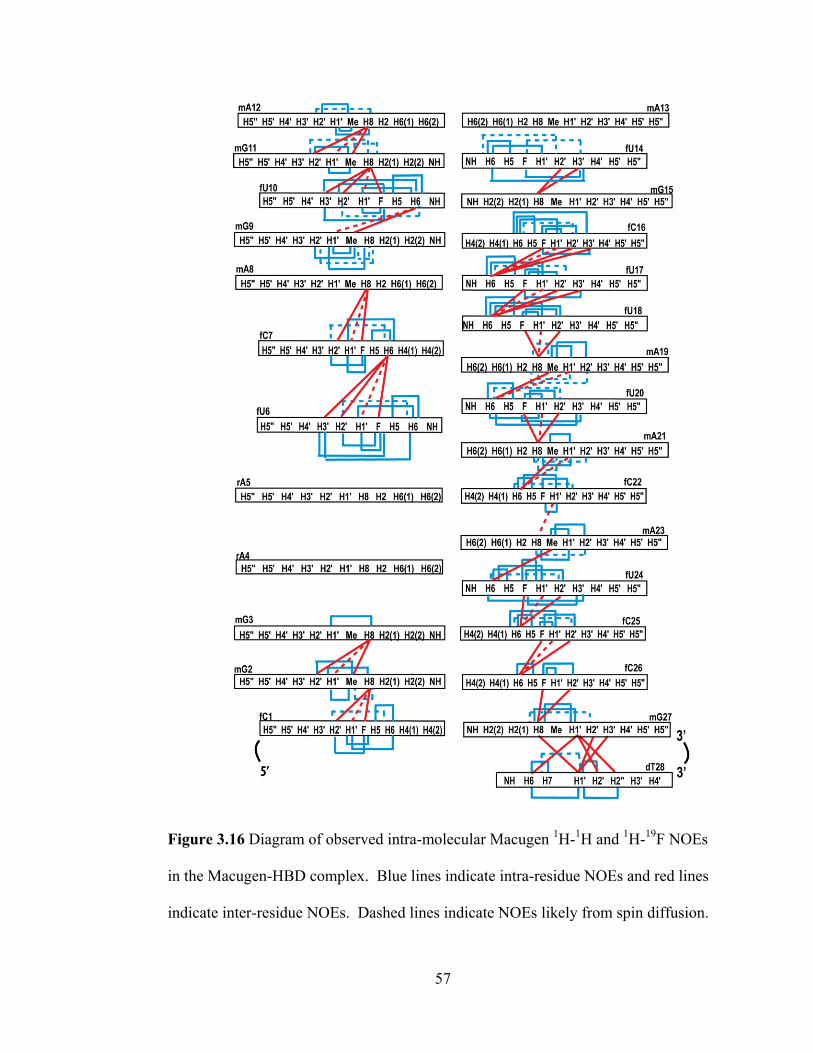
57
Figure 3.16 Diagram of observed intra-molecular Macugen 1H-
1H and
1H-
19F NOEs
in the Macugen-HBD complex. Blue lines indicate intra-residue NOEs and red lines
indicate inter-residue NOEs. Dashed lines indicate NOEs likely from spin diffusion.
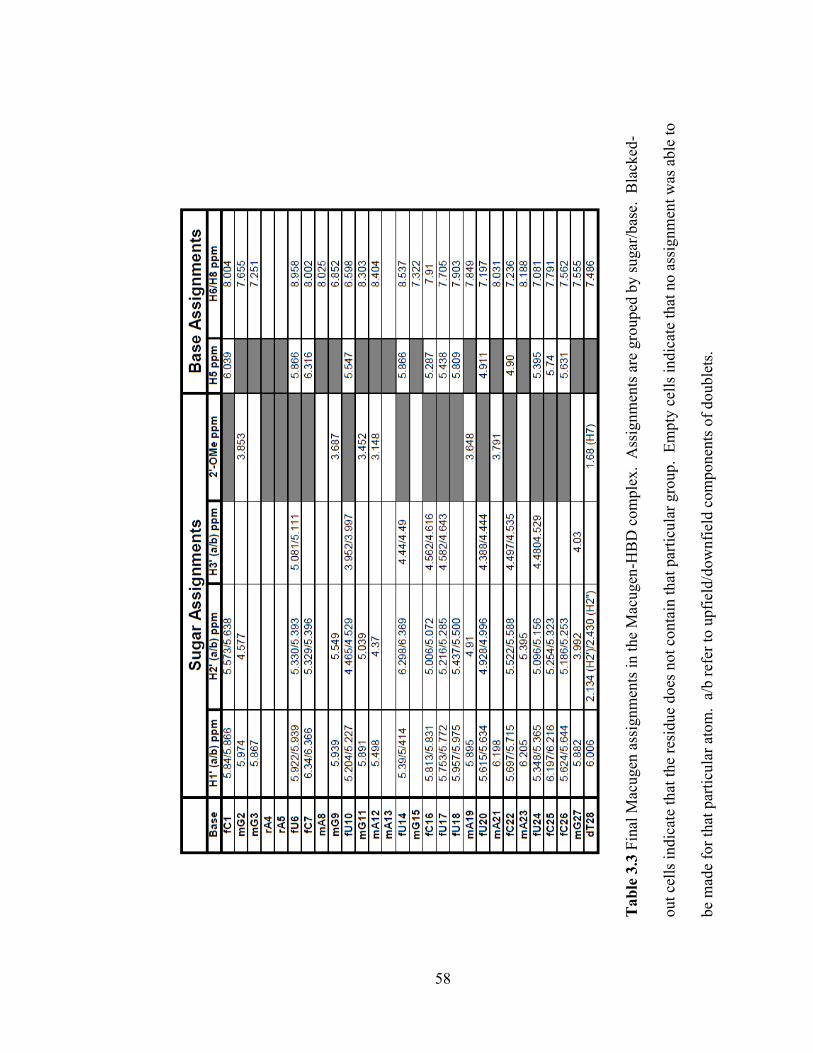
58
Tab
le 3
.3 F
inal
Mac
ugen
ass
ign
men
ts i
n t
he
Mac
ugen
-HB
D c
om
ple
x. A
ssig
nm
ents
are
gro
uped
by s
ugar
/bas
e. B
lack
ed-
out
cell
s in
dic
ate
that
the
resi
due
does
not
conta
in t
hat
par
ticu
lar
gro
up. E
mpty
cel
ls i
ndic
ate
that
no a
ssig
nm
ent
was
able
to
be
mad
e fo
r th
at p
arti
cula
r at
om
. a
/b r
efer
to u
pfi
eld/d
ow
nfi
eld c
om
ponen
ts o
f double
ts.
59
REFERENCES
1. Wilson, D.S. and J.W. Szostak, In vitro selection of functional nucleic acids.
Annu Rev Biochem, 1999. 68: p. 611-47.
2. Tuerk, C. and L. Gold, Systematic evolution of ligands by exponential
enrichment: RNA ligands to bacteriophage T4 DNA polymerase. Science,
1990. 249(4968): p. 505-10.
3. Brackett, D.M. and T. Dieckmann, Aptamer to ribozyme: the intrinsic
catalytic potential of a small RNA. Chembiochem, 2006. 7(5): p. 839-43.
4. Feigon, J., T. Dieckmann, and F.W. Smith, Aptamer structures from A to zeta.
Chem Biol, 1996. 3(8): p. 611-7.
5. Fang, X. and W. Tan, Aptamers generated from cell-SELEX for molecular
medicine: a chemical biology approach. Acc Chem Res, 2010. 43(1): p. 48-
57.
6. Fan, P., et al., Molecular recognition in the FMN-RNA aptamer complex. J
Mol Biol, 1996. 258(3): p. 480-500.
7. Bunka, D.H. and P.G. Stockley, Aptamers come of age - at last. Nat Rev
Microbiol, 2006. 4(8): p. 588-96.
8. Cowan, J.A., et al., Recognition of a cognate RNA aptamer by neomycin B:
quantitative evaluation of hydrogen bonding and electrostatic interactions.
Nucleic Acids Res, 2000. 28(15): p. 2935-42.
9. Ellington, A.D. and J.W. Szostak, In vitro selection of RNA molecules that
bind specific ligands. Nature, 1990. 346(6287): p. 818-22.

60
10. Jayasena, S.D., Aptamers: an emerging class of molecules that rival
antibodies in diagnostics. Clin Chem, 1999. 45(9): p. 1628-50.
11. Prudent, J.R., T. Uno, and P.G. Schultz, Expanding the scope of RNA
catalysis. Science, 1994. 264(5167): p. 1924-7.
12. Tombelli, S., M. Minunni, and M. Mascini, Analytical applications of
aptamers. Biosens Bioelectron, 2005. 20(12): p. 2424-34.
13. Uphoff, K.W., S.D. Bell, and A.D. Ellington, In vitro selection of aptamers:
the dearth of pure reason. Curr Opin Struct Biol, 1996. 6(3): p. 281-8.
14. Famulok, M., G. Mayer, and M. Blind, Nucleic acid aptamers-from selection
in vitro to applications in vivo. Acc Chem Res, 2000. 33(9): p. 591-9.
15. Nimjee, S.M., C.P. Rusconi, and B.A. Sullenger, Aptamers: an emerging class
of therapeutics. Annu Rev Med, 2005. 56: p. 555-83.
16. Eaton, B.E., et al., Post-SELEX combinatorial optimization of aptamers.
Bioorg Med Chem, 1997. 5(6): p. 1087-96.
17. Eaton, B.E., L. Gold, and D.A. Zichi, Let's get specific: the relationship
between specificity and affinity. Chem Biol, 1995. 2(10): p. 633-8.
18. Carothers, J.M., S.C. Oestreich, and J.W. Szostak, Aptamers selected for
higher-affinity binding are not more specific for the target ligand. J Am Chem
Soc, 2006. 128(24): p. 7929-37.
19. Hermann, T. and D.J. Patel, Adaptive recognition by nucleic acid aptamers.
Science, 2000. 287(5454): p. 820-5.
61
20. Leulliot, N. and G. Varani, Current topics in RNA-protein recognition:
control of specificity and biological function through induced fit and
conformational capture. Biochemistry, 2001. 40(27): p. 7947-56.
21. Williamson, J.R., Induced fit in RNA-protein recognition. Nat Struct Biol,
2000. 7(10): p. 834-7.
22. Patel, D.J., et al., Structure, recognition and adaptive binding in RNA aptamer
complexes. J Mol Biol, 1997. 272(5): p. 645-64.
23. Burke, D.H. and L. Gold, RNA aptamers to the adenosine moiety of S-
adenosyl methionine: structural inferences from variations on a theme and the
reproducibility of SELEX. Nucleic Acids Res, 1997. 25(10): p. 2020-4.
24. Dieckmann, T., et al., Solution structure of an ATP-binding RNA aptamer
reveals a novel fold. RNA, 1996. 2(7): p. 628-40.
25. Garst, A.D., et al., Crystal structure of the lysine riboswitch regulatory mRNA
element. J Biol Chem, 2008. 283(33): p. 22347-51.
26. Jiang, F., et al., Structural basis of RNA folding and recognition in an AMP-
RNA aptamer complex. Nature, 1996. 382(6587): p. 183-6.
27. Wang, K.Y., et al., A DNA aptamer which binds to and inhibits thrombin
exhibits a new structural motif for DNA. Biochemistry, 1993. 32(8): p. 1899-
904.
28. Ferrara, N., H.P. Gerber, and J. LeCouter, The biology of VEGF and its
receptors. Nat Med, 2003. 9(6): p. 669-76.
29. Ema, M., et al., A novel bHLH-PAS factor with close sequence similarity to
hypoxia-inducible factor 1alpha regulates the VEGF expression and is
62
potentially involved in lung and vascular development. Proc Natl Acad Sci U
S A, 1997. 94(9): p. 4273-8.
30. Kliche, S. and J. Waltenberger, VEGF receptor signaling and endothelial
function. IUBMB Life, 2001. 52(1-2): p. 61-6.
31. Neufeld, G., et al., Vascular endothelial growth factor (VEGF) and its
receptors. FASEB J, 1999. 13(1): p. 9-22.
32. Lee, S., et al., Autocrine VEGF signaling is required for vascular
homeostasis. Cell, 2007. 130(4): p. 691-703.
33. Tammela, T., et al., The biology of vascular endothelial growth factors.
Cardiovasc Res, 2005. 65(3): p. 550-63.
34. Folkman, J., Angiogenesis in cancer, vascular, rheumatoid and other disease.
Nat Med, 1995. 1(1): p. 27-31.
35. Krilleke, D., et al., Molecular mapping and functional characterization of the
VEGF164 heparin-binding domain. J Biol Chem, 2007. 282(38): p. 28045-56.
36. Fairbrother, W.J., et al., Solution structure of the heparin-binding domain of
vascular endothelial growth factor. Structure, 1998. 6(5): p. 637-48.
37. Ng, E.W. and A.P. Adamis, Targeting angiogenesis, the underlying disorder
in neovascular age-related macular degeneration. Can J Ophthalmol, 2005.
40(3): p. 352-68.
38. Carmeliet, P., Angiogenesis in life, disease and medicine. Nature, 2005.
438(7070): p. 932-6.
39. van Wijngaarden, P. and S.H. Qureshi, Inhibitors of vascular endothelial
growth factor (VEGF) in the management of neovascular age-related macular

63
degeneration: a review of current practice. Clin Exp Optom, 2008. 91(5): p.
427-37.
40. Aiello, L.P., et al., Suppression of retinal neovascularization in vivo by
inhibition of vascular endothelial growth factor (VEGF) using soluble VEGF-
receptor chimeric proteins. Proc Natl Acad Sci U S A, 1995. 92(23): p.
10457-61.
41. Gerber, H.P., et al., Mice expressing a humanized form of VEGF-A may
provide insights into the safety and efficacy of anti-VEGF antibodies. Proc
Natl Acad Sci U S A, 2007. 104(9): p. 3478-83.
42. Jellinek, D., et al., Inhibition of receptor binding by high-affinity RNA ligands
to vascular endothelial growth factor. Biochemistry, 1994. 33(34): p. 10450-
6.
43. Frokjaer, S. and D.E. Otzen, Protein drug stability: a formulation challenge.
Nat Rev Drug Discov, 2005. 4(4): p. 298-306.
44. Ruckman, J., et al., 2'-Fluoropyrimidine RNA-based aptamers to the 165-
amino acid form of vascular endothelial growth factor (VEGF165). Inhibition
of receptor binding and VEGF-induced vascular permeability through
interactions requiring the exon 7-encoded domain. J Biol Chem, 1998.
273(32): p. 20556-67.
45. Lee, J.H., et al., A therapeutic aptamer inhibits angiogenesis by specifically
targeting the heparin binding domain of VEGF165. Proc Natl Acad Sci U S
A, 2005. 102(52): p. 18902-7.

64
46. Kang, Y., et al., UBL/UBA ubiquitin receptor proteins bind a common
tetraubiquitin chain. J Mol Biol, 2006. 356(4): p. 1027-35.
47. Cavanagh, J., Protein NMR spectroscopy : principles and practice. 1996, San
Diego: Academic Press. xxiii, 587 p.
48. Castagne, C., et al., 31P NMR analysis of the DNA conformation induced by
protein binding SRY/DNA complexes. Eur J Biochem, 2000. 267(4): p. 1223-
9.
49. Wüthrich, K., NMR of proteins and nucleic acids. The George Fisher Baker
non-resident lectureship in chemistry at Cornell University. 1986, New York:
Wiley. xv, 292.
50. Bax, A., Davis, D., MLEV-17-Based Two-Dimensional Homonuclear
Magnetization Transfer Spectroscopy. Journal of Magnetic Resonance, 1985.
65: p. 355-360.
51. Muller, L., Sensitivity Enhanced Detection of Weak Nuclei Using
Heteronuclear Multiple Quantum Coherence. Journal of the American
Chemical Society, 1979. 101(16): p. 4481-4484.
52. Lix, B., Sonnichsen, F.D., Sykes, B.D, Measuring diffusion in liquids with a
single gradient pulse. J Magn Reson, 1996. 121: p. 83-87.
53. Neuhaus, D. and M.P. Williamson, The nuclear Overhauser effect in
structural and conformational analysis. 1989, New York, N.Y.: VCH. xxii,
522 p.
54. Furtig, B., et al., NMR spectroscopy of RNA. Chembiochem, 2003. 4(10): p.
936-62.
65
55. Gundhi, P., Chary, K. V. R., Hosur, R. V., Direct observation of (H8,H6)-Hr
J-coupling correlations in oligonucleotides for unambiguous resonance
assignments : Use of J-scaling in two-dimensional correlated spectroscopy
FEBS J, 1985. 191: p. 92-96.
56. Williams, A.A., et al., Impact of sugar pucker on base pair and mispair
stability. Biochemistry, 2009. 48(50): p. 11994-2004.
57. Nishizaki, T., et al., Solution structure of an RNA.2'-O-methylated RNA hybrid
duplex containing an RNA.DNA hybrid segment at the center. Biochemistry,
1997. 36(9): p. 2577-85.
58. Majumdar, A., Hosur, R, Analytical treatment of spin diffusion in a three-spin
(AMX and ABX) system in the long-correlation-time (ω0gtc, much greater-
than 1) limit, for estimation of internuclear distances in macromolecules J.
Magn. Reson., 1989. 88(2): p. 284-304
59. Stuart, J.W., et al., Naturally-occurring modification restricts the anticodon
domain conformational space of tRNA(Phe). J Mol Biol, 2003. 334(5): p. 901-
18.
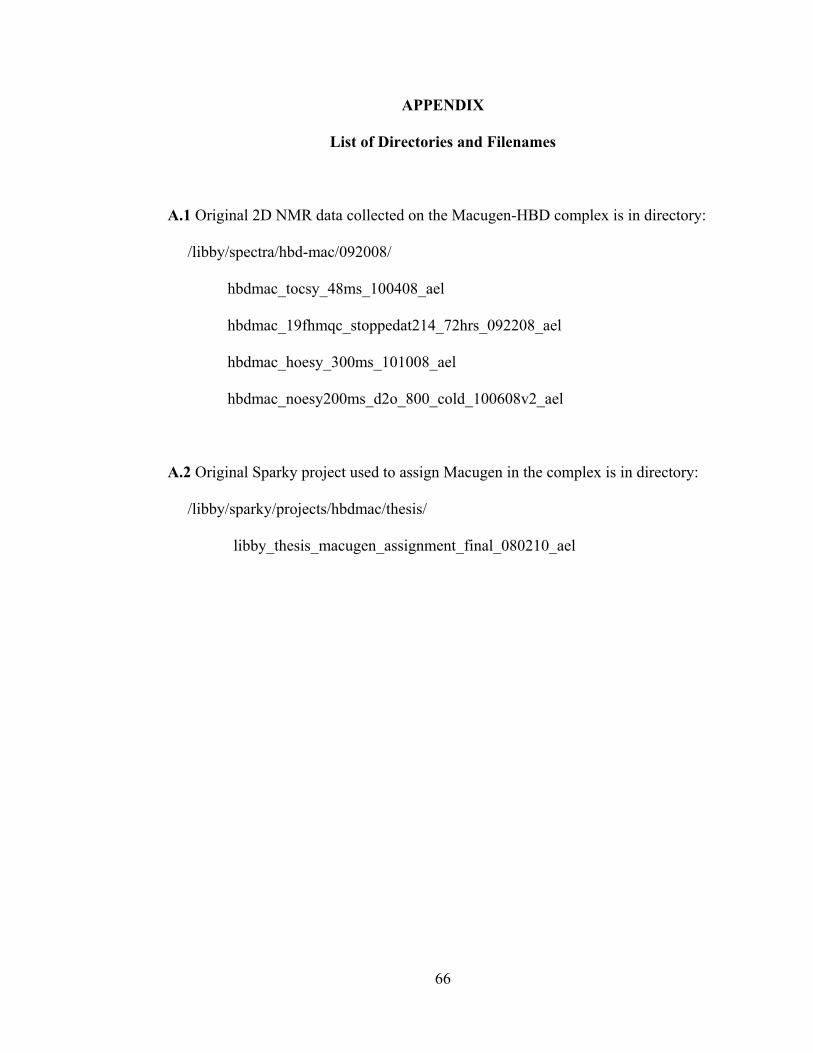
66
APPENDIX
List of Directories and Filenames
A.1 Original 2D NMR data collected on the Macugen-HBD complex is in directory:
/libby/spectra/hbd-mac/092008/
hbdmac_tocsy_48ms_100408_ael
hbdmac_19fhmqc_stoppedat214_72hrs_092208_ael
hbdmac_hoesy_300ms_101008_ael
hbdmac_noesy200ms_d2o_800_cold_100608v2_ael
A.2 Original Sparky project used to assign Macugen in the complex is in directory:
/libby/sparky/projects/hbdmac/thesis/
libby_thesis_macugen_assignment_final_080210_ael