Western Basin and Central Basin involvement Niël Pretorius, CEO June 2011.

Niël Pretorius, CEOCraig Barnes, CFOJohannesburg23 August 2013

Disclaimer
Many factors could cause the actual results, performance or achievements to be materially different from any futureresults, performance or achievements that may be expressed or implied by such forward-looking statements, including,among others, adverse changes or uncertainties in general economic conditions in the markets we serve, a drop in thegold price, a sustained strengthening of the Rand against the Dollar, regulatory developments adverse to DRDGOLDor difficulties in maintaining necessary licenses or other governmental approvals, changes in DRDGOLD’s competitiveposition, changes in business strategy, any major disruption in production at key facilities or adverse changes inforeign exchange rates and various other factors. These risks include, without limitation, those described in the sectionentitled “Risk Factors” included in our annual report for the fiscal year ended 30 June 2012, which we filed with theUnited States Securities and Exchange Commission on 26 October 2012 on Form 20-F. You should not place unduereliance on these forward-looking statements, which speak only as of the date thereof. We do not undertake anyobligation to publicly update or revise these forward-looking statements to reflect events or circumstances after thedate of this report or to the occurrence of unanticipated events. Any forward-looking statements included in this reporthave not been reviewed and reported on by DRDGOLD’s auditors.
23 August 2013 2Results for the quarter and year ended 30 June 2013 |

Key features for the year (FY13 v FY12)
180% increase in total dividend to 28 SA cents per share
8% increase in gold production to 146 381oz
9% increase in operating profit to R679.3 million
11% increase in HEPS to 68 SA cents per share
10% increase in all-in sustaining costs to R365 569/kg
All-in sustaining cost margin steady at 20%
23 August 2013Results for the quarter and year ended 30 June 2013 | 3

Ergo trends
23 August 2013Results for the quarter and year ended 30 June 2013 | 4
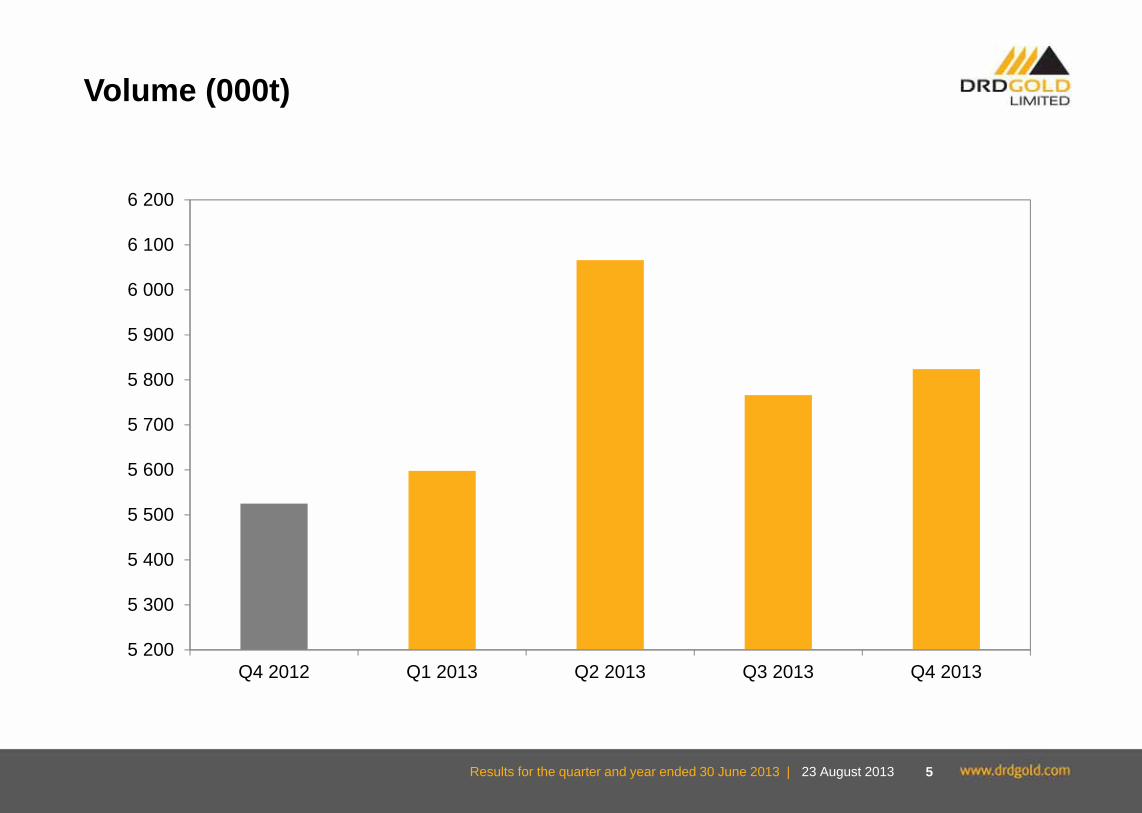
Volume (000t)
5 200
5 300
5 400
5 500
5 600
5 700
5 800
5 900
6 000
6 100
6 200
Q4 2012 Q1 2013 Q2 2013 Q3 2013 Q4 2013
23 August 2013Results for the quarter and year ended 30 June 2013 | 5

Production (kg)
0
200
400
600
800
1 000
1 200
1 400
Q4 2012 Q1 2013 Q2 2013 Q3 2013 Q4 2013
23 August 2013Results for the quarter and year ended 30 June 2013 | 6

Financial indicators
23 August 2013Results for the quarter and year ended 30 June 2013 | 7

Operating margin (%)
23 August 2013Results for the quarter and year ended 30 June 2013 | 8
34
40
37
28
35
32
41
33
22
32
0
5
10
15
20
25
30
35
40
45
Q1 Q2 Q3 Q4 YTD
FY2012 FY2013

All-in sustaining costs margin (%)
23 August 2013Results for the quarter and year ended 30 June 2013 | 9
24
29
21
8
21
17
29
18
15
20
0
5
10
15
20
25
30
35
Q1 Q2 Q3 Q4 YTD
FY2012 FY2013

EBITDA (Rm)
113.0141.0
105.6
13.0
372.6
114.7
171.9
114.7101.5
502.8
0.0
100.0
200.0
300.0
400.0
500.0
600.0
Q1 Q2 Q3 Q4 YTD
FY2012 FY2013
23 August 2013Results for the quarter and year ended 30 June 2013 | 10

Free cash flow (Rm)
34.8
154.7
73.7
-55.3
207.9
-53.3
111.6
85.7
-46.1
97.9
-100
-50
0
50
100
150
200
250
Q1 Q2 Q3 Q4 YTD
FY2012 FY2013
23 August 2013Results for the quarter and year ended 30 June 2013 | 11

HEPS (SA cents)
1215
12
22
61
20
25
14
9
68
0
10
20
30
40
50
60
70
80
Q1 Q2 Q3 Q4 YTD
FY2012 FY2013
23 August 2013Results for the quarter and year ended 30 June 2013 | 12

Financials
23 August 2013Results for the quarter and year ended 30 June 2013 | 13

Financial review: income statement for the year ended 30 June 2013
FY2013 FY2012 CommentsRm Rm
Continuing operations
Revenue 2 076.5 1 764.2 Up 18%, higher gold price and gold production
Net operating costs (1 397.2) (1 142.0) Up 22%, volumes up 8% and annual cost increases
Operating profit 679.3 622.2 Up 9%
Depreciation (143.8) (119.2) Up 21%, new Ergo infrastructure being depreciated
Movement in provision for environmental rehab (15.3) (59.5)
Environmental rehab costs (45.4) (47.3)
Other income and costs (353.8) (151.0) Includes impairments of R238.0 million
Net finance income 24.0 15.8
Profit before tax 145.0 261.0
Taxation (44.9) (8.0)
Profit after tax 100.1 253.0
Discontinued operation - 124.0 Blyvoor sold 1 June 2012
Net profit 100.1 377.0
HEPS from continuing operations (cents) 68 61 Up 11%
EBITDA 502.8 372.6 Up 35%
23 August 2013Results for the quarter and year ended 30 June 2013 | 14

Financial review: balance sheet at 30 June 2013
30 Jun 2013 30 Jun 2012 CommentsRm Rm
Property, plant and equipment 1 756.3 1 641.6
Non-current investments and other assets 130.1 176.1 Includes Village shares of R34.1 million
Environmental rehabilitation trust funds and guarantees 177.0 165.6
Deferred tax asset 2.9 38.3
Cash and cash equivalents 377.2 298.5 Positive free cash flow offset by dividends paid
Other current assets 227.6 172.1
Total assets 2 671.1 2 492.2
Equity 1 648.3 1 633.9
Long-term liabilities 152.0 6.0 Total borrowings of R165 million
Provision for environmental rehabilitation 524.3 504.3
Deferred tax liability 100.7 87.0
Current liabilities 245.8 261.0
Total equity and liabilities 2 671.1 2 492.2
Current ratio (times) 2.5 1.8 Strong liquidity
Debt to equity ratio (%) 10 2 Prudent debt to equity ratio
23 August 2013Results for the quarter and year ended 30 June 2013 | 15

Update on flotation/fine-grind project
Flotation circuit, fine-grind both in final commissioning phase
• flotation circuit achieving 4% mass-pull, 40% gold retention; float tail at 0.182g
Elution circuit scheduled for commissioning by September 2013
Full benefit expected in December quarter
28 August 2012Results for the year ended 30 June 2012 16

Sustainable development
23 August 2013Results for the quarter and year ended 30 June 2013 | 17

Financial capital
Dividend yield: 5%Return on equity: 18%All-in sustaining costs margin: 20%Salaries, wages, other benefits paid to employees: R283 million (33% of total expenditure) Total expenditure on goods, services: R1 293 millionDividends paid to shareholders: R107 million
23 August 2013Results for the quarter and year ended 30 June 2013 | 18

Intellectual and manufactured capital
Improving recoveries:
• flotation/fine grind process
• second CIL circuit at Ergo refurbished
Increasing deposition capacity at Brakpan tailings facility (BTF)
Creating synergies: Crown/Ergo pipeline
23 August 2013Results for the quarter and year ended 30 June 2013 | 19

Human capital
Best Life launched
• focus on financial literacy, career development and health and wellness
• employee support programme launched
• substance dependency, stress, conflict, personal development
191 community pupils benefiting from Mathematics and Science Centre of Excellence
63 community pupils enrolled in three year entrepreneur course
285 community learners completing courses in engineering, literacy and small enterprise management in the last six months
46% HDSAs in management
23 August 2013Results for the quarter and year ended 30 June 2013 | 20

Natural capital
Mega water consumer: 2 443Ml/pm
Carbon footprint: pipeline design delivers 18% electricity cost reduction
R67.9 million spent on dump rehabilitation
• 46ha of side slopes, 75ha of top surfaces vegetated during FY2013
• 115ha of dust netting installed
23 August 2013Results for the quarter and year ended 30 June 2013 | 21

Social capital
Corporate social investment spend: R1.5 million
Socio-economic development project spend: R3.1 million
Uplift employees by providing life skills and knowledge-based initiatives (Best Life and Vuselela)
Flagship Ergo Business Development Academy (EBDA):
• R25.5 million total cost
• 2 474 people trained
23 August 2013Results for the quarter and year ended 30 June 2013 | 22

Looking ahead
Flotation/fine-grind circuit commissioning to continue
• targeting completion, stable production by December 2013
Increased focus on achieving sustainable profits
Work towards targets to reduce:
• potable water usage
• dust emissions
Invest substantially in internal social capital
• improve employee competence in personal financial management to combat over-indebtedness/garnishee order scourge
Test new technologies’ potential for greater scale, existing footprint and beyond
23 August 2013Results for the quarter and year ended 30 June 2013 | 23

Registered office 1st Floor, Quadrum 1Quadrum Office Park50 Constantia BoulevardConstantia Kloof Ext 28RoodepoortSouth Africa
PO Box 390 Maraisburg 1700 South Africa
Contact details Tel: +27 (0) 11 470 2600 Fax: +27 (0) 11 470 2618 Email: [email protected]
[email protected] Website: www.drdgold.com
Shareholder data (Incorporated in the Republic of South Africa) Registration No.1895/000926/06 JSE share code: DRDISIN: ZAE 000058723 Issuer code: DUSM NYSE trading symbol: DRD
23 August 2013Results for the quarter and year ended 30 June 2013 | 24