NIH Public Access - California Institute of...
32
Discovery of functional elements in 12 Drosophila genomes using evolutionary signatures Alexander Stark 1,2,* , Michael F. Lin 1,2,* , Pouya Kheradpour 2,* , Jakob S. Pedersen 3,4,* , Leopold Parts 5,6 , Joseph W. Carlson 7 , Madeline A. Crosby 8 , Matthew D. Rasmussen 2 , Sushmita Roy 9 , Ameya N. Deoras 2 , J. Graham Ruby 10,11 , Julius Brennecke 12 , Harvard FlyBase curators † , Berkeley Drosophila Genome Project † , Emily Hodges 12 , Angie S. Hinrichs 4 , Anat Caspi 13 , Benedict Paten 4,5,14 , Seung-Won Park 15 , Mira V. Han 16 , Morgan L. Maeder 17 , Benjamin J. Polansky 17 , Bryanne E. Robson 17 , Stein Aerts 18,19 , Jacques van Helden 20 , Bassem Hassan 18,19 , Donald G. Gilbert 21 , Deborah A. Eastman 17 , Michael Rice 22 , Michael Weir 23 , Matthew W. Hahn 16 , Yongkyu Park 15 , Colin N. Dewey 24 , Lior Pachter 25,26 , W. James Kent 4 , David Haussler 4 , Eric C. Lai 27 , David P. Bartel 10,11 , Gregory J. Hannon 12 , Thomas C. Kaufman 21 , Michael B. Eisen 28,29 , Andrew G. Clark 30 , Douglas Smith 31 , Susan E. Celniker 7 , William M. Gelbart 8,32 , and Manolis Kellis 1,2 1 The Broad Institute, Massachusetts Institute of Technology and Harvard University, Cambridge, Massachusetts 02140, USA 2 Computer Science and Artificial Intelligence Laboratory, MIT, Cambridge, Massachusetts 02139, USA 3 The Bioinformatics Centre, Department of Molecular Biology, University of Copenhagen, Ole Maaloes Vej 5, 2200 Copenhagen N, Denmark 4 Center for Biomolecular Science and Engineering, University of California, Santa Cruz, California 95064, USA 5 Wellcome Trust Sanger Institute, Wellcome Trust Genome Campus, Hinxton, Cambridge CB10 1SA, UK 6 Institute of Computer Science, University of Tartu, Estonia 7 BDGP, LBNL, 1 Cyclotron Road MS 64-0119, Berkeley, California 94720, USA 8 FlyBase, The Biological Laboratories, Harvard University, 16 Divinity Avenue, Cambridge, Massachusetts 02138, USA Author Information Reprints and permissions information is available at www.nature.com/reprints. Correspondence and requests for materials should be addressed to M.K. ([email protected]). * These authors contributed equally to this work. † Lists of participants and affiliations appear at the end of the paper. Author Contributions Organizing committee: Manolis Kellis, William Gelbart, Doug Smith, Andrew G. Clark, Michael E. Eisen, Thomas C. Kaufman; protein-coding gene prediction: Michael F. Lin, Ameya N. Deoras, Mira V. Han, Matthew W. Hahn, Donald G. Gilbert, Michael Weir, Michael Rice, Manolis Kellis; manual curation of protein-coding genes: Madeline A. Crosby, Harvard FlyBase curators, William M. Gelbart; validation of protein-coding genes: Joseph W. Carlson, Berkeley Drosophila Genome Project, Susan E. Celniker; non-coding RNA gene prediction: Jakob S. Pedersen, David Haussler, Yongkyu Park, Seung-Won Park, Manolis Kellis; microRNA gene prediction: Alexander Stark, Pouya Kheradpour, Leopold Parts, Manolis Kellis; microRNA cloning and sequencing: Julius Brennecke, Emily Hodges, Gregory J. Hannon; microRNA target prediction: Alexander Stark, J. Graham Ruby, Manolis Kellis, Eric C. Lai, David P. Bartel; motif identification: Alexander Stark, Pouya Kheradpour, Manolis Kellis; motif instance prediction: Alexander Stark, Pouya Kheradpour, Sushmita Roy, Morgan L. Maeder, Benjamin J. Polansky, Bryanne E. Robson, Deborah A. Eastman, Stein Aerts, Bassem Hassan, Jacques van Helden, Manolis Kellis; genome alignments: Angie S. Hinrichs, W. James Kent, Anat Caspi, Lior Pachter, Colin N. Dewey, Benedict Paten; phylogeny and branch length estimation: Matthew D. Rasmussen, Manolis Kellis; final manuscript preparation: Alexander Stark, Michael F. Lin, Pouya Kheradpour, Jakob Pedersen, Manolis Kellis. Harvard FlyBase curators Madeline A. Crosby1, Beverley B. Matthews1, Andrew J. Schroeder1, L. Sian Gramates1, Susan E. St Pierre1, Margaret Roark1, Kenneth L. Wiley Jr1, Rob J. Kulathinal1, Peili Zhang1, Kyl V. Myrick1, Jerry V. Antone1 & William M. Gelbart1 Berkeley Drosophila Genome Project Joseph W. Carlson2, Charles Yu2, Soo Park2, Kenneth H. Wan2 & Susan E. Celniker2 NIH Public Access Author Manuscript Nature. Author manuscript; available in PMC 2008 November 8. Published in final edited form as: Nature. 2007 November 8; 450(7167): 219–232. NIH-PA Author Manuscript NIH-PA Author Manuscript NIH-PA Author Manuscript
Transcript of NIH Public Access - California Institute of...
Discovery of functional elements in 12 Drosophila genomes usingevolutionary signatures
Alexander Stark1,2,*, Michael F. Lin1,2,*, Pouya Kheradpour2,*, Jakob S. Pedersen3,4,*,Leopold Parts5,6, Joseph W. Carlson7, Madeline A. Crosby8, Matthew D. Rasmussen2,Sushmita Roy9, Ameya N. Deoras2, J. Graham Ruby10,11, Julius Brennecke12, HarvardFlyBase curators†, Berkeley Drosophila Genome Project†, Emily Hodges12, Angie S.Hinrichs4, Anat Caspi13, Benedict Paten4,5,14, Seung-Won Park15, Mira V. Han16, MorganL. Maeder17, Benjamin J. Polansky17, Bryanne E. Robson17, Stein Aerts18,19, Jacques vanHelden20, Bassem Hassan18,19, Donald G. Gilbert21, Deborah A. Eastman17, MichaelRice22, Michael Weir23, Matthew W. Hahn16, Yongkyu Park15, Colin N. Dewey24, LiorPachter25,26, W. James Kent4, David Haussler4, Eric C. Lai27, David P. Bartel10,11, GregoryJ. Hannon12, Thomas C. Kaufman21, Michael B. Eisen28,29, Andrew G. Clark30, DouglasSmith31, Susan E. Celniker7, William M. Gelbart8,32, and Manolis Kellis1,2
1 The Broad Institute, Massachusetts Institute of Technology and Harvard University, Cambridge,Massachusetts 02140, USA
2 Computer Science and Artificial Intelligence Laboratory, MIT, Cambridge, Massachusetts 02139, USA
3 The Bioinformatics Centre, Department of Molecular Biology, University of Copenhagen, Ole Maaloes Vej5, 2200 Copenhagen N, Denmark
4 Center for Biomolecular Science and Engineering, University of California, Santa Cruz, California 95064,USA
5 Wellcome Trust Sanger Institute, Wellcome Trust Genome Campus, Hinxton, Cambridge CB10 1SA, UK
6 Institute of Computer Science, University of Tartu, Estonia
7 BDGP, LBNL, 1 Cyclotron Road MS 64-0119, Berkeley, California 94720, USA
8 FlyBase, The Biological Laboratories, Harvard University, 16 Divinity Avenue, Cambridge, Massachusetts02138, USA
Author Information Reprints and permissions information is available at www.nature.com/reprints. Correspondence and requests formaterials should be addressed to M.K. ([email protected]).*These authors contributed equally to this work.†Lists of participants and affiliations appear at the end of the paper.Author Contributions Organizing committee: Manolis Kellis, William Gelbart, Doug Smith, Andrew G. Clark, Michael E. Eisen,Thomas C. Kaufman; protein-coding gene prediction: Michael F. Lin, Ameya N. Deoras, Mira V. Han, Matthew W. Hahn, Donald G.Gilbert, Michael Weir, Michael Rice, Manolis Kellis; manual curation of protein-coding genes: Madeline A. Crosby, Harvard FlyBasecurators, William M. Gelbart; validation of protein-coding genes: Joseph W. Carlson, Berkeley Drosophila Genome Project, Susan E.Celniker; non-coding RNA gene prediction: Jakob S. Pedersen, David Haussler, Yongkyu Park, Seung-Won Park, Manolis Kellis;microRNA gene prediction: Alexander Stark, Pouya Kheradpour, Leopold Parts, Manolis Kellis; microRNA cloning and sequencing:Julius Brennecke, Emily Hodges, Gregory J. Hannon; microRNA target prediction: Alexander Stark, J. Graham Ruby, Manolis Kellis,Eric C. Lai, David P. Bartel; motif identification: Alexander Stark, Pouya Kheradpour, Manolis Kellis; motif instance prediction:Alexander Stark, Pouya Kheradpour, Sushmita Roy, Morgan L. Maeder, Benjamin J. Polansky, Bryanne E. Robson, Deborah A. Eastman,Stein Aerts, Bassem Hassan, Jacques van Helden, Manolis Kellis; genome alignments: Angie S. Hinrichs, W. James Kent, Anat Caspi,Lior Pachter, Colin N. Dewey, Benedict Paten; phylogeny and branch length estimation: Matthew D. Rasmussen, Manolis Kellis; finalmanuscript preparation: Alexander Stark, Michael F. Lin, Pouya Kheradpour, Jakob Pedersen, Manolis Kellis.Harvard FlyBase curators Madeline A. Crosby1, Beverley B. Matthews1, Andrew J. Schroeder1, L. Sian Gramates1, Susan E. StPierre1, Margaret Roark1, Kenneth L. Wiley Jr1, Rob J. Kulathinal1, Peili Zhang1, Kyl V. Myrick1, Jerry V. Antone1 & William M.Gelbart1Berkeley Drosophila Genome Project Joseph W. Carlson2, Charles Yu2, Soo Park2, Kenneth H. Wan2 & Susan E. Celniker2
NIH Public AccessAuthor ManuscriptNature. Author manuscript; available in PMC 2008 November 8.
Published in final edited form as:Nature. 2007 November 8; 450(7167): 219–232.
NIH
-PA Author Manuscript
NIH
-PA Author Manuscript
NIH
-PA Author Manuscript
9 Department of Computer Science, University of New Mexico, Albuquerque, New Mexico 87131, USA
10 Department of Biology, MIT, Cambridge, Massachusetts 02139, USA
11 Whitehead Institute, Cambridge, Massachusetts 02142, USA
12 Cold Spring Harbor Laboratory, Watson School of Biological Sciences, 1 Bungtown Road, Cold SpringHarbor, New York 11724, USA
13 University of California, San Francisco/University of California, Berkeley Joint Graduate Group inBioengineering, Berkeley, California 97210, USA
14 EMBL Nucleotide Sequence Submissions, European Bioinformatics Institute, Wellcome Trust GenomeCampus, Hinxton, Cambridge CB10 1SD, UK
15 Department of Cell Biology and Molecular Medicine, G-629, MSB, 185 South Orange Avenue, UMDNJ-New Jersey Medical School, Newark, New Jersey 07103, USA
16 Department of Biology and School of Informatics, Indiana University, Indiana 47405, USA
17 Department of Biology, Connecticut College, New London, Connecticut 06320, USA
18 Laboratory of Neurogenetics, Department of Molecular and Developmental Genetics, VIB, 3000 Leuven,Belgium
19 Department of Human Genetics, K. U. Leuven School of Medicine, 3000 Leuven, Belgium
20 Department de Biologie Moleculaire, Universite Libre de Bruxelles, 1050 Brussels, Belgium
21 Department of Biology, Indiana University, Bloomington, Indiana 47405, USA
22 Department of Mathematics and Computer Science, Wesleyan University, Middletown, Connecticut 06459,USA
23 Biology Department, Wesleyan University Middletown, Connecticut 06459, USA
24 Department of Biostatistics and Medical Informatics, University of Wisconsin-Madison, Madison,Wisconsin 53706, USA
25 Department of Mathematics, University of California at Berkeley, Berkeley, California 94720, USA
26 Department of Computer Science, University of California at Berkeley, Berkeley, California 94720, USA
27 Department of Developmental Biology, Memorial Sloan-Kettering Cancer Center, New York, New York10021, USA
28 Graduate Group in Biophysics, Department of Molecular and Cell Biology, and Center for IntegrativeGenomics, University of California, Berkeley, California 94720, USA
29 Lawrence Berkeley National Laboratory, Life Sciences Division, Berkeley, California 94720, USA
30 Department of Molecular Biology and Genetics, Cornell University, Ithaca, New York 14853, USA
31 Agencourt Bioscience Corporation, 500 Cummings Center, Suite 2450, Beverly, Massachusetts 01915,USA
32 The Department of Molecular and Cellular Biology, Harvard University, Cambridge, Massachusetts02138, USA
AbstractSequencing of multiple related species followed by comparative genomics analysis constitutes apowerful approach for the systematic understanding of any genome. Here, we use the genomes of12 Drosophila species for the de novo discovery of functional elements in the fly. Each type of
Stark et al. Page 2
Nature. Author manuscript; available in PMC 2008 November 8.
NIH
-PA Author Manuscript
NIH
-PA Author Manuscript
NIH
-PA Author Manuscript
functional element shows characteristic patterns of change, or ‘evolutionary signatures’, dictated byits precise selective constraints. Such signatures enable recognition of new protein-coding genes andexons, spurious and incorrect gene annotations, and numerous unusual gene structures, includingabundant stop-codon readthrough. Similarly, we predict non-protein-coding RNA genes andstructures, and new microRNA (miRNA) genes. We provide evidence of miRNA processing andfunctionality from both hairpin arms and both DNA strands. We identify several classes of pre- andpost-transcriptional regulatory motifs, and predict individual motif instances with high confidence.We also study how discovery power scales with the divergence and number of species compared,and we provide general guidelines for comparative studies.
The sequencing of the human genome and the genomes of dozens of other metazoan specieshas intensified the need for systematic methods to extract biological information directly fromDNA sequence. Comparative genomics has emerged as a powerful methodology for thisendeavour1,2. Comparison of few (two–four) closely related genomes has proven successfulfor the discovery of protein-coding genes3–5, RNA genes6,7, miRNA genes8–11 andcatalogues of regulatory elements3,4,12–14. The resolution and discovery power of thesestudies should increase with the number of genomes15–20, in principle enabling the systematicdiscovery of all conserved functional elements.
The fruitfly Drosophila melanogaster is an ideal system for developing and evaluatingcomparative genomics methodologies. Over the past century, Drosophila has been a pioneeringmodel in which many of the basic principles governing animal development and populationbiology were established21. In the past decade, the genome sequence of D. melanogasterprovided one of the first systematic views of a metazoan genome22, and the ongoing effort bythe FlyBase and Berkeley Drosophila Genome Project (BDGP) groups established a systematichigh-quality genome annotation23–25. Moreover, the fruit-fly benefits from extensiveexperimental resources26–28, which enable novel functional elements to be systematicallytested and used in the evaluation of genetic screens29,30.
The fly research community has sequenced, assembled and annotated the genomes of 12Drosophila species22,31,32 at a range of evolutionary distances from D. melanogaster (Fig.1a, b). The analysis of these genomes was organized around two complementary aims. Thefirst, described in an accompanying paper32, was to understand the evolution of genes andchromosomes on the Drosophila phylogeny, and how it relates to speciation and adaptation.The second goal, described here, was to develop general comparative methodologies todiscover and refine functional elements in D. melanogaster using the 12 genomes, and toinvestigate the scaling of discovery power and its implications for studies in vertebrates (Fig.1c).
Here, we report genome-wide alignments of the 12 species (Supplementary Information 1),and the systematic discovery of euchromatic functional elements in the D. melanogastergenome. We predict and refine thousands of protein-coding exons, RNA genes and structures,miRNAs, pre- and post-transcriptional regulatory motifs and regulatory targets. We validatemany of these elements using complementary DNA (cDNA) sequencing, human curation,small RNA sequencing, and correlation with experimentally supported transcription factor andmiRNA targets. In addition, our analysis leads to several specific biological findings, listedbelow.
• We predict 123 novel polycistronic transcripts, 149 genes with apparent stop-codonreadthrough and several candidate programmed frameshifts, with potential roles inregulation, localization and function of the corresponding protein products.
Stark et al. Page 3
Nature. Author manuscript; available in PMC 2008 November 8.
NIH
-PA Author Manuscript
NIH
-PA Author Manuscript
NIH
-PA Author Manuscript
• We make available the first systematic prediction of general RNA genes and structures(non-coding RNAs (ncRNAs)) in Drosophila, including several structures probablyinvolved in translational regulation and adenosine-to-inosine RNA editing (A-to-Iediting).
• We present comparative and experimental evidence that some miRNA loci yieldmultiple functional products, from both hairpin arms or from both DNA strands,thereby increasing the versatility and complexity of miRNA-mediated regulation.
• We provide further comparative evidence for miRNA targeting in protein-codingexons.
• We report an initial network of pre- and post-transcriptional regulatory targets inDrosophila on the basis of individual high-confidence motif occurrences.
Comparative genomics and evolutionary signaturesAlthough multiple closely related genomes provide sufficient neutral divergence forrecognition of functional regions in stretches of highly conserved nucleotides16,17,33,measures of nucleotide conservation alone do not distinguish between different types offunctional elements. Moreover, functional elements that tolerate abundant ‘silent’ mutations,such as protein-coding exons and many regulatory motifs, might not be detected whensearching on the basis of strong nucleotide conservation.
Across many genomes spanning larger evolutionary distances, the information in the patternsof sequence change reveals evolutionary signatures (Fig. 2) that can be used for systematicgenome annotation. Protein-coding regions show highly constrained codon substitutionfrequencies34 and insertions and deletions that are heavily biased to be multiples of three3(Fig. 2a). RNA genes and structures tolerate substitutions that preserve base pairing35,36 (Fig.2b). MicroRNA hairpins show a characteristic conservation profile with high conservation inthe stem and mutations in loop regions10,11 (Fig. 2c). Finally, regulatory motifs are markedby high levels of genome-wide conservation3,4,12–14, and post-transcriptional motifs showstrand-biased conservation12 (Fig. 2d, e).
We find that these signatures can be much more precise for genome annotation than the overalllevel of nucleotide conservation (for example, Fig. 3a).
Revisiting the protein-coding gene catalogueThe annotation of protein-coding genes remains difficult in metazoan genomes owing to shortexons and complex gene structures with abundant alternative splicing. Comparativeinformation has improved computational gene predictors5, but their accuracy still falls far shortof well-studied gene catalogues such as the FlyBase annotation, which combines computationalgene prediction37, high-throughput experimental data38–42 and extensive manualcuration23. Recognizing this, we set out not only to produce an independent computationalannotation of protein-coding genes in the fly genome, but also to assess and refine its alreadyhigh-quality annotations43.
Our analyses of D. melanogaster coding genes are based on two independent evolutionarysignatures unique to protein-coding regions (Fig. 2a): (1) reading frame conservation (RFC)3, which observes the tendency of nucleotide insertions and deletions to preserve the codonreading frame; and (2) codon substitution frequencies (CSF, see Supplementary Methods 2a),which observes mutational biases towards synonymous codon substitutions and conservativeamino acid changes, similar to the non-synonymous/synonymous substitution ratio KA/KS
34and other methods44–46.
Stark et al. Page 4
Nature. Author manuscript; available in PMC 2008 November 8.
NIH
-PA Author Manuscript
NIH
-PA Author Manuscript
NIH
-PA Author Manuscript
Assessing and refining existing gene annotationsWe first assessed the 13,733 euchromatic genes in FlyBase47 release 4.3. Using the abovemeasures, we defined tests that ‘confirmed’ genes supported by the evolutionary evidence,‘rejected’ genes inconsistent with protein-coding selection, or ‘abstained’ for genes that werenot aligned or with ambiguous comparative evidence (Supplementary Methods 2a). Of the4,711 genes with descriptive names, we confirmed 97%, rejected 1% and abstained for 2%,whereas the same criteria applied to 15,000 random non-coding regions ≥300 nucleotidesrejected 99% of candidates and confirmed virtually none (Table 1). Together, these resultsillustrate the high sensitivity and specificity of our criteria.
Applying the same criteria to the 9,022 genes lacking a descriptive name (genes designatedonly by a CG identifier, referred to hereafter as CGid-only genes), our tests accepted 87%,rejected 5% (414 genes) and abstained for 8%. This provides strong evidence that most CGid-only genes encode proteins, but also suggests that they may be less constrained20,32 and/ormay include incorrect annotations. Indeed, on manual review, 222 (54%) of the 414 rejectedCGid-only genes were re-categorized as non-protein-coding or deleted (of which 55 were dueto genomically primed clones), 73 (18%) were flagged as being of uncertain quality, and theremaining 119 (29%) were kept unchanged (Fig. 3b). Some of these are probably rapidlyevolving protein-coding genes, but others may also prove to be non-protein-coding genes orspurious; in fact, none of these had any functional gene ontology (GO) annotation48.
In addition, we proposed specific corrections and adjustments to hundreds of existing transcriptmodels, including translation start site adjustments (Supplementary Fig. 2b), alternative spliceboundaries (Supplementary Fig. 2b), recent nonsense mutations (Supplementary Fig. 2c) andalternative translational reading frames43.
Identifying new genes and exonsTo predict new protein-coding exons, we integrated our metrics into a probabilistic algorithmthat determines an optimal segmentation of the genome into protein-coding and non-codingregions (Fig. 3a) on the basis of whole-genome sequence alignments of the 12 fly species(Supplementary Methods 2a). Our genome-wide search predicted 1,193 new protein-codingexons, mostly in euchromatic regions annotated as intergenic (43%), intronic (26%), or 5′/3′untranslated region (UTR; 23%) in FlyBase annotation release 4.3.
We manually reviewed 928 of these predictions according to FlyBase standards23(Supplementary Methods 2a), leading to 142 new gene models (incorporating 192 predictions)and 438 revised gene models (incorporating 562 predictions) (Fig. 3b). In parallel, we tested184 predictions (126 intergenic, 58 intronic) by directed cDNA sequencing using inversepolymerase chain reaction (inverse PCR) of circularized full-length clones49–51 (Fig. 3c),which validated 120 targeted predictions (65%) and an additional 42 predictions not directlytargeted but contained within the recovered transcripts. Predictions in intergenic regionsyielded 88 full-length cDNAs, providing evidence for 50 new genes and modification of 39gene models. Predictions within introns of existing annotations yielded 32 full-length cDNAs,of which only 18 (56%) represent new splice variants of the surrounding gene, whereas theremaining 14 revealed nested or interleaved gene structures. This provides additional evidencethat such complex gene structures are not rare in Drosophila23.
Overall, 83% of the 948 predicted exons that we assessed by manual curation or cDNAsequencing were incorporated into FlyBase, resulting in 150 new genes and modifications tohundreds of existing gene models. Finally, the 245 predictions that we did not assess were innon-coding regions of existing transcript models, or were already included in FlyBaseindependent of our study. In an independent analysis52, we predicted 98 new genes on the
Stark et al. Page 5
Nature. Author manuscript; available in PMC 2008 November 8.
NIH
-PA Author Manuscript
NIH
-PA Author Manuscript
NIH
-PA Author Manuscript
basis of inferred homology to predicted genes in the informant species32, of which 63%matched the above predictions.
Discovering unusual features of protein-coding genesOur analysis also predicted an abundance of unusual protein-coding genes that call for follow-up experimental investigation. First, we found open reading frames with clear protein-codingsignatures and conserved start and stop sites on the transcribed strand of annotated UTRs,indicative of polycistronic transcripts23,53,54. These include 73% of 115 annotated dicistronictranscripts and 135 new candidate cistrons of 123 genes (Supplementary Fig. 2b).
Second, we predicted that 149 genes undergo stop codon readthrough, with protein-codingselection continuing past a deeply conserved stop codon (Fig. 3d), in some cases for hundredsof amino acids. It is unlikely that these genes are selenoproteins, as they appear to lack SECISelements that direct selenocysteine recoding55–58. Other mechanisms may instead be at work,such as regulation of ribosomal release factors59, A-to-I editing39,60,61, alternative splicing,or other less-characterized mechanisms62. In fact, these genes are significantly enriched inneuronal proteins (P =10−4), which frequently undergo A-to-I editing63.
Third, we found four genes in which CSF signatures abruptly shift from one reading frame toanother in the absence of nearby intron–exon boundaries or insertions and deletions (Fig. 3e).These are suggestive of conserved ‘programmed’ frameshifts64, which are thought to be rarein eukaryotes.
Overall, our results affected over 10% of protein-coding genes, and will be available in futurereleases of FlyBase. They also suggest that several types of unusual protein-coding genestructure may be more prevalent in the fly than previously appreciated.
RNA genes and structuresSeveral comparative approaches to RNA gene identification have been developed6,7,65 thatrecognize their characteristic properties: compensatory double substitutions of pairednucleotides (for example, A•U↔C•G), structure-preserving single-nucleotide mutationsinvolving G•U base pairs (G•U↔G•C and G•U↔A•U), and few nucleotide substitutionsdisrupting functional base pairs (Fig. 2b). To predict new structures, we applied EvoFold7 inhighly conserved segments of the 12 Drosophila species and focused on high-stringencycandidates with strong support by compensatory changes (Supplementary Methods 4).
Our search led to 394 predictions, recovering 68 known RNA structures (primarily transferRNA genes) in 0.02% of the genome (570-fold enrichment). The novel candidates consistedof 177 structures in intergenic regions (54%), 103 in introns (32%), 36 in 3′ UTRs (11%) and10 in 5′ UTRs (3%). In addition, we predicted 200 structures in protein-coding regions(Supplementary Methods 3). Notably, 75% of 3′ UTR structures and 80% of 5′ UTR structureswere predicted on the transcribed strand, suggesting that they are frequently part of themessenger RNA. In contrast, only 47% of intronic structures are on the transcribed strand,suggesting that they are largely independent of the surrounding genes.
Known and novel types of RNA genesOf the 177 predicted intergenic structures, 30 were detected in a tiling-array expressionstudy42. This fraction (17%) is significantly above that for all conserved intergenic regions(12%, P =0.007), but lower than that of known intergenic ncRNAs (21%), suggesting that thesecandidates may be of lower abundance, temporally or spatially constrained, or might includefalse positives. Two predictions were expressed throughout development, one extending theannotation of a previously reported but uncharacterized ncRNA66 and the other probably
Stark et al. Page 6
Nature. Author manuscript; available in PMC 2008 November 8.
NIH
-PA Author Manuscript
NIH
-PA Author Manuscript
NIH
-PA Author Manuscript

representing a novel type of ncRNA. The predictions also included nine novel H/ACA-boxsmall nucleolar RNA candidates in introns of ribosomal genes, known to frequently containsmall nucleolar RNAs that guide post-transcriptional base modifications of ncRNAs67.
Likely A-to-I editing structuresMany of the 48 intronic candidates on the transcribed strand and many of the 200 hairpins incoding sequence are probably involved in A-to-I editing or post-transcriptional regulation (Fig.4a). Hairpins in coding sequence were associated with 11 of the 157 known editing sites (120-fold enrichment) and both intronic and coding-sequence hairpins showed a strong enrichmentfor ion-channel genes (6%, P =0.007 and 10%, P =2×10⁻¹², respectively), known to be frequentediting targets. Editing is known to occur at multiple sites in the same gene63, and we find anadditional 10 hairpins in known editing targets, as well as 40 additional hairpins clustered in18 genes not previously known to be edited (for example huntingtin68, which harbours fourpredicted hairpins, more than any other gene). Intronic predictions also showed the highestabundance of compensatory substitutions: for example, Resistant to dieldrin (Fig. 2b)contained a 26-base-pair (bp) intronic hairpin flanked by exons known to be edited69 with astriking 16 compensatory changes, lodestar showed one hairpin with 11 compensatorychanges, and Inverted repeat-binding protein showed one hairpin with 10 compensatorysubstitutions (Fig. 4b).
Likely regulatory UTR structuresWe predicted 38 structures in 3′ UTRs, a density twofold higher than the genomic average,whereas fewer than 10 such examples are currently known70. A considerable fraction of theselies in regulatory genes (14 out of 38; P =10−4), including several transcriptional regulators(for example, cas, spen and Alh), the tyrosine phosphatase PTP-ER and the translation initiationfactor eIF3-S8. This suggests that many regulatory genes may themselves be regulated post-transcriptionally through these structures.
3′ UTR structures were also enriched for genes involved in mRNA localization (3 out of 38,P =2.7 ×10⁻⁴), including oo18 RNA-binding protein (orb) and staufen (stau), both of whichcontain double-stranded RNA-binding domains, are involved in axis specification duringoogenesis, and interact with the mRNA of maternal effect protein oskar. The hairpin in orb isknown to be important for mRNA transport and localization71, whereas the highly similarstau hairpin has not been previously described to our knowledge.
The ten structures found in 5′ UTRs probably contain binding sites for factors that regulatetranslation. For example, the fly homologue of yeast ribosomal protein RPL24 contains ahairpin structure overlapping its start codon (Fig. 4c). This is interesting in light of highconservation upstream of the start codon in yeast ribosomal proteins3,4, and findings thatribosomal proteins bind to their mRNAs and control translation in prokaryotes72,73.
Conserved RNA structures in roX2 recruit MSLIn an independent study74, we searched for conserved regions in the non-coding roX1 androX2 (RNA on the X) genes to gain insights into their function. Both RNAs are components ofthe MSL (Male-specific lethal) complex and are crucial for dosage compensation in male flies,inducing lysine 16 acetylation of histone H4, leading to upregulation of hundreds of genes onthe X chromosome75. We identified several stem-loop structures with repeated sequencemotifs (for example, GUUNUACG), and found that tandem repeats of one of these weresufficient to recruit MSL complexes to the X chromosome and to induce acetylation of lysine16 of histone H4. Although this structure could not fully rescue roX-deficient males, our resultssuggest that it mediates MSL recruitment during roX2-dependent chromatin modification and
Stark et al. Page 7
Nature. Author manuscript; available in PMC 2008 November 8.
NIH
-PA Author Manuscript
NIH
-PA Author Manuscript
NIH
-PA Author Manuscript
dosage compensation, illustrating the power of evolutionary evidence for directingexperimental studies.
Prediction and characterization of miRNA genesFocusing on specific classes of RNA genes markedly increases the accuracy of RNA geneprediction, reviewed in refs 35, 76 and illustrated here for Drosophila miRNA genes. Thecommon biogenesis and function of miRNAs77 lead to evolutionary and structural signatures(Fig. 2c) that can be used for their systematic de novo discovery8–11. Using such signaturesin the 12 fly genomes (Supplementary Methods 4a, b), we predicted 101 miRNAs78(Supplementary Table 4d), which include 60 of the 74 verified Rfam miRNAs (81%), whilespanning less than 0.006% of the fly genome (13,500-fold nucleotide enrichment).
Comparison of our predictions with high-throughput sequencing data of short RNA librariesfrom different stages and tissues of D. melanogaster78,79 revealed that 84 of the 101predictions (83%), including 24 of the 41 novel predictions (59%), were authentic miRNAgenes (Fig. 5a and Supplementary Table 4d). An independent computational method79 had 20of its 45 novel predictions validated when used across six Drosophila species. Additionalcandidates may represent genuine miRNAs whose temporal or spatial expression pattern doesnot overlap with the surveyed libraries.
Several of the validated miRNAs were on the transcribed strand of introns or clustered withother miRNAs. For example, mir-11 and mir-998 (the vertebrate homologue of which,mir-29, has been implicated in cancer80) were both found in the last intron of E2f, and mightbe involved in cell-cycle regulation (Fig. 5b). Notably, two predictions overlapped exons ofpreviously annotated protein-coding genes that were independently rejected above (Fig. 5c),providing an explanation for the previously observed transcripts of these annotations andhighlighting the importance of specific signatures for genome annotation.
High-throughput sequencing data discovered an additional 50 miRNAs not foundcomputationally79,81, thereby illustrating the limitations of purely computational approaches.Some of these had precursor structures not seen previously for animal miRNAs, includingunusually long hairpins79 and hairpins corresponding to short introns (mirtrons)81,82. Theremaining were often less broadly conserved or showed unusual conservation properties.
Signatures for mature miRNA annotationThe exact position of 5′ cleavage of mature miRNAs is important, because it dictates the coreof the target recognition sequence83–85. This leads to unique structural and evolutionarysignatures, including direct signals, present at the 5′ cleavage site, and indirect signals,stemming from the relationship of miRNAs with their target genes (Supplementary Methods4a, c). Combined into a computational framework78, these signatures predicted the exact startposition in 47 of the 60 cloned Rfam miRNAs (78%), and were within 1 bp in 51 cases (85%).The method disagreed with the previous annotation in 9 of the 14 Rfam miRNAs that were notpreviously cloned, of which 6 were confirmed by sequencing reads78,79, leading to markedchanges in the inferred target spectrum (Fig. 5d). Prediction accuracy was significantly lower(41% exact, 61% within 1 nucleotide) for novel miRNAs, which, however, also showed lessaccurate processing in vivo78,79.
New insights into miRNA function and biogenesisWe predicted targets for all conserved miRNAs identified by high-throughput sequencing79searching for conserved matches to the seed region (similar to ref. 86) evaluated using thebranch length score (Supplementary Methods 5a), a new scoring scheme described below.Whereas the resulting miRNA targeting network changed substantially79, we found that the
Stark et al. Page 8
Nature. Author manuscript; available in PMC 2008 November 8.
NIH
-PA Author Manuscript
NIH
-PA Author Manuscript
NIH
-PA Author Manuscript
novel and revised miRNAs shared many of their predicted targets with previously knownmiRNAs, resulting in a denser network with increased potential for combinatorialregulation78,79.
For ten miRNA hairpins, the mature miRNA and the corresponding miRNA star sequence(miRNA*, the small RNA from the opposite arm of the hairpin) both appeared to be functional:both reached high computational scores and were frequently sequenced78,79, often exceedingthe abundance of many mature miRNAs (Supplementary Table 4e). The Hox miRNAmir-10 showed a particularly striking example of a functional star sequence (Fig. 5e): botharms showed abundant reads, high scores and highly conserved Hox gene targets78,79,suggesting a key role in Hox regulation.
In addition, for 20 miRNA loci, the anti-sense strand also folded into a high-scoring hairpinsuggestive of a functional miRNA78 (Supplementary Table 4f). Indeed, sequencing readsconfirmed that four of these anti-sense hairpins are processed into small RNAs in vivo79. Thus,a single genomic miRNA locus may produce up to four miRNAs, each with distinct targets.
Regulatory motif discovery and characterizationRegulatory motifs recognized by proteins and RNAs to control gene expression have beendifficult to identify due to their short length, their many weakly specified positions, and thevarying distances at which they can act87,88. Recent studies have shown that comparativegenomics of a small number of species can be used for motif discovery3,4,12–14, on the basisof hundreds of conserved instances across the genome (Fig. 2d). Many related genomes shouldlead to increased discovery power, but also pose new challenges, arising from sequencing,assembly, or alignment artefacts, and from movement or loss of motif instances in individualspecies.
To account for the unique properties of regulatory motifs, we developed a phylogeneticframework to assess the conservation of each motif instance across many genomes89. Briefly,we searched for motif instances in each of the aligned genomes, and based on the set of speciesthat contained them, we evaluated the total branch length over which the D. melanogaster motifinstance appears to be conserved (Supplementary Methods 5a, b), which we call the branchlength score (BLS). We used BLS for the discovery of novel motifs (this section) and for theprediction of individual functional motif instances (next section).
Predicted motifs recover known regulatorsTo discover motifs, we estimated the conservation level of candidate sequence patterns with amotif excess conservation (MEC) score compared to overall conservation levels in promoters,UTRs, introns, protein-coding exons and intergenic regions (Supplementary Methods 5a).
Our search in regions with roles in pre-transcriptional regulation resulted in 145 distinct motifs(Table 2), obtained by collapsing variants across 83 motifs discovered in promoters, 35 inenhancers, 20 in 5′ UTRs, 35 in core promoters, 30 in introns and 84 in the remaining intergenicregions. Motifs discovered in each region showed similar properties and large overlap: 66(46%) were discovered independently in at least two regions and 40 (28%) in at least three,consistent with shared regulatory elements in these regions90.
The 145 discovered motifs match 40 (46%) of the 87 known transcription factors inDrosophila (Supplementary Table 5c) compared to 8% expected at random (P =1 ×10⁻²⁰).Several of the non-discovered known motifs are involved in early anterior–posteriorsegmentation of the embryo, consistent with reports that they are largely non-conserved91;indeed, 74% of these did not exceed the conservation expected by chance in promoter regions.
Stark et al. Page 9
Nature. Author manuscript; available in PMC 2008 November 8.
NIH
-PA Author Manuscript
NIH
-PA Author Manuscript
NIH
-PA Author Manuscript
Other non-discovered motifs often lacked characteristics expected for transcription factormotifs, suggesting that some may be spurious: 49% were unusually long (>10 nucleotides)compared to 23% of recovered ones, and showed only one or a few total instances genome-wide, suggestive of individual regulatory sites rather than motifs.
Tissue-specific and functional enrichment of novel motifsThe discovered motifs showed strong signals with respect to embryonic expression patterns(Fig. 6a). Overall, 75 (52%) were either enriched or depleted in genes expressed in at least onetissue, compared to 59% of known motifs and 3% of random controls. Motif depletion mayrepresent either specific repressors for individual tissues, or activators excluded from thesetissues. Motif depletion was found more generally in ubiquitously expressed genes (30% ofdiscovered and 34% of known motifs compared with 1% expected at random), similar tofindings for in vivo binding sites92, and probably reflecting less complex regulation. We alsofound significant motif enrichment in groups of genetically interacting genes (collected byFlyBase) that often function in common developmental contexts or signalling pathways, genesof metabolic pathways (Kyoto Encyclopedia of Genes and Genomes, KEGG93), and geneswith shared functions (GO).
In total, 68% of discovered and 70% of known motifs were enriched or depleted in one of thefunctional categories (14% random). Noteworthy examples include motif ME93 (GCAACA),which was more highly enriched in neuroblasts (P =4 ×10⁻¹²) than either of the two well-known regulators of neuroblast development, prospero and asense (P =4 ×10⁻⁵ and 2 ×10⁻⁷,respectively). Similarly, motifs ME89 (CACRCAC), ME11 (MATTAAWNATGCR) andME117 (MAAMNNCAA) were highly enriched in malpighian tubule (P =4 ×10⁻⁷), trachea(P =4 ×10⁻⁵) and surface glia (6 ×10⁻⁷), respectively, in each case ranking above motifs forfactors known to be important in these tissues (Supplementary Table 5c). These presumablycorrespond to as-yet-unknown regulators for these tissues.
Exclusion, clustering and positional constraintsA large number of motifs were depleted in coding sequence (57% of discovered versus 57%of known and 10% of random motifs, P =3 ×10⁻¹⁸) and in 3′ UTRs (30% versus 22% and 0%,P =4 ×10⁻¹¹), suggesting specific exclusion similar to in vivo binding92.
Many of the intergenic or intronic instances occurred in clusters, a property of motifs that hasbeen used to identify enhancer elements91,94–96. We assessed increased conservation ofmotifs when found near other instances of the same motif (whether conserved or not, to correctfor regional conservation biases), and found significant multiplicity for 19% of the discoveredmotifs (compared to 24% of known and 4% of random motifs).
In addition, 15 of the discovered motifs (10%) were significantly enriched near transcriptionstart sites (compared to 14% of known and 1% of random motifs). Several were enriched atprecise positions and preferred orientations (Fig. 6b), including close matches to several knowncore promoter motifs involved in transcription initiation97. For example, ME5(STATAWAWR), which matches the TATA-box motif, displayed a sharp peak on thetranscribed strand, 27 nucleotides upstream of the transcription start site. Similarly, ME120(TCAGTT), corresponding to the known initiator motif (Inr) strongly peaked directly on thetranscription start site, and ME54 (RCGYRCGY), which matches a known downstreampromoter element (DPE), peaked 30 nucleotides downstream of the transcription start site.
Regulatory motifs involved in post-transcriptional regulationWe also used BLS/MEC to discover motifs involved in post-transcriptional regulation, anddeveloped methods to distinguish motifs acting at the DNA level, motifs acting at the RNA
Stark et al. Page 10
Nature. Author manuscript; available in PMC 2008 November 8.
NIH
-PA Author Manuscript
NIH
-PA Author Manuscript
NIH
-PA Author Manuscript
level and motifs stemming from protein-coding codon biases (Supplementary Methods 5a).Motifs acting post-transcriptionally at the RNA level generally showed highly asymmetricconservation12, as functional instances can only occur on the transcribed strand. Indeed, 71 of90 motifs (79%) discovered in 3′ UTRs showed strand-specific conservation (compared withonly 3% of 5′ UTR motifs and 5% of intron motifs, suggesting that these act primarily in pre-transcriptional regulation).
Overall, 33 motifs discovered in 3′ UTRs were complementary to the 5′ end of Rfam miRNAs,recovering 72% of known miRNAs (68% of 5′ unique miRNA families). An additional 21motifs matched to 5′ ends of novel miRNAs predicted above, of which 12 were validatedexperimentally78,79, and 3 motifs matched uniquely to miRNA star sequences, all of whichwere abundantly expressed in vivo (Supplementary Table 4e).
We found 33 additional motifs in 3′ UTRs that were apparently not associated with miRNAs.MO40 (TGTANWTW) closely matches the Puf-family Pumilio motif98. MO32 (AATAAA)corresponds to the polyadenylation signal and displays both very strong conservation and asharply defined distance preference with respect to the end of the annotated 3′ UTR (P=10−69). Finally, several motifs (for example, MO24 =TAATTTAT; MO94 =TTATTTT) arevariants of known AU-rich elements, which are known to mediate mRNA instability anddegradation99.
MicroRNA targeting in protein-coding regionsProtein-coding regions can also harbour functional regulatory motifs, such as exonic splicingregulatory elements100. However, motif conservation is difficult to assess within protein-coding regions because of the overlapping selective pressures. Indeed, the most highlyconserved nucleotide sequence patterns of length seven (7mers) in coding sequence showedstrong reading-frame-biased conservation, suggesting that they reflect protein-codingconstraints rather than regulatory roles at the DNA or RNA level (Fig. 6c).
MicroRNA motifs, which function at the RNA level, instead showed high conservation in allthree reading frames, suggesting that they are specifically selected within coding regions fortheir RNA-level function. Indeed, previous studies have shown that miRNA motifs in codingregions are preferentially conserved in vertebrates86, that they can lead to repression inexperimental assays101,102, and that they are avoided in genes co-expressed with themiRNA103. Frame-invariant conservation allows us to demonstrate the coding-regiontargeting of individual miRNAs, and also enables the de novo discovery of miRNA motifs incoding regions. Using frame-invariant conservation, we recovered 11 miRNA motifs withinthe top 20 coding-region motifs (Supplementary Table 5g), whereas using overall conservationrequired several hundred candidates to recover 11 miRNA motifs.
Moreover, 7mers complementary to different positions in the mature miRNA show a distinctiveconservation pattern indicative of functional targeting in coding regions (Fig. 6d) and similarto that found in 3′ UTRs12,83 (correlation coefficient 0.96). Finally, 6mers complementary tomiRNA 5′ ends were depleted in coding exons of anti-target genes (Supplementary Fig. 5f),similar to findings for these genes’ 3′ UTRs103,104. Overall, these results, together withfindings in vertebrates86,101–103, suggest that important miRNA targets have beenoverlooked by many target prediction methods105 that have traditionally focused exclusivelyon 3′ UTR sequences.
Prediction of individual regulator binding sitesPrevious methods for regulatory motif discovery3,4,12–14 integrated conservationinformation over hundreds of motif instances across the genome, leading to an exceedingly
Stark et al. Page 11
Nature. Author manuscript; available in PMC 2008 November 8.
NIH
-PA Author Manuscript
NIH
-PA Author Manuscript
NIH
-PA Author Manuscript
clear signal for motif discovery even if many of these instances are only marginally conserved.In contrast, the reliable identification of individual motif instances has been hampered by lackof neutral divergence and would require many related genomes15–19. In the absence of suchdata, previous studies have relied on motif clustering91,94–96 or other sequencecharacteristics106 to predict regulatory targets or regions.
With the availability of the 12 fly genomes, we inferred high-confidence instances of regulatorymotifs by mapping the BLS of each motif instance to a confidence value (SupplementaryMethods 5a). This value represents the probability that a motif instance is functional, on thebasis of the conservation level of appropriate control motifs evaluated in the same type ofregion (promoter, 3′ UTR, coding, and so on). Because the number of conserved instancesdecreases much more rapidly for control motifs than for real motifs, the many genomes allowedus to reach high confidence values for many transcription factors and miRNAs, even atrelatively modest BLS thresholds (Fig. 2e).
Conserved motif instances identify functional in vivo targetsWe found that increasing confidence levels selected for functional instances for bothtranscription factor and miRNA motifs: the normalized fraction of transcription factor motifinstances within promoter regions rose from 20% to 90%; that of miRNA motif instances within3′ UTRs rose from 20% to 90%; and the fraction of miRNA motif instances on the transcribedstrand of 3′ UTRs rose from 50% (uniform) to 100% (Fig. 7a); in each case selecting the regionsand strands where the motifs are known to be functional.
We further assessed how predicted motif instances compared with in vivo targets in promoterregions, defined experimentally (without comparative information). We used a set of high-confidence direct CrebA targets107 and three genome-wide chromatin immunoprecipitation(ChIP) data sets for Snail, Mef2 and Twist92,108,109, and in each case found that theenrichment between conserved motif instances and known in vivo regions increased sharplyfor increasing confidence values (Fig. 7b).
We also found that a large fraction of motif instances in experimentally determined targetregions was conserved (Fig. 7c): 76% of motif instances in direct CrebA targets and 90% ofmotif instances in experimentally supported miRNA targets104,110 were recovered at 60%confidence. Although many of the miRNA targets stem from comparative predictions and areexpected to be well conserved, their high recovery rate illustrates the increased sensitivity ofthe BLS measure compared to perfect conservation (Supplementary Fig. 7d). Similar resultswere found for motifs in known enhancers that were determined to be bound by ChIP (‘ChIP-bound’): 65% of Mef2 motifs, 65% of Snail motifs and 25% of Twist motifs were conserved(Fig. 7c).
ChIP-determined and conservation-determined targets show similar enrichmentTo determine whether ChIP-bound motifs that lack conservation are biologically meaningful,we studied their enrichment in muscle gene promoters. We found that motifs that were bothbound and evolutionarily conserved showed very strong correlation with muscle genes for allthree factors: Mef2 showed eightfold enrichment, Twist showed sevenfold enrichment andSnail, a mesodermal repressor, showed threefold depletion for muscle genes. However, whenonly non-conserved sites were considered, the correlation dropped significantly to 1–2-foldfor all three factors, suggesting that non-conserved ChIP-bound sites may be of decreasedbiological significance (Fig. 7d).
We also used the correlation with muscle genes to compare ChIP-on-chip and evolutionaryconservation as two complementary methods for target identification (Fig. 7d). We found that
Stark et al. Page 12
Nature. Author manuscript; available in PMC 2008 November 8.
NIH
-PA Author Manuscript
NIH
-PA Author Manuscript
NIH
-PA Author Manuscript
the enrichment of conservation-inferred targets was consistently higher than the enrichment ofChIP-inferred targets for each of the three factors. Finally, we assessed the functionalsignificance of motif instances that were only found by the conservation approach, specificallyexcluding those in ChIP-bound regions, and found that these were also enriched in the samefunctional categories as ChIP-bound sites with comparable or higher functional correlations(Fig. 7d). This suggests that the additional conserved instances are indeed functional, probablyreflecting the higher coverage of conservation-based approaches, which are not restricted tothe experimental conditions surveyed, or that they may be bound in vivo yet missed by ChIP-on-chip technology111,112.
In an independent study113 we compared several strategies for the prediction of motif instancesand cis-regulatory modules and found that using the 12 fly genomes led to substantialimprovements. In another study, we reported the recovery of conserved motifs for severalknown regulators, including Suppressor of Hairless, in genes of the Enhancer of splitcomplex114.
A regulatory network of D. melanogaster at 60% confidenceHaving established the accuracy of conserved motif instances, we present an initial regulatorynetwork for D. melanogaster at 60% confidence (Supplementary Fig. 5i), containing 46,525regulatory connections between 67 transcription factors and 8,287 genes, and 3,662connections between 81 cloned miRNAs (clustered in 49 families with unique seed sequences)and 2,003 genes.
The distribution of predicted sites per target gene is highly nonuniform and indicative ofvarying levels of regulatory control. Genes with the highest number of sites appeared to beenriched in morphogenesis, organogenesis, neurogenesis and a variety of tissues, whereasubiquitously expressed genes and maternal genes with housekeeping functions had the fewestsites104. Interestingly, transcription factors appeared to be more heavily targeted than othergenes, both by transcription factors (10 sites versus 5.5 on average, P =10−15) and by miRNAs(2.3 versus 1.8 miRNAs, P =5 ×10⁻⁵). Moreover, genes with many transcription factor sitesalso had many miRNA sites, and conversely, genes with few transcription factor sites also hadfew miRNA sites (P =10−4 and P =7 ×10⁻³, respectively).
Several of the predicted regulatory connections have independent experimental support(Supplementary Table 5h), including direct regulation of achaete by Hairy115, of giant byBicoid116, of Enhancer of split complex genes by Suppressor of Hairless117, and ofbagpipe by Tinman (known to cooperate in mesoderm induction and heart specification118).More generally, when tissue-specific expression data were available, we found that on average46% of all targets were co-expressed with their factor in at least one tissue (SupplementaryFig. 5i), which is significantly higher than expected by chance (P =2 ×10⁻³).
Scaling of comparative genomics powerTheoretical considerations and pilot studies on selected genomic regions showed that thediscovery power of comparative methods scales with the number and phylogenetic distance ofthe species compared16–20,46,119,120. We extended these analyses by investigating thescaling of genome-wide discovery power using evolutionary signatures for each class offunctional elements (Fig. 8), on the basis of the recovery of known elements using differentsubsets of informant species (at a fixed stringency).
We found that recovery consistently increased with the total number of informant species, andthat multi-species comparisons outperformed pairwise comparisons within the samephylogenetic clade. When we examined subsets of informants with similar total branch length
Stark et al. Page 13
Nature. Author manuscript; available in PMC 2008 November 8.
NIH
-PA Author Manuscript
NIH
-PA Author Manuscript
NIH
-PA Author Manuscript
(for example, several close species versus one distant species), multi-species comparisonssometimes performed better (protein-coding exons, ncRNAs), comparably (motifs), or worse(miRNAs) than pairwise comparisons. This complex relationship between total branch lengthand actual discovery power probably reflects imperfect genome assemblies/alignments,characteristics of each class of functional elements, and the specific methods we used. Forexample, ncRNA discovery probably benefits from observing more compensatory changesacross more genomes, whereas miRNA discovery may be more sensitive to artefacts in low-coverage genomes, given the expected high conservation of miRNA arms.
As expected, longer elements were easier to discover than shorter elements. Long protein-coding exons (>300 nucleotides) were recovered at very high rates even with few species atclose distances (leaving little room for improvement with additional species). In contrast, moreinformant species and larger distances were crucial for recovering short exons, miRNAs andregulatory motifs.
Notably, the optimal evolutionary distance for pairwise comparisons to D. melanogaster alsoseemed to depend on element length: for long protein-coding exons, the best pairwise informantwas the closely related D. erecta, for exons of intermediate lengths D. ananassae, and for theshortest exons the distant D. willistoni (Supplementary Table 7a). Distant species were alsooptimal for other classes of short elements (ncRNAs, miRNAs and motifs, Fig. 8b–d). Thissuggests that a small number of species at close evolutionary distances may generally allowthe discovery of long elements, possibly including clade-specific elements, whereas shortclade-specific elements may not be reliably detectable without many genomes at closedistances.
Finally, we investigated the effect of alignment choice on our results (Supplementary Fig. 8).We found high similarity between different alignment strategies for longer elements (>93%agreement for exons), whereas shorter elements showed larger discrepancies betweenalignments (81% and 59% agreement for miRNA and motif instances, respectively).
Although factors such as genome size, repeat density, pseudogene abundance and physiologicaldifferences might confound a simple analogy to the vertebrate phylogeny based on neutralbranch length (Fig. 1c), our results suggest that comparisons spanning marsupials, birds andreptiles may prove surprisingly useful for biological signal discovery in the human genome.
DiscussionOur results demonstrate the potential of comparative genomics for the systematiccharacterization of functional elements in a complete genome. Even in a species as intenselystudied as D. melanogaster, our methods predicted several thousand new functional elements,including protein-coding genes and exons, novel RNA genes and structures, miRNA genes,regulatory motifs, and regulator targets. Our novel predictions have overwhelming statisticalsupport, often surpassing that of known functional elements, and are additionally supported byexperimental evidence in hundreds of cases. The common underlying methodology in thisstudy has been the recognition of specific evolutionary signatures associated with each classof functional elements, which can be much more informative for genome annotation thanoverall measures of nucleotide conservation. These signatures are general and are immediatelyrelevant to the analysis of the human genome and more generally of any species.
In addition to the many new elements, we gained specific biological insights and formulatedhypotheses that we hope will guide follow-up experiments. We found 149 genes with potentialtranslational readthrough, showing protein-like evolution downstream of a highly conservedstop codon, and possibly encoding additional protein domains or peptides specific to certaindevelopmental contexts. We also found several candidate programmed frameshifts, which
Stark et al. Page 14
Nature. Author manuscript; available in PMC 2008 November 8.
NIH
-PA Author Manuscript
NIH
-PA Author Manuscript
NIH
-PA Author Manuscript
might be part of regulatory circuits (as for ODC/Oda 64) or help expand the diversity of proteinproducts generated from one mRNA, similar to their role in prokaryotes121. We also presentedevidence of miRNA processing from both arms of a miRNA hairpin and from both DNA strandsof a miRNA locus in some cases, potentially leading to as many as four functional miRNAsper locus. As miRNA/miRNA* pairs are expressed from a single precursor and thus co-regulated, whereas sense/anti-sense pairs are expressed from distinct promoters, the use of botharms or both strands provides compelling general building blocks for higher-level miRNA-mediated regulation.
The newly discovered elements did not dramatically increase the total number of annotatednucleotides. Known and predicted elements explain 42% of nucleotides in phastConselements33, compared to 35.5% for previous annotations (Supplementary Fig. 6), an 18%increase (mostly owing to conserved motif instances). The remaining phastCons elements andindependent estimates based on transcriptional activity42 would suggest that a much higherfraction of the genome may be functional (Supplementary Fig. 6). Although it is possible thatthese estimates are artificially high and that we are in fact converging on a complete annotationof the fly genome, they might instead indicate that much remains to be discovered, which mayrequire the recognition of as-yet-unknown classes of functional elements with distinctevolutionary signatures.
Our results also allowed us to compare and contrast evolutionary and experimental methodsfor the recovery of functional elements, particularly for the identification of regulator targets.We found that comparative genomics resulted in many functionally meaningful sites fortranscription factors Mef2, Twist and Snail outside ChIP-bound regions, probably representingtargets from diverse conditions not surveyed experimentally. Similarly, ChIP resulted in manyadditional sites outside those recovered by comparative genomics: some of these may havebeen replaced by functionally equivalent non-orthologous sequence, rendering them apparentlynon-conserved in sequence alignments122–124; others may have species- or lineage-specificroles, thus lacking sufficient signal for their comparative detection; finally, some bound sitesmay be biochemically active yet selectively neutral125. It is worth noting, however, that ChIP-bound motifs that were not conserved showed decreased enrichment in muscle/mesodermdevelopment where the factors are known to act, suggesting that potential lineage-specific rolesmay lie outside the regulators’ conserved functions. To resolve these questions, comparativegenomics studies would benefit greatly from experimental studies in several related species inparallel.
Overall, comparative genomics and species-specific experimental studies providecomplementary approaches to biological signal discovery. Comparative studies help pinpointevolutionarily selected functional elements across diverse conditions, whereas experimentalstudies reveal stage- and tissue-specific information, as well as species-specific sites.Ultimately, their integration is a necessary step towards a comprehensive understanding ofanimal genomes.
METHODS SUMMARYThe Methods are described in Supplementary Information, with more details found in the citedcompanion papers for each section. The sections of the Supplementary Methods are arrangedin the same order as the manuscript to facilitate cross-referencing, with an index on the firstpage to aid navigation.
Supplementary MaterialRefer to Web version on PubMed Central for supplementary material.
Stark et al. Page 15
Nature. Author manuscript; available in PMC 2008 November 8.
NIH
-PA Author Manuscript
NIH
-PA Author Manuscript
NIH
-PA Author Manuscript
Acknowledgements
We thank the National Human Genome Research Institute (NHGRI) for continued support. A.S. was supported in partby the Schering AG/Ernst Schering Foundation and in part by the Human Frontier Science Program Organization(HFSPO). P.K. was supported in part by a National Science Foundation Graduate Research Fellowship. J.S.P. thanksB. Raney and R. Baertsch, and the Danish Medical Research Council and the National Cancer Institute for support.J.B. thanks the Schering AG/Ernst Schering Foundation for a postdoctoral fellowship. L. Parts thanks J. Vilo. S.R.was supported by a HHMI-NIH/NIBIB Interfaces Training Grant and thanks T. Lane and M. Werner-Washburne.D.H., D.P.B., G.J.H. and T.C.K. are Investigators of the Howard Hughes Medical Institute, and B.P., J.G.R., E.H. andJ.B. are affiliated with these investigators. J.W.C. and S.E.C. were supported by the NHGRI. M.K. was supported bystart-up funds from the MIT Electrical Engineering and Computer Science Laboratory, the Broad Institute of MIT andHarvard, and the MIT Computer Science and Artificial Intelligence Laboratory, and by the Distinguished Alumnus(1964) Career Development Professorship.
References1. Miller W, Makova KD, Nekrutenko A, Hardison RC. Comparative genomics. Annu Rev Genomics
Hum Genet 2004;5:15–56. [PubMed: 15485342]2. Ureta-Vidal A, Ettwiller L, Birney E. Comparative genomics: genome-wide analysis in metazoan
eukaryotes. Nature Rev Genet 2003;4:251–262. [PubMed: 12671656]3. Kellis M, et al. Sequencing and comparison of yeast species to identify genes and regulatory elements.
Nature 2003;423:241–254. [PubMed: 12748633]4. Cliften P, et al. Finding functional features in Saccharomyces genomes by phylogenetic footprinting.
Science 2003;301:71–76. [PubMed: 12775844]5. Brent MR. Genome annotation past, present, and future: how to define an ORF at each locus. Genome
Res 2005;15:1777–1786. [PubMed: 16339376]6. Washietl S, Hofacker IL, Stadler PF. Fast and reliable prediction of noncoding RNAs. Proc Natl Acad
Sci USA 2005;102:2454–2459. [PubMed: 15665081]7. Pedersen JS, et al. Identification and classification of conserved RNA secondary structures in the human
genome. PLoS Comput Biol 2006;2:e33. [PubMed: 16628248]8. Lim LP, et al. The microRNAs of Caenorhabditis elegans. Genes Dev 2003;17:991–1008. [PubMed:
12672692]9. Lim LP, et al. Vertebrate microRNA genes. Science 2003;299:1540. [PubMed: 12624257]10. Lai EC, Tomancak P, Williams RW, Rubin GM. Computational identification of Drosophila
microRNA genes. Genome Biol 2003;4:R42. [PubMed: 12844358]11. Berezikov E, et al. Phylogenetic shadowing and computational identification of human microRNA
genes. Cell 2005;120:21–24. [PubMed: 15652478]12. Xie X, et al. Systematic discovery of regulatory motifs in human promoters and 3′ UTRs by
comparison of several mammals. Nature 2005;434:338–345. [PubMed: 15735639]13. Ettwiller L, et al. The discovery, positioning and verification of a set of transcription-associated motifs
in vertebrates. Genome Biol 2005;6:R104. [PubMed: 16356267]14. Chan CS, Elemento O, Tavazoie S. Revealing posttranscriptional regulatory elements through
network-level conservation. PLoS Comput Biol 2005;1:e69. [PubMed: 16355253]15. Boffelli D, et al. Phylogenetic shadowing of primate sequences to find functional regions of the human
genome. Science 2003;299:1391–1394. [PubMed: 12610304]16. Cooper GM, et al. Distribution and intensity of constraint in mammalian genomic sequence. Genome
Res 2005;15:901–913. [PubMed: 15965027]17. Margulies EH, Blanchette M, Haussler D, Green ED. Identification and characterization of multi-
species conserved sequences. Genome Res 2003;13:2507–2518. [PubMed: 14656959]18. Thomas JW, et al. Comparative analyses of multi-species sequences from targeted genomic regions.
Nature 2003;424:788–793. [PubMed: 12917688]19. Eddy SR. A model of the statistical power of comparative genome sequence analysis. PLoS Biol
2005;3:e10. [PubMed: 15660152]20. Bergman CM, et al. Assessing the impact of comparative genomic sequence data on the functional
annotation of the Drosophila genome. Genome Biol 2002;3:RESEARCH0086. [PubMed: 12537575]
Stark et al. Page 16
Nature. Author manuscript; available in PMC 2008 November 8.
NIH
-PA Author Manuscript
NIH
-PA Author Manuscript
NIH
-PA Author Manuscript

21. Rubin GM, Lewis EB. A brief history of Drosophila’s contributions to genome research. Science2000;287:2216–2218. [PubMed: 10731135]
22. Adams MD, et al. The genome sequence of Drosophila melanogaster. Science 2000;287:2185–2195.[PubMed: 10731132]
23. Misra S, et al. Annotation of the Drosophila melanogaster euchromatic genome: a systematic review.Genome Biol 2002;3:RESEARCH0083. [PubMed: 12537572]
24. Celniker SE, Rubin GM. The Drosophila melanogaster genome. Annu Rev Genomics Hum Genet2003;4:89–117. [PubMed: 14527298]
25. Ashburner M, Bergman C. M Drosophila melanogaster: a case study of a model genomic sequenceand its consequences. Genome Res 2005;15:1661–1667. [PubMed: 16339363]
26. Matthews KA, Kaufman TC, Gelbart WM. Research resources for Drosophila: the expandinguniverse. Nature Rev Genet 2005;6:179–193. [PubMed: 15738962]
27. Venken KJ, He Y, Hoskins RA, Bellen HJ. P[acman]: a BAC transgenic platform for targeted insertionof large DNA fragments in D. melanogaster. Science 2006;314:1747–1751. [PubMed: 17138868]
28. Dietzl G, et al. A genome-wide transgenic RNAi library for conditional gene inactivation inDrosophila. Nature 2007;448:151–156. [PubMed: 17625558]
29. Spradling AC, et al. The Berkeley Drosophila Genome Project gene disruption project: Single P-element insertions mutating 25% of vital Drosophila genes. Genetics 1999;153:135–177. [PubMed:10471706]
30. St Johnston D. The art and design of genetic screens: Drosophila melanogaster. Nature Rev Genet2002;3:176–188. [PubMed: 11972155]
31. Richards S, et al. Comparative genome sequencing of Drosophila pseudoobscura: chromosomal,gene, and cis-element evolution. Genome Res 2005;15:1–18. [PubMed: 15632085]
32. Drosophila 12 Genomes Consortium. Evolution of genes and genomes on the Drosophila phylogeny.Nature. 200710.1038/nature06341this issue
33. Siepel A, et al. Evolutionarily conserved elements in vertebrate, insect, worm, and yeast genomes.Genome Res 2005;15:1034–1050. [PubMed: 16024819]
34. Nekrutenko A, Makova KD, Li WH. The KA/KS ratio test for assessing the protein-coding potentialof genomic regions: an empirical and simulation study. Genome Res 2002;12:198–202. [PubMed:11779845]
35. Eddy SR. Computational genomics of noncoding RNA genes. Cell 2002;109:137–140. [PubMed:12007398]
36. Bompfuenewerer AF, et al. Evolutionary patterns of non-coding RNAs. Theor Biosci 2004;123:301–369.
37. Reese MG, et al. Genome annotation assessment in Drosophila melanogaster. Genome Res2000;10:483–501. [PubMed: 10779488]
38. Rubin GM, et al. A Drosophila complementary DNA resource. Science 2000;287:2222–2224.[PubMed: 10731138]
39. Stapleton M, et al. A Drosophila full-length cDNA resource. Genome Biol 2002;3:RESEARCH0080.[PubMed: 12537569]
40. Hild M, et al. An integrated gene annotation and transcriptional profiling approach towards the fullgene content of the Drosophila genome. Genome Biol 2003;5:R3. [PubMed: 14709175]
41. Yandell M, et al. A computational and experimental approach to validating annotations and genepredictions in the Drosophila melanogaster genome. Proc Natl Acad Sci USA 2005;102:1566–1571.[PubMed: 15668397]
42. Manak JR, et al. Biological function of unannotated transcription during the early development ofDrosophila melanogaster. Nature Genet 2006;38:1151–1158. [PubMed: 16951679]
43. Lin MF, et al. Revisiting the protein-coding gene catalog of Drosophila melanogaster using twelvefly genomes. Genome Res. 10.1101/gr.6679507in the press
44. Yang Z, Bielawski JP. Statistical methods for detecting molecular adaptation. Trends Ecol Evol2000;15:496–503. [PubMed: 11114436]
Stark et al. Page 17
Nature. Author manuscript; available in PMC 2008 November 8.
NIH
-PA Author Manuscript
NIH
-PA Author Manuscript
NIH
-PA Author Manuscript
45. Mignone F, Grillo G, Liuni S, Pesole G. Computational identification of protein coding potential ofconserved sequence tags through cross-species evolutionary analysis. Nucleic Acids Res2003;31:4639–4645. [PubMed: 12888525]
46. Zhang L, Pavlovic V, Cantor CR, Kasif S. Human-mouse gene identification by comparative evidenceintegration and evolutionary analysis. Genome Res 2003;13(6A):1190–1202. [PubMed: 12743024]
47. Crosby MA, et al. FlyBase: genomes by the dozen. Nucleic Acids Res 2007;35(Database issue):D486–D491. [PubMed: 17099233]
48. Ashburner M, et al. Gene ontology: tool for the unification of biology. The Gene OntologyConsortium. Nature Genet 2000;25:25–29. [PubMed: 10802651]
49. Ochman H, Ajioka JW, Garza D, Hartl DL. Inverse polymerase chain reaction. Bio/Technology1990;8:759–760. [PubMed: 1366903]
50. Hoskins RA, et al. Rapid and efficient cDNA library screening by self-ligation of inverse PCRproducts (SLIP). Nucleic Acids Res 2005;33:e185. [PubMed: 16326860]
51. Wan KH, et al. High-throughput plasmid cDNA library screening. Nature Protocols 2006;1:624–632.52. Hahn MW, Han MV, Han SG. Gene family evolution across 12 Drosophila genomes. PLoS Genet
2007;3:e197. [PubMed: 17997610]53. Andrews J, et al. The stoned locus of Drosophila melanogaster produces a dicistronic transcript and
encodes two distinct polypeptides. Genetics 1996;143:1699–1711. [PubMed: 8844157]54. Brogna S, Ashburner M. The Adh-related gene of Drosophila melanogaster is expressed as a
functional dicistronic messenger RNA: multigenic transcription in higher organisms. EMBO J1997;16:2023–2031. [PubMed: 9155028]
55. Hatfield DL, Gladyshev VN. How selenium has altered our understanding of the genetic code. MolCell Biol 2002;22:3565–3576. [PubMed: 11997494]
56. Kryukov GV, et al. Characterization of mammalian selenoproteomes. Science 2003;300:1439–1443.[PubMed: 12775843]
57. Copeland PR. Regulation of gene expression by stop codon recoding: selenocysteine. Gene2003;312:17–25. [PubMed: 12909337]
58. Castellano S, et al. In silico identification of novel selenoproteins in the Drosophila melanogastergenome. EMBO Rep 2001;2:697–702. [PubMed: 11493597]
59. von der Haar T, Tuite MF. Regulated translational bypass of stop codons in yeast. Trends Microbiol2007;15:78–86. [PubMed: 17187982]
60. Luo GX, et al. A specific base transition occurs on replicating hepatitis delta virus RNA. J Virol1990;64:1021–1027. [PubMed: 2304136]
61. Casey JL, Gerin JL. Hepatitis D virus RNA editing: specific modification of adenosine in theantigenomic RNA. J Virol 1995;69:7593–7600. [PubMed: 7494266]
62. Steneberg P, et al. Translational readthrough in the hdc mRNA generates a novel branching inhibitorin the Drosophila trachea. Genes Dev 1998;12:956–967. [PubMed: 9531534]
63. Bass BL. RNA editing by adenosine deaminases that act on RNA. Annu Rev Biochem 2002;71:817–846. [PubMed: 12045112]
64. Ivanov IP, et al. The Drosophila gene for antizyme requires ribosomal frameshifting for expressionand contains an intronic gene for snRNP Sm D3 on the opposite strand. Mol Cell Biol 1998;18:1553–1561. [PubMed: 9488472]
65. Eddy SR. Non-coding RNA genes and the modern RNA world. Nature Rev Genet 2001;2:919–929.[PubMed: 11733745]
66. Yuan G, et al. RNomics in Drosophila melanogaster: identification of 66 candidates for novel non-messenger RNAs. Nucleic Acids Res 2003;31:2495–2507. [PubMed: 12736298]
67. Lestrade L, Weber M. J snoRNA-LBME-db, a comprehensive database of human H/ACA and C/Dbox snoRNAs. Nucleic Acids Res 2006;34(Database issue):D158–D162. [PubMed: 16381836]
68. Bier E. Drosophila, the golden bug, emerges as a tool for human genetics. Nature Rev Genet 2005;6:9–23. [PubMed: 15630418]
69. Hoopengardner B, Bhalla T, Staber C, Reenan R. Nervous system targets of RNA editing identifiedby comparative genomics. Science 2003;301:832–836. [PubMed: 12907802]
Stark et al. Page 18
Nature. Author manuscript; available in PMC 2008 November 8.
NIH
-PA Author Manuscript
NIH
-PA Author Manuscript
NIH
-PA Author Manuscript
70. Mignone F, et al. UTRdb and UTRsite: a collection of sequences and regulatory motifs of theuntranslated regions of eukaryotic mRNAs. Nucleic Acids Res 2005;33(Database issue):D141–D146. [PubMed: 15608165]
71. Cohen RS, Zhang S, Dollar GL. The positional, structural, and sequence requirements of theDrosophila TLS RNA localization element. RNA 2005;11:1017–1029. [PubMed: 15987813]
72. Allemand F, et al. Escherichia coli ribosomal protein L20 binds as a single monomer to its ownmRNA bearing two potential binding sites. Nucleic Acids Res 2007;35:3016–3031. [PubMed:17439971]
73. Okumura T, Matsumoto A, Tanimura T, Murakami R. An endoderm-specific GATA factor gene,dGATAe, is required for the terminal differentiation of the Drosophila endoderm. Dev Biol2005;278:576–586. [PubMed: 15680371]
74. Park SW, et al. An evolutionarily conserved domain of roX2 RNA is sufficient for induction of H4-Lys16 acetylation on the Drosophila X chromosome. Genetics. in the press
75. Park Y, Kuroda MI. Epigenetic aspects of X-chromosome dosage compensation. Science2001;293:1083–1085. [PubMed: 11498577]
76. Berezikov E, Cuppen E, Plasterk RH. Approaches to microRNA discovery. Nature Genet 2006;38(Suppl 1):S2–S7. [PubMed: 16736019]
77. Bartel DP. MicroRNAs: genomics, biogenesis, mechanism, and function. Cell 2004;116:281–297.[PubMed: 14744438]
78. Stark A, et al. Systematic discovery and characterization of fly microRNAs using 12 Drosophilagenomes. Genome Res. 10.1101/gr.6593807in the press
79. Ruby JG, et al. Evolution, biogenesis, expression, and target predictions of a substantially expandedset of Drosophila microRNAs. Genome Res. 10.1101/gr.6597907in the press
80. Pekarsky Y, et al. Tcl1 expression in chronic lymphocytic leukemia is regulated by miR-29 andmiR-181. Cancer Res 2006;66:11590–11593. [PubMed: 17178851]
81. Ruby JG, Jan CH, Bartel DP. Intronic microRNA precursors that bypass Drosha processing. Nature2007;448:83–86. [PubMed: 17589500]
82. Okamura K, et al. The mirtron pathway generates microRNA-class regulatory RNAs inDrosophila. Cell 2007;130:89–100. [PubMed: 17599402]
83. Lewis BP, et al. Prediction of mammalian microRNA targets. Cell 2003;115:787–798. [PubMed:14697198]
84. Stark A, Brennecke J, Russell RB, Cohen SM. Identification of Drosophila microRNA targets. PLoSBiol 2003;1:E60. [PubMed: 14691535]
85. Lai EC. Micro RNAs are complementary to 3′UTR sequence motifs that mediate negative post-transcriptional regulation. Nature Genet 2002;30:363–364. [PubMed: 11896390]
86. Lewis BP, Burge CB, Bartel DP. Conserved seed pairing, often flanked by adenosines, indicates thatthousands of human genes are microRNA targets. Cell 2005;120:15–20. [PubMed: 15652477]
87. Tompa M. Identifying functional elements by comparative DNA sequence analysis. Genome Res2001;11:1143–1144. [PubMed: 11435394]
88. Stormo GD. DNA binding sites: representation and discovery. Bioinformatics 2000;16:16–23.[PubMed: 10812473]
89. Kheradpour P, Stark A, Roy S, Kellis M. Reliable prediction of regulator targets using 12Drosophila genomes. Genome Res. 10.1101/gr.7090407in the press
90. Stathopoulos A, Levine M. Genomic regulatory networks and animal development. Dev Cell2005;9:449–462. [PubMed: 16198288]
91. Schroeder MD, et al. Transcriptional control in the segmentation gene network of Drosophila. PLoSBiol 2004;2:e271. [PubMed: 15340490]
92. Zeitlinger J, et al. Whole-genome ChIP-chip analysis of Dorsal, Twist, and Snail suggests integrationof diverse patterning processes in the Drosophila embryo. Genes Dev 2007;21:385–390. [PubMed:17322397]
93. Kanehisa M, et al. The KEGG resource for deciphering the genome. Nucleic Acids Res 2004;32(Database issue):D277–D280. [PubMed: 14681412]
Stark et al. Page 19
Nature. Author manuscript; available in PMC 2008 November 8.
NIH
-PA Author Manuscript
NIH
-PA Author Manuscript
NIH
-PA Author Manuscript
94. Berman BP, et al. Exploiting transcription factor binding site clustering to identify cis-regulatorymodules involved in pattern formation in the Drosophila genome. Proc Natl Acad Sci USA2002;99:757–762. [PubMed: 11805330]
95. Markstein M, et al. A regulatory code for neurogenic gene expression in the Drosophila embryo.Development 2004;131:2387–2394. [PubMed: 15128669]
96. Philippakis AA, et al. Expression-guided in silico evaluation of candidate cis regulatory codes forDrosophila muscle founder cells. PLoS Comput Biol 2006;2:e53. [PubMed: 16733548]
97. Smale ST, Kadonaga JT. The RNA polymerase II core promoter. Annu Rev Biochem 2003;72:449–479. [PubMed: 12651739]
98. Gerber AP, et al. Genome-wide identification of mRNAs associated with the translational regulatorPUMILIO in Drosophila melanogaster. Proc Natl Acad Sci USA 2006;103:4487–4492. [PubMed:16537387]
99. Zubiaga AM, Belasco JG, Greenberg ME. The nonamer UUAUUUAUU is the key AU-rich sequencemotif that mediates mRNA degradation. Mol Cell Biol 1995;15:2219–2230. [PubMed: 7891716]
100. Fairbrother WG, Yeh RF, Sharp PA, Burge CB. Predictive identification of exonic splicingenhancers in human genes. Science 2002;297:1007–1013. [PubMed: 12114529]
101. Kloosterman WP, Wienholds E, Ketting RF, Plasterk RH. Substrate requirements for let-7 functionin the developing zebrafish embryo. Nucleic Acids Res 2004;32:6284–6291. [PubMed: 15585662]
102. Grimson A, et al. MicroRNA targeting specificity in mammals: determinants beyond seed pairing.Mol Cell 2007;27:91–105. [PubMed: 17612493]
103. Farh KK, et al. The widespread impact of mammalian MicroRNAs on mRNA repression andevolution. Science 2005;310:1817–1821. [PubMed: 16308420]
104. Stark A, et al. Animal microRNAs confer robustness to gene expression and have a significant impacton 3′ UTR evolution. Cell 2005;123:1133–1146. [PubMed: 16337999]
105. Rajewsky N. microRNA target predictions in animals. Nature Genet 2006;38(suppl 1):S8–S13.[PubMed: 16736023]
106. Elnitski L, et al. Distinguishing regulatory DNA from neutral sites. Genome Res 2003;13:64–72.[PubMed: 12529307]
107. Abrams EW, Andrew DJ. CrebA regulates secretory activity in the Drosophila salivary gland andepidermis. Development 2005;132:2743–2758. [PubMed: 15901661]
108. Sandmann T, et al. A temporal map of transcription factor activity: mef2 directly regulates targetgenes at all stages of muscle development. Dev Cell 2006;10:797–807. [PubMed: 16740481]
109. Sandmann T, et al. A core transcriptional network for early mesoderm development in Drosophilamelanogaster. Genes Dev 2007;21:436–449. [PubMed: 17322403]
110. Sethupathy P, Corda B, Hatzigeorgiou AG. TarBase: A comprehensive database of experimentallysupported animal microRNA targets. RNA 2006;12:192–197. [PubMed: 16373484]
111. Lee TI, et al. Control of developmental regulators by Polycomb in human embryonic stem cells.Cell 2006;125:301–313. [PubMed: 16630818]
112. Boyer LA, et al. Core transcriptional regulatory circuitry in human embryonic stem cells. Cell2005;122:947–956. [PubMed: 16153702]
113. Aerts S, van Helden J, Sand O, Hassan B. Fine-tuning enhancer models to predict transcriptionaltargets across multiple genomes. PLoS ONE 2007;2(11):e1115. [PubMed: 17973026]
114. Maeder M, Polansky B, Robson B, Eastman D. Phylogenetic footprinting analysis in the upstreamregulatory regions of the Drosophila Enhancer of split genes. Genetics. in the press
115. Van Doren M, et al. Negative regulation of proneural gene activity: hairy is a direct transcriptionalrepressor of achaete. Genes Dev 1994;8:2729–2742. [PubMed: 7958929]
116. Kraut R, Levine M. Spatial regulation of the gap gene giant during Drosophila development.Development 1991;111:601–609. [PubMed: 1893877]
117. Bailey AM, Posakony JW. Suppressor of hairless directly activates transcription of enhancer of splitcomplex genes in response to Notch receptor activity. Genes Dev 1995;9:2609–2622. [PubMed:7590239]
118. Yin Z, Frasch M. Regulation and function of tinman during dorsal mesoderm induction and heartspecification in Drosophila. Dev Genet 1998;22:187–200. [PubMed: 9621427]
Stark et al. Page 20
Nature. Author manuscript; available in PMC 2008 November 8.
NIH
-PA Author Manuscript
NIH
-PA Author Manuscript
NIH
-PA Author Manuscript
119. Margulies EH, et al. An initial strategy for the systematic identification of functional elements inthe human genome by low-redundancy comparative sequencing. Proc Natl Acad Sci USA2005;102:4795–4800. [PubMed: 15778292]
120. Margulies EH, Chen CW, Green ED. Differences between pair-wise and multi-sequence alignmentmethods affect vertebrate genome comparisons. Trends Genet 2006;22:187–193. [PubMed:16499991]
121. Farabaugh PJ. Programmed translational frameshifting. Annu Rev Genet 1996;30:507–528.[PubMed: 8982463]
122. Odom DT, et al. Tissue-specific transcriptional regulation has diverged significantly between humanand mouse. Nature Genet 2007;39:730–732. [PubMed: 17529977]
123. Ludwig MZ, Kreitman M. Evolutionary dynamics of the enhancer region of even-skipped inDrosophila. Mol Biol Evol 1995;12:1002–1011. [PubMed: 8524036]
124. Ludwig MZ, et al. Functional evolution of a cis-regulatory module. PLoS Biol 2005;3:e93. [PubMed:15757364]
125. The ENCODE Project Consortium. Identification and analysis of functional elements in 1% of thehuman genome by the ENCODE pilot project. Nature 2007;447:799–816. [PubMed: 17571346]
126. Kent WJ, et al. The human genome browser at UCSC. Genome Res 2002;12:996–1006. [PubMed:12045153]
Stark et al. Page 21
Nature. Author manuscript; available in PMC 2008 November 8.
NIH
-PA Author Manuscript
NIH
-PA Author Manuscript
NIH
-PA Author Manuscript
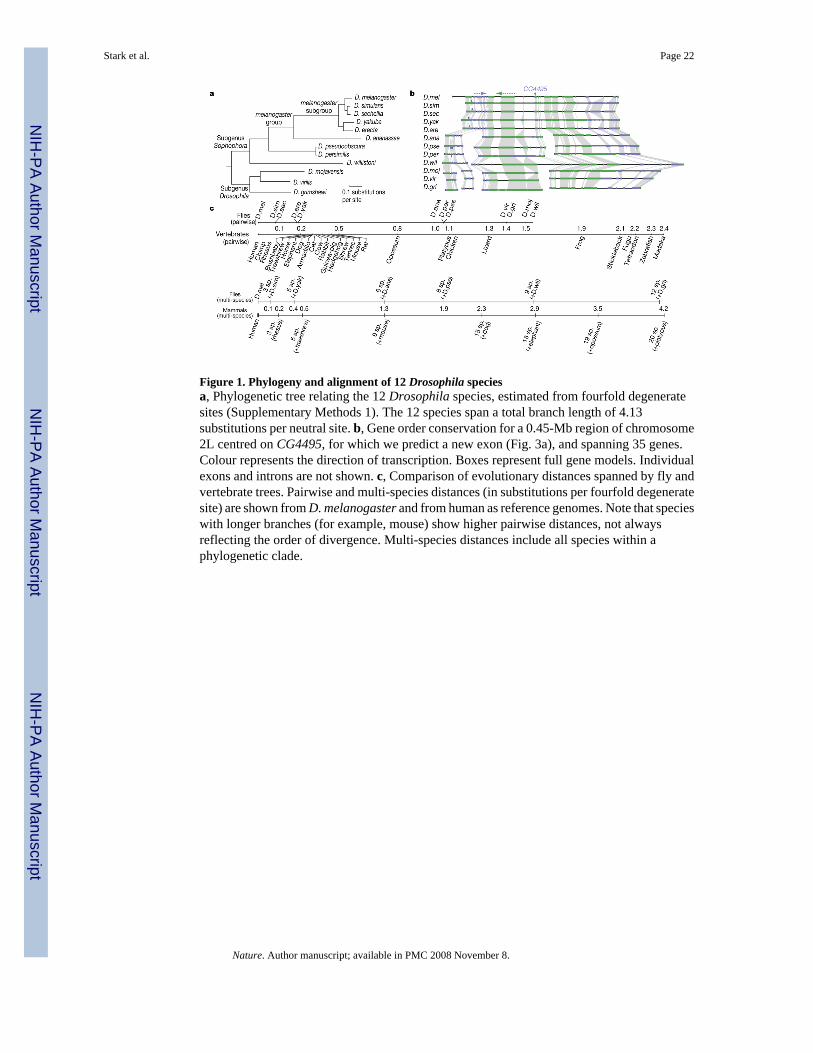
Figure 1. Phylogeny and alignment of 12 Drosophila speciesa, Phylogenetic tree relating the 12 Drosophila species, estimated from fourfold degeneratesites (Supplementary Methods 1). The 12 species span a total branch length of 4.13substitutions per neutral site. b, Gene order conservation for a 0.45-Mb region of chromosome2L centred on CG4495, for which we predict a new exon (Fig. 3a), and spanning 35 genes.Colour represents the direction of transcription. Boxes represent full gene models. Individualexons and introns are not shown. c, Comparison of evolutionary distances spanned by fly andvertebrate trees. Pairwise and multi-species distances (in substitutions per fourfold degeneratesite) are shown from D. melanogaster and from human as reference genomes. Note that specieswith longer branches (for example, mouse) show higher pairwise distances, not alwaysreflecting the order of divergence. Multi-species distances include all species within aphylogenetic clade.
Stark et al. Page 22
Nature. Author manuscript; available in PMC 2008 November 8.
NIH
-PA Author Manuscript
NIH
-PA Author Manuscript
NIH
-PA Author Manuscript
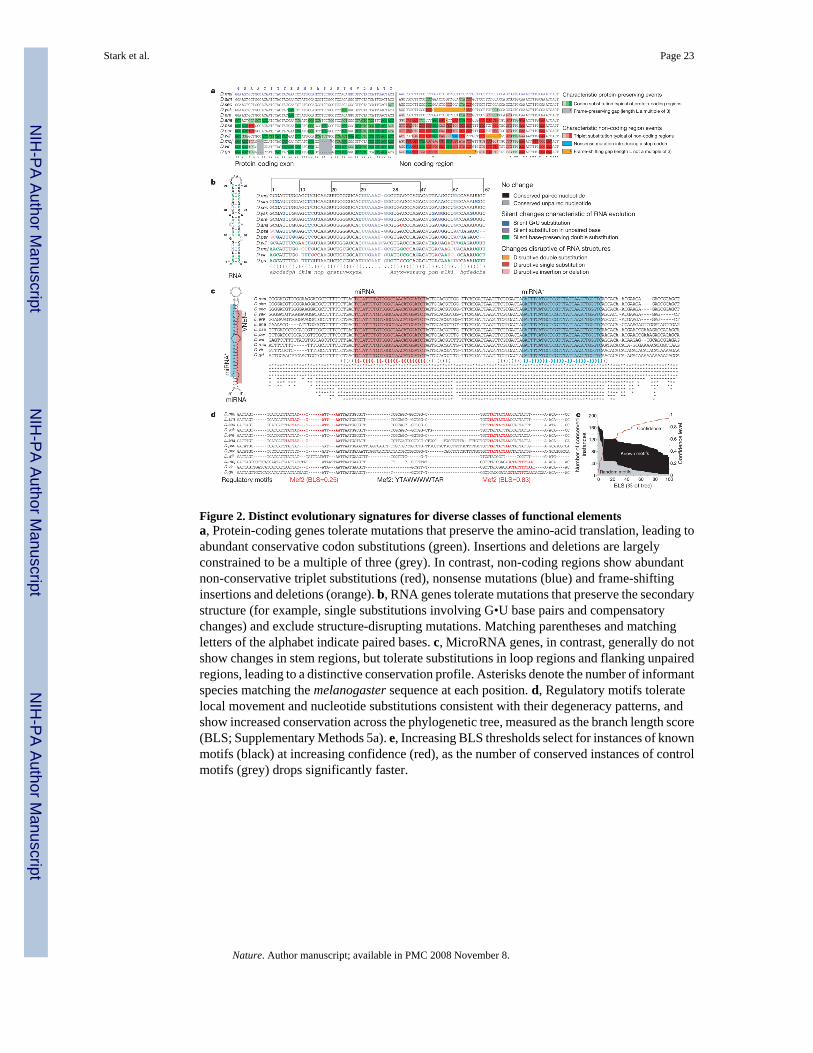
Figure 2. Distinct evolutionary signatures for diverse classes of functional elementsa, Protein-coding genes tolerate mutations that preserve the amino-acid translation, leading toabundant conservative codon substitutions (green). Insertions and deletions are largelyconstrained to be a multiple of three (grey). In contrast, non-coding regions show abundantnon-conservative triplet substitutions (red), nonsense mutations (blue) and frame-shiftinginsertions and deletions (orange). b, RNA genes tolerate mutations that preserve the secondarystructure (for example, single substitutions involving G•U base pairs and compensatorychanges) and exclude structure-disrupting mutations. Matching parentheses and matchingletters of the alphabet indicate paired bases. c, MicroRNA genes, in contrast, generally do notshow changes in stem regions, but tolerate substitutions in loop regions and flanking unpairedregions, leading to a distinctive conservation profile. Asterisks denote the number of informantspecies matching the melanogaster sequence at each position. d, Regulatory motifs toleratelocal movement and nucleotide substitutions consistent with their degeneracy patterns, andshow increased conservation across the phylogenetic tree, measured as the branch length score(BLS; Supplementary Methods 5a). e, Increasing BLS thresholds select for instances of knownmotifs (black) at increasing confidence (red), as the number of conserved instances of controlmotifs (grey) drops significantly faster.
Stark et al. Page 23
Nature. Author manuscript; available in PMC 2008 November 8.
NIH
-PA Author Manuscript
NIH
-PA Author Manuscript
NIH
-PA Author Manuscript
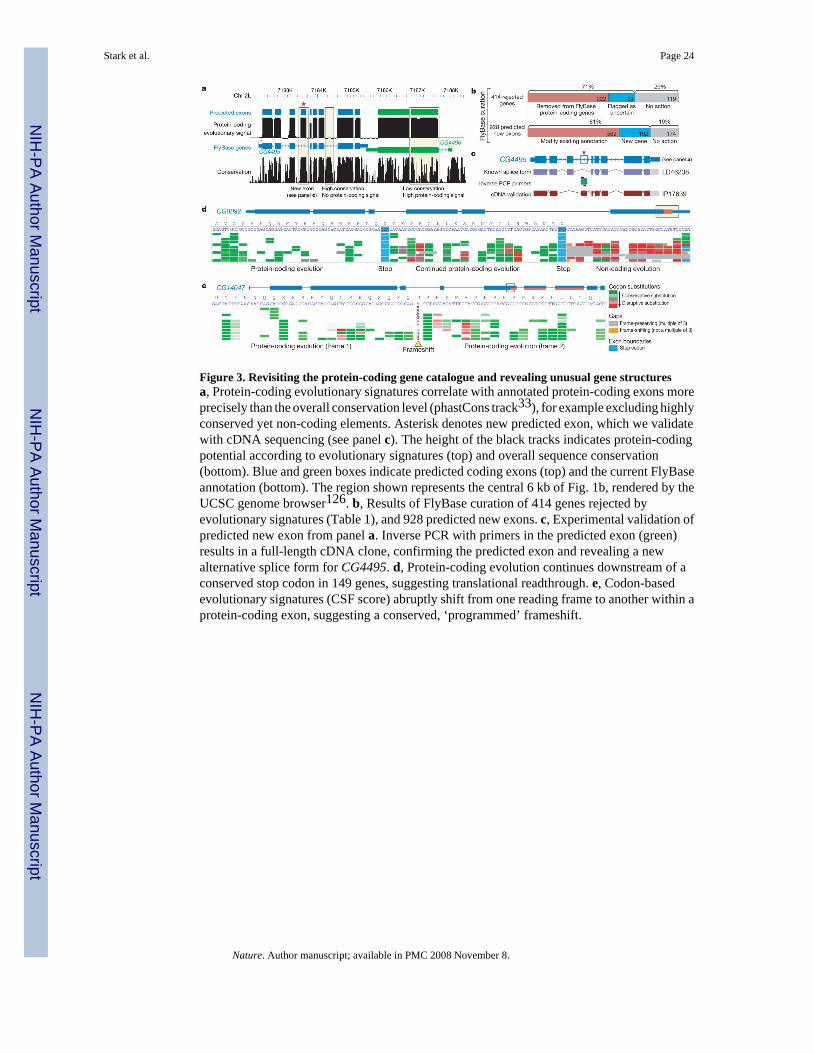
Figure 3. Revisiting the protein-coding gene catalogue and revealing unusual gene structuresa, Protein-coding evolutionary signatures correlate with annotated protein-coding exons moreprecisely than the overall conservation level (phastCons track33), for example excluding highlyconserved yet non-coding elements. Asterisk denotes new predicted exon, which we validatewith cDNA sequencing (see panel c). The height of the black tracks indicates protein-codingpotential according to evolutionary signatures (top) and overall sequence conservation(bottom). Blue and green boxes indicate predicted coding exons (top) and the current FlyBaseannotation (bottom). The region shown represents the central 6 kb of Fig. 1b, rendered by theUCSC genome browser126. b, Results of FlyBase curation of 414 genes rejected byevolutionary signatures (Table 1), and 928 predicted new exons. c, Experimental validation ofpredicted new exon from panel a. Inverse PCR with primers in the predicted exon (green)results in a full-length cDNA clone, confirming the predicted exon and revealing a newalternative splice form for CG4495. d, Protein-coding evolution continues downstream of aconserved stop codon in 149 genes, suggesting translational readthrough. e, Codon-basedevolutionary signatures (CSF score) abruptly shift from one reading frame to another within aprotein-coding exon, suggesting a conserved, ‘programmed’ frameshift.
Stark et al. Page 24
Nature. Author manuscript; available in PMC 2008 November 8.
NIH
-PA Author Manuscript
NIH
-PA Author Manuscript
NIH
-PA Author Manuscript
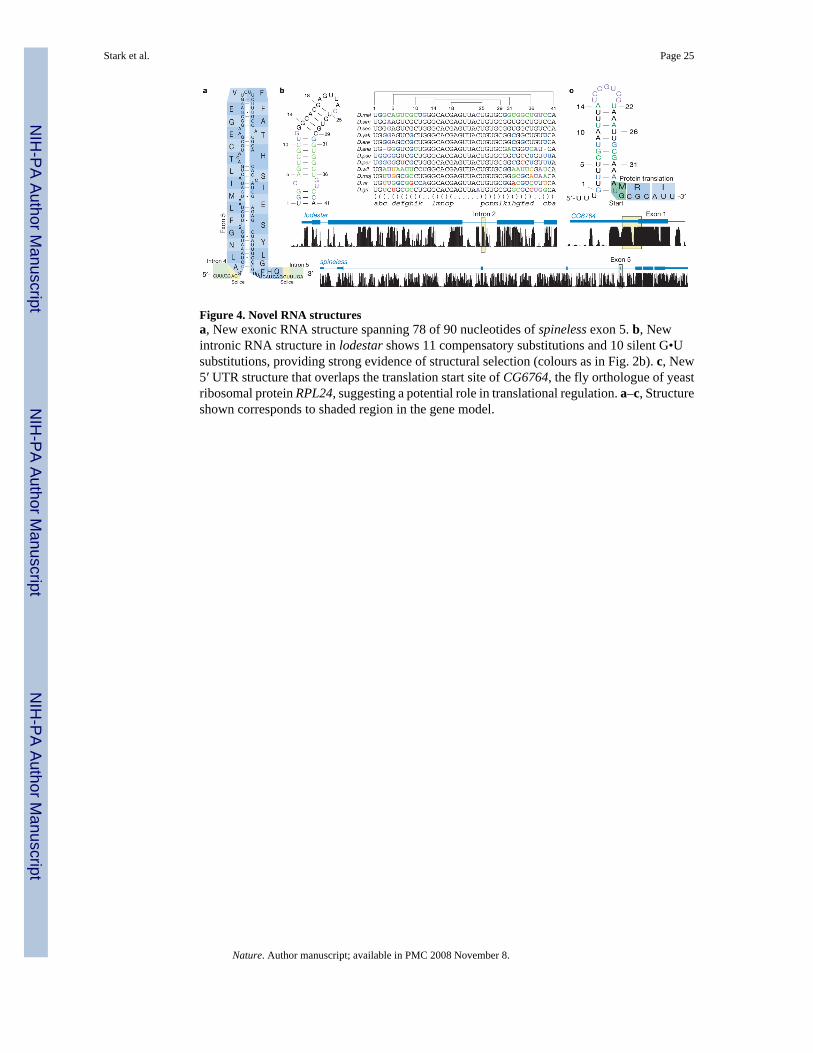
Figure 4. Novel RNA structuresa, New exonic RNA structure spanning 78 of 90 nucleotides of spineless exon 5. b, Newintronic RNA structure in lodestar shows 11 compensatory substitutions and 10 silent G•Usubstitutions, providing strong evidence of structural selection (colours as in Fig. 2b). c, New5′ UTR structure that overlaps the translation start site of CG6764, the fly orthologue of yeastribosomal protein RPL24, suggesting a potential role in translational regulation. a–c, Structureshown corresponds to shaded region in the gene model.
Stark et al. Page 25
Nature. Author manuscript; available in PMC 2008 November 8.
NIH
-PA Author Manuscript
NIH
-PA Author Manuscript
NIH
-PA Author Manuscript
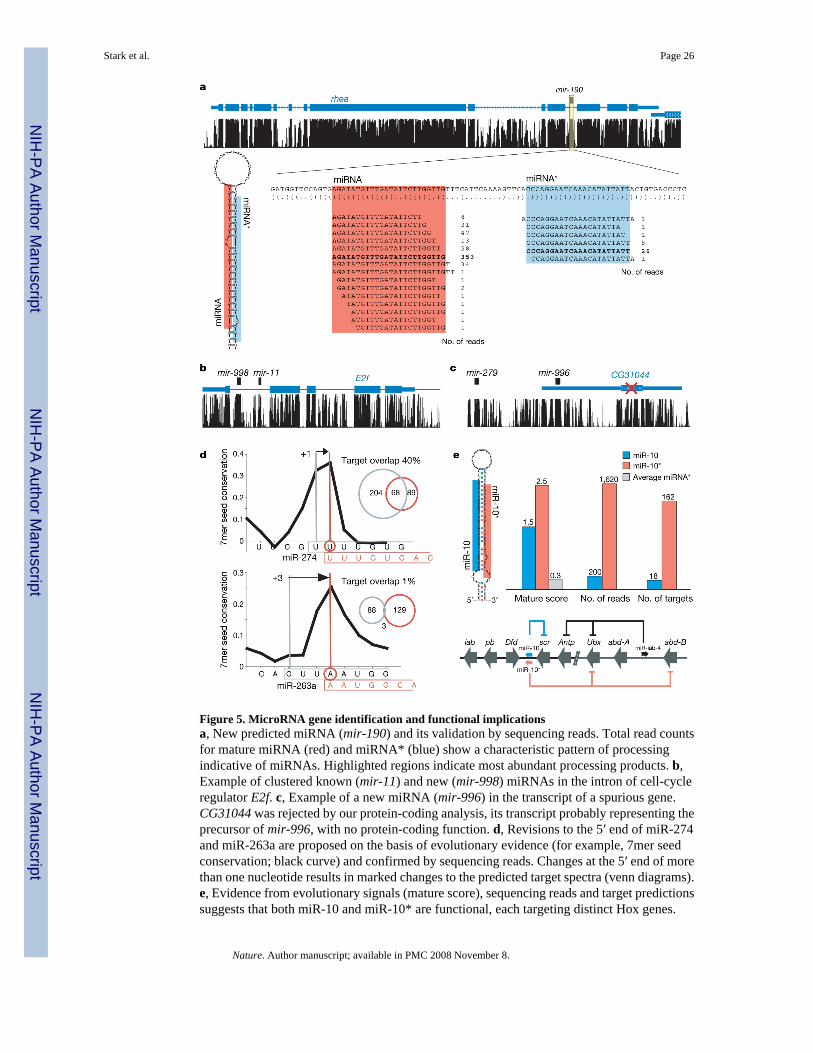
Figure 5. MicroRNA gene identification and functional implicationsa, New predicted miRNA (mir-190) and its validation by sequencing reads. Total read countsfor mature miRNA (red) and miRNA* (blue) show a characteristic pattern of processingindicative of miRNAs. Highlighted regions indicate most abundant processing products. b,Example of clustered known (mir-11) and new (mir-998) miRNAs in the intron of cell-cycleregulator E2f. c, Example of a new miRNA (mir-996) in the transcript of a spurious gene.CG31044 was rejected by our protein-coding analysis, its transcript probably representing theprecursor of mir-996, with no protein-coding function. d, Revisions to the 5′ end of miR-274and miR-263a are proposed on the basis of evolutionary evidence (for example, 7mer seedconservation; black curve) and confirmed by sequencing reads. Changes at the 5′ end of morethan one nucleotide results in marked changes to the predicted target spectra (venn diagrams).e, Evidence from evolutionary signals (mature score), sequencing reads and target predictionssuggests that both miR-10 and miR-10* are functional, each targeting distinct Hox genes.
Stark et al. Page 26
Nature. Author manuscript; available in PMC 2008 November 8.
NIH
-PA Author Manuscript
NIH
-PA Author Manuscript
NIH
-PA Author Manuscript

Figure 6. Regulatory motif discoverya, Discovered motifs show enrichment (red) or depletion (blue) in genes expressed in a giventissue (log colour range from P =10−5 enrichment to P =10−5 depletion). Bi-clustering revealsgroups of motifs with similar tissue enrichment and groups of tissues with similar motif content.Full matrix and randomized control is shown in Supplementary Fig. 6d. b, Positional bias ofdiscovered motifs relative to transcription start sites (TSS). Peaks with highly specific distancesfrom the transcription start site (for example, first three plots) are characteristic of corepromoter elements, and broad peaks (for example, fourth plot) are characteristic of transcriptionfactors. For non-palindromic motifs, colours indicate forward-strand (red) and reverse-strand(blue) instances. Curves denote the density of all instances and individual segments denoteindividual motif instances, summed across groups of 50 genes (each line). c, Coding regionsshow reading-frame-invariant conservation for miRNA motifs (red) and reading-frame-biasedconservation for protein motifs (grey). MEC scores are evaluated for each of the three readingframe offsets (F1–F3) and also without frame correction (all Fs). Plots show average MEC forall miRNA motifs and 500 top-scoring protein-coding motifs (based on MEC without framecorrection). d, Motif excess conservation (MEC) of 7mer complements at different offsets withrespect to miRNA 5′ end, averaged across all Rfam miRNAs. MEC scores evaluated in protein-coding regions and 3′ UTRs show a highly similar profile (correlation coefficient 0.96),suggesting similar evolutionary constraints.
Stark et al. Page 27
Nature. Author manuscript; available in PMC 2008 November 8.
NIH
-PA Author Manuscript
NIH
-PA Author Manuscript
NIH
-PA Author Manuscript
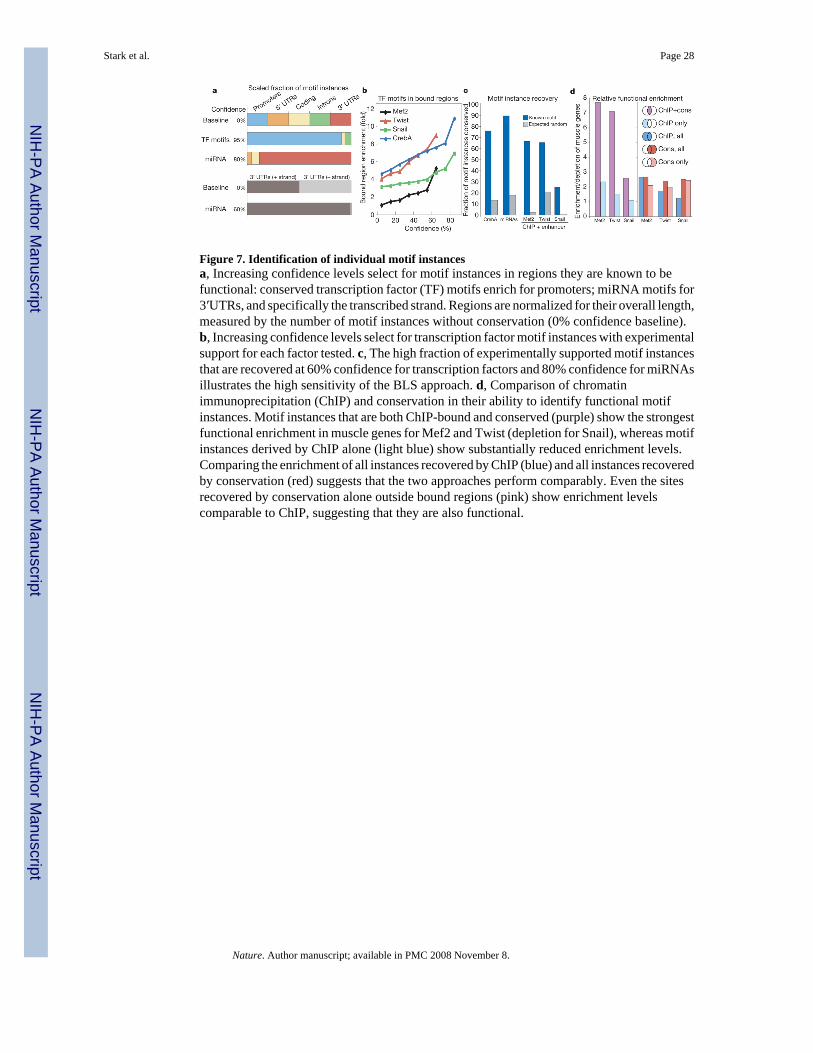
Figure 7. Identification of individual motif instancesa, Increasing confidence levels select for motif instances in regions they are known to befunctional: conserved transcription factor (TF) motifs enrich for promoters; miRNA motifs for3′UTRs, and specifically the transcribed strand. Regions are normalized for their overall length,measured by the number of motif instances without conservation (0% confidence baseline).b, Increasing confidence levels select for transcription factor motif instances with experimentalsupport for each factor tested. c, The high fraction of experimentally supported motif instancesthat are recovered at 60% confidence for transcription factors and 80% confidence for miRNAsillustrates the high sensitivity of the BLS approach. d, Comparison of chromatinimmunoprecipitation (ChIP) and conservation in their ability to identify functional motifinstances. Motif instances that are both ChIP-bound and conserved (purple) show the strongestfunctional enrichment in muscle genes for Mef2 and Twist (depletion for Snail), whereas motifinstances derived by ChIP alone (light blue) show substantially reduced enrichment levels.Comparing the enrichment of all instances recovered by ChIP (blue) and all instances recoveredby conservation (red) suggests that the two approaches perform comparably. Even the sitesrecovered by conservation alone outside bound regions (pink) show enrichment levelscomparable to ChIP, suggesting that they are also functional.
Stark et al. Page 28
Nature. Author manuscript; available in PMC 2008 November 8.
NIH
-PA Author Manuscript
NIH
-PA Author Manuscript
NIH
-PA Author Manuscript
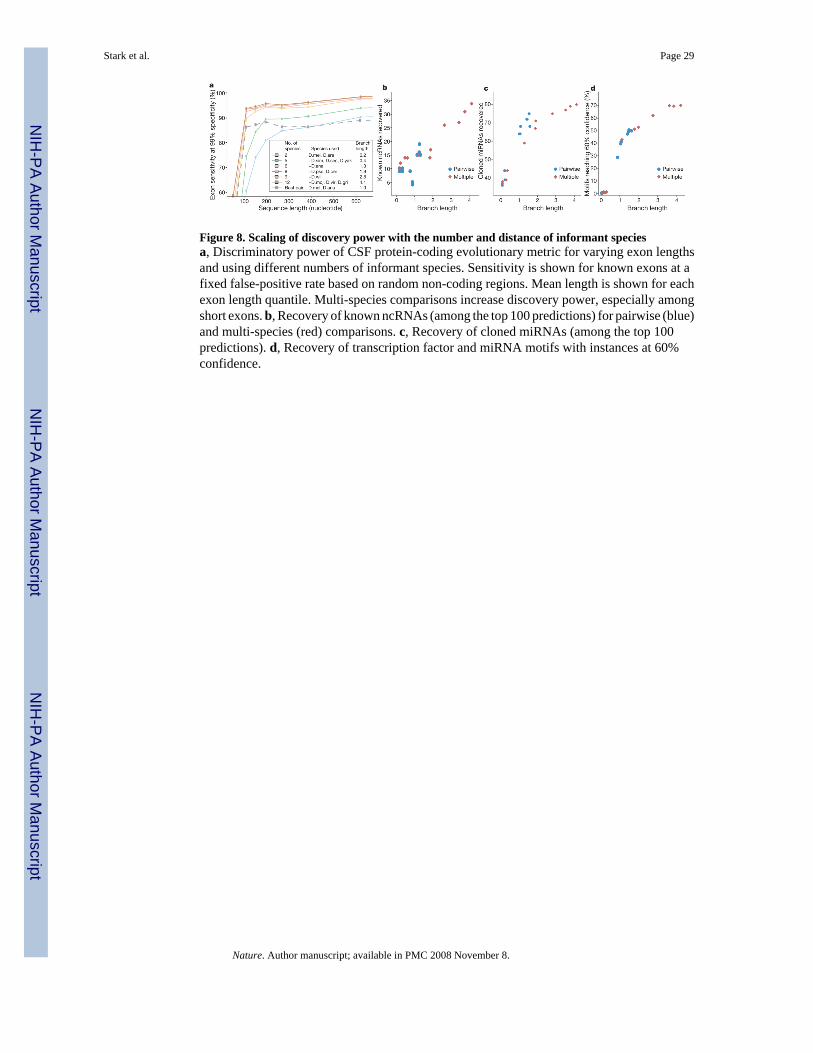
Figure 8. Scaling of discovery power with the number and distance of informant speciesa, Discriminatory power of CSF protein-coding evolutionary metric for varying exon lengthsand using different numbers of informant species. Sensitivity is shown for known exons at afixed false-positive rate based on random non-coding regions. Mean length is shown for eachexon length quantile. Multi-species comparisons increase discovery power, especially amongshort exons. b, Recovery of known ncRNAs (among the top 100 predictions) for pairwise (blue)and multi-species (red) comparisons. c, Recovery of cloned miRNAs (among the top 100predictions). d, Recovery of transcription factor and miRNA motifs with instances at 60%confidence.
Stark et al. Page 29
Nature. Author manuscript; available in PMC 2008 November 8.
NIH
-PA Author Manuscript
NIH
-PA Author Manuscript
NIH
-PA Author Manuscript

NIH
-PA Author Manuscript
NIH
-PA Author Manuscript
NIH
-PA Author Manuscript
Stark et al. Page 30
Table 1Assessment of FlyBase euchromatic protein-coding gene annotations
Regions evaluated Total Confirm Abstain Reject*
Named genes 4,711 4,566 (96.9%) 105 (2.2%) 40 (0.8%)CGid-only genes 9,022 7,879 (87.3%) 729 (8.1%) 414 (4.6%)Non-coding regions† 15,564 3 (0.0%) 131 (0.8%) 15,430 (99.1%)
*A minority of rejected genes are false rejections; see Fig. 3b and text for details.
†Regions ≥300 nucleotides in length randomly chosen from the non-coding part of the genome (see Supplementary Methods 2a).
Nature. Author manuscript; available in PMC 2008 November 8.
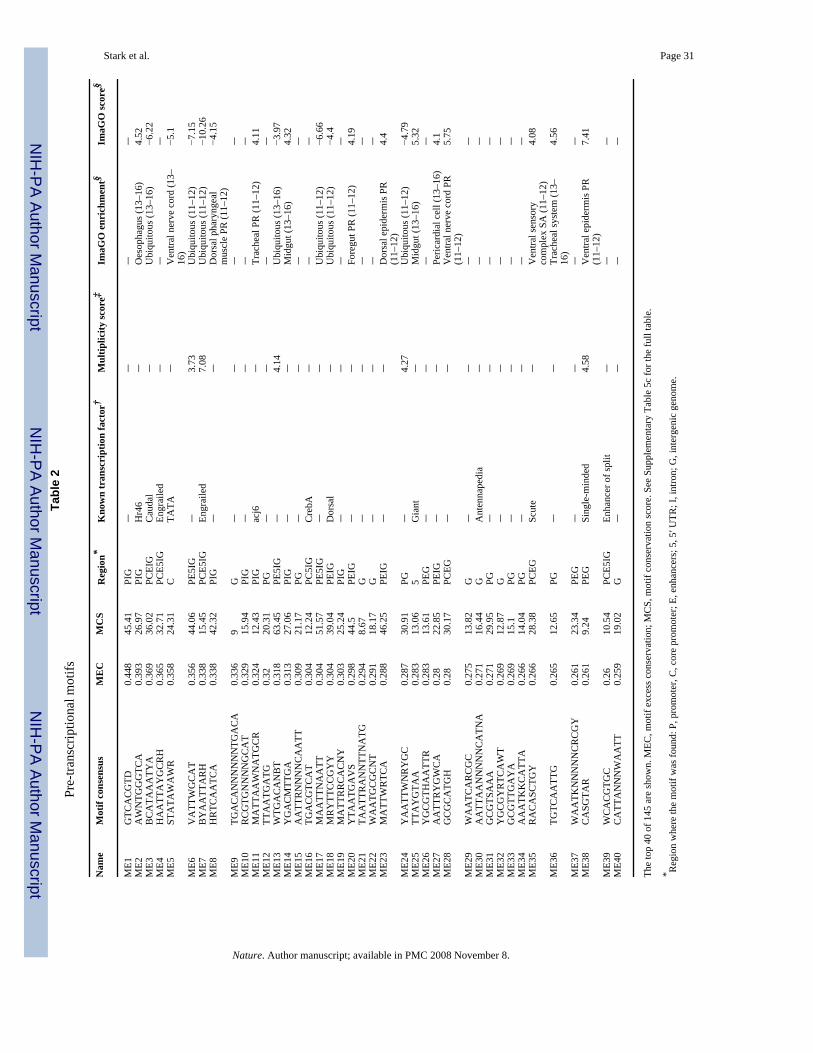
NIH
-PA Author Manuscript
NIH
-PA Author Manuscript
NIH
-PA Author Manuscript
Stark et al. Page 31Ta
ble
2Pr
e-tra
nscr
iptio
nal m
otifs
Nam
eM
otif
cons
ensu
sM
EC
MC
SR
egio
n*K
now
n tr
ansc
ript
ion
fact
or†
Mul
tiplic
ity sc
ore‡
ImaG
O e
nric
hmen
t§Im
aGO
scor
e§
ME1
GTC
AC
GTD
0.44
845
.41
PIG
––
––
ME2
AW
NTG
GG
TCA
0.39
326
.97
PIG
Hr4
6–
Oes
opha
gus (
13–1
6)4.
52M
E3B
CA
TAA
ATY
A0.
369
36.0
2PC
EIG
Cau
dal
–U
biqu
itous
(13–
16)
−6.2
2M
E4H
AA
TTA
YG
CR
H0.
365
32.7
1PC
E5IG
Engr
aile
d–
––
ME5
STA
TAW
AW
R0.
358
24.3
1C
TATA
–V
entra
l ner
ve c
ord
(13–
16)
−5.1
ME6
VA
TTW
GC
AT
0.35
644
.06
PE5I
G–
3.73
Ubi
quito
us (1
1–12
)−7
.15
ME7
BY
AA
TTA
RH
0.33
815
.45
PCE5
IGEn
grai
led
7.08
Ubi
quito
us (1
1–12
)−1
0.26
ME8
HR
TCA
ATC
A0.
338
42.3
2PI
G–
–D
orsa
l pha
ryng
eal
mus
cle
PR (1
1–12
)−4
.15
ME9
TGA
CA
NN
NN
NN
TGA
CA
0.33
69
G–
––
–M
E10
RC
GTG
NN
NN
GC
AT
0.32
915
.94
PIG
––
––
ME1
1M
ATT
AA
WN
ATG
CR
0.32
412
.43
PIG
acj6
–Tr
ache
al P
R (1
1–12
)4.
11M
E12
TTA
ATG
ATG
0.32
20.3
1PG
––
––
ME1
3W
TGA
CA
NB
T0.
318
63.4
5PE
5IG
–4.
14U
biqu
itous
(13–
16)
−3.9
7M
E14
YG
AC
MTT
GA
0.31
327
.06
PIG
––
Mid
gut (
13–1
6)4.
32M
E15
AA
TTR
NN
NN
CA
ATT
0.30
921
.17
PG–
––
–M
E16
TGA
CG
TCA
T0.
304
12.2
4PC
5IG
Cre
bA–
––
ME1
7M
AA
TTN
AA
TT0.
304
51.5
7PE
5IG
––
Ubi
quito
us (1
1–12
)−6
.66
ME1
8M
RY
TTC
CG
YY
0.30
439
.04
PEIG
Dor
sal
–U
biqu
itous
(11–
12)
−4.4
ME1
9M
ATT
RR
CA
CN
Y0.
303
25.2
4PI
G–
––
–M
E20
YTA
ATG
AV
S0.
298
44.5
PEIG
––
Fore
gut P
R (1
1–12
)4.
19M
E21
TAA
TTR
AN
NTT
NA
TG0.
294
8.67
G–
––
–M
E22
WA
ATG
CG
CN
T0.
291
18.1
7G
––
––
ME2
3M
ATT
WR
TCA
0.28
846
.25
PEIG
––
Dor
sal e
pide
rmis
PR
(11–
12)
4.4
ME2
4Y
AA
TTW
NR
YG
C0.
287
30.9
1PG
–4.
27U
biqu
itous
(11–
12)
−4.7
9M
E25
TTA
YG
TAA
0.28
313
.06
5G
iant
–M
idgu
t (13
–16)
5.32
ME2
6Y
GC
GTH
AA
TTR
0.28
313
.61
PEG
––
––
ME2
7A
ATT
RY
GW
CA
0.28
22.8
5PE
IG–
–Pe
ricar
dial
cel
l (13
–16)
4.1
ME2
8G
CG
CA
TGH
0.28
30.1
7PC
EG–
–V
entra
l ner
ve c
ord
PR(1
1–12
)5.
75
ME2
9W
AA
TCA
RC
GC
0.27
513
.82
G–
––
–M
E30
AA
TTA
AN
NN
NN
CA
TNA
0.27
116
.44
GA
nten
nape
dia
––
–M
E31
GC
GTS
AA
A0.
271
29.9
5PG
––
––
ME3
2Y
GC
GY
RTC
AW
T0.
269
12.8
7G
––
––
ME3
3G
CG
TTG
AY
A0.
269
15.1
PG–
––
–M
E34
AA
ATK
KC
ATT
A0.
266
14.0
4PG
––
––
ME3
5R
AC
ASC
TGY
0.26
628
.38
PCEG
Scut
e–
Ven
tral s
enso
ryco
mpl
ex S
A (1
1–12
)4.
08
ME3
6TG
TCA
ATT
G0.
265
12.6
5PG
––
Trac
heal
syst
em (1
3–16
)4.
56
ME3
7W
AA
TKN
NN
NN
CR
CG
Y0.
261
23.3
4PE
G–
––
–M
E38
CA
SGTA
R0.
261
9.24
PEG
Sing
le-m
inde
d4.
58V
entra
l epi
derm
is P
R(1
1–12
)7.
41
ME3
9W
CA
CG
TGC
0.26
10.5
4PC
E5IG
Enha
ncer
of s
plit
––
–M
E40
CA
TTA
NN
NW
AA
TT0.
259
19.0
2G
––
––
The
top
40 o
f 145
are
show
n. M
EC, m
otif
exce
ss c
onse
rvat
ion;
MC
S, m
otif
cons
erva
tion
scor
e. S
ee S
uppl
emen
tary
Tab
le 5
c fo
r the
full
tabl
e.
* Reg
ion
whe
re th
e m
otif
was
foun
d: P
, pro
mot
er, C
, cor
e pr
omot
er; E
, enh
ance
rs; 5
, 5′ U
TR; I
, int
ron;
G, i
nter
geni
c ge
nom
e.
Nature. Author manuscript; available in PMC 2008 November 8.

NIH
-PA Author Manuscript
NIH
-PA Author Manuscript
NIH
-PA Author Manuscript
Stark et al. Page 32† Th
e kn
own
trans
crip
tion
fact
or m
otif
mat
chin
g th
e co
nsen
sus s
eque
nce.
‡ A m
ultip
licity
scor
e is
repo
rted
for m
otifs
with
man
y re
peat
ed o
ccur
renc
es.
§ Tiss
ue w
here
mot
if is
mos
t stro
ngly
enr
iche
d or
dep
lete
d, a
nd c
orre
spon
ding
scor
e (p
ositi
ve, e
nric
hmen
t; ne
gativ
e, d
eple
tion)
. PR
, prim
ordi
um; S
A, s
peci
fic a
nlag
e.
Nature. Author manuscript; available in PMC 2008 November 8.