Nicole Ackerman - DSpace@MIT Home
53
Study of Michel Spectrum of Tau Decay by Nicole Ackerman Submitted to the Department of Physics in partial fulfillment of the requirements for the degree of Bachelor of Science in Physics at the MASSACHUSETTS INSTITUTE OF TECHNOLOGY June 2007 @ Nicole Ackerman, MMVII. All rights reserved. The author hereby grants to MIT permission to reproduce and distribute publicly paper and electronic copies of this thesis document in whole or in part. Author ......................................... .......... Department of Physics December 20, 2006 4 '1W . I Certified by............ ..... ... ...... .. . . .... .. .. V ... : . .. . . .. Peter Fisher Professor of Physics; Division Head, Particle and Nuclear Experimental Physics Thesis Supervisor A ccepted by .......................... r. 4..-W ..... V ..... ........ David E. Pritchard Thesis Coordinator ARCHIVES MASSACHUSETTS INSVTUn OF TECHNOLOGY AUG 0 i 2007 .LIBRARIES
Transcript of Nicole Ackerman - DSpace@MIT Home
Study of Michel Spectrum of Tau Decay
by
Nicole Ackerman
Submitted to the Department of Physicsin partial fulfillment of the requirements for the degree of
Bachelor of Science in Physics
at the
MASSACHUSETTS INSTITUTE OF TECHNOLOGY
June 2007
@ Nicole Ackerman, MMVII. All rights reserved.
The author hereby grants to MIT permission to reproduce anddistribute publicly paper and electronic copies of this thesis document
in whole or in part.
Author ......................................... ..........Department of Physics
December 20, 20064 '1W. I
Certified by............ ..... ... ...... .. . . .... .. .. V ... : . .. . . ..
Peter FisherProfessor of Physics; Division Head, Particle and Nuclear
Experimental PhysicsThesis Supervisor
A ccepted by .......................... r. 4..-W ..... V ..... ........David E. PritchardThesis Coordinator
ARCHIVES
MASSACHUSETTS INSVTUnOF TECHNOLOGY
AUG 0 i 2007
.LIBRARIES

Study of Michel Spectrum of Tau Decay
by
Nicole Ackermnan
Submitted to the Department of Physicsonil December 20. 2006, in partial fulfillment of the
requirements for the degree ofBachelor of Science in Physics
Abstract
This thesis is the beginning of a larger project to use BaBar to examine weak couplingsthrough leptonic r decay. I will use the ratio of Br(r - ev,) and Br(r -- p•io) and theMichel parameters p and q. which describe the momenta spectrum of the daughterleptons. I studied using a simultaneous fit to the T --+ e and r 1- p momentumspectra, using p, rl, the ratio Br(r --4 e)/Br(r -+ p), and total number of events as thefit variables. I created a simple Monte Carlo simulation which generated a. sampledata spectrum and fit it for the Michel parameters p and g. I used the Monte Carloto assess the impact of the uncertainties in the detector response fmnction on themeasurement of the ratio Br(-r --+ e)/Br(r --+ pt). My conclusion is that the threeefficiency uncertainties equally have the greatest effect on the measurement of thenumber of events. The energy offset affects the measurement of Br(r --+ e)/Br(r -+ p)and that the energy scale and offset uncertainties have a non-negligible effect on pand r.
Thesis Supervisor: Peter FisherTitle: Professor of Physics; Division Head, Particle and Nuclear Experimental Physics


Acknowledgments
Id like to thank my father and grandparents who always listen to me talk about
physics and encourage me in everything that I do. I realize that I would not be where
I am now without the encouragement and mentorship of my teachers at OSMTech
and everyone on Team RUSH, especially Mrs. Hughes. I thank my sisters at A4I for
editing my papers and keeping me happy and sane.
I am very grateful toward Prof. Fisher for providing me with opportunities to do
exciting research, including the topic of this thesis. I have loved working on this and
learning fromn him. I couldn't have done this without the help of those at SLAC -
especially Steve Sekula, Min Liang Zhao, and Karsten Koeneke.
This work was partially supported by the Reed Fund.

Contents
1 Introduction 13
1.1 Value of Studying the T Branching Ratios and Michel Parameters . . 14
1.2 Using BaBar to Study r Physics ...... . . . . . . . . . . ..... 15
1.2.1 New Approach: Michel Spectrum . . . . . . . . . . . . .... .. 16
2 Physics 19
2.1 The Weak Interaction and Tau Lepton ... . . . . . . . . . ..... 19
2.1.1 The NuTeV Anomaly . ...................... 21
2.2 Michel Spectrum . ........................... . 22
3 BaBar Experiment 27
3.1 The PEP-II Accelerator ....... . . . . . . . . . . . . . ..... 27
3.2 The BaBar Detector . .......................... 27
3.2.1 Drift Chamnber System ........ . . . . . . . . . . . ..... 28
3.2.2 Other Detector Subsystems .... . . . . . . . . . . ..... 29
3.3 Tau Events .. ..... ......................... . 30
4 Feasibility Study and Systematic Errors 31
4.1 Monte Carlo to generate Events ... . . . . . . . . . . . . ...... . 31
4.2 Fitting ....... ..... ............................ 34
4.3 Results ................................. . . ....... 36
4.4 Analysis and Conclusions . ...... . ................. .. 38
5 Conclusion 41

A Pull Plots 43

List of Figures
2-1 The top plot is of Standard Model values of p and q, the four under-
neath show the effect of changing p and q individually, and the bottom
plot shows the difference between Standard Model and one possible
alternative spectrum . ....... .................... . 25
3-1 The BaBar detector (from [1]) . ..................... .. 28
4-1 Flow of the generation of a single T event . ..... .......... .. 32
4-2 Diagram of how the data is fit for the values of p. r, and the normal-
ization ........ ............................. ...... 34
4-3 Example of the results from a fit ..... . . . . . . . . . . . ..... 35
A-1 How the fit changes as the energy offset is changed . . . . . . . . . . 45
A-2 How the fit changes as the scale factor is changed . . . . . . . . . . . 46
A-3 How the fit changes as the efficiency as a fmunction of theta is changed. 47
A-4 How the fit changes as the efficiency as a fmunction of phi is changed. 48
A-5 How the fit changes as the efficiency as a function of energy is changed. 49
A-6 How the fit changes as the resolution value is changed . . . . . . . . 50

List of Tables
2.1 Properties of the 7 lepton [2]. ...... .. .............. . 20
4.1 Modeling of the three efficiencies based on the measured parameters
4.2 Uncertainty in Given Variable for a Change of Fitted Value of 1 Stan-
dard Deviation .. ............................. .. 37
A.1 Parameters used to study effects of detector uncertainties .......


Chapter 1
Introduction
Our understanding of the complex and fascinating world in which we live grew tremen-
dously over the past century, due to experimental physics. New discoveries overturned
contemporary models and inspired new theories. We have been led to what is called
the Standard Model, the summation of our knowledge of particle physics. While it
accurately describes the low energy phenomena that we have seen, many physicists
believe that it only approximates a much more complete model of particle inter-
actions. A complete theory would include gravity, dark-matter, inflation, and the
matter-antimatter asymmetry seen in the universe. Many expect the complete the-
ory to have more symmetries than the Standard Model, which requires 29 parameters
and has patterns indicating deeper symmetries. Finally, we have yet to observe the
Higg's boson, which is essential to the Standard Model. There are many theoretical
models that expand on the Standard Model, such as different flavors of supersymmne-
try and Higgs mechanisms [3]. By making precision measurements, it is possible to
observe small deviations from the Standard Model that support or exclude competing
theoretical models.
1.1 Value of Studying the r Branching Ratios and
Michel Parameters
New experiments, such as the Large Hadron Collider, have been developed to test the
standard model and look for "new physics". phenomena which can only be explained
by an addition to the Standard Mode. However, results from these experiments are
years away and valuable tests can currently be performed using data that is already
collected and understood. The measurement of the ratio of the branching fractions
of the two leptonic channels -r -- c•u and --+ ftu and the energy distribution of
the daughter leptons are examples of the windows into the Standard Model provided
by leptonic 7- decay. These results would improve our understanding of the weak
interaction and could reveal hints of new physics.
Lepton universality predicts the branching fractions of r -- puP and - -* uevo
are equal with some small, calculable quantum corrections due to mass differences
between the electron and muon. By measuring the ratio more accurately, constraints
are put on these corrections. One use of this is to test the NuTeV measurements of
the weak mixing angle, which disagreed with the Standard Model values by 3 a. One
of the NuTeV proposals is a family dependent suppression of the Wtv, coupling by
a factor of (1-ce/ 2) where ce parameterizes violation of universality coming from the
interaction of heavier particles [4, 5]. This NuTeV measurement and its implications
will be discussed further in section 2.1.1.
The energy distribution of the daughter leptons friom r decay can be described
by the Michel parameters. The Michel parameters (p and 17) are functions of the
charged current coupling constants (gY', E {S, V.T} and e,A C {R,L} ) of the
weak interaction and will be explained in section 2.2. Non-Standard Model values for
the Michel parameters would imply a more complex structure to the weak interaction
than currently believed, or other new p)hysics. The parameter q is related to the
partial decay width of the r assuming lepton universality, and additional charged
Higgs bosons would be needed to explain any deviation of q from the Standard Model
value [6].
1.2 Using BaBar to Study T Physics
Studies of the branching ratios and the Michel parameters have been done on other
experiments in recent years ([7. 8]), but BaBar has the potential to yield much better
statistics than the previous studies. BaBar is the detector at the SLAC B-Factory,
where the primary interaction of interest is e+e- - T(4S) -* BB. with a (cross-
section of 1.05 nb. But e+e - -- T(4S) -- * -T + has a relatively high cross-section of
0.89 nb, making the BaBar experiment a T factory as well [9].
A preliminary study was done with the first year of BaBar data in 2001 to mea-
sure the branching ratio of the leptonic channels. Using 0.828 fb- 1 of data. which
corresponds to about 7.3x100 7- pairs, the value of the ratio of the gauge couplings
was determined to be
= 0.979 ± 0.021 (1.1)ge
which is consistent with the standard model prediction of 1.0. While the uncertainty
was quite large in comparison to the world average of 1.0010 ± 0.0020, this was only
a preliminary study [10].
The study concluded that a competitive measurement of the branching ratio could
be achieved with the full data set, but there were many sources of uncertainty high-
lighted. One concern was the multiplicity of hadronic events that would pass the 3-1
topology cut. requiring one hemisphere to have 3 tracks and the other to have 1 track,
where a hemisphere is defined by the thrust of the event. The analysis was instead
performed with a 1-1 topology, looking for one track in each hemisphere. A source
of systematic error is the difference in tracking efficiencies in the drift chamber for
muons and electrons. There was also a contribution from the uncertainty in the lumi-
nosity and the reduced efficiency of the muon system, which has since been replaced.
In order to deal with backgTounds (such as 7r), a number of specific cuts and filters
were made for the analysis. The spectrum was broken into three regions to calculate
the ratio, in order to account for the fact that the 7r contamination is a function of
momentum.

1.2.1 New Approach: Michel Spectrum
This analysis can be improved by reducing backgrounds and systematic errors by using
the Michel parameters as constraints. The branching ratio is equal to the ratio of
the integrals of the muon and electron energy spectra from tau decays. Uncertainties
in detector efficiency and luminosity cancel if they effect both leptons equally. A
simultaneous fit can be done to four fit parameters: the Michel parameters p and
q, the number of electron events, and the ratio of the number of muon to electron
events.
The Michel parameters are constrained to be equal in the two leptonic spectra.
This will constrain the shape of the entire spectra, reducing the influence of back-
grounds and misidentification that haven't been corrected for and only occupy a
certain momentum region. This constraint will provide additional information dur-
ing the development of the analysis since large uncertainties in the fit parameters
could indicate poorly modeled data.
The values of the Michel parameters are important in their own right, in addition
to improving the measurement of the branching ratio. The current world averages
of are consistent with the Standard Model. The parameters are related to the gauge
couplings and a measurement inconsistent with the Standard Model would indicate
new physics contributions to the weak interaction.
The measurement will be done with over 3 x 10 7- pairs, corresponding to the
integrated luminosity of 375 fb-1 from Runs 1-5. The T events will be selected based
on thrust, energy, charge, and particle identification. We will use a 3-1 topology,
requiring a charged lepton in the single prong hemisphere, but not in the other hemi-
sphere. This corresponds to requiring one -r to decay leptonically and the other to
decay hadronically. The branching fraction of w- --> h-h-h+ is 15.19+0.07 [2], so this
is will not significantly reduce our signal, but will drastically reduce the contamina-
tion from Bhabha and dimuon events being misidentified as 7+r - events. Only drift
chamber data will be used to measure momentum in order to cancel uncertainties
between the electron and miuon decays. The Monte Carlo that will be used for fitting

is produced with the Standard Model values for p and .t. Events will be assigned a
weight that can be modified to account for non-Standard Model values of the Michel
parameters.
While there will be systematic errors introduced due to selectors and other analysis
methods, one important contribution to the systematic errors will be the detector
response's affect on the Michel spectrum. The Monte Carlo data. used for fitting
will be dependent upon the model of the detector parameters, such as resolution
and efficiency, which are all known within a given error from other processes. The
differences between the actual parameters and how they are modeled will change the
shape of the Michel spectrum. We need to establish the effect that these errors will
have, and check that they can be known to a margin to make this method of analysis
feasible.


Chapter 2
Physics
In this chapter I will discuss the relevant physics to this study. The elegance of this
project is in apparently simple results leading to much subtler conclusions. The weak
interaction and possible new physics can be probed through a ratio of the number
of T -- e and T -+ p decays. The energy spectra can be parameterized by only
two numbers, yet these two numbers probe deeply into the structure of the weak
interaction.
2.1 The Weak Interaction and Tau Lepton
The T is the heaviest of the known charged leptons and is identical to them in every
way except mass. Table 2.1 summarizes some of the important properties of the T
lepton. While it wasn't detected until 1976 [11], it had been theoretically described
in 1971 [12]. The 7 is invaluable to study since it behaves identically to the well-
understood electron and muon, yet allows access to interesting physics as it is the
only lepton that has a large enough mass to decay hadronically. Less than half of
the decays of the 7 are fully leptonic, but these are understood very well due to their
similarity to the decay of the muon. The 7r is optimal for studying both hadronic and
leptonic weak couplings because it provides a clean and well understood vertex in the
production of the W1 [13].
Quarks and leptons decay through the weak interaction: the first evidence of it was
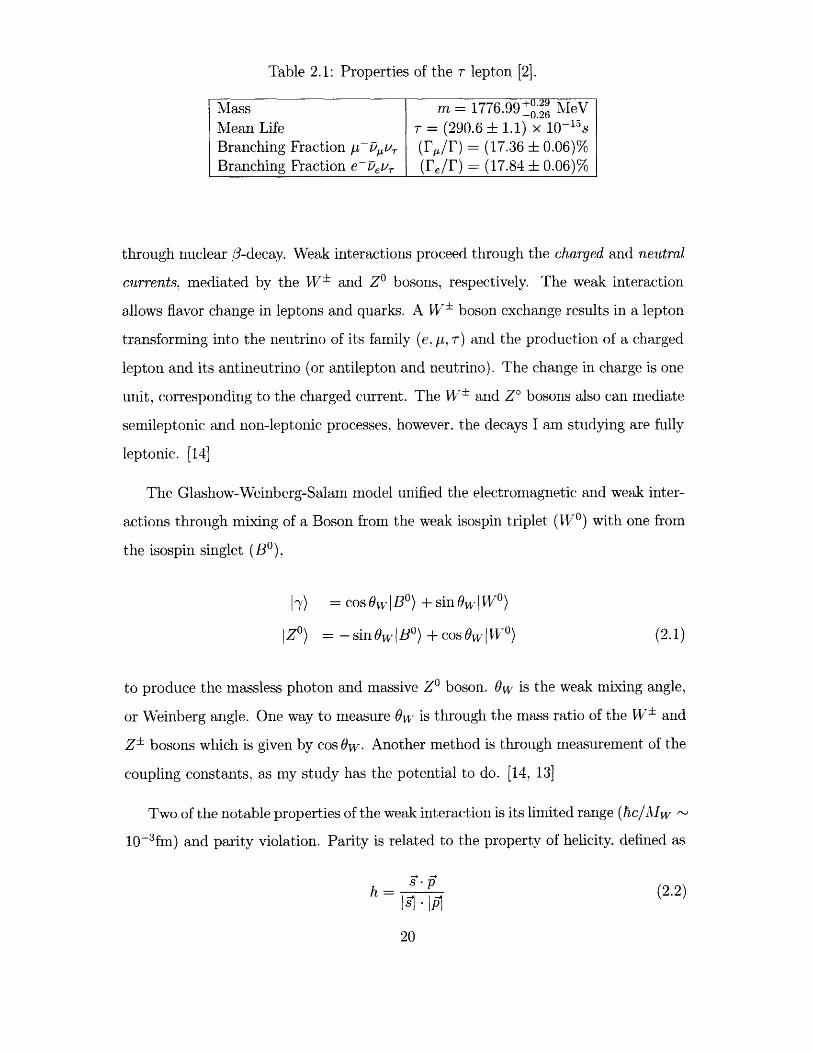
Table 2.1: Properties of the 7 lepton [2].
Mass m = 1776.99+±.29 MeV-0.26Mean Life r = (290.6 ± 1.1) x 10-1i sBranching Fraction tU-O,U (P,/F) = (17.36 ± 0.06)%Branching Fraction e ICyu, (Fe/F) = (17.84 + 0.06)%
through nuclear /3-decay. Weak interactions proceed through the charged and neutral
currents, mediated by the W ± and Z' bosons, respectively. The weak interaction
allows flavor change in leptons and quarks. A W± boson exchange results in a lepton
transforming into the neutrino of its family (e, p,, 7) and the production of a charged
lepton and its antineutrino (or antilepton and neutrino). The change in charge is one
unit, corresponding to the charged current. The W1 and Z' bosons also can mediate
semileptonic and non-leptonic processes, however, the decays I am studying are fully
leptonic. [14]
The Glashow-Weinberg-Salain model unified the electromagnetic and weak inter-
actions through mixing of a Boson from the weak isospin triplet (Wo) with one from
the isospin singlet (B(),
7) = cos0wIBo) + sinfw Wo1)
Zo) = - sin Ow I B) + cosOw Wo) (2.1)
to produce the massless photon and massive Zo boson. Ow is the weak mixing angle,
or Weinberg angle. One way to Imeasure Ow is through the mass ratio of the W 1 and
ZŽ bosons which is given by cos Ow. Another method is through measurement of the
coupling constants, as my study has the potential to do. [14, 13]
Two of the notable properties of the weak interaction is its limlited range (Ac/MAw
10-3 fm) and parity violation. Parity is related to the property of helicity. defined as
Ih = (2.2)
20

where g is the spin of the particle and is the momentum. Spin is an axial quantity
and momentum is a vector quantity. Particles can either be left- or right-handed,
with helicity changing signs under the parity operator. An operator that conserves
parity will couple identically to both handednesses. Any exchange of a spin-1 particle
can be described by an operator with axial and vector components. For it to conserve
parity, it must either be purely axial or purely vector. In parity violating interac-
tions, both parts are present and described by the coefficients cv and CA. Maximum
parity violation occurs when cv=±CA, correspondingly called V-A and V+A inter-
actions. Experimental results yield cv=-CA=1, which implies the weak interaction is
V-A and only couples to left-handed ferminions and right-handed antiferminions. The
V+A interaction is responsible for coupling to right-handed fermions and left-handed
antifermnions, which has yet to be seen in charged current interactions [13].
The general. Lorentz invariant, four-lepton interaction matrix element for leptonic
decay of the 7 is given by
M =4T f K (Im(C p(v vt(VT) F'Id4T)) (2.3), --=S.V.TeA=R,L
where n labels the types of interactions (scalar, vector, or tensor) and E and A label
the handedness of the charged leptons [6]. There are 10 possible coupling constants
(g)., for which the Standard model predicts all are zero, except for gin = 1. This
corresponds to assuming a V-A structure for the weak interaction. If it could be
shown that any of the other coupling constants were non-zero, it would indicate new
physics; a more complex structure of the weak interaction, either through changes in
the couplings to the W-boson or through new gauge bosons [7].
2.1.1 The NuTeV Anomaly
The NuTeV experiment at Fermilab measured the ratio of neutral current to charged
current event in muon neutrino-nucleon and antineutrino-nucleon scattering. g. were
found to be So smaller than the Standard Model prediction from the neutrino-quark

coupling constants. One proposed explanation for this discrepancy is a suppression
(by factor c) of the Z' and WV bosons to the neutrino and a heavy Higgs boson [4].Additionally, the lepton universality (ge/g)) must be modified by c as well. Assuming
independence of the three ce, the NuTeV results, combined with all other electroweak
results give
c, = 0.0048 ± 0.0018
eC = 0.0027 ± 0.0014
e = 0.0007 ± 0.0028
The ratios of the coupling constants are given by I 1 + -2 , which all can beg9 2
determined from the leptonic decays of the - [5].
From the NuTeV results, a measurement of the weak mixing angle (Eq. 2.1) was
made that was a factor of two more precise than previous measurements. However,
this value was 3a from the expected Standard Model value. There are multiple possi-
bilities to explain this discrepancy, including a heavy Higgs. strange sea asymmetry,
or extra Z' bosons. All of these are relatively exotic modifications to the Standard
Model, making any verification of the NuTeV measurement of 0w very interesting
[15].
2.2 Michel Spectrum
In 1949 Louis Michel postulated a parameterization of the energy spectrum of the
electrons produced in "p-meson" (now known as the pt lepton) decays based upon the
interaction matrix [16]. This spectrum is still accurate, though the understanding
of the underlying physics has vastly improved. The energy distribution is dependent
upon the matrix elements of the interactions matrix given in Eq. 2.3. There are four
"Michel Parameters" that can be created from these coupling constant, simplifying

the expression to:
0o • 2 17158= 2• 3(1 - x) + p,192PT C , (3
- P,( cos 0 (1
(2.4)me (1 - x)r - 2 + 67k7
± , }where x = Ee/EY•?" in the T rest frame and cos 9 is the angle between r-spin and the
momentum of the daughter lepton. The Michel parameters are related to the charged
current couplings by
+R3 +34 163 33± T 2 -3Re(g* . -RL I (.
3 2+ gL 3+ 9L
R- 4Re (g% g4).T S , 3* Re (9 S gT,*R)- - (gRL eL4.LR
+ g R2+16
'I=] Re (6gv, ag +6g V. , R Sy, 9 gS R Lv + g S ",
V + 3 1 • 3| -1 ~ _ Ig [ -15 gT 2+
1 L 2 1 S 2 1 S 2YLI --•9LR +9kRL
1 +4 RSR I LT (IR [IL' R) -ggT*)
4Re t RSL RL)
I |g L2 -G + - I -L2 -3 T 2 3 T 2
4V2 L 4 2R9 1R
R2LI?
4Re (gSL L.4,
Plugging in glL = 1 and all other constants set to zero, the Standard Model predicts
the values are p = 3/4, 'r = 0, ( = 1, and 6 = 3/4 ((6 = 3/4)[7].
The parameters ( and 6 are accessible either by polarizing the 7 or measuring
the polarization of the final state lepton, which was not of part of this study. From
Eq. 2.4 it can be seen that the polarized term is independent and can be ignored
by integrating over all 0. Hence, the spectrum is only dependent upon the two
parameters p and rj. It is worthwhile to note that some measurements of new physics
are dependent upon the polarized measurements as well [17] and that it is possible
d2 F T -dx,
dadx
3 2P 1-LY, R
43
g ,|2
(2.5)
(2.6)
(2.7)
3 1f 3 2+ (2.8)
to make these measurements using BaBar using the correlation between T decays.
Assuming universality between t and e and rq, = rtie, r can be expressed as
I im, B(r- [--+ pUlg)I = [LB(<Ir-) - (1 + (A, - Ae)) (2.9)4my -me B(T- - O Ce-Vr)
where At are small corrections, A, = -0.031 and A, = -0.004, due to the lep-
ton masses, QED radiative corrections, and the boson propagator [6]. The Standard
Model prediction is ýr=0, which is a result of universality predicting the branching
fraction to be equal (except for the corrections). If measurements of r and the branch-
ing ratio of the leptonic decays do not agree, then either the universality assumption
is incorrect or there are other corrections possibly due to new physics.
If the charged weak interaction has other contributions to leptonic decay structure,
the decay of the r will be the best place to look, due to mass-dependent couplings.
The leptonic decay channels are ideal since the electroweak couplings can be studied
without disturbances from the strong interaction [7].
One of the terms in the expression for r is the interference term of rV - L -RLVeR,
which occurs through a charged Higgs boson and appears in certain extensions of the
standard model. If the charged Higgs is the only modification to r decay [6],
mrm, tan 2 ,3m 2m tan (2.10)2mn22 H
For tan /J = 5 and AH = 100GeV, i 2.32 x 10- 4 .
Additionally, as mentioned in section 2.1.1, the original NuTeV results indicate
new physics, such as lepton non-universality. The relationship between the Michel
parameters and the branching ratio can help determine whether the new physics lies
in non-universality.

0.05 0.1 0.15 0.2 0.25x
Figure 2-1: Theshow the effect
top plot is of Standard Model values of p and q, the four underneathof changing p and q individually, and the bottom plot shows the
difference between Standard Model and one possible alternative spectrum.
Rho Modifications
Muon Spectra.... ~p = 0.77- p = 0.75
p =0.73
..
8640C
0620W' 600
580560540520500480460440420
86401620'L 600
580560540520500480460440420
2640i620W 600
580560540520500480460440420
IIII.................. Z I

Chapter 3
BaBar Experiment
3.1 The PEP-II Accelerator
The PEP-II asymmetric B Factory has been operating since May of 1999. The ac-
celerator produces a 9.0 GeV electron beam and a 3.1 GeV positron beam with a,
center of mass energy of 10.58 GeV. This corresponds to the T(4S) resonance that
has a branching fraction to BB of 0.96 [2]. The asymmetric beams provide a. Lorentz
boost of 7 = 0.56 in order to adequately separate the B mesons produced for CP
violation studies. PEP-II has operated at a peak luminosity of 10.88 x 1033cm-2S-1,
which far surpasses the design luminosity of 3.00x 1033 cm-2S-1. It has delivered a
total integrated luminosity (as of June 2006) of over 375 fb - 1 [18].
3.2 The BaBar Detector
The BaBar detector was designed to exploit the potential of PEP-II, specifically to
measure the CP violations in the decay of B mesons to their CP eigenstates. This
placed many requirements on the design [1]. The final detector design consists of an
inner detector surrounded by a 1.5T solenoid and instrumented flux return. The inner
detector is comprised of a silicon vertex track, drift chamber, ring-imaging Cerenkov
detector. and calorimeter.

0
BABAR Cooy
CryogenicChimney
CherenkovDetector(DIRC)
Magnetic Shieldfor DIRC
Bucking Coil
SupportTube
.--,
04Q2
01BI
Floor
Detector t InstrumentedFlux Return (IFR))
Scale 4m IP. BarrelSuperconductingi coil
rdinate System -1015-o1749 El________Electromagnetic
Sx -1149 4050 -- 1149-- Calorimeter (EMC)Z L 370S
3 7 0 Drift Chamber(DCH)
Silicon Vertex-.. Tracker (SVT)
S-IFRi. / , 1225 Endcap
Forward 3045End Plug
1375810
/- .... ÷ - :i -
3500
-- ---- --- ---
~--" I~- -3-20W 3-20018583A50
Figure 3-1: The BaBar detector (from [1])
3.2.1 Drift Chamber System
The drift cihamber system (DCH) measures the momentum for charged particles.
provides a trigger for charged particles, and measures (Id E/dx. An energetic charged
particle ionizes the gas in the chamber as it passes through. The electrons drift in
a electric field and are collected by a signal wire. The distance of closest approach
is determined by the time delay in the ionization electrons reaching the signal wire.
The signals from many wires are used to reconstruct the path of the particle as it
travels away from the interaction point.
The central drift chamber is a cylinder with inner radius of 23.6 cm, outer radius
of 81 cm, and length of 280 cm. The chamber is filled with a helium-isobutane 80:20
gas mixture. The chamber is comprised of 7104 hexagonal cells, arranged in 10 super-
layers. Each super-layer contains 4 cells, arranged in an axial or stereo orientations.
The typical dimension of a, cell is 1.2 x 1.8 cm . Each cell is a 20 pim gold-plated
tungsten-rhenium signal wire at 1960 V surrounded by 6 gold-plated aluminumln wires.

The design requirements included use of light materials and precision measure-
ments of track location and dE/dx. The inner cylinder corresponds to 0.28% X0, the
outer cylinder corresponds to 1.5% Xo, and the gas and wires account for 0.3% X0 (for
90'). From prototype measurements, the BaBar drift chamber system is predicted to
have a dE/cLx resolution of 6.8% for 40 measurements [19]. The drift velocity in the
center of the cell is 25 pm/nsec and the threshold is < 3e- [20]. The average spatial
resolution across tihe entire cell is 125 pjn. The resolution of the transverse momen-
tum is -(PT)/PT r 0.45% + 0.13% x PT [21]. The dE/cLx in the DCH is calculated
from the total charge deposited on the wires and is used to identify particles in the
momentum range of 400-1000 MeV[1].
3.2.2 Other Detector Subsystems
The silicon vertex tracker (SVT) is made of 5 layers of silicon strip detectors. The
three innermost layers provide high precision vertex information in the form of angle
and position., the outer two layers serve to link SVT and DCH measurements. It
detects short-lived particles by locating the vertex of the decay tracks outside of
the interaction point with a, resolution of about 60 ym. The detector of internally
reflected Cherenkov light (DIRC) provides differentiation between pions and kaons
between 500 MeV and 4.5 GeV. as well as general energy measurements for particles
above the threshold energy. The Cherenkov light is produced in silica, bars 4.9 m long
with a refractive index of 1.474 and is internally reflected to be detected in an array of
photomultiplier tubes. The velocity of the particle is measured through the opening
angle of the light cone. with an angular resolution of 2.5 mrad. The electromagnetic
calorimeter (EMC) detects and measures the electromagnetic showers in the region
of 20 MeV to 4 GeV. It is made of CsI(TI) crystals read out by silicon PIN diodes. It
provides electron and hadron separation and measures photon energy down to about
20 MeV. Its angular resolution in o and 0 is 3.9 mrad and its energy resolution is
OE/E = 3.0%. The instrumented flux return (IFR) identifies mniuons and neutral
hadrons with resistive plate chambers in between layers of steel absorbers [1].

3.3 Tau Events
BaBar is well suited for T analysis. The excellent resolution and particle identifi-
cation that has allowed BaBar to study B-meson events will allow for precision 7-
measurements as well. The 375 fb- 1 of data collected through Run 5 corresponds to
about 3.3 x 10 7 pairs. In this sample we should have about 57 (59) million events
that includes at least one 7 e(p) decay. I will be selecting events based on a 3-1
topology that requires the 3-prong hemisphere to not include the lepton I am looking
for in the 1-prong hemisphere. This constraint will reduce the sample to about 8.9
(8.7) million electron (muon) decays. Previous measurements of the branching ratio
have been made with far fewer events: the L3 collaboration used 163.256 7r events for
their study in 2001 [22].
The BaBar sample is large enough that the uncertainty on any measurement will
be dominated by systematic errors. A measurement of the T lifetimes was done with
80.0 fb-' of BaBar data, using similar topology. Only 0.44% of their initial sample of
T+T - events passed all of their cuts, which were optimized for sample purity. After
correcting for differences in particle identification requirements. this would correspond
to 502,000 (485,000) electron (muon) events in the analysis sample. This yields a
statistical uncertainty of about orstat = 0.14%. This is about half of the uncertainty
on the current world average and is smaller than any single experiment's statistical
average [2]. The additional fit constraint of the Michel spectrum would reduce the
need for an extremely pure sample, allowing for a greater efficiency in selecting events.
a larger sample size, and smaller statistical uncertainty. It is more important to
reduce the systematic errors to be on the same scale as the statistical errors than to
further reduce the statistical errors. The total error can best be minimized through a
thorough understanding of the sources of the systematic errors, such as the detector
response.

Chapter 4
Feasibility Study and Systematic
Errors
I created a 3imple Monte Carlo program in order to study the effect of deviations
between actual and modeled detector performance on the Michel parameter fit. This
program modeled the detector response with 6 variables and then performed a fit be-
tween two momentum spectra resulting from leptonic r decay. The detector response
is mismatched between the "data" and "'fit" spectra to examine the resulting change
in the fit parameters. The data spectrum is generated from specified Michel param-
eters; the fit is done by varying the weights of the events in the fit spectrum based
upon changing the Michel parameters. This chapter will explain the methodology
used in the statistical study I performed.
4.1 Monte Carlo to generate Events
Each event being modeled has the form of -r - IJVr where the r is produced by
e+e- -- T+T - . While the final quantities of interest are the properties of the p as
measured by the detector! the event simulation needs to begin with the T.
The Tr is generated in the center of mass frame from e+e- - r+T - . Neglecting
radiative effects, each -r+ must have half of the center of mass energy and be equal
and opposite in momentum. If the final state includes a hard photon, either the
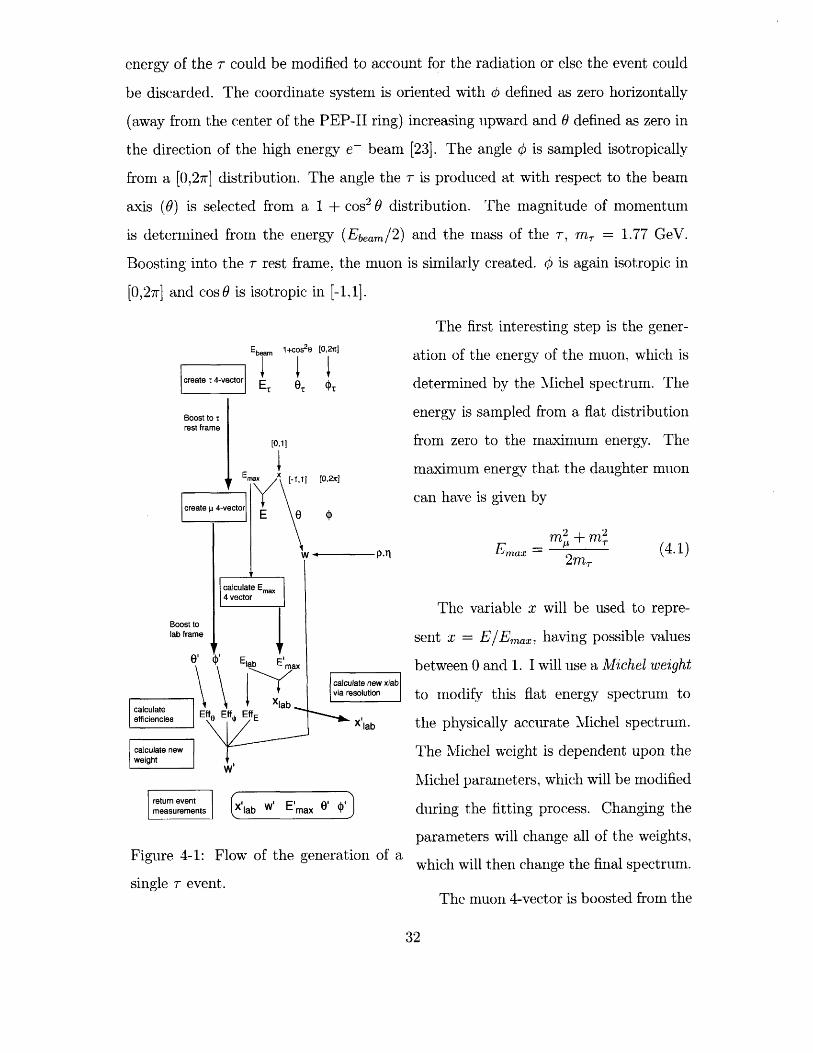
energy of the 7 could be modified to account for the radiation or else the event could
be discarded. The coordinate system is oriented with c6 defined as zero horizontally
(away from the center of the PEP-II ring) increasing upward and 0 defined as zero in
the direction of the high energy e- beam [23]. The angle Q' is sampled isotropically
from a [0,27r] distribution. The angle the T is produced at with respect to the beam
axis (0) is selected from a 1 + cos 2 0 distribution. The magnitude of momentum
is determined from the energy (Ebeam/2) and the mass of the 7, rnm, = 1.77 GeV.
Boosting into the - rest frame, the muon is similarly created. 6 is again isotropic in
[0,27] and cos9 is isotropic in [-1,1].
Ebeam 1+C0S2t [0,21]
create 4-vector 0t Ot OT
(-',1] [0,2z]
The first interesting step is the gener-
ation of the energy of the miuon, which is
determined by the Michel spectrum. The
energy is sampled from a flat distribution
from zero to the maximum energy. The
maximum energy that the daughter muon
can have is given by
m 2m,
Bo(lab
calculateefficiencies
calculate newweight
return eventmeasurements
late new xlabasolution
X'lab
lab w' E'max 01 '1
Figure 4-1: Flow of the generation of a
single 7T event.
The variable x will be used to repre-
sent x = E/Emax, having possible values
between 0 and 1. I will use a Michel weight
to modify this flat energy spectrum to
the physically accurate Michel spectrum.
The Michel weight is dependent upon the
Michel parameters, which will be modified
during the fitting process. Changing the
parameters will change all of the weights,
which will then change the final spectrum.
The muon 4-vector is boosted from the
prl (4.1)

Parameter Domain ParameterizationE < 45 MeV 0
Energy 45 MeV < E < 450 MeV (em.x x (E - 45))/(450 - 45)E > 450 MeV ma,,,x,
all ¢ 6r,,,:
-< Cmax X4 r/max
Table 4.1: Modeling of the three efficiencies based on the measured parameters
T rest frame to the center of mass frame using the . and angle from the 7 4-vector.
It is then boosted to the lab frame by using the - of the beam. In the lab frame we
now have the energy and momentum. We are also interested in the x value in this
frame. E,mLX in the lab frame is calculated by creating a 4-vector in the r rest frame
that has the mnomentum of the muion oriented along the beam axis. Boosting this
into the lab frame provides the EmaFx. flab is simply E/Emax and will be within [0,1].
While the true properties of the muon have been generated, the detector response
now needs to be taken into account. The detector has a non-unity probability in
detecting the event with respect to the energy, 0, and Q. The efficiencies are modeled
as shown in table 4.1.
A new weight for the event is calculated by multiplying the Michel weight by the
three efficiencies. Then the measured energy is calculated via E' = aE+b where a is a
scaling value and b is an offset, presumably close to one and zero, respectively. Finally,
the measured energy is affected by the resolution of the detector. The measured
energy is selected from a Gaussian distribution centered at the true energy and with
a width of o(7E). The values that are known for the event are then 0, 6, E', and the
weight.
The only difference in generating the data or fit spectra is in the Michel weight.
The Michel parameters are fixed for the data spectrum so the Michel weight is con-
stant. I specify what values of efficiency, energy offset, scaling, and resolution are
used in each spectrum. After the generation process, the data spectrum is treated as
if it is "real" data and only the measured 0, Q, E', and weight is used in fitting. I
can see what the result would be if the value of (for example) the energy offset for
the detector in the full BaBar Monte Carlo program was wrong by a given amount
by specifying slightly different values in the two spectra for the energy offset.
4.2 Fitting
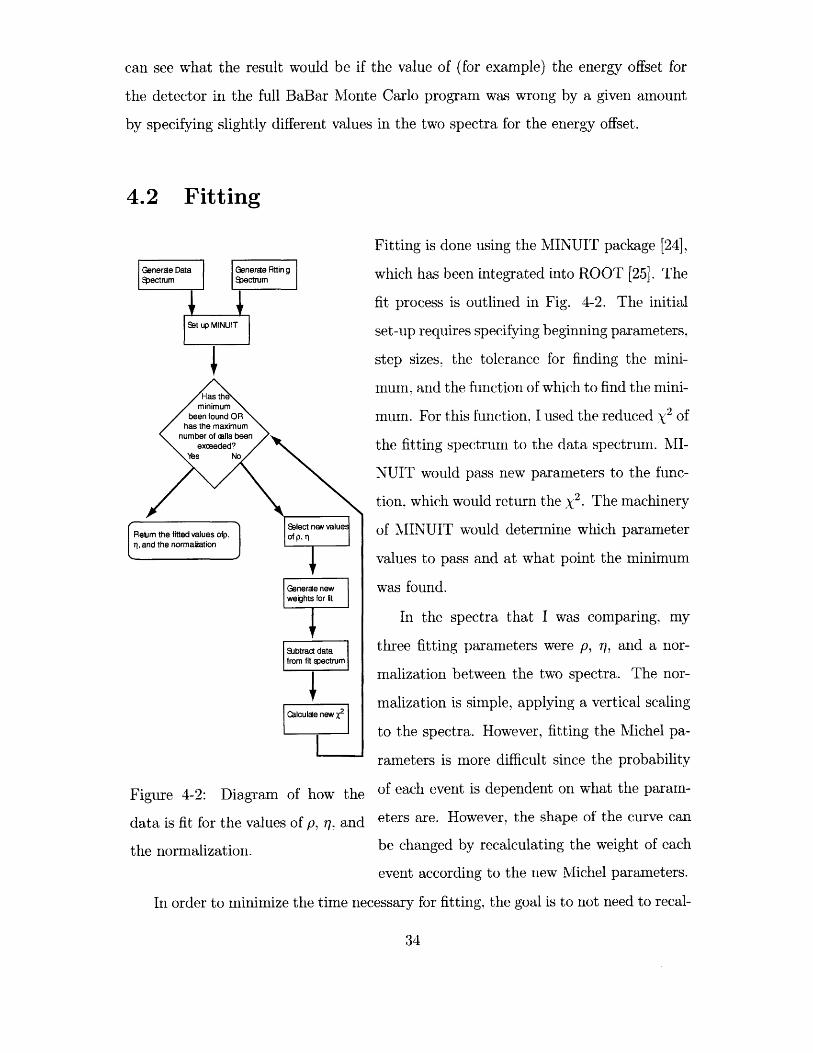
Fitting is done using the MINUIT package [24],
which has been integrated into ROOT [25]. The
fit process is outlined in Fig. 4-2. The initial
set-up requires specifying beginning parameters,
step sizes, the tolerance for finding the mini-
mum. and the function of which to find the mniini-
mum. For this fmunction, I used the reduced -V2 of
the fitting spectrum to the data spectrum. MI-
NUIT would pass new parameters to the ftime-
tion, which would return the X2. The machinery
of MINUIT would determine which parameter
values to pass and at what point the minimum
was found.
In the spectra that I was comparing, my
three fitting parameters were p, 'rj, and a nor-
malization between the two spectra. The nor-
malization is simple, applying a vertical scaling
to the spectra. However, fitting the Michel pa-
rameters is more imcuat since the prouability
Figure 4-2: DiagTam of how the of each event is dependent on what the param-
data is fit for the values of p, q, and eters are. However, the shape of the curve can
the normalization, be changed by recalculating the weight of each
event according to the new Michel parameters.
In order to minimize the time necessary for fitting, the goal is to not need to recal-

culate all weights for every fitting iteration. Instead, multiple weights are recorded for
each event in the initial generation of the fitting spectrum and the fit just interpolated
between these weights. This is simply a two dimensional Taylor expansion around the
standard model values. The accuracy of this method is dependent upon whether the
final fit value falls inside of the points used for the expansion, the amount of change
in the values over the distance between sample points, and the number of terms used.
My final fit included up to the third derivative, which was only slightly different from
the results gained from the second derivative, implying higher order terms would be
negligible. The 10 weights recorded corresponded to the weights at the expansion
point (Standard Model values) and appropriate combinations of p and/or rl shifted
by 1, 2, or 3 increments.
SFit to Generated Data
24000 -22000 -20000 -18000 -
?16000
1400012000210000 1-EZ 8000 4z 6000400020007
..........00 0.1 0.2 0.3
IResidualsi
40C
20C
CU,
20
-40-40C
X"2= 1.1754
N,
0.4 0.5 0.6 0.7 0.8 0.9x
X
Figure 4-3: Example of the results from
fit.
The two steps to using this approach
are calculating the weights of the points
being interpolated between during the
generation of the fit spectra, and then
using these weights to calculate the new
weight during the fitting process. During
the generation of the fit spectrum, 10 dif-
ferent weights are calculated and stored
for each event for values of p and q, as de-
termined from the standard model values
and a. specified increment size. During
the fitting process, the weight for each
event for the current values of p and q
is calculated from a polynomial depen-
dent upon the 10 stored weights and thea difference in the parameters from their
Standard Model values.

4.3 Results
The final goal of this study was to examine the relationship between the uncertainty
in the detector response function and the uncertainty in the Michel parameters of
the fit result. Each detector parameter (ie, resolution, or the maximum efficiency as
dependent on energy) was varied independently over a range of values with a number
of fits done at each value. For each detector parameter a plot can be made of the
error on the Michel parameter fit values as a function of the offset of the detector
parameter. For each detector parameter there are 3 plots, corresponding to p, y, and
the normalization. The data can then be fit to extrapolate the overall relationship
between the two parameters.
Each parameter has a specified "nominal'" value that was a reasonable estimate
for its value in the detector model. Only one of the detector variables were modified
at a time. with the remaining variables at their nominal value. The goal is to study
the effect of the uncertainty in the detector response, so the parameter is only being
modified in the fit spectrum. The data spectrum is always modeled by the nominal
values.
For the efficiencies, the nominal maximum efficiency was set to 98%. This allowed
the fit to include both higher and lower values, without including the non-physical
region above unity. The scale and offset variables were set to 1 and 0, respectively,
which would be their optimal values. A priori, there is no reason to choose a value
larger or smaller than the optimal, though the true value is likely non-optimal. The
values used for the fit were chosen symmetrically around the nominal values, however,
the fit response was asymmetric, especially in the case of the offset. 1% was chosen
as the nominal resolution value, again allowing variations in both directions within
physically allowed values.
All data were fit linearly, except the offset, which was better modeled quadratically
(see Appendix A). The parameters of the fit appear on the plots in Appendix A. Error
bars represent the variance in the 20 fits done at each value. The y-axis on all of the
plots represents the pull value, which is the ratio of the difference between the fit and

Variable Parameter Nominal Pull at A for Avy=lChanged Value Nominal Value
p 0.01 0.29 - 0.37 0.013 ± 0.010Resolution t 0.01 0.33 ± 0.37 0.013 ± 0.011
norm 0.01 0.20 ± 0.69 0.043 + 0.032p 0.98 0.20 +0.40 5 - 130
Oef f 0.98 0.23 ±0.38 6 ± 150norm 0.98 0.23 ±+0.25 0.001211 - 0.000010
p 0.98 0.24 ±0.40 2 + 30Ef 0.98 0.20 +0.41 9 + 410
norm 0.98 0.23 ±0.24 0.001211 ±0.000002
p 0.98 0.23 ±0.28 1 ±30h. 0.98 0.24 ±0.39 1 ± 50
norm 0.98 0.19 +0.30 0.001212 ± 0.000012p 1.0 0.28 ±0.41 0.00164 ± 0.00034
Scale f 1.0 0.18 ±0.41 0.0042 ± 0.0023norm 1.0 0.098 ±0.29 0.082 ± 0.65
p 0.0 0.19 ±0.38 3.11 ± 0.93Offset q 0.0 0.15 ±0.39 1.81 ± 0.32
norm 0.0 0.19 ±0.29 4.4 ± 1.3
Table 4.2: Uncertainty in Given Variable for a Change of Fitted Value of 1 StandardDeviation
actual value to the standard deviation of the measurement. Hence. a pull of zero is a
perfectly fit parameter and a pull of ±1 represents ±lo from the actual value.
Table 4.2 shows the results of the fit and the corresponding calculations. The pull
at nominal value is the v-value of the fitted function. evaluated at the nominal value.
This is not necessary what was measured at the nominal value. For a "perfect"
fit. this should be zero since all of the parameters would be matched. The final
calculation is the change in parameter (A) necessary to change the pull by one unit
of or. This inumber gives the margin for which we must be able to determine the
detector response function parameters to have their systematic error be less than one
standard deviation. A is calculated as the change from the nominal value, not from
a pull equal to zero. For the linear fits, A is simply dependent upon slope.

4.4 Analysis and Conclusions
From the plots of the fits, both quantitative and qualitative statements can be made.
The plots clearly show very similar behavior in the three efficiencies and interesting
effects in the other three detector variables. The calculations made from the fits allow
us to find a relationship between the detector response uncertainty and systematic
errors of this type of fit.
The three detector efficiency parameters have very similar behaviors, though each
is modeled differently. Over all values studied. there was no statistical difference in
the fit of p and rq. This is expected due to the efficiencies functioning as a vertical scale
factor, but having little influence along the x-axis. All efficiencies have a strong effect
on the normalization since a mismatch in efficiency reduces the number of counts in
the spectra, which must be compensated by the normalization. In efficiencies that
are dependent upon 0 and 0, and change in normalization will be equivalent in the
muon and electron spectrum and the ratio will not change. If the energy efficiency is
different for nuons and electrons, that will have an effect on the ratio.
The effect of the resolution is complicated by the finite bin size of the spectra.
When the range of values in one bin is much greater than the resolution, only a
negligible number of events would end up in the incorrect bin due to resolution. In
the case that the majority of events in a bin lie within 1 or 2 ,re• of another bin,
resolution will have a great effect.
Changing the energy scale results in a relatively linear response in the fit to the
Michel parameters. This is reasonable upon examining Eq. 2.4. It has a minimal
effect on the normalization. At high energies, where the scaling would have the
greatest effect, there are the fewest events.
The detector parameter with the greatest imnpact on the fit to the Michel parame-
ters p and rl is the energy offset. A mismatch in the energy offset between the model
of the detector response function and the actual response by about 2 MeV is enough
to have a large effect on the fit of p. rj, and the normalization. This has a much larger
effect than the normalization does since it shifts the events in the lower-energy region
of the spectrum. which is much more dependent upon p and rt.
It is essential to minimize the uncertainty in all three detector efficiencies and
the energy offset in order to measure the number of events in a spectrum. However,
the leptonic branching ratio will not be effected by the uncertainties if the detector
efficiencies are equal for muons and electrons. The branching ratio will be effected by
the energy offset since the difference in mass between the electron and muon results
in a different energy scale (see Eq. 4.1). If the energy offset is equivalent (say. 1
MeV) for electrons and muons. it will result in different shifts when converted to
x = E/E,,r,,,. This will result in different changes in normalization which then effect
the branching ratio.


Chapter 5
Conclusion
From table 4.2 we are able to determine which parameters could adversely affect the
fits. The three maximum efficiency values do not affect the fits to p and -q, but do
strongly affect the normalization values. Any uncertainties in the efficiencies will
result in uncertainties in the number of events measured. For the 0 and 6 efficiencies.
any scaling due to uncertainties will cancel in the muon and electron spectra. If
the energy efficiency is identically modeled for the muon and electron spectra it will
similarly cancel. By only using the drift chamber to make measurements, this should
be the case. Otherwise, different energy efficiencies will cause different changes in the
normalization which then changes the measurement of the branching ratio.The resolution of the drift chamber system is o7,,,/pt = (0.45 + 0.013)% + (0.13
0.01)%pt [1]. Table 4.2 shows that the uncertainty in resolution needs to be on the
order of 1% in order for it to affect the fit. The highest momenta are on the order
of 10 GeV/c, so the maximum uncertainty will be about 0.1%. The lower half of the
momentum spectrum is the most important to the fit, and the uncertainty will only
be on the order of 0.05% there. Hence, uncertainty will not have a large affect on the
fit.
The scale value affects both Michel parameters, with a greater sensitivity in p.
An uncertainty in the scale value at the level of 0.1% will result in a shift in the fit to
p by 1 ar. Measurements show an energy scale uncertainty on the order of 0.05%, low
enough to not have a sizable effect on the fit [1]. The energy offset also has a large

impact in the Michel parameters. An uncertainty in the energy measurement over
about 1.5 MeV could cause the fit of the Michel parameters to be off by one standard
deviation.
The energy offset will affect the ratio of the leptonic branching fractions clue to the
different energy scales of the two leptons. Even if the offset is equal for both muons
and electrons it will cause different shifts in the normalization, leading to a change
in the ratio of the branching fractions. While other parameters affect normalization.
this is the only one that cannot possibly cancel when the ratio of the events is taken.
In conclusion, uncertainties in the efficiencies will result in uncertainties in the
number of events mneasured. The uncertainty in energy efficiency will not affect the
branching ratio if it is modeled the same way for electrons and muons. The energy
offset and scale affect the fit to the Michel parameters. The energy offset will not
cancel between the muon and electron spectrum in calculating the branching ratio.
so it the most important parameter to control to calculate the branching ratio.

Appendix A
Pull Plots
These plots show the effect of a mismatch between the parameters for the data and
fitting spectra. For each plot only one variable was considered.

Parameter Notation ValueNumber of events in fitting spectrmn N 1,000,000Number of events in data spectrul M 50),00,000Standard Model value for p P 0.75Standard Model value for r T 0.0Normalization nrm M/NNumber of bins 100p increment for weight generation and fitting Op 0.05
Sincrement for weight generation and fitting (r5 0.05Normalization increment for fitting 6nrm 0.01Energy Efficiency Eeff 0.980 Efficiency O•, f 0.980 Efficiency Of f 0.98Resolution res 0.01Energy Offset off 0 MeVEnergy Scale Factor scale 1
Table A.1: Parameters used to study effects of detector uncertainties.

ENERGY OFFSET (MeV)20 runs at each value, 0.0 nominal
Rho Pulls
10
8
6
4a.
2
> 0
-2
-4
-6
-20 -15 -10 -5 0E Offset (MeV)
5 10 15 20
-20
Normalization Pulls
8
-15 -10 -5 0E Offset (MeV)
5 10 15 20
-20 -15 -10 -5 0E Offset (MeV)
5 10 15 20
Figure A-1: How the fit changes as the energy offset is changed.
V I0021
032
D.38
I Eta Pulls I
150022
032
0.39
F- I.0015
.022
0.29
I
~. .,....,..,,,.,,,, .. ,....,....,....,. ... ,... I
.,.I....I....I....I .... I,.,.I...,I.... I..,.I...
L. I .. . .... I .... I .... , , .... I .... I .... I , I
I7
m
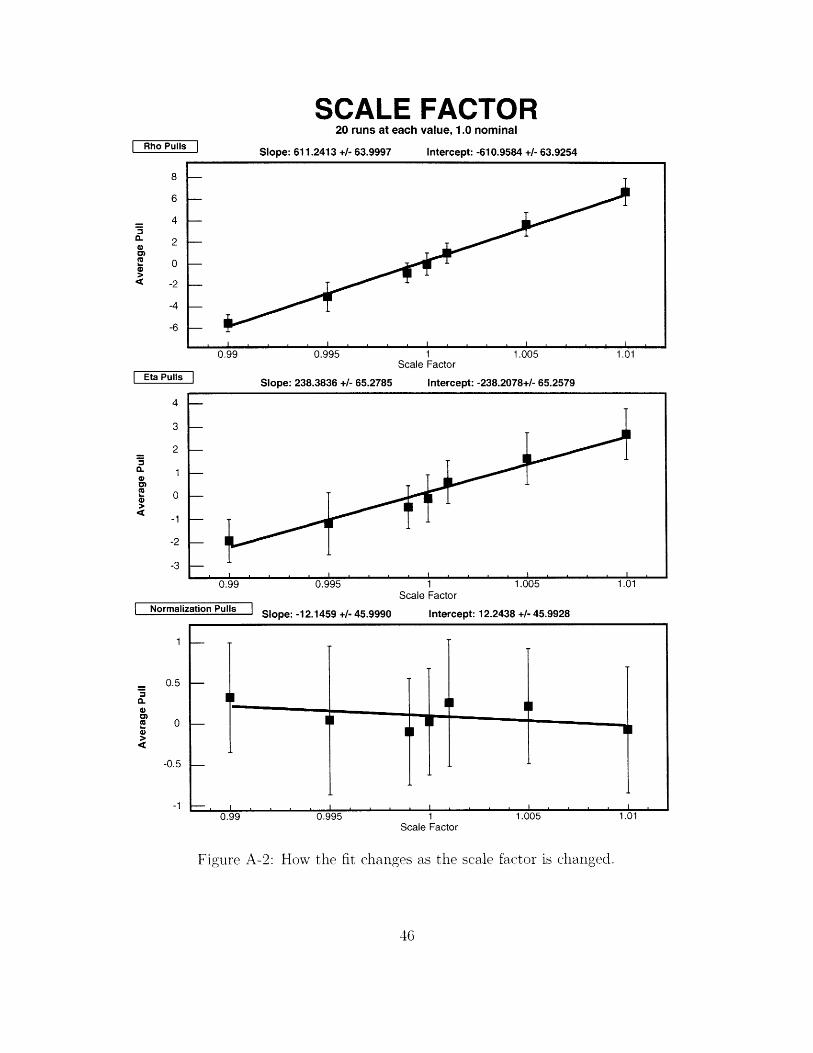
SCALE FACTOR20 runs at each value, 1.0 nominal
Slope: 611.2413 +/- 63.9997 Intercept: -610.9584 +/- 63.9254SRho Pulls
8
6
475
04)
S -2
-4
-6
Eta Pulls
4
3
2
04)
-1
-2
-3
Normali
1
0.99 0.995 1 1.005 1.01Scale Factor
zation Pulls Slope: -12.1459 +/- 45.9990 Intercept: 12.2438 +/- 45.9928
I 1
0.99 0.995 1Scale Factor
1.005
Figure A-2: How the fit changes as the scale factor is changed.
]
L I
0.99 0.995 1 1.005 1.01Scale Factor
] Slope: 238.3836 +/- 65.2785 Intercept: -238.2078+/- 65.2579
I I I I
I:

THETA EFFICIENCY20 runs at each value, 0.98 nominal
Slope: -0.1849 +/- 5.5951
0.84 0.86 0.88 0.9 0.92Efficiency
Slope: -0.1703 +/- 5.2411
0.84 0.86 0.88 0.9 0.92Effic
Normalization Pulls Slope: 826.0501 +/- 3.4473
0.84 0.86 0.88 0.9 0.92Efficiency
Intercept: 0.3809 +/- 5.1745
0.94 0.96 0.98
Intercept: 0.3936 +/- 4.8352
0.94 0.96 0.98iency
Intercept: -809.2947 +1- 3.1941
0.94 0.96 0.98
Figure A-3: How the fit changes as the efficiency as a function of theta is changed.
zV 1
I .. , . I. I .I. I . I ... I . j
Rho Pulls
2
1.5
-1
-1.5
Eta Pulls
1.5
1
-0.5
-1
I
_ II I I I I I I
I- I
II . I .I .I.I. . I . I .I .I.
-80
-100
-120
-i; ----- --- -- --- --- ---

PHI EFFICIENCY20 runs at each value, 0.98 nominal
Slope: -0.8600+/- 5.8760 Intercept: 1.0708+/- 5.4417Rho Pulls
2
1.5
0 0.5* 05
0
-0.5
-1
-1.5
Eta Pulls
I I . I . I I I I I I I 1 ,0.84 0.86 0.88 0.9 0.92 0.94 0.96 0.98 1
Efficiencyzation Pulls Slope: 824.9740+/- 4.1151 Intercept: -808.2805+/- 3.8003
I i . I I .1 I__ .1i . . . I ... I .1 I . . j0.84 0.86 0.88 0.9 0.92 0.94 0.96 0.98 1
Efficiency
Figure A-4: How the fit changes as the efficiency as a function of phi is changed.
I7
- III
I , I I . , . I , I I , , . I , . . I , ,I I I
0.84 0.86 0.88 0.9 0.92 0.94 0.96 0.98 1EfficiencV
Slope: -0.9244+/- 5.7918 Intercept: 1.1431+/- 5.3894
2
1.5
1
0.5
0
-0.5
-1
Normali
20
0
- -20a.* -40CD
S-60
-80
-100
-120

ENERGY EFFICIENCY20 runs at each value, 0.98 nominal
Slope: 0.5094+/- 5.8578
0.84 0.86 0.88 0.9 0.92Efficiency
] Slope: -0.1111+/- 5.7616
0.84 0.86 0.88 0.9 0.92Effic
Normalization Pulls Slope: 826.0285+/- 3.2077
0.84 0.86 0.88 0.9 0.92 0.94Efficiency
Figure A-5: How the fit chaniges as the efficiency as a
Intercept: -0.2564+/- 5.4527
0.94 0.96 0.98 1
Intercept: 0.3119+/- 5.3348
0.94 0.96 0.98 1iency
Intercept: -809.2771+/- 2.9586
0.96 0.98 1
function of energy is changed.
I Rho Pulls ]
Eta Pulls
2
1.5
i-~ I ,.i,
- --
/ - - - I - , . I , . , I . , . L . . . I I , , . . . , . I . ,
j I
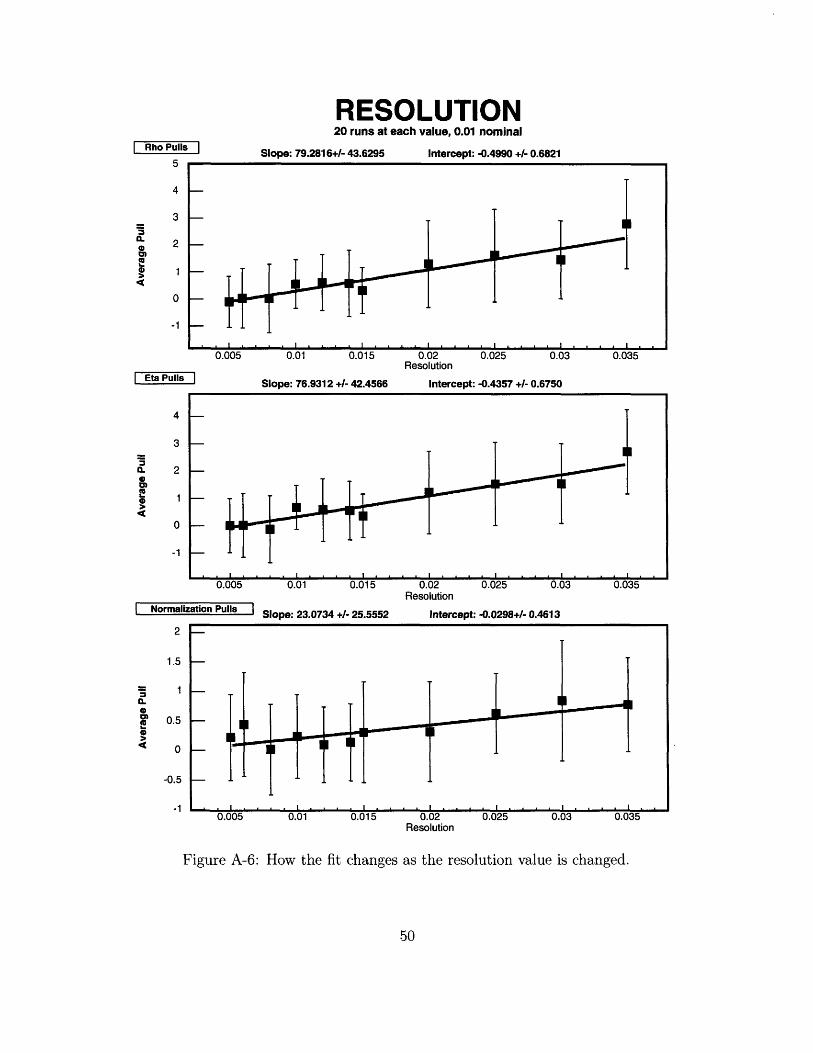
RESOLUTION20 runs at each value, 0.01 nominal
Slope: 79.2816+/- 43.6295 Intercept: -0.4990 +1- 0.6821
0.005 0.01 0.015 0.02 0.025 0.03 0.035Resolution
Slope: 76.9312 +/- 42.4566 Intercept: -0.4357 +/- 0.6750
0.005
Normalization Pulls
2
0.01 0.015
Slope: 23.0734 +1- 25.5552
0.02Resolution
0.025 0.03
Intercept: -0.0298+/- 0.4613
0.005 0.01 0.015 0.02Resolution
0.025 0.03 0.035
Figure A-6: How the fit changes as the resolution value is changed.
I Rho Pulls7
5
4
I Eta Pulls
II
I.... ,......I I I I ,. ,....,. I0.035
m

Bibliography
[1] BABAR Collaboration, B. Aubert et al., "'The BaBar detector." Nucl.
In,str'm. Mfeth. A479 (2002) 1 116. hep-ex/0105044.
[2] W.-M. Yao et al., .- Review of Particle Physics," Journal of Physics G 33 (2006)
1+.
[3] D. I. Kazakov, "Beyond the standard model," hep-ph/0611279.
[4] W. Loinaz, N. Okamura, T. Takeuchi, and L. C. R. Wijewardhana, "The
NuTeV anomaly, neutrino mixing, and a heavy Higgs," Phys. Rev. D67 (2003)
073012, hep-ph/0210193.
[5] W. Loinaz, N. Okanmura, S. Rayyan, T. Takeuchi, and L. C. R. Wijewardhana.
'The NuTeV anomaly, lepton universality. and non-universal neutrino-gauge
couplings," Phys. Rev. D70 (2004) 113004. hep-ph/0403306.
[6] A. Stahl. "The Michel parameter eta in tau decays." Phy.s. Lett. B324 (1994)
121 124.
[7] OPAL Collaboration. K. Ackerstaff ct al., "Measurement of the Michel
parame-ers in leptonic tau decays," Eur. Phys. J. C8 (1999) 3-21.
hep-ex/9808016.
[8] CLEO Collaboration, R. Ammar et al.. -A measurement of the Michel
paramneters in leptonic decays of the ta.u," Phys. Rev. Lett. 78 (1997)
4686 4690.
[9] G. D. Lafferty, "Tau Physics from B Factories," hep-ex/0610028.
[10] C. Brown and M. Roney, "A Study of the Leptonic Branching Ratios of the
Tau at BaBar." BaBar Analysis Document 309. Version 1.
11] M. L. Perl et al., "Properties of Anomalous e mu Events Produced in e+ e-
Annihilation." Phys. Lett. B63 (1976) 466.
[12] Y.-S. Tsai, "Decay Correlations of Heavy Leptons in e+ e- .lepton+ lepton-,
Phys. Rev. D4 (1971) 2821.
[13] B. Povh, K. Rith. C. Scholz, and F. Zetsche. Particles and Ntcl(ei: A4r
Introduction to the Physical Concepts. Springer. 2004.
[14] F. Halzen and A. D. Martin, Quarks and Leptons: 4•n Introductory Course inl
Modern Parti(cle Physics. John Wiley and Sons. 1984.
[15] NuTeV Collaboration, G. P. Zeller, "A departure from prediction:
Electroweak physics at NuTeV." hep-ex/0207037.
[16] L. Michel, "Interaction between four half spin particles and the decay of the mu
mneson," Proc. Phys. Soc. A63 (1950) 514 531.
[17] A. Rouge, "Tau lepton Michel parameters and new physics." Eur. Phys. J1.
C18 (2001) 491-496, hep-ph/0010005.
[18] J. Seeman et al.. "A luminositv of 1034 cm,-2s - 1 in the PEP-II B- factory.".
Contributed to European Particle Accelerator Conference (EPAC 06).
Edinburgh, Scotland, 26-3(0 Jun 2006.
[19] BABAR Drift Chamber Collaboration, G. Sciolla et al., "The BaBar drift
chamber," Nucl. Instrunm. Meth. A419 (1998) 310 314.
[20] J. Albert et al., "Electronics for the BaBar central drift chamber," IEEE
Trans. Nucl. Sci. 46 (1999) 2027-2032.
[21] BABAR Collaboration, M. H. Kelsey. *Performance and aging of the BaBar
drift chamnber," Nucl. Instrum. Meth. A535 (2004) 206 211.
22] P. Garcia-Abia, "Measurement of the tau lifetime and leptonic branching ratios
in L3." Nucl. Phys. Proc. Suppl. 98 (2001) 75 84.
[23] G. Lynch, S. Schaffner, S. Wagner, G. Raven, and F. Wilson, "BaBar Drift
Chamber Tracking Conventions." BaBar-Note 488, April, 1999.
[24] F. James and M. Roos, "'MINUIT' A System for Function Minimization and
Analysis of the Parameter Errors and Correlations," Comput. Phys. Cormnun,.
10 (1975) 343 367.
[25] R. Brur. and F. Rademakers, "ROOT: An object oriented data analysis
framework." N•ucl. Instrunm. ilMeth. A389 (1997) 81 86.