
NHTSA Frontal Offset Research
31
NHTSA Frontal Offset Research Update on 40% Offset Deformable Barrier And Vehicle-to-Vehicle Tests James Saunders Crashworthiness Research Division Office of Applied Vehicle Safety Research
Transcript of NHTSA Frontal Offset Research
NHTSA Frontal Offset Research
Update on40% Offset Deformable Barrier
AndVehicle-to-Vehicle Tests
James SaundersCrashworthiness Research Division
Office of Applied Vehicle Safety Research
Offset Frontal Protection
Objectives
• Reduce death and injury• Reduce long term impairment, pain and
suffering (especially lower extremities)• Reduce costs of recovery and
rehabilitation• Ensure the test procedure does not
induce disbenefits to the collision partner
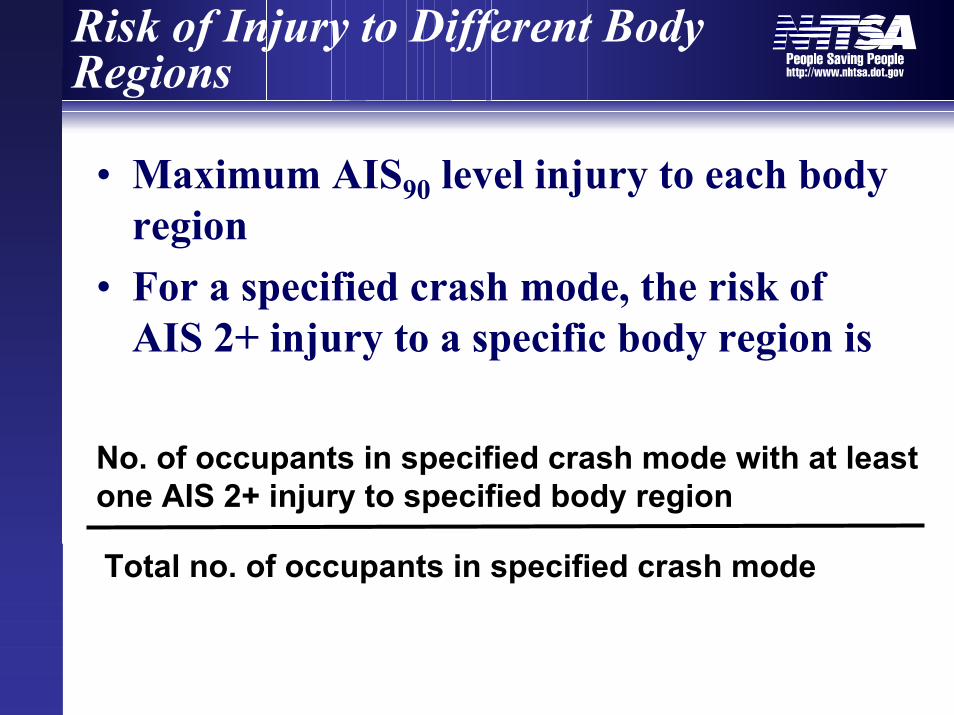
Risk of Injury to Different Body Regions
• Maximum AIS90 level injury to each body region
• For a specified crash mode, the risk of AIS 2+ injury to a specific body region is
No. of occupants in specified crash mode with at least one AIS 2+ injury to specified body region
Total no. of occupants in specified crash mode
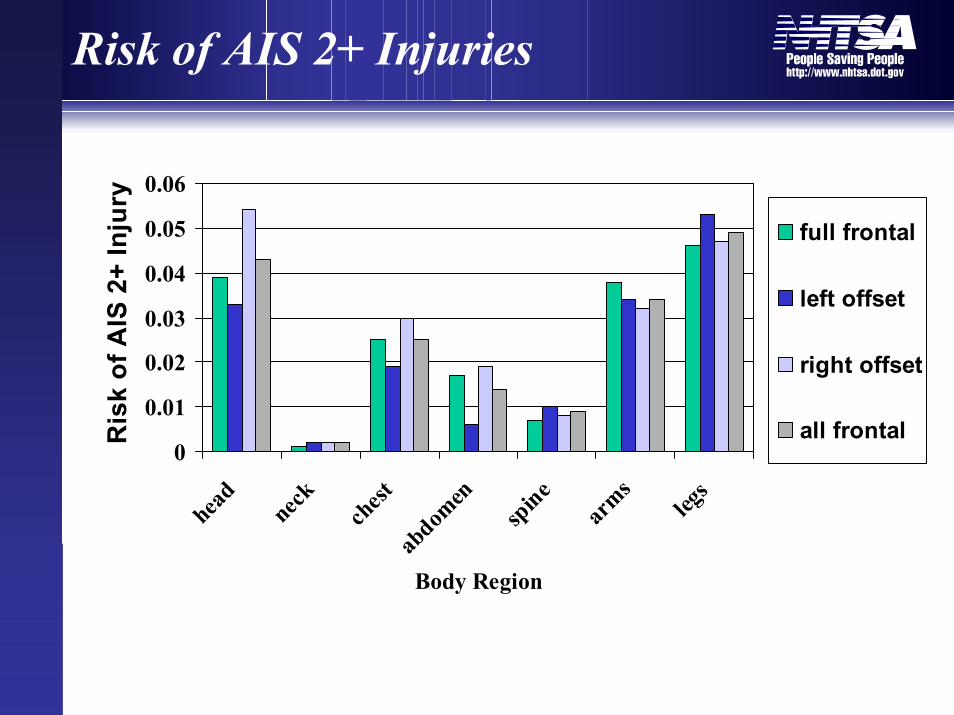
Risk of AIS 2+ Injuries
0
0.01
0.02
0.03
0.04
0.05
0.06
head
neck chest
abdom
en
spine
arms
legs
Body Region
Ris
k of
AIS
2+
Inju
ry
full frontal
left offset
right offset
all frontal
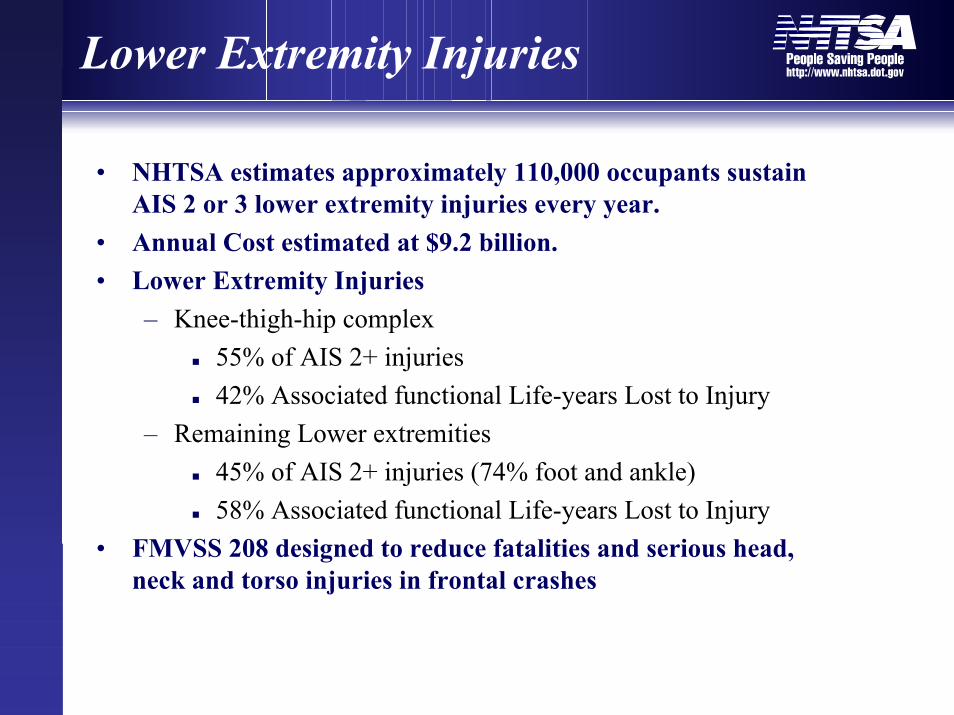
Lower Extremity Injuries
• NHTSA estimates approximately 110,000 occupants sustain AIS 2 or 3 lower extremity injuries every year.
• Annual Cost estimated at $9.2 billion.• Lower Extremity Injuries
– Knee-thigh-hip complex55% of AIS 2+ injuries42% Associated functional Life-years Lost to Injury
– Remaining Lower extremities45% of AIS 2+ injuries (74% foot and ankle)58% Associated functional Life-years Lost to Injury
• FMVSS 208 designed to reduce fatalities and serious head, neck and torso injuries in frontal crashes

Thor-Lx/HIIIr
Axial Compliant Element
Accelerometers x,y
Triaxial Accelerometer
Ankle Rotation(x,y,z)
Lower Tibia Load CellFx,Fy,Fz,Mx,My
Upper Tibia Load CellFx,Fz,Mx,My
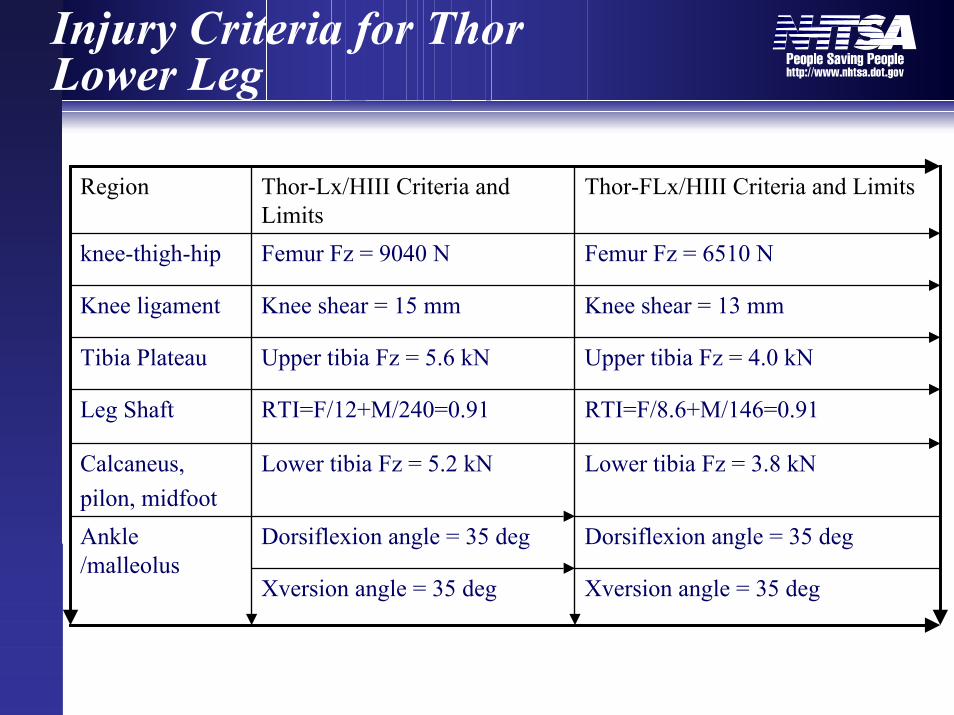
Injury Criteria for Thor Lower Leg
Xversion angle = 35 deg
Dorsiflexion angle = 35 deg
Lower tibia Fz = 3.8 kN
RTI=F/8.6+M/146=0.91
Upper tibia Fz = 4.0 kN
Knee shear = 13 mm
Femur Fz = 6510 N
Thor-FLx/HIII Criteria and Limits
Xversion angle = 35 deg
Dorsiflexion angle = 35 degAnkle /malleolus
Lower tibia Fz = 5.2 kNCalcaneus,pilon, midfoot
RTI=F/12+M/240=0.91Leg Shaft
Upper tibia Fz = 5.6 kNTibia Plateau
Knee shear = 15 mmKnee ligament
Femur Fz = 9040 Nknee-thigh-hip
Thor-Lx/HIII Criteria and Limits
Region
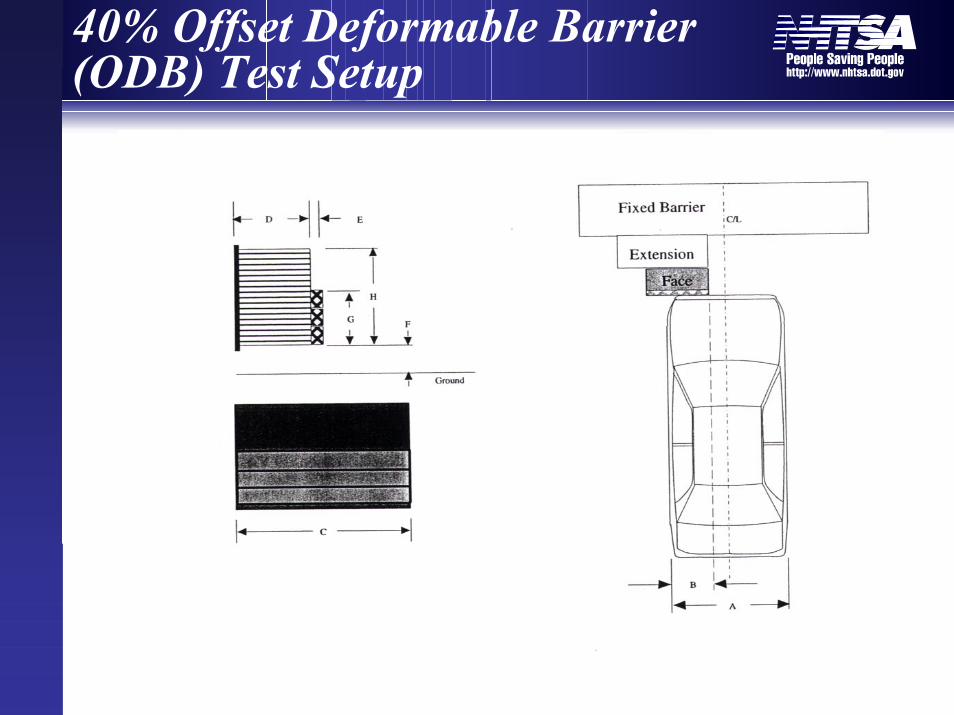
40% Offset Deformable Barrier (ODB) Test Setup

2002 Dodge Neon with 5th HIII
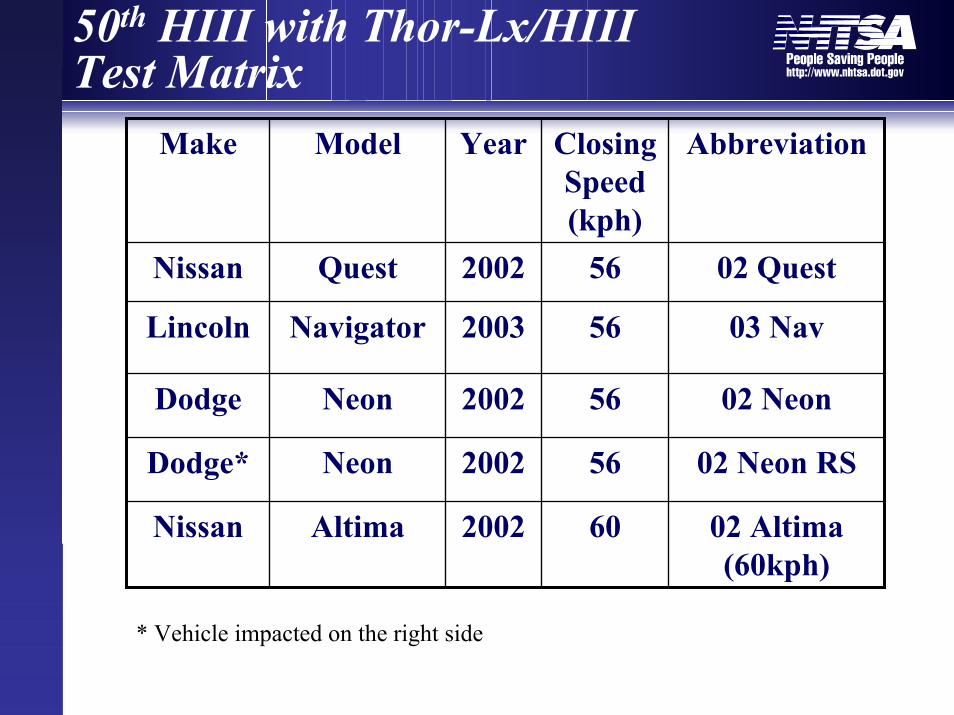
50th HIII with Thor-Lx/HIII Test Matrix
02 Neon562002NeonDodge
60
56
56
56
Closing Speed (kph)
02 Altima (60kph)
2002AltimaNissan
02 Neon RS2002NeonDodge*
03 Nav2003NavigatorLincoln
02 Quest2002QuestNissan
AbbreviationYearModelMake
* Vehicle impacted on the right side

50th HIII Lower Leg Responses with Thor-Lx/HIIIr
0
0.25
0.5
0.75
1
1.25
1.5
02QUEST
03 NAV 02 NEON 02 NEONRS
02ALTIMA(60 kph)
Normalized Femur LoadNormalized Femur Load
0
0.25
0.5
0.75
1
1.25
1.5
02QUEST
03 NAV 02 NEON 02 NEONRS
02ALTIMA(60 kph)
Normalized Knee Normalized Knee DisplacementDisplacement
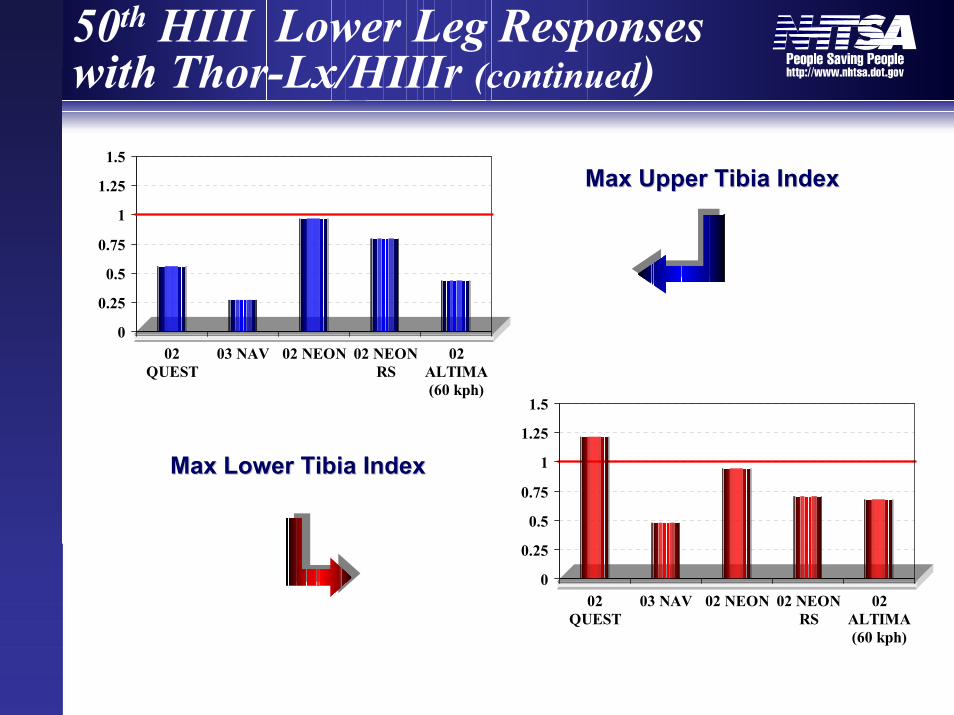
50th HIII Lower Leg Responses with Thor-Lx/HIIIr (continued)
0
0.25
0.5
0.75
1
1.25
1.5
02QUEST
03 NAV 02 NEON 02 NEONRS
02ALTIMA(60 kph)
Max Upper Tibia IndexMax Upper Tibia Index
0
0.25
0.5
0.75
1
1.25
1.5
02QUEST
03 NAV 02 NEON 02 NEONRS
02ALTIMA(60 kph)
Max Lower Tibia IndexMax Lower Tibia Index
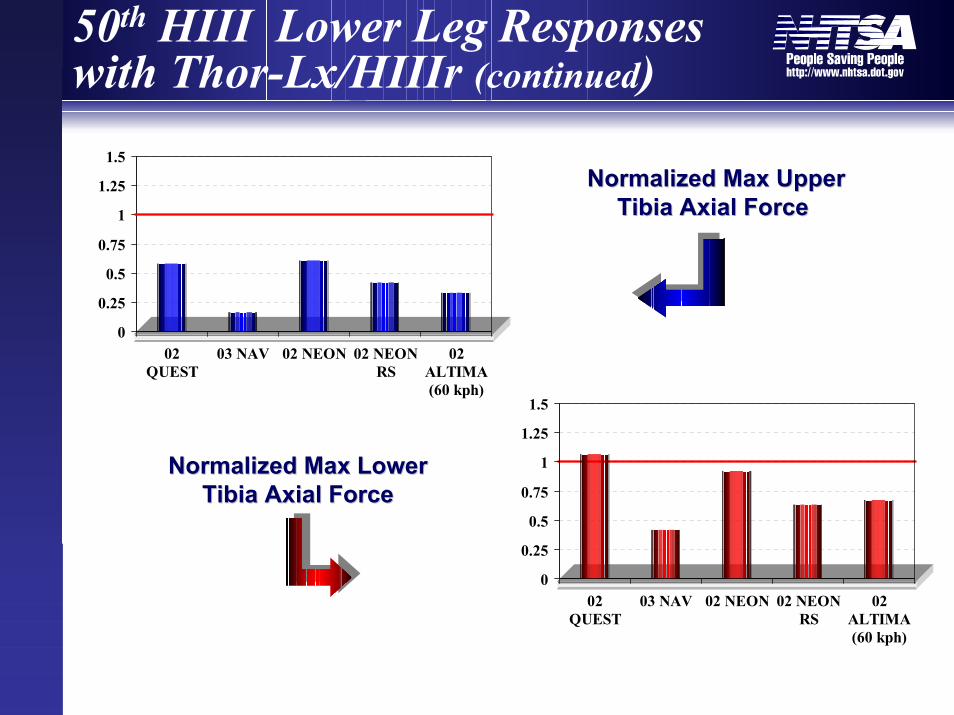
50th HIII Lower Leg Responses with Thor-Lx/HIIIr (continued)
0
0.25
0.5
0.75
1
1.25
1.5
02QUEST
03 NAV 02 NEON 02 NEONRS
02ALTIMA(60 kph)
Normalized Max Upper Normalized Max Upper Tibia Axial ForceTibia Axial Force
0
0.25
0.5
0.75
1
1.25
1.5
02QUEST
03 NAV 02 NEON 02 NEONRS
02ALTIMA(60 kph)
Normalized Max Lower Normalized Max Lower Tibia Axial ForceTibia Axial Force
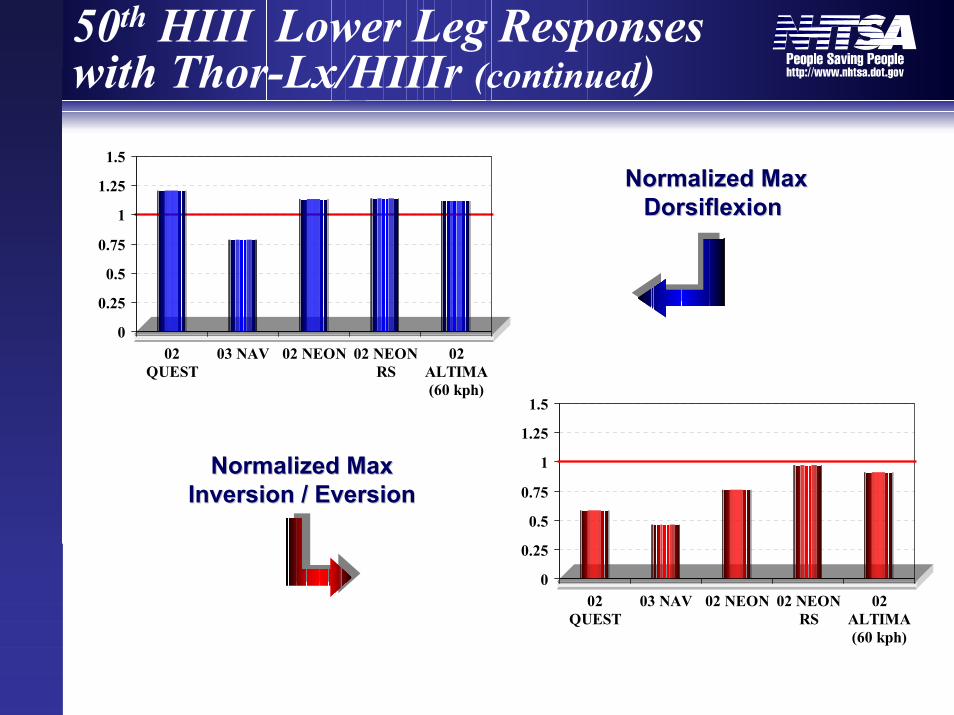
50th HIII Lower Leg Responses with Thor-Lx/HIIIr (continued)
0
0.25
0.5
0.75
1
1.25
1.5
02QUEST
03 NAV 02 NEON 02 NEONRS
02ALTIMA(60 kph)
Normalized Max Normalized Max DorsiflexionDorsiflexion
0
0.25
0.5
0.75
1
1.25
1.5
02QUEST
03 NAV 02 NEON 02 NEONRS
02ALTIMA(60 kph)
Normalized Max Normalized Max Inversion / Inversion / EversionEversion
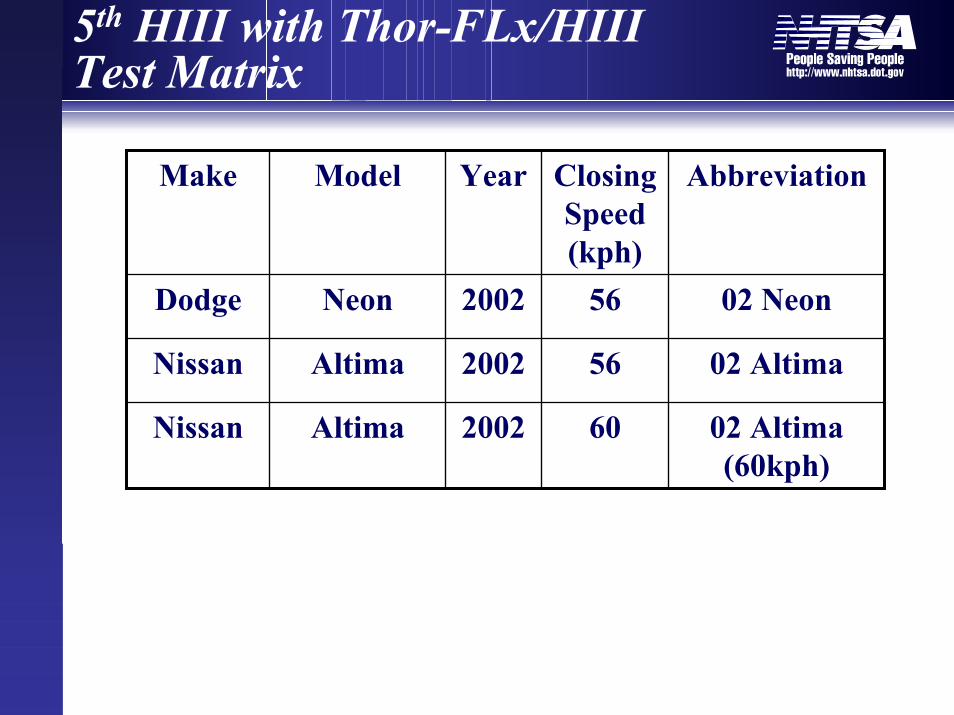
5th HIII with Thor-FLx/HIII Test Matrix
02 Neon562002NeonDodge
60
56
Closing Speed (kph)
02 Altima (60kph)
2002AltimaNissan
02 Altima2002AltimaNissan
AbbreviationYearModelMake

5th HIII Lower Leg Responses with Thor-Lx/HIIIr
0
0.25
0.5
0.75
1
1.25
1.5
02 NEON 02 ALTIMA 02 ALTIMA(60kph)
Normalized Femur LoadNormalized Femur Load
0
0.25
0.5
0.75
1
1.25
1.5
02 NEON 02 ALTIMA 02 ALTIMA(60kph)
Normalized Knee Normalized Knee DisplacementDisplacement
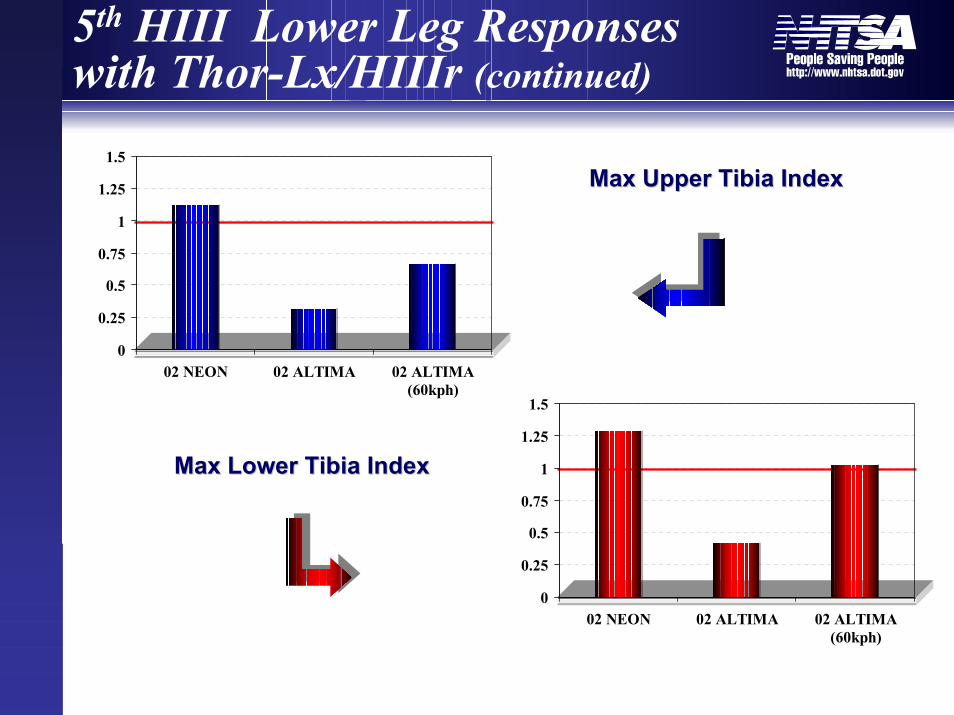
5th HIII Lower Leg Responses with Thor-Lx/HIIIr (continued)
0
0.25
0.5
0.75
1
1.25
1.5
02 NEON 02 ALTIMA 02 ALTIMA(60kph)
Max Upper Tibia IndexMax Upper Tibia Index
0
0.25
0.5
0.75
1
1.25
1.5
02 NEON 02 ALTIMA 02 ALTIMA(60kph)
Max Lower Tibia IndexMax Lower Tibia Index

5th HIII Lower Leg Responses with Thor-Lx/HIIIr (continued)
0
0.25
0.5
0.75
1
1.25
1.5
02 NEON 02 ALTIMA 02 ALTIMA(60kph)
Normalized Max Upper Normalized Max Upper Tibia Axial ForceTibia Axial Force
0
0.25
0.5
0.75
1
1.25
1.5
02 NEON 02 ALTIMA 02 ALTIMA(60kph)
Normalized Max Lower Normalized Max Lower Tibia Axial ForceTibia Axial Force
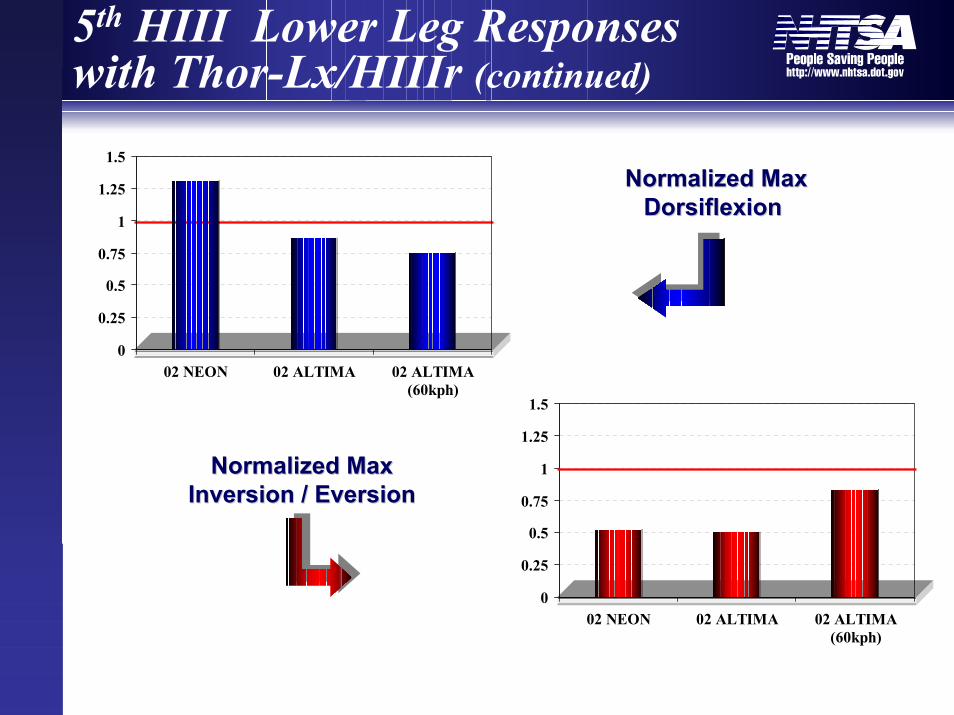
5th HIII Lower Leg Responses with Thor-Lx/HIIIr (continued)
0
0.25
0.5
0.75
1
1.25
1.5
02 NEON 02 ALTIMA 02 ALTIMA(60kph)
Normalized MaxNormalized MaxDorsiflexionDorsiflexion
0
0.25
0.5
0.75
1
1.25
1.5
02 NEON 02 ALTIMA 02 ALTIMA(60kph)
Normalized Max Normalized Max Inversion /Inversion / EversionEversion
ODB Conclusions
• Injury assessment with 50th HIII Thor-Lx/HIIIr is in accordance with injury distribution seen in real world crashes
• Previous results can be found at http://www-nrd.nhtsa.dot.gov/departments/nrd-01/presentations/SAE.html
Vehicle-to-Accord tests Objective
• To determine the disbenefits, if any, from requiring the 40% Offset Deformable Barrier crash tests to evaluate high speed frontal offset crashes
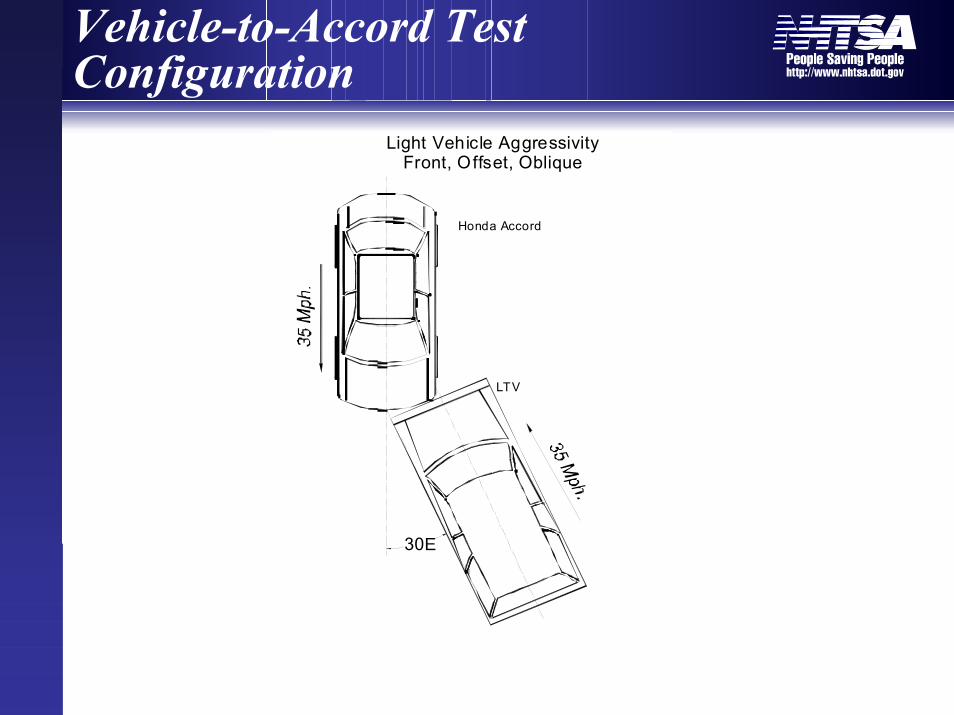
Vehicle-to-Accord Test Configuration
30E
Light Vehicle AggressivityFront, Offset, Oblique
Honda Accord
LTV

Test Matrix
Chevrolet TrailBlazerIIHS Rating: Marginal
Chevrolet BlazerIIHS Rating: Poor
SUV
Mitsubishi Montero SportIIHS Rating: Good
Mitsubishi Montero SportIIHS Rating: Poor
SUV
“After”“Before”
Toyota Sienna (3,937 lbs.)IIHS Rating: Good
Toyota Previa (3,810 lbs.)IIHS Rating: Poor
Minivan
Dodge Ram 1500 (4,969 lbs.)IIHS Rating: Good
Dodge Ram 1500 (4,930 lbs.)IIHS Rating: Poor
Pickup
Toyota Avalon (3,468 lbs.)IIHS Rating: Good
Toyota Avalon (3,225 lbs.)IIHS Rating: Marginal
Large Car
Cadillac Seville (4,008 lbs.)IIHS Rating: Good
Cadillac Seville (3,885 lbs.)IIHS Rating: Poor
Large Car

Blazer Pre-Test Pictures
1997 Blazer (IIHS rated “poor”) 1997 Accord(4686 lbs, Width=1700 mm)
2002 TrailBlazer (IIHS rated “marginal”) 1997 Accord(5181 lbs, Width=1847 mm)
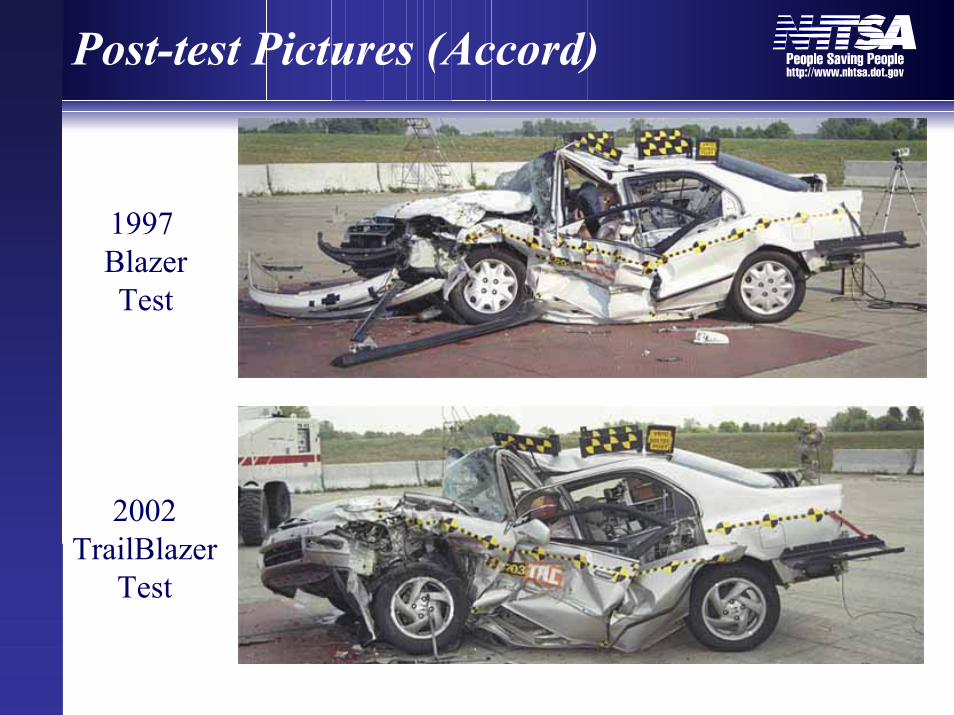
Post-test Pictures (Accord)
1997 BlazerTest
2002TrailBlazer
Test
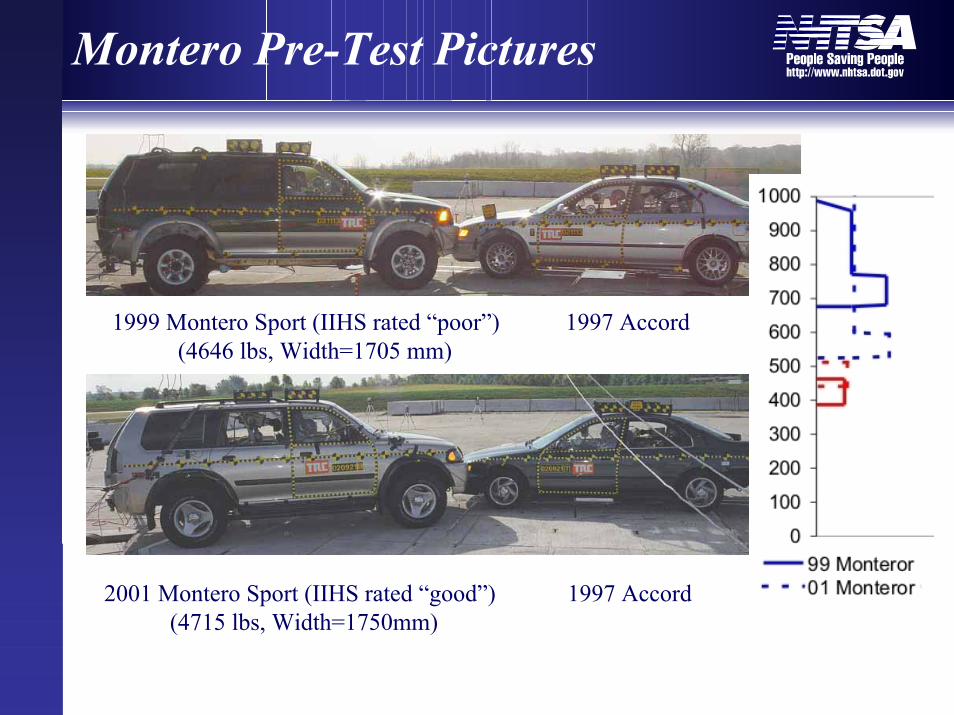
Montero Pre-Test Pictures
1999 Montero Sport (IIHS rated “poor”) 1997 Accord(4646 lbs, Width=1705 mm)
2001 Montero Sport (IIHS rated “good”) 1997 Accord(4715 lbs, Width=1750mm)

Post-test Pictures (Accord)
1999 Montero Sport Test
2001 Montero SportTest

Normalized HIC 15 for Accord Driver
Nor
mal
ized
HIC
15
Nor
mal
ized
HIC
15
MonteroMontero00
0.50.5
11
1.51.5
BlazerBlazerSportSport
OldOld RedesignedRedesigned(4.7)(4.7)
Striking Vehicle
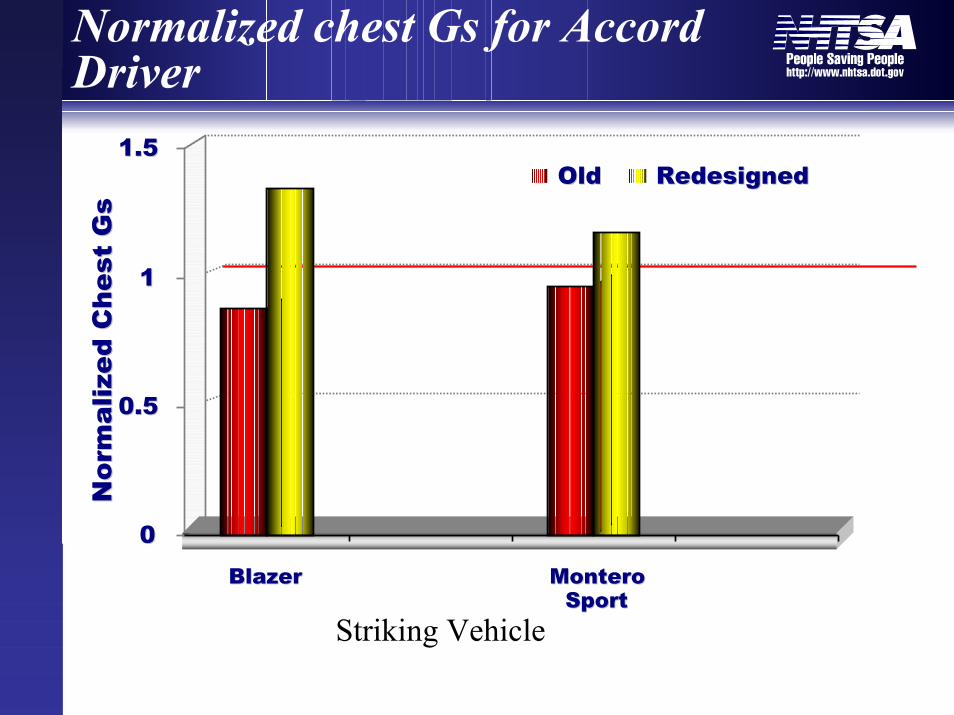
Normalized chest Gs for Accord Driver
Nor
mal
ized
Che
st G
sN
orm
aliz
ed C
hest
Gs
BlazerBlazer MonteroMonteroSportSport
OldOld RedesignedRedesigned
Striking Vehicle
1.51.5
11
0.50.5
00
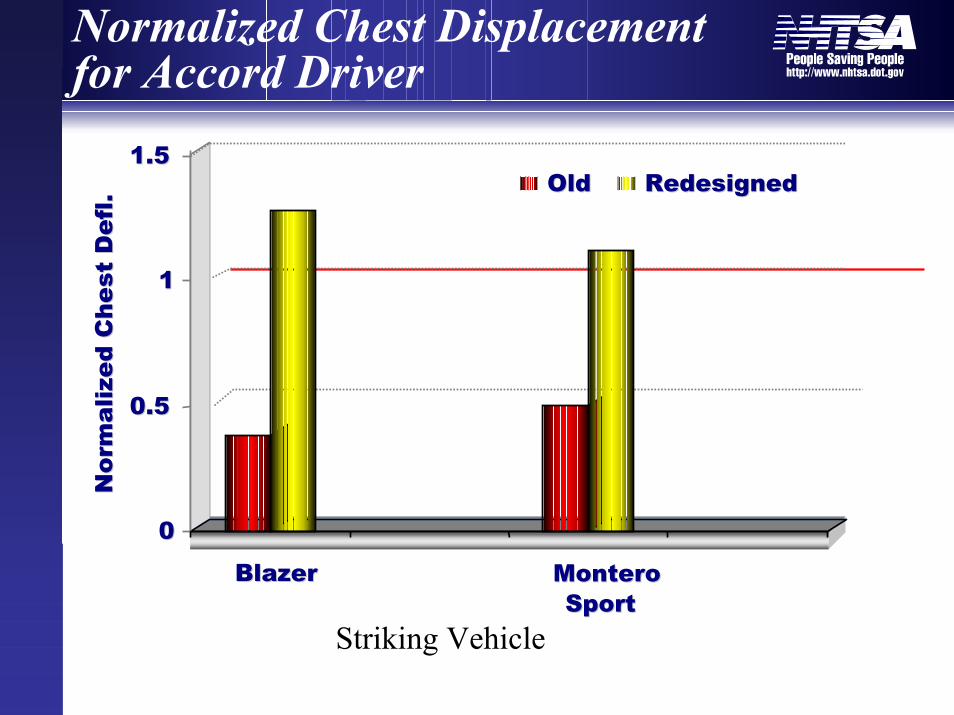
Normalized Chest Displacement for Accord Driver
Nor
mal
ized
Che
stN
orm
aliz
ed C
hest
Def
lD
efl ..
BlazerBlazer MonteroMonteroSportSport
OldOld RedesignedRedesigned
Striking Vehicle
1.51.5
11
0.50.5
00

Vehicle-to-Accord Findings to Date
• Both vehicles showed increased risk in both the head and chest injuries
• Not able to assess the contribution of stiffness, mass and geometry has toward the increase in injury measures
• Need to complete fleet study to determine if the same trend applies for all types of vehicles


![InformedForLife.org Safety Assessment...2015 BMW 335I XDRIVE GT 5 HB AWD CAR NOT RECOMMENDED: [NHTSA frontal impact rating in bottom 71%] [IIHS ratings incomplete] 5 4 55???? ? ?3399](https://static.fdocuments.us/doc/165x107/5ff6ae5026ff9c32961f9ff4/safety-assessment-2015-bmw-335i-xdrive-gt-5-hb-awd-car-not-recommended-nhtsa.jpg)


