DETERMINATION OF FRONTAL OFFSET TEST CONDITIONS … · ABSTRACT This paper reports on the test...
21
Stucki, 1 DETERMINATION OF FRONTAL OFFSET TEST CONDITIONS BASED ON CRASH DATA Sheldon L. Stucki William T. Hollowell NHTSA R&D Osvaldo Fessahaie ISSI, Inc. United States Paper Number 98-S1-O-02 ABSTRACT This paper reports on the test procedure development phase of the agency’s Improved Frontal Protection research program. It is anticipated that even after all cars and light trucks have air bags for drivers and front seat passengers there will remain over 8,000 fatalities a year and over 100,000 moderate to severe injuries. This research program will address these injuries/fatalities through development of crash tests with impact conditions not currently addressed by FMVSS No. 208, development of additional or more appropriate instrumentation and injury criteria on the test surrogate, and evaluation of other sizes of test surrogates. An analysis of crash data is presented using the National Automotive Sampling System (NASS) and the Fatality Analysis Reporting System (FARS) for fatality counts. The population is drivers in frontal collisions with air bag restraints. Using NASS, frontal impact modes are grouped into general "test" conditions which will best represent the real world impact environment. These general test conditions include full barrier, left and right offset, and other impact modes. Using these general groupings of impact conditions, the analysis further assesses degree of overlap and impact direction to determine more specifically which crash conditions result in highest injury/fatality to drivers with air bags. Injury/fatality risk is also assessed by driver size and body region, with a more detailed analysis of leg injuries. Finally, a preliminary benefits analysis is presented for a future frontal, left, offset test procedure. A test procedure has been developed, and is reported on in a separate paper [1]. Collinear and oblique, offset, frontal crash testing, at different widths of overlap, has been conducted with several current model, "target" cars into a standard "bullet" car at closing speeds of about 110 kph. Dummy injury measurements and structural responses provide a basis for determining which impact conditions produce the most severe environment for occupants with air bags. It appears that the oblique impact with over 50 percent overlap produces the most severe responses on the "target" car. Development of this impact configuration into a potential frontal test procedure has been completed using a moving deformable barrier (MDB). INTRODUCTION In the United States, air bags with lap and shoulder belts are specifically required by legislation (i.e., the National Highway Traffic Safety Administration Authorization Act of 1991) for both front outboard seating positions in all passenger cars manufactured after September 1, 1997. They are also required in all light trucks, multipurpose passenger vehicles (e.g., vans, utility and sport vehicles), and buses with a gross vehicle weight rating of 3,846 kilograms (8,500 pounds) or less and an unloaded vehicle weight of 2,489 kilograms (5,500 pounds) or less manufactured after September 1, 1998. NHTSA’s "Third Report to Congress - Effectiveness of Occupant Restraint Systems and Their Use", dated December 1996, estimates that drivers protected by air bags experience a reduced fatality risk of 11 percent overall and 31 percent in pure frontal accidents. The detailed performance requirements for these systems are contained in Federal Motor Vehicle Safety Standard (FMVSS) No. 208, Occupant Crash Protection. The standard has long specified a barrier test requirement using both belted and unbelted dummies. Beginning in March, 1997, Standard 208 has been temporarily modified to allow for a 48 kmph sled test requirement for unbelted dummies which made it easier for manufacturers to quickly introduce less aggressive, depowered air bags. This temporary option expires in September, 2001 and thereafter the full barrier test is again required. The main dynamic performance requirements in FMVSS No. 208, either sled or barrier test, involves successful testing with a 50th percentile adult dummy at all speeds up to 48
Transcript of DETERMINATION OF FRONTAL OFFSET TEST CONDITIONS … · ABSTRACT This paper reports on the test...

Stucki, 1
DETERMINATION OF FRONTAL OFFSET TEST CONDITIONS BASED ON CRASH DATA
Sheldon L. StuckiWilliam T. HollowellNHTSA R&DOsvaldo FessahaieISSI, Inc.United StatesPaper Number 98-S1-O-02
ABSTRACT
This paper reports on the test procedure developmentphase of the agency’s Improved Frontal Protectionresearch program. It is anticipated that even after all carsand light trucks have air bags for drivers and front seatpassengers there will remain over 8,000 fatalities a yearand over 100,000 moderate to severe injuries. Thisresearch program will address these injuries/fatalitiesthrough development of crash tests with impactconditions not currently addressed by FMVSS No. 208,development of additional or more appropriateinstrumentation and injury criteria on the test surrogate,and evaluation of other sizes of test surrogates.
An analysis of crash data is presented using theNational Automotive Sampling System (NASS) and theFatality Analysis Reporting System (FARS) for fatalitycounts. The population is drivers in frontal collisionswith air bag restraints. Using NASS, frontal impactmodes are grouped into general "test" conditions whichwill best represent the real world impact environment. These general test conditions include full barrier, left andright offset, and other impact modes. Using these generalgroupings of impact conditions, the analysis furtherassesses degree of overlap and impact direction todetermine more specifically which crash conditions resultin highest injury/fatality to drivers with air bags. Injury/fatality risk is also assessed by driver size andbody region, with a more detailed analysis of leg injuries. Finally, a preliminary benefits analysis is presented for afuture frontal, left, offset test procedure.
A test procedure has been developed, and is reportedon in a separate paper [1]. Collinear and oblique, offset,frontal crash testing, at different widths of overlap, hasbeen conducted with several current model, "target" carsinto a standard "bullet" car at closing speeds of about 110kph. Dummy injury measurements and structuralresponses provide a basis for determining which impactconditions produce the most severe environment for
occupants with air bags. It appears that the obliqueimpact with over 50 percent overlap produces the mostsevere responses on the "target" car. Development of thisimpact configuration into a potential frontal testprocedure has been completed using a moving deformablebarrier (MDB).
INTRODUCTION
In the United States, air bags with lap and shoulderbelts are specifically required by legislation (i.e., theNational Highway Traffic Safety AdministrationAuthorization Act of 1991) for both front outboardseating positions in all passenger cars manufactured afterSeptember 1, 1997. They are also required in all lighttrucks, multipurpose passenger vehicles (e.g., vans, utilityand sport vehicles), and buses with a gross vehicle weightrating of 3,846 kilograms (8,500 pounds) or less and anunloaded vehicle weight of 2,489 kilograms (5,500pounds) or less manufactured after September 1, 1998. NHTSA’s "Third Report to Congress - Effectiveness ofOccupant Restraint Systems and Their Use", datedDecember 1996, estimates that drivers protected by airbags experience a reduced fatality risk of 11 percentoverall and 31 percent in pure frontal accidents.
The detailed performance requirements for thesesystems are contained in Federal Motor Vehicle SafetyStandard (FMVSS) No. 208, Occupant Crash Protection. The standard has long specified a barrier test requirementusing both belted and unbelted dummies. Beginning inMarch, 1997, Standard 208 has been temporarilymodified to allow for a 48 kmph sled test requirement forunbelted dummies which made it easier for manufacturersto quickly introduce less aggressive, depowered air bags. This temporary option expires in September, 2001 andthereafter the full barrier test is again required. The maindynamic performance requirements in FMVSS No. 208,either sled or barrier test, involves successful testing witha 50th percentile adult dummy at all speeds up to 48
Stucki, 2
kilometers per hour (30 miles per hour) at all anglesbetween perpendicular and 30 degrees to either side ofperpendicular. The tests can be run both with the dummybeing unbelted and with the belts on. "Successful" crashtesting requires that the dummy Head Injury Criterion(HIC) be 1,000 or less, the dummy chest deceleration be60 G’s or less, and the dummy femur loads be at or below10,000 Newtons. The chest deflection on the Hybrid IIIdummy must be less than 75 millimeters.
The agency is currently in the process of proposingfurther requirements for reducing air bag aggressivenesswhich will lead to advanced air bags. Based onassessment of technologies which will come available inthe next few years future air bag systems may include variable level deployments, or suppression, based oncrash severity, and/or restraint use, pre-crash occupantposition and/or size. As previously noted the full barriertest will again be required in September, 2001 to possibly"recapture" injuries/fatality savings in high severitycrashes which may have been lost with depowered airbags. Part of the analysis in this paper is to look atcrashes which may be represented by the 30 mph fixedbarrier test of FMVSS No. 208 in terms of frequency ofinvolvement, and injuries.
Even after full implementation of driver andpassenger air bags as required by FMVSS No. 208, it hasbeen estimated that frontal impacts will still account forover 8,000 fatalities and 120,000 moderate-to-criticalinjuries (i.e., injuries of AIS 2). The fatality estimate isbased on 1995 FARS figures adjusted to a baseline non-air bag fleet and applying an air bag effectivenessestimate of 11 percent (from the Agency’s "Third Reportto Congress - Effectiveness of Occupant ProtectionSystems and Their Use.") to predict fatalities for an all airbag fleet. The number of fatalities in non-rollover frontalimpacts is based on the proportion estimated by theNASS analysis and the computations are shown as part ofTable 9. The estimates of annual numbers of moderate-to-critical injuries are from the Agency’s "FinalRegulatory Evaluation - Actions to Reduce the AdverseEffects of Air Bags - FMVSS No. 208 - Depowering." The objective of this research program is to address thesefatalities and injuries and provide a basis for the possiblefuture improvements in frontal protection. This mayinclude upgrade of FMVSS No. 208 injury criteria andtest devices, and the development of supplementary testprocedures for the evaluation of occupant injury incrashes of higher severity and in different impact modesthan those addressed by the current FMVSS No. 208 [2-
5].
The agency has been directed by Congress to developa frontal, offset compliance test to complement thecurrent FMVSS No. 208 full frontal test. The agency is evaluating a 40 percent overlap, 60 Kmph full-fixed-deformable barrier test which has been adopted inEurope, but at a test speed of 56 kmph. This willdetermine whether benefits can be realized in the U.S.from adopting this test procedure in the near future. Theplan for making this assessment was presented in a reportto Congress in April, 1997. The results of the FY 1997testing is presented in a proposed paper for the 16th ESVConference [6]. The oblique/offset test being developedby NHTSA ‘s Research and Development office wouldbe considered a longer term project.
Defining the problem includes assessing crash dataand identifying general laboratory test conditions that canbe used to replicate the safety performance of air bagvehicles in use. Then, evaluating the performance of avariety of production vehicles under those preliminarycrash conditions, comparing their performance, andconducting potential benefits assessments to guide theagency for the "final" selection of a test procedure(s).
Some general conclusions from the analysis are:
� For drivers in frontal collisions with air bags, theoffset crash configurations with highest frequencyand risk of serious to fatal injuries is a left offset,vehicle-to-vehicle impact with substantial overlap .
� Drivers with air bags have a higher risk of leg injuryin left offset crashes than in other frontal crashes and,thus, reducing leg injuries should be a primeobjective in development of a offset test procedure.Leg injury should address tibia, knee and anklemeasures, not addressed currently in the standard.
� For left offset impacts, improvements to reduceinjury should address leg/instrument panel and floorinteraction and all regions with left side surfaces.
� The size grouping representing 50th percentile malesresults in the highest crash exposure and number ofinjuries/fatalities for left offset impacts. However,both smaller and larger drivers have a higher risk ofAIS 2 injuries and larger drivers have higher risk ofAIS 3 injuries and fatalities even though their crashexposure is much lower than that for the 50thpercentile grouping.

Stucki, 3
0%
1%
2%
3%
4%
5%
6%
7%
Ris
k of
MA
IS>
=3
Belted Unbelted As UsedBelt Use
Air Bag No Air Bag
Figure 1. Serious Injury Risk by Restraint, Drivers in Frontals
0.0%
0.2%
0.4%
0.6%
0.8%
1.0%
1.2%
1.4%
Per
cent
Arms Thorax Head LegsBody Region
Air Bags No Air Bags
AIS>=3 Injury, Belts "As Used"
Figure 3. Serious-to-Fatal Injury Risk by Body Region, Belts “As Used”
0.0%
0.2%
0.4%
0.6%
0.8%
1.0%
1.2%
1.4%
Ris
k of
Fat
ality
Belted Unbelted As UsedBelt Use
Air Bag No Air Bag
Figure 2. Fatality Risk by Restraint, Drivers in Frontals
� Based on various assumptions, a requirement for a left offset test procedure could save as many as 5,100 AIS 3 injuries and over 20,000 AIS 2injuries each year. Leg injuries alone could bereduced annually by about 11,000 for AIS 2 andabout 2,000 for AIS 3. Although not estimated, itappears that substantial fatalities could be reduced. The European (EU) offset test procedure couldpotentially address many of the leg injuries, whileother recent or future vehicle improvements, such asFMVSS No. 201 head protection or future advancedair bags will eliminate many of the other injuries andfatalities.
The analysis is based on relatively limited cases ofdrivers with air bags in NASS and findings may changewith additional data.
CRASH ENVIRONMENT
The agency's National Automotive Sampling System(NASS) files for the years 1988-96 were used to projectthe occupant injuries that will occur in an all air bag fleet. In the 1988-1996 NASS there are about 2700 vehicleswith driver air bags in frontal crashes. The analysis willidentify test conditions to simulate crashes with highestrisk and frequency of injury/fatality. These testconditions can be used to analyze the safety performanceof baseline vehicles and to assess potentialcountermeasures. The NASS is a statistical sample ofthe United States accidents investigated in detail. About4,500 crashes per year are currently being investigated. The NASS files for these years differ from those ofprevious years in that only the more serious accidentsqualified for inclusion into the files. Crashes involvingair bag-equipped vehicles have been increasing alongwith the increasing installations. Between 1988 and1996, the NASS teams investigated 44,368 crashes,representing an estimated 21 million crashes and12 million injured vehicle occupants nationwide. In thesecrashes, 2,891 driver and 378 right, front passenger airbag deployments were investigated, representing anestimated 1,012,263 driver and 124,506 right, frontpassenger air bag deployments that occurred during thattime frame.
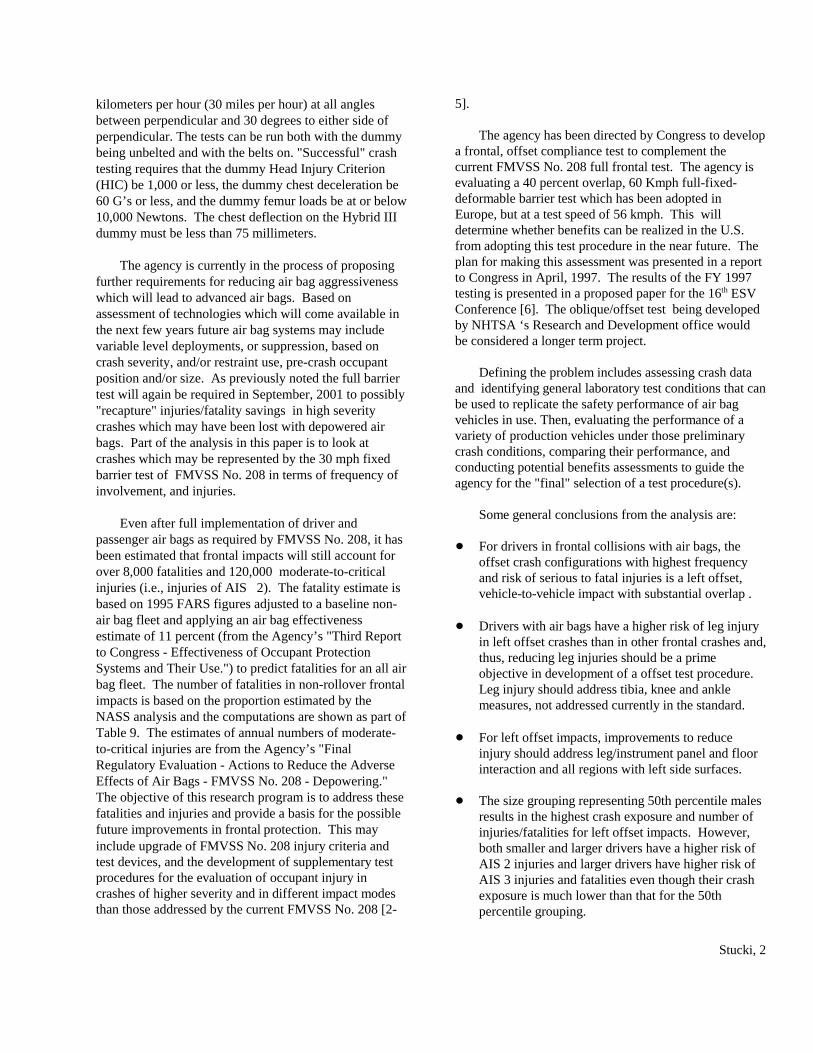
When comparing drivers with air bags to thosewithout air bags serious injury risk is slightly lower withair bags and belts and belts “as used”, i.e, nodiscrimination for whether belts were or were not used(Figure 1, and Table 1.) However, for fatalities air bagshave lower rates for all restraint conditions and

Stucki, 4
0.0%
0.2%
0.4%
0.6%
0.8%
1.0%
Per
cent
Arms Thorax Head LegsBody Region
Air Bags No Air Bags
AIS>=3 Injury, Belts Used
Figure 4. Serious-to-Fatal Injury Risk by Body Region, Belts Used
0.0%
0.5%
1.0%
1.5%
2.0%
2.5%
3.0%
3.5%
Per
cent
Arms Thorax Head LegsBody Region
Air Bags No Air Bags
AIS>=3 Injury, Belts Not Used
Figure 5. Serious-to-Fatal Injury Risk by Body Region, Belts Not Used
substantially lower for belts “as used” (Figure 2.)
Figures 3 to 5 and Table 2 show risk of seriousinjury by body region in frontal crashes for drivers of airbag equipped vehicles in air bag and non-air bag cars withand without belts. For serious-to-fatal injury and belts“as used” head, thorax and leg injuries are substantiallylower with air bags. (Figure 3.) Arm injuries aresomewhat higher with air bags. Since the majority ofdrivers in frontal impacts are belted (about 84 percentwith air bags and 68 percent without) the injury risks bybody region are similar when belts are used (Figure 4) aswhen “as used” . For unbelted drivers there is noapparent reduction in serious to fatal chest or headinjuries with air bags (Figure 5.)
Traditionally, fatality reduction has been theemphasis of the agency’s research program. Morerecently, however, attention has been focused towardinjury reduction, particularly for those injuries which leadto life long disabilities. This added focus includes therole of lower extremity and pelvic injuries in frontalcrashes. Selection of Test Conditions Based on Crash ImpactModes
An additional test procedure for increased frontalprotection should simulate those impact modes in the “real-world” crash environment which result in highestfrequency and risk of injury/fatality. Since FMVSS No.208 sets performance requirements for full frontalimpacts, the initial analysis focused on "offset", frontal impacts as candidate accident modes for simulation. The
accident analysis has been coupled with offset crashtesting to determine which impact configurations producethe highest likelihood and frequency for injury/fatality.
Drivers of all vehicles in 1988-1996 NASS weregrouped by their general area of damage (GAD) andprincipal direction of force (DOF1) into a frontal impactpopulation. Drivers were considered to be in frontalimpacts if their vehicle sustained DOF1 between 11 and 1o'clock or DOF1 was 10 or 2 and GAD1 was front or sidewith damage forward of the A-pillar. The frontal impactpopulation is then separated into specific crash modes toidentify potential impact configurations with highfrequency and risk of injury to be simulated by crash testprocedures. The frontal population was separated bydirection of force (DOF) into collinear or oblique (left orright), by damage distribution into offset (left or right) ordistributed, and by object contacted into another vehicleor fixed object. Counts in the paper are weighted unlessnoted. DOF is used to delineate collinear (12 o'clock),left (10 & 11 o'clock) and right (1 & 2 o'clock) obliqueimpacts. For frontal damage (GAD1=F), overlap isdefined by the crash "D" variable when known and after1989; otherwise, the primary specific horizontal location(SHL1) is used, and is separated into distributed ("D"=0or SHL1=D), left ("D"<0 or SHL1=Y or L) and right("D">0 or SHL1=Z or R) offset impacts. For thoseimpacts with left or right damage (GAD1) the locationmust include the front corner of the vehicle (SHL1=F)and is entered as left or right 1/3 of the vehicle's front(equivalent to SHL1=L or R for GAD1=F.)
Grouping Into Most Appropriate Test Procedure

Stucki, 5
0%
1%
2%
3%
4%
5%
6%
7%
% o
f Veh
icle
s w
ith >
6"
Full Barrier Left Offset Total OffsetCrash Modes
Under 30 mph All
Figure 6 - Percent of Vehicles with 6 inches or more Intrusion by Crash Mode
The exposure population for frontal impacts, i.e,number of collisions, is based on 1988 to 1996 NASS toestimate the exposure for an all air bag fleet. Drivers infrontal collisions are grouped by impact conditions (DOF,damage distribution and crash partner) into the mostappropriate test situation to simulate the type of collision.
For specifying impact conditions for a future frontal,offset test both crash pulse and intrusion are ofcomparable importance in occupant injury outcome. However, the agency is also currently addressing issuesof what are the appropriate conditions for a full frontaltest procedure in FMVSS No. 208, i.e, the full barrier, thecurrent sled test or some other simulation test. For thesetypes of tests, intrusion is of secondary importance andcrash pulse alone is the important crash factor in theoccupants injury outcome. To show a comparison ofintrusion in full barrier type impacts and offset impacts,crash situations with intrusions of 6 inches or more intothe vehicle compartment are assumed to compromise thecompartment integrity and lead to serious or fatal injuries. As shown in Figure 6 the incidence of 6 inches or moreintrusion is much greater in the offset impact modes thanin the full barrier type modes, especially for crashseverities less than 30 mph.
Figure 7 shows the test situations, the impactconditions for that test and the percentage of all frontalimpacts represented. The first group of impact modes arethose in which the test must account for both crash pulseand intrusion. The current frontal test is a full frontalimpact into a fixed rigid barrier with impact angles on the
car from -30 to +30 degrees. As shown in the figure, allcollinear, distributed damage impacts and oblique,distributed damage, fixed object impacts with distributeddamage are assumed to be best simulated by this testcondition. The left offset configuration, either collinearor oblique direction of impact is assumed that all leftoffset impacts, either collinear or oblique, are bestrepresented by this test condition. Also, it is assumed thatthe left oblique, vehicle-to-vehicle impact, withdistributed damage is better simulated by the left offsettest than by the barrier test. Not only may less than fulloverlaps often produce distributed damage, but theinteraction of the vehicle and the propensity for higherintrusion is well simulated by this test even though theremay be near distributed damage.
A right offset configuration would include right sideimpacts in the same way as left side impacts are includedin the left offset test. About 9 percent of cars haveoffset, frontal damage which is opposite to the clockdirection, i.e., left and right oblique impacts with rightand left offset damage, respectively. Note that thiswould be the impact configuration for the "bullet" vehiclein a left or right oblique impact to the "target" vehicle, asshown in Figure 6. Based on the assumed groupings ofvehicle impact conditions from above, the left offset testwould represent about 34 percent of cars with air bags in"frontal" crashes, with right offset making up about 35percent and full barrier about 22 percent.
If only crash pulse is considered, the full frontalfixed barrier accounts for the majority of impact modes infrontal crashes. Collinear, car-to-car crash tests at partialoverlaps of 50, 60 and 70 percent, and a 30 degreeoblique car-to-car impact with 50 percent overlap on aChevrolet Corsica using a Honda Accord as the strikingvehicle have been conducted. The car-to-car tests wereconducted with both cars moving at about 56 kmph. Also, the agency has conducted an NCAP test using theCorsica, i.e., a 56 kmph, full frontal, rigid barrier test. The longitudinal compartment deceleration crash pulsesare shown in Figure 8. The collinear 60 and 70 percentoverlap crash tests appear to be well simulated by the fullbarrier impact along with the oblique impact at 50 percentoverlap. However, for the collinear impact at 50 percentoverlap the crash pulse appears to deviate somewhat fromthe full barrier pulse. Based on these comparisons, thecollinear impacts with overlaps ranging from somewherebetween 50 and 60 percent (say 55 percent) to fulloverlap were classified as “full barrier-like” crashes. Since exact overlap dimensions are not available in allNASS cases, SHL1 also must be used. SHL1 is used to

Stucki, 6
Figure 7. Possible Frontal Test Conditions and Impact Modes Addressed (1988-1996 NASS)
-30
-25
-20
-15
-10
-5
0
5
Acc
eler
atio
n, G
’s
0 25 50 75 100 125 150Time (Milliseconds)
50% 60% 70%
Full 50% Oblique
Figure 8. Crash Pulses by Overlap, Chevrolet Corsica, hit by Honda Accord and NCAP, at 56 Kmph
define a crash as “full barrier-like” for values of E andgreater overlap.
Oblique, car-to-car impact tests have been conductedonly at nominally 50 percent overlap impact conditions. As shown in Figure 8 the 50 percent overlap, obliquecrash test actually produces as severe compartmentdeceleration crash pulse as the NCAP full barrier test, atsimilar impact speeds for the Corsica. Thus, in theabsence of additional tests with varying proportions ofoverlap, it is assumed that oblique impacts can berepresented by the full barrier test at overlaps of D andgreater. The category of frontal impacts which qualify as“full barrier” (FB) like crash pulses, based on thisanalysis, include:
� Collinear with 55 percent and greater overlap orSHL1 E when exact overlap dimension is notavailable
� Oblique (DOF1 12 o’clock) with SHL1 D
The 1988 through 1996 NASS-CDS files are queriedfor impact conditions shown above. Drivers in crasheswith “barrier-like” impact conditions on the vehicle are
compared to drivers of vehicles in all frontal crashes todetermine what proportion of all frontal impacts arerepresented by “barrier-like” impact conditions. Thiscomparison is made for:

Stucki, 7
0.0%
2.0%
4.0%
6.0%
8.0%
Full Barrier Left Oblique Right Oblique
MAIS>=2 MAIS>=3
Left Offset Rightt Offset
Figure 9. Injury Risk by Test Condition
0.0%
0.1%
0.2%
0.3%
0.4%
0.5%
Full Barrier Left Oblique Right ObliqueLeft Offset Rightt Offset
Figure 10. Fatality Risk by Test Condition
� All drivers� Drivers of vehicles with air bags, and MAIS 3
injuries
The 1988 through 1996 NASS-CDS files are queried forimpact conditions which produce crash pulses which maybe fairly well represented by the full barrier crash pulse,as discussed above (referred to subsequently as “barrier-like.”) Drivers in crashes with “barrier-like” impactconditions on the vehicle are compared to drivers ofvehicles in all frontal crashes.
For drivers in vehicles with air bags the proportion ofdriver in vehicles with “barrier-like” crashes as a percentof all frontal crashes is:
� 74 percent for all drivers� 83 percent for drivers with MAIS 3 injuries� 73 percent for driver fatalities
The remainder of the paper will consider those crashconfiguration groupings which account for both crashpulse and intrusion as factors in occupant injury.
Injury Risk by Test Configuration
Comparing injury risk shows that for moderate andmore severe injuries (MAIS 2) the injury risk issomewhat higher for vehicles in crashes fitting “leftoffset” than those described by “full barrier” (7.6percent and 6.8 percent, respectively.) For serious andhigher injuries (MAIS 3), the "full barrier" groupingshas the highest injury rate (3.8 percent.) Left offset andright offset groups both have much lower serious injuryrates of about 2.1 percent and 1.3 percent, respectively(Figure 9. And Table 3) Figure 10 shows fatality risk forthe various impact modes grouped into appropriate testcondition. These fatality rates are based on limitedobservations: 10 for full barrier, 38 for left offset, and 10for right offset. The left offset grouping has much higherfatality risk (0.43 percent) than full barrier (0.25 percent)and almost four times that experienced by drivers with airbags in right offset modes (0.11 percent.)
An estimate of the annual injuries/fatalities whichmight be expected with an all air bag fleet is computed inTable 3 and shown in Figures 11 and 12. The estimatesare based on the injury/fatality risks, shown previously,applied to the expected number of drivers with air bags intow-away crashes in an average year (1988 through 1996NASS divided by nine.) Based on these estimates the left
offset impact modes would result in the highest numberof drivers with MAIS 2 and fatal injuries (about 47,000and 4,200, respectively.) Although full barrier typeimpacts would account for the highest number ofMAIS 3 injuries (14,942) the left offset modes are onlyslightly less (13,042.)
Within the test groupings for left offset and rightoffset the effect of overlap on injury rate was assessed. As a rough approximation of overlap percent, an averagecar width of 66 inches is assumed for "L" in the offsetformula: Overlap = 1-(2*D/L), where “D” is the distancefrom the vehicles center-line to the damage mid-point. Overlap is then separated into 1/3 or less of the car width,over 1/3 to 2/3 of the width and over 2/3 of the width. As

Stucki, 8
0%
1%
2%
3%
4%
0-1/3 >1/3-2/3 >2/3 Total
Left Oblique/Offset Right Oblique/Offset
Figure 13. Serious-to-Fatal Injury Risk by Overlap
0
1000
2000
3000
4000
5000
Full Barrier Left Oblique Right ObliqueLeft Offset Rightt Offset
Figure 12. Estimated Annual Fatalities by Test Condition
0
10000
20000
30000
40000
50000
Full Barrier Left Oblique Right Oblique
MAIS>=2 MAIS>=3
Left Offset Rightt Offset
Figure 11. Estimated Annual Injuries by Test Condition
discussed above, left and right damaged vehicles with damage to the front corner were grouped into the 1/3overlap category. By using these damage widthgroupings, the SHL1 parameter, which is separated intodamage width increments of one-third of the vehiclewidth, may be used when "D" is not known. Therelatively low injury risk for configurations groupedunder a left offset test appears to be due to lowoccurrence of MAIS 3 injuries in narrow overlapimpacts. For left offset impacts the rate of MAIS 3injuries is about 1.5% for 1/3 or less overlap (Figure 13and Table 4.) Overlaps in the 1/3 to 2/3 range, also, resultin fairly low injury rates for these configurations. Atoverlaps over 2/3, left offset impacts produce higherMAIS 3 injury rates, increasing to about 3.6 percent forover 2/3 overlap while right offset impacts at larger
overlaps produce lower injury rates (1.8 percent for rightoffset.) The left offset impact at over 2/3 overlapproduces the highest MAIS 3 injury rate of all offsetimpact modes considered (3.8 percent.)
Recommendation
Based on analysis of the NASS crash data files ofdrivers in frontal collisions with air bag restraints, theoffset crash test which represents actual crashconfigurations with the highest frequency and risk ofserious to fatal injuries is a left offset, vehicle-to-vehicleimpact with substantial overlap (E or greater.) Thespecific recommendations for impact angle and overlappercentage will be variables addressed in the crash testdevelopment phase of the program. The remainder of thepaper assumes that this type of test condition will beselected as the offset procedure for the future and theanalysis focuses on these crash modes.
Body Region Injury Assessment
Injury measures, criteria and instrumentation and thetest surrogate itself should be selected based on thelocation and type of injuries experienced by the driver infrontal, left offset crashes.
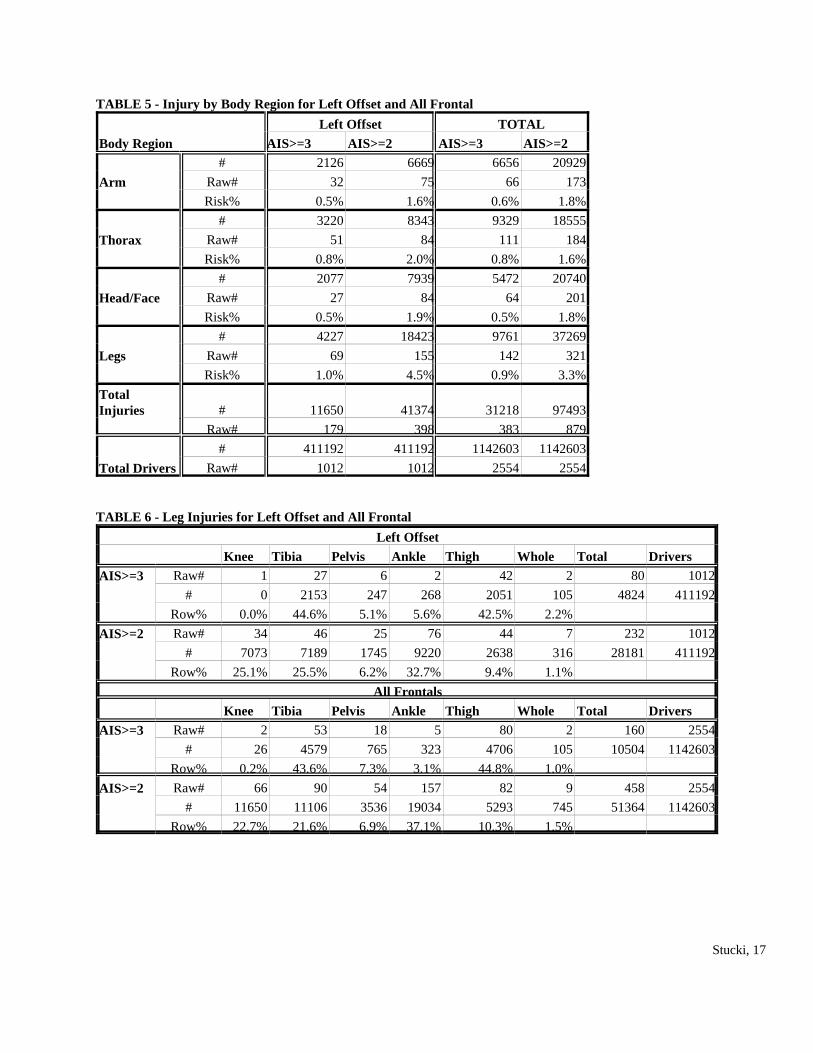
Injuries to specific body region are tallied by AISlevel counting only the single, most severe injury to eachindividual body region which make up the general bodyregion group (head, chest, arms and legs.) The risk ofinjury to a body region is the sum of injuries at thespecific AIS level divided by all drivers in the crashmode. As shown in Figures 14 and 15 and Table 5, legs

Stucki, 9
0%
10%
20%
30%
40%
Pro
port
ion
of L
eg In
jurie
s
Knee Tibia Pelvis Ankle Thigh
Left Obl./Offset All Frontal
Figure 16. Proportion of AIS 2 Leg Injuries
0%
1%
2%
3%
4%
5%In
jury
Ris
k %
Arm Thorax Head/Face LegsBody Region
Left Obl./Offset All Frontal
Figure 14. AIS 2 Body Region Injury Risk, Left Offset and All Frontal Impacts
0%
10%
20%
30%
40%
50%
Pro
port
ion
of L
eg In
jurie
s
Knee Tibia Pelvis Ankle Thigh
Left Obl./Offset All Frontal
Figure 17. Proportion of AIS 3 Leg Injuries
0.0%
0.2%
0.4%
0.6%
0.8%
1.0%
1.2%
Inju
ry R
isk
%
Arm Thorax Head/Face LegsBody Region
Left Obl./Offset All Frontal
Figure 15. AIS 3 Body Region Injury Risk, Left Offset and All Frontal Impacts
have a higher risk of AIS 2 and AIS 3 injury in leftoffset impacts than all frontals with other body regionshaving similar rates in both crash modes. Thus, reducingleg injuries should be a prime objective in addressing leftoffset crashes.
For drivers with air bags, AIS 2 leg injuries areseparated into specific injury location in Figure 16 andTable 6. For these injuries, the ankle is most frequentlyinjured followed by the knee and tibia, regardless ofwhether the impact is left offset or all frontals. Togetherthese regions make up almost 90 percent of all AIS 2 leginjuries in left offset crashes. The tibia and femurdominate the severe leg injuries, with about 45 percent ofleg injuries to the tibia and almost 43 percent to thefemur, again, regardless of impact mode (Figure 17.) About E of moderate and serious leg injuries arefractures. Thus, a test surrogate should have appropriatehardware and be instrumented to assess AIS 2 ankle andknee injuries and AIS 3 tibia and femur injuries with thetype of lesions listed.
Injury Assessment by Size
The current frontal impact protection standard(FMVSS No. 208) assesses vehicle performance with asingle size, 50th percentile, male dummy. An assessmentof the crash environment by driver size was conducted toindicate whether there is a need to incorporate additionalsize dummies in future frontal test procedures. Driverswere grouped into three categories based on height of testdummies representing the 5th percentile female, 50thpercentile male and 95th percentile male. The heights foreach category are:
• 5th % group - less than 164 cm

Stucki, 10
0%
1%
2%
3%
5th% 50th% 95th%
Left Oblique/Offset All Frontals
Figure 19. MAIS 3 Injury Risk by Size
0%
10%
20%
30%
40%
50%
60%
5th% 50th% 95th%
Left Oblique/Offset All Frontals
Figure 18. Crash Exposed Drivers by Size
0.0%
0.1%
0.2%
0.3%
0.4%
0.5%
0.6%
0.7%
5th% 50th% 95th%
2
277
740
12
Left Oblique/Offset All Frontals
Figure 20. Fatality Risk by Size
• 50th % group - 164 to 180 cm• 95th % group - over 180 cm
The distribution of drivers with air bags grouped byheight is shown in Figure 18 and Table 7 for left offsetimpacts and for all frontal impacts. The 50th % groupingrepresents about 58 percent of all involved drivers in leftoffset and all frontal impacts, the 5th % about 24 percentand the 95th about 18 percent.
Figures 19 and 20 show MAIS 3 injury and fatalityrisk, respectively, by the three size groupings. Previousanalyses have shown that smaller drivers, generallyfemales, tend to have lower severity crashes and thus mayhave lower injury risk as a result. Because of the limitedobservations, as shown in Table 8, for assessinginjury/fatality risk, no attempt is made to consider severity(deltaV.)
The fatality risk is based on limited numbers with“raw” counts shown above each bar in Figure 20. The5th percentile generally shows a lower injury/fatality ratefor the left offset crash modes; however, this groupexperiences a higher MAIS 2 injury rate than the 50thpercentile group. The 95th percentile shows highest riskfor MAIS 2 and MAIS 3 injuries and fatalities. Thehigher injury risk for the 95th % grouping is due, at leastin part, to the higher risk of leg and head injury (Table 8.) For all frontal impacts the 5th percentile exhibits similarinjury risk as the other size groupings; however forfatalities the risk is much lower, but is based on limitedobservations.
The number of injuries and fatalities which might beexpected annually for each size group with an all air bagfleet is estimated below for left offset impact modes. The estimates are based on current year Fatality Analysis
Reporting System (FARS, 1995) for fatalities and theNHTSA Final Regulatory Evaluation (FRE) on Air BagDepowering for MAIS 2 injuries.
Table 9 presents the work sheet for computing theestimates. The annual exposure by size group is from1988-1996 NASS for an average year which is multipliedby the injury risk (Table 8) to give an estimate of annualinjuries/fatalities. Since the total driver fatalities based onNASS appears low, the estimates are adjusted by thecomputed number of driver fatalities in non-rollover,frontal crashes with an all air bag fleet based on 1995FARS as shown in the table. The fatalities for left offsetcrash modes are adjusted to be consistent with theproportion of all frontal impact fatalities for these modes,computed earlier. Likewise, the number of injuries areadjusted based on the NHTSA Final RegulatoryEvaluation (FRE) on Air Bag Depowering for MAIS 2injuries, which predicted 120,000 annually. The same

Stucki, 11
0%
2%
4%
6%
8%
10%
MAIS>=2 MAIS>=3 Fatal
Full Barrier Left Obl./Off.
Figure 21. Driver Injury/Fatality Risk for All Injury, 48 KPH
adjustment factor for MAIS 2 injuries is also applied toMAIS 3 injuries. As shown, based on the assumed sizegroups, i.e., based on the division of sizes by the mid-point of the difference in height between successivedummy sizes, the 50th percentile group is the mostpopulous and thus experiences the most injuries/fatalities. However, the 95th percentile group, although the leastpopulous, experiences substantially more fatalities andMAIS 3 injuries than the 5th percentile group and hasthe highest injury and fatality risks.
Based on the assumptions made and the limited dataon severe and fatal injuries, the 95th percentile groupexperiences a substantial number of injuries/fatalities andshould be considered as an additional test surrogate to beused in a proposed left offset test procedure. The 5thpercentile group, although experiencing less injuries, stillhas substantial numbers of moderate and severe to fatalinjuries in this impact mode. A different definition of5th, 50th and 95th percentile groupings, perhaps based onstatistical groupings or more narrow height ranges for the50th group would possibly lead to a different conclusion.
Benefits Assessment for an Improved Test Procedure
A preliminary method for estimating injury andfatality reductions for a left offset test procedure isproposed. This method assumes that for under 48 kph(the current FMVSS No. 208 test speed) theinjury/fatality rates for drivers with air bags in left offsetcrash modes will be reduced to levels similar to those fordrivers in full barrier modes. In other words, drivers withair bags in the proposed impact modes to be addressed bya left offset test would experience the same injury risk asdrivers with air bags in impact modes addressed by thecurrent requirement.
As shown in Figure 21 and Table 10 for speeds of 48kph and less the MAIS 2 injury and fatality rates arehigher for the left offset crash modes (8.6 and 0.2percent) compared to full barrier modes (5.2 and 0.0percent.) No fatalities occurred at 48 kph and less in fullbarrier type impacts. For MAIS 3 injuries the fullbarrier risk is actually higher than for the left offset forimpacts at 48 kph and less (2.3 and 2.2 percent,respectively.)
As shown in the previous sections, arm injuries in thefull barrier impact modes occur at a much higher rate thanin impacts without air bags or even left offset impactswith air bags. Arm fractures and other less severelaceration and contusion type injuries occur quitefrequently from aggressively deploying air bags. AnotherNHTSA research program is vigorously addressingproblems associated with aggressive
Estimated Annual Driver Injury/Fatalities in Left Offset Impacts With Air Bags
DRIVER SIZE GROUP
INJURYLEVEL Total
5th Percent 50th Percent 95th Percent
MAIS 2 45,924 11,796 19,819 14,309
MAIS 3 11,520 1,261 7,307 2,953
Fatalities 4,243 224 3,004 1,015
deployment of air bags on out-of-position occupants andarm injuries. This research program supported by thiscrash analysis is focused on improved frontal protection
and not on resolving problems with aggressive air bagdeployment. Since arm injuries are not the main concernof an alternative frontal test the analysis was repeated to

Stucki, 12
0%
2%
4%
6%
8%
MAIS>=2 MAIS>=3 Fatal
Full Barrier Left Obl./Off.
Figure 22. Injury/Fatality Risk Without Arm Injuries, 48 KPH
compare injury risk when arm injuries are removed (Figure 22, Table 10.) Relative to the injury risk in fullbarrier type impacts this method shows a much higherrisk for left offset impacts (1.66 percent for MAIS 3 and7.86 percent for MAIS 2) than for full barrier (0.69percent for MAIS 3 and 3.15 percent for MAIS 2.)
The percent decrease in injury risk for the left offsetimpacts compared to the full barrier impacts is shown inthe following table. Since the estimate of fatality risk inimpacts of 48 kph and less are based on few numbers anda total reduction in fatalities is unreasonable no
numerical estimate is made for fatality reduction, exceptto say there appears to be potential for substantialreductions. Also, for drivers with air bags subjected to aleft offset test procedure, an increase in MAIS 3 injuriesin impacts is not expected and, thus, no change ispredicted. The number of driver injuries and fatalitiesexpected in left offset impacts with an all air bag fleet isshown in Table 10 and repeated below. The reduction ininjuries/fatalities is then the percent change applied tothese expected injuries and fatalities.
An analysis was also conducted to estimate thenumber of leg injuries which might be eliminated by a left offset test. Again, it is assumed that the benefit ofadopting a left offset test procedure is an injury ratereduction for drivers with air bags below 48 kph to theinjury rate experienced in full barrier type crashes. Table11 shows the risk of receiving a leg injury of AIS 2 andof AIS 3 level for left offset and full barrier type impactmodes. Drivers with air bags in full barrier type impactsbelow 48 kph have a lower risk of leg injury than those inleft offset impacts by the percentages shown in the Table11 worksheet. It is assumed that the number of injuriesin NASS are below the annual nationwide count by thesame factor as that used previously to estimate occupants. This factor is then applied to the NASS injury counts andthe proportion of leg injuries computed to yield anestimate of leg injuries expected nationwide in one year. This annual estimate is then multiplied by the reduction ininjury rate to give a rough approximation of number ofleg injuries, AIS 2 and AIS 3, which might beeliminated with a left offset test procedure, as shownbelow. Based on this computation, over 11,400 AIS 2and over 2,200 AIS 3 leg injuries could be saved.
Injury/Fatality Risk Difference: Left Offset Compared to Full Barrier, Under 48 KPH
Percent Change Number in Left Offset Reductions for Offset Test Procedure All MAIS Arms Excluded All MAIS Arms Excluded All MAIS Arms Excluded
MAIS 2 - 40.0% -59.9% 40568 34611 16,227 20,732MAIS 3 0% (+7.3%) -58.7% 10889 8689 0 5,100Fatality Not Computed* 2664 2664 Not Computed*
AIS 2 AIS 3Annual Leg Injuries 24,169 4,834Reduction for Left Offset Test (Table 11) Percent 47.2% 45.8% Annual Leg Injuries 11,416 2,215* There were 13 fatalities (unweighted) to drivers in left offset impacts under 48 kmph with no fatalities in fullbarrier type impacts.
REFERENCES
Stucki, 13
1. Ragland, Carl L., “Offset Test Procedure Developmentand Comparison,” Sixteenth International TechnicalConference on Enhanced Safety of Vehicles, Windsor,Canada, June, 1998.
2. Hollowell, William T., and Hitchcock, Ralph J., "TheNational Highway Traffic Safety Administration Programto Improve Frontal Crash Protection," 26th InternationalSymposium on Automotive Technology and Automation,Aachen, Germany, September 1993.
3. Hollowell, William T., and Hitchcock, Ralph J., "Improved Frontal Impact Crash Test Data," FourteenthInternational Technical Conference on Enhanced Safetyof Vehicles, Munich, Germany.
4. Stucki, Sheldon L., Ragland, Carl, Hennessey,Barbara, and Hollowell, Tom, "NHTSA's ImprovedFrontal Protection Research Program," 1995 SAEInternational Congress and Exposition, SAE 950497,Detroit, Michigan, February 27-March 2, 1995.
5. Stucki, Sheldon L., Ragland, Carl, Hennessey,Barbara, and Hollowell, Tom, "NHTSA's ImprovedFrontal Protection Research Program," FifteenthInternational Technical Conference on Enhanced Safetyof Vehicles, Melbourne, Australia, May, 1996.
6. Park, Brian T., Morgan, Richard M., Hackney, JamesR., Lee, John, and Stucki, Sheldon L., “Frontal OffsetCrash Test Study using 50th Percentile Male and 5th
Percentile Female Dummies,” Sixteenth InternationalTechnical Conference on Enhanced Safety of Vehicles,Windsor, Canada, June, 1998.
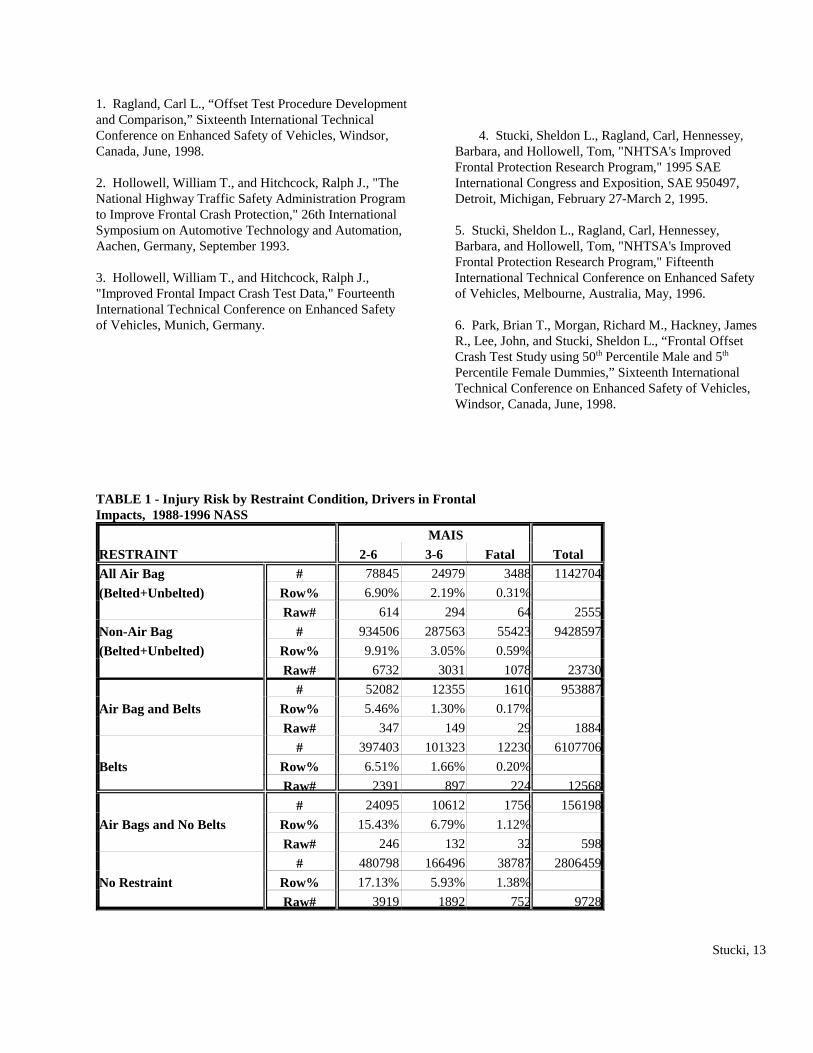
TABLE 1 - Injury Risk by Restraint Condition, Drivers in Frontal Impacts, 1988-1996 NASS
RESTRAINT MAIS
Total2-6 3-6 FatalAll Air Bag # 78845 24979 3488 1142704
(Belted+Unbelted) Row% 6.90% 2.19% 0.31%
Raw# 614 294 64 2555
Non-Air Bag # 934506 287563 55423 9428597
(Belted+Unbelted) Row% 9.91% 3.05% 0.59%
Raw# 6732 3031 1078 23730
# 52082 12355 1610 953887
Air Bag and Belts Row% 5.46% 1.30% 0.17%
Raw# 347 149 29 1884
# 397403 101323 12230 6107706
Belts Row% 6.51% 1.66% 0.20%
Raw# 2391 897 224 12568
# 24095 10612 1756 156198
Air Bags and No Belts Row% 15.43% 6.79% 1.12%
Raw# 246 132 32 598
# 480798 166496 38787 2806459
No Restraint Row% 17.13% 5.93% 1.38%
Raw# 3919 1892 752 9728

Stucki, 14
TABLE 2 - Injuries by Body Region for Drivers With and Without Air Bags
Serious and Greater Injuries by Body Region (Most Severe AIS>=3) OccupantsKnown AISArms Thorax Head Legs
Air Bag Raw 66 110 64 142 2555
Belts "As Used" # 7369 9314 5472 10058 1161513
Risk% 0.63% 0.80% 0.47% 0.87%
Non Air Bag Raw 385 1433 1034 1236 23730
Belts "As Used" # 43300 120297 87340 115450 9566033
Risk% 0.45% 1.26% 0.91% 1.21%
Air Bag Raw 51 42 23 71 1884
Belts # 5840 4070 1979 4236 970219
Risk% 0.60% 0.42% 0.20% 0.44%
Non Air Bag Raw 137 406 265 338 12568
Belts # 14647 48205 23219 31261 6220408
Risk% 0.24% 0.77% 0.37% 0.50%
Air Bag Raw 13 57 40 64 598
No Belts # 1474 3327 3438 5423 158090
Risk% 0.93% 2.10% 2.17% 3.43%
No Restraint Raw 226 888 701 791 9728
# 27812 59930 59948 75979 2825620
Risk% 0.98% 2.12% 2.12% 2.69%
Moderate and Greater Injuries by Body Region (Most Severe AIS>=2)
Air Bag Raw 172 183 199 321 2555
Belts "As Used" # 21781 18701 20077 38286 1161513
Risk% 1.88% 1.61% 1.73% 3.30%
Non Air Bag Raw 1246 2578 3612 2699 23730
Belts "As Used" # 177592 296200 448255 309813 9566033
Risk% 1.86% 3.10% 4.69% 3.24%
Air Bag Raw 117 89 84 188 1884
Belts # 16371 9033 11603 27537 970219
Risk% 1.69% 0.93% 1.20% 2.84%
Non Air Bag Raw 459 976 1046 939 12568
Belts # 77453 148062 138056 125161 6220408
Risk% 1.25% 2.38% 2.22% 2.01%
Air Bag Raw 49 81 111 120 598
No Belts # 4875 7685 8199 10168 158090
Risk% 3.08% 4.86% 5.19% 6.43%
No Restraint Raw 721 1395 2385 1557 9728
# 90587 124360 283675 161361 2825621
Risk% 3.21% 4.40% 10.04% 5.71%

Stucki, 15
TABLE 3 - Injury/Fatality Rates by Test Condition
Full BarrierLeft Obl./Left Off.
Right Obl./Right Off.
L&R Obl./R&L Off. Other TOTAL
MAIS>=2 # 15100 32841 20449 10445 10 78845
Raw# 127 270 169 47 1 614
Row% 19.2% 41.7% 25.9% 13.2% 0.01%
Risk 6.79% 7.61% 4.58% 10.25% 0.33% 6.54%
Annual# 18175 31710 19882 11095 16 80879
Adjusted Injuries to FRE 26967 47048 29499 16462 24 120000
MAIS>=3 # 8367 9104 5870 1628 10 24979
Raw# 71 130 75 17 1 294
Row% 33.5% 36.4% 23.5% 6.5% 0.04%
Risk 3.76% 2.11% 1.31% 1.60% 0.33% 2.07%
Annual# 10071 8791 5707 1729 16 26315
Adjusted Injuries to FRE 14942 13042 8468 2566 24 39043
Fatality # 548 1875 506 548 10 3487
Raw# 10 38 10 5 1 64
Row% 15.7% 53.8% 14.5% 15.7% 0.29%
Risk 0.25% 0.43% 0.11% 0.54% 0.33% 0.29%
Annual# 660 1810 492 582 16 3561
Adjusted to FARS Annual 1546 4243 1153 1364 39 8345
Drivers with Air Bags
# 222419 431302 446804 101858 2993 1205376
Raw# 457 1067 895 265 5 2689
Exposed Annual Drivers
# 267716 416450 434416 108198 4921 1231701
Row% 21.7% 33.8% 35.3% 8.8% 0.40%

Stucki, 16
TABLE 4 - Injury Risk by Overlap Proportion for Left and Right Offset Impacts
Left OffsetTotal0-1/3 >1/3-2/3 >2/3
MAIS>=2 # 8017 6553 18273 32843
Raw# 68 76 126 270
Row% 24.4% 20.0% 55.6%
Risk 5.01% 5.34% 14.23% 7.99%
Annual# 11484 9387 26176 47048
MAIS>=3 # 2335 2136 4634 9105
Raw# 37 39 54 130
Row% 25.6% 23.5% 50.9%
Risk 1.46% 1.74% 3.61% 2.21%
Annual# 3345 3060 6638 13042
Total # 160134 122614 128445 411193
Raw# 315 279 418 1012
Row% 38.9% 29.8% 31.2%
Right OffsetMAIS>=2 # 5353 6650 8445 20448
Raw# 48 42 79 169
Row% 26.2% 32.5% 41.3%
Risk 3.66% 4.96% 5.91% 4.83%
Annual# 7722 9594 12183 29499
MAIS>=3 # 2152 1137 2580 5869
Raw# 20 15 40 75
Row% 36.7% 19.4% 44.0%
Risk 1.47% 0.85% 1.80% 1.39%
Annual# 3105 1641 3723 8468
Total # 146108 133960 142960 423028
Raw# 282 214 352 848
Row% 34.5% 31.7% 33.8%
Stucki, 17
TABLE 5 - Injury by Body Region for Left Offset and All Frontal
Body RegionLeft Offset TOTAL
AIS>=3 AIS>=2 AIS>=3 AIS>=2# 2126 6669 6656 20929
Arm Raw# 32 75 66 173
Risk% 0.5% 1.6% 0.6% 1.8%
# 3220 8343 9329 18555
Thorax Raw# 51 84 111 184
Risk% 0.8% 2.0% 0.8% 1.6%
# 2077 7939 5472 20740
Head/Face Raw# 27 84 64 201
Risk% 0.5% 1.9% 0.5% 1.8%
# 4227 18423 9761 37269
Legs Raw# 69 155 142 321
Risk% 1.0% 4.5% 0.9% 3.3%
TotalInjuries # 11650 41374 31218 97493
Raw# 179 398 383 879
# 411192 411192 1142603 1142603
Total Drivers Raw# 1012 1012 2554 2554
TABLE 6 - Leg Injuries for Left Offset and All Frontal
Left OffsetKnee Tibia Pelvis Ankle Thigh Whole Total Drivers
AIS>=3 Raw# 1 27 6 2 42 2 80 1012
# 0 2153 247 268 2051 105 4824 411192
Row% 0.0% 44.6% 5.1% 5.6% 42.5% 2.2%
AIS>=2 Raw# 34 46 25 76 44 7 232 1012
# 7073 7189 1745 9220 2638 316 28181 411192
Row% 25.1% 25.5% 6.2% 32.7% 9.4% 1.1%
All FrontalsKnee Tibia Pelvis Ankle Thigh Whole Total Drivers
AIS>=3 Raw# 2 53 18 5 80 2 160 2554
# 26 4579 765 323 4706 105 10504 1142603
Row% 0.2% 43.6% 7.3% 3.1% 44.8% 1.0%
AIS>=2 Raw# 66 90 54 157 82 9 458 2554
# 11650 11106 3536 19034 5293 745 51364 1142603
Row% 22.7% 21.6% 6.9% 37.1% 10.3% 1.5%

Stucki, 18
TABLE 7 - Driver Exposure by Size Groups
TestCondition
Driver SizeTotal5th% 50th% 95th%
Raw# 194 512 169 875
Left Obl/Off # 86118 208241 66045 360404
Row% 23.9% 57.8% 18.3%
Raw# 502 1231 426 2159
All Frontals # 238928 571491 176787 987206
Row% 24.2% 57.9% 17.9%
TABLE 8 - Driver Injury by Size Group
TestCondition MAIS
Driver SizeTotal5th% 50th% 95th%
Raw# 48 135 47 230
# 7111 11948 8626 27685
2-6 Row% 25.7% 43.2% 31.2%
Risk% 8.26% 5.74% 13.06% 7.68%
Raw# 21 65 21 107
Left Obl/Off # 760 4405 1780 6945
3-6 Row% 10.9% 63.4% 25.6%
Risk% 0.88% 2.12% 2.70% 1.93%
Raw# 2 27 7 36
# 96 1287 435 1818
Fatal Row% 5.3% 70.8% 23.9%
Risk% 0.11% 0.62% 0.66% 0.50%
Raw# 116 290 96 502
# 16821 37941 12236 66998
2-6 Row% 25.1% 56.6% 18.3%
Risk% 7.04% 6.64% 6.92% 6.79%
Raw# 49 145 48 242
All Frontals # 4176 11416 3948 19540
3-6 Row% 21.4% 58.4% 20.2%
Risk% 1.75% 2.00% 2.23% 1.98%
Raw# 7 40 12 59
# 557 1567 1008 3132
Fatal Row% 17.8% 50.0% 32.2%
Risk% 0.23% 0.27% 0.57% 0.32%
TABLE 9 - Worksheet for Estimating Annual Injuries/Fatalities

Stucki, 19
ANNUAL EXPOSURETotal 5th% 50th% 95th%
Left Offset 416450 99510 240624 76316 88-95 NASSAll Frontal 1231701 298102 713029 220571 /8 YearsANNUAL INJURIES/FATALITIES
Left OffsetMAIS>=2 31990 8217 13806 9967
MAIS>=3 8025 878 5090 2057
Fatalities 2101 111 1487 503
All FrontalMAIS>=2 83591 20987 47338 15266
MAIS>=3 24379 5210 14243 4926
Fatalities 3908 695 1955 1258
FARS 1995 Fatalities 8345 1995 Driver Fatalities in Light Vehicles
FRE on DePoweringMAIS>=2 Injuries 120000
1995 FARS driver fatalities 31786
- Non-rollover 23995
- Rollover 7791
Adjustment Factors Total non-air bag fatalities 31952
All Frontal Fatals 2.14 - Non-rollover 24120
MAIS>-2 1.44 - Rollover 7832
MAIS>-3 1.44 Total air bag effectiveness 11%
Left Obl./Off. Fatals* 2.02 - Non-rollover 14.6%* Adjusted to agree with Table 3 - Rollover 0
estimate of fatalities in left Total fatalities with air bags 28437
offset crashes - Non-rollover 20606
- Rollover 7832
% Non-rollover fatalities in frontals 54%
1995 fatalities in frontals 11127
Frontal air bag effectiveness 25%
Frontal fatalities with air bags 8345
ANNUAL INJURIES/FATALITIES (Adjusted)Left Offset
Total 5th% 50th% 95th%
MAIS>=2 45924 11796 19819 14309MAIS>=3 11520 1261 7307 2953Fatalities 4243 224 3004 1015
All FrontalMAIS>=2 120000 30128 67956 21916MAIS>=3 34998 7480 20447 7071Fatalities 8345 1484 4175 2686

Stucki, 20
TABLE 10 - Comparison of Injury/Fatality Risk, Left Offset vs. Full Barrier
MAIS Without Arm Injury MAIS All Body Regions
TEST
DeltaV KnownTotal Total
DeltaV KnownTotal Total<=30 >30 Unk. <=30 >30 Unk.
Raw# 0 6 4 6 10 0 6 4 6 10
Fatal # 0 410 138 410 548 0 410 138 410 548
Risk% 0.00% 20.60% 0.17% 0.33% 0.26% 0.00% 20.60% 0.17% 0.33% 0.26%
Raw# 15 23 24 38 62 20 24 27 44 71
Full Barrier MAIS>=3 # 838 969 4264 1807 6071 2840 1052 4475 3892 8367
Risk% 0.69% 48.69% 5.13% 1.46% 2.93% 2.32% 52.86% 5.38% 3.14% 4.04%
Raw# 37 31 42 68 110 46 33 48 79 127
MAIS>=2 # 3852 1455 6250 5307 11557 6290 1979 6831 8269 15100
Risk% 3.15% 73.12% 7.51% 4.27% 5.57% 5.15% 99.45% 8.21% 6.66% 7.28%
Raw# 223 34 180 257 437 223 34 180 257 437
Total # 122152 1990 83186 124142 207328 122152 1990 83186 124142 207328
Row% 98.40% 1.60% 40.12% 59.88% 98.40% 1.60% 40.12% 59.88%
Raw# 13 8 17 21 38 13 8 17 21 38
# 447 265 1164 712 1876 447 265 1164 712 1876
Fatal Annual# 2664 1579 4243 2664 1579 4243
Risk% 0.20% 7.93% 0.65% 0.31% 0.46% 0.20% 7.93% 0.65% 0.31% 0.46%
Raw# 55 18 38 73 111 66 20 44 86 130
Left Offset MAIS>=3 # 3779 902 2831 4681 7512 4930 975 3198 5905 9103
Annual# 8689 2074 10763 10889 2153 13042
Risk% 1.66% 27.01% 1.57% 2.03% 1.83% 2.17% 29.19% 1.77% 2.56% 2.21%
Raw# 134 31 69 165 234 154 32 84 186 270
MAIS>=2 # 17878 3091 7368 20969 28337 19526 3119 10196 22645 32841
Annual# 34611 5984 40596 40568 6480 47048
Risk% 7.86% 92.54% 4.09% 9.08% 6.89% 8.58% 93.38% 5.66% 9.81% 7.99%
Raw# 611 37 364 648 1012 611 37 364 648 1012
Total # 227573 3340 180280 230913 411193 227573 3340 180280 230913 411193

Stucki, 21
Row% 98.55% 1.45% 43.84% 56.16% 98.55% 1.45%
TABLE 11 - Leg Injuries in Full Barrier and Left Offset Crashes
TESTMAISLevel
DeltaV KnownTotal Total<=30 >30 Unk.
Raw# 10 15 14 25 39
MAIS>=3 # 577 758 1082 1335 2417
Risk% 0.47% 38.09% 1.30% 1.08% 1.17%
Raw# 30 24 23 54 77
Full Barrier MAIS>=2 # 3427 1138 3214 4565 7779
Risk% 2.81% 57.19% 3.86% 3.68% 3.75%
Raw# 223 34 180 257 437
Total # 122152 1990 83186 124142 207328
Row% 98.40% 1.60% 40.12% 59.88%
Raw# 36 11 22 47 69
# 1984 478 1765 2462 4227
MAIS>=3 Row% 79.82% 20.18% 31.43% 68.57%
Annual# 4834 1222 6056Risk% 0.87% 14.31% 0.98% 1.07% 1.03%
Raw# 89 21 45 110 155
# 12100 2590 3733 14690 18423
Left Offset MAIS>=2 Row% 91.57% 8.43% 28.99% 71.01%
Annual# 24169 2224 26393Risk% 5.32% 77.54% 2.07% 6.36% 4.48%
Raw# 611 37 364 648 1012
Total # 227573 3340 180280 230913 411193
Row% 98.55% 1.45% 43.84% 56.16%
Percent of drivers with AIS>=2 leg injury of all drivers with MAIS>=2 injury 56.1%Percent of drivers with AIS>=3 leg injury of all drivers with MAIS>=3 injury 46.4%Annual drivers with AIS>=2 leg injuries = 56.1%*(all drivers with MAIS>=2) 26393Annual drivers with AIS>=3 leg injuries = 46.4%*(all drivers with MAIS>=3) 6056
Driver Leg Injuries in Left Offset Impacts MAIS or AIS>=2 MAIS or AIS>=3
<=30 >30 <=30 >30Annual Leg Injuries 24169 2224 4834 1222
Reduction Over Full Barrier (Table 10) Percent 47.2% 45.8%
Annual Leg Injuries 11416 2215