The left inferior frontal gyrus under focus: an fMRI study of the
Journal of Abnormal Psychology Copyright 1991 by the American Psychological Anso~iation. Inc. 1991, %,hi. 100. No. 4, 535-545 0021-843X/91/$3,00
Left Frontal Hypoactivation in Depression
Jeffrey B. Henriques and Richard J. Davidson University of Wisconsin--Madison
Baseline resting electroencephalogram activity was recorded with 3 different reference montages from 15 clinically depressed and 13 control subjects. Power in all frequency bands was extracted by fast Fourier transformation. There was a significant Group • Hemisphere interaction in the mid- frontal region, for the alpha band power only. Depressed subjects had less left-sided activation (i.e., more alpha activity) than did normal control subjects. This pattern of diminished left-sided frontal activation is interpreted as indicating a deficit in approach mechanisms in depressed subjects.
Many reports that indicate that depression is associated with a disruption of the normal pattern of cerebral laterality have recently appeared. This evidence comes from a number of dif- ferent areas (for reviews, see Davidson, 1984,1987; Silberman & Weingartner, 1986; Tucker, 198 l). Investigations of mood dis- turbances in epileptics have found that left-sided epileptogenic lesions were associated with significantly higher levels of de- pression and anxiety than right-sided lesions (e.g., Perini & Mendius, 1984). Gainotti (1972) investigated stroke-induced le- sions and reported that left-hemisphere lesions were associated with tears and anxiety whereas subjects with right-hemisphere lesions exhibited indifference and joking. Sackeim et al's (1982) review of cases of pathological laughing and pathological cry- ing showed that left-hemisphere lesions were more prevalent in cases of pathological crying whereas pathological laughing was more often associated with right-hemisphere lesions. Other re- searchers have administered the Minnesota Multiphasic Person- ality Inventory to subjects with unilateral brain lesions and found that subjects with left-hemisphere lesions had significant elevations on the depression subscale whereas subjects who had lesions in the right hemisphere did not (e.g., Black, 1975; Gas- parrini, Satz, Heilman, & Coolidge, 1978).
Robinson and his colleagues (Robinson, Kubos, Starr, Rap, & Price, 1984; Robinson & Price, 1982) have used computerized tomography to clarify the relation between lesion location and poststroke mood changes. They found that the severity of post- stroke depression was positively correlated with the lesion's proximity to the left frontal pole and negatively correlated with proximity to the right frontal pole (Robinson et al., 1984). Sin- yor et al. (1986) also found this positive relation between the
This research was supported by National Institute of Mental Health Grant MH-40747, Research Scientist Development Award MH- 00875, and a grant from the University of Wisconsin Graduate School to Richard J. Davidson.
We wish to thank Andrea Straus, Linda Kinney, Joseph Senulis, Clifford Saron, and Ken Kobak for their help in various phases of this research.
Correspondence concerning this article should be addressed to Jef- frey B. Henriques or Richard L Davidson, Department of Psychology, University of Wisconsin-Madison, 1202 West Johnson Street, Mad- ison, Wisconsin 53706.
535
severity of poststroke depression and proximity to the frontal pole in the left hemisphere, but they found a curvilinear rela- tion in the right hemisphere, such that both anterior and poste- rior lesions were associated with increased depression. If one assumes that stroke-produced lesions lead to decreased activa- tion in the brain regions in which they are found (Burke et aL 1982; Takeuchi et al., 1986), these findings suggest that depres- sion is associated with a decrease in left frontal, right posterior, and possibly right frontal activation. The issue of whether these different patterns tend to co-occur or whether they represent different subtypes of depression is unresolved.
On the basis of previous studies of both normal and de- pressed subjects, we propose that the left and right anterior zones of the cortex are differentially activated during approach- and withdrawal-related behavior, respectively (see Davidson & Tomarken, 1989, for a review), This leads to an interpretation of decreased left frontal activation as the proximal cause of defi- cits in approach-related behavior. At least some of the symp- toms of depression are similar to the cognitive impairments o f patients with left anterior lesions (Luria, 1973). For example, loss of initiative, impaired concentration, indecision, and short- ened future perspective are all symptoms common to patients with left anterior lesions and certain subtypes o f depression. In a detailed study of the specific symptomatology of endogenous depression, deJonghe, Ameling, and Assies (1988) reported that these symptoms were present to a moderate or strong degree in at least 83% of the 46 patients studied.
It is important to note that not all studies o f patients with unilateral brain lesionsshow increased depressive symptomatol- ogy with left anterior lesions (see Gainotti, 1989). The fact that some patients who show clear evidence of a left anterior lesion in the absence o f depressive symptomatology have been identi- fied indicates that decreased activation in this region is clearly not sufficient for the production o f depressive symptomatology We propose that left frontal hypoactivation, either naturally oc- curring or lesion-induced, represents a diathesis that increases a person's vulnerability to depression. Only when the requisite environmental stress occurs, however, is the vulnerability ex- pressed. This view, therefore, recognizes the existence o f per- sons with a depressogenic pattern of frontal activation who do not show any of the symptoms of depression. However, at least a
536 JEFFREY B. HENR1QUES AND RICHARD J. DAVIDSON
subset of persons who are already depressed ought to possess the diathesis and therefore may show decreased left frontal acti- vation in comparisor, with controls.
Many studies to assess regional brain activation differences between depressed persons and normal control subjects have been performed. These studies have used a number of different methods to assess regional brain activation, including cerebral blood flow, glucose metabolism, and quantitative electroen- cephalography (EEG; see Henriques & Davidson, 1989, for re- view). Studies investigating cerebral asymmetries through ei- ther regional cerebral blood flow or cerebral glucose metabo- lism have produced inconsistent results. Guenther et aL (1986) examined changes in regional cerebral blood flow during a mo- tor task that involved the right hand and found that more se- verely depressed subjects exhibited a lack of activation in the comralateral motor area, which suggests a left-hemisphere dys- function. Kuhl, Metter, and Riege (1985) found that the pattern of glucose metabolism in unipolar subjects at rest differed from control subjects in only one region: Depressed subjects had de- creased metabolism in the left posterior-inferior frontal cortex. Baxter and his associates have also observed decreased left ante- rior activation in depressives in relation to that in control sub- jects (Baxter et al, 1985; Baxter et at., 1989). This finding has recently been confirmed by' Martinet et al. (1990), but other investigators have not found this pattern of diminished left ante- rior activation (e.g, Gur et al., 1984; Uytdenhoefet aL 1983 ). It is not clear why these investigators found divergent results. Gur et al. used absolute regional values in computing their compari- sons, whereas Baxter et al. (1989) computed the metabolic rate in each region relative to the entire ipsilateral hemisphere. How- ever, Uytdenhoef et al. used relative values and found that their depressed subjects had greater left anterior blood flow than did the control subjects. Unfortunately, there were a number of problems with Uytdenhoef el al's study. The handedness of the patients and control subjects was not specified. The groups dif- fered considerably in age, with the control subjects more than t 0 years younger than the depressives, Uytdenhoefet al, reported a positive .35 correlation between relative left frontal blood flow and age within the control group. It is therefore unclear whether the group difference in left frontal blood flow is a function of the age difference between groups or is a genuine group differ- ence. Without statistically partialing out the effects of age, the results from this study are inconclusive.
Investigations that have used quantitative EEG to examine asymmetries in activation also suggest left hemisphere involve- merit in depression. Some of the earliest work was done by d'Elia and Perris (1973, 1974), who examined the mean inte- grated amplitude and the within-patient variability of the inte- grated amplitude in depressed subjects. They tbund that the within-patient variability in the dominant left hemisphere was significantly lower in depression, and this variability in the left hemisphere increased at recovery. They interpreted this finding to suggest greater left hemisphere involvement in depression (d'Elia & Perris, 1973,1974; Perris, 1975). Greater relative right hemisphere variability has also been found in neurotic depres- sives (Rochford, Swartzburg, Chowdhrey, & Goldstein, 1976). Unfortunately, the functional significance of variability in brain electrical activity is not known, so that interpretation of these findings is problematic. Matousek, Capone, and Okawa
(198 l) found that endogenously depressed subjects bad more relative left-sided alpha activity in the frontal region than did control subjects, though this difference was not significant. Work in our laboratory has found that depressed subjects dif- fered from nondepressed subjects in measures of alpha power asymmetry in the anterior and posterior scalp regions (David- son, Chapman, & Chapman, 1987; Davidson, Schaffer, & Saron, 1985; Sehaffer, Davidson, & Saron, t 983). The most con- sistent finding we have obtained across studies is that depressed subjects differed from controls in the asymmetry of frontal acti- vation. Compared with control subjects, depressives show more left frontal alpha power. In some studies, depressives have shown relatively more fight-sided parietal alpha power in com- parison with control subjects (e.g,, Davidson et al., 1987). Note that decreases in alpha-band power reflect increases in cortical activation (see Davidson, 1988; Lindsley & Wicke, 1974), Thus, our electrophysiological data indicate that the most consistent difference between depressed and nondepressed subjects is that the former group shows less leR-sided frontal aeti~ttion in com- parison with the latter group. A recent study found that this pattern of decreased left anterior activation also distinguished remitted depressives from never-depressed control subjects (Henriques & Davidson, t990). Remitted depressives also showed decreased right-sided posterior activation in compari- son with controls. In that study, in addition to assessing power in the alpha band, we examined power in the other EEG fre- quency bands and found that the group differences were spe- cific to the alpha band.
In previous studies with acutely depressed sffDjecls (David- son et at., 1987; Davidson et al, t985; Schaffer et al., 1983), the subjects consisted of subclinically depressed college mudents, selected on the basis of extreme scores on the Beck Depression Inventory (BDI; Beck, Ward, Mendelson, & Erbaugh, 1961). In addition to the usual criterion of high BDI scores that are main- tained over at least a 1-month interval, subjects were required to report vegetative symptomatology on the final six items of the BDI (see Schaffer et air 1983, for details). In this study we tested a group of subjects who met Research Diagnostic Criteria (Spitzer, Endicott, & Robins, 1978) for major unipolar depres- sion, all but one of whom also met criteria for definite or proba- ble endogenous depression. We compared these subjects with a group of control subjects who had no history of depression or any other psychopathology in themselves or their first-degree relatives. We focused primarily on endogenous depressives be- cause we hypothesized that this subtype would be most likely to show deficits in approach-related behavior (e.g., show pervasive loss of pleasure and imerest in objects and people) and therefore would show left frontal hypoactivation. We recorded EEG from the left and right hemisphere in several anterior and posterior scalp regions. Although there has been discussion in the electro- physiology literature about the appropriateness of different ref- erencing strategies (Lehman, 1987; Nunez, 19gl), there is currently no consensus in the literature about which approach is optimal. We adopted the strategy of recording the EEG with more than one reference montage and demonstrating consis- tency across different referencing procedures. Such across- reference consistency would support our suggestion of the lo- calization of the significant effects to the frontal region because it would indicate that the group differences were not a function
BRAIN ASYMMETRIES IN DEPRESSION 537
o f the par t icu lar reference used. Therefore, E E G da ta were re- corded so tha t three different reference montages , (a) vertex, (b) computer-averaged ear lobes, and (c) average reference were available for analysis, (see Henr iques & Davidson, 1990, for a more comple te discussion). In addi t ion to c o m p u t i n g measures o f power in the t radi t ional EEG bands , we c o m p u t e d power in a h igh frequency (70-80 Hz) b a n d (which presumably is purely myogenic in origin) to ob ta in es t imates of muscle c o n t a m i n a - t ion. Power in this b a n d was then used as a covariate in our analyses o f EEG b a n d power.
We predic ted tha t the pa t t e rn of E E G a s y m m e t r y across the scalp would d is t inguish be tween depressed and control subjects and tha t this would be cons is tent across reference montage. O n the basis of earlier work (Davidson et al., 1987; Henr iques & Davidson, 1990; Schaffer et al., 1983), we predic ted tha t de- pressed subjects, in compar i son with control subjects, would have less left frontal activation. Al though there is less in forma- t ion abou t parietal activation, we also predicted that depressed subjects would show less r ight par ie ta l act ivat ion in c o m p a r i s o n with control subjects.
M e t h o d
Subjects
Depressed subjects were recruited in connection with ongoing drug studies at the Center for Affective Disorders at the University of Wis- consin Hospital. Control subjects were recruited through advertise- ments in local newspapers. All subjects were screened with the Sched- ule for Affective Disorders and Schizophrenia (Endicott & Spitzer, 1978). Interviews were conducted by one of two laboratory members, both of whom had completed 40 hours of training on the Schedule for Affective Disorders and Schizophrenia. Depressed subjects were re- quired to meet Research Diagnostic Criteria (Spitzer et al., 1978) diag- nosis of unipolar major depressive disorder. In addition, subjects were required to have an absence of mania in their first-degree relatives. Of 54 possible depressed subjects interviewed, 16 (7 men and 9 women) met all criteria and were invited to participate in the study. Fifteen of the depressed subjects met criteria for endogenous depression (11 defi- nite and 4 probable). Eight of the depressives met criteria for recurrent depression, and 3 were diagnosed as having chronic depression. The length of the current episode, at the time of testing, ranged from 10 to 364 weeks in duration. Five of the depressed subjects had begun treat- ment with either imipramine or fluvoxamine at the time that EEG was recorded.
The control subjects were required to have an absence of any psychi- atric history for both themselves and their first-degree relatives. There were 65 possible control subjects interviewed, 15 (6 men and 9 women) of whom met criteria. The rejection rate for control and depressed subjects did not differ significantly. All subjects were right-handed as assessed by the Chapman Handedness Inventory (Chapman & Chap- man, 1987))
Because of insufficient artifact-free data, the EEG measures from 1 depressed and 2 control subjects were dropped. This resulted in a final group of 15 depressed and 13 control subjects. The two groups did not differ in age (depressed subjects, M = 40.40, range, 33-57, and control subjects, M = 40.61, range 31-56), t(26) = -0.08, p > .05, or sex (p > .05, two-tailed, Fisher's exact test). The groups did differ in the amount of reported depression as assessed by the BDI, t(17) = 10.57, p < .0001, and the Hamilton Depression Rating Scale (Hamilton, 1960), t(l 5) = 13.68, p < .0001.2 The two groups also differed in socioeconomic status as assessed by Hollingshead's (1957) index, t(26) = 4.18, p < .001. De-
Table 1 Subject Characteristics by Group
Depressed Control
Measure M SD M SD
Age (in years) 40.40 6.89 40.61 7.29 Socioeconomic status 3.93 0.88 2.61 0.77 Hamilton Depression
Rating Scale 23.33 6.23 0.92 1.12 Beck Depression
Inventory 26.80 8.68 1.83 2.59
Note. Depressed women, n = 8; control women, n = 9; depressed men, n = 7; and control men, n = 4. Socioeconomic status is rated 1-7, wherein lower numbers reflect higher social class.
pressed subjects came from lower social classes than did the control subjects. Relevant subject variables are listed in Table 1.
Procedure
Before the EEG recording, the subject was informed about the na- ture of the experiment and was asked to sign a consent form. The subject was then administered the Hamilton Depression Rating Scale and completed the BDI. On completion of the depression inventories, the subject was escorted to the experimental testing room where all further procedures took place.
The test session consisted of two 30-s baseline resting periods, and these baselines were followed by a series o femotion-eliciting film clips. This report will present only the data from the baseline periods. Base- line EEG was recorded during both an eyes-open and an eyes-dosed rest period, the order of which was counterbalanced across subjects. The subjects were asked at the end of each baseline trial to rate their emotional state during the trial. This was done by rating emotional experience on seven emotion scales: interest, amusement, happiness, fear, sadness, disgust, and anger. Subjects used a 0-8 scale, wherein 0 indicated that the emotion was not experienced during the trial and 8 indicated that it was felt very strongly during the trial.
All subject instructions were presented on a video monitor con- trolled by computer. The subjects used a numeric keypad to advance through the instructions and to input their emotion ratings at the end of each trial. The subjects were instructed to use either their right or their left hand to enter their responses, and response hand was random- ized across subjects.
Electroencephalography Recording
EEG was measured with a modified lycra electrode cap (Electro-cap International, Dallas, TX). The electrode cap was positioned on the subject's head at known anatomical landmarks. Elastic straps from the cap attached to a strap that traversed the subject's torso, and this en- abled the subject to move comfortably without altering the placement. This procedure results in accurate electrode placements (Blom & An- neveldt, 1982). EEG was recorded from 14 scalp locations: F3, F4, F7, F8, T3, T4, T5, T6, P3, P4, C3, C4, Pz, and Fz 00-20 system). All
Six of the control subjects (2 men, 4 women) in this study were previously reported on in Henriques and Davidson (1990).
2 The reduced degrees of freedom for the tests of group differences on the Beck Depression Inventory and the Hamilton Depression Rat- ing Scale are a function of the correction for unequal variances.

538 JEFFREY B. HENRIQUES A N D RICHARD J. DAVIDSON
placements were referenced to Cz. Two additional channels, Cz-A1 and Cz-A2, were recorded in order to derive an averaged ears reference (see Davidson, 1988). Electrode impedances were all under 5,000 fl, and the impedances for homologous sites were within 500 fl of each other. Electrooculogram (EOG) was recorded from the external canthus to the supraorbit of one eye, in order to facilitate artifact scoring. (EOG was only recorded on paper for the purpose of artifact scoring. We were thus unable to digitize EOG activity.) EEG and EOG were amplified with a 20-channel Grass (Quincy, MA) Model 12 Neurodata System that had a bandpass of 1-300 Hz and a 60-Hz notch filter. All analog signals were passed through active low-pass filters (Rockland Systems, West Nyack, NY, Model 424) with a cutoffof 85 Hz and a 24 dB per octave roll-off (see Dumermuth & Molinari, 1987). The EEG was digi- tized at the rate of 250 samples/s. The EEG activity for eight channels and the EOG activity were displayed on a Grass Model 7 nine-channel polygraph. This paper record was then used to identify those portions of data to be edited out because of eye blinks, gross muscle artifact, and movement artifact. A fast Fourier transform was applied to all chunks of artifact-free data that were 2.05 s in duration, with chunks overlap- ping by 75% The two groups did not differ in the number of artifact- free chunks, t(24) = 0.45, p > .05. The mean number of chunks for the depressed group was 74.42 (SD = 27.69), and the mean for the control group was 69.36 (SD = 29.17). The fast Fourier transform output was then converted to power density (/.tV2/Hz) in each of five bands: delta, 1-4 Hz; theta, 4-8 Hz; alpha, 8-13 Hz; beta l, 13-20 Hz; and electro- myogram (EMG), 70-80 Hz. This conversion was done by summing activity across all bins within a band and dividing by the number of 1-Hz bins. Power in the 70- to 80-Hz band was examined in an attempt to quantitatively evaluate the presence and amount of muscle artifact. Activity in this frequency range is presumed to be exclusively myogenic in origin and thus can be used to estimate the contribution of muscle artifact in each lead independent of EEG activity. In addition to the original recording montage (referencing to vertex), the EEG was re- computed off-line for two additional references, computer-averaged ears and an average reference. For the ears reference, the separate Cz- A1 and Cz-A2 channels were averaged and then added to the original vertex-referenced data. 3 For the average reference the voltage at each electrode was expressed as a difference from the average voltage of all electrodes on the scalp. All power density values were log-transformed to normalize their distribution.
Resu l t s
We present the emot ion self-report data first and then the EEG data. All analyses were computed as repeated measures multivariate analyses o f variance (MANOVAs). Because o f equipment malfunctions, 3 depressed subjects were missing data from one channel (T4); these subjects were not included in any MANOVA that examined activity at all sites, but they were included in all o f the regional MANOVAs that were computed. The inclusion o f these 3 subjects did not change the significance of any of the computed regional analyses.
Baseline Emotion Data
The subjects' self-report o f experienced emot ion was exam- ined by computing separate two-way MANOVAs, with group and emotion as variables. There was a significant effect for group, F(I, 26) = 5.13, p < .04. This was because the depressed subjects reported more emot ion than the controls during the baseline trials (Table 2). There was also a main effect for emo- tion, F(6, 21) = 5.46, p < .002. This was because subjects re- ported more interest, amusement , and happiness than sadness,
Table 2 Self-Reported Emotion Averaged Across Eyes-Open and Eyes-Closed Resting Baselines by Group
Depressed Control
Emotion M SD M SD
Interest 2.26 1.72 1.54 1.75 Amusement 1.13 1.14 0.69 1.09 Happiness 1.60 1.80 1.50 1.53 Sadness 1.03 0.93 0.00 0.00 Fear 0.83 1.13 0.15 0.43 Disgust 0.73 1.24 0.08 0.28 Anger 0.47 0.74 0.00 0.00
Note. Each emotion was rated on a 0-8 scale.
fear, disgust, or anger. There was no significant interaction be- tween group and emotion, F(6, 21) = 0.91.
Baseline Electroencephalography Data
Prior research in our laboratory with a large sample size has demonstrated that subjects do not differ in anterior asymmetry during eyes-open as compared with eyes-closed baseline pe- riods. Moreover, a weighted average o f eyes-open and eyes- closed data produces more stable estimates o f EEG asymmetry (Tomarken, Davidson, Wheeler, & Kinney, in press) than either baseline type alone. In previous research to compare clinical samples with normal subjects, we failed to find Group × Base- line Type (i.e., eyes open or closed) interactions (Henriques & Davidson, 1990). In order to justify our use o f a composite variable o f the mean of the eyes-open and eyes-closed trials in this study, four-way MANOVAs were computed with group (de- pressed vs. control) as the between-groups variable and with hemisphere (left vs. right), region (midfrontal [F3 and F4] vs. lateral frontal [F7 and F8] vs. anterior temporal [T3 and T4] vs. posterior temporal [T5 and T6] vs. central [C3 and C4] vs. parietal [P3 and P4 ]), and condit ion (eyes open vs. eyes closed) as within-groups variables. These analyses revealed that there were no interactions with baseline condition. The data from the eyes-open and eyes-closed baselines were then averaged to- gether by using the number o f artifact-free chunks within each baseline as a weighting factor, and this composite variable was then used in all subsequent analyses.
Because earlier research in our laboratory has examined group differences in alpha power (e.g., Davidson et al., 1987; Davidson et al., 1985), we had specific hypotheses about activity in this frequency band. We predicted that depressed and con- trol subjects would differ in asymmetry in both the midfrontal (F3 and F4) and parietal regions (P3 and P4). These analyses are presented first.
3 We recorded the Cz channel referenced separately to each ear, rather than reference each ear to Cz, and thus the average of the Cz-A1 and Cz-A2 channels was added to the original data to derive the com- puter averaged ears reference. Thus ifa = (F3 - Cz) and b = (Cz - A1), then a + b = (F3 - A1).
BRAIN ASYMMETRIES IN DEPRESSION 539
Midfrontal Region
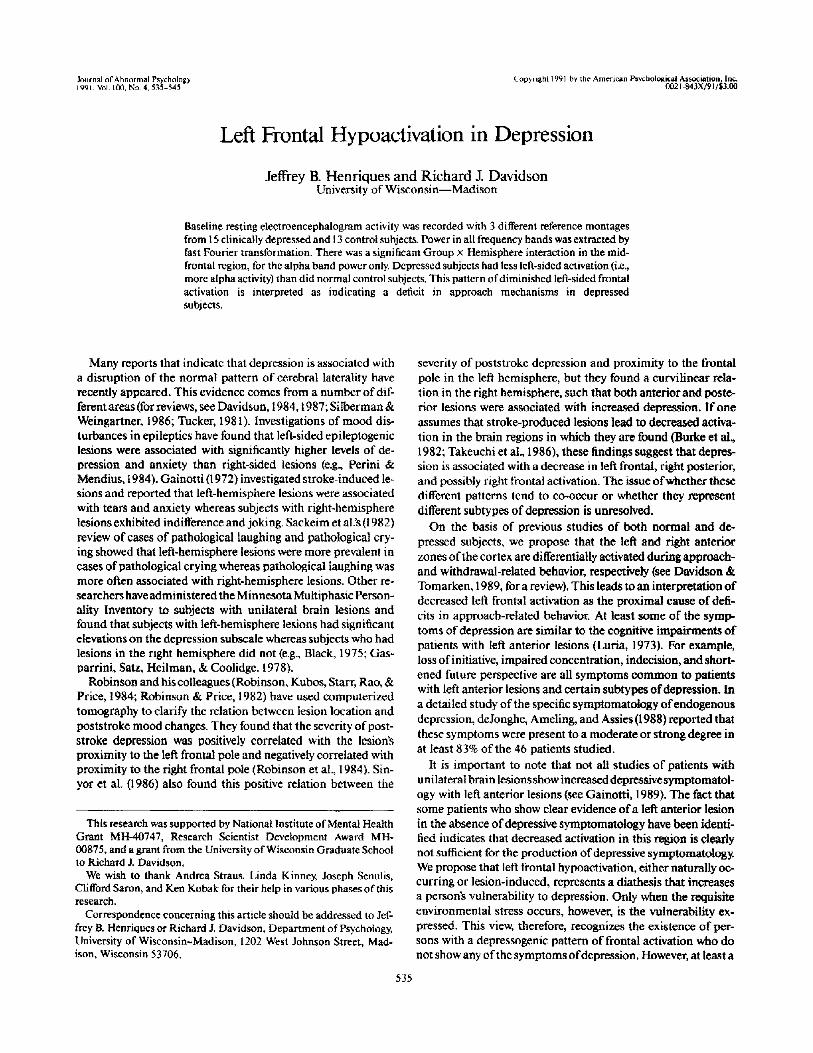
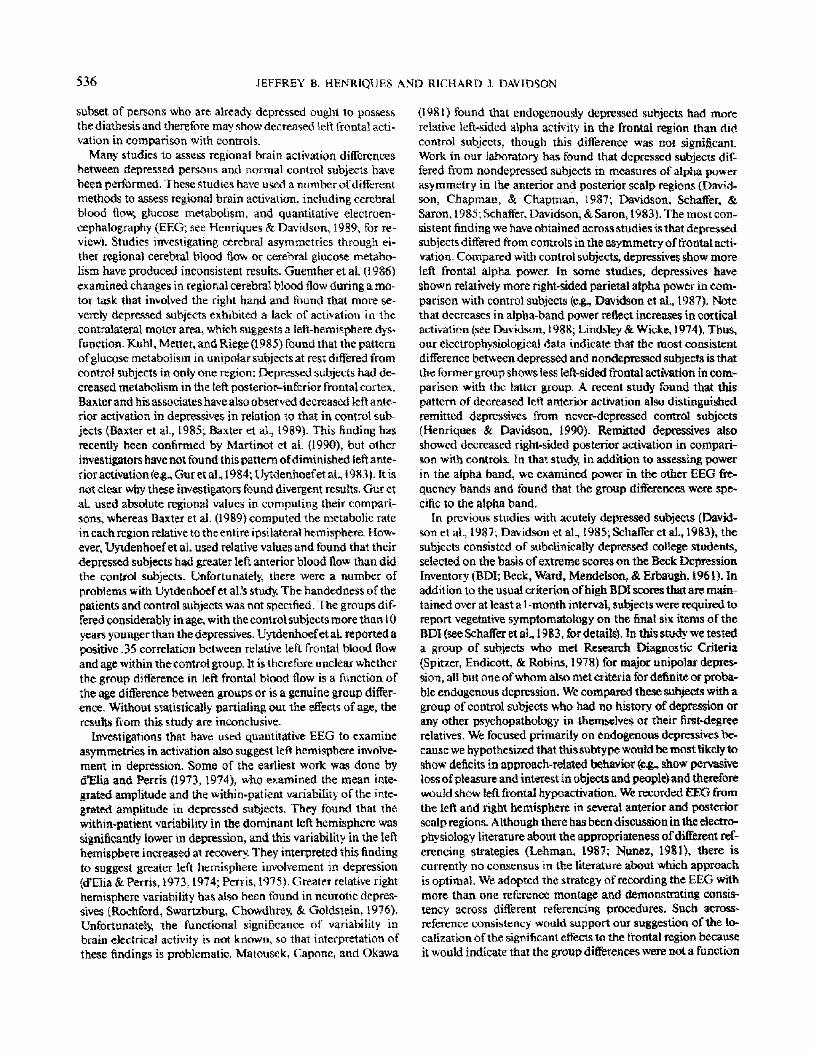
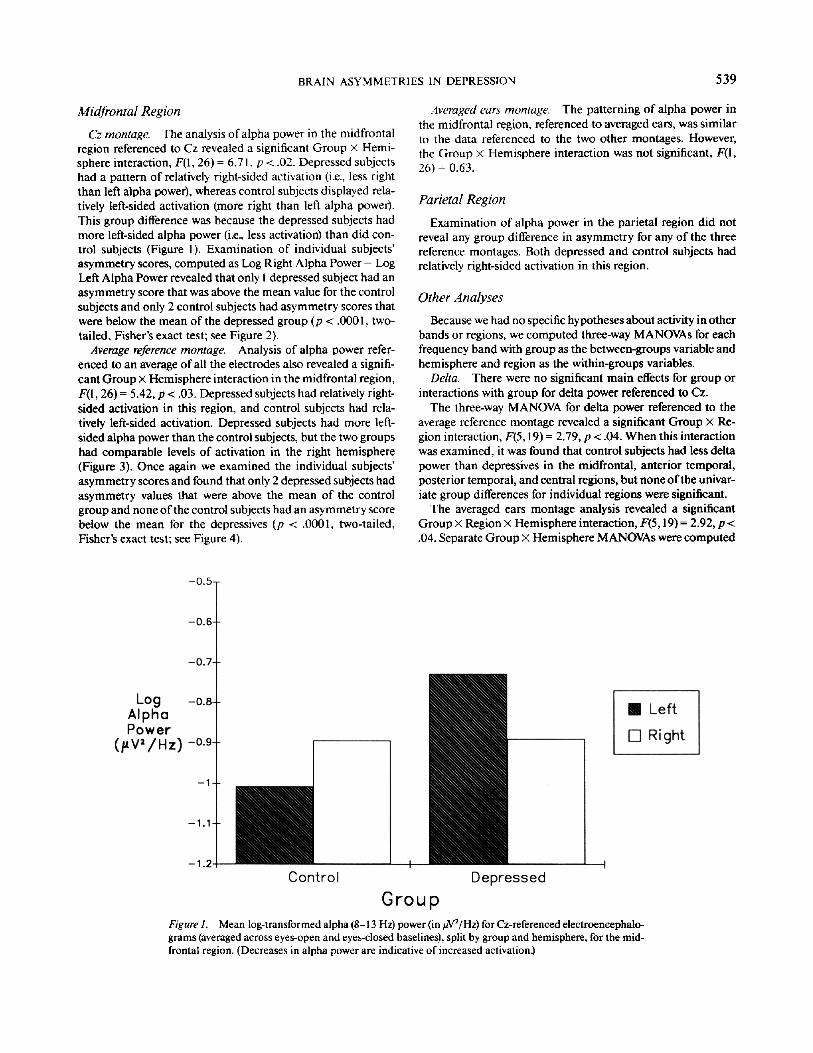
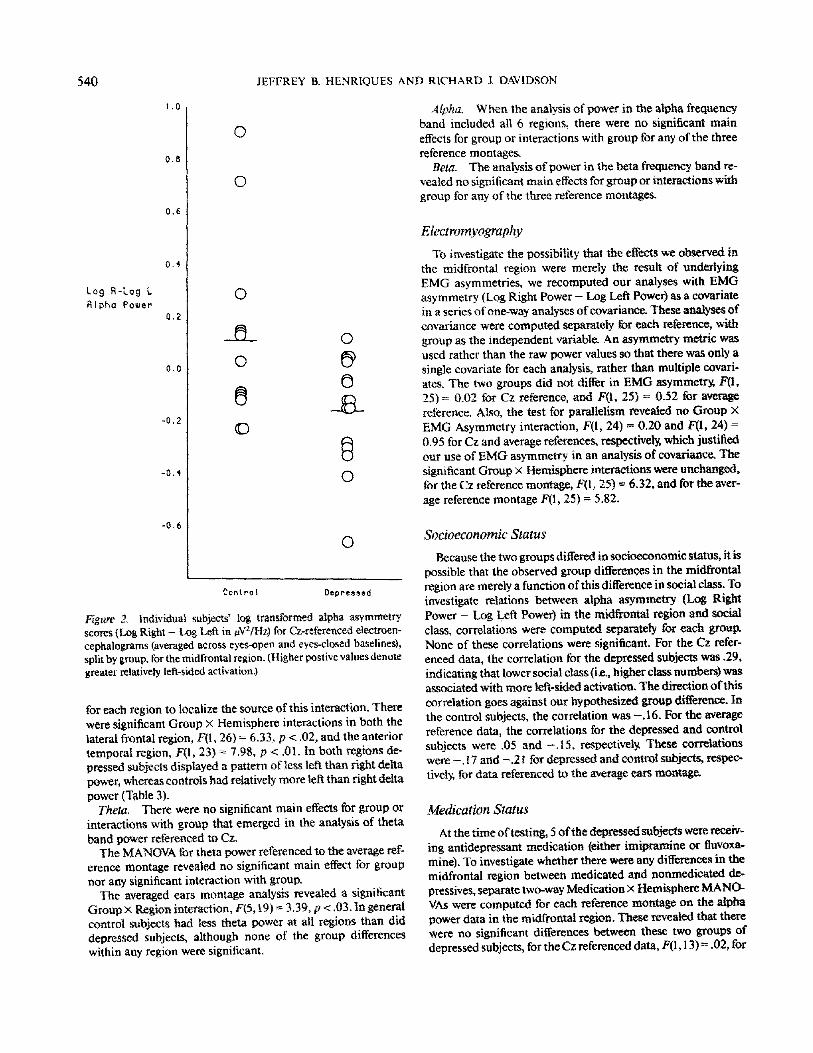
Cz montage. The analysis of alpha power in the midfrontal region referenced to Cz revealed a significant Group • Hemi- sphere interaction, F(I, 26) = 6.71, p < .02. Depressed subjects had a pattern of relatively right-sided activation (i.e., less right than left alpha power), whereas control subjects displayed rela- tively left-sided activation (more right than left alpha power). This group difference was because the depressed subjects had more left-sided alpha power (i.e., less activation) than did con- trol subjects (Figure 1). Examination of individual subjects' asymmetry scores, computed as Log Right Alpha Power - Log Left Alpha Power revealed that only I depressed subject had an asymmetry score that was above the mean value for the control subjects and only 2 control subjects had asymmetry scores that were below the mean of the depressed group (p < .0001, two- tailed, Fisher's exact test; see Figure 2).
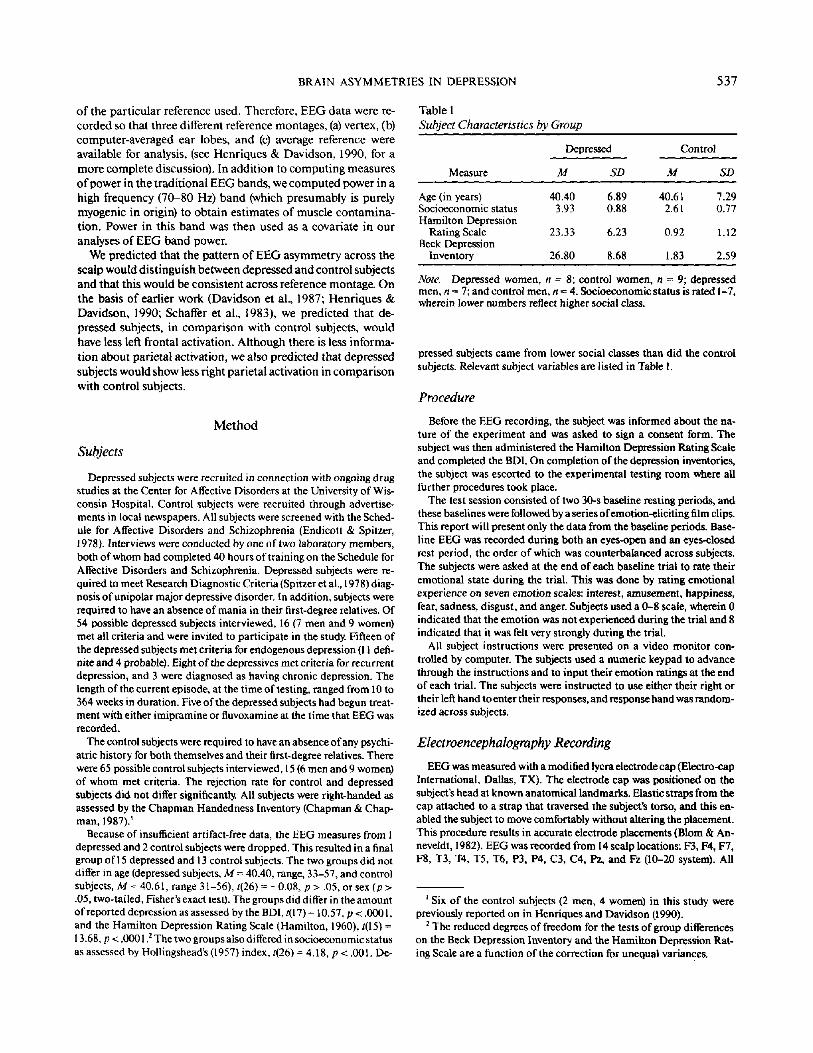
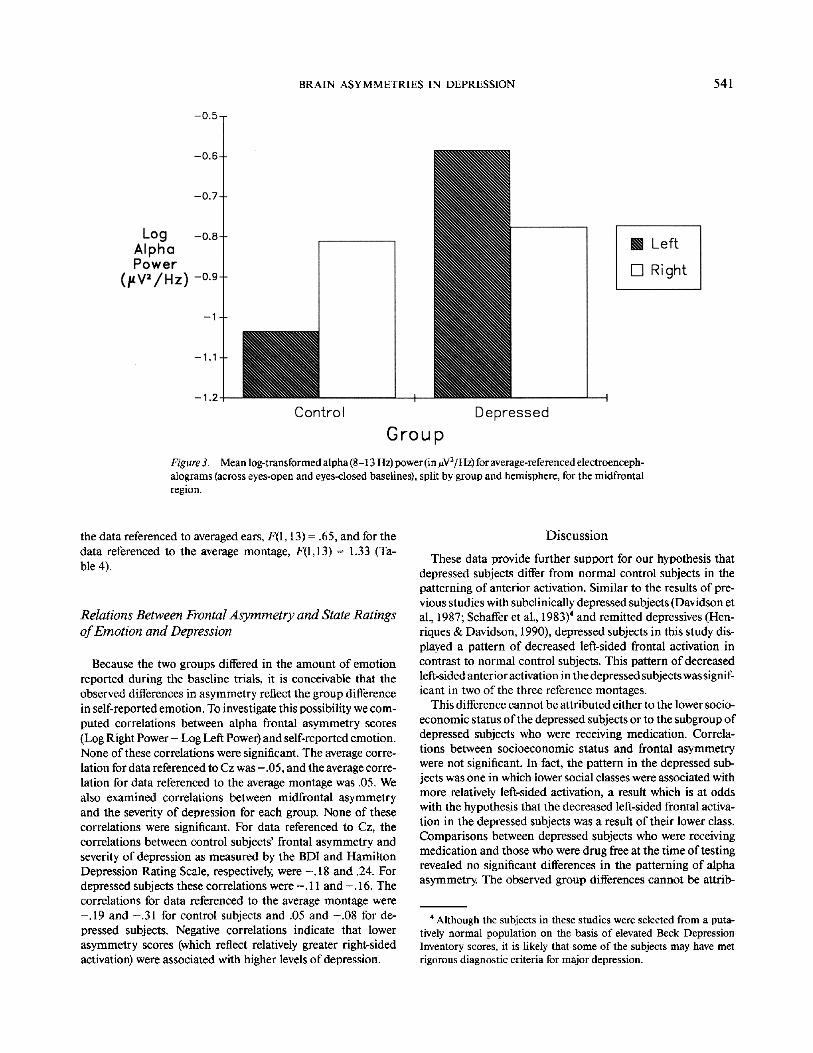
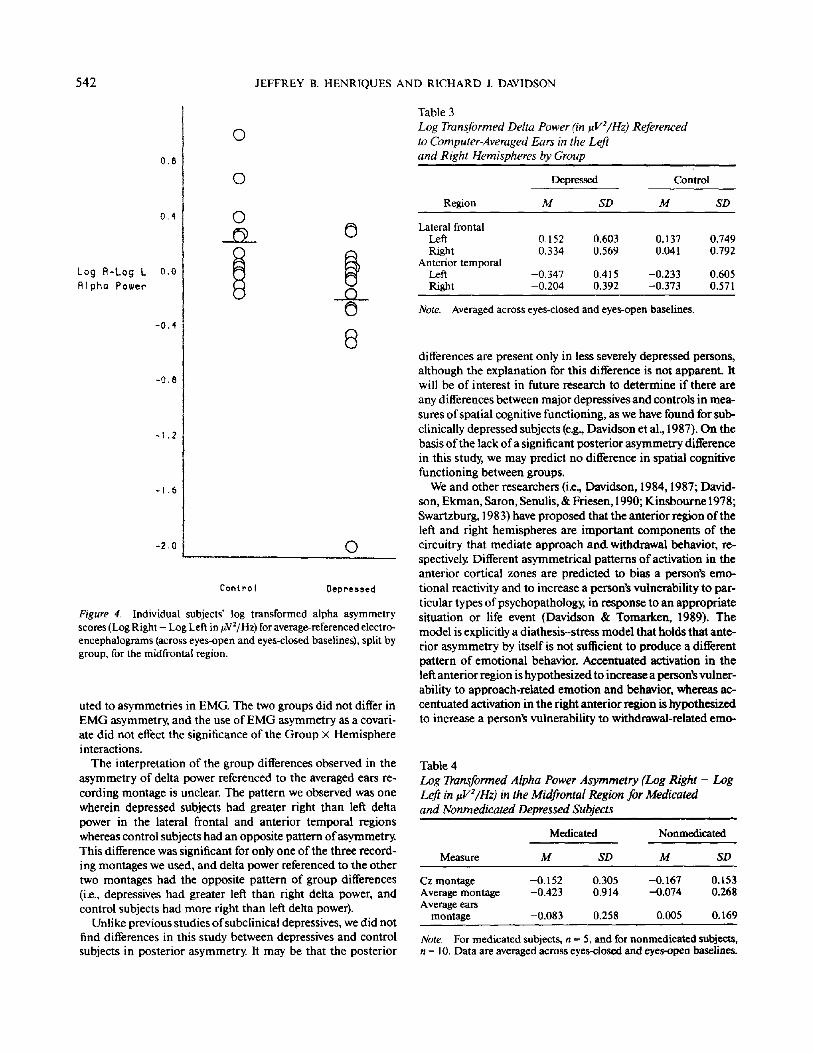
Average reference montage. Analysis of alpha power refer- enced to an average of all the electrodes also revealed a signifi- cant Group x Hemisphere interaction in the midfrontal region, F(I, 26) = 5.42, p < .03. Depressed subjects had relatively right- sided activation in this region, and control subjects had rela- tively left-sided activation. Depressed subjects had more left- sided alpha power than the control subjects, but the two groups had comparable levels of activation in the right hemisphere (Figure 3). Once again we examined the individual subjects' asymmetry scores and found that only 2 depressed subjects had asymmetry values that were above the mean of the control group and none of the control subjects had an asymmetry score below the mean for the depressives (p < .0001, two-tailed, Fisher's exact test; see Figure 4).
Averaged ears montage. The patterning of alpha power in the midfrontal region, referenced to averaged ears, was similar to the data referenced to the two other montages. However, the Group • Hemisphere interaction was not significant, F(I, 26) = 0.63.
Parietal Region
Examination of alpha power in the parietal region did not reveal any group difference in asymmetry for any of the three reference montages. Both depressed and control subjects had relatively right-sided activation in this region.
Other Analyses
Because we had no specific hypotheses about activity in other bands or regions, we computed three-way MANOVAs for each frequency band with group as the between-groups variable and hemisphere and region as the within-groups variables.
Delta. There were no significant main effects for group or interactions with group for delta power referenced to Cz.
The three-way MANOVA for delta power referenced to the average reference montage revealed a significant Group x Re- gion interaction, F(5, 19) = 2.79, p < .04. When this interaction was examined, it was found that control subjects had less delta power than depressives in the midfrontal, anterior temporal, posterior temporal, and central regions, but none of the univar- iate group differences for individual regions were significant.
The averaged ears montage analysis revealed a significant Group x Region x Hemisphere interaction, F(5,19) = 2.92, p < .04. Separate Group x Hemisphere MANOVAs were computed
Figure 1. Mean log-transformed alpha (8-13 Hz) power (in #V2/Hz) for Cz-referenced electroencephalo- grams (averaged across eyes-open and eyes-closed baselines), split by group and hemisphere, for the mid- frontal region. (Decreases in alpha power are indicative of increased activation.)
540 JEFFREY B. HENRIQUES AND RICHARD J. DAV1DSON
Alpha. When the analysis of power in the alpha frequency band included all 6 regions, there were no significant main effects for group or interactions with group for any of the three reference montages.
Beta. The analysis of power in the beta frequency band re- vealed no significant main effects for group or interactions with group for any of the three reference montages.
Electromyography
To investigate the possibility that the effects we observed in the midfrontal region were merely the result of underlying EMG asymmetries, we recomputed our analyses with EMG asymmetry (Log Right Power - Log Left Power) as a covariate in a series of one-way analyses of covarianee~ These analyses o f covariance were computed separately for each reference, with group as the independent variable. An asymmetry metric was used rather than the raw power values so that there was only a single covariate for each analysis, rather than multiple covari- ares. The two groups did not differ in EMG asymmetry, F(I, 25) = 0.02 for Cz reference, and F(I, 25) = 0.52 for average reference. Also, the test for parallelism revealed no Group x EMG Asymmetry interaction, F(I, 24) = 0.20 and F(I, 24) = 0.95 for Cz and average references, respectively, which justified our use of EMG asymmetry in an analysis of covariance. The significant Group • Hemisphere interactions were unchanged, for the Cz reference montage, F(l, 25) -- 6,32, and for the aver- age reference montage F(1, 25) = 5.82.
Figure 2. Individual subjects" log transformed alpha asymmetry scores (Log Right - Log Left in uV2/Hz) for Cz-referenced electroen- cephalograms (averaged across eyes-open and eyes-closed baselines), split by group, for the midfrontal region. (Higher postive values denote greater relatively left-sided activation.)
for each region to localize the source of this interaction. There were significant Group • Hemisphere interactions in both the lateral frontal region, F(I, 26) = 6.33, p < .02, and the anterior temporal region, F(1, 23) = 7.98, p < .01. In both regions de- pressed subjects displayed a pattern of less left than right delta power, whereas controls had relatively more left than right delta power (Table 3).
Theta. There were no significant main effects for group or interactions with group that emerged in the analysis of theta band power referenced to Cz.
The MANOVA for theta power referenced to the average ref- erence montage revealed no significant main effect for group nor any significant interaction with group.
The averaged ears montage analysis revealed a significant Group • Region interaction, F(5, t9) --- 3.39, p < .03. In general control subjects had less theta power at all regions than did depressed subjects, although none of the group differences within any region were significant.
Socioeconomic Status
Because the two groups differed in socioeconomic status, it is possible that the observed group differences in the midfrontal region are merely a function of this difference in social class. To investigate relations between alpha asymmetry (Log Right Power - Log Left Power) in the midfrontal region and social class, correlations were computed separately for each group. None of these correlations were significant. For the Cz refer- enced data, the correlation for the depressed subjects was ,29, indicating that lower social class (i.e., higher class numbers) was associated with more left-sided activation, The d'h-'ecfion o f this correlation goes against our hypothesized group difference. In the control subjects, the correlation was - . 16. For the average reference data, the correlations for the depressed and control subjects were .05 and - . 15, respectively. These correlations were - . l 7 and - .2 ! for depressed and control subjects, respec- tively, for data referenced to the average ears montage.
Medication Status
At the time of testing, 5 o f the depressed subjects were receiv- ing antidepressant medication (either imipramine or fluvoxa- mine). To investigate whether there were any differences in the midfrontal region between medicated and nonmedicated de- pressives, separate two-way Medication • Hemisphere MANO- VAs were computed for each reference montage on the alpha power data in the midfrontal region. These revealed that there were no significant differences between these two groups of depressed subjects, for the Cz referenced data, F(I, 13)-- .02, for
BRAIN ASYMMETRIES IN DEPRESSION 541
Figure 3. Mean log-transformed alpha (8-13 Hz) power (in uV2/Hz) for average-referenced electroenceph- alograms (across eyes-open and eyes-closed baselines), split by group and hemisphere, for the midfrontal region.
the data referenced to averaged ears, F(1, 13) = .65, and for the data referenced to the average montage, F(1,13) = 1.33 (Ta- ble 4).
Relations Between Frontal Asymmetry and State Ratings of Emotion and Depression
Because the two groups differed in the amount of emotion reported during the baseline trials, it is conceivable that the observed differences in asymmetry reflect the group difference in self-reported emotion. To investigate this possibility we com- puted correlations between alpha frontal asymmetry scores (Log Right P o w e r - Log Left Power) and self-reported emotion. None of these correlations were significant. The average corre- lation for data referenced to Cz was - .05, and the average corre- lation for data referenced to the average montage was .05. We also examined correlations between midfrontal asymmetry and the severity of depression for each group. None of these correlations were significant. For data referenced to Cz, the correlations between control subjects' frontal asymmetry and severity of depression as measured by the BDI and Hamilton Depression Rating Scale, respectively, were - . 18 and .24. For depressed subjects these correlations were - . 11 and - . 16. The correlations for data referenced to the average montage were - . 19 and - .31 for control subjects and .05 and - .08 for de- pressed subjects. Negative correlations indicate that lower asymmetry scores (which reflect relatively greater right-sided activation) were associated with higher levels of depression.
Discussion
These data provide further support for our hypothesis that depressed subjects differ from normal control subjects in the patterning of anterior activation. Similar to the results of pre- vious studies with subclinically depressed subjects (Davidson et al., 1987; Schaffer et al., 1983) 4 and remitted depressives (Hen- riques & Davidson, 1990), depressed subjects in this study dis- played a pattern of decreased left-sided frontal activation in contrast to normal control subjects. This pattern of decreased left-sided anterior activation in the depressed subjects was signif- icant in two of the three reference montages.
This difference cannot be attributed either to the lower socio- economic status of the depressed subjects or to the subgroup of depressed subjects who were receiving medication. Correla- tions between socioeconomic status and frontal asymmetry were not significant. In fact, the pattern in the depressed sub- jects was one in which lower social classes were associated with more relatively left-sided activation, a result which is at odds with the hypothesis that the decreased left-sided frontal activa- tion in the depressed subjects was a result of their lower class. Comparisons between depressed subjects who were receiving medication and those who were drug free at the time of testing revealed no significant differences in the patterning of alpha asymmetry. The observed group differences cannot be attrib-
4 Although the subjects in these studies were selected from a puta- tively normal population on the basis of elevated Beck Depression Inventory scores, it is likely that some of the subjects may have met rigorous diagnostic criteria for major depression.
542 JEFFREY B. HENRIQUES AND RICHARD J. DAVIDSON
Table 3 Log Transformed Delta Power On tzVe/Hz) Referenced to Computer-Averaged Ears in the Left and Right Hemispheres by Group
Depressed Control
Re,on M SD M SD
Lateral frontal Left 0.152 0.603 0.137 0.749 Right 0.334 0.569 0.041 0.792
Anterior temporal Left -0.347 0.415 -0.233 0.605 Right -0.204 0.392 -0.373 0,571
Note. Averaged across eyes-closed and eyes-open baselines.
Figure 4. Individual subjects' log transformed alpha asymmetry scores (Log Right - Log Left in uV2/Hz) for average-referenced electro- encephalograms (across eyes-open and eyes-closed baselines), split by group, for the midfrontal region.
uted to asymmetries in EMG. The two groups did not differ in EMG asymmetry, and the use of EMG asymmetry as a covari- ate did not effect the significance of the Group X Hemisphere interactions.
The interpretation of the group differences observed in the asymmetry of delta power referenced to the averaged ears re- cording montage is unclear. The pattern we observed was one wherein depressed subjects had greater right than left delta power in the lateral frontal and anterior temporal regions whereas control subjects had an opposite pattern of asymmetry. This difference was significant for only one of the three record- ing montages we used, and delta power referenced to the other two montages had the opposite pattern of group differences (i.e., depressives had greater left than right delta power, and control subjects had more right than left delta power).
Unlike previous studies of subclinical depressives, we did not find differences in this study between depressives and control subjects in posterior asymmetry. It may be that the posterior
differences are present only in less severely depressed persons, although the explanation for this difference is not apparent. It will be of interest in future research to determine if there are any differences between major depressives and controls in mea- sures of spatial cognitive functioning, as we have found for sub- clinically depressed subjects (e.g., Davidson et al., 1987). On the basis of the lack of a significant posterior asymmetry difference in this study, we may predict no difference in spatial cognitive functioning between groups.
We and other researchers (i.e., Davidson, 1984, 1987; David- son, Ekman, Saron, Senulis, & Friesen, 1990; Kinsbourne 1978; Swartzburg, 1983) have proposed that the anterior region of the left and right hemispheres are important components of the circuitry that mediate approach an& withdrawal behavior, re- spectively Different asymmetrical patterns of activation in the anterior cortical zones are predicted to bias a person's emo- tional reactivity and to increase a person's vulnerability to par- ticular types of psychopathology, in response to an appropriate situation or life event (Davidson & Tomarken, 1989). The model is explicitly a diathesis-stress model that holds that ante- rior asymmetry by itself is not sufficient to produce a different pattern of emotional behavior. Accentuated activation in the left anterior region is hypothesized to increase a person's vulner- ability to approach-related emotion and behavior, whereas ac- centuated activation in the right anterior region is hypothesized to increase a person's vulnerability to withdrawal-related emo-
Table 4 Log Transformed Alpha Power Asymmetry (Log Right - Log Left in ~V2/l-Iz) in the Midfrontal Region for Medicated and Nonmedicated Depressed Subjects
Medicated Nonmcdicatcd
Measure M SD M SD
Cz montage -0.152 0.305 -0.167 0.153 Average montage -0.423 0.914 -0.074 0.268 Average ears
montage -0.083 0.258 0.005 0.169
Note, For medicated subjects, n = 5, and for nonmedicated subjects, n = 1 0 . Data are averaged across eyes-closed and eyes-open baselines.
BRAIN ASYMMETRIES IN DEPRESSION 543
tion and behavior. Hypoactivation in the left anterior region is predicted to increase a person's vulnerability to behavior and emotion associated with deficits in the approach system. Sad- ness and depression are both expected to result from such ap- proach-related deficits. This view is supported by studies that suggest that dispositional positive affect is decreased in de- pressed persons (TeUegen, 1985; Watson, Clark, & Carey, 1988) and in subjects selected from a normal population on the basis of extreme left frontal hypoactivation (Tomarken, Davidson, Wheeler, & Doss, in press).
In this study we found no relation between anterior activation asymmetry and reports of emotion at the time the baseline measures were obtained. The lack of a significant association between these classes of measures is consistent with previous data in normal subjects, for whom it was found that baseline frontal asymmetry predicted reactivity to emotional film clips but was not associated with measures of mood (identical to those used in this study) at the time the baselines were obtained (Tomarken, Davidson, & Henriques, 1990). The fact that base- line measures of frontal asymmetry were not associated with concurrent measures of emotional state is also consistent with our theory that posits a diathesis-stress model. During the base- line periods, there is no situational provocation, and the level of baseline state-emotion is rather low. Under such circumstances we do not expect frontal asymmetry to account for variance in baseline emotional state.
Measures of frontal asymmetry were also not significantly associated with measures of severity of depressive symptomatol- ogy as indexed by either the BDI or the Hamilton Depression Rating Scale. This conclusion is based on the absence of any significant correlations within groups between the EEG mea- sure of frontal asymmetry and scores on the two depression measures. Because these measures reflect more tonic disposi- tional characteristics in comparison with our measures of emo- tional state, we might expect them to be associated with frontal asymmetry. We offer two possible reasons to explain this lack of association. First, the lack of correlation between depression severity and frontal asymmetry may have arisen because of the truncated range of scores on the measures of depressive symp- tomatology within each group. We did not compute correla- tions across groups because subjects were selected on the basis of depressive symptomatology, and we therefore did not have the continuous range ofdepression severity scores necessary for correlation. If we had a full range of scores on the depression measures, we would expect to find significant relations be- tween the depression measures and the frontal asymmetry measures. Second, according to our model, not all depressed subjects are expected to have the left frontal hypoactivation diathesis. We allow for the possibility that depression arises in other manners, and our depressed sample may have included subjects who lacked the diathesis (see Figures 2 and 4). In this regard, it will be of great interest in future research to deter- mine if there are phenotypic differences between those de- pressed subjects with and without left frontal hypoactivation.
In light of the now available corpus of evidence that indicates that left frontal hypoactivation is present in acutely depressed persons, in remitted depressives, and in subjects with low dispo- sitional positive affect drawn from a normal population, we propose that this pattern is a state-independent marker of vul-
nerability to affective disorders. If this proves to be a replicable finding, it will be of interest to examine its etiology. We know that individual differences in frontal asymmetry are present within the first year of life and predict important aspects of an infant's response to stressful challenges, such as a brief episode of maternal separation (Davidson & Fox, 1989). It is likely that the distal causes of individual differences in frontal asymmetry will be a complex mixture of early environmental and genetic effects. The proximal causes, or mechanisms which underlie the frontal asymmetry differences, are likely to reflect, at least in part, upstream influences from subcortical structures that have direct projections to the frontal lobes (Nauta, 1971). For example, catecholamine asymmetries in certain subcortical structures, such as the amygdala and the thalamus, may contrib- ute to asymmetrical efferent outflow to anterior cortical re- gions (see Tucker & Williamson, 1984, for review). Alterna- tively, or possibly in addition, frontal cortical zones of the two hemispheres may be differentially sensitive to upstream influ- ences from subcortical structures. The differential cortical sen- sitivity of the two hemispheres may also be a function of an asymmetrical distribution of neurotransmitters or asymme- tries in receptor densities. The precise mechanisms that under- lie the electrophysiological asymmetries we have found must await research with new methods to assess regional brain func- tion, such as positron emission tomography, which can poten- tially reveal regional differences in neurotransmitter concentra- tion and receptor densities.
References
Baxter, L. R., Phelps, M. E., Mazziotta, J. C., Schwartz, J. M., Gerner, R. H., Selin, C. E., & Sumida, R. M. (1985). Cerebral metabolic rates for glucose in mood disorders. Archives of General Psychiatry, 42, 441-447.
Baxter, L. R., Schwartz, J. M., Phelps, M. E., Mazziotta, J. C., Guze, B. H., Sclin, C. E., Gerner, R. H., & Sumida, R. M. (1989). Reduction of prefrontal cortex glucose metabolism common to three types of depression. Archives of General Psychiatry, 46, 243-250.
Beck, A. T., Ward, C. H., Mendelson, M., & Erbaugh, J. (1961). An inventory for measuring depression. Archives of General Psychiat~ 4, 561-571.
Black, E W. (1975). Unilateral brain lesions and MMPI performance: A preliminary study. Perceptual and Motor Skills, 40, 87-93.
Biom, J. L., & Anneveldt, M. (1982). An electrode cap tested. Electroen- cephalography and Clinical Neurophysiology, 54, 591-594.
Burke, A., Younkin, D., Kushner, M., Gordon, J., Pistone, L., Shapiro, H., & Reivich, M. (1982). Recovery from acute stroke and changes in cerebral blood flow. Annals of Neurolog~ 12, 84.
Chapman, L. J., & Chapman, J. E (1987). The measurement of handed- hess. Brain and Cognition, 6, 175-183.
Davidson, R. J. (1984). Hemispheric asymmetry and emotion. In K. Scherer & E Ekman (Eds.), Approaches to emotion (pp. 39-57). Hills- dale, N J: Erlbaum.
Davidson, R. J. (1987). Cerebral asymmetry and the nature of emotion: Implications for the study of individual differences and psychopa- thology. In R. Takahashi, E Flor-Henry, J. Gruzelier, & S. Niwa (Eds.), Cerebral dynamics, laterality, and psychopathology (pp. 71- 83). New York: Elsevier Science.
Davidson, R. J. (1988). EEG measures of cerebral asymmetry: Concep- tual and methodological issues. International Journal of Neuro- science, 39, 71-89.
544 JEFFREY B. HENR1QUES AND RICHARD J. DAVIDSON
Davidson, R. J., Chapman, J. P., & Chapman, L. J. (1987). Task-depen- dent EEG asymmetry discriminates between depressed and non-de- pressed subjects. Psychophysiology, 24, 585.
Davidson, R. J., Ekman, E, Saron, C. D., Senulis, J. A., & Friesen, W V. (1990). Approach-withdrawal and cerebral asymmetry: Emotional expression and brain physiology I. Journal of Personality and Social Psychology, 58, 330-341.
Davidson, R. J., & Fox, N. A. (1989). Frontal brain asymmetry predicts infants' response to maternal separation. Journal of Abnormal Psy- chology, 98, 127-131.
Davidson, R. J., Schaffer, C. E., & Saron, C. (1985). Effects of latera- lized presentations of faces on self-reports of emotion and EEG asymmetry in depressed and non-depressed subjects. Psychophys- iology. 22, 353-364.
Davidson, R. J., & Tomarken, A. J. (1989). Laterality and emotion: An electrophysiological approach. In E Boiler & J. Grafman (Eds.), Handbook ofneuropsychology (pp. 419-441 ). Amsterdam: Elsevier.
deJonghe, E, Ameling, E., & Assies, J. (1988). An elaborate description of the symptomatology of patients with research diagnostic criteria endogenous depression. Journal of Nervous and Mental Disease, 176, 475-479.
d'Elia, G., & Perris, C, (1973). Cerebral functional dominance and de- pression. Acta Psychiatrica Scandinavica, 49, 191-197.
d'Elia, G., & Perris, C. (1974). Cerebral functional dominance and memory functions. Acta Psychiatrica Scandinavica, Suppl. 255, 143- 157.
Dumermuth, G., & Molinari, L. (1987). Spectral analysis of EEG back- ground activity. In A. S. Gevins & A. Remond (Eds.), Handbook of electroencephalography and clinical neurophysiology: Vol. 1. Methods of anal.vsis of brain electrical and magnetic signals (pp. 85-130). Am- sterdam: Elsevier.
Endicott, J., & Spitzer, R. (1978). A diagnostic interview: The Schedule for Affective Disorders and Schizophrenia. Archives of General Psy- chiatry, 35, 837-844.
Gainotti, G. (1972). Emotional behavior and hemispheric side of the lesion. Cortex, 8, 41-55.
Gainotti, G. (1989). Disorders of emotions and affect in patients with unilateral brain damage. In E Boiler & J. Grafman (Eds.), Handbook ofneuropsychology (Vol. 3, pp. 345-361). Amsterdam: Elsevier.
Gasparrini, W. G., Satz, P., Heilman, K. M., & Coolidge, E L. (1978). Hemispheric asymmetries of affective processing as determined by the Minnesota Multiphasic Personality Inventory. Journal of Neurol- ogy, Neurosurgery, and Psychiatry, 41, 470-473.
Guenther, W., Moser, E., Mueller-Spahn, E, von Oefele, K., Buelle, U., & Hippius, H. (1986). Pathological cerebral blood flow during mo- tor function in schizophrenic and endogenous depressed patients. Biological Psychiatry, 21,889-899.
Gur, R. E., Skolnick, B. E., Gur, R. C., Caroff, S., Rieger, W., Obrist, W. D., Younkin, D., & Reivich, M. (1984). Brain function in psychiat- ric disorders. Archives of General Psychiatry, 41. 695-699.
Hamilton, M. (1960). A rating scale for depression, Journal of Neurol- ogy, Neurosurgery, and Psychiatry, 23, 56-62.
Henriques, J. B., & Davidson, R. J, (1989). Affective disorders. In G. Turpin (Ed.), Handbook of clinical psychophysiology (pp. 357-392). London: Wiley.
Henriques, J. B., & Davidson, R. J. (1990). Regional brain electrical asymmetries discriminate between previously depressed and healthy control subjects. Journal of Abnormal Psychology, 99, 22-31.
Hollingshead, A. B. (1957). Two-factor index of social position. Unpub- lished manuscript, Yale University, New Haven, CT.
Kinsbourne, M. (1978). Evolution of language in relation to lateral
action. In M. Kinsbourne (Ed.), Asymmetrical function of the brain (pp. 553-556). New York: Cambridge University Press.
Kuhl, D. E., Metter, E. J., & Riege, W H. (1985). Patterns of cerebral glucose utilization in depression, multiple infarct dementia, and Alzheimer's disease. In L. Sokoloff (Ed.), Brain imaging and brain function (pp. 211-226). New York: Raven Press.
Lehman, D. (1987). Principles of spatial analysis. In A. S. Gevins & A. Remond (Eds.), Methods of analysis of brain electrical and magnetic signals (pp. 309-354). New York: Elsevier Science.
Lindsley, D. B., & Wicke, J. D. (1974). The electroencephalogram: Au- tonomous electrical activity in man and animals. In R. Thompson & M. N. Patterson (Eds.), Bioelectric recording techniques (pp. 3-83). New York: Academic Press.
Luria, A. R. (1973). The working brain. New York: Basic Books. Martinot, J.-L., Hardy, P., Feline, A., Huret, J.-D., Mazoyer, B., Attar-
Levy, D., Pappata, S., & Syrota, A. (1990). Left prefrontal glucose hypometabolism in the depressed state: A confirmation. American Journal of Psychiatry, 147, 1313-1317.
Matousek, M., Capone, C., & Okawa, M. (1981). Measurement of the inter-hemispheral differences as a diagnostic tool in psychiatry. Ad- vances in Biological Psychiatry, 6, 76-80.
Nauta, W. J. H. (1971). The problem of the frontal lobe: A reinterpreta- tion. Journal of Psychiatric Research, 8, 167-187.
Nunez, P. L. (1981). Electrical fields of the brain: The neurophysics of EEG. New York: Oxford University Press.
Perini, G., & Mendius, R. (1984). Depression and anxiety in complex partial seizures. The Journal of Nervous and Mental Disease, 172, 287-290.
Perris, C. (1975). EEG techniques in the measurement of the severity of depressive syndromes. Neuropsychobiology, 1, 16-25.
Robinson, R. G., Kubos, K. L., Starr, L. B., Rap, K., & Price, T. R. (1984). Mood disorders in stroke patients. Brain, 107, 81-93.
Robinson, R. G., & Price, T. R. (1982). Post-stroke depressive dis- orders: A follow-up of 103 patients. Stroke, 13, 635-641.
Rochford, J. M., Swartzburg, M., Chowdhrey, S. M., & Goldstein, L. (1976). Some quantitative EEG correlates of psychopathology. Re- search Communications in Psychology, Psychiatry, and Behavior, I, 211-226.
Sackeim, H. A., Greenberg, M. S., Weiman, A. L., Gur, R., Hunger- buhler, J. E, & Geschwind, N. (1982). Hemispheric asymmetry in the expression of positive and negative emotions. Archives of Neurology, 39, 210-218.
Schaffer, C. E., Davidson, R. J., & Saron, C. (1983). Frontal and parietal electroencephalogram asymmetry in depressed and nondepressed subjects. Biological Psychiatry, 18, 753-762.
Silberman, E. K., & Weingartner, H. (1986). Hemispheric lateraliza- tion of functions related to emotion. Brain and Cognition, 5, 322-353
Sinyor, D., Jacques, E, Kaloupek, D. G., Becker, R., Goldenberg, M, & Coppersmith, H. (1986). Poststroke depression and lesion location: An attempted replication. Brain, 109, 537-546.
Spitzer, R. L., Endicott, J., & Robins, E. (1978). Research Diagnostic Criteria (RDC) for a selected group of functional disorders (3rd ed.). New York: New York State Psychiatric Institute, Biometrics Re- search.
Swartzburg, M. (1983). Hemispheric laterality and EEG correlates of depression. Research Communications in Psychology, Psychiatry, and Behavior, 8, 187-205.
Takeuchi, S., Miyakawa, T., Koike, T., Tanaka, R., Arai, H., Sekine, K., & Ishii, R. (1986). [Study of cerebral blood flow in patients with cerebral infarction by 133Xe inhalation method--Comparison be- tween affected and unaffected hemispheres, and sequential
BRAIN ASYMMETRIES IN DEPRESSION 545
changes]. No To Shinke, 38, 1143-1149. (From Medline, Unique Identifier No. 87128641 )
Tellegen, A. (1985). Structures of mood and personality and their rele- vance to assessing anxiety, with an emphasis on self-report. In A. H. Tuma & J. Maser (Eds.), Anxiety and the anxiety disorders (pp. 681- 706). Hillsdale, N J: Erlbaum.
Tomarken, A. J., Davidson, R. J., & Henriques, J. B. (1990). Frontal brain asymmetry predicts affective responses to films. Journal of Personality and Social Psychology. 59, 791-801.
Tomarken, A. J., Davidson, R. J., Wheeler, R. E,, & Doss, R. (in press). Individual differences in anterior brain asymmetry and fundamen- tal dimensions o femotion. JournalofPersonalityandSocialPsychol- ogy.
Tomarken, A. J., Davidson, R. J., Wheeler, R. E,, & Kinney, L. (in press). Psychometric properties of resting anterior EEG asymmetry: Temporal stability and internal consistency. Psychophysiology
Tucker, D. M. (I 981 ). Lateral brain function, emotion and conceptual- ization. Psychological Bulletin, 89, 19-46.
Tucker, D. M., & Williamson, P. A. (1984). Asymmetric neural control systems in human self-regulation. Psychological Review, 91, 185- 215.
Uytdenhoef, P., Portelange, P., Jacquy, J., Charles, G., Linkowski, P., & Mendlewicz, J. (1983). Regional cerebral blood flow and lateralized hemispheric dysfunction in depression. British Journal of Psychiatry, 143, 128-132.
Watson, D., Clark, L. A., & Carey, G. (1988). Positive and negative affectivity and their relation to anxiety and depressive disorders. Journal of Abnormal Psychology, 97, 346-353.
Received May 30, 1990 Revision received December 14, 1990
Accepted December 15, 1990 �9
Low Publication Prices for APA Members and Affiliates Keeping You Up to Date: All APA members (Fellows, Members, and Associates, and Student
Affiliates) receive--as part of their annual dues--subscriptions to the American Psychologist and the APA Monitor.
High School Teacher and Foreign Affiliates receive subscriptions to the APA Monitor and they can subscribe to the American Psychologist at a significantly reduced rate.
In addition, members and affiliates are eligible for savings of up to 60% on other APAjoumals, as well as significant discounts on subscriptions from cooperating societies and publishers (e.g., the British Psychological Society, the American Sociological Association, and Human Sciences Press).
Essential Resources: APA members and affiliates receive special rates for purchases of APA books, including Computer Use in Psychology: A Directory of Software, the Master Lectures, and Journals in Psychology: A Resource Listing for Authors.
Other Benefits of Membership: Membership in APA also provides eligibility for low-cost insurance plans covering life; medical and income protection; hospital indemnity; accident and travel; Keogh retirement; office overhead; and student/school, professional, and liability.
For more information, write to American Psychological Association, Membership Services, 1200 Seventeenth Street NW, Washington, DC 20036, USA or call (703) 247-7760 (collect calls cannot be accepted).