NGO Shadow Report for the review of the U.S. … IHRLG, Cathy Albisa, and Dorthy Thomas of the...
48
1 NGO Shadow Report for the review of the U.S. government under the UN International Convention on the Elimination of All Forms of Racial Discrimination (ICERD), Article 5 Submitted by the New York City Human Rights Working Group August 2001 Human Rights Project Urban Justice Center 666 Broadway, 10 th floor New York, NY 10012
Transcript of NGO Shadow Report for the review of the U.S. … IHRLG, Cathy Albisa, and Dorthy Thomas of the...
1
NGO Shadow Report for the review of the U.S. government under the UN International Convention on the Elimination of All Forms of Racial Discrimination (ICERD), Article 5
Submitted by the New York City Human Rights Working Group August 2001
Human Rights Project Urban Justice Center
666 Broadway, 10 th floor New York, NY 10012
2
T T h h e e H H u u m m a a n n R R i i g g h h t t s s P P r r o o j j e e c c t t The Human Rights Project of the Urban Justice Center (HRP)
is a nongovernmental, antipoverty organization located in New
York City, New York, USA. HRP is dedicated to strengthening a
human rights based approach to public policy and social justice
activism with particular attention to the intersections of race, gender and poverty. HRP uses a
human rights framework to promote a higher standard of government responsibility and
accountability in regard to meeting the basic needs of those living in the United States. Within
the area of economic, social and cultural rights, we document, monitor and report on violations.
Based on our findings, we engage in advocacy, organizing, education, and technical assistance.
N N e e w w Y Y o o r r k k C C i i t t y y H H u u m m a a n n R R i i g g h h t t s s W W o o r r k k i i n n g g G G r r o o u u p p The New York City Human Rights Working Group (NYCHRWG), spearheaded by the Human
Rights Project, is a consortium of grassroots racial and economic justice groups and human
rights organizations. The mandate of the group is to report on US compliance with ICERD in
preparation for their review before the committee. The following is list of the groups that
participated in the NYCHRWG.
American Indian Law Alliance
Asian American Legal Defense Fund
Audre Lorde Project
Center for Economic & Social Rights
Central Brooklyn Partnership
Columbia School of Public Health, Law &
Policy Center
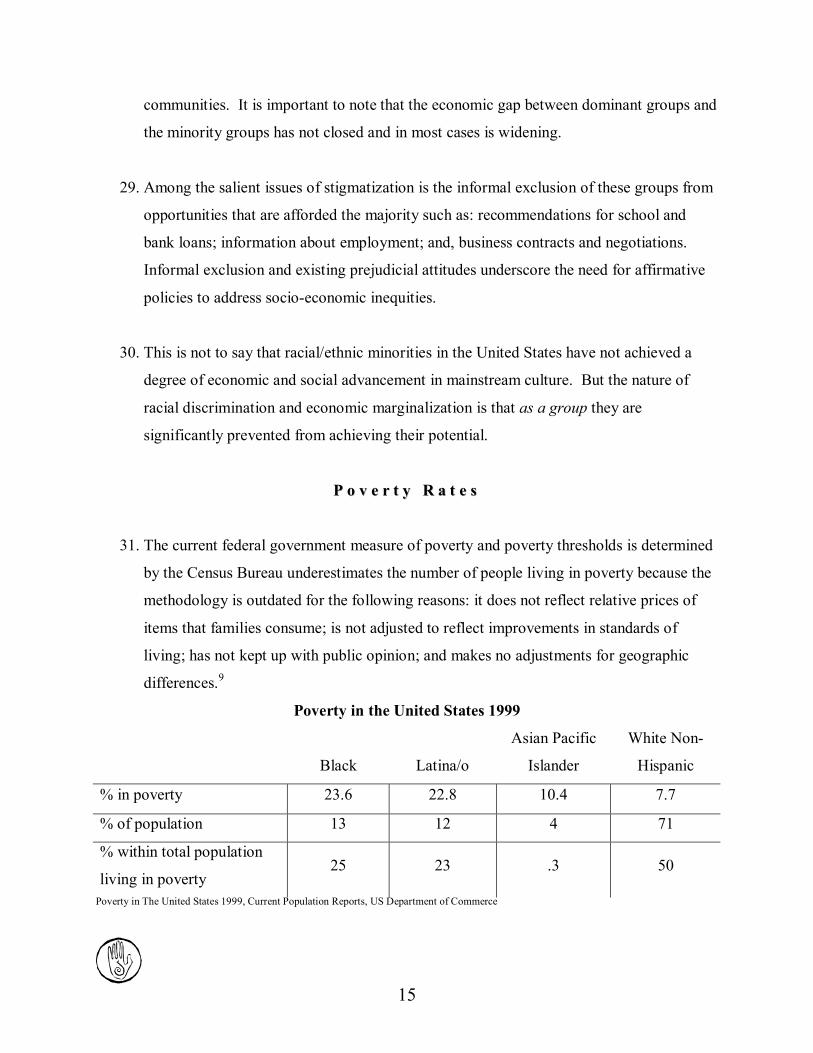
CUNY Law School, International Women’s
Harlem Community Justice Center
Human Rights Clinic
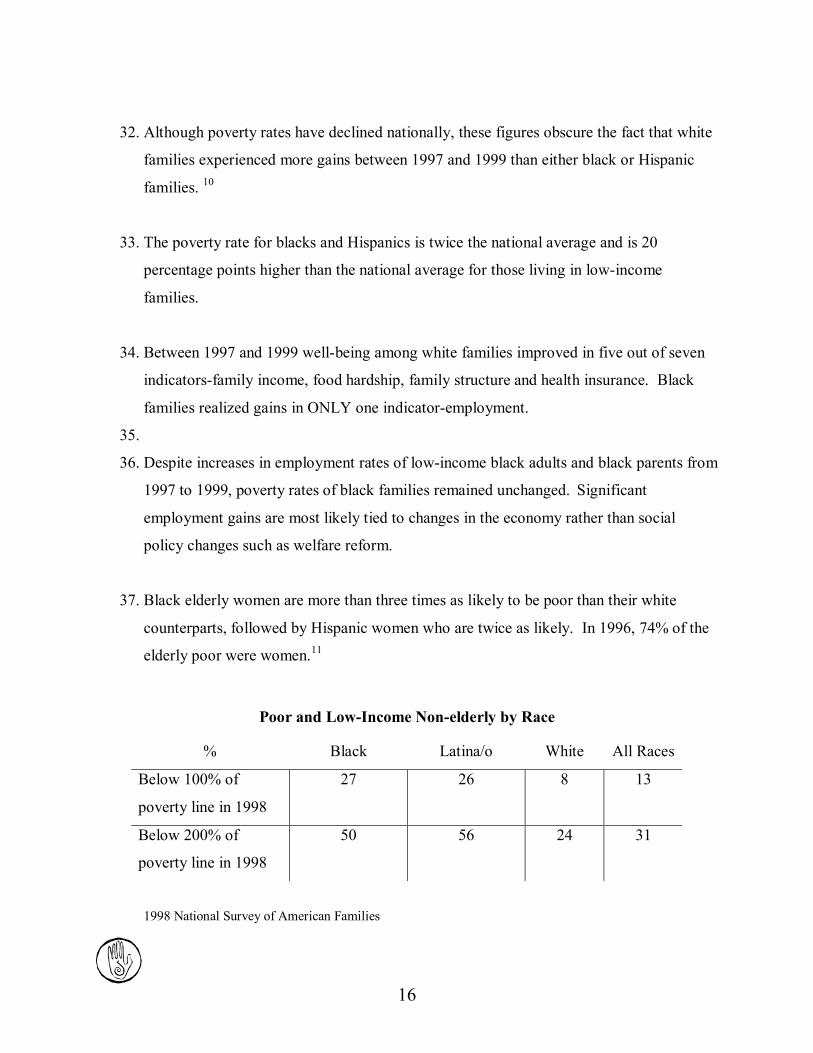
Human Rights Project, Urban Justice Center
Human Rights Watch, International Gay and
Lesbian Human Rights Commission
Imani House Fox House
International AntiPoverty Law Center
(IAPLC)
International Human Rights Law Group
(IHRLG)
South Asian Lesbian and Gay Association
Urban Mindz
Women’s Institute for Leadership
Development for Human Rights (WILD)
3
A A c c k k n n o o w w l l e e d d g g e e m m e e n n t t s s We would like to acknowledge and thank everyone who participated in this report all of the
NYC Human Rights Working Group members, Human Rights Project staff, interns, and
volunteers. This report was edited by Abby Pitcher and Ejim Dike, both Human Rights Project
staff, to whom we are grateful. We would like to thank Maria Green of IAPLC, Veena Vasista
of IHRLG, Cathy Albisa, and Dorthy Thomas of the Shaler Adams Foundation for their technical
support and helpful insight. We thank the many social and economic justice activists who
challenge racial and gender inequality. Finally, we would like to express our gratitude to the
hundreds of New Yorkers from whom we gathered testimony about their experience with public
benefits and services in New York City.
C C o o n n t t r r i i b b u u t t i i n n g g A A u u t t h h o o r r s s Julie Carlson, HRP
Ramona Ortega, HRP
Emily Roscia, CUNY Law Center
Kristina Browning, CUNY Law Center
Heidi Dorow, WILD for Human Rights
Julian Liu, Audre Lorde Project
Shravanti Reddy, Independent Scholar
Stacey Mayer, Graduate Student
4
T T a a b b l l e e o o f f C C o o n n t t e e n n t t s s
Executive Summary 4
Introduction 6
General Analysis of the US State Report 7
Economic Social and Cultural Rights and ICERD 9
Race and Poverty 12
Employment 18
Public Benefits 25
Education and Discriminatory Practices 31
Health Status of Minority Women 44
5
E E x x e e c c u u t t i i v v e e S S u um mm ma a r r y y
V Vi io ol la at ti io on ns s • State and federal rollbacks of Affirmative Action programs seen across the country in
education and government contracts is a clear violation of Article 2(2), particularly
because the objectives for which they were originally intended have not been realized.
• In light of research and statistics proving welfare reform has a disproportionate negative
impact on the economic and wellbeing of ethnic/racial minorities, the US is in direct
violation of Article 5(a),(e)(i)(iv)(v).
• The US is in violation of Article 5(e)(iii) due to extremely high rates of HIVAIDS
infection of racial/ethnic minorities. The government has an obligation to use all
available resources to combat this crisis. Funding for minority targeted HIVAIDS
funding is unacceptably low considering the disproportionate number of racial/ethnic
minorities who are infected.
• Can workfare workers form Unions? If not, include as violation under employment.
• Zero Tolerance disciplinary policies in the public school system have been found to be
implemented and carried out in a discriminatory manner, which effectively violate the
right to equity before the law and are in violation of Article 5(a).
• Less than 50 years ago the US public school system was officially desegregated, yet de
facto discriminatory policies and practices persist and continue to segregate the US
school system. General Recommendation 19 invites State parties to monitor all trends,
which can give rise to racial segregation, to work for the eradication of any negative
consequences that ensue, and to describe any such action in their periodic reports. While
the US mentioned continued segregation in the school system in its report, recent court
6
rulings that weaken desegregation policies put the US at risk of being in violation of
Article 3.
Q Qu ue es st ti io on ns s f fo or r t th he e U US S D De el le eg ga at ti io on n • How will the current administration meet its obligations under Article 2(1)(c) and take
effective measures to review governmental, national and local policies, and to amend
them where needed, for discriminatory impact?
• What policy changes will this administration propose for welfare reform reauthorization
in 2002 to bring the program into compliance under ICERD and nullify its negative
disparate impact on ethnic/racial minorities and children?
• • Despite continued efforts to increase educational outcomes for minority students, little
progress has been made. What programs will be carried out through the Department of
Education that will focus primarily on eradicating gross gaps in minoritywhite
educational outcomes?
R Re ec co om mm me en nd da at ti io on ns s • ICERD General Recommendation 17 proposes that State parties establish national
commissions or other appropriate bodies to promote respect for the observance of rights
set out in Article 5. It is our recommendation that the US federal government create such
a body expressly for this purpose. This institution would have in its name reference to
the International Convention on the Elimination of All Forms of Racial Discrimination as
a means to educate the public on its existence and clearly mark its purpose. This body
would be comprised of both Office of Civil Rights staff and racial justice advocates.
Establishment of such an institution or task force would fulfill obligations under ICERD
Article 2(1)(c).
• Recognizing that racial/ethnic minorities in the US suffer disproportionately from poverty
and associated health risks, it is critical that the federal government increase funding and
7
improve the administration of social services, particularly services under Temporary
Assistance for Needy Families (TANF) legislation.
• Because human rights are not as well known as civil rights and the International
Convention on the Elimination of Racial Discrimination was just recently ratified by the
US, it is our recommendation that the office of the President issue an executive order
clarifying states’ obligations under ICERD and urge them to review their policies and
practices for racial/ethnic discrimination.
8
I n t r o d u c t i o n
1. The New York City Human Rights Working Group welcomes the first report submitted
by the United States of America (US) to the Committee on the Elimination of All Forms
of Racial Discrimination (CERD). The collaborative spirit and content of their report
demonstrates some exciting first steps the US is taking to ensure compliance with the
International Convention on the Elimination of All Forms of Racial Discrimination
(ICERD). It is our hope that the new Presidential Administration will continue to
strengthen efforts to examine and work towards challenging the causes and effects of
racial discrimination in the US as they are articulated in ICERD.
2. The overall goal of this shadow report is to provide the Committee with supplementary
information regarding the state of economic, social and cultural rights (ESC) as they are
covered under Article 5(e) of ICERD. Specifically, we will examine employment, health
care, education and public welfare benefits within the context of poverty. The
geographic focus of this report is primarily upon New York State and City compliance
with ICERD. National information will be provided as it relates to State and City issues.
This report will also be used as a tool to continue monitoring ICERD at the local level.
3. Given that men and women of color experience poverty differently, this report will give
an intersectional analysis of race, gender and (human) poverty to the extent that data is
available. Disparate impact is of particular concern in our examination as this is the
context in which economic, social & cultural rights violations most often occur, however
the general lack of disaggregated data by race restricts current analyses. In conjunction
with data inadequacies, these violations are particularly difficult to monitor within a
governmental system that is constitutionally based upon civil and political rights and state
governance.
9
G G e e n n e e r r a a l l A A n n a a l l y y s s i i s s o o f f T T h h e e U U S S S S t t a a t t e e R R e e p p o o r r t t
4. Although comprehensive in many respects, overall, the US State Report is deficient in its
analysis to fully measure compliance with the International Convention on the
Elimination of All Forms of Racial Discrimination. The inadequacy stems from a
combination of the following factors: 1) a focus on only civil and political rights, 2) a
devaluation of the role disparate impact plays in regard to racial/gender discrimination
and poverty, and 3) a lack of intersectional analysis that examines race, gender and
poverty as they directly relate to economic, social and cultural rights.
5. The US State Report as evidenced in paragraph 234 focuses almost entirely upon the civil
and political aspects of ICERD compliance making only passing mention that economic,
social and cultural rights are not recognized constitutionally.
6. When economic, social and cultural rights are mentioned in the US report, solutions to
violations in this area are addressed not through a commitment to strengthen these rights,
but rather by using the civil and political rights available, namely through the legal
system.
7. Given the increased privatization of public services and programs in both the forprofit
and religious sectors, it is increasingly important that the government considers itself
ready, willing and able to intervene in regard to private conduct beyond what is currently
“mandated by the Constitution and law of the United States” (US reservation (2) under
ICERD).
8. Over the past several years there has been an incredible push to increase funding to
private, faithbased organizations that provide social services. The cornerstone of these
faith specific funding streams is the deregulation of service provision, primarily within
the areas of health, safety, and hiring practices. A Texas nongovernmental organization
10
monitoring faithbased contracts reports that there was a 50% increase of neglect and
abuse for clients of those organizations. In the area of the billiondollar industry of
welfare privatization, state and local governments have proven slow and ineffective to
evaluate the efficacy of privatelyrun programs and to respond to private companies’
fraudulent expenditures. To our knowledge there are no comprehensive studies looking
at racial discrimination within the privatization of social services.
9. The US Report states in paragraph 71(a) that “[t]he persistence of attitudes, policies and
practices reflecting a legacy of segregation, ignorance, stereotyping, discrimination and
disparities in opportunity and achievement” is one of the causative factors effecting
implementation of ICERD. It is important to note that less than 40 years ago racial
discrimination was legally sanctioned by the US government. Civil Rights Legislation is
relatively new compared to two centuries of racial segregation and discrimination. Many,
if not most, politicians in office today grew up in a time when discrimination was the
norm.
10. In light of the fact that holding political office does not make an official immune to
“persistent” racist/sexist attitudes, our legislators and public officials are equally subject
to having these attitudes. This being said, it is clear that laws and policies are needed to
facilitate change and bring about effective remedies, rather than wait for changes in
attitudes.
11. The US in paragraph 180 of its report attempts to satisfy its obligations under article
2(1)(c) by pointing to the legislative and administrative processes in place and lists
numerous government departments as responsible for these processes. The Office of Civil
Rights has a mandate that provides some scrutiny of policies for discriminatory impact
but most federal and state departments mentioned are not responsible for ICERD
compliance.
11
12. Paragraph 248 in the State Report does not mention plans of increased funding or
permanent authorization of economic security programs such as cash and food assistance,
housing, or education. Since the 1980s there has been an overall decrease in funding for
all of these programs.
13. Keeping in mind the limitations mentioned above, there is virtually no governmental data
collected with the express purpose of examining the intersection of race, gender and
poverty. There are governmental reports that focus on each of these specific
characteristics individually, and with some overlap, but they are not sufficient for an in
depth review. In many cases when gender is mentioned in governmental reports, it is
only done so secondarily or within the context of family status. Further, data collection
and analysis performed on the national level are not replicated on either the state or local
levels, making comparisons difficult if not impossible to make.
14. While one can begin to get a sense of intersectionality through the data that does exist, it
is only a glimpse and therefore not sufficient for thorough problem/violation
identification or monitoring purposes. This limitation is a great obstacle to being able to
identify and evaluate solutions or remedies to problems/violations.
E E c c o o n n o o m m i i c c S S o o c c i i a a l l a a n n d d C C u u l l t t u u r r a a l l R R i i g g h h t t s s a a n n d d I I C C E E R R D D
15. The federal government has never guaranteed economic, social and cultural rights.
Likewise, the Supreme Court, the federal government’s highest court, does not recognize
equal access to public benefits and services even though these benefits were created
through the legislative branch of government. The “Supreme Court has held that the US
government has no affirmative constitutional duty to create the conditions necessary to
protect social and economic rights.” 1
16. Where state courts have recognized disparate impact in regard to the Fair Housing Act
(US Report paragraph 235), the US Constitution only protects against intentional
12
discrimination, not de facto discrimination 2 . The recognition of disparate impact in
regard to housing is a step forward, but it only covers one important aspect of ESC rights
and it only exists on the state level. These same provisions do not exist for education,
health, or welfare.
17. Along with state court decisions, a number of individual states have legislated, to varying
degrees, aspects of economic, social and cultural rights that include welfare, affordable
housing, health benefits, and abortions. 3 For example, Article 17 of the New York State
Constitution mandates its responsibility to provide “aid, care and support for the needy”
to be determined by the legislature. New York City even has a “right to shelter” law. In
the big picture however, without federal support, these laws are left incredibly vulnerable
and are open to persistent attack, which has been the case for New York City’s “right to
shelter” law.
18. The ESC rights cases argued before the Supreme Court have involved the Equal
Protection Clause under the 14 th Amendment of the Constitution, which is the same
Amendment used by civil rights lawyers challenging discrimination within the area of
civil and political rights. Although people of color are over represented in poverty, a
lower level of scrutiny (the “rational basis standard”) is used to test for discrimination in
cases of ECS rights. The outcome of these cases using a lower level of scrutiny to test for
discrimination has actually resulted in the denial of equal protection, and thus access, to
cash benefits, adequate housing, and education. 4
19. In paragraph 180 of the US State Report, the claim is made that economic, social and
cultural rights are fulfilled through the realization of civil and political rights.
Responding to ICERD Article 2 (1) (c), the report states that “[t]he United States satisfies
the policy review obligation of Article 2 (1) (c) through this nation’s legislative and
administrative process, as well as through court challenges brought by governmental and
private litigants. US law is under continuous legislative and administrative revision and
judicial review.” In reality, Equal Protection under the 14 th Amendment does not protect
13
these rights and in fact does just the opposite by relegating people living in poverty, who
are disproportionally people of color, to the lowest level of court scrutiny.
20. In the end, Supreme Court case law gives full discretion to the legislature to determine if
public benefits should exist at all. 5 Hence the US is clearly unwilling to acknowledge
any responsibility in this area and its response to CERD on the issue is disingenuous.
This is true especially in light of the fact that there exists indisputable, persistent and
growing economic inequality between whites and minorities, especially in the lives of
women of color and children.
21. The absence of ESC rights on the constitutional level is contrary to the spirit that all
human rights are equally important and indivisible. In his January 1995 report, Special
Rapporteur Mr. Maurice GléléAhanhanzo made a recommendation (#11) specifically
about this issue where the US was urged to acknowledge the “indissoluble link between
civil and political rights and economic and cultural rights.” 6
22. In the global context, the US is the only “industrialized” country that has not ratified the
International Convention on Economic, Social and Cultural Rights (ICESCR).
Considering that the United States is the richest country in the world, resistance to
economic, social and cultural rights is clearly not an issue of resources, but one of
political will and inflexibility rooted in a long legacy of socioeconomic and political
racism/sexism.
23. There are other instances where specific ESC rights are not even mentioned in the US
State Report. For example, there is no mention of how the right to social services is
being fulfilled. This is an outright denial of the rights articulated in Article 5 (e) of
ICERD.
14
24. The lack of commitment to ESC rights is further affirmed through the US Reservations,
Understandings, and Declarations under ICERD, specifically the reservation related to
Article 5 and the declaration of ICERD not being a “selfexecuting treaty.” 7
R R a a c c e e a a n n d d P P o o v v e e r r t t y y
25. Contemporary poverty, particularly in developed countries, is a complex and multi
layered problem. What is known, especially in the United States, is that economic
marginalization is deeply connected to racial discrimination both de jure and de facto.
For more than three centuries, racist policies and practices have been the norm in the
United States and have shaped the social and economic structures.
26. It has been no more than half a century since the United States has systemically tried to
remove racist policies from its legislation. While legal action and the changing of laws
have done much to advance the lives of racial/ethnic minorities in the US, it has not been
enough to halt the bigotry transmitted across generations.
27. A study by the International Council on Human Rights on Racial and Economic
Exclusion and its Policy Implications states, “to some extent racial discrimination and
stigma always imply economic discrimination.” 8 This same report described America as
having severe inequalities between rich and poor. What many racial/ethnic minorities
living in developed countries face, is not legally sanctioned discrimination, [but unequal
rewards for identical work] and service and unequal access to services and resources
needed for longterm development of communities and individuals. In addition, these
groups face continued stigmatization and social dislocation.
28. The ramifications of discrimination and economic marginalization are experienced in
subtle and covert ways. Unequal access to schools, housing, higher education, health
care, and social services results in less skilled, less mobile, less healthy and poorer
15
communities. It is important to note that the economic gap between dominant groups and
the minority groups has not closed and in most cases is widening.
29. Among the salient issues of stigmatization is the informal exclusion of these groups from
opportunities that are afforded the majority such as: recommendations for school and
bank loans; information about employment; and, business contracts and negotiations.
Informal exclusion and existing prejudicial attitudes underscore the need for affirmative
policies to address socioeconomic inequities.
30. This is not to say that racial/ethnic minorities in the United States have not achieved a
degree of economic and social advancement in mainstream culture. But the nature of
racial discrimination and economic marginalization is that as a group they are
significantly prevented from achieving their potential.
P P o o v v e e r r t t y y R R a a t t e e s s
31. The current federal government measure of poverty and poverty thresholds is determined
by the Census Bureau underestimates the number of people living in poverty because the
methodology is outdated for the following reasons: it does not reflect relative prices of
items that families consume; is not adjusted to reflect improvements in standards of
living; has not kept up with public opinion; and makes no adjustments for geographic
differences. 9
Poverty in the United States 1999
Black Latina/o
Asian Pacific
Islander
White Non
Hispanic
% in poverty 23.6 22.8 10.4 7.7
% of population 13 12 4 71
% within total population
living in poverty 25 23 .3 50
Poverty in The United States 1999, Current Population Reports, US Department of Commerce
16
32. Although poverty rates have declined nationally, these figures obscure the fact that white
families experienced more gains between 1997 and 1999 than either black or Hispanic
families. 10
33. The poverty rate for blacks and Hispanics is twice the national average and is 20
percentage points higher than the national average for those living in lowincome
families.
34. Between 1997 and 1999 wellbeing among white families improved in five out of seven
indicatorsfamily income, food hardship, family structure and health insurance. Black
families realized gains in ONLY one indicatoremployment.
35.
36. Despite increases in employment rates of lowincome black adults and black parents from
1997 to 1999, poverty rates of black families remained unchanged. Significant
employment gains are most likely tied to changes in the economy rather than social
policy changes such as welfare reform.
37. Black elderly women are more than three times as likely to be poor than their white
counterparts, followed by Hispanic women who are twice as likely. In 1996, 74% of the
elderly poor were women. 11
Poor and LowIncome Nonelderly by Race
% Black Latina/o White All Races
Below 100% of
poverty line in 1998
27 26 8 13
Below 200% of
poverty line in 1998
50 56 24 31
1998 National Survey of American Families

17
Child Poverty Rates by Race for 1998
% Black Latina/o White All Races
Below 100% of
poverty line in 1998
36 34 10 18
Below 150% poverty
line in 1998
13 17 4 8
Below 50% of
poverty line in 1998
52 52 18 29
US Census Bureau, March Current Population Survey
38. Child poverty rates for children of color are alarmingly high. The poverty rate of
black and Hispanic children is much higher than the poverty rate of white, non
Hispanic children.
39. When disaggregated by married couples and femaleheaded households, the gaps are
consistent. The poverty rate for children living in a white marriedcouple household
was 5% compared with 12% for blacks and 23% for Hispanic. In femalehouseholder
families with no husband present the rates are 33% for whites, 55% for blacks, and
60% for Hispanics.
F Fo oo od d I In ns se ec cu ur ri it ty y
Food Insecurity by Race from 19971999
% Black Latina/o White All Races
97 99 97 99 97 99 97 99
Below 200% of 57 56.3 56.1 53.9 43.3 38.4 49 45.6
18
poverty line
All incomes 39.4 40.1 43 40.6 19.9 17.1 25.6 23.2
40. The United States Department of Agriculture (USDA) reports that black and Hispanic
households are almost three times more likely to go hungry than white households.
Although food insecurity declined significantly nationally, this number was driven
solely by statistically significant declines in food insecurity for whites.
41. A twomonth federal inquiry into New York City’s welfare program found that city
officials routinely violate the law by denying poor people the right to apply promptly
for Food Stamps. The report by the United States Department of Agriculture states:
“substantial noncompliance with the Food Stamp Act and regulations has gone
undetected and unaddressed at the local level.” 12 The report also highlighted the
city’s failure to adequately screen families for emergency needs and mistakenly
requiring the poor to search for work before receiving help.
42. Food stamp participation decreased for black (8.5%) and Hispanic (7%) households
yet increased for white (2.3%) households between 1995 and 1997. 13
43. Four out of five legal immigrants surveyed nationwide in 1998 were “food insecure,”
a rate that is seven times that of the general population. Legal immigrant households
are ten times more likely to go hungry than general households.
44. New York has failed to use $1 billion in federal welfare funds and has actually used
federal welfare funds to balance the budget ($760.9 million). In essence, the unused
federal welfare funds intended for the poor served as a “fiscal relief” for revenue lost
through tax cuts enjoyed primarily by the State’s wealthier residents.
Remedies
19
45. Provide a constitutionally guaranteed economic security system that ensures non
discriminatory access to resources and social services, including food, education,
health care, employment, housing and other social services.
46. Provide and disseminate accurate statistics disaggregated by both race and gender and
make them widely available to facilitate intersectional analysis of race, gender and
poverty.
47. Adopt more aggressive affirmative action measures as articulated in Article 1(4) for
access to higher education and highlevel governmental posts.
48. National programs implemented at the state and local levels should be aimed at
eliminating racist prejudices rather than promoting “colorblindness” and be
undertaken in the areas outlined in Article 7, particularly acknowledging historic and
current discrimination in US History curriculum and teaching.
49. Increase the federal poverty rate based on the current cost of living.
Emp l o ymen t
ICERD Article 5 (e) (i) and (ii)
(i) “The right to work, to free choice of employment, to just and favourable
conditions of work, to protection against unemployment, to equal pay for equal
work, to just and favourable remuneration”
(ii) “The right to form and join trade unions”
50. The economic system in the United States has at its foundation a legacy of slavery
and other systems of economic exploitation that prospered by paying the majority of
workers little or no remuneration. The current economic system is in many ways still
rooted in this framework and is still dependent upon free or cheap labor. An
individual working full time earning the minimum wage earns only $10,700, which is
20
below the federal poverty line for two people. In NYC, this salary would leave just
$800 at the end of the year after paying annual fair market rent for a twobedroom
apartment in New York City. 14 The minimum wage is clearly not a livable wage.
51. Paragraph 351 of the US Report stated that trade has had a positive impact on
employment. While this may be true for the top economic quintile, it is not for those
in the middle or bottom quintiles. The North American Free Trade Agreement
(NAFTA), the largest and perhaps most far reaching trade agreement made in the last
decade, has resulted in astounding net job loss. The Economic Policy Institute and
other groups monitoring the impact of NAFTA found that almost 766,000 jobs have
been lost across the nation and 46,000 jobs have been lost in New York State. 15
These figures do not include secondary job loss from shops, businesses and services
that had previously been reliant upon the workers for their livelihood.
52. Trade is arguably the primary impetus behind the growing service sector, which
generally pays minimum wage and offers no real opportunities for advancement or
permanency. With the globalization of the economy and shifting of the labor market
across borders, it has become increasingly important to include trade in economic and
employment discussions, and it must certainly be included in an analysis of how this
shift impacts racial and gender equality.
W Wo or rk ki in ng g P Po oo or r
53. People of color are over represented in the working poor population due to pay
inequity and the segregation of people of color in low wage jobs. This situation calls
for positive measures by the state to ensure substantive equality in these areas. US
antidiscrimination measures, as described in the US state report to the ICERD, do
not adequately ensure racial justice in the labor force.
21
54. In 1997 and 1998, black and Hispanic workers in NYS earned much less than the
median wage. Hispanic males in NYS earned just 68% of the median and black
males earned 83%, while their white counterparts earned 113%. Black females
earned 91% of the median wage while Hispanic females earned 79% and white
females earned 105%. 16
Percentages of Working Poor Families with Children (199597)
US New York State
White 45.4% 38.2%
Black 23.1% 25.6%,
Hispanic 27.1% 29.5%
Other 4.4% 6.7%. Fiscal Policy Institute of New York State
55. Half of all women who work fulltime make less than $22,000 per year. 17 African
American women earn 63 percent of the white man’s dollar, and Latinas earn only 57
percent. 18
56. Median income across the country has increased by 4.6% from 19891998, yet for
New Yorkers has remained stagnant. 19 Women make up 3 out of every 5 workers in
the minimum wage workforce. New York State has the lowest minimum wage of all
the higher wage states in the country. Unemployment rates have decreased without
relative decreases in poverty. In fact, food and housing difficulties have increased.
57. Workers in NYS experienced significant wage declines from 1989 to 1998 unless
they held a college degree or higher; declines for all educational classes and both
sexes were even more severe in NYC than at the state level. Independent of their
educational attainment, individuals across racialethnic categories experienced very
different wage levels. Black males with some college education earned less than
white males with just a high school degree. Males who were black, Hispanic and of
22
other racialethnic categories earned significantly less than the median wage received
by white males for the same educational attainment. Hispanic women and women of
other racialethnic groups with college or greater education and high school or less
education also earned significantly less than the median, although the differences
between racialethnic groups were less extreme than for males. 20
58. Another area where labor rights are violated in New York City is the apparel industry,
which is the city’s largest industry. There are between 7,0007,500 factories in NYC,
most of which are located in immigrant communities of color. The Department of
Labor estimates that over 60% of them are sweatshops, even though all but 10% are
unionized. Women of color comprise the majority of sweatshop workers (6090%),
most of who are Chinese and Latina. 21
59. Wages in the NYC garment industry fell throughout the 1990s. In Chinatown, wages
fell 30% over the last half of the 1990s. Although the federal minimum wage is $5.15
per hour and the union’s minimum wage ranges from $6.72$8.15, garment workers
earn anywhere between $2$6 dollars per hour. A typical workweek is 67 days, 10
12 hours per day. A strategy used by apparel factories to avoid paying or being held
liable for health, safety, and wage violations is to close down the factory, then set up
again under a new name. 22
U Un ne em mp pl lo oy ym me en nt t
60. While general unemployment among people of color is down, discrimination and
exploitation have not necessarily decreased. In fact, domestic structural adjustment
programs such as cutbacks in civil service jobs and welfare reform, as well as general
labor market trends (like the expansion of the lowwage service sector) have
increased the exploitation of people of color. For example, antidiscrimination and
affirmative action policies within the civil service sector have made this labor market
one of the primary venues where people of color, particularly women, have been able

23
to move into the middle class. Cut backs in these jobs severely limit this opportunity
since these protections are not guaranteed in the private sector.
61. There is a basic lack of living wage jobs in urban communities of color, where
unemployment rates are as much as three times national average. Even if national
trends show decreasing rates of unemployment for people of color, violations of the
right to work persist in local communities of color where barriers to employment such
as lack of transportation and childcare exist.
62. Rates of unemployment and underemployment for young adults with a high school
diploma or less are much higher in NYC than in the nation as a whole. Blacks
experienced far higher levels of both un and underemployment regardless of gender
and level of education. 23 In the Harlem section of New York City, a historic African
American neighborhood, the ratio of available jobs to applicants was 1 to14. 24
63. New York State’s unemployment rate for black men in the first half of 1999 was
12.5% compared to the national average of 4.4% and to white men at 4.0%. Black
and Latina women faced unemployment rates three times higher than the 3.8% white
female unemployment rate. 25
64. In New York State, 10.2% of the workforce was underemployed in 1998 compared to
8.5% nationally. Black men in New York City had an underemployment rate of
20.3%, more than twice the underemployment rate for all men citywide. Latina
women had the next highest rate at 19.3%, and black women had an 18%
underemployment rate. 26 These rates suggest that job growth has not been sufficient
to keep up with workers’ needs, and specifically those of workers of color.
65. Contrary to all aspects of the right to work articulated in ICERD, the US government
legislated, with the passage of federal welfare reform in 1996, the creation of an
unpaid labor workforce. Welfare reform laws require the majority of impoverished
24
people who receive welfare benefits to work off the amount they receive in benefits
(workfare). Economists have found that the presence of such a large unpaid
workforce will, and has, served to depreciate the wages of everyone.
66. The workfare program not only lowers wages, it also replaces union jobs. For
example, in NYC, the city government who is the largest “employer” of workfare
workers has filled onethird of its Sanitation Department and twothirds of its Parks
Department with unpaid workers. Workfare wokers are performing jobs once done
by union paid workers but without equivalent health, safety or benefit provisions.
Workfare workers receive between $5,000$12,000 per year “working” for the city
performing the same jobs of civil servants who earn/ed $20,000$40,000 per year. 27
67. Discrimination in the workforce continues to disadvantage people of color. A study
that interviewed employment service providers in 45 states found widespread
discrimination against welfare recipients based on race and ethnicity. 28
Discrimination based on previous incarceration is also problematic for people of
color. Over onethird of all young black men and a majority of young black male high
school dropouts are involved with the criminal justice system at any point in time.
R eme d i e s
68. Increase the federal minimum wage and base it on geographical and realistic cost of
living variations including housing, food, healthcare, transportation, care giving costs,
and utilities.
69. Include monitoring systems to ensure compliance and strong sanction provisions for
employers who do not comply with particular attention to sweatshop factories.
70. Create a federal public works program guaranteeing paid employment for every US
resident unable to find wage work.
25
71. Close the wage gap between men and women of color and whites. Enact stronger
enforcement mechanisms ensure wage equality.
72. Recognize the full range of “women’s work” including care giving and home making.
Expand worker benefits and rewards to include this category of work, such as earned
income tax credits and social security.
73. The US should not become party to any bi/multilateral trade agreements nor trade
organizations that do not have within the body of the main negotiating text
enforceable human rights standards. These human rights standards should include all
rights articulated by the United Nations as well as Programmes of Action from
relevant world conferences and summits.
P u b l i c B e n e f i t s
ICERD 5 (e) (iv) The right to public health, medical care, social security and social
services 1
B Ba ac ck kg gr ro ou un nd d
74. The US has witnessed the development of a variety of social welfare programs that
cover a broad range of basic human needs, such as cash, food, housing and medical
assistance both at the federal and state government levels. While these, and other
social service programs, have set precedents of federal and state governments
responsibility for the distribution of resources that enable residents to fulfill their
basic needs, the US does not recognize this obligation through national or
international laws. The lack of a legal support structure puts the existence and equal
accessibility of these programs in jeopardy.
75. The history of public benefits has always been intertwined with racism and sexism,
often cloaked in notions of the “deserving” and “undeserving” poor based on moral
26
rectitude and “middle class” values (i.e. the experiences, perspectives and ideologies
of whites, and specifically, white men). These trends are historically clear in the
stated goals of public benefit programs, their arbitrary eligibility rules, and their
punitive implementation. The result has been that people of color have had little,
inconsistent, and unequal access to governmental public benefit/social service
programs. When access is possible, service recipients, and particularly people of
color, are often treated with contempt.
76. When public benefits were first legislated, people of color, specifically blacks, were
excluded from receiving benefits through de facto policies that prohibited the
eligibility of domestic and agricultural workers. At the time, the vast majority of
blacks worked within these fields and was thus excluded from the program. This
same kind of racist and sexist de facto exclusion from public benefits persists to this
day, albeit within a different economy.
77. It was not until the1960s that people of color had gained access to welfare benefit
programs—one of the hard won victories of the 1960 era civil rights movements.
The 1960s and 1970s saw an expansion of the federal welfare state and a correlative
decrease in hunger and poverty. 29 This changed during the 1980s when President
Reagan began decentralizing government programs by transforming a once federally
run program into a staterun block grant program.
78. As more programs became decentralized during the 1980s and 1990s, racist and
sexist stereotypes were again instrumental in shaping public perceptions about public
benefits. This spurred the “end welfare as we know it” campaign echoed by almost
every public official. Based on racist and sexist stereotypes, the idea of the (black
and unwed) “welfare queen” along with her “lazy” boyfriend getting a “free ride” off
the system was no longer politically tolerable. This rhetoric was at the base of the
1996 federal welfare reform.
1 Public benefits and welfare are used interchangeably and refer to “social security and social services” in their
27
79. The power of stereotyping in the world of policy making cannot be underestimated,
as it is “the public,” with these perceptions, who vote officials into office. Recent
polls cited by the Poverty & Race Research Action Council found that whites felt that
African Americans “are less likely than whites to prefer to be selfsupporting” and in
another poll, where the majority of respondents were white, respondents felt that
“lack of effort was to blame for people being on welfare and that most welfare
recipients did not really want to work.” Almost half of respondents think that the
majority of people receiving welfare are black.
80. The 1996 federal reform entirely dismantled one of the most important public benefit
programs in the US. It took away the entitlement aspect of welfare, introduced
lifetime time limits (5 years for families, 2 years for singles), excluded entire classes
of legal immigrants, and in some states, permanently disqualified drug felony
offenders from ever being able to receive benefits. Also part of this reform was an
extreme focus on reducing outofwedlock births and abortions as well as increasing
marriage among the poor. On the surface, these policies and their stated goals might
seem reasonable, but taken in context of the larger assumptions being made about
poor people and invasions considered acceptable in the lives of poor, these policies
are reprehensible. During the 1996 welfare reform debates, Congressional members
likened welfare recipients to “alligators and wolves,” and associated public benefits
with “sloth, illegitimacy, and drug abuse.” 30
81. In New York City, little thought was put into the City’s welfare reforms beyond the
primary goal of diverting applicants from applying. Jason Turner, Commissioner of
the city’s welfare agency stated, “We didn’t do any lengthy planning [with reforms],
followed by implementation. Instead we acted first and worried about the
consequences later, and it seems to have worked with us.” 31 This “act first think
later” attitude has resulted in a deluge of lawsuits against the city. In cases where
broad sense, not as they are necessarily defined in the US
28
advocates have won, the city continues to deny human rights by failing to comply
with the court decision. There have been several court cases on this issue. 32
I Im mp pl le em me en nt ta at ti io on n & & I Im mp pa ac ct t o of f W We el lf fa ar re e R Re ef fo or rm m
82. After federal welfare reform, many “legal” immigrants were no longer eligible for the
Food Stamp Program 900,000 nationwide and 147,000 in NYS. Although some of
these benefits have been restored through a subsequent 1998 Federal Act, it is
estimated that 53,500 legal immigrants living in New York State are still ineligible
for Food Stamps. 33 Welfare reform in New York City has been especially drastic.
With the emphasis on diversion and workfare, the caseloads have dropped by 50%.
Additionally, two years after welfare reform in New York City, roughly 13,000
college students were forced to drop out of school to comply with work requirements,
which often conflict with class and study schedules. 34 Considering that blacks and
Hispanics, specifically women, are more likely to be poor and in need of public
benefits, restrictive access to welfare benefits has a disproportionate impact on people
of color, and specifically on women of color.
83. The United States Department of Agriculture investigated the New York City welfare
system and found numerous federal violations related to illegal diversionary practices
including preventing applicants from filing an application the first day they enter the
welfare office; referring applicants to food pantries instead of reviewing them for
emergency benefit qualification; requiring applicants to search for employment
before receiving food assistance; and welfare workers pressuring applicants to
withdraw their applications. 35
84. There is startling evidence that people of color suffer discriminatory practices within
local welfare offices where workers wield considerable discretion. One study found a
consistent pattern within the State of Illinois, where whites (almost 50%) were more
likely to be referred to educational programs than blacks (18%). 36 Given that 87% of
former welfare recipients in New York State who receive a college diploma never
29
return to welfare, 37 this practice has profound repercussions in regard to economic
segregation of people of color.
85. The welfare grant in NYC has not increased over the last ten years and leaves a
family of three at 47% of the federal poverty level (with Food Stamps, 70%), which is
$14,630 a year. 38
86. In New York City, people of color are more likely to leave the rolls because of
sanctions (failure to comply with an aspect of the process), a pattern that is also true
nationally. 39 Additionally, people of color are also less likely to know why their case
was closed, which makes it more difficult to find legal redress. States with high
numbers of black and Latina/o residency have harsher forms of sanctions for those
who do not comply with welfare center requirements, which are onerous and
confusing. 40
87. Two class action lawsuits, Reynolds v. Giuliani and Henrietta v. Turner, found the
city welfare administration to be in violation of the law. The lawsuits placed two
divisions of welfare offices (Job Centers and Division of AIDS Services) under the
oversight of the court. 41 In New York City, welfare applicants/recipients can file an
administrative fair hearing if they disagree with a decision made by the welfare
office. More than 80% of claimants win their case. This number points to the
arbitrary and erroneous decisionmaking process at welfare centers. 42
88. Along with fair hearings, welfare applicants/recipients can also file a formal
complaint against the welfare center. Complaints range from changes in case file
without notice, to rude and discriminatory behavior on the part of caseworkers,
including lack of bilingual staff and interpretative services. 43 The welfare
administration is required by law to formally respond to each complaint within 20
days. Over 5,000 complaints have been filed against the city welfare administration
30
between 1998 and 2001, yet the city has formally responded to less than 5 of those
complaints.
R R e e m m e e d d i i e e s s
89. Create a constitutionally guaranteed economic security program where grants for
cash, food, housing, health, education, training, care giving, and transportation
assistance are provided based on a streamlined and graduated income meanstest.
There shall be no citizenship status requirements.
90. No persons shall live below 300% of the poverty level. Variations in geographical
costs of living should be included in the calculation.
91. There should be specific measures ensuring equal access to and receipt of all benefits.
Administering bodies should collect data by race, gender and other characteristics and
regularly report their findings to the public.
92. Receipt of benefits should not be attached to mandated work requirements (workfare).
93. All application and informational materials should be disseminated in every public
institution and made available in all relevant languages.
E E d d u u c c a a t t i i o o n n a a n n d d D D i i s s c c r r i i m m i i n n a a t t o o r r y y P P r r a a c c t t i i c c e e s s
ICERD 5 (e) (v) The right to education and training
94. Half a century after the Supreme Court ruling that concluded that de jure school
segregation was unconstitutional and “inherently unequal,” the United States
continues to face a school system that is both segregated and unequal. Although the
31
laws have changed, the practices of de facto discrimination persist. White children
consistently have better educational outcomes and enroll in higher education more
often than minorities. A number of institutional barriers including school budgets and
funding channels, teacher lowwages, and minimal federal oversight have contributed
to this phenomena but other factors such as low student expectations, criminalization
of youth of color, and low levels of leadership are also important variables. Access to
quality and equitable education is central to equality of opportunity and any obstacles
to achieving this should be seen as a violation of human rights.
S S e e g g r r e e g g a a t t i i o o n n
95. The 1990s witnessed several judicial blows to desegregation efforts. Despite
evidence of intensified segregation, there were three major Supreme Court decisions
authorizing a return to segregated neighborhood schools and limiting the reach and
duration of desegregation orders.” 44
96. Schools in the central metropolitan areas, where housing is seriously segregated, have
become increasingly nonwhite and overwhelmingly poor.
97. Segregation by language, particularly Spanish speakers, is also extremely high. A
1993 study found that Limited English Proficient (LEP) students were in schools with
more than ten times the concentration of LEP students than majority English speaking
schools. As Latinos become the largest minority group in the US, school segregation
by language is increasingly important. 45
98. Even as Latinos register higher dropout rates than any other ethnic group due to a
number of factors including segregation to low quality schools, they are concentrated
in states where effective remedies such as Affirmative Action for college have been
made illegal (California, Texas, and Florida).

32
Ra c i a l C ompo s i t i o n o f S c h o o l s A t t e n d e d b y t h e A v e r a g e S t u d e n t
o f E a c h R a c e , 1 9 9 8 9 9
% of Race in Each
School
White
Students
Black
Students
Latino
Students
Asian
Students
Native
American
Students
White 80.6 31.7 29.1 46.3 49.7
Black 8.7 54.6 12.0 12.2 7.0
Latino 6.9 10.5 53.2 18.7 9.8
Asian 2.9 2.8 4.9 22.1 2.5
Native American 0.9 0.5 0.8 0.7 31.0
Total 100 100 100 100 100
Source: 9899 NCES Common Core of Data and computations by Harvard Project on
School Desegregation
99. The above data show the numeric prevalence of segregation. White students attend
schools where 81% of the other students are also white compared to Black and Latino
students who attend schools that are more mixed. Despite these numbers, in 1991,
the courts have declared that school districts which have sufficiently implemented
their desegregation court orders could be released from these orders and be free to
assign students to neighborhood schools that are segregated as a result of residential
patterns.
100. High concentrations of poverty in schools only complicate the problem of
segregation. Of schools that are attended mostly by whites, 19.6% of the student
body is poor; by comparison that rate is 39.3% for predominantly black schools and
44% for Latinos and 35.1% for Native Americans.
E E d d u u c c a a t t i i o o n n a a l l o o u u t t c c o o m m e e s s
33
101. The 1990s have seen serious growth in the racial gaps between achievement and high
school graduation rates yet racial minorities are still at the bottom end of educational
outcomes. Despite recent federal and state policies including Title I and Bilingual
Education Funds, minority students register the highest dropout rates and lowest test
scores.
102. In the mid 1990s about half of the high schools in the largest cities of the US were
graduating less than 50 percent of their students, and these students were
overwhelmingly in segregated minority schools. In 1998, white students between the
ages of 16 and 24 had a dropout rate of 7.7 percent compared to 13.8 percent for
black students, and 29.5 percent for Latinos. 46
103. High dropout rates can often lead to incarceration, health problems and longterm
poverty. The unemployment rate for dropouts was 75% higher than for graduates.
Student dropouts have been attributed to several factors including mobility, student
engagement, and social and academic experiences of students; rarely is dropping out
solely a result of academic failure. The US government has provided monies to help
with dropout prevention programs but these programs have been largely unsuccessful
in bridging the academic gaps across race.
104. Compared with white children, blacks scored lower on mathematics and reading tests
at every grade level studied between 112. Gaps were usually similar in size for both
boys and girls.
S S c c h h o o o o l l F F i i n n a a n n c c e e
105. The school financing system relies primarily on the funding a school district can raise
from property taxes. Consequently, the total amount of revenue available to fund the
provision of educational services within school districts depends largely upon the
amount of taxable wealth that exists within individual school districts. The high

34
minority districts have far less wealth within their borders with which to support their
schools than do neighboring lowminority districts.
106. Despite inequitable funding is allocation, all schools are held accountable to standard
state and federal measures, and are penalized for not meeting the standards despite
resource inadequacies.
107. On January 10, 2001, the Campaign for Fiscal Equity won a lawsuit against the state
of New York finding the financing system unconstitutional and disproportionately
impacting minority students. The state was ordered to reform the system quickly but
reforms have not yet occurred. 47
108. The discriminatory features of the state’s system for financing education includes
differential expenditures on instructional expenses; primary reliance upon local
property taxes to finance educational services; use of "transition adjustments" to the
state aid formula; and reliance upon attendance rather than enrollment figures in
calculating state aid. The funding structure of the educational system significantly
limits the ability of highminority districts to raise the level of educational
expenditures for their students
109. In New York State, although students attending schools in the highracial/ethnic
minority districts tend to have the greatest educational needs, in every high
racial/ethnic minority district that exists outside New York City, the state is spending
significantly less money on instructional expenses for generaleducation students than
they are spending on similar students in neighboring lowminority districts. 48
Ironically, the largest part of the state’s education budget is comprised of revenue
raised by local school districts .
Z Z e e r r o o T T o o l l e e r r a a n n c c e e 4 49 9
35
110. Zero Tolerance refers to school disciplinary sanction policies passed by state
legislatures and Congress that are meant to end dangerous and criminal behavior in
schools by expelling and suspending students who engage in such conduct. However,
these policies have been extend
111. ed to include other behaviors that are not necessarily safety concerns, and are then
used to discipline a wide variety of actions including nonviolent offenses of
"disobeying rules," "insubordination," and "disruption."
112. National and multistate studies have shown that black and Hispanic students are
disciplined more often and more harshly than white students, and that Zero Tolerance
policies are more likely to exist in predominantly black and Latino school districts.
The increased expulsion and suspension of black and Latino students has an adverse
impact on their education that white students are less likely to encounter.
113. Students of color are more likely than whites to be referred for subjective infractions
such as "defiance of authority." When teachers and other school officials responsible
for reporting disciplinary infractions are more prone to identify violations by students
of color than by white students misconduct by white students goes unreported.
Consequently, proving that students of color are treated differently than similarly
situated white students may be impossible since those white students are never
referred for any disciplinary action.
114. Despite these limitations, the legal protections against intentional racial
discrimination are valuable especially in cases where other evidence of racial animus
on the part of school officials exists, such as use of racial epithets or tolerance of a
racially hostile environment.
115. The overwhelming weight of research on child development and education policy
indicates that harsh, inflexible school discipline practices, extending well beyond

36
serious weapons and drugs, are not educationally sound and do not improve school
safety.
116. The Office for Civil Rights (OCR) of the US Department of Education is responsible
for enforcing Title VI. Unfortunately, it does not appear that OCR is vigorously
applying the adverse impact doctrine in its complaint investigations and findings.
117. The cases that have been reviewed do not reveal that OCR has seriously considered
whether harsh disciplinary systems actually serve school safety, a required element of
"educational necessity." Furthermore, OCR case files do not indicate much attention
to alternative disciplinary systems that could equally serve educational and safety
goals with a less discriminatory impact. And while OCR has authority to initiate
investigations without waiting for complaints, OCR has not used this power even to
look at the educational justification for the disciplinary practices of school systems
with the most egregious racial disparities.
118. Last year, in Jefferson County, Florida, a small, predominantly black school district,
43 % of the high school students and 31 % of middle school students were suspended
at least once. 11 Chicago Public Schools have experienced a dramatic increase in the
number of expulsions where AfricanAmerican students represent 73% of those
expelled but only 53% of student enrollment, and Latino students represent 20% of
students expelled. 14 And despite the disturbing situation in Chicago, the school
district set a goal of expelling even more students during the 19992000 school year. 15
119. Fortyone states require schools to report students to law enforcement agencies for
various conduct committed in school. The growing involvement of law enforcement
agencies in the discipline of students for nonviolent conduct in school raises several
concerns about students’ rights. In many instances, students are arrested and taken
from school without prior notification to parents.

37
120. Unfortunately, data collection is inconsistent and, in some instances, unreliable. In
addition, many State Departments of Education, responsible for the collection and
reporting of data, do not make data readily accessible. Many States require that
persons or organizations seeking discipline data be "cleared" to obtain such data.
R R e e m m e e d d i i e e s s
121. Provide and earmark funds to improve educational outcomes in interracial schools.
122. Equalize finances among school districts with federal mandates for per public
expenditures.
123. The federal government must provide funding and flexibility for prevention programs
geared toward racial minorities that include a range of services such as community
school collaborations, additional structural resources, and comprehensive trainings for
teachers and staff.
124. Increase funding for affirmative action at the federal level.
125. Increase access to and number of field offices of the Office of Civil Rights.
126. Schools should monitor disciplinary referrals by teachers to ensure fair application of
disciplinary codes.
127. The Department of Education should require all school districts receiving federal aid to
provide more comprehensive civil rights compliance data, including data on disciplinary
actions taken by offense, with the race and disability status of the child, and information
on referrals to law enforcement agencies for inschool conduct.
128. The General Accounting Office should study OCR’s work on race and disability
discrimination in the student discipline arena, with special attention to the effectiveness
38
of public education and technical assistance, the clarity and consistency of internal
policies, and the length of time for investigations.
H e a l t h S t a t u s o f M i n o r i t y Women
ICERD 5 (e) (iv) The right to public health, medical care, social security and social services
129. The United States is one of the only industrialized countries that fails to provide its
citizens with universal health care. Despite a highly advanced system of care, only a
small population have the financial means to enjoy its advantages. The three main
systems of access to health care are private employerbased insurance, federally provided
insurance (Medicaid), and care for those over age 65 (Medicare).
130. Because racial/ethnic minorities are disproportionately represented in employment that
does not provide health insurance, they are least likely to access quality health care. As a
result of this lack of access, racial minorities suffer from higher mortality rates and
chronic diseases. This situation uniquely impacts specific populations, including women,
children, and those with additional barriers to equal opportunities.
131. Several international treaties recognize the right to health care. ICERD specifically
requires State Parties to guarantee everyone, without distinction to race, color, or national
or ethnic origin, the right to public health, medical care, social security and social
services. 50 As a State Party, the United States is obligated to fulfill the rights under
ICERD but has failed to meet its obligations to eliminate racial discrimination as a barrier
in achieving the right to health.
132. The United States State Department in paragraph 376 recognizes in its report submitted
to CERD that there exist “significant disparities with regard to certain health measures.”
This acknowledgment is insufficient when disparities are growing larger as a result of
current and developing health and social welfare policies. Notwithstanding the federal
39
programs to eliminate disparities, listed in the US report, the purpose of this report is to
illuminate the inadequacies in the administration of health care. 51
133. Discrimination in the administration of health care in the US particularly affects minority
women. The experience of minority women in New York City mirrors the national
situation described in a May 2000 study by the Office of Women’s Health of the US
Department of Health and Human Services entitled, “The Health of Minority Women.”
(hereinafter “US Study”).
134. Although these [minority] women experience many of the same health problems as white
women, as a group, they are in poorer health, use fewer health services, and continue to
suffer disproportionately from premature death, disease, and disabilities.
135. As a result of diversity, minority women’s access to health care, their health behaviors,
and their health status can vary widely between racial/ethnic groups. For example,
minority women who have recently emigrated to America face more obstacles to
accessing health care than any other minority women in their group. The health status of
women within the four major minority groups may also differ significantly, depending on
income, education, and acculturation.
136. The US Study has identified many barriers limiting access to health care for minority
women. Such obstacles include inadequate numbers of primary care physicians which
cause women to seek care in highvolume facilities where physicians spend less time
with patients and provide less preventative care counseling, the misreporting of the race
and ethnicity of women in many medical research studies, and too few women and
minorities in health care fields which leads to insensitivity to the needs and preferences of
minority women.
137. Regarding medical research studies, the US Study’s finding that “data are typically
gathered from a limited number of subgroups, and then the conclusions are
40
erroneously applied to the entire minority group,” demonstrates that an intersectional
approach in such studies would apply particular data to particular subgroups.
138. Economic barriers to health care for minority women identified by the US Study
include the greater likelihood that minority women will have lower incomes and live
in poverty than white women. Further, minority women hold a disproportionate share
of lowwage jobs, and that more minority women than white women are uninsured or
rely on public health insurance such as Medicaid and Medicare. According to the US
Study, benefits from such public programs are limited and frequently do not meet all
minority women’s health care needs.
139. The US study found that minority women are more likely than white women to die of
certain illnesses and that certain health problems occur more frequently in minority
women. The authors of the study further asserted that “[a]lthough these important
disparities have been identified, we do not know all the reasons why women’s disease
risks and mortality rates vary by race and ethnicity.” The US is obligated under ICERD
to determine the reasons for such a disparity.
U U n n i i n n s s u u r r e e d d
140. In paragraph 71(1) of its report submitted to CERD, the United States State Department
recognizes that persons belonging to minority groups tend to have less adequate access to
health insurance and health care.
141. Many New York City residents face a health care crisis in that the care is not reliable or
meaningful. Twentyeight percent of working age adults in the city are uninsured. The
uninsured rates among the City’s minority adults ages 18 to 64 are 50 percent higher than
among white, nonLatino adults. 52
142.
143. In addition, New York City has one of the lowest rates among MSA’s of jobbased
coverage. Ethnicity was identified as a factor that distinguishes high from lowcoverage
MSA’s. “Given the enormous inequalities in US society and the high rates of poverty
41
among Latinos, it is not surprising that MSA’s with low rates of jobbased coverage have
a larger proportion of Latinos … and a smaller proportion of nonLatino whites.” 53
M M e e d d i i c c a a i i d d
144. Medicaid is the federal safety net medical insurance program for the nation’s poor. As a
result of welfare reform in 1996, Medicaid participation for poor children has dropped for
the first time in a decade. Almost 30% of the city’s residents under 65 years of age lack
insurance. 54
145. An investigation by the federal and state governments revealed that city welfare workers
fail to comply with federal law, which requires welfare workers to distribute Medicaid
applications without delay. On more than one occasion, undercover state investigators
were told by city workers that they would have to return on another day to apply for
Medicaid. 55
E E m m e e r r g g e e n n c c y y R R o o o o m m U U s s e e
146. The replacement of primary care with emergency room care is one consequence for many
uninsured people. Uninsured patients have no other choice when health is at risk but to
visit emergency rooms. This reliance, however, means costly (outofpocket) care and no
continuity. In a recent study of emergency room care in New York City, the
Commonwealth Fund found of the 669 patients surveyed at four hospitals in the Bronx
section of New York City, 60 % were Latino, 29% black, and 10% white. This reflects a
huge racial disparity among those seeking emergency room care where doctors often
have little time to educate families on how to control disease, chronic conditions, and
where there is little followup care. 56
146. The problem of asthma care, among New York City’s poor children, illustrates this
dilemma. A team at the Center for Children’s Health and the Environment at New York
City’s Mt. Sinai School of Medicine has determined that hospitalization rates for children
with asthma were as much as 21 times higher in poor neighborhoods in the city as
compared to more affluent communities. In the neighborhood of lower East Harlem (in
42
the 10029 ZIP code) the rate of hospitalization was 22.28 per 10,000, per year. In five
highincome ZIP codesthe rate was zero. 57
R R a a c c i i a a l l D D i i s s c c r r i i m m i i n n a a t t i i o o n n b b y y P P r r o o v v i i d d e e r r s s
147. A report by the office of Bronx Borough President Fernando Ferrer found that “racial
discrimination may play its own role in cases where physicians or providers provide
unequal care to people of different races.” 58 The report refers to studies that found such
discrimination where “[t]he results are disturbing and demonstrate that physicians look
beyond the information provided by a patient when making a medical assessment.” 59
148. For example, one study found that white men were referred for more aggressive workup
and intervention, the African American men less so, the white women still less, and the
AfricanAmerican women even less. 60 This indicates the unique situation of minority
women, in particular, who are often subjected to discrimination more so than any other
population.
43
H H I I V V a a n n d d A A I I D D S S
149. Although the global HIVAIDS crisis has made significant advances in treatment and
prevention, the newest numbers in the United States show that infection rates for
minorities, especially women, are growing.
150. Of the AIDS cased reported by Center for Disease Control (CDC) through 1999, black
and Latino adults and adolescents accounted for 67% of the total, 77% of the women,
79% of heterosexuals, and 82% of the children. These numbers prove that blacks and
Latinos account for a disproportionate share of AIDS cases particularly for women and
children. Black women make up 57% of women cases, Latinas make up 20%.
151. In New York City it is estimated that 44,994 thousand people are living with AIDS, and
of those, 9,285 are white, 19,994 are black, and 15,121 are Latino, 361 are Asian, and 24
are American Indian.
152. New York welfare policies have special housing programs for AIDS infected persons but
often these services are either not provided or are rendered in a way that is
discriminatory. A dramatic example of federal intervention (to hold the city
administration to federal standards) is the legal case (Henrietta vs. Giuliani) which
resulted in the placement of the city’s Division of AIDS Services, the city’s agency for
poor New Yorker’s with AIDS, under federal authority. The federal judge in this case
ruled that the city “chronically and systematically” delayed and terminated benefits to
thousands of people with AIDS in error. 61
C C a a n n c c e e r r
153. The US Report to CERD makes women of color invisible in its section on health. The
only numbers that reflect the health status of women are infant mortality and maternal
mortality. The report does not reflect that women suffer from health problems that are
unique from those of men, both biologically and in terms of access to care and
diagnosis. 62
44
154. While white women have higher incidence rates of breast cancer than women of other
ethnic or racial groups, African American women have a higher mortality rate than white
women. This discrepancy is primarily due to African American women’s later diagnoses
in less treatable stages of the cancer. 63
155. In regard to cervical cancer among women, Vietnamese women suffer from the highest
incidence rate. But again, African American women have the highest mortality rate,
followed by Latinas. 64
156. Aside from the startling mortality statistics for certain groups of women, it is also
problematic that the New York State Department of Health, on its public website, does
not disaggregate female cancer statistics by race.
D D i i a a b b e e t t e e s s
157. The New York State Department of Health reported that through 1995, “nonHispanic
black women” have the highest prevalence of diabetes. This gender breakdown was not
reported by the US, but rather simply reported that diabetes is higher for Hispanics,
Native Americans, and blacks.
H H e e a a r r t t D D i i s s e e a a s s e e
158. Coronary heart disease (CHD) is the leading cause of death for African American women
in New York State. In fact, the death rate for African American women under age 75 is
71% higher than for white women. 65
159. Heart disease is also slightly higher among AfricanAmerican men that white men. The
New York State Department of Health reports that “CHD incidence and mortality rates
go up as socioeconomic status goes down.” This relationship between status and heart
disease impacts minority groups greatly.
P P u u b b l l i i c c B B e e n n e e f f i i t t s s a a n n d d H H e e a a l l t t h h
45
160. The overwhelming majority of those receiving public assistance in New York City are
people of color, most of who are children under the age of 18. In 1999, New York City’s
TANF (the federal cash welfare program for adults with children) caseload was 54%
Latino, 39% African American, 5% white, and 2% Asian. 66
161. The welfare policies of New York City’s government have resulted in the large numbers
of poor people of color being denied desperately needed public benefits and suffering
undue health crises.
162. A recent national study shows that women (and their children) who are on welfare have
substantially higher rates of physical and mental health problems than did national
samples of women and children. In addition, their health problems were often multiple
and severe. 67
163. The study also found that women with multiple health problems (and women who had
been physically abused) were more likely than other women to have been sanctioned (cut
of benefits) by the welfare agency in the previous year.
164. The study concluded that women's health problems, and those of their children's,
constrain their entry into the workforce and ability to remain there. This directly impacts
their ability to comply with participation requirements, which raises troubling questions
about sanctioning policies.
165. The following is testimony of a young woman taken by the Urban Justice CenterHuman
Rights Project highlighting the health risks faced by pregnant women attempting to
navigate New York City’s welfare system. The woman is 19 years old and six months
pregnant. She had tried to reapply for food stamps for two weeks to no avail.
“After two weeks I didn’t have any money, no lunch money. I told them
‘How do you expect pregnant females to come here and look for
jobs…and you don’t give us lunch money? I’m hungry and I don’t have
any money.’ Then I spoke to the supervisor. She said, ‘Do you feel all
46
rights?’ I said, ‘No. I’m hungry.’ She said, ‘Drink some water it will
make you feel better.’ There were two pregnant women like me, six
months pregnant [in the Job Search] program. We would put our money
together. We would buy a roll and coffee just to fill us up.”
Remedies
166. Medicaid and social welfare programs tied to public benefits must be reviewed for equal
access and discriminatory practices by state actors.
167. Access to health insurance in the United States has a direct relationship to socioeconomic
status. Articles 1(1) and 2(2) specifically address economic and social rights as
guarantees under ICERD. The United States cannot these ignore disparities.
168. Differences in race, ethnicity, and gender among racial subgroups must be considered in
developing a national nondiscriminatory health care policy and ensuring such
compliance with such policy at the state and local level.
169. The federal government should monitor the administration of public benefits at a local
level, particularly the Food Stamp Program that is vitally connected to the right to health.
170. The US should repeal the Personal Responsibility and Work Reconciliation Act (“welfare
reform”). The provisions of the act, as well as the implementation of the act, cause the
elimination of Medicaid for many minority populations and result in increased health
problems.
171. Although not explored in this report, private providers of healthcare must be required to
operate with the same commitment to racial equality as the federal government, both as a
practical matter and as an obligation of the US under ICERD.
1 Hunger is No Accident: New York and Federal Welfare Polices Violated the Human Right to Food. Human Rights Project of the Urban Justice Center, New York, NY. This Shadow Report contains significant information from Hunger is No Accident. From this point forward in the endnotes, it will be referred to as “HNA.”
47
See also Harris v. McRae, 448 US 297 (1980). 2 HNA see note 1. 34 UCLA L. Rev. 1195 *1199, Copyright 1987 by the Regents of the University of California; Ann I. Park. 44 Hastings L.J. 79 *95, Copyright 1992 by the Hastings College of the Law; Barbara Stark. 3 ibid. 4 34 UCLA L. Rev. 1195 *1199, Copyright 1987 by the Regents of the University of California; Ann I. Park. Some of these Supreme Court Lawsuits include Dandridge v. Williams, 397 U.S. 471 (1970), Jefferson v. Hackney 406 U.S. 535 (1972), Lindsey v. Normet, 405 U.S. 56, 74 (1972), Martinez v. Bynum, 461 U.S. 321, 34041 n.7 (1983), and San Antonio Indep. School District v. Rodriguez, 411 U.S. 1, 35 (1973). 5 HNA see note 1. 6 Report by Mr. Marurice GléléAhanhanzo, Special Rapportuer on contemporary forms of racism, racial discrimination, xenophobia and related intolerance on his mission to the United States of America from 9 to 22 October 1944, submitted pursuant to Commission on human Rights resolutions 1993/20 and 1994/64 E/CN.4/1995/78/Add.1, 16 January 1995 7 US Report, Annex I, Paragraph 2, III. 8 Racial and Economic Exclusion: Policy Implications. International Council on Human Rights. May 2001 9 [www.epinet.org/issueguides/poverty/povertyfaq/html] 10 Sarah Staveteig & Alyssa Wigton. Key Findings by Race and Ethnicity: Findings from the National Survey of America’s Families. Urban Institute, Washington DC. 11 Women Fighting Poverty conference VII, New York, NY 12 New York Times, “US Audit is Said to Criticize Guliani’s Strict Welfare Plan,” 1/20/99, Rachel Swarns and New York Times, “State Officials Add to US Criticism of NYC Food Stamp Program,” 1/21/99, Rachel Swarns. 13 HNA 14 HNA see note 1. 15 Economic policy Institute, “NAFTA At Seven: It’s impact on workers in all three nations. Washington DC. 16 “Hardships in America: The Real Story of Working Families,” Fiscal Policy Institute, NY. 17 Women Fighting Poverty Conference VII, New York, NY 18 ibid. 19 “Balancing Revenues, Expenditures, and Human Needs in the 21 st Century,” Fiscal Policy Institute, NY. 20 Ibid. 21 “Treated Like Slaves: Donna Karan, INC Violates Women’s Worker’s Human Rights,” The Center for Economic and Social Rights, December 1999, Brooklyn, NY. 22 Ibid.
23 “Hardships in America: The Real Story of Working Families,” Fiscal Policy Institute, NY. 24 Women Fighting Poverty Conference VII, New York, NY 25 “Hardships in America: The Real Story of Working Families,” Fiscal Policy Institute, NY. 26 Ibid. 27 “WEP Fact Sheet,” Organizing ProjectUrban Justice Center, New York, NY. 28 “Poverty & Race” Volume 10 #2, March/April 2001, Poverty and Race Research Action Council. 29 HNA see note 1. 30 ibid. 31 ibid. 32 “Stiff Rules Gut Welfare Rolls at Two Offices,” Rachel Swarns, New York Times, June 22, 1988. 33 ibid. 34 New York Times, “Measure Seeks Campus Workfare Jobs, but City Balks. August 6, 1997. 35 HNA see note 1. 36 “Living With Welfare Reform: A Survey of Low Income Families in Illinois,” Armato, et al., Chicago: Chicago Urban League and University of Illinois at Chicago, January 2000. 37 Welfare Reform Network, New York, NY. 38 Community Food Resource Center 39 “Key Findings: The impact of Human Rights Project of the Urban Justice Center, New York City, March 2001. “Poverty & Race” Volume 10 #2, March/April 2001, Poverty and Race Research Action Council.
48
40 “Poverty & Race” Volume 10 #2, March/April 2001, Poverty and Race Research Action Council. 41 HNA see note 1“A Tragedy of Errors: The New York Human Recourses Administration Fails New York’s Neediest Residents,” Coalition for An Accountable and Respectful HRA, New York, NY 42 HNA see note 1. 43 Coalition for an Accountable and respectful HRA, New York City, NY. The Coalition has released two reports: 44 Schools More Separate: Consequences of a Decade of Resegregation, Gary Orfield with Nora Gordon, July 2001 45 (Elizabeth M. Grieco and Rachel C. Cassidy, “Overview of Race and Hispanic Orgin,” Census 2000 Brief, March 2001) 46 Why Students Drop Out of School and What Can be Done, Russell W. Rumberger, University of California, Santa Barbara 47 Class action compliant compiled by the New York Civil Liberties Union Foundation. Christopher Dunn, Arthur Eisenberg, and Norm Siegel. December 3, 1998. 48 Ibid. 49 Opportunities suspended: The devastating consequences of zero tolerance and school discipline policies. A Report by the Advancement Project and The Civil Rights Project. June 2000 50 Article 5(e)(iv) 51 See paragraphs 382 – 388 of US report. 52 “Five Boroughs, Common Problems: The Uninsured in New York City.” The Commonwealth Fund, February 2000 53 “Disparities in Health Insurance and Access to Care for Residents Across US Cities,” The Commonwealth Fund and UCLA Center for Health Policy Research, August 2000. 54 New York Times, “Financial Struggles at Medical Clinics for the City’s Poor,” 4/17/00, A1, Jennifer Steinhauer. 55 New York Times, “State Investigators Find Medicaid Delays in City,” 2/4/99,Rachel Swarns. 56 “Emergency Department Use in New York City: A Survey of Bronx Patients,” The Commonwealth Fund, November 2000. 57 New York Times, “Study shows a Big Asthma Risk for Children in Poor Neighborhoods,” 7/27/99, Holcolm B. Noble. 58 “Closing the Gaps: Racial Disparities in Our Health Care System,” Fernando Ferrer, Bronx Borough President, November 2000. 59 Ibid at n. 5657), citing New England Journal of Medicine and Grantmakers in Health. 60 Ibid 61 New York Times, “Sparring begins on oversight of AIDS Unit,” 9/21/00. 62 See US Report, (paragraph 376). 63 National Cancer Institute 64 Ibid 65 New York State Department of Health. 66 Roundtable on Institutions of People of Color 67 The Health of Poor Urban Women, D. Polit, A. London, J. Martinez. Manpower Demonstration Research Corporation, May 2001