Ángel Cano, BBVA's President & COO · 3Q11 Results / October 26th 2011 1 Ángel Cano, BBVA's...
42
3Q11 Results / October 26th 2011 1 Ángel Cano, BBVA's President & COO October 26 th 2011 Third quarter results 2011
Transcript of Ángel Cano, BBVA's President & COO · 3Q11 Results / October 26th 2011 1 Ángel Cano, BBVA's...

3Q11 Results / October 26th 2011
1
Ángel Cano, BBVA's President & COO
October 26th 2011
Third quarter results 2011

3Q11 Results / October 26th 2011
2
Disclaimer
This document is only provided for information purposes and does not constitute, nor must it be interpreted as, an offer to sell or exchange or acquire, or
an invitation for offers to buy securities issued by any of the aforementioned companies. Any decision to buy or invest in securities in relation to a specific
issue must be made solely and exclusively on the basis of the information set out in the pertinent prospectus filed by the company in relation to such
specific issue. Nobody who becomes aware of the information contained in this report must regard it as definitive, because it is subject to changes and
modifications.
This document contains or may contain forward looking statements (in the usual meaning and within the meaning of the US Private Securities Litigation
Act of 1995) regarding intentions, expectations or projections of BBVA or of its management on the date thereof, that refer to miscellaneous aspects,
including projections about the future earnings of the business. The statements contained herein are based on our current projections, although the said
earnings may be substantially modified in the future by certain risks, uncertainty and others factors relevant that may cause the results or final decisions
to differ from such intentions, projections or estimates. These factors include, without limitation, (1) the market situation, macroeconomic factors,
regulatory, political or government guidelines, (2) domestic and international stock market movements, exchange rates and interest rates, (3) competitive
pressures, (4) technological changes, (5) alterations in the financial situation, creditworthiness or solvency of our customers, debtors or counterparts.
These factors could condition and result in actual events differing from the information and intentions stated, projected or forecast in this document and
other past or future documents. BBVA does not undertake to publicly revise the contents of this or any other document, either if the events are not
exactly as described herein, or if such events lead to changes in the stated strategies and intentions.
The contents of this statement must be taken into account by any persons or entities that may have to make decisions or prepare or disseminate
opinions about securities issued by BBVA and, in particular, by the analysts who handle this document. This document may contain summarised
information or information that has not been audited, and its recipients are invited to consult the documentation and public information filed by BBVA with
stock market supervisory bodies, in particular, the prospectuses and periodical information filed with the Spanish Securities Exchange Commission
(CNMV) and the Annual Report on form 20-F and information on form 6-K that are disclosed to the US Securities and Exchange Commission.
Distribution of this document in other jurisdictions may be prohibited, and recipients into whose possession this document comes shall be solely
responsible for informing themselves about, and observing any such restrictions. By accepting this document you agree to be bound by the foregoing
Restrictions.
3Q11 Results / October 26th 2011
3
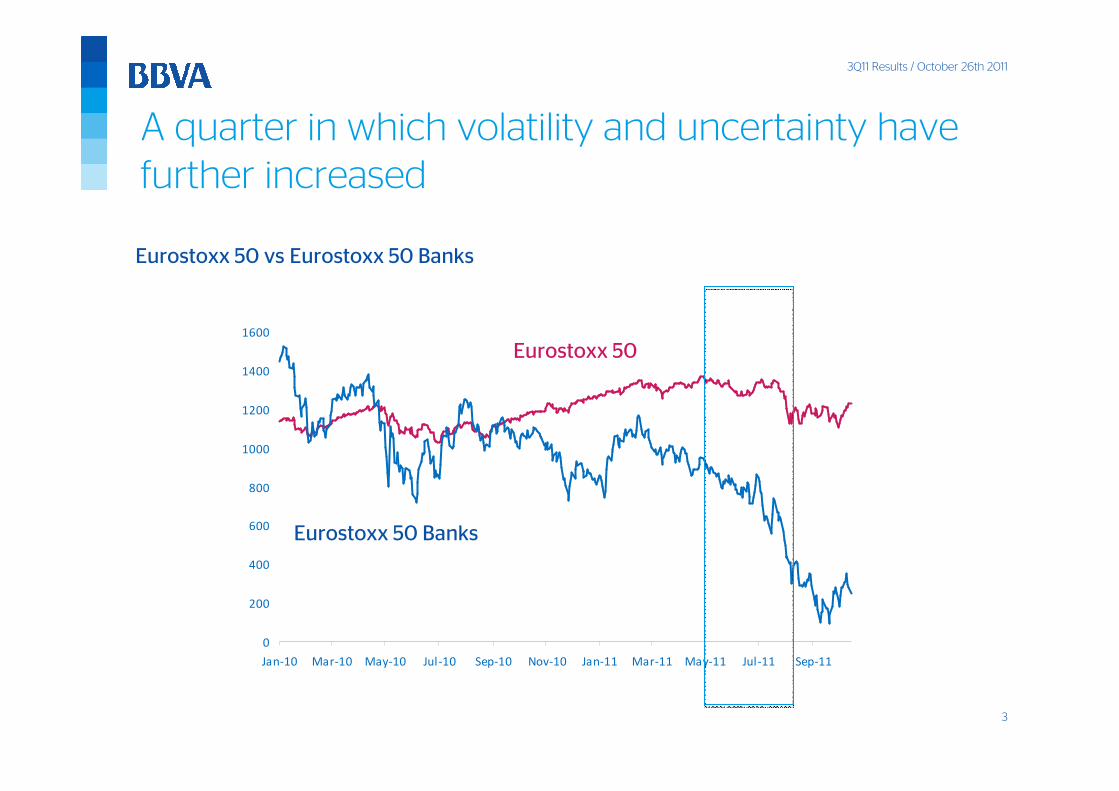
0
200
400
600
800
1000
1200
1400
1600
Jan-10 Mar-10 May-10 Jul-10 Sep-10 Nov-10 Jan-11 Mar-11 May-11 Jul-11 Sep-11
80
100
120
140
160
180
200
220
240
Eurostoxx 50 vs Eurostoxx 50 Banks
Eurostoxx 50
Eurostoxx 50 Banks
A quarter in which volatility and uncertainty have
further increased

3Q11 Results / October 26th 2011
4
In the present environment attention centres on
three aspects …
Capital adequacy
Funding
Ability to generate earnings
11
22
33
3Q11 Results / October 26th 2011
5
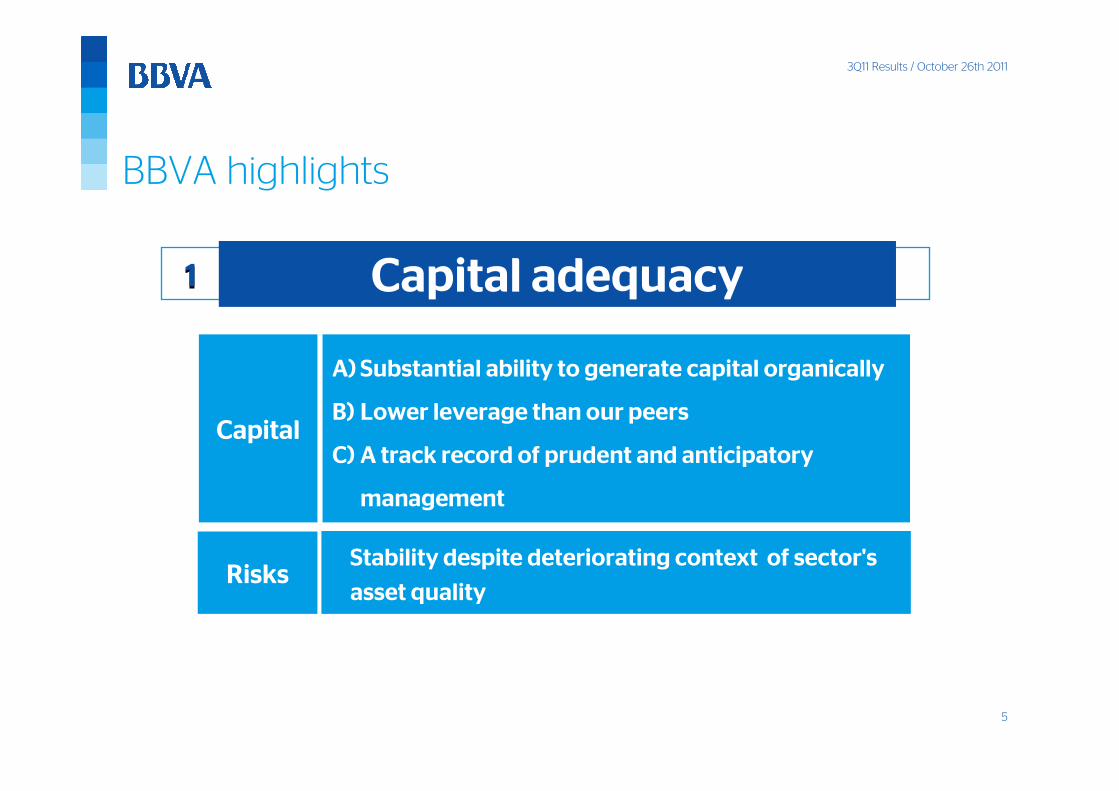
BBVA highlights
Capital adequacy11
A) Substantial ability to generate capital organically
B) Lower leverage than our peers
C) A track record of prudent and anticipatory
management
Stability despite deteriorating context of sector's
asset quality
Capital
Risks

3Q11 Results / October 26th 2011
6
Core capitalBBVA Group (%)
A) Substantial ability to generate capital organically
5.8
-1.62.3
3.2 9.1-0.6
Dec. 07 Organic
generation
Capital
increase*
M&A
transactions**
Other Sep. 11
0.00
10.00
20.00
30.00
40.00
50.00
1Q08 3Q08 1Q09 3Q09 1Q10 3Q10 1Q11 3Q11
Quarterly organic generation of core capitalBBVA Group(Basis points)
• Organic generation with simultaneous increase in RWAs (+€53bn during the crisis)
• Highly resilient operating income that could absorb sharp increases in provisions
*Includes conversion of convertible bonds** Acquisition of Fórum, Garanti y Credit Uruguay
+15bp in
the quarter

3Q11 Results / October 26th 2011
7
Peer Group: BARCL, BNPP, CASA, CMZ, CS, DB, HSBC, ISP, LBG, RBS , SAN, SG, UBS, UCI . * CASA: core capital published in december 2010
RWAs / Total assetsBBVA Group vs Peer Group(Dec.10, %)
B) Lower leverage than our peers
18
21
23
27
30
30
32
35
41
45
49
50
5057
15Peer 14
Peer 13
Peer 12
Peer 11
Peer 10
Peer 9
Peer 8
Peer 7
Peer 6
Peer 5
Peer 4
Peer 3
Peer 2
Peer 1
BBVA
1.6
2.0
2.5
2.7
2.8
3.5
3.5
3.6
3.9
4.1
4.2
4.6
4.8
Peer 12
Peer 11
Peer 10
Peer 9
Peer 8
Peer 7
Peer 6
Peer 5
Peer 4
Peer 3
Peer 2
BBVA
Peer 1
-4
0
3
5
6
8
12
18
24
33
35
41
56
Peer 1
BBVA
Peer 2
Peer 3
Peer 4
Peer 5
Peer 6
Peer 7
Peer 8
Peer 9
Peer 10
Peer 11
Peer 12
EBA capital* / total tangible assetsBBVA Group vs Peer Group(Dec.10, %)
Capital needed to match BBVA’s ratioBBVA Group vs Peer Group(Dec.10, €bn)

3Q11 Results / October 26th 2011
8
C) A track record of prudent and anticipatory
management
2011201020092008
€1bn Preferred shares issuance
€0.8bn sale & lease-back retail network
€2bn Convertible bond issuance
Dividend pay-out reduced to 30%
€5bn Capital increase (Garanti)
Retention of additional sources of capital
Script dividend option
Early conversion of convertible bonds

3Q11 Results / October 26th 2011
9
6964 67 67 64
3Q10 4Q10 1Q11 2Q11 3Q11
3,0513,852
2,804
3,7132,918
3Q10 4Q10 1Q11 2Q11 3Q11
15,563 15,686 15,528 15,791 15,972
3Q10 4Q10 1Q11 2Q11 3Q11
Risk: stable NPAs despite deteriorating context of
sector's asset quality ...
Gross additions to NPA statusBBVA Group (€m)
Recoveries / additionsBBVA Group (%)
Balance of NPAsBBVA Group (€m)

3Q11 Results / October 26th 2011
10
... whilst our main risk indicators are also stable
NPA & coverage ratiosBBVA Group(%)
6062 62 61 61
4.1 4.1 4.1 4.1 4.0
Sep.10 Dec.10 Mar.11 Jun.11 Sep.11
Cumulative risk premiumBBVA Group (%)
1.5 1.3
1.1
2009 2010 2011
Coverage ratio
NPA ratio

3Q11 Results / October 26th 2011
11
BBVA highlights
Funding22
Solid position to face 2012:
� The highest ratio of deposits / assets in the peer group
with reduced liquidity gap
� Low wholesale redemptions compared to peer group

3Q11 Results / October 26th 2011
12
Solid Group funding position . . .
Customer deposits / total assetsBBVA Group vs Peer Group(1H11, %)
Lending /depositsBBVA Group(%)
Peer Group: BARCL, BNPP, CASA, CMZ, CS, DB, HSBC, ISP, LBG, RBS , SAN, SG, UBS, UCI .
30
31
33
36
38
41
44
46
49
49
25
26
29
29
29
Peer 14
Peer 13
Peer 12
Peer 11
Peer 10
Peer 9
Peer 8
Peer 7
Peer 6
Peer 5
Peer 4
Peer 3
Peer 2
Peer 1
BBVA
130
122
Sep.10 Sep.11

3Q11 Results / October 26th 2011
13
... and performance and outlook for the euro balance
sheet are good
Positive trends in 2011Positive trends in 2011Positive trends in 2011Positive trends in 2011 Good outlook for 2012Good outlook for 2012Good outlook for 2012Good outlook for 2012
Wholesale redemptionsBBVA Group vs Peer Group(€bn)
11111111
26262626
23232323
22222222
28282828
27272727
34343434
30303030
37373737
43434343
41414141
63636363
58585858
88888888
93939393
124124124124
123123123123
127127127127
126126126126
131131131131
134134134134
148148148148
166166166166
153153153153
198198198198
174174174174
256256256256
56565656
51515151
91919191
69696969
114114114114
116116116116
146146146146
151151151151
154154154154
160160160160
161161161161
170170170170
191191191191
208208208208
217217217217
254254254254
265265265265
308308308308
BBVA
Peer 14
Peer 13
Peer 12
Peer 11
Peer 10
Peer 9
Peer 8
Peer 7
Peer 6
Peer 5
Peer 4
Peer 3
Peer 2
Peer 1
2012201220122012
>2012>2012>2012>2012
Peer Group: BARCL, BNPP, CASA, CMZ, CS, DB, HSBC, ISP, LBG, RBS , SAN, SG, UBS, UCI . BBVA data from in-house sources.
Source: Bloomberg July 20th prior to change in calculation method.
2011 funding needs already covered
Reduction in liquidity gap: -€20bn (Sep.11 vs May.10)
Customer funds on balance sheet improve +€37bn (Sep.11 vs May.10)

3Q11 Results / October 26th 2011
14
BBVA highlights
33
•Resilience and quality of net interest income
•Net trading income affected by market volatility
•Loan loss provisioning in line with recent quarters
and stability in risk indicators
Ability to generate earnings

3Q11 Results / October 26th 2011
15
Positive performance of recurrent revenue
Gross income excluding dividends and NTIBBVA Group(€m)
NTI + div.
4,520 4,467 4,488 4,566 4,602
564 479775 595
25
3Q10 4Q10 1Q11 2Q11 3Q11
Gross income
excluding NTI
and dividends
+1.8%
+0.8%
Resilience and quality of net interest income
HighlightsNet trading income affected by
market volatility
15,96415,052
9M10 9M11
Gross incomeBBVA Group(€m)
-5.7%

3Q11 Results / October 26th 2011
16
Net interest incomeBBVA Group(€m)
3,2453,138 3,175 3,215
3,286
3Q10 4Q10 1Q11 2Q11 3Q11
Resilience and quality of net interest income
Emerging mkts
Developed mkts
-11.3%
+17.0%
+1.3%
+2.2%YoY change: 9M11/9M10

3Q11 Results / October 26th 2011
17
Net trading income affected by market volatility
Significant falls in asset prices �impact on mark to market portfolios
No extraordinary contributions
Highlights
Negative impact mainly affects euro balance sheet and is less marked in Mexico and South America
336
-25
386474
752
2009 2010 1Q11 2Q11 3Q11
Net trading income (NTI) BBVA GroupQuarterly average and quarter-on-quarter(€m)
Business focused on customers in a context of declining activity
Absence of NTI in a context of
weakening markets
3Q11 Results / October 26th 2011
18
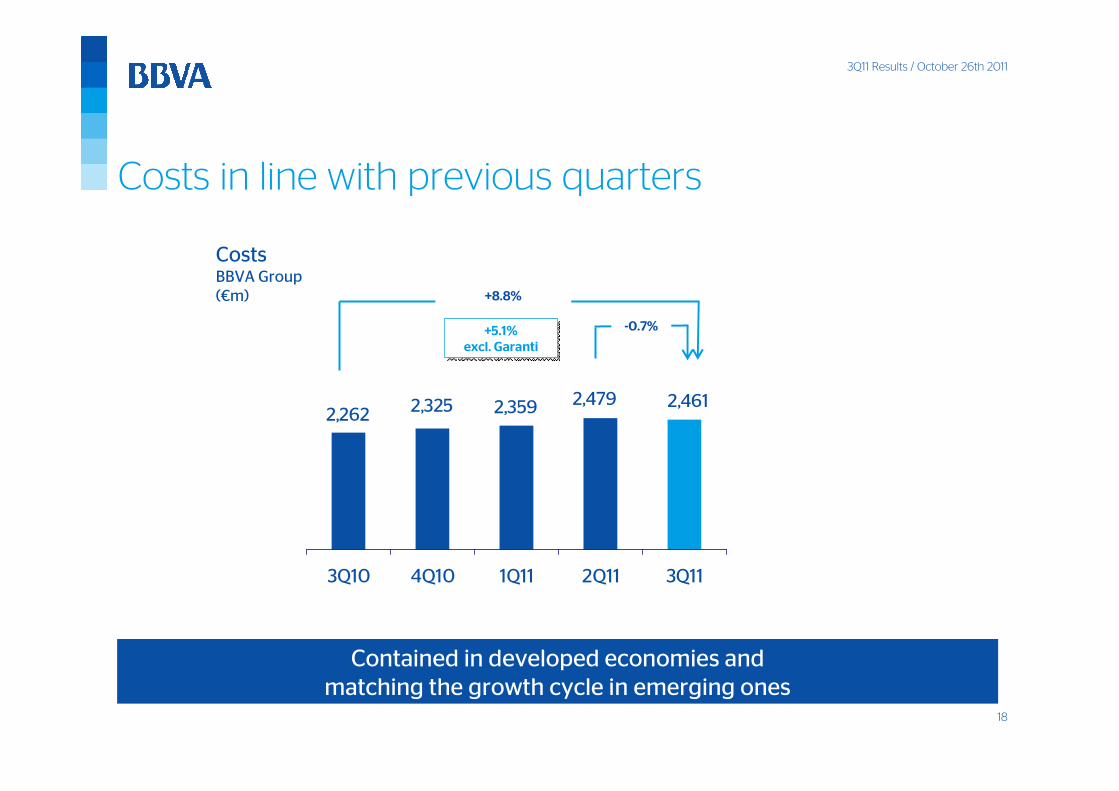
2,4612,4792,3592,3252,262
3Q10 4Q10 1Q11 2Q11 3Q11
CostsBBVA Group(€m) +8.8%
-0.7%+5.1%
excl. Garanti
+5.1%
excl. Garanti
Costs in line with previous quarters
Contained in developed economies and matching the growth cycle in emerging ones

3Q11 Results / October 26th 2011
19
Provisioning in line with recent quarters
1,187 1,112 1,023 962 904
3Q10 4Q10 1Q11 2Q11 3Q11
Impairment lossesBBVA Group (€m)
-23.9%
-6.0%
Decline is the result of lower provisioning in the USA and unchanged in Spain

3Q11 Results / October 26th 2011
20
Resilience and solid fundamentals in difficult times
ROE: 11.3% RORWA: 1.5% ROA: 0.8%
Accum.
7,753
9,676
- 1,569
-5.7%
-16.8%
-14.3%
4,145
Growth 9M11 / 9M10
%Abs.
-5.0%
15,052
- 506
- 912
Net Attributable ProfitR E S U L T A D O A T R IB U IB L E A L G R U P O
3,143 - 525
BBVA Group
Income Before TaxR E S U L T A D O S A N T E S D E IM P U E S T O S
M A R G E N D E IN T E R E S E S
-21.2%
Net Interest Income
Gross Income
9M11
Operating IncomeM A R G E N N E T O
M A R G E N B R U T O
- 1,115
(€m)

3Q11 Results / October 26th 2011
21
Geographic areas: highlights
Spain
EurAsia
Mexico
South America
United States
Improved spreads, stable net interest income and risk contained one more quarter
Dynamism in business and earnings, especially in the retail segment. The risk premium is stable.
Strong growth of business and revenue, supported by diversification, with the Group’s best risk indicators.
Selective growth of business, good performance of retail net interest income and provisioning is declining
Wholesale banking Diversification and resilience of revenue from customers in an especially complicated quarter in the markets
Dynamism in Asia and Turkey and resilience in WB&AM Europe in line with previous quarters

3Q11 Results / October 26th 2011
22
Spain: stabilisation of net interest income
1,102 1,0961,1091,143
1,178
3Q10 4Q10 1Q11 2Q11 3Q11
Net interest incomeQuarter-on-quarter(€m)
Customer spread*Quarter-on-quarter(%)
1.8%1.7%
1.8%
1.6%
1.8%
2.2%
2Q10 3Q10 4Q10 1Q11 2Q11 3Q11
* Excl. markets
+15 bp
With market share gains in lending and deposits

3Q11 Results / October 26th 2011
23
11,240 11,32211,03011,28911,273
Sep.10 Dec.10 Mar.11 Jun.11 Sep.11
43434447 42
4.7 4.8 4.8 4.8 4.9
Sep.10 Dec.10 Mar.11 Jun.11 Sep.11
Spain: risk indicators under control
Balance of NPAsBBVA Spain (€m)
NPA & coverage ratios(%)
Coverage ratio
NPA ratio
Cum. Spec.
risk premium 0.9 1.0 0.7 0.7 0.7
Risks stable while system keeps deteriorating
3Q11 Results / October 26th 2011
24
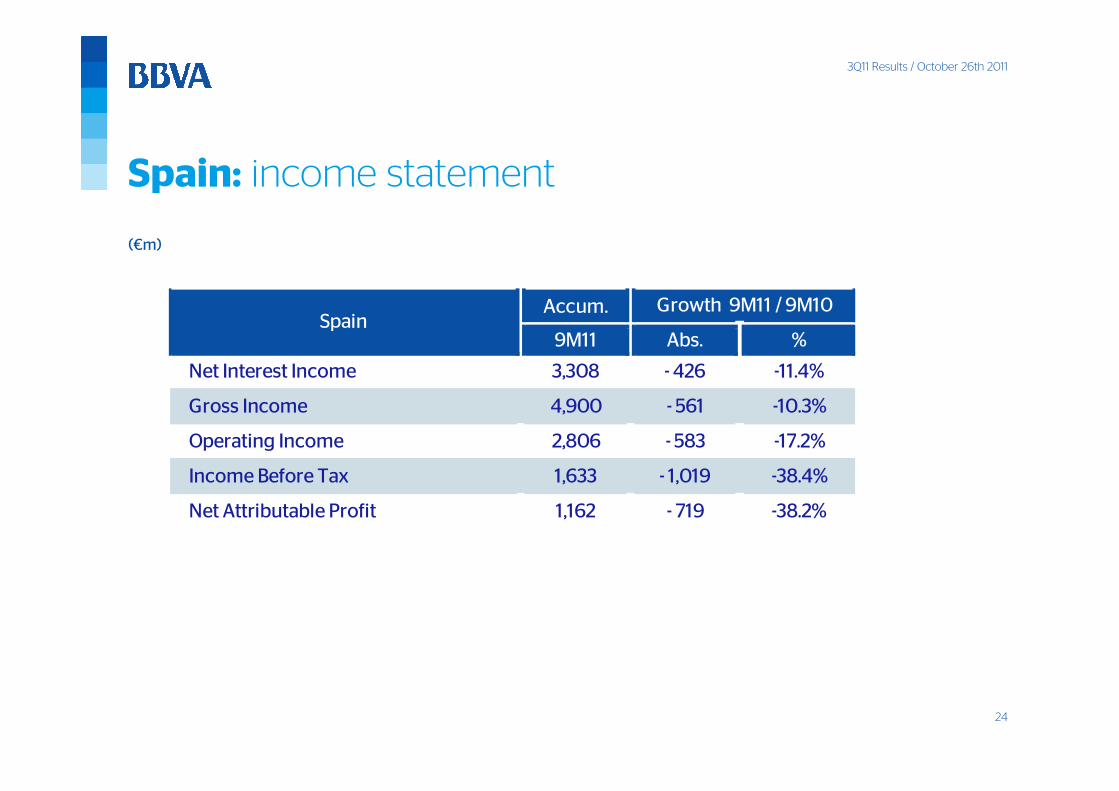
Spain: income statement
(€m)
Accum.Spain
Growth 9M11 / 9M10
9M11 Abs. %
-10.3%
Net Interest IncomeM A R G E N D E IN T E R E S E S
3,308 - 426 -11.4%
Gross IncomeM A R G E N B R U T O
4,900 - 561
Operating IncomeM A R G E N N E T O
2,806 - 583 -17.2%
Income Before TaxR E S U L T A D O S A N T E S D E IM P U E S T O S
1,633 - 1,019 -38.4%
Net Attributable ProfitR E S U L T A D O A T R IB U IB L E A L G R U P O
1,162 - 719 -38.2%
3Q11 Results / October 26th 2011
25
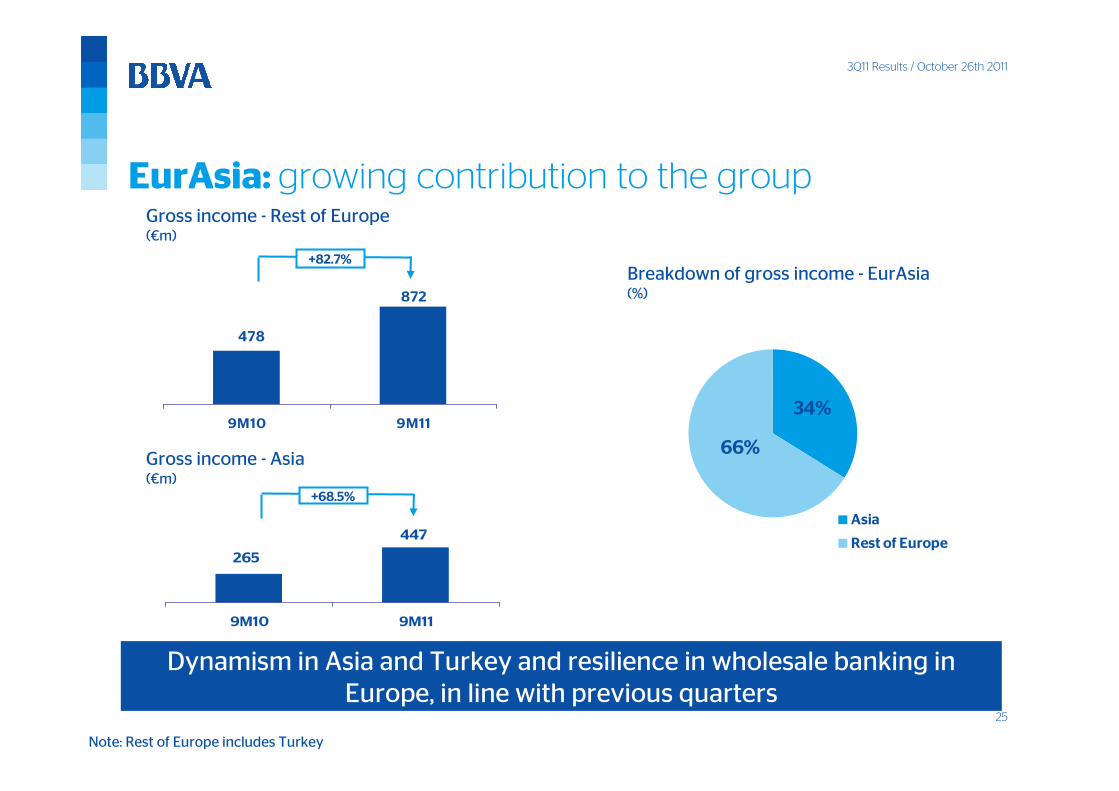
EurAsia: growing contribution to the groupGross income - Rest of Europe(€m)
Gross income - Asia(€m)
872
478
9M10 9M11
Breakdown of gross income - EurAsia(%)
66%
34%
Asia
Rest of Europe
Dynamism in Asia and Turkey and resilience in wholesale banking in Europe, in line with previous quarters
447
265
9M10 9M11
Note: Rest of Europe includes Turkey
+82.7%
+68.5%
3Q11 Results / October 26th 2011
26
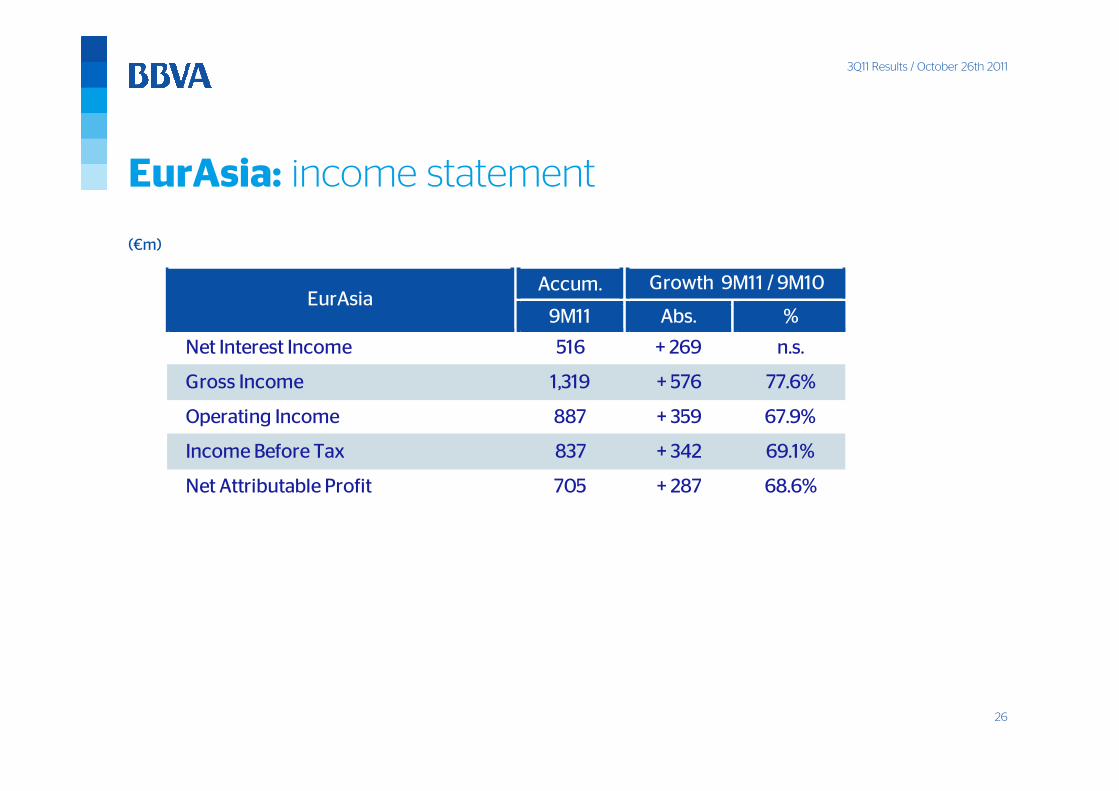
EurAsia: income statement
(€m)
Accum.
n.s.
EurAsiaGrowth 9M11 / 9M10
9M11 Abs.
Net Interest IncomeM A R G E N D E IN T E R E S E S
%
516
Operating IncomeM A R G E N N E T O
887
+ 269
69.1%
+ 576 77.6%
+ 359 67.9%
R E S U L T A D O S A N T E S D E IM P U E S T O S
837 + 342
M A R G E N B R U T O
1,319
Income Before Tax
Gross Income
+ 287 68.6%Net Attributable ProfitR E S U L T A D O A T R IB U IB L E A L G R U P O
705

3Q11 Results / October 26th 2011
27
Mexico: growth in all main items
* Excluding old residential portfolio
LendingYoY growth(Average balances, %)
17.9%23.7%
6.4%
Mortgages* Cards +
Consumer
SMEs
Customer fundsYoY growth(Average balances, %)
+8.9%* +9.6%
11.5%10.3%
Transact.+Time
deposits
Mutual Funds
3Q11 Results / October 26th 2011
28
183 186
9M10 9M11
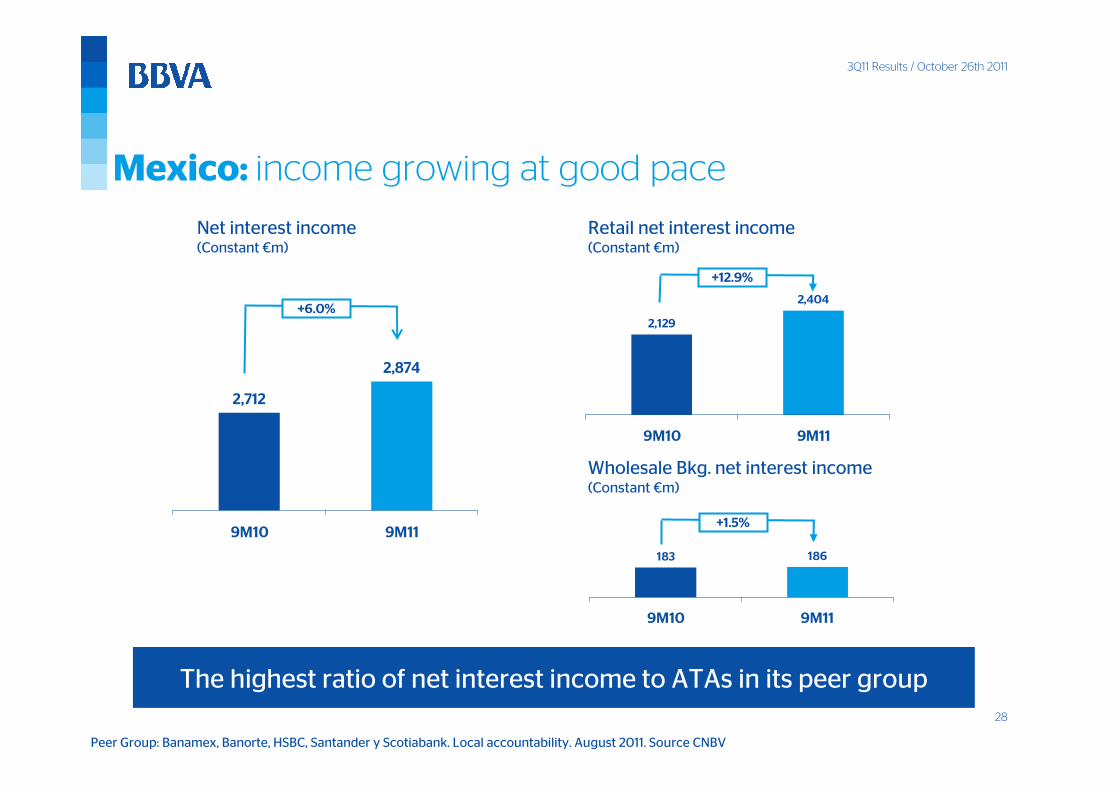
Mexico: income growing at good pace
Net interest income(Constant €m)
2,712
2,874
9M10 9M11
+6.0%
Retail net interest income (Constant €m)
Wholesale Bkg. net interest income (Constant €m)
2,129
2,404
9M10 9M11
The highest ratio of net interest income to ATAs in its peer group
+12.9%
+1.5%
Peer Group: Banamex, Banorte, HSBC, Santander y Scotiabank. Local accountability. August 2011. Source CNBV

3Q11 Results / October 26th 2011
29
3.4 3.4 3.6 3.9
3.4
Sep.10 Dec.10 Mar.11 Jun.11 Sep.11
Mexico: improvement in provisioning
Loan-loss provisions(Constant €m)
945 914
9M10 9M11
-3.2%
Cumulative risk premium(%)

3Q11 Results / October 26th 2011
30
Mexico: income statement
(Constant €m)
Accum.Mexico
Growth 9M11 / 9M10
9M11 Abs. %
6.0%
Gross IncomeM A R G E N B R U T O
4,208 + 136 3.3%
Net Interest IncomeM A R G E N D E IN T E R E S E S
2,874 + 162
0.1%Operating IncomeM A R G E N N E T O
2,686 + 4
1,722 + 28Income Before TaxR E S U L T A D O S A N T E S D E IM P U E S T O S
1.7%
2.9%1,275 + 37Net Attributable ProfitR E S U L T A D O A T R IB U IB L E A L G R U P O
3Q11 Results / October 26th 2011
31
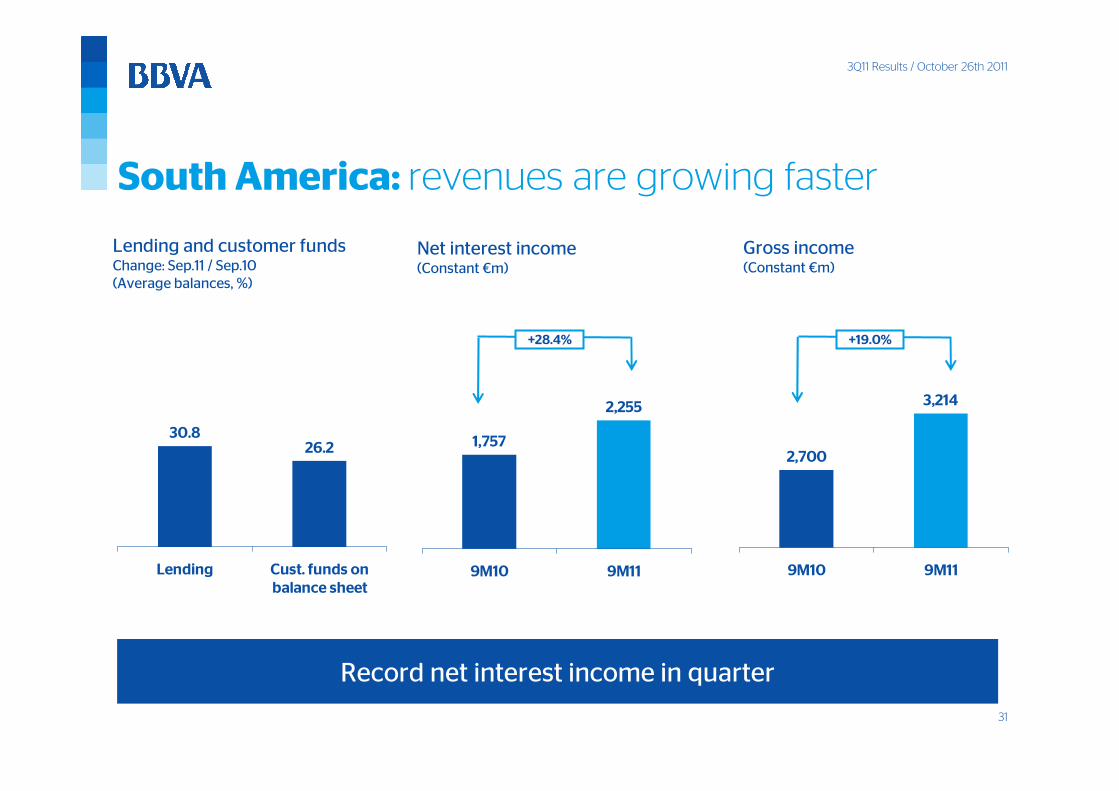
South America: revenues are growing faster
Lending and customer funds Change: Sep.11 / Sep.10(Average balances, %)
1,757
2,255
9M10 9M11
+28.4%
Gross income(Constant €m)
+19.0%
2,700
3,214
9M10 9M11
30.826.2
Lending Cust. funds on
balance sheet
Net interest income(Constant €m)
Record net interest income in quarter

3Q11 Results / October 26th 2011
32
South America: best risk indicators in the BBVA Group
Loan-loss provisions(Constant €m)
NPA & coverage ratios (%)
1.5% 1.3%Cum. Risk
premium
290320
9M10 9M11
+10.3%
138134130139 140
2.4 2.5 2.5 2.4 2.3
Sep.10 Dec.10 Mar.11 Jun.11 Sep.11
Coverage ratio
NPA ratio

3Q11 Results / October 26th 2011
33
South America: income statement
(Constant €m)
Accum.South America
Growth 9M11 / 9M10
9M11 Abs. %
19.0%
Net Interest IncomeM A R G E N D E IN T E R E S E S
2,255 + 498 28.4%
Gross IncomeM A R G E N B R U T O
3,214 + 514
13.7%Operating IncomeM A R G E N N E T O
1,751 + 211
Income Before TaxR E S U L T A D O S A N T E S D E IM P U E S T O S
1,385 + 155 12.6%
Net Attributable ProfitR E S U L T A D O A T R IB U IB L E A L G R U P O
754 + 76 11.2%

3Q11 Results / October 26th 2011
34
United States: selective growth of business
Information on this slide related to Compass BG. * Excluding RE Constr. – Resid + Commer
Lending
+7% -37%
Individuals and
companies*
Customer funds
+6% -21%
Unremunerated Remunerated
YoY change. Average balances YoY change. Average balances
Cost of customer deposits(%)
Market share gains in lending Lower cost of deposits
Re Constr.
- Resid+Commer.
Mkt share of lendingYoY change(Basis points)
614
-16
Lending ex
CRE
Residential Commercial
RE
0.51%
0.42%
0.54%0.58%
0.62%
3Q10 4Q10 1Q11 2Q11 3Q11

3Q11 Results / October 26th 2011
35
150114
9M10 9M11
United States: improvement in customer spread
Customer spread*(%)
* Compass BG
1,018 1,045
9M10 9M11
Wholesale Bkg. net interest income(Constant €m)
Retail net interest income(Constant €m)
+2.7%
-23.7%
3.94
3.923.92
3.86
3.90
3Q10 4Q11 1Q11 2Q11 3Q11

3Q11 Results / October 26th 2011
36
United States: risk levels continue to improve
Loan-loss provisions(Constant €m)
471
286
9M10 9M11
- 39.4 %
1.6% 1.0%Cum. risk
premium
67646159
69
4.2 4.5 4.4 4.6
3.9
Sep.10 Dec.10 Mar.11 Jun.11 Sep.11
NPA & coverage ratios(%)
Gross additions: -40%
Recoveries / additions: 93%
In the quarter
Coverage ratio
NPA ratio

3Q11 Results / October 26th 2011
37
United States: income statement
(Constant €m)
Attributable net profit excluding New York: +39.4%
Accum.USA
Growth 9M11 / 9M10
9M11 Abs. %
-9.1%
Gross IncomeM A R G E N B R U T O
1,711 - 136 -7.3%
Net Interest IncomeM A R G E N D E IN T E R E S E S
1,182 - 118
-21.5%Operating IncomeM A R G E N N E T O
613 - 168
305 + 9Income Before TaxR E S U L T A D O S A N T E S D E IM P U E S T O S
3.2%
1.5%218 + 3Net Attributable ProfitR E S U L T A D O A T R IB U IB L E A L G R U P O

3Q11 Results / October 26th 2011
38
Wholesale banking: recurrence and diversification of
revenue
Gross income by geographic area9M11(%)
Gross income by products9M11(%)
4%18%
51%16%
11%
USA
Europe
Asia
Mexico
6%7%
30%
21%
1%
5%
8%
Interest rates
Corporate
finance
Global
transactional
banking
Global
lending
Asset
Management
Credit
FX
Equity
22%
South
America

3Q11 Results / October 26th 2011
39
Wholesale banking: C&IB and GM
Corporate &
Investment BankingGlobal Markets
0.2%
3.4%
5.9%
Lending NII Fee income
Dynamic revenueStrengthening the customer
franchise
Source of income (%)
Y0Y
change
Customer
franchise
Trading income
+17%
-36%
Lending, net interest income and fee income(Year-on-year change, %)
GM, gross income, Sep.11/Sep.10: -5.3%
6376
2437
9M10 9M11
3Q11 Results / October 26th 2011
40
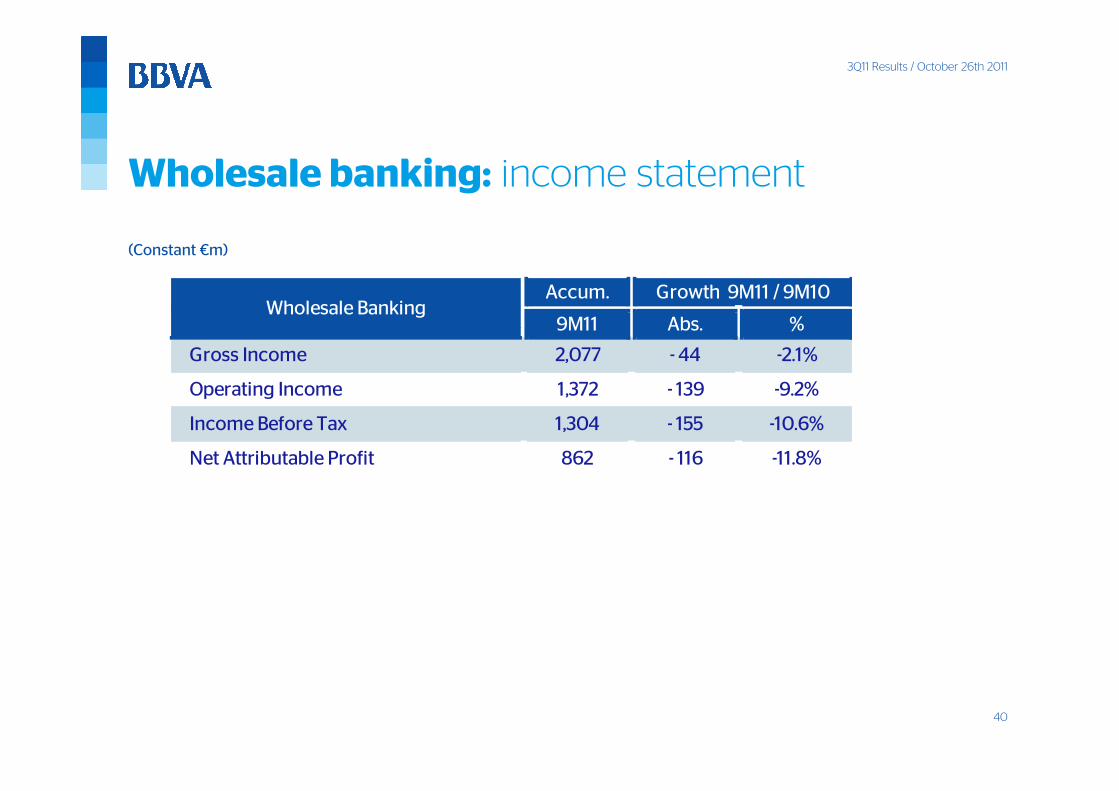
Wholesale banking: income statement
(Constant €m)
Accum. Growth 9M11 / 9M10
9M11 Abs. %Wholesale Banking
Gross Income 2,077 - 44
1,372 - 139
-2.1%
-9.2%Operating Income
1,304 - 155Income Before Tax -10.6%
-11.8%862 - 116Net Attributable Profit

3Q11 Results / October 26th 2011
41
3Q11 highlights
A) Capital:A) Capital:A) Capital:A) Capital:
• Substantial ability to generate capital organically
• Much lower leverage than our competitors
• A track record of prudent and anticipatory management of capital
B) Risks: B) Risks: B) Risks: B) Risks:
• Stability in a scenario of further deterioration of asset quality
• Solid foundations to face 2012
• Resilience and quality of net interest income
• Net trading income affected by market volatility
• Provisioning and risk indicators under control
Capital adequacy
Funding
Ability to generate earnings

3Q11 Results / October 26th 2011
42
Ángel Cano, BBVA's President & COO
October 26th 2011
Third quarter results 2011