NFORMATION TECHNOLOGY FOR SEATTLE S FUTURE
188
INFORMATION TECHNOLOGY FOR SEATTLE’S FUTURE: A Citywide Study of IT Efficiency, Effectiveness and Security City Budget Office City of Seattle, September 28, 2012
Transcript of NFORMATION TECHNOLOGY FOR SEATTLE S FUTURE
INFORMATION TECHNOLOGY FOR SEATTLE’S FUTURE:
A Citywide Study of IT Efficiency, Effectiveness and Security
City Budget Office City of Seattle, September 28, 2012


Information Technology For Seattle’s Future September 28, 2012 1
Contents 1. INTRODUCTION: A CITYWIDE APPROACH TO INFORMATION TECHNOLOGY EFFICIENCY ..... 5
2. BACKGROUND ........................................................................................................................... 6
IT is Fundamental to Running the City’s Business ...................................................................... 6
Council Direction for IT Efficiencies Study .................................................................................. 6
Study Scope ................................................................................................................................. 7
Employee Involvement ........................................................................................................... 7
Data Centers Study ................................................................................................................. 7
Applications Rationalization Inventory ................................................................................... 7
Infrastructure Optimization Study .......................................................................................... 7
How the City’s IT Services are Delivered .................................................................................... 7
City Departments .................................................................................................................... 7
IT Governance ....................................................................................................................... 10
Project Oversight .................................................................................................................. 10
3. EMPLOYEE INPUT AND CONSULTANT ANALYSES ................................................................... 11
IT Employee Survey ................................................................................................................... 11
Background and Existing Conditions ..................................................................................... 11
Survey Findings ..................................................................................................................... 11
Technology Board Comments ............................................................................................... 12
Executive Recommendation ................................................................................................. 13
Data Centers Options Study ...................................................................................................... 13
Background and Existing Conditions ..................................................................................... 13
Hargis Findings ...................................................................................................................... 14
Hargis Recommendations ..................................................................................................... 15
Executive Recommendations ................................................................................................ 15
Applications Rationalization Inventory ..................................................................................... 16
Background and Existing Conditions ..................................................................................... 16
Oracle Findings ...................................................................................................................... 17
Oracle Recommendations ..................................................................................................... 17
Cost Savings .......................................................................................................................... 18

Information Technology For Seattle’s Future September 28, 2012 2
Executive Recommendations ................................................................................................ 18
Infrastructure Optimization Analysis ........................................................................................ 19
Background-existing conditions ............................................................................................ 19
Microsoft Findings ................................................................................................................ 21
Microsoft Recommendations ............................................................................................... 21
Return on Investment ........................................................................................................... 22
Executive Recommendations ................................................................................................ 24
4. COMMON THEMES ................................................................................................................. 24
5. EXECUTIVE RECOMMENDATIONS: SUMMARY ..................................................................... 26
6. IMPLEMENTATION AND NEXT STEPS ...................................................................................... 26
Information Technology For Seattle’s Future September 28, 2012 3
List of Appendices Appendix 1. City of Seattle Information Technology Employee Survey, August, 2012 Appendix 2. City of Seattle Data Center Efficiency Study, September 21, 2012 Appendix 3. Oracle Insight, Applications Rationalization, City of Seattle, September 10, 2012
Appendix 4. Microsoft Infrastructure Optimization Assessment Results, Presentation to City Technology Board, July 24, 2012

Information Technology For Seattle’s Future September 28, 2012 4
Information Technology For Seattle’s Future September 28, 2012 5
INFORMATION TECHNOLOGY FOR SEATTLE’S FUTURE: A Citywide Study of IT Efficiency, Effectiveness, and Security
1. INTRODUCTION: A CITYWIDE APPROACH TO INFORMATION TECHNOLOGY EFFICIENCY Seattle is at an important information technology (IT) cross road. This study’s findings point the way toward a Citywide approach to making the best use of the City’s existing IT resources to meet its growing business needs in ways that will provide better and more innovative IT services to the public and employees. This Study also presents a compelling case to develop a new architecture for the City’s future data center services while improving efficiency, and to do it quickly. Finally, this study identifies new leadership opportunities for the Chief Technology Officer (CTO) to catalyze collaboration and coordination among the departments to elevate the City’s performance.
The Seattle City Council (Council) requested that the Executive prepare this review of IT systems and protocols Citywide to identify efficiency, effectiveness and security improvements in Statement of Legislative Intent 75-1-A-2 (SLI). This report, “Information Technology for Seattle’s Future: A Citywide Study of IT Efficiency, Effectiveness and Security” (Study) is the Executive’s response to the Council’s request. While departments have unique business and regulatory needs, this Study finds, based on three consultant and vendor analyses, that greater efficiencies can be achieved by better standardization of many of the City’s common IT service needs. Standardizing IT practices where it makes sense can reduce costs for procurement, training, operations, and maintenance, and improve security.
Information Technology For Seattle’s Future September 28, 2012 6
2. BACKGROUND IT is Fundamental to Running the City’s Business As technology and innovation advance, the business of the City of Seattle is increasingly dependent upon information technology systems. In public safety, IT systems help dispatch police and fire responses and search massive databases for evidence to solve crimes and deliver justice in courts of law. IT is used to operate critical infrastructure such as electrical generation at Seattle’s dams, buying and selling power in the regional power grid, and providing cyber security to the City’s electrical system. There are myriad other examples of the ways in which IT is crucial to efficiently operating the city’s transportation, water supply, drainage and wastewater, municipal buildings, and security systems. Businesses can pay taxes online, obtain essential business and development permits and request economic development assistance. Citizens can access an extensive range of information and customer services from their mobile devices and personal computers for such services as reporting potholes, accessing the Seattle Public Library’s vast collection of resources, applying for permits, City jobs, neighborhood grants and pet licenses, obtaining neighborhood crime information, and much more. Delivery of these services is critical. Businesses and citizens will continue to demand more, and more innovative, IT services.
Council Direction for IT Efficiencies Study The Council directed that this Study cover all City departments and that it be a collaborative process with the active participation of City employees. The City Budget Office (CBO) led this project with support from the Department of Information Technology (DoIT) and the Department of Finance and Administrative Services (FAS).
Council also requested specific actionable recommendations to improve service to users, standardize systems and protocols, and achieve cost efficiencies. The SLI also directed that this Study should consider opportunities for software standardization, uniform protocols for access and use of IT systems and software, department-specific applications and approval standards for such applications. The Council’s SLI stated that this review was not specifically intended to reduce staffing levels, but that if staffing reductions were to be recommended, that the Council anticipated they would occur through the normal process of staff attrition.
This Study was accomplished in a relatively short time-frame with a modest budget. Therefore, it necessarily takes a high level look at the City’s IT systems and its data centers and makes preliminary recommendations for efficiency improvements which will require further detailed consideration and planning. There is a dependent relationship between IT efficiencies and business process efficiencies. Analysis of these relationships was beyond the scope of this Study and they should be evaluated as IT efficiencies are put into practice.

Information Technology For Seattle’s Future September 28, 2012 7
In response to Council’s direction of the SLI, the Executive engaged in an employee involvement effort and three consultant and vendor analyses. These four components comprise the research for this Study and are described below and full reports are provided in Appendices 1.-4.
Study Scope
Employee Involvement
Employees have contributed input to this Study in a variety of ways. Background meetings and interviews were conducted with department IT directors to obtain initial input about IT issues in their departments. The City Technology Board was briefed and provided feedback throughout the project. The consulting firm Triangle Associates conducted a survey of City IT staff and management. Employee information and discussion sessions and conversations with labor representatives of Local 17 were held to provide information about the project and its results.
Data Centers Study
As part of this Council SLI response, the Executive determined a need for a high-level study of future options for the City’s various data centers to both identify potential efficiencies and to begin to plan for future data center services given the significant facilities issues and capital investment needs of the City’s existing data centers. Hargis, a consulting engineering firm, was hired to conduct this analysis. Hargis evaluated the City’s data center facilities, analyzed options and made recommendations.
Applications Rationalization Inventory
Oracle conducted an inventory of the City’s most significant applications in collaboration with City departments to identify efficiencies and help plan future data center needs. Oracle also made findings and recommended potential efficiency initiatives.
Infrastructure Optimization Study
The Council requested that the Executive work collaboratively with Microsoft to conduct an Infrastructure Optimization (IO) Study which is an assessment of the City’s IT practices and a comparison to industry best practices. Microsoft made findings and identified potential efficiency initiatives.
How the City’s IT Services are Delivered
City Departments
The way the City provides IT service is complex and decentralized. Although DoIT provides a wide variety of IT services to all City departments, individual departments

Information Technology For Seattle’s Future September 28, 2012 8
also have their own IT budgets with a large discretion to independently provide various IT services for their own business needs. Because there are few protocols or mandates for standardization, each department is free to decide how to conduct its IT practices to serve its own needs. (See Table 1. City of Seattle Technology by Department) which illustrates the complex array of combinations of those IT services that DoIT provides, and those that departments provide. Virtually every department has a unique profile of services it provides versus those provided by DoIT.
The CTO’s role is to carry out numerous duties related to establishing IT policies and standards and strategic planning. DoIT IT services include operating the Main City Data Center, and providing desktop support, the Service Desk, messaging, internet service, web service, the telephone and radio networks, and many other services. For departments that have no professional IT staff, DoIT provides a full suite of IT services. There is a middle tier of departments that has their own professional IT staff to provide some services, while the others are provided by DoIT. Large departments such as the Seattle Police Department (SPD), Seattle Fire Department (SFD), Seattle City Light (SCL), and Seattle Public Utilities (SPU) provide proportionately more IT services to their own departments. The Seattle Public Library (SPL) is highly self-sufficient, but does depend on DoIT to provide data center services, telephones and other services.
FAS has three important roles. One, it administers the City’s large enterprise applications that serve all city departments for finance, accounting, human resources, and customer services. Two, FAS provides applications development services to several City departments and for its internal functions, such as business licensing. Three, it provides and manages the facilities to house IT infrastructure such as data centers and communications rooms. These facilities services include constructing and operating buildings, administering leases, and providing power and cooling services.
Several other departments provide services centrally for the City. For example, SPU provides Geographic Information Services (GIS) to all City departments on a cost recovery basis. SPD offers the Seattle Justice Information System (SEAJIS) data sharing services to other City departments for public safety and criminal justice needs. SCL provides utility billing and customer services for SPU, the Department of Neighborhoods, and others.
The City of Seattle’s array of IT services has grown into a federated, siloed arrangement which is a complicated hybrid of centrally and independently provided IT services. IT governance processes add complexity.

Information Technology For Seattle’s Future September 28, 2012 9
SCL SPU DPD SDOT SPD SFD Law SMC Library ParksSeattle Center
HSD DON OHSmall Depts
FAS Pers Leg
Telephone Network
Interactive Voice Response
Call Center Systems Data Network
Internet Connection
Legend: Radio Network
Data Centers
Service Desk (Help Desk)
Desktop Computer Support File-and-Print Servers E-mail Exchange
Server/OS Support
Virtual Servers (Intel)
Storage/Backup
Electronic Payment Cell Phones
Web Support, Apps
Application Support
Table 1. City of Seattle Technology by Departments
Technology
No Utilization
Department Supported
DoIT supported
DoIT, SCL and SPU jointly maintain the Internet connection for all of City government.FAS provides application support for some Departments
Separate Fund Departments General Fund Departments
The majority of applications support is done by individual Departments, but DOIT does provide some targeted application support in some instances.
SPU transferred its Call Center to their own independent ACD and Contact Management and Quality Management Systems (separate from the Citywide systems used elsewhere in the City).
Mixed DoIT and Dept. Support
Some of these departments' servers are in the central DoIT-managed server room, but many are in separate, department-managed, locationsCity Light maintains its own telephone network at its dams and service center due to federal regulations.DoIT maintains SPU's data network in SMT, but SPU staff maintain their data network at other locationsBecause of National Criminal Justice standards, SPD maintains its data network equipment with DoIT support and fundingElectronic payment - FAS manages a standard e-payment system used by all Depts. except for Municipal Court which has a DoIT-supplied electronic payment and Library and Parks which have their own.
Desktop/Printer support: 1. DoIT maintains all Executive offices' desktops except OH which has its own desktop support person.2. SPD maintains all its own desktops except DoIT provides desktop and server support for OEM
Notes:

Information Technology For Seattle’s Future September 28, 2012 10
IT Governance
As with the provisioning of IT services, Seattle’s IT governance is similarly complex and, to some degree, inefficient. Although the CTO has authority to establish policies, standards and strategic plans, several governance bodies and working groups have been formed to incorporate departmental policy perspectives and expertise into decision making. In practice, the result of Seattle’s governance system is that decision making is often slow, cumbersome, and costly in terms of staff time. The City Technology Board is chaired by the CTO and comprises the top IT manager or director from each department. This board makes recommendations to the CTO on technology standards, policies, and priorities and has implemented various working teams that report into the board. There are six different teams broken out by service area, Desktops, Directory Services and Messaging , Internet, Network, Service Management, and Information Security. The Technology Board and their working teams which include representatives from relevant departments meet on average twice a month. As an example, the Desktop Technical Team has a representative from each of the 12 departments that provide desktop support. This team sets high-level hardware and software standards; however, the implementation of those standards is the responsibility of the 12 different departments. Each department then conducts its own project management and implementation in 12 different ways and at 12 different times. This can be time consuming and introduce inefficiencies, e.g. a common desktop management tool standard was set over three years ago yet only three of the 12 departments have fully implemented the standard.
Project Oversight
There is a Municipal IT Investment Evaluation (MITIE) process, which is a citywide collection and review process for all IT projects that meet certain criteria. Projects are self-reported by departments and are evaluated in six areas: Finance, Enterprise Applications, Project Risk Profile, Security, Web and Infrastructure. If the evaluation team determines that a project has significant impact to the business, the project will have oversight by the CTO’s Project Management Center of Excellence.
Information Technology For Seattle’s Future September 28, 2012 11
3. EMPLOYEE INPUT AND CONSULTANT ANALYSES IT Employee Survey
Background and Existing Conditions
The City conducted an employee survey to provide all City IT staff and management the opportunity to confidentially contribute their ideas about a range of topics including current conditions affecting the efficiency of their work, expectations for the future changes in IT, how the City should best prepare for those changes, and potential IT efficiencies. Triangle Associates, a mediation, facilitation and public education consultant, designed and implemented the survey and interpreted the results. The survey design was developed with input from the City Technology Board members, leadership of Local 17, and IT management. (Please See Appendix 1. City of Seattle Information Technology Employee Survey for the complete report of the results.)
Survey Findings
IT employee participation in the survey was very high, with 418 respondents out of the 568 IT management and staff who were sent the survey. The survey posed 15 questions, 10 of them open ended, although not all respondents answered all 15 questions. The survey results, particularly the individual written comments, provide the City a wealth of insights and suggestions for improving efficiency and performance. The consultant coded over 5,600 individual comments that covered a very wide of topics and opinions. Despite the challenge to summarize this volume of responses, several clear themes emerged. Here are selected highlights: Employees predict a high degree of change in IT in the next three years. On a scale from 1 (low) to 10 (high) 30% of respondents ranked change at nine or 10, and 83% ranked it at six or higher. The most predominant themes about change were in the areas of mobility, data storage, and future planning/agility. The most common comments also included cloud based systems, virtualization and network and data security. The overwhelmingly number one step IT employees said the City should take to prepare for these changes is training for existing employees. Other steps are increasing use of cloud services, smarter investing/budgeting, approaches to new technology, and being flexible to compete with the private sector for skilled staff. The highest priority business needs the City IT should prepare to deliver were identified as connectivity and device support, non-technological needs (agility, training, internal

Information Technology For Seattle’s Future September 28, 2012 12
policy, etc.), security, data management and communications, and web based needs. In terms of future job skills, 64% of the comments identified needs for technical skills (mobile device computing, web development, database programming and administration, cloud computing, and Windows 7/8). Interestingly, 36% of the comments identified needs for non-technical skills (project management, communications, people skills, flexibility to adapt to change, contracting and procurement and customer service). The most commonly identified technological future training topics included mobile devices, Microsoft’s .NET framework (internet development), databases, security, and cloud-based technology and computing. Business training topics include project management, business analysis and general business. IT employees rated their own department’s IT efficiency. On a scale of 1 (low) to 10 (high) thirty-seven percent (37%) ranked it as 8 or higher and 75% ranked it 6 or higher. Only 14% ranked it 4 or lower. The results on communication and collaboration between departments generally fell into bell-shaped curves with most responses near the middle of the scales, and fewer at the high and low ends. This suggests that while there is a fair amount of good collaboration and communication, there is room to strive toward excellence in these areas. When asked to identify the single most significant action their department could take to improve their efficiency, respondents replied: staffing improvements (adequate staffing levels and changes to existing staff), technology improvements, managerial changes, increased collaboration, increased training, process and productivity improvements, and increased funding.
Technology Board Comments
The City Technology Board discussed the survey results and commented that the City should identify future business needs and that those business needs should drive future IT services. IT directors should be involved to contribute their expertise in this strategy setting. Training should be tied to these long-term business needs. A common challenge is to ensure that business processes are fully developed before implementing an IT solution. In the past, IT projects have been bogged down when business processes were not adequately developed.
Information Technology For Seattle’s Future September 28, 2012 13
Executive Recommendation
• Develop and implement a Citywide employee development and training program.
(Executive Recommendation 5.6) Data Centers Options Study
Background and Existing Conditions
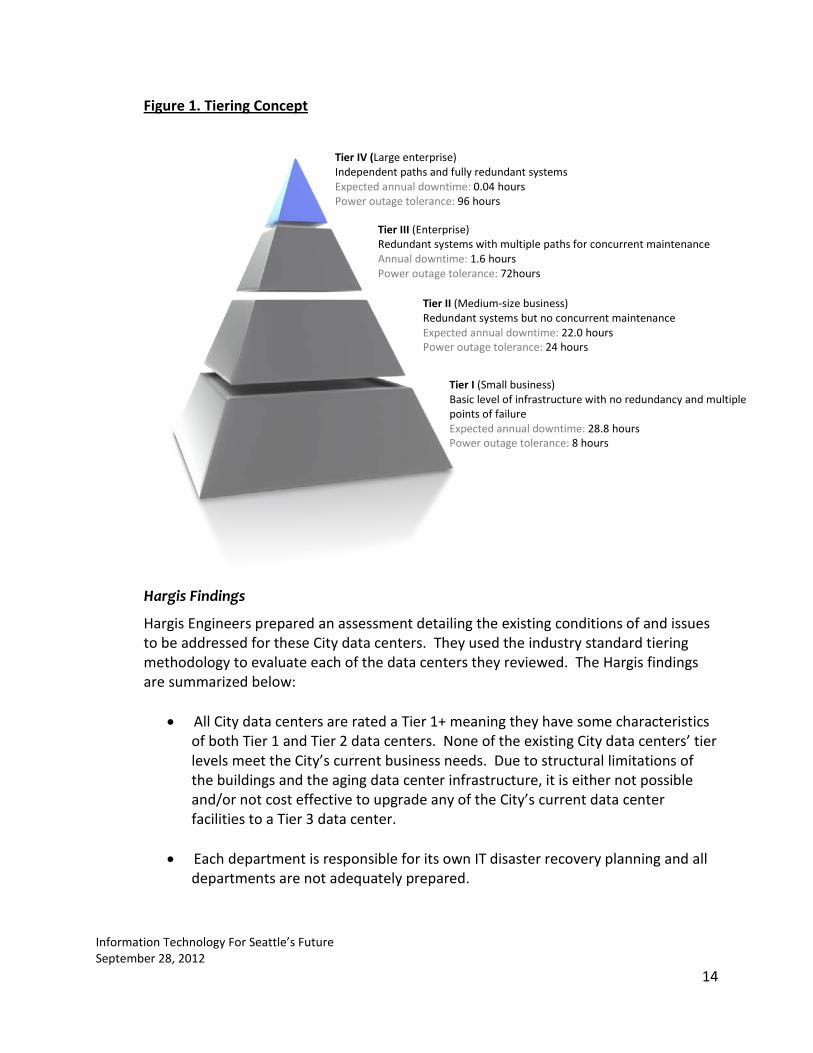
The City hired Hargis, an engineering consulting firm, to conduct a high level evaluation of the existing conditions of six data centers, and to identify interim efficiencies and preliminary future data center alternatives and recommendations. (Please see Appendix 2. City of Seattle Data Center Efficiency Study.) The Hargis analysis focused on six City data center facilities. The Main City Data Center is owned and operated by DoIT and it serves all City departments. Some departments install and maintain their own servers in the Main City Data Center, while DoIT provides a full range of services to the other departments. There are also many dispersed servers and server rooms throughout City facilities including libraries, parks, community centers, neighborhood services centers, Seattle Center facilities, police and fire stations, and utility facilities with locations that range from downtown Seattle to as far as the Skagit River and Boundary Hydroelectric Projects. Most City data centers were developed to meet the technology requirements of more than a decade ago. Since then, technology and business needs have changed significantly and Seattle’s data centers cannot meet their current and future requirements. Each of these data centers currently has facility limitations. Several also require significant capital investments to maintain their current level of service. Industry standards are in place to rank data centers on a tier scale that ranges from Tier 1 through Tier 4. Figure 1.Tiering Concept briefly explains the characteristics of each tier. The tier assessment for City data centers is described in Hargis Findings below.
Information Technology For Seattle’s Future September 28, 2012 14
Figure 1. Tiering Concept
Hargis Findings
Hargis Engineers prepared an assessment detailing the existing conditions of and issues to be addressed for these City data centers. They used the industry standard tiering methodology to evaluate each of the data centers they reviewed. The Hargis findings are summarized below:
• All City data centers are rated a Tier 1+ meaning they have some characteristics of both Tier 1 and Tier 2 data centers. None of the existing City data centers’ tier levels meet the City’s current business needs. Due to structural limitations of the buildings and the aging data center infrastructure, it is either not possible and/or not cost effective to upgrade any of the City’s current data center facilities to a Tier 3 data center.
• Each department is responsible for its own IT disaster recovery planning and all
departments are not adequately prepared.
Tier IV (Large enterprise) Independent paths and fully redundant systems Expected annual downtime: 0.04 hours Power outage tolerance: 96 hours
Tier III (Enterprise) Redundant systems with multiple paths for concurrent maintenance Annual downtime: 1.6 hours Power outage tolerance: 72hours
Tier II (Medium-size business) Redundant systems but no concurrent maintenance Expected annual downtime: 22.0 hours Power outage tolerance: 24 hours
Tier I (Small business) Basic level of infrastructure with no redundancy and multiple points of failure Expected annual downtime: 28.8 hours Power outage tolerance: 8 hours

Information Technology For Seattle’s Future September 28, 2012 15
• The City does not have a Citywide business continuity plan that includes the recovery point objectives and recovery time objections by application to define the amount of time the business has to recover their technology. This means the City lacks a system to maintain a Citywide prioritized list of applications and their order for restoration in the event of a disaster.
• The City has multiple storage area networks (SANs), from multiple vendors, operated by multiple departments. The diversification in platforms increases cost to the enterprise for support and maintenance.
• The City has implemented at least three different server virtualization platforms, operated by multiple departments. The diversification in platforms presents additional cost to the enterprise for support and maintenance.
• Over time, multiple departments in the City have purchased and developed their own data center services to meet their individual business needs. These independent actions duplicate effort and are an inefficient use of IT support and technology resources.
Hargis Recommendations
Hargis recommends the City develop a single integrated data center architecture managed by one City department that provides significantly improved resiliency and redundancy. This recommended data center architecture would include a new Tier 3 data center where generally all City applications would reside. In addition, two of the City’s existing data centers would be upgraded to Tier 2 to provide application redundancy for the City’s mission critical applications. Hargis also recommended the City consider implementing Citywide IT disaster recovery plans and specify recovery point objectives and recovery time objectives for all applications, providing a prioritized list of City applications with expected recovery times should there be a disaster. Hargis also suggested the City consolidate its multiple disparate platforms for storage and server virtualization into more standardized solutions. In addition, Hargis indicated the City should leverage economies of scale in its ongoing server virtualization efforts thereby reducing the number of vendor platforms and installations.
Executive Recommendations
The Executive concurs with Hargis’s recommendations and proposes the following Executive Recommendations. (See section 5. Executive Recommendations).

Information Technology For Seattle’s Future September 28, 2012 16
• Plan, design, and implement a multi-tier data center architecture with the goal of moving to these facilities by the end of 2015. (Executive Recommendation 5.1.)
• Implement a system to create and maintain Citywide business continuity and IT
disaster recovery plans. (Executive Recommendation 5.2.)
• Implement standardized shared storage and virtualization services for all departments. (Executive Recommendation 5.4.)
Applications Rationalization Inventory
Background and Existing Conditions
At the City’s request, Oracle conducted the applications rationalization inventory as part of the Oracle Insight program, a pro bono customer marketing information service that the City has used in the past. (See Appendix 3. Oracle Insight Applications Rationalization, City of Seattle.) As with the data centers analysis conducted by Hargis, the applications rationalization inventory was conducted for two reasons: one; to identify potential efficiencies; and two, to begin to inventory applications within Seattle data centers to help plan for the future of the data centers. Oracle led this study in close collaboration with City staff and using the Oracle Primavera applications inventory analysis tool. Applications are, in very simple terms, software programs that perform specific tasks for the Citywide enterprise or a City department’s lines of business. The practice of application portfolio management (APM) is a systematic evaluation that provides organizations information about the costs and benefits of applications to their lines of business to help optimize the portfolio. The potential benefits are reduced costs, improved security, and increased return on investment. APM typically evaluates a host of attributes to strategically manage the applications portfolio which might include how old a given application is, its frequency of usage, its technical health (how technologically modern the application is), security risks, how many duplications or redundancies of similar applications exist within the organization, etc. APM analysis can inform decisions about procuring or retiring applications. Seattle does not now have a practice of managing its applications portfolio at the Citywide level. All City departments completed surveys to inventory their current applications. The Oracle survey generated detailed data on more than 700 applications. The survey collected basic background information on applications, including: how critical the application is to City business, regulatory compliance needs, whether emergency business contingency plans are in place, security questions, costs, full time employees (FTEs) assigned, the application’s technical health, and many others.

Information Technology For Seattle’s Future September 28, 2012 17
Oracle Findings
The following eight Oracle findings correspond to the eight recommendations in the Oracle Recommendations section below.
• Approximately 80 Mission applications that are rated Mission Critical or Business Critical have no business continuity plans.
• Applications with low data sensitivity and low number of interfaces with other applications.
• More than 100 applications were identified where the security ranks lower than the
data sensitivity ranking.
• Approximately 60 different reporting/business intelligence tools and approaches were identified.
• There are many duplicative human resources, asset management, budgeting, case
management, contract management, timekeeping and financial management applications, many of which are identified for replacement or decommissioning.
• The City has hundreds of interfaces between applications across the more than 700 applications.
• Only six of the city’s 719 applications have true enterprise single sign-on.
• The City does not currently implement APM.
In summary, of the more than 700 applications to date, many are small, of low technological health, lack business continuity plans, and lack adequate security for level of data sensitivity, which points to significant opportunities to better manage the City’s applications portfolio to become more efficient, reduce costs, improve security, increase return on investment, and improve productivity.
Oracle Recommendations
Oracle recommends the following high level initiatives as a result of the application rationalization:
• Improve the reliability and business continuity of critical systems in the event of an emergency or disaster. Identify mission-critical systems and create a consistent business continuity plan.

Information Technology For Seattle’s Future September 28, 2012 18
• Applications with low data sensitivity and minimal systems interaction, or interfaces
are good candidates for moving to a public cloud. • Address security risks, by modernizing, decommissioning or replacing the systems
where the sensitivity of the data is not adequately protected by the security level of the application.
• Implement Single Sign-On across the city to help secure these applications as well as increase user satisfaction and lower the cost of administering these applications over time.
• Reduce the number of reporting and business intelligence tools and approaches.
• Reduce the number of redundant or over-lapping applications, particularly those with poor technical health that have relatively low numbers of interfaces, are a security risk and have been identified for replacement or decommission.
• Develop a City-wide Integration strategy and initiative that follows industry best practices around Service Oriented Architecture (SOA) to reduce duplicate data entry, high support costs, and to enable operational efficiency.
• Implement robust and comprehensive IT Portfolio Management tools and governance processes around the City’s Municipal Information Technologies Investment Evaluation (MITIE) process to help move the City from “silos” to “shared services.” Establish ongoing management to drive future efficiency, effectiveness, and security improvements.
Cost Savings
Based on its experience, Oracle estimated that 20% of the City’s applications might reasonably be eliminated. If so, Oracle estimates a 5 year range of savings from $3.0 – $ 6.0 million using the costs City departments reported as part of the survey
Executive Recommendations
The Executive concurs with Oracle’s recommendations and proposes the following Executive Recommendations. (See Executive Recommendation 5.3.)
• Implement a citywide system to manage the City’s application portfolio. o Identify all applications and the department lead for each application. o Eliminate duplicate applications. o Manage applications centrally where appropriate.

Information Technology For Seattle’s Future September 28, 2012 19
o Develop procurement protocols to achieve economies of scale and avoid duplication.
o Develop a cloud strategy and move applications to the cloud where appropriate.
o Evaluate application security and implement changes as needed. Infrastructure Optimization Analysis
Background-existing conditions
At Council’s request, Microsoft conducted an Infrastructure Optimization (IO) study to assess the City’s technology practices to help prioritize projects to increase productivity and efficiency. This work was done in collaboration with City departments using an assessment model developed by Alinean. (See Appendix 4 Microsoft Infrastructure Optimization Assessment Results Presentation.) This assessment model is based on the Carnegie-Mellon Capacity Maturity Model (CMM) that categorizes the level of development, or “maturity,” of an organization’s IT practices along a continuum of four progressive stages: Basic, Standard, Rationalized, and Dynamic. (See Figure 2, Stages of IT Optimization for a description). Generally the CMM research demonstrates that as an organization progresses along this continuum, automation increases, operational costs decrease, and worker productivity increases.

Information Technology For Seattle’s Future September 28, 2012 20
Figure 2. Carnegie Mellon Maturity Model Stages of IT Optimization
Fourteen City departments were surveyed to collect detailed data about IT practices and costs. They were: DoIT, FAS, SCL, SPU, SFD, SPD, Seattle Department of Transportation (SDOT), Department of Planning and Development (DPD), Human Services Department (HSD), Seattle Law Department (LAW), Legislative Department (LEG), Seattle Municipal Courts (SMC), Seattle Department of Parks and Recreation (DPR), and Seattle Center (CEN). The remaining City departments were not surveyed because DoIT provides IT services to those departments. The Alinean model identified potential projects that would improve efficiency, save cost, and improve the City’s security and productivity. To present a reasonable and conservative range of potential cost savings, this analysis presents a range from 100% to 50% of the model’s projected cost savings assuming that the real savings for the City of Seattle likely will fall somewhere within this range.
Stages of IT Optimization:Goal: Move the City from Basic to Standardized
9/23/2012 6
As progress is made from Basic to Dynamic, automation is increased, operational costs decreased, and worker productivity is increased.
Resources can then be reallocated from O&M to innovation.

Information Technology For Seattle’s Future September 28, 2012 21
Microsoft Findings
The study produced CMM profiles for each of the 14 departments and for the City as a whole. The department profiles were then used to create two Citywide evaluations. The first evaluation created a Citywide average using the 14 departmental CMM profiles and compared that average to other government organizations of similar sizes. (See Appendix 4 pages 9 and 10 for details). From a Citywide perspective, Seattle is classified at the Basic Level, although it does rate as the higher level “Standardized” in a few specific areas of capability. This puts the City on par with the Other Government Agencies in most of the IT areas evaluated. The City exceeds the average in some areas, but also lags in a number of others. The second evaluation plotted department CMM rankings to indicate how close or far apart individual departments performed for each of the technical areas evaluated. The evaluation identified technical areas with wider spreads of data points indicating greater opportunities to improve efficiency. (See Appendix 4, Microsoft Infrastructure Optimization Assessment Results Presentation, pages, 11 and 12 for details). These findings are the basis for the recommended projects in the next section.
Microsoft Recommendations
Microsoft recommended three projects based on these findings.
• Upgrade the City’s desktop operating system to Windows 7. o Security support for the City’s Windows XP platform ends April 8, 2014.
• Standardize on a common set of productivity tools ( (e.g. email, portals, video
conferencing, instant messaging). o Increases efficiency of end-user operations. o Reduces the wide distribution of optimization levels.
• Standardize client and server management tools (e.g. desktop and server
management tools like Microsoft’s system center configuration management and operations management.) o Deduces PC operations and administration costs. o Decreases user downtime for problem resolution. o Reduces IT Service Desk costs. o Reduces client and server maintenance and support costs.
In addition, Microsoft recommends that the City adopt an ongoing IO strategy to periodically assess progress and ensure the City continues on the CMM progression toward continued efficiency and productivity.

Information Technology For Seattle’s Future September 28, 2012 22
Return on Investment
The six year (2013-2018) implementation costs for the three recommended projects are estimated at $11,420,000 based the 2013-14 Proposed Budget costs for Windows 7 and Office 365, and a preliminary estimate of the 2015 project costs to implement a standardized set of client/server tools. The six-year estimated benefits include both hard cost savings (IT staff time, licenses, hardware, etc.) and soft costs which represent end-user productivity gains (video conferencing, instant messaging, e-forms, etc.) The benefits were derived from the Alinean IO model results. Both a Low Estimate and High Estimate are given. The Low Estimate is based on 50% of the Alinean model’s projected benefits, and the High Estimate uses 100% of the projected benefits to provide a conservative range of benefits. It is anticipated the real benefits to the City would fall within this range. Table 1. Estimated Return on Infrastructure Efficiency Benefits
Low Estimate High Estimate
Estimated Cumulative Costs (2013-2016) $11,420,000 $11,420,000
Estimated Cumulative Benefits (hard costs and soft costs)
$ 16,167,000 $25,377,000
Net Benefit $4,747,000 $13,957,000
Return on Investment 42% 122%
Figure 3. Expected Payback Assuming High Estimate and Figure 4. Expected Payback Assuming Low Estimate show estimated return on investment (ROI) calculations for both the low and high cost and benefit estimates. For this exercise, it was assumed that Windows 7 would be implemented in 2013; Office 365/Exchange in 2014; and standard server management tools in 2014 - 2015. It was also assumed that the benefits of these three projects were distributed equally among the three projects. Using this range of ROI, the expected payback would occur between 2015 and 2017.

Information Technology For Seattle’s Future September 28, 2012 23
Figure 3. Expected Payback Assuming High Estimate
Figure 4. Expected Payback Assuming Low Estimate
$-
$5,000,000
$10,000,000
$15,000,000
$20,000,000
$25,000,000
$30,000,000
2013 2014 2015' 2016 2017 2018
cumulative investment
cumulative benefits
$-
$2,000,000
$4,000,000
$6,000,000
$8,000,000
$10,000,000
$12,000,000
$14,000,000
$16,000,000
$18,000,000
2013 2014 2015' 2016 2017 2018
cumulative investment
cumulative benefits

Information Technology For Seattle’s Future September 28, 2012 24
Executive Recommendations
The Executive concurs with Microsoft’s recommendations and proposes the following Executive Recommendations. (See section 5. Executive Recommendations).
• Complete the implementation of the standard desktop management software, System Center Configuration Manager. (Executive Recommendation 5.5.)
• Implement Windows 7. (Executive Recommendation 5.7.)
• Implement Office 365. (Executive Recommendation 5.8.)
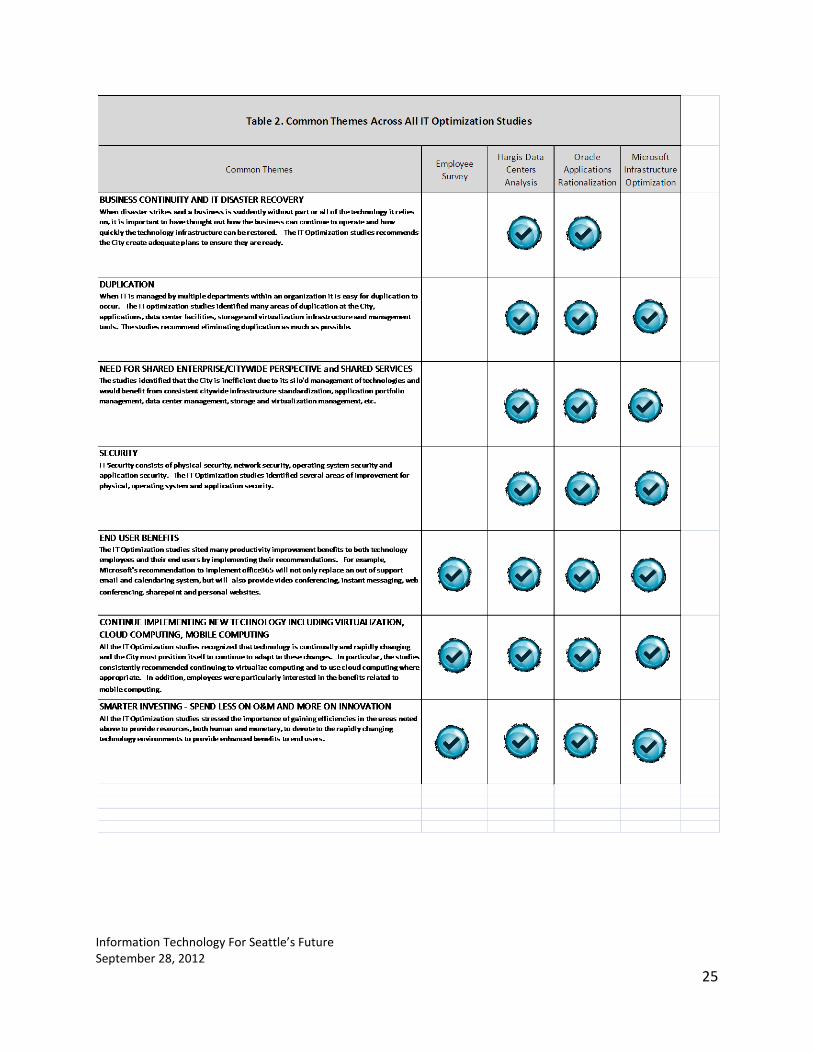
4. COMMON THEMES Individually, each of the four studies discussed above provided useful findings that illuminated inefficiencies and made specific recommendations for improvements. Several themes emerge in common across the various studies which are summarized in Table 2. Common Themes Across All IT Efficiency Studies .
Information Technology For Seattle’s Future September 28, 2012 25

Information Technology For Seattle’s Future September 28, 2012 26
5. EXECUTIVE RECOMMENDATIONS: SUMMARY The Executive recommends the following summary list of actions (each previously discussed in section 3. Employee Input and Consultant Analyses), and directs that the CTO develop a work plan and timeline to implement them.
5.1. Plan, design, and implement a multi-tier data center architecture with the goal of
moving to these facilities by the end of 2015.
5.2. Implement a system to create and maintain Citywide business continuity and IT disaster recovery plans.
5.3. Implement a system to manage the City’s application portfolio.
5.3.1. Identify all applications and the department lead for each application. 5.3.2. Eliminate/reduce duplicate applications. 5.3.3. Manage applications centrally where appropriate. 5.3.4. Develop procurement protocols to achieve economies of scale and avoid
duplication. 5.3.5. Develop a cloud strategy and move applications to the cloud where appropriate.
5.4. Implement standardized shared storage and virtualization services for all departments.
5.5. Complete the implementation of the standard desktop management software, System
Center Configuration Manager, and implement a standard set of server management tools.
5.6. Develop and implement a Citywide IT employee development and training program.
5.7. Implement Windows 7.
5.8. Implement Office 365.
6. IMPLEMENTATION AND NEXT STEPS The Proposed 2013-14 Budget presents funding initiatives to plan and design the new data centers’ architecture, and to implement Windows 7 and Office 365. The data centers’ planning and design work will also encompass many of the applications rationalization tasks to various degrees. The City IT employee survey input should be considered throughout all of this future work. A training program will be developed to ensure that the City’s IT employees are prepared with the necessary future skills and expertise. See Table 3. Proposed Implementation of Executive Recommendations that outlines planned and proposed implementation activities from 2012-2015

Information Technology For Seattle’s Future September 28, 2012 27
This Study assessed major issues Seattle now faces at this crucial IT cross road. These Executive Recommendations set strategies to develop a new data center architecture, and to better optimize Seattle’s IT infrastructure and applications portfolio. This Study also captured very insightful opinions and wisdom of its IT staff and managers about Seattle’s IT future, how to best train Seattle’s IT work force, and prepare for the significant changes they see coming. These recommendations constitute a significant amount of very challenging work that requires strong leadership by the CTO and Citywide collaboration and coordination, while respecting and balancing the unique business needs of individual departments. Accomplishing these Executive Recommendations will advance Seattle toward its goals of efficiency, effectiveness and security, and position Seattle’s IT work force and services to serve the City’s current and future business needs.

Information Technology For Seattle’s Future September 28, 2012 28
2012 2013 2014 2015Employee Survey
Implement Citywide IT training plan
5.6 Identify Owner Planning & Design Implement Ongoing
Multi-tier data center architecture
5.1
.. Identify Project Scope.. Execute RFP for consulting services.. Identify project governance
Planning and design ImplementComplete
Implementation
Implement Disaster Recovery and Business Continuity 5.2
Determine if in Data Center Project Scope
Standardize on storage5.4
Determine if in Data Center Project Scope
Standardize on virtualization5.4
Determine if in Data Center Project Scope
Hargis EngineeringData Center
Study
Implement as appropriate
Implement as appropriate
Implement as appropriate
Table 3. Proposed Implementation of Executive Recommendations
Study Study RecommendationExecutive
Recommen-dation #
Summary of Next Steps by Year

Information Technology For Seattle’s Future September 28, 2012 29
2012 2013 2014 2015Improve the reliability and business continuity of critical
5.2
Move appropriate applications to the cloud
5.3.5Determine if in Data Center Project Scope
Modernizing or decommission applications with security
3Determine if in Data Center Project Scope
Implement Single Sign-OnEvaluate for 2014/2015
budget cycleEvaluate
Implement if appropriate
Reduce the number of Reporting / BI tools
5.3.2Determine if in Data Center Project Scope
Reduce the number of redundant or over-lapping
5.3.2Determine if in Data Center Project Scope
Implement Service Oriented Architecture (SOA) citywide.
Evaluate for 2014/2015
budget cycleEvaluate
Implement if appropriate
Implement robust and comprehensive IT Portfolio Management
5.3Determine if in Data Center Project Scope
Implement Windows 7 5.7 Planning Planning and Complete
Implement Office 365 5.8 Planning Implementation Complete
Implement standard desktop management
5.5Implement System
Center Configuration Complete
Implementation
Implement standard server management
Evaluate for 2014/2015
budget cycleEvaluate
Implement if appropriate
Adopt IOEvaluate for 2014/2015
budget cycleEvaluate
Implement if appropriate
Microsoft Infrastructure Optimization
Table 3. Proposed Implementation of Executive Recommendations
Study Study RecommendationExecutive
Recommen-dation #
Summary of Next Steps by Year
Oracle Applications
Study
Included in Data Center project
Implement as appropriate
Implement as appropriate
Implement as appropriate
Implement as appropriate
Implement as appropriate


APPENDIX 1. City of Seattle Information Technology Employee Survey Prepared by Triangle Associates August 2012


City of Seattle Information Technology Employee Survey
August 2012
Conducted by:


Table of Contents
EXECUTIVE SUMMARY ................................................................................................................. 1
INTRODUCTION ........................................................................................................................... 3
METHODOLOGY .......................................................................................................................... 3
PREFACE ON SURVEY DESIGN AND REPONSES .............................................................................. 4
RESPONSES BY JOB CLASSIFICATION ............................................................................................ 6
SURVEY RESULTS ......................................................................................................................... 8
QUESTION 1: ARE YOU: ........................................................................................................................... 8 QUESTION 2: HOW MANY YEARS HAVE YOU BEEN WITH THE CITY? ................................................................... 9 QUESTION 3: HOW WOULD YOU RATE THE IT EFFICIENCY IN YOUR DEPARTMENT? (1=LOW, 10=HIGH) ................. 10 QUESTION 4: WHAT IS THE SINGLE MOST SIGNIFICANT ACTION WITHIN YOUR DEPARTMENT THAT WOULD
IMPROVE YOUR WORKING EFFICIENCY? ..................................................................................................... 12 QUESTION 5: WHAT ARE THE HIGH PRIORITY BUSINESS NEEDS THAT CITY IT SERVICES SHOULD BE PREPARED TO
SERVE IN THE FUTURE? ........................................................................................................................... 14 QUESTION 6: AS THE IT EFFICIENCY PROJECT MOVES FORWARD, IN WHAT WAYS DO YOU WANT TO BE INFORMED
ABOUT THE PROGRESS? (NOTE: PLEASE RECOMMEND TYPICAL METHODS OF COMMUNICATION. DO NOT PROVIDE
PERSONAL CONTACT INFORMATION.) ........................................................................................................ 16 QUESTION 7: HOW WOULD YOU RATE THE COMMUNICATIONS BETWEEN IT GROUPS IN OTHER DEPARTMENTS?
(1=VERY INEFFECTIVE, 10=VERY EFFECTIVE) .............................................................................................. 17 QUESTION 8: HOW WOULD YOU RATE HOW WELL IT STAFF WORK TOGETHER BETWEEN IT DEPARTMENTS?
(1=VERY POORLY, 10=VERY WELL)........................................................................................................... 18 QUESTION 9: WHAT WOULD YOU CHANGE TO IMPROVE YOUR PERFORMANCE AND ENHANCE THE QUALITY OF
YOUR WORK ENVIRONMENT (TO REMOVE OR DIMINISH IMPEDIMENTS)? .......................................................... 20 QUESTION 10: WHAT DO YOU FEEL IS THE DEGREE OF CHANGE COMING IN THE IT WORLD IN THE NEXT 3 YEARS?
(1=LOW, 10=HIGH) .............................................................................................................................. 22 QUESTION 11: WHAT JOB SKILLS DO YOU THINK YOU WILL NEED FOR THE FUTURE IT WORK ENVIRONMENT? .......... 24 QUESTION 12: WHAT TRAINING WOULD BE MOST HELPFUL TO YOUR FUTURE? WHY? (IF YOU KNOW SPECIFIC
COURSES BY NAME, PLEASE LIST THEM.) .................................................................................................... 26 QUESTION 13: WHAT DO YOU SEE AS THE MOST SIGNIFICANT CHANGE COMING IN THE IT WORLD IN THE NEXT 3
YEARS? WHY? ..................................................................................................................................... 28 QUESTION 14: IN YOUR OPINION, WHAT TYPE OF CHANGE IS COMING TO THE IT WORLD IN THE NEXT 3 YEARS
THAT COULD HAVE THE MOST SIGNIFICANT IMPACT ON THE EFFICIENCY OF THE SEATTLE IT DEPARTMENTS? WHAT
FACTORS ARE DRIVING THAT CHANGE? ...................................................................................................... 30 QUESTION 15: WHAT STEPS DO YOU THINK THE CITY SHOULD TAKE TO PREPARE FOR THIS CHANGE? ..................... 32
APPENDICES A–J ........................................................................................................................ 34


1 | P a g e S e a t t l e I T E m p l o y e e S u r v e y 2 0 1 2
Executive Summary
The intent of the employee survey was to gain City information technology (IT) employees’ and management’s perspectives on IT systems and protocols Citywide in order to identify efficiency, effectiveness, and security improvements. This report was designed to clearly and graphically present the survey results. Appendices were included to provide complete information on the responses to individual questions. The appendices were formatted in a way to protect the identity of the individual respondents.
Summary of Findings The survey contained 15 questions. Analysis of survey results revealed the following: Question 1: What is your job category?
• 60% IT Professional B or C, 15% IT Professional A, 11% Management, and 14% Other Question 2: How many years have you been with the City?
• 43% have worked between 5 and 15 years • Average tenure is 13 years and 4 months
Question 3: How would you rate the IT efficiency in your department? (1=low, 10=high)
• 75% of respondents rated IT efficiency as a 6 or higher • 14% of respondents rated IT efficiency as a 4 or lower
Question 4: What is the single most significant action within your Department that would improve your working efficiency? Most common responses included:
• Hire enough staff to get all jobs done • Increase collaboration • Keep workforce highly skilled (training)
Question 5: What are the high priority business needs that City IT Services should be prepared to serve in the future? Most common responses included:
• Mobile Device and Mobile Application Support • Increased data and network security • Cloud computing
Question 6: As the IT efficiency project moves forward, in what ways do you want to be informed about the progress?
• Nearly 80% of respondents indicated a preference for email communications Question 7: How would you rate the communications between IT groups in other departments? (1=very ineffective, 10=very effective)
• 55% of respondents rated 1 through 5 • 45% of respondents rated 6 through 10

2 | P a g e S e a t t l e I T E m p l o y e e S u r v e y 2 0 1 2
Question 8: How would you rate how well IT staff work together between IT departments? (1=very poorly, 10=very well) Most common responses included:
• 26% of respondents rated 1 through 4 • 74% of respondents rated 5 through 10 (9% rated 9 or 10)
Question 9: What would you change to improve your performance and enhance the quality of your work environment (to remove or diminish impediments)? Most common responses included:
• Increase training • Increase collaboration • Hire more non-administration/management staff
Question 10: What do you feel is the degree of change coming in the IT world in the next 3 years? (1=low,10=high)
• 83% rated between 6 and 10 • 30% rated a 9 or 10
Question 11: What job skills do you think you will need for the future IT work environment? Most common responses included:
• Mobile device, mobile computing • Web development • Project Management
Question 12: What training would be most helpful to your future? Why? Most common responses included:
• Mobile device • .NET • SQL Server
Question 13: What do you see as the most significant change coming in the IT world in the next 3 years? Most common responses included:
• Mobility, mobile devices • Cloud computing
Question 14: In your opinion, what type of change is coming to the IT world in the next 3 years that could have the most significant impact on the efficiency of the Seattle IT departments? Most common responses included:
• Greater demand for mobility and cloud based services 14a. What factors are driving that change?
• Cost savings, user demand Question 15: What steps do you think the City should take to prepare for this change? Most common responses included:
• Detailed training • Using cloud services • Agility (flexibility to new technology)

3 | P a g e S e a t t l e I T E m p l o y e e S u r v e y 2 0 1 2
Introduction
The Seattle City Council passed a Statement of Legislative Intent (SLI-75-1-A-2), which directed the Executive to conduct a review of information technology (IT) systems and protocols Citywide to identify efficiency, effectiveness, and security improvements (IT Efficiencies Project). The City Council requested that this review be a collaborative process with the active participation of employees representing departments across City government. This survey was conducted to solicit feedback from City IT staff and management about current conditions, thoughts about future IT change and challenges, and potential IT efficiencies. Survey findings will be communicated to the Seattle Mayor, Seattle City Council, department directors, and City employees. They will also be discussed in the IT Efficiencies Project final report in response to the Seattle Council Statement of Legislative Intent. The City Budget Office led the IT Efficiencies Project with extensive collaboration with City departments. In addition to this survey, there were three technical studies to identify potential efficiencies: 1) an infrastructure optimization study, which is an inventory of the City’s IT practices and comparison with industry practices, 2) an inventory of the City’s significant applications, and 3) a preliminary study of options for future data center services. Triangle Associates, an independent contractor, was hired by the City of Seattle in May 2012 to design, administer, and analyze this employee survey to help fulfill the City Council’s employee participation directive. Triangle Associates is a third party neutral facilitation/mediation firm that specializes in public involvement and policy.
Methodology
The data contained in this report summarizes the online survey. The survey was administered through SurveyMonkey.com and was conducted from June 26, 2012 to July 13, 2012. The survey had 15 questions, 10 of which were open-ended and 5 of which were closed. Survey questions were written collaboratively by City staff and neutral consultant staff with a goal to ensure that questions were not biased or leading. The Federation of Professional Engineers, Local 17 and its IT Professionals union members also provided input to developing the survey. Responses to each individual question were not mandatory; survey respondents could skip questions if they chose to. Survey participants were also informed this would be an anonymous survey. No information was collected that could identify survey respondents to ensure a safe and encouraging environment, which would hopefully result in a high degree of useful and honest information. Invitations to participate in the survey were sent to 568 Seattle IT management and staff members, the total survey population. Respondents completed the survey through the online Survey Monkey interface. Over 160 employees had either started or finished the survey within 24 hours of its release. A reminder notice was sent on July 9, 2012 to encourage participation in the survey. Per question, the highest response rate was 418 and the lowest was 229, with an average response rate of 306 responses per question. Results from this response rate can be interpreted to be accurate with a 95% level of confidence, meaning that there is a 95% chance that answers received are representative of all 568 participants invited. Out of the responses to all 15 questions, a total of 91 were miscellaneous uncoded comments.

4 | P a g e S e a t t l e I T E m p l o y e e S u r v e y 2 0 1 2
All responses to the questions were reviewed by neutral independent readers. None of the readers had contact with either employees or management prior to the completion of their work. Open-ended questions required qualitative analysis and coding in order to accurately interpret and represent survey results. Analysis and coding were manually executed by a team of three from the consultant firm, who independently reviewed each other’s work to ensure coder reliability.
Preface on Survey Design and Reponses
Survey Design The survey questions were designed to ensure they would effectively capture all participants’ perspectives on the key issues impacting IT efficiency. The key areas of inquiry were intended to better understand respondents’ beliefs about opportunities for efficiencies, how future change in the IT world will impact the City and its IT staff, and how best to prepare for that upcoming change. Questions were designed to gain insights into:
• What does “efficiency” mean? • What is the current IT efficiency in the (survey) respondent’s department? • What is impacting that efficiency and what could improve it? • What does the future IT world look like? • What future IT business needs will be in highest demand? • How well-prepared are Seattle IT Departments for that change? • How would you suggest the City better prepare for that change?
Collaboration There was strong collaboration with both the IT employees and management throughout the survey development and implementation. Numerous meetings were convened by the survey design team with management and Local 17 representatives to identify interests and define topics which would be most useful to the City to meet the objectives outlined in the City Council’s legislative intent SLI-75-1-A-2. The design team met with Local 17 Union leadership and IT management prior to designing the survey questions. Once the draft questions were developed, the questions were presented to Local 17 leadership and IT management for their review and input prior to releasing the survey. Upon completion of the survey and the preliminary data analysis, Local 17 leadership and IT management were briefed.
Survey Responses Of the survey questions, 5 questions were quantitative and 10 questions were qualitative (open-ended). Many individual responses to open-ended questions contained multiple specific answers to that particular survey question. Each specific answer, or “discrete comment”, was identified. For example, a question with 350 survey responses could contain over 400 discrete responses.

5 | P a g e S e a t t l e I T E m p l o y e e S u r v e y 2 0 1 2
The responses to qualitative questions are illustrated in this report in two ways: 1. General Response Themes 2. Most Common Comments
General Response Themes are the major themes, categories, or umbrellas that all “discrete comments” can easily fall under in a given question. Thus, the “General Response Themes” chart reflects the total number of “discrete comments” received per question, organized by theme. Most Common Comments are the “discrete comments” most commonly occurring within the responses to a given survey question. No specific threshold was set to define “Most Common” and “Most Common” is not intended to mean only the top two or three most repeated “discrete comments”. Instead, “Most Common Comments” is intended to display a broad range of comments that were reiterated within a survey question’s responses. The complete list of coded “discrete comments” for every question is presented in the appendices.

6 | P a g e S e a t t l e I T E m p l o y e e S u r v e y 2 0 1 2
Responses by Job Classification
The following bar graphs show how many responses each survey question received and the number of respondents per job category. For example, in question 1, 48 of the responses were from Management, 63 from IT A, 247 from IT B or C, 50 from Other IT, and 10 from Other. Question 1: Job Category: Total Response: 418
Question 2: How many years have you been with the City? Total Response: 339
Question 3: How would you rate the IT efficiency in your department? Total Response: 360
Question 4: What is the single most significant action within your Department that would improve your working efficiency? Total Response: 324
Question 5: What are the high priority business needs that City IT Services should be prepared to serve in the future? Total Response: 295
Question 6: As the IT efficiency project moves forward, in what ways do you want to be informed about the progress? Total Response: 312
Question 7: How would you rate the communications between IT groups in other departments? Total Response: 344
48 63 247 50 10
44 47 197 42 9
44 53 214 41 8
42 47 190 37 8
41 47 166 32 9
41 48 176 38 9
42 49 205 39 9
= 339
= 418
= 360
= 324
= 295
= 312
= 344

7 | P a g e S e a t t l e I T E m p l o y e e S u r v e y 2 0 1 2
Question 8: How would you rate how well IT staff work together between IT departments? Total Response: 348
Question 9: What would you change to improve your performance and enhance the quality of your work environment (to remove or diminish impediments)? Total Response: 296
Question 10: What do you feel is the degree of change coming in the IT world in the next 3 years? Total Response: 315
Question 11: What job skills do you think you will need for the future IT work environment? Total Response: 276
Question 12: What training would be most helpful to your future? Why? Total Response: 250
Question 13: What do you see as the most significant change coming in the IT world in the next 3 years? Why? Total Response: 260
Question 14: In your opinion, what type of change is coming to the IT world in the next 3 years that could have the most significant impact on the efficiency of the Seattle IT departments? What factors are driving that change? Total Response: 229
Question 15: What steps do you think the City should take to prepare for this change? Total Response: 234
42 51 206 40 9
39 42 172 34 9
40 46 187 34 8
37 39 163 29 8
30 34 153 26 7
40 40 150 22 8
37 36 131 18 7
37 36 134 19 8 = 234
= 229
= 260
= 250
= 276
= 315
= 296
= 348

8 | P a g e S e a t t l e I T E m p l o y e e S u r v e y 2 0 1 2
11.5%
15.1%
59.1%
12.0%
2.4%
Management (Director or Manager)
IT Professional A
IT Professional B or C
Other IT
Other (please specify)
Survey Results
Question 1: Are You: • Management (Director or Manager) • IT Professional A • IT Professional B or C • Other IT (Programmer Analyst, Programmer Analyst Specialist, Specialist, Systems
Analyst, Tech Support) • Other (Please Specify)
This question received a total of 418 survey responses. The most common response was “IT Professional B or C.”
(Please see Appendix A for a list of “Other” responses.)
Who answered this survey?
418 responses

9 | P a g e S e a t t l e I T E m p l o y e e S u r v e y 2 0 1 2
18
58
74 72
46
27 29
12
3
0 to 1 1 to 5 5 to 10 10 to 15 15 to 20 20 to 25 25 to 30 30 to 35 35 to 40
Question 2: How many years have you been with the City? This question received a total of 339 survey responses. Key Findings:
• 43% have worked between 5 and 15 years. • 78% of respondents have worked for the City for 5 years or more, and half of respondents have
worked with the City for 10 years or more. • 5% respondents have worked for the City for a year or less. • Average tenure is 13 years and 4 months.
Years with City

10 | P a g e S e a t t l e I T E m p l o y e e S u r v e y 2 0 1 2
5
12 15
19
40
52
85
74
43
16
1 2 3 4 5 6 7 8 9 10
Question 3: How would you rate the IT efficiency in your department? (1=low, 10=high) This question received a total of 361 survey responses. Key Findings
• 75% of respondents rated efficiency as a 6 or higher. • 37% rated efficiency as an 8 or higher. • 14% of respondents rated the IT department as a 4 or lower.
IT efficiency
Low High

11 | P a g e S e a t t l e I T E m p l o y e e S u r v e y 2 0 1 2
This page was intentionally left blank.

12 | P a g e S e a t t l e I T E m p l o y e e S u r v e y 2 0 1 2
Question 4: What is the single most significant action within your Department that would improve your working efficiency? This question received a total of 324 survey responses. Of the responses, there were a total of 339 discrete comments. Comments were divided into nine basic response themes. These are:
• Staffing improvements • Technology improvements • Managerial changes • Increased collaboration (within the
Department and with other Departments)
• Increased training • Process improvements • Productivity improvements • Increased IT funding • Other
Key Findings From the total discrete comments, the most significant actions that would improve working efficiency are:
• Increasing staff levels • Increasing collaboration and communication • Keeping IT workers highly trained
Secondary significant actions include:
• Increasing IT funding • Updating hardware and software • Changes in management
The following graphs display the number of comments per theme and the most common overall comments.
(Please see Appendix B for a breakdown of all responses to this question.)
13
18
22
35
36
40
41
45
89
Other
Increased IT Funding
Productivity Improvements
Process Improvements
Increased Training
Increased Collaboration
Managerial Changes
Technology Improvements
Staffing Improvements
Actions Improving IT Efficiency General Response Themes

13 | P a g e S e a t t l e I T E m p l o y e e S u r v e y 2 0 1 2
6
8
12
13
13
14
23
28
40
Allow remote work (work from home)
Fewer managers, more workers
Offer concise, transparent, and communicative leadership
Changes in management
Updated hardware and software
General request for increased IT funding
Keep workforce highly skilled (training)
Increase collaboration and communication within and between
Teams/Management/Business/IT
Hire enough staff to get all jobs done
Actions Improving IT Efficiency Most common comments (from all themes)

14 | P a g e S e a t t l e I T E m p l o y e e S u r v e y 2 0 1 2
Question 5: What are the high priority business needs that City IT Services should be prepared to serve in the future? This question received a total of 295 survey responses. Of the responses, there were a total of 356 discrete comments. Comments were divided into six basic response themes. These are:
• Connectivity and device support • Non-technological needs (e.g. agility,
training, internal policy, etc.) • Security
• Data management and communications • Web-based needs • Miscellaneous/Other
Key Findings The strongest feedback to this question was in support of:
• Mobile device and mobile application support • Increased security
Secondary to these was support for:
• Cloud computing • Collaboration tools • Flexibility to adapt to a changing technological landscape
The following graphs display the number of comments per theme and the most common overall comments.
(Please see Appendix C for a breakdown of all responses to this question.)
16
29
43
64
76
128
Web-based needs
Data management and communications
Security
Miscellaneous/Other
Non-technological needs
Connectivity and device support
High Priority Business Needs General Response Themes

15 | P a g e S e a t t l e I T E m p l o y e e S u r v e y 2 0 1 2
9
13
13
15
17
20
31
74
Reliable robust high speed infrastructure
Increased use of collaboration/sharing tools such as SharePoint
"Bring Your Own Device" support
City-wide WIFI / increased wireless services
Flexibility and adaptation for changing technologies
Cloud computing
Increased data and network security
Mobile Device and Mobile Application support (internal and external)
High Priority Business Needs Most common comments (from all themes)

16 | P a g e S e a t t l e I T E m p l o y e e S u r v e y 2 0 1 2
Question 6: As the IT efficiency project moves forward, in what ways do you want to be informed about the progress? (Note: Please recommend typical methods of communication. DO NOT provide personal contact information.) This question received a total of 312 survey responses. Of the responses, there were a total of 451 discrete comments. Key Findings
• Nearly 80% of respondents indicated a preference for email communications.
(Please see Appendix D for a breakdown of all responses to this question.)
3
3
4
4
5
9
14
16
17
47
73
247
2
5
2
Do Not Contact
Phone
RSS
Newsletter/flyer
Blog
Sharepoint
Other
Meetings (e.g. Brown Bags, Q&A sessions)
Website
Yes No
Requested methods of communication

17 | P a g e S e a t t l e I T E m p l o y e e S u r v e y 2 0 1 2
Question 7: How would you rate the communications between IT groups in other departments? (1=very ineffective, 10=very effective) This question received a total of 344 survey responses. Key Findings
• 55% of respondents entered a value of 1 through 5. • 45% of respondents entered 6 through 10. • 13% of respondents entered 1 or 2. • 36% of respondents entered 5 or 6. • 6% of respondents entered 9 or 10.
24 21
38
28
78
46
54
36
11 8
1 2 3 4 5 6 7 8 9 10
Communications between IT groups
Very ineffective
Very effective

18 | P a g e S e a t t l e I T E m p l o y e e S u r v e y 2 0 1 2
Question 8: How would you rate how well IT staff work together between IT departments? (1=very poorly, 10=very well) This question received a total of 348 survey responses. Key Findings
• 26% of respondents entered a value of 1 through 4. • 33% of respondents entered 5 or 6. • 32% of respondents entered 7 or 8. • 9% of respondents entered 9 or 10.
13
19
31 28
59
54 56 55
21
12
1 2 3 4 5 6 7 8 9 10
How well IT staff work together
Very poorly Very well

19 | P a g e S e a t t l e I T E m p l o y e e S u r v e y 2 0 1 2
This page was intentionally left blank.

20 | P a g e S e a t t l e I T E m p l o y e e S u r v e y 2 0 1 2
Question 9: What would you change to improve your performance and enhance the quality of your work environment (to remove or diminish impediments)? This question received a total of 296 survey responses. Of the responses, there were a total of 406 discrete comments. Comments were divided into 10 basic response themes. These are:
• Staffing • Management • Training/Education • Communication • Technology
• Project Management • Miscellaneous/Other • Morale and Team Building • DoIT Structure • Finance
Key Findings The most commonly heard theme related to staffing. However, across all the themes, the number one cumulative interest was training. Employees also expressed the need for more collaboration and communication between departments, sections, and divisions. Employees emphasized the need for more staff because employees are overloaded and stretched too thin, but not at the administrative or management level. Finally, upgraded computers, equipment, software, and hardware would increase quality and productivity. The following graphs display the number of comments per theme and the most common overall comments.
(Please see Appendix E for a breakdown of all responses to this question.)
11
12
14
15
25
58
60
62
67
82
Finance
DoIT Structure
Morale and Team Building
Miscellaneous/Other
Project Management
Technology
Communication
Training/Education
Management
Staffing
Improving Performance and Work Environment General Response Themes

21 | P a g e S e a t t l e I T E m p l o y e e S u r v e y 2 0 1 2
8
8
8
9
9
10
10
11
11
12
19
21
25
56
Clear strategic plan/roadmap with goals that define accountability (involve entire Division)
Reduce the number of supervisors/management
Improve communication between management and staff
Simpler, more unified IT environment
Management is more flexibile and able to adopt new processes and platforms
Clearer expectations and roles/responsibilities within department and between IT groups
Better prioritize projects and have better communication about priorities and when they
change
Reduce micro-management (trust staff can do their work), giving employees more autonomy
Ability to work remotely/telecommute
Reduce employee workload--overloaded and stretched too thin
Upgrade computers, equipment, software, and hardware
Hire more staff, but not at adminstration/management level
Increase collaboration between departments, sections, and divisions (cross-training/sharing
expertise)
Increase number of and access to trainings (especially in new technologies) at all employee
levels
Improving Performance and Work Environment Most common comments (from all themes)

22 | P a g e S e a t t l e I T E m p l o y e e S u r v e y 2 0 1 2
Question 10: What do you feel is the degree of change coming in the IT world in the next 3 years? (1=low, 10=high) This question received a total of 315 survey responses. Key Findings
• 83% entered a value between 6 and 10, indicating that the degree of change coming to the IT world would increase in the next 3 years.
• 30% entered a 9 or 10, indicating that there would be a high to very high degree of change within the next 3 years.
2 2
9 8
31
19
59
92
48 45
1 2 3 4 5 6 7 8 9 10
Degree of change coming to IT
Low High

23 | P a g e S e a t t l e I T E m p l o y e e S u r v e y 2 0 1 2
This page was intentionally left blank.
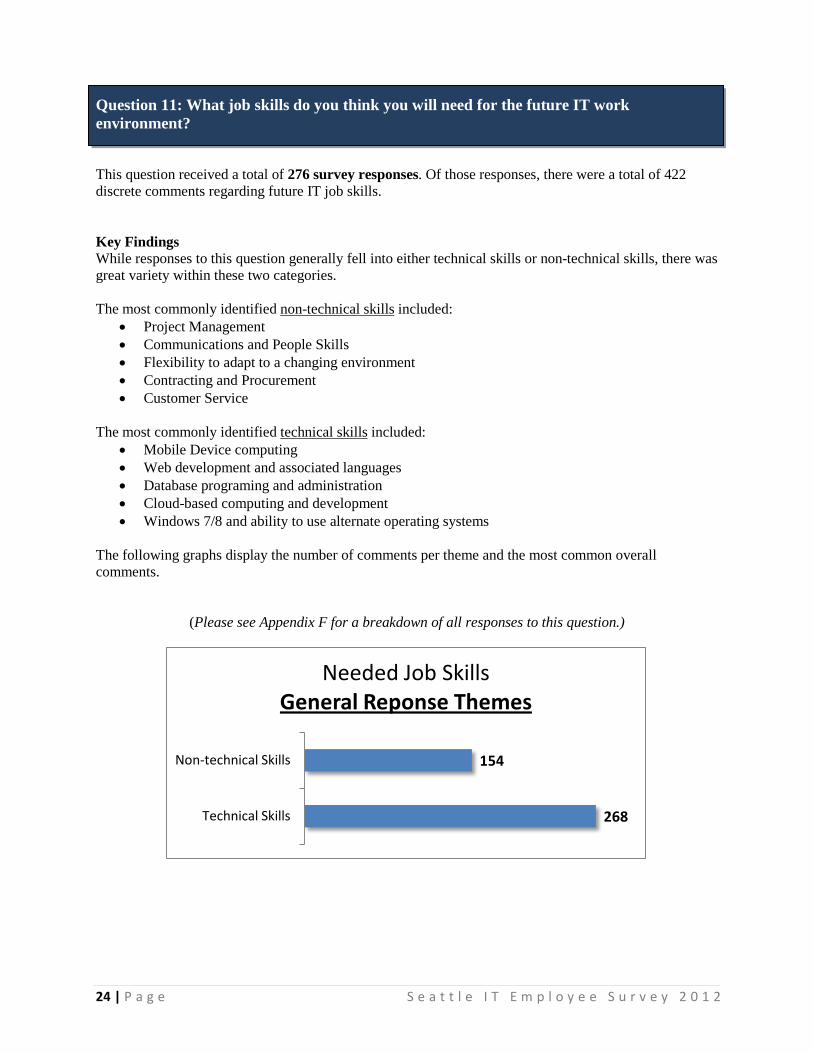
24 | P a g e S e a t t l e I T E m p l o y e e S u r v e y 2 0 1 2
Question 11: What job skills do you think you will need for the future IT work environment?
This question received a total of 276 survey responses. Of those responses, there were a total of 422 discrete comments regarding future IT job skills. Key Findings While responses to this question generally fell into either technical skills or non-technical skills, there was great variety within these two categories. The most commonly identified non-technical skills included:
• Project Management • Communications and People Skills • Flexibility to adapt to a changing environment • Contracting and Procurement • Customer Service
The most commonly identified technical skills included:
• Mobile Device computing • Web development and associated languages • Database programing and administration • Cloud-based computing and development • Windows 7/8 and ability to use alternate operating systems
The following graphs display the number of comments per theme and the most common overall comments.
(Please see Appendix F for a breakdown of all responses to this question.)
268
154
Technical Skills
Non-technical Skills
Needed Job Skills General Reponse Themes
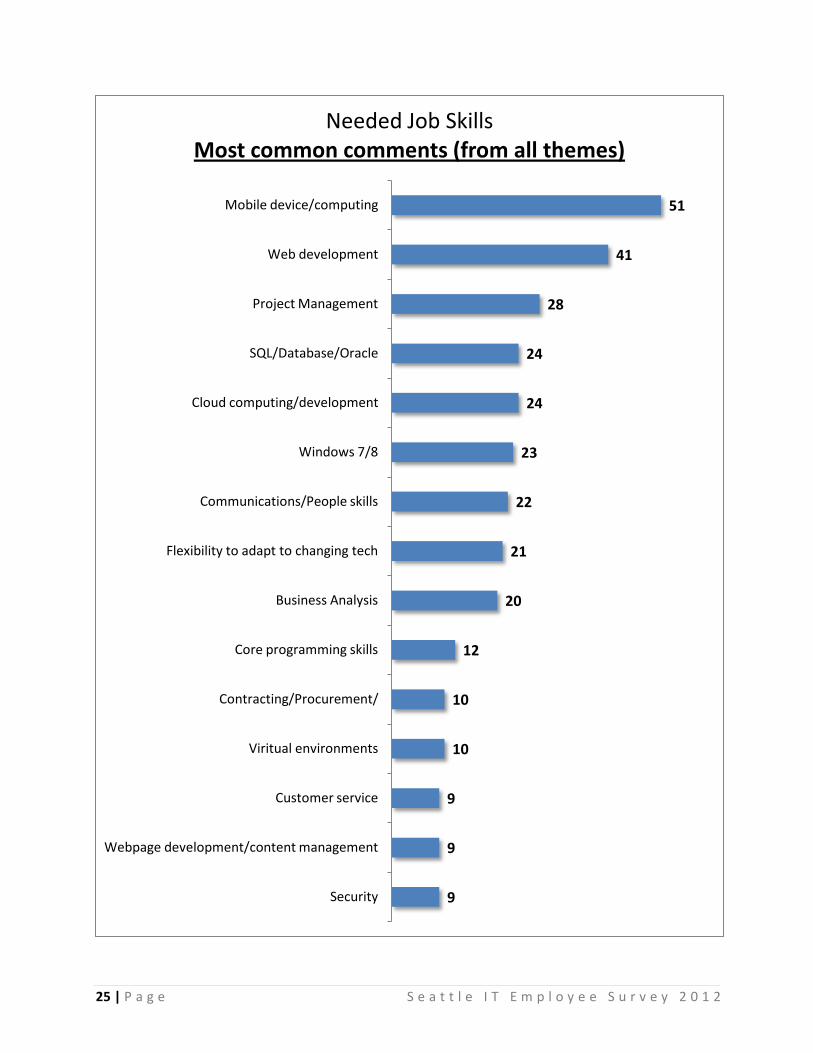
25 | P a g e S e a t t l e I T E m p l o y e e S u r v e y 2 0 1 2
9
9
9
10
10
12
20
21
22
23
24
24
28
41
51
Security
Webpage development/content management
Customer service
Viritual environments
Contracting/Procurement/
Core programming skills
Business Analysis
Flexibility to adapt to changing tech
Communications/People skills
Windows 7/8
Cloud computing/development
SQL/Database/Oracle
Project Management
Web development
Mobile device/computing
Needed Job Skills Most common comments (from all themes)

26 | P a g e S e a t t l e I T E m p l o y e e S u r v e y 2 0 1 2
Question 12: What training would be most helpful to your future? Why? (If you know specific courses by name, please list them.) This question received a total of 250 survey responses. Of the responses, there were a total of 479 discrete comments. Comments were divided into four basic response themes. These are:
• Technology Training • Business Training
• Non-Technology Training • Other
Key Findings While responses to this question generally fell into one of these four categories, there was great variety in the answers themselves. The most commonly identified technology trainings included:
• Mobile/Tablet • .Net • Database (SQL Server and Oracle) • Security • Cloud-based technology/computing
The most commonly identified business trainings included:
• Project Management • Business Analysis • General Business
The following graphs display the number of comments per theme and the most common overall comments.
(Please see Appendix G for a breakdown of all responses to this question.)
11
19
57
392
Other
Non-Technology Training
Business Training
Technology Training
Desired Trainings General Response Themes

27 | P a g e S e a t t l e I T E m p l o y e e S u r v e y 2 0 1 2
12
14
17
17
20
21
22
22
25
37
Emerging technologies (generally)
Oracle
Windows (7 and 8)
HTML5
Project Management
Cloud
Security and Forensics
SQL Server
.NET
Mobile/Tablet
Desired Trainings Most common comments (from all themes)

28 | P a g e S e a t t l e I T E m p l o y e e S u r v e y 2 0 1 2
Question 13: What do you see as the most significant change coming in the IT world in the next 3 years? Why?
This question received a total of 260 survey responses. Of the responses, there were a total of 346 discrete comments. Key Findings The majority of discrete responses related to mobility, cloud computing, and data storage. Many respondents indicated that this would change the way that City employees work. Several respondents indicated that significant changes within the next three years would change the way in which they deliver support services to their users. The following graphs display the number of comments per theme and the most common overall comments.
(Please see Appendix H for a breakdown of all responses to this question.)
13
14
26
32
49
80
132
Integration of Tools
Communications
Security
Hardware/Software
Future planning/Agility
Data Storage
Mobility
Most Significant Change to IT General Response Themes

29 | P a g e S e a t t l e I T E m p l o y e e S u r v e y 2 0 1 2
8
15
22
71
101
Shift to Windows 8 / Updating to Windows 7
Virtual desktops / telecommuting
Network and data security, especially with mobile devices
Cloud-based systems / virtualization
Mobile devices / applications / computing
Most Significant Change to IT Most common comments (from all themes)

30 | P a g e S e a t t l e I T E m p l o y e e S u r v e y 2 0 1 2
Question 14: In your opinion, what type of change is coming to the IT world in the next 3 years that could have the most significant impact on the efficiency of the Seattle IT departments? What factors are driving that change? This question received a total of 229 survey responses. Of the responses, there were a total of 296 discrete comments. This question contains two parts. The analysis has been divided into:
• Q14.a. What type of change is coming to the IT world in the next 3 years that could have the most significant impact on the efficiency of the Seattle IT departments? and,
• Q14.b. What factors are driving that change? Discrete comments for Q14.a. are divided into four general themes. These are:
• Technology • Staffing • Management • City Organization/Structure
Discrete comments for Q14.b. were broad and did not fall into overarching themes. Therefore, there is only one chart for this question, and it shows the most common comments. Key Findings Over 1/3 of all responses indicated that mobility and cloud computing are the most significant changes coming to the IT world in the next three years. The two most commonly reported driving factors are budgetary considerations and user demand.
(Please see Appendix I for a breakdown of all responses to this question.)
8
22
27
168
City Organization/Structure
Management
Staffing
Technology
Most Significant Change Affecting Efficiency Question 14.a. General Response Themes

31 | P a g e S e a t t l e I T E m p l o y e e S u r v e y 2 0 1 2
7
8
9
9
11
14
39
48
Potential outsourcing
Virtualization - IT world is becoming more centralized again
Continued pressure and need for privacy and protection of personal information
Demand to "do more with less;" be more efficient and cost-saving
Demand for more mobile applications
More demand for constantly evolving technology
Move to cloud services
Greater demand for mobility and remote access
Most Significant Change Affecting Efficiency Q14.a. Most common comments (from all themes)
4
4
7
12
16
Aging workforce and potential lack of qualified new employees
Consolidation of resources and staff
Aging equipment
User demand / consumer-driven technologies
Attempt at cost-saving to help with City budget
Factors Driving the Change Q14.b. Most Common Comments

32 | P a g e S e a t t l e I T E m p l o y e e S u r v e y 2 0 1 2
Question 15: What steps do you think the City should take to prepare for this change? This question received a total of 224 survey responses. Of the responses, there were a total of 297 discrete comments. Comments were divided into six general themes. These are:
• Specific actions the City can take to prepare for this change
• Staffing improvements
• Broadly focused steps for the City to consider in preparing for this change
• Strategic planning changes • Changes that management can make
Key Findings A large percentage of respondents suggested training as a way for the City to better prepare for upcoming changes. Some respondents focused on suggesting actions for the City that are very specific. Overall, suggestions included efficiency analysis and long-term planning. The following graphs display the number of comments per theme and the most common overall comments.
(Please see Appendix J for a breakdown of all responses to this question.)
24
28
69
81
95
Changes that management can make
Strategic planning changes
Broadly focused steps
Staffing improvements
Specific actions
Steps to Prepare for Change General Response Themes

33 | P a g e S e a t t l e I T E m p l o y e e S u r v e y 2 0 1 2
5
5
5
5
5
6
6
9
10
10
50
Reduce silo effect
Be open-minded to embrace change
Create a more strategic approach to technology
Gain skills in mobile technologies
Invest in employees
Make sure that apps are kept up with current technology
Be more flexible in order to compete with the private sector for skilled staff
Approach new technologies appropriately
Smarter investing / budgeting
Consider using cloud services
More detailed training opportunities for existing employees
Steps to Prepare for Change Most common comments (from all themes)

Appendix A
34 | P a g e S e a t t l e I T E m p l o y e e S u r v e y 2 0 1 2
Appendices A–J
Appendix A Question 1: Are you
Comments Frequency
MANAGEMENT (Director or Manager) 48
IT PROFESSIONAL A 63
IT PROFESSIONAL B OR C 247
OTHER IT (Programmer Analyst, Programmer Analyst Specialist, Specialist, Systems Analyst, Tech Support)
50
OTHER IT (Please Specify) 10
Strategic Advisor 3 Strategic Advisor I 1 Computer Operator 1 Enhanced CAD user 1 IT Project Manager 1 MSA Senior 1 Prefer not to respond 1 Principal Accountant 1
TOTAL NUMBER OF DISCRETE COMMENTS: 418

Appendix B
35 | P a g e S e a t t l e I T E m p l o y e e S u r v e y 2 0 1 2
Appendix B Question 4: What is the single most significant action within your Department that would
improve your working efficiency?
Comments Frequency
STAFFING IMPROVEMENTS 89 discrete comments
Hire enough staff to get all jobs done 40 Change in management 13 Fewer managers, more workers 8 Hire educated/skilled staff 6 Increase staff accountability 3 Business areas should hire analysts to define process needs 3 Stop outsourcing IT support 3 Remove inefficient staff 3 Add Director of Technology 2 Hire a qualified network analyst 1 Staff should arrive on time 1 Better CAD support 1 Hire one developer and one QA 1 Remove unions 1 Have City define staff levels underneath Director and Manager levels 1 Hire minority managers 1 Distribute staff as needed, not as favoritism 1
TECHNOLOGY IMPROVEMENTS 45 discrete comments
Updated hardware and software 12 Support mobile devices 2 Improve network efficiency 2 Establish virtual workstations 2 Increase support and use of standards 2 Increase technological resources 2 Increase managerial openness to new technology 2 Offer Web Content Management for PAN and InWeb 2 Increase up-to-date utilities and infrastructure 1 Increase speed on web-based applications 1 Use more open or shared source technology 1 Increase business application support 1 Identity Management 1 ITIL compliant IT Service Management Software 1 Stop using SCCM 1

Appendix B
36 | P a g e S e a t t l e I T E m p l o y e e S u r v e y 2 0 1 2
Comments Frequency Enforce SDLC standards 1 Stop writing custom software 1 Use HEAT 1 Provide larger Monitors 1 Increase worker access to systems 1 Implement a single standard for structures and equipment 1 Sync passwords between Novell / Active Directory 1 Offer better work stations 1 Use standardized software 1 Setup Windows Active Director correctly 1 Increase use of social media 1 Implement single sign-on 1
MANAGERIAL CHANGES 41 discrete comments
Increase managerial accountability 6 Remove bureaucratic roadblocks 6 Offer concise and communicative leadership 5 Use better project management (lean/agile) 4 Streamline management processes 2 Management should listen to employees 2 Increased transparency in management 2 Provide and communicate concrete management goals 2 Increase managerial transparency 1 Hold crosswalk with business and IT staff to clarify roles and responsibilities 1 Let employees provide input into management performance review 1 Consolidate IP and TPO 1 Include staff in project planning 1 Reduce micro-management 1 Reduce favoritism 1 Increase worker responsibility 1 Take Title VI seriously 1 Incorporate IT in all IT purchasing 1 Separate functional management from project management 1 Business units should be more agile 1
INCREASED COLLABORATION 40 discrete comments
Increase collaboration and communication within and between Teams/Management/ Business/IT
29
Business management should be more involved in prioritizing application work 5

Appendix B
37 | P a g e S e a t t l e I T E m p l o y e e S u r v e y 2 0 1 2
Comments Frequency Remove departmental IT silos 4 Enterprise architecture alignment 1 Include IT in design and purchase decisions 1
INCREASED TRAINING 36 discrete comments
Keep workforce highly skilled (training) 23 Offer departmental cross training 3 Offer training for end-users 2 Increased SQL Server & DBA skills to support application developers 1 Provide hardware training 1 Provide Cloud Technology and Mobile Device Training 1 Increase application knowledge for business processes 1 Increase understanding of relationship between systems 1 Business analysis training for subject matter experts 1 .NET development training 1 Using department specific systems training in employee orientation 1
PROCESS IMPROVEMENTS 35 discrete comments
Communicate with customers more 4 Reduce productivity reporting 3 Simplify business process to avoid automating bad processes 3 Enforce common process and procedures across all teams 3 Less process and paperwork 2 Remove redundant procedures 2 Intelligent prioritization of tasks 2 Crosswalk with business and IT staff to clarify roles and responsibilities 1 Clear, accurate and concise requirements and design documents 1 Shared City-wider services should apply only to areas that are value added 1 Streamline administrative overhead and non-productive work requirements 1 Increase resource analysis before prioritizing projects 1 Evaluate using better Key Performance Indicators 1 Coordinate and prioritize requests across business units 1 Improve project distribution 1 Consolidate job tasks 1 Standardized the document management system 1 Follow Systems Development Life Cycle processes 1 More end user computing 1 Improved communications on progress of ordinances 1 Establish project management office 1

Appendix B
38 | P a g e S e a t t l e I T E m p l o y e e S u r v e y 2 0 1 2
Comments Frequency Move desktop support from DoIT back to DPD 1 Better distribution of work within Business Technology 1
PRODUCTIVITY IMPROVEMENTS 22 discrete comments
Allow remote work (work from home) 6 Improve IT strategy and planning 4 Improve time, budget, and resource planning on projects and tasks 3 Transfer City-wide IT issues from IT to DoIT 1 Do not pool IT services; use embedded specialists 1 Reduce or eliminate flex hours 1 Increase development time 1 Quieter work environment 1 Staff should control their own hardware 1 Improve time, budget, and resource planning on projects and tasks 1 Departments should handle their own calls and tickets 1 Manage centrally, service should be decentralized 1
INCREASED IT FUNDING 18 discrete comments
General request for increased IT funding 14 One-year IT budget cycle 1 Funding to buy the right products 1 Increase resources 1 Transparency of training budget 1
OTHER 13 discrete comments
Better distribution of work with Business Tech/Peers 3 Executives should prioritize IT higher 2 Users should assume testing responsibilities 1 Daily tasks should be at operational level instead of tier 3 1 Co-locate with SDOT 1 Increase job security 1 Get out of cubicle to talk about issues 1 Comply with FIOA requirements for email 1 Improve quality; efficiency is fine 1 MS Desktop RAP - WDRAP 1
TOTAL NUMBER OF DISCRETE COMMENTS: 339

Appendix C
39 | P a g e S e a t t l e I T E m p l o y e e S u r v e y 2 0 1 2
Appendix C Question 5: What are the high priority business needs that City IT Services should be prepared to
serve in the future?
Comments Frequency
CONNECTIVITY AND DEVICE SUPPORT 128 discrete comments
Mobile Device and Application support (internal and external) 74 Cloud computing 20 City-wide Wi-Fi / increased wireless services 15 “Bring Your Own Device” support 13 Mobile support for field work 6
NON-TECHNOLOGICAL NEEDS 76 discrete comments
Flexibility and adaptation for changing technologies 17 Training employees 7 Remote access 6 Public Disclosure Requests 6 Prioritize end users and customers 5 Telecommute to work 4 Inevitable growth of IT needs 2 Increase / support non-contractor institutional knowledge 2 Consolidate of IT services 2 Allow departmental webpage control 2 IT involvement in business unit needs assessment 2 Increased efficiency 2 Balancing smaller budgets with increased needs 1 Improved Management Communications 1 Supporting SCL's 6 year plan 1 Circumnavigating monopolies in service providers 1 Succession planning 1 Business process and organizational redesign 1 Elimination of duplicate IT services 1 Increased communication with the public 1 Business side more involved in strategic planning 1 Removal of departmental IT silos 1 FOIA requests 1 Litigation 1 Increased need for improved billing systems 1 Increased need for core business services 1 Recycling, environmental awareness, and conservation education tools 1 Improved analysis methods 1 Securing a new software vendor 1 Asset management 1 Centralized oversight 1
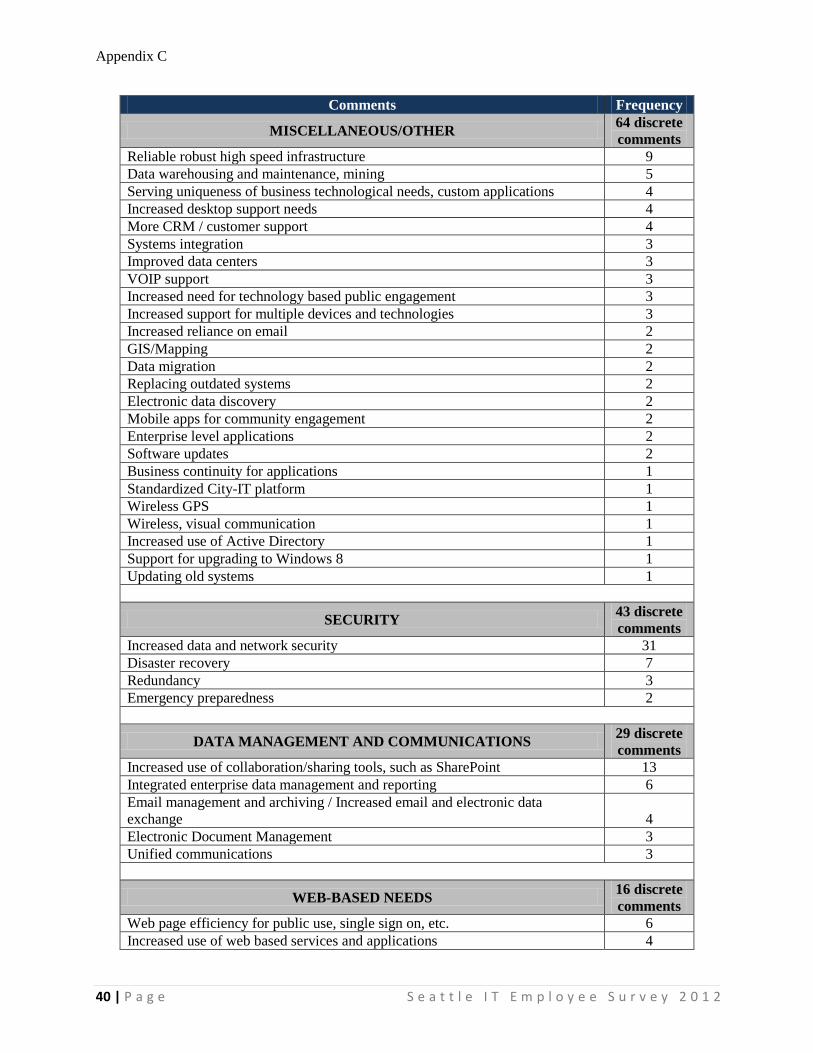
Appendix C
40 | P a g e S e a t t l e I T E m p l o y e e S u r v e y 2 0 1 2
Comments Frequency
MISCELLANEOUS/OTHER 64 discrete comments
Reliable robust high speed infrastructure 9 Data warehousing and maintenance, mining 5 Serving uniqueness of business technological needs, custom applications 4 Increased desktop support needs 4 More CRM / customer support 4 Systems integration 3 Improved data centers 3 VOIP support 3 Increased need for technology based public engagement 3 Increased support for multiple devices and technologies 3 Increased reliance on email 2 GIS/Mapping 2 Data migration 2 Replacing outdated systems 2 Electronic data discovery 2 Mobile apps for community engagement 2 Enterprise level applications 2 Software updates 2 Business continuity for applications 1 Standardized City-IT platform 1 Wireless GPS 1 Wireless, visual communication 1 Increased use of Active Directory 1 Support for upgrading to Windows 8 1 Updating old systems 1
SECURITY 43 discrete comments
Increased data and network security 31 Disaster recovery 7 Redundancy 3 Emergency preparedness 2
DATA MANAGEMENT AND COMMUNICATIONS 29 discrete comments
Increased use of collaboration/sharing tools, such as SharePoint 13 Integrated enterprise data management and reporting 6 Email management and archiving / Increased email and electronic data exchange 4 Electronic Document Management 3 Unified communications 3
WEB-BASED NEEDS 16 discrete comments
Web page efficiency for public use, single sign on, etc. 6 Increased use of web based services and applications 4

Appendix C
41 | P a g e S e a t t l e I T E m p l o y e e S u r v e y 2 0 1 2
Comments Frequency Increased reliance on Web and Social Media 4 Moving applications to web interface 2
TOTAL NUMBER OF DISCRETE COMMENTS: 356
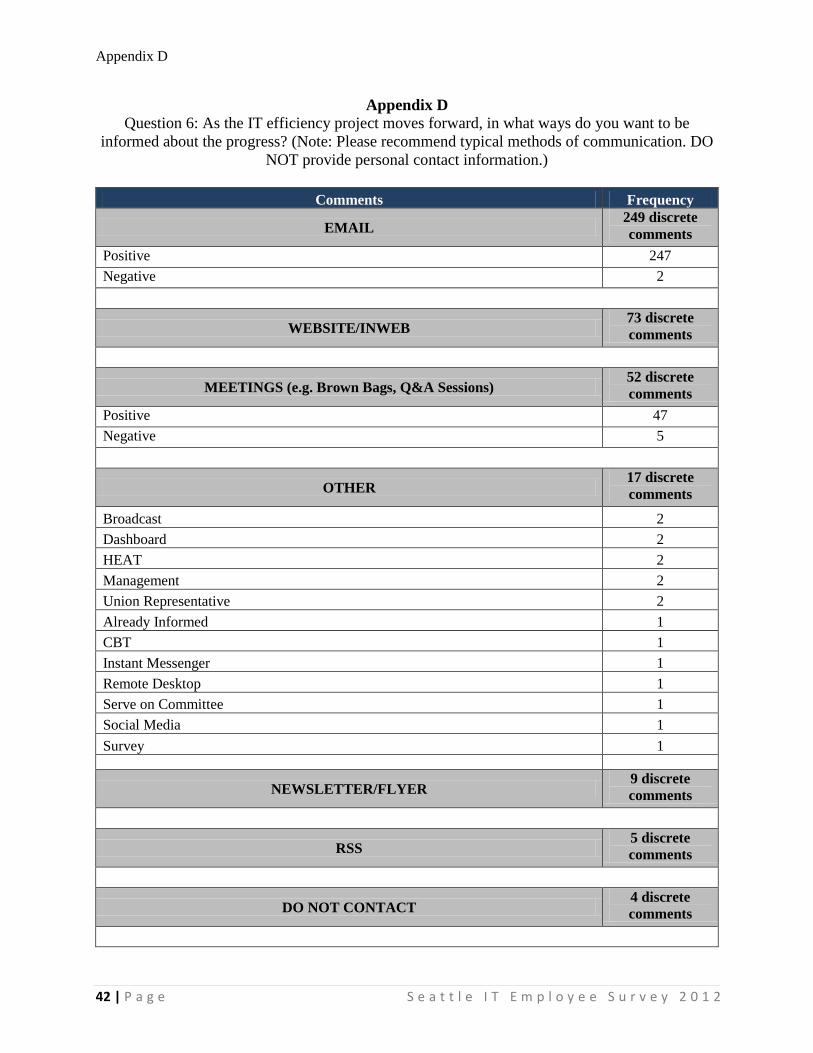
Appendix D
42 | P a g e S e a t t l e I T E m p l o y e e S u r v e y 2 0 1 2
Appendix D Question 6: As the IT efficiency project moves forward, in what ways do you want to be
informed about the progress? (Note: Please recommend typical methods of communication. DO NOT provide personal contact information.)
Comments Frequency
EMAIL 249 discrete comments
Positive 247 Negative 2
WEBSITE/INWEB 73 discrete comments
MEETINGS (e.g. Brown Bags, Q&A Sessions) 52 discrete comments
Positive 47 Negative 5
OTHER 17 discrete comments
Broadcast 2 Dashboard 2 HEAT 2 Management 2 Union Representative 2 Already Informed 1 CBT 1 Instant Messenger 1 Remote Desktop 1 Serve on Committee 1 Social Media 1 Survey 1
NEWSLETTER/FLYER
9 discrete comments
RSS 5 discrete comments
DO NOT CONTACT 4 discrete comments

Appendix D
43 | P a g e S e a t t l e I T E m p l o y e e S u r v e y 2 0 1 2
Comments Frequency
PHONE 4 discrete comments
MAIL 3 discrete comments
TWITTER 3 discrete comments
TOTAL NUMBER OF DISCRETE COMMENTS: 451
A portion of respondents answered the question with their preference on how often they would like to be notified; these answers are noted below.
Comments Frequency
REGULARLY 9 discrete comments
QUARTERLY 5 discrete comments
MONTHLY 4 discrete comments
WEEKLY/BI-WEEKLY 3 discrete comments
AS NEEDED 1 discrete comments
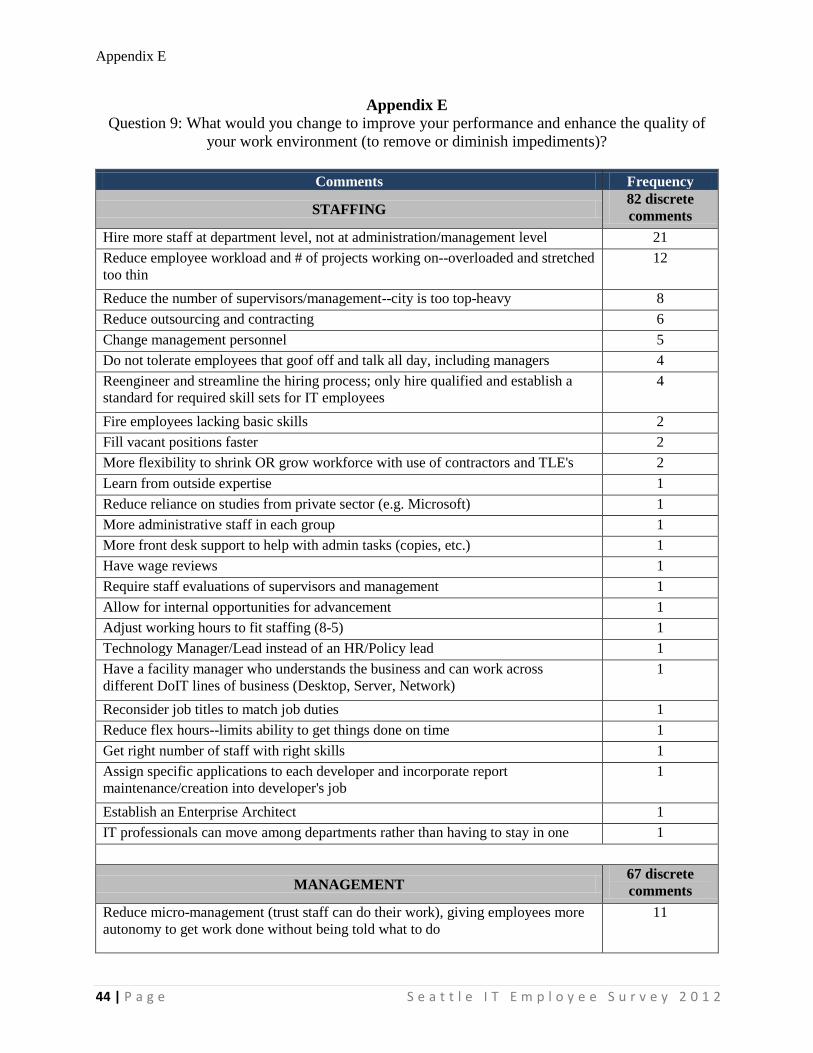
Appendix E
44 | P a g e S e a t t l e I T E m p l o y e e S u r v e y 2 0 1 2
Appendix E Question 9: What would you change to improve your performance and enhance the quality of
your work environment (to remove or diminish impediments)?
Comments Frequency
STAFFING 82 discrete comments
Hire more staff at department level, not at administration/management level 21 Reduce employee workload and # of projects working on--overloaded and stretched too thin
12
Reduce the number of supervisors/management--city is too top-heavy 8 Reduce outsourcing and contracting 6 Change management personnel 5 Do not tolerate employees that goof off and talk all day, including managers 4 Reengineer and streamline the hiring process; only hire qualified and establish a standard for required skill sets for IT employees
4
Fire employees lacking basic skills 2 Fill vacant positions faster 2 More flexibility to shrink OR grow workforce with use of contractors and TLE's 2 Learn from outside expertise 1 Reduce reliance on studies from private sector (e.g. Microsoft) 1 More administrative staff in each group 1 More front desk support to help with admin tasks (copies, etc.) 1 Have wage reviews 1 Require staff evaluations of supervisors and management 1 Allow for internal opportunities for advancement 1 Adjust working hours to fit staffing (8-5) 1 Technology Manager/Lead instead of an HR/Policy lead 1 Have a facility manager who understands the business and can work across different DoIT lines of business (Desktop, Server, Network)
1
Reconsider job titles to match job duties 1 Reduce flex hours--limits ability to get things done on time 1 Get right number of staff with right skills 1 Assign specific applications to each developer and incorporate report maintenance/creation into developer's job
1
Establish an Enterprise Architect 1 IT professionals can move among departments rather than having to stay in one 1
MANAGEMENT 67 discrete comments
Reduce micro-management (trust staff can do their work), giving employees more autonomy to get work done without being told what to do
11
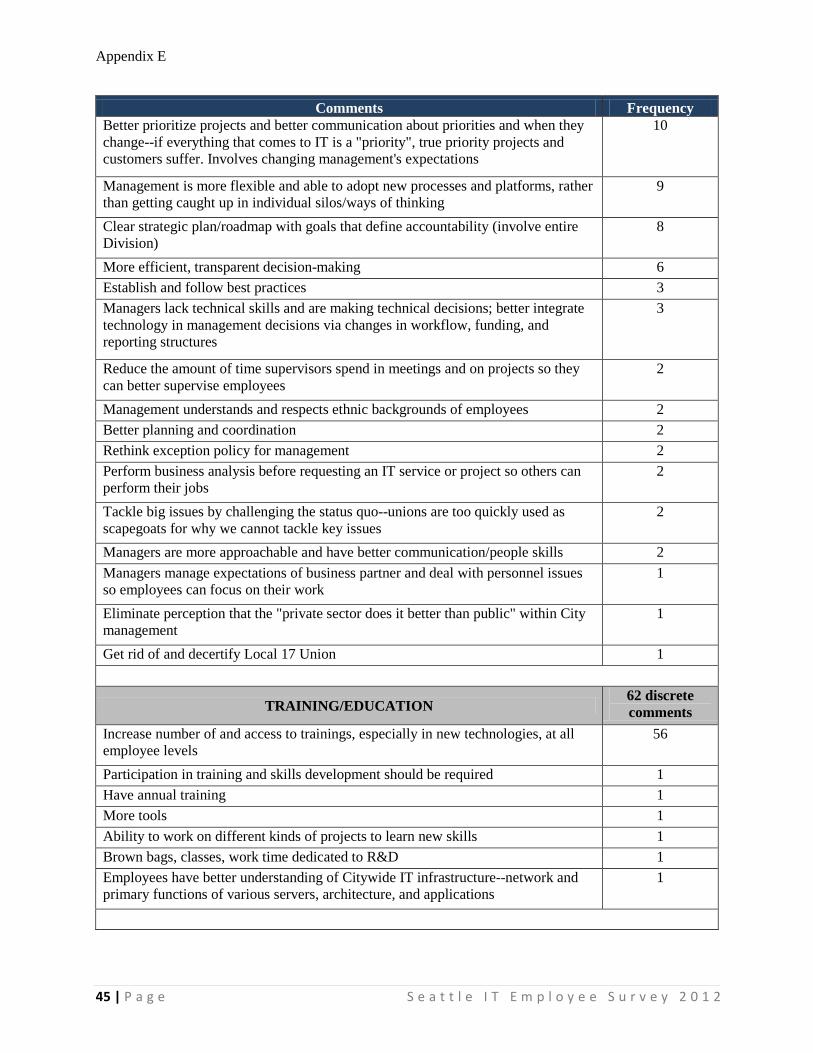
Appendix E
45 | P a g e S e a t t l e I T E m p l o y e e S u r v e y 2 0 1 2
Comments Frequency Better prioritize projects and better communication about priorities and when they change--if everything that comes to IT is a "priority", true priority projects and customers suffer. Involves changing management's expectations
10
Management is more flexible and able to adopt new processes and platforms, rather than getting caught up in individual silos/ways of thinking
9
Clear strategic plan/roadmap with goals that define accountability (involve entire Division)
8
More efficient, transparent decision-making 6 Establish and follow best practices 3 Managers lack technical skills and are making technical decisions; better integrate technology in management decisions via changes in workflow, funding, and reporting structures
3
Reduce the amount of time supervisors spend in meetings and on projects so they can better supervise employees
2
Management understands and respects ethnic backgrounds of employees 2 Better planning and coordination 2 Rethink exception policy for management 2 Perform business analysis before requesting an IT service or project so others can perform their jobs
2
Tackle big issues by challenging the status quo--unions are too quickly used as scapegoats for why we cannot tackle key issues
2
Managers are more approachable and have better communication/people skills 2 Managers manage expectations of business partner and deal with personnel issues so employees can focus on their work
1
Eliminate perception that the "private sector does it better than public" within City management
1
Get rid of and decertify Local 17 Union 1
TRAINING/EDUCATION 62 discrete comments
Increase number of and access to trainings, especially in new technologies, at all employee levels
56
Participation in training and skills development should be required 1 Have annual training 1 More tools 1 Ability to work on different kinds of projects to learn new skills 1 Brown bags, classes, work time dedicated to R&D 1 Employees have better understanding of Citywide IT infrastructure--network and primary functions of various servers, architecture, and applications
1

Appendix E
46 | P a g e S e a t t l e I T E m p l o y e e S u r v e y 2 0 1 2
Comments Frequency
COMMUNICATION 60 discrete comments
Increase collaboration between departments, sections, and divisions (cross-training/sharing expertise, skills, and knowledge) and work together as a team
25
Ability to work remotely/telecommute 11 Improve communication between management and staff 8 Fewer unnecessary meetings and more effective meetings (e.g. 50 minute meeting limit)
5
Improved communication between IT groups as well as between IT and Users 4 Need a centralized, integrated system to house personnel contact information (e.g. to look up who is supervising any given contractor); Citywide Directory is not linked to Exchange or to HR database or any other system
2
Increase communication among the applications, network, and desktop support groups within DoIT of Seattle Police Department
1
More cooperation between Mayor's office and Council re: managing IT strategy 1 Encourage use of "professional" social media to facilitate communication 1 All Calendars should be shared 1 Less email 1
TECHNOLOGY 58 discrete comments
Upgrade computers, equipment (e.g. faster printers), software, and hardware (loss of productivity costs more than getting new equipment)
19
Employees have input in management decisions (e.g. what hardware to purchase) 4
Develop funding strategies/increase budget for regular upgrades to technology (hardware and software)
4
More efficient DoIT desktop support 4 More electronic storage of information and email 3 Managers should consider how much effort is required to keep up with the latest technological trends before jumping on board
2
Increase access to secured wireless 2 More flexible and adaptable to changes in technology. "DoIT is too big, too slow, and too regulated" to take advantage of new technology quickly enough
2
Content management and standards 2 Increase transparency of documents and make them understandable to employees (e.g. strategic plan)
1
Reduce number of places the same information is recorded 1 Switch from paper documents to electronic 1 Use file access analysis tools to determine which files can be archived 1 More access to data 1

Appendix E
47 | P a g e S e a t t l e I T E m p l o y e e S u r v e y 2 0 1 2
Comments Frequency Standardize report structures across IT departments--too much time is wasted reporting the same things for different audiences; MITIE is too much reporting
1
Conduct software updates, upgrades, and virus scans after hours 1 Clean up issues with inconsistent SharePoint privileges 1 Enable SharePoint users to have more control of their sites 1 Allow Outlook users to create, own, and update their own distribution lists rather than putting in a service ticket to make changes
1
Able to set up virtual machine server instance in the cloud to perform immediate testing
1
Able to more easily order necessary systems parts due to repair/service issues 1 Better integrate technology and applications 1 All staff on same web browser and operating system 1 More intuitive and transparent ticket tracking system 1 Reduce number of days’ notice required for placing application enhancements to the public facing applications to the Wald
1
PROJECT MANAGEMENT 25 discrete comments
Clearer expectations and roles/responsibilities, with point person for each responsibility, within department and between IT groups
10
Agile Project Management--greater involvement of the end-user 4 More emphasis on quality and less on unrealistic deadlines 2 Better estimate time required for projects and tasks (get ahead in project scheduling instead of "fighting fires")
2
Better project managers (focused on results/efficiency, motivating team, and successfully facilitates complex project)
2
Employees are included in projects from conception to birth to death rather than just a small piece of a project
1
Project managers have the right to approve/decline employee/contract timesheets 1 More frequent and quick meetings to check in on projects 1 Implement work tracking tools to track/update status on multiple balls in court 1 Better process for scoping and defining requirements to address continuously changing deadlines and requirements
1
MISCELLANEOUS/OTHER 15 discrete comments
More resources 5 Less regulations and required DoIT services--departments that use DoIT should be able to prioritize their needs
1
Improve local governance to assure IT requests have required components (e.g. adequate O&M funding in project scope, obsolescence of legacy apps, etc.)
1

Appendix E
48 | P a g e S e a t t l e I T E m p l o y e e S u r v e y 2 0 1 2
Comments Frequency Operate more like a business 1 IT viewed as a partner delivery mechanism rather than a cost center 1 Develop a city-wide IT org chart that is available online 1 City-wide Security organization rather than embedding it in the DoIT 1 Less security--changing passwords every 2 months is a little extreme and reduces productivity
1
Change company culture to one of "performance and contribution." Employees should be required to be just as productive as private, for-profit counterparts
1
Require cell phone calls to be taken away from the desk and instead at "phone booths"
1
Improve work station and centralize staff 1
MORALE AND TEAM BUILDING 14 discrete comments
Management is nice to their employees, shows support, and shows employees that they are appreciated
6
More social IT gatherings to build relationships and team spirit 4 Reduce negative attitudes and resistance 2 Create employee incentives to motivate personnel and boost morale 1 Provide merit-based raises despite budget restrictions 1
DOIT STRUCTURE 12 discrete comments
Simpler, more unified IT environment. There should be 1 standard, efficient process for IT management. DoIT has gotten too big and delays projects, causing enormous financial costs
9
Restructure DoIT--make IT a partner to other business units 1 Combine SCL IT and Communications groups into 1 organization 1 Outsource or disband DoIT. They continue raising their rates to cover inefficiencies and therefore have no incentive to improve
1
FINANCE 11 discrete comments
Increase operating budget 3 Improve internal process-procurement, invoicing, department to department bill and spending, purchasing, and spending authority authorization
2
Stop changing IT budgets and IT personnel payroll. They should be a constant and consistent % of the total City budget with funds added for any new projects
1
Reduce Administrative Overhead 1 Reduce mandates from DoIT on what to purchase--many not wanted or not used 1

Appendix E
49 | P a g e S e a t t l e I T E m p l o y e e S u r v e y 2 0 1 2
Comments Frequency If a development request does not include funding for development AND ongoing maintenance and support, it should not be done
1
Politics and timing of budget submittals for Citywide projects 1 More transparency on spending within departments when working together on a project. If it's not competitive, should be allowed to outsource
1
TOTAL NUMBER OF DISCRETE COMMENTS: 406

Appendix F
50 | P a g e S e a t t l e I T E m p l o y e e S u r v e y 2 0 1 2
Appendix F Question 11: What job skills do you think you will need for the future IT work environment?
Comments Frequency
TECHNICAL SKILLS 268 discrete comments
Mobile device/computing 51 Web development 41 Cloud computing/development 24 SQL/Database/Oracle 24 Windows 7/8 23 Core programming skills 12 Virtual environments 10 Security 9 Webpage development/content management 9 Network architecture/admin 7 System Center Configuration Manager 7 GIS / graphic data 6 Systems analysis/management 4 Unix/Linux 4 C# 3 Data modeling 3 IPV6 3 Powershell 3 XML 3 Active Directory 2 Automation 2 Data management 2 Data storage 2 Open standards/Open source 2 Server management 2 Systems integration 2 VOIP 2 Application configuration 1 Backend tools 1 Data analysis 1 Office 2010 1 Systems analysis 1
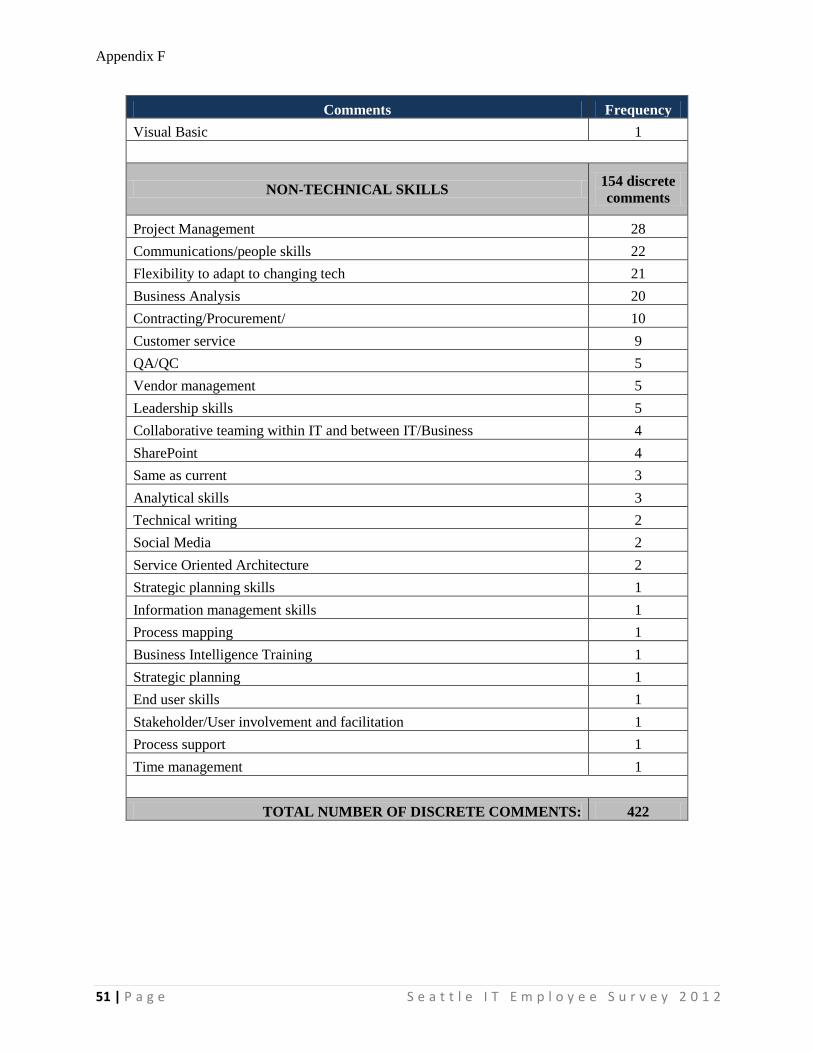
Appendix F
51 | P a g e S e a t t l e I T E m p l o y e e S u r v e y 2 0 1 2
Comments Frequency Visual Basic 1
NON-TECHNICAL SKILLS 154 discrete comments
Project Management 28 Communications/people skills 22 Flexibility to adapt to changing tech 21 Business Analysis 20 Contracting/Procurement/ 10 Customer service 9 QA/QC 5 Vendor management 5 Leadership skills 5 Collaborative teaming within IT and between IT/Business 4 SharePoint 4 Same as current 3 Analytical skills 3 Technical writing 2 Social Media 2 Service Oriented Architecture 2 Strategic planning skills 1 Information management skills 1 Process mapping 1 Business Intelligence Training 1 Strategic planning 1 End user skills 1 Stakeholder/User involvement and facilitation 1 Process support 1 Time management 1
TOTAL NUMBER OF DISCRETE COMMENTS: 422
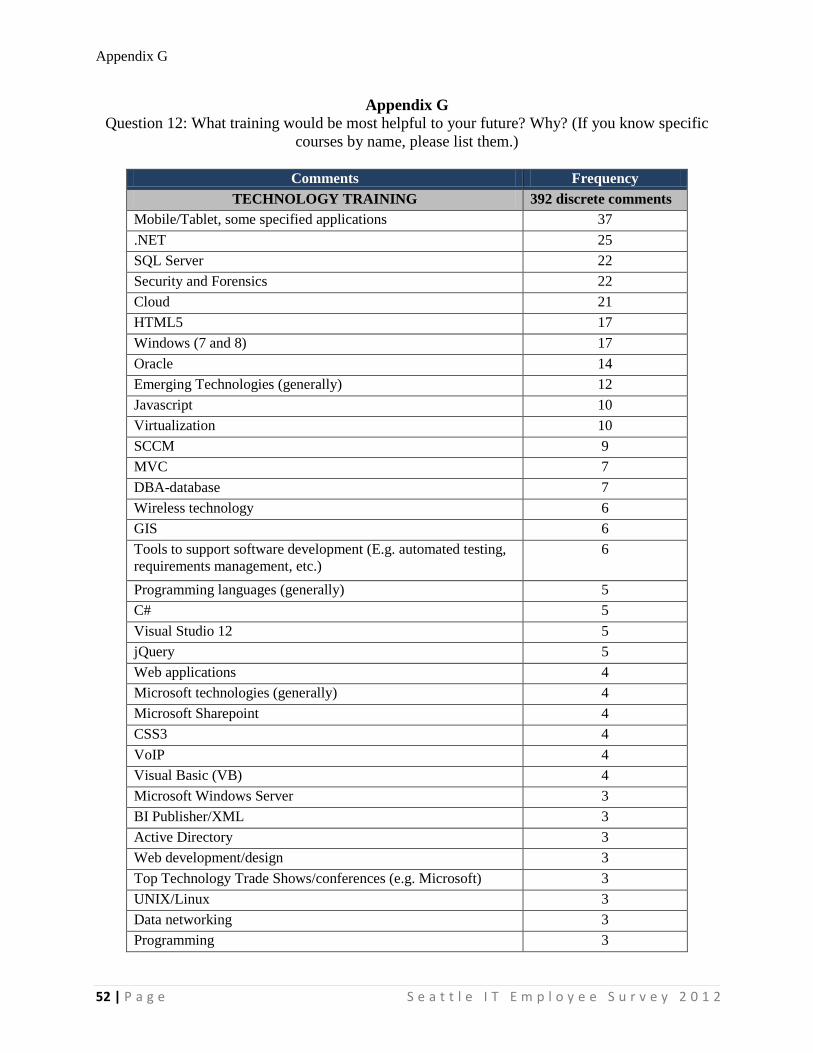
Appendix G
52 | P a g e S e a t t l e I T E m p l o y e e S u r v e y 2 0 1 2
Appendix G Question 12: What training would be most helpful to your future? Why? (If you know specific
courses by name, please list them.)
Comments Frequency TECHNOLOGY TRAINING 392 discrete comments
Mobile/Tablet, some specified applications 37 .NET 25 SQL Server 22 Security and Forensics 22 Cloud 21 HTML5 17 Windows (7 and 8) 17 Oracle 14 Emerging Technologies (generally) 12 Javascript 10 Virtualization 10 SCCM 9 MVC 7 DBA-database 7 Wireless technology 6 GIS 6 Tools to support software development (E.g. automated testing, requirements management, etc.)
6
Programming languages (generally) 5 C# 5 Visual Studio 12 5 jQuery 5 Web applications 4 Microsoft technologies (generally) 4 Microsoft Sharepoint 4 CSS3 4 VoIP 4 Visual Basic (VB) 4 Microsoft Windows Server 3 BI Publisher/XML 3 Active Directory 3 Web development/design 3 Top Technology Trade Shows/conferences (e.g. Microsoft) 3 UNIX/Linux 3 Data networking 3 Programming 3

Appendix G
53 | P a g e S e a t t l e I T E m p l o y e e S u r v e y 2 0 1 2
Comments Frequency Python 2 CCNA 2 AutoCAD 2 Cocoa 2 Cognos 2 Objective-C 2 ASP 2 Switch and Router configurations 2 New data storage technologies (other than SQL) 2 PHP 2 Coding/Automation 2 Server operating systems (generally) 1 IIS 7.5 1 RESTful web services 1 SQR Data 1 Outlook 1 Desktop 1 Crystal Reports 1 Revit 1 ESRI 1 ITIL 1 ADFS 1 TCP/IP 1 DHCP 1 DNS 1 OSPInsight 1 Microwave/Canopy 1 Citrix 1 Hardware and Software Visualization 1 SMS texting 1 VPN 1 Hyper-V 1 NVision 1 TSM 1 Scala 1 SCADA hardware/software 1 NAS 1 Microsoft Office 1 Microsoft Excel 1 Microsoft Azure 1

Appendix G
54 | P a g e S e a t t l e I T E m p l o y e e S u r v e y 2 0 1 2
Comments Frequency Cisco 1 Visio 1 Google Analytics 1 Load and network testing (for mobile applications) 1 Windows Communication Foundation (WCF) 1 Windows Presentation Foundation (WPF) 1 Multimedia content creation 1 User Experience Design 1 Infrastructure 1 Online Collaboration Tools 1 Reporting tools 1 Data integration 1 Advanced reporting techniques 1 Something similar to Emergenetics 1 Integration of various platforms (Apple, Linux, etc.) e.g. MacSvcOS and MacSvcHW
1
Web technology 1 SAN switches/storage 1 Technical tools 1 Microsoft Systems Center 1 Configuration manager 1 System/network architecture 1 HP data switch 1 Data warehousing 2 Session Initiation Protocol 1
BUSINESS TRAINING 57 discrete comments
Project management 20 Business Analyst (BA)/Business Analysis 9 General Business (finance, public policy, analytics, etc.) 8 Project Management, Agile 5 Management 5 Leadership 2 Vendor relationship management 2 Time management and priority setting 1 Teamwork 1 Best practices for unit testing and continuous integration development/test environments
1
SCRUM 1 Management Solution architecture 1

Appendix G
55 | P a g e S e a t t l e I T E m p l o y e e S u r v e y 2 0 1 2
Comments Frequency Technical and business architecture 1
NON-TECHNOLOGY TRAINING 19 discrete comments
Service-oriented architecture 4 Data analysis 4 Business Intelligence 3 Communication 2 IT Strategy and long-term planning 2 Process analysis 1 Managing information (from a taxonomy/metadata perspective) 1 Customer Service 1 IT in other organizations and regionally 1
OTHER TRAINING 11 discrete comments
Job-specific training 2 Cross-training divisions within departments 1 SCL website navigation 1 Web content management 1 Systems management tools 1 City architecture and infrastructure 1 Certified Ethical Hacker 1 Stress Management 1 On the job training 1 Private sector 1
TOTAL NUMBER OF DISCRETE COMMENTS: 479
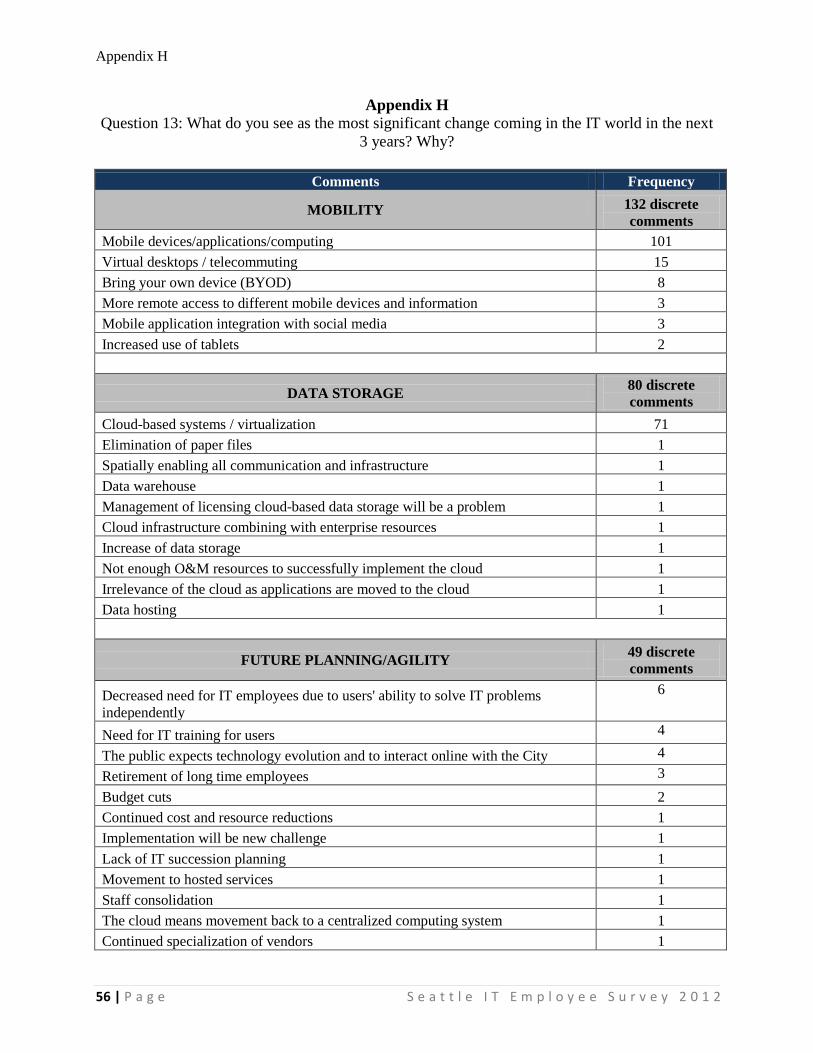
Appendix H
56 | P a g e S e a t t l e I T E m p l o y e e S u r v e y 2 0 1 2
Appendix H Question 13: What do you see as the most significant change coming in the IT world in the next
3 years? Why?
Comments Frequency
MOBILITY 132 discrete comments
Mobile devices/applications/computing 101 Virtual desktops / telecommuting 15 Bring your own device (BYOD) 8 More remote access to different mobile devices and information 3 Mobile application integration with social media 3 Increased use of tablets 2
DATA STORAGE 80 discrete comments
Cloud-based systems / virtualization 71 Elimination of paper files 1 Spatially enabling all communication and infrastructure 1 Data warehouse 1 Management of licensing cloud-based data storage will be a problem 1 Cloud infrastructure combining with enterprise resources 1 Increase of data storage 1 Not enough O&M resources to successfully implement the cloud 1 Irrelevance of the cloud as applications are moved to the cloud 1 Data hosting 1
FUTURE PLANNING/AGILITY 49 discrete comments
Decreased need for IT employees due to users' ability to solve IT problems independently
6
Need for IT training for users 4
The public expects technology evolution and to interact online with the City 4 Retirement of long time employees 3 Budget cuts 2 Continued cost and resource reductions 1 Implementation will be new challenge 1 Lack of IT succession planning 1 Movement to hosted services 1 Staff consolidation 1 The cloud means movement back to a centralized computing system 1 Continued specialization of vendors 1

Appendix H
57 | P a g e S e a t t l e I T E m p l o y e e S u r v e y 2 0 1 2
Comments Frequency No money or department support to do the work 1 Further integration of social media into IT business models 1 The beginning of a post-PC work environment 1 New communication resources like Skype 1 Increased citizen involvement 1 More software and applications support, less hardware and systems administration 1 Users expect everything to be easy and not complicated 1 Training on one type of technology doesn't last long; pretty soon training is needed for another type of technology 1 IT will be more agile, open, and mobile 1 Need to "do more with more" 1 The City politics determine direction(s) of the City 1
Document and information management 1
Resource IT divisions appropriately 1
Use statistic indicators to evaluate project efficiencies 1 Change from real-time field access to enterprise asset and work management systems 1
IT professionals should not keep IT 'mysterious' but should stay as consultant 1
Strategic planning 1
Define service levels and metrics 1
Process flow and work intake prioritization 1
Create a pay-for-what-you-use paradigm 1
Try to stay current 1
Accurate project performance metrics 1 Compare COTS options vs. building in-house 1
HARDWARE/SOFTWARE 32 discrete comments
Shift to Microsoft Windows 8 / Updating to Windows 7 8 Introduction of IPv6 4 More location-based applications on phones 3 Development on multiple platforms / open source / crowdsourcing 3 Outsourcing of essential IT infrastructure environments 2 Increased need for large scale enterprise applications 1 User interface change to using keyboard, mouse, and touch 1 Augmented reality 1 Upgrading infrastructure to support higher demands of 40 and 100 gigabit servers 1 Vendor based systems using Microsoft Active Directory 1

Appendix H
58 | P a g e S e a t t l e I T E m p l o y e e S u r v e y 2 0 1 2
Comments Frequency Proliferation of internet based processing 1 Diversity of technology (both software and hardware) 1 Using systems such as Xaas, VDI, Linux, and Citrix 1 Integration of current and new wireless technologies in platforms and technologies 1 NG systems 1 Real time data increase volume of data 1 SAS 1
SECURITY 26 discrete comments
Network and data security especially with mobile devices 22 Privacy concern especially with data storage on the cloud 3 Personal privacy 1
COMMUNICATIONS 14 discrete comments
VOIP 3 Tele or wireless communications 3 Networking infrastructure 3 Wireless networking - increased speed and efficiency 3 Increase of functional programming languages 1 Data exchanges 1
INTEGRATION OF TOOLS 13 discrete comments
Integration where possible 5 Integration of computer, phone, and media into a single device 3 Let users customize their interface 1 Integration of desktop fiber 1 Server and desktop OS custom applications 1 Responsive design for non-desktop devices 1 Interactive computing 1
TOTAL NUMBER OF DISCRETE COMMENTS: 346

Appendix I
59 | P a g e S e a t t l e I T E m p l o y e e S u r v e y 2 0 1 2
Appendix I Question 14: In your opinion, what type of change is coming to the IT world in the next 3 years
that could have the most significant impact on the efficiency of the Seattle IT departments? What factors are driving that change?
Comments Frequency
Q14.a. What type of change is coming?
TECHNOLOGY 168 discrete comments
Greater demand for mobility / demand for remote access 48 Move to cloud services 39 More demand for constantly evolving technology 14 Demand for more mobile apps 11 Virtualization - IT world is becoming more centralized again 8 Need for more agile and research-oriented development 3 Need to have huge volumes of data secure and discoverable 3 Increased use of fiber optics and crossover technology between copper and fiber 3 More open-source development 2 VOIP 2 Bring your own device 2 Demand to consolidate various systems into one 2 Looking towards using O365 and VDI 2 Integration of phones, computers, and other devices 2 Create desktop-like products to users like Software as a Service 2 Hardware changes 2 Upcoming Windows 8 - potential change 2 Demand for streamlined GIS services 2 Need for more tools to manage technology so fewer tasks are manual 2 Wireless communications 2 Reliable and high-speed storage systems 1 Demand for more and better telecommunications 1 Need to update the infrastructure of buildings 1 Move to web 4 1 Move from keyboard and mouse to a combination of keyboard, mouse, and touch 1 Changes to the platform 1 Desire to avoid cloud computing as it exposes the system to failure 1 Demand for green technology 1 Demand for smart apps 1 Demand for REID Technology 1 Demand for network-related programs and equipment 1 Faster operating system changes 1 Move to Citrix 1

Appendix I
60 | P a g e S e a t t l e I T E m p l o y e e S u r v e y 2 0 1 2
Comments Frequency Document management in the cloud 1 Move to windows file services 1
STAFFING 27 discrete comments
Potential outsourcing 7 Workforce retirement 4 Need for staff to constantly be trained in new systems 4 Better tools to collaborate between IT and the users 3 Need for staff reorganization (determine what types of services IT is able to provide) 2 Job mobility 1 Loss of knowledge for business operation and IT asset support 1 More demand from the public and City employees for information 1 Need to keep up while shifting to Windows 7 1 Move toward national/international ASP services 1 Need for backend support for cloud computing instead of in-person IT support 1 Need to listen and interact more with users 1
MANAGEMENT 22 discrete comments
Demand to do 'more with less,' be more efficient and cost-saving 9 Continued pressure and need for privacy and protection of personal information 9 Desire for increased accountability mechanisms for accounts and projects 1 Cannot keep up with any changes due to budget cuts 1 Desire for less waterfall planning 1 “Consumerization” of IT 1
CITY ORGANIZATION/STRUCTURE 8 discrete comments
Change will always be slow and gradual in the City 2 There is a move towards more centralized control, more restrictions, and less customer service
1
Centralize the desktop and network IT employees in DOIT and leave the application development to each department
1
Desire to move away from segmented IT evolution within different City departments 1 Change from horizontally-organized IT to top-down IT department 1 Demand for high level of cooperation between Departments 1 Need to balance work needed with resources available to do so 1

Appendix I
61 | P a g e S e a t t l e I T E m p l o y e e S u r v e y 2 0 1 2
Comments Frequency
Q14.b. What factors are driving that change? 71 discrete comments
Attempt at cost-saving to help with City budget 16 User demand / consumer-driven technologies 12 Aging equipment 7 Consolidation of resources and staff 4 Aging workforce and potential lack of qualified new employees 4 Demand for more mobile devices and mobile computing from business and government
3
Increased outsourcing to external vendors 3 Accessibility needs 2 Need to store any and all information 2 Social media and collaboration 2 Generation X and their expectation for services 2 Hardware demand 1 Failure to integrate functionality and merge business processes into coherent paths 1 Mobile access 1 Demand from individual divisions to get services directly from the Cloud instead of asking IT to build a service
1
Increasingly greater demand to store electronic information 1 Consolidation enabled by hyper threaded CPUs 1 Continued improvements in virtualization with disaster recovery capabilities 1 Frustration by City employees for VPN expense and inconsistency 1 Public records requests are draining on IT resources 1 Need to keep up with quickly evolving regional IT giants 1 Over-reliance on private sector services 1 Continued growth in web-based citizen engagement 1 Over-reliance on Microsoft-only services 1 More demand for transparency 1 1
TOTAL NUMBER OF DISCRETE COMMENTS: 296

Appendix J
62 | P a g e S e a t t l e I T E m p l o y e e S u r v e y 2 0 1 2
Appendix J Question 15: What steps do you think the City should take to prepare for this change?
Comments Frequency
SPECIFIC ACTIONS THE CITY CAN TAKE 95 discrete comments
Consider using cloud services and experiment by moving over low-risk infrastructure/application
10
Invest in and encourage research 6 Invest in employees 5 Gain skills in mobile technologies 5 Focus on security 4 Test equipment / pilot programs 2 Invest in mobile communications 2 Increased use of virtualization where possible 2 Develop standards for hardware/software to ensure that employees have necessary tools
2
Carefully consider consolidation 2 Prototype virtual desktops 1 Be able to hire contractors 1 Job rotations at all levels 1 Choose a small number of stable products/frameworks that will be used by all departments and standardize them (i.e., SharePoint)
1
Invest in a city-wide system to index facilities and cloud storage instead of renting these services
1
Open up communication among IT workers to encourage skilled workers to stay 1 Revamp current network infrastructure to accommodate massive data input/output to the Cloud
1
Provide training opportunities in networking and fiber optic tools 1 Support Linux; Windows Server is limited 1 Support IT Career Quest 1 Identify compatible technologies that will deliver solutions for at least 90% of user requirements
1
Lose old applications as soon as they become obsolete 1 Track/manage the third party software and cloud storage 1 Make tasks open and flexible so people are encouraged to use them 1 Establish standard practices for recordkeeping and document lifecycles 1 Consolidate storage 1 Update IT agenda 1 Establish IT enterprise architecture 1 Make sure that apps are kept up with current technology 1 Support Microsoft Hyper-V and VMware ESX virtualization platforms 1
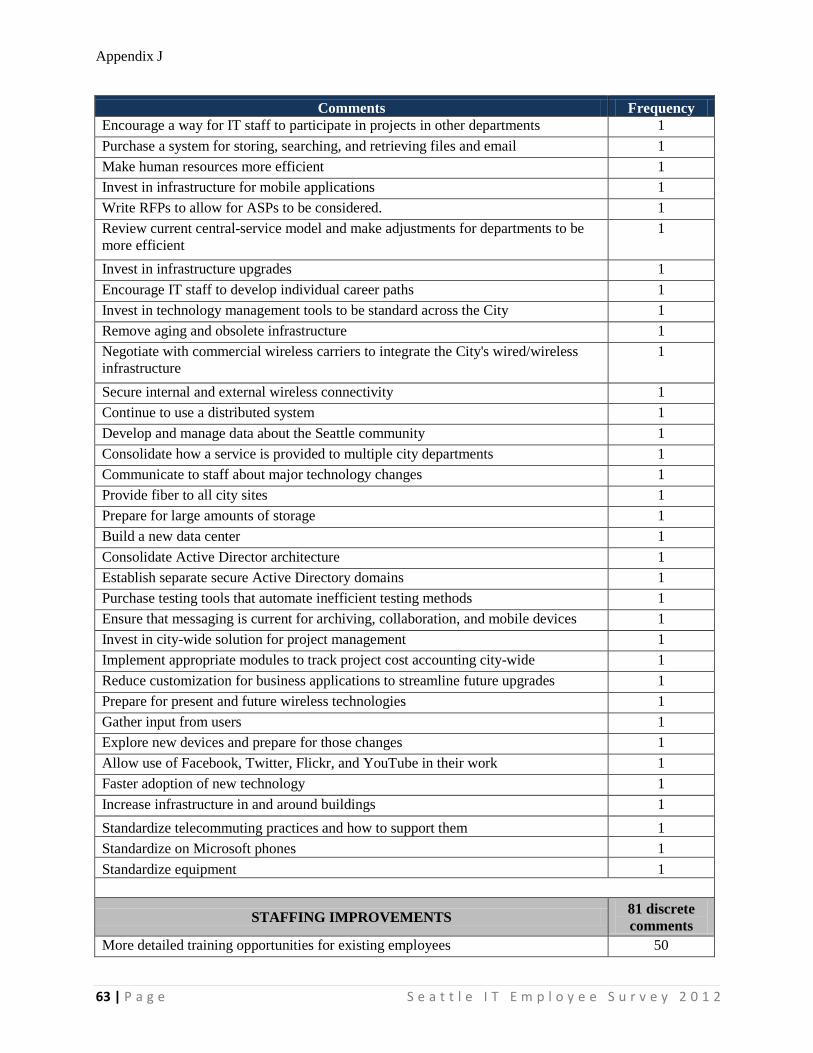
Appendix J
63 | P a g e S e a t t l e I T E m p l o y e e S u r v e y 2 0 1 2
Comments Frequency Encourage a way for IT staff to participate in projects in other departments 1 Purchase a system for storing, searching, and retrieving files and email 1 Make human resources more efficient 1 Invest in infrastructure for mobile applications 1 Write RFPs to allow for ASPs to be considered. 1 Review current central-service model and make adjustments for departments to be more efficient
1
Invest in infrastructure upgrades 1 Encourage IT staff to develop individual career paths 1 Invest in technology management tools to be standard across the City 1 Remove aging and obsolete infrastructure 1 Negotiate with commercial wireless carriers to integrate the City's wired/wireless infrastructure
1
Secure internal and external wireless connectivity 1 Continue to use a distributed system 1 Develop and manage data about the Seattle community 1 Consolidate how a service is provided to multiple city departments 1 Communicate to staff about major technology changes 1 Provide fiber to all city sites 1 Prepare for large amounts of storage 1 Build a new data center 1 Consolidate Active Director architecture 1 Establish separate secure Active Directory domains 1 Purchase testing tools that automate inefficient testing methods 1 Ensure that messaging is current for archiving, collaboration, and mobile devices 1 Invest in city-wide solution for project management 1 Implement appropriate modules to track project cost accounting city-wide 1 Reduce customization for business applications to streamline future upgrades 1 Prepare for present and future wireless technologies 1 Gather input from users 1 Explore new devices and prepare for those changes 1 Allow use of Facebook, Twitter, Flickr, and YouTube in their work 1 Faster adoption of new technology 1 Increase infrastructure in and around buildings 1 Standardize telecommuting practices and how to support them 1 Standardize on Microsoft phones 1 Standardize equipment 1
STAFFING IMPROVEMENTS 81 discrete comments
More detailed training opportunities for existing employees 50

Appendix J
64 | P a g e S e a t t l e I T E m p l o y e e S u r v e y 2 0 1 2
Comments Frequency Form committees to determine needs and offer solutions 2 Hire talented staff from outside 2 Increase staffing 2 Appreciate existing staff 2 Train replacements before the employee retires 2 Reduce inter- and intra-departmental politics 2 Have more surveys so employees can voice opinions 2 Don't cut too much - puts too much strain on those remaining 1 Support staff for upcoming changes 1 Replace retiring people with new faces 1 Hire IT managers from a pool of senior technical people 1 Hire a highly technical CTO with a computer science background 1 Mentorship by more veteran staff to less experienced staff 1 Have staffing levels be more responsive to individual department needs 1 Remove barriers to hiring consultants when needed 1 Encourage internal staff to prepare now for tomorrow's needs 1 Hire a full-time enterprise architect with authority for infrastructure decisions across all departments
1
Allow for business analysts for every project 1 Consider staffing for both operational and project work 1 Allow more opportunities for employees to meet one another 1 Hire a young workforce to embrace changes 1 Outsource 1 Promote from within instead of externally 1 Consider reducing aging employees 1
BROADLY FOCUSED STEPS 69 discrete comments
Smarter investing / budgeting 10 Approach new technologies appropriately 9 Be more flexible in order to compete with the private sector for skilled staff / compensation and benefits should keep up with corporate levels
6
Reduce silo effect 5 Prepare for more regular telecommuting and how to be supportive 3 Standardize business practices among departments 2 Carefully consider changes before implementing 2 Allow for smarter evolution of technology (out with the old, in with the new) 2 Think about how users work and what they need, then develop systems 2 Be proactive with changes 2 More flexibility in the City's personnel and contracting systems and with union contracts
1

Appendix J
65 | P a g e S e a t t l e I T E m p l o y e e S u r v e y 2 0 1 2
Comments Frequency Improve the image of working for the City 1 Reduce outsourcing 1 Keep current with market trends and updates 1 Consider how virtualization makes sense and where a distributed environment is still needed
1
Simplify business processes 1 Develop a unified, simplified data architecture 1 Identify the disconnects between the PC-based architecture and where the need is 1 Focus on changes that will be long-term changes; not ones that will soon be obsolete 1
Look at various options for how to maintain applications 1 Unify desktop and network to serve all departments 1 Address needs based on a needs assessment 1 Start planning early 1 Integrate systems to lessen duplication 1 Begin dialogue on next steps for training, resources, and funding 1 Remember that IT department is working for the City to meet needs 1 Get rid of Local 17 union 1 Reduce current project management and development practices 1 Management should be more trained to recognize upcoming IT changes and be more open to suggestions
1
Ensure stability and availability of network services to all departments 1 Avoid consolidation that would completely crash with any failure 1 Adopt more agile methodologies for project management 1 Better educate end users as technology environments evolves 1 Be more service oriented 1 Collaborate more with other government entities to share information, experiences, and expertise
1
Look at best practices 1
STRATEGIC PLANNING CHANGES 28 discrete comments
Create a more strategic approach to technology in the City as a whole 5 Seriously consider Windows 8 migration 4 Understand the environment and the drivers that shape it 2 Work directly with employees to build the teams needed and plan for the future 2 Reduce outsourcing 2 Prioritize when planning 2 Start identifying new roles in the identified new change 1 Create a plan for providing automation and related services to employees and customers
1
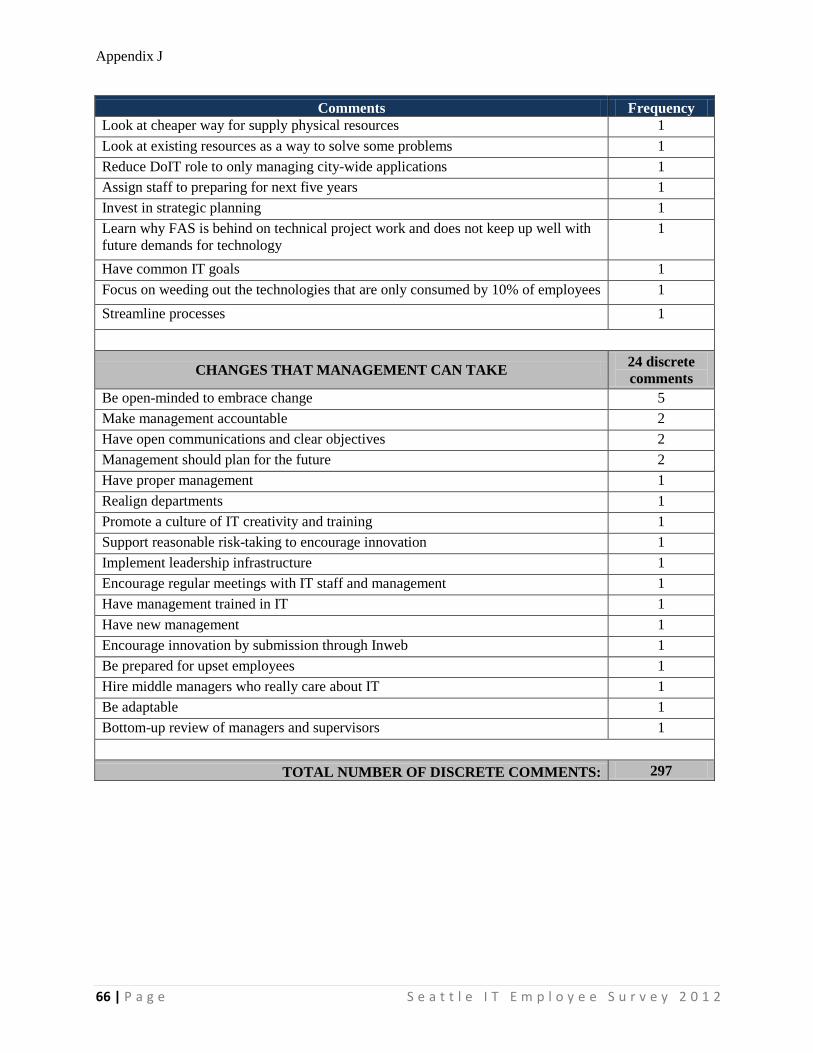
Appendix J
66 | P a g e S e a t t l e I T E m p l o y e e S u r v e y 2 0 1 2
Comments Frequency Look at cheaper way for supply physical resources 1 Look at existing resources as a way to solve some problems 1 Reduce DoIT role to only managing city-wide applications 1 Assign staff to preparing for next five years 1 Invest in strategic planning 1 Learn why FAS is behind on technical project work and does not keep up well with future demands for technology
1
Have common IT goals 1 Focus on weeding out the technologies that are only consumed by 10% of employees 1 Streamline processes 1
CHANGES THAT MANAGEMENT CAN TAKE 24 discrete comments
Be open-minded to embrace change 5 Make management accountable 2 Have open communications and clear objectives 2 Management should plan for the future 2 Have proper management 1 Realign departments 1 Promote a culture of IT creativity and training 1 Support reasonable risk-taking to encourage innovation 1 Implement leadership infrastructure 1 Encourage regular meetings with IT staff and management 1 Have management trained in IT 1 Have new management 1 Encourage innovation by submission through Inweb 1 Be prepared for upset employees 1 Hire middle managers who really care about IT 1 Be adaptable 1 Bottom-up review of managers and supervisors 1
TOTAL NUMBER OF DISCRETE COMMENTS: 297
APPENDIX 2. City of Seattle Data Center Efficiency Study Prepared by Hargis September 21, 2012


H:\My Documents\IT Efficencies\Appendix 2 12088_Report_final_CITY comments_120925 (2).docxH:\My Documents\IT Efficencies\Appendix 2 12088_Report_final_CITY comments_120925 (2).docx
0
City of Seattle
Data Center Efficiency Study
September 21, 2012
prepared by
A high-level review of the City’s current data center environments and operations to identify opportunities for efficiencies and optimization in their IT infrastructure.

1
Executive Summary Background and Objectives
The City of Seattle has invested in innovative and effective Information Technology (IT) solutions to deliver services to constituents and support citywide enterprise computing needs. As the role of technology has increased in the operation of the city and in serving the public interest, departments have developed data center environments to meet their functional and mission critical needs. Managing and operating these vital spaces is a considerable commitment of the city’s resources, especially considering the age and space limitations of the current operating environments. Looking ahead, the city is taking the opportunity to assess and document the data centers’ current environments, compare and contrast them against opportunities presented with today’s technologies, and develop options to create efficiencies in planning the next evolution in the city’s IT infrastructure.
Methodology
This study is based upon existing documentation, interviews with key staff and site tours to assess the current data center environments and IT systems with respect to their ability to provide secure, expandable, flexible, efficient, and reliable systems. The environments were also assessed according to industry trends, best practices and their capacity to support current and future needs.
Findings
From an infrastructure standpoint, there are deficiencies in the data centers with regards to the level of redundancy and reliability that are leaving mission-critical applications vulnerable to outages and downtime. There are also a number of IT systems varying in age and manufacturer. To continue to maintain and operate these disparate systems requires a significant investment of the city’s resources in soft and hard costs. The assessment revealed opportunities to develop citywide systems and processes which can improve the efficiency of the IT systems and the effectiveness of the IT staff.
Options
A range of options were considered for the city data centers including 1) maintaining all the existing data centers with minimal investment, 2) upgrading all the existing data centers, and 3) establishing a new main enterprise City of Seattle Data Center. Options for the existing data center environments were evaluated based on a set of criteria including cost and reliability. However, maintaining or upgrading the existing main city data center does not represent a prudent investment of city resources nor would it resolve essential IT data center requirements.
Therefore, this study recommends the city consider an option to relocate the main city data center, upgrade two other existing facilities and consolidate the other data centers. This option aligns with the city’s long-term goals by providing a more secure, reliable and resilient data center environment which presents additional opportunities for IT efficiencies through centralized core shared IT systems.

2
Background & Objectives The city commissioned a review of the information technology systems and protocols citywide to identify efficiency, effectiveness, security and resiliency improvements. This is a report on the city’s existing data center environments to support planning efforts for the next evolution of the city’s Information Technology (IT) infrastructure. The objective of the review is to provide options to capitalize on existing investments and optimize city resources as decision-makers strategize how to approach the city’s need for data center environments and define risk tolerances.
The City of Seattle has been at the forefront in utilizing IT solutions to support citywide operations and serving public interests. Investments in innovative IT systems and high-speed citywide networks have created a high demand for and reliance on the IT systems. As such, there are apparent risks to the operation of the enterprise.
From an IT perspective, the system of city data centers is configured as a hybrid of consolidated and independent data centers that have been created and developed to address the changing business and service needs of the city’s departments. The largest of these is the City of Seattle Data Center, completed in 2001. Since its completion, there have been exponential advancements in technology (e.g. virtualization, storage area networks, cloud computing) that offer efficiencies in maintaining and operating a data center. Likewise, industry standards have been established and best practices documented to serve as benchmarks for qualifying the physical and network design of data centers and identifying the resources required to support IT systems. Concurrently, evolutions in power and cooling technologies present additional opportunities for more sustainable and energy efficient operating environments.
Methodology
Step 1 –Developed evaluation criteria based upon: current industry trends and best practices, evolution of data center spaces, capacity planning, current and future needs, and tiering classification system for data centers.
Step 2 – Interviewed stakeholders to learn and acquire an understanding of current and anticipated needs.
Step 3 – Reviewed existing documentation to better understand existing conditions, future planning efforts and mission critical operations. Documentation included technology roadmaps, strategic plans, application inventories, equipment lists, system documentation/overviews, and previous reports commissioned by the City of Seattle.
Step 4 – Physical verification of existing systems supporting mission critical operations.
Step 5 – Consolidate and report findings against criteria established in Step 1.
Step 6 – Provide options and criteria for assessing potential data center strategies and IT initiatives.

3
Findings
The city currently operates one main data center which provides computing, storage, backup and networking services for individual departments and city agencies. In addition, some of the larger departments have over time developed their own data centers and IT spaces to support specific business needs and requirements. Each of these facilities contains a separate set of IT systems and IT support staff. This replication of systems and staff prohibits opportunities to realize savings through econonmy of scale and standardization and contributes to inefficient use of resources.
The study also evaluated and assessed the reliability and redundancy of the major systems operating within the city’s larger data center environments using an industry standard classification system (figure 1.) This classification system establishes performance tiers based upon over 200 data points including telecommunications, building construction, electrical, and mechanical systems.
A Tier III facility provides redundant systems to prevent downtime. It allows systems to be serviced and maintained without shutting down the data center, as well as preventive measures in the event a piece of equipment fails unexpectedly. Because of these capabilities, a Tier III data center is standard for an organization the size of the City of Seattle with the responsibility for public safety, critical infrastructure (utilities) and other mission critical operations. The existing city facilities assessed all have Tier I infrastructure while some also feature Tier II components, but none of the data centers assessed perform at a full Tier II, much less a, Tier III level.
Tier IV (Large enterprise) Independent paths and fully redundant systems Expected annual downtime: 0.04 hours Power outage tolerance: 96 hours
Tier III (Enterprise) Redundant systems with multiple paths for concurrent maintenance Annual downtime: 1.6 hours Power outage tolerance: 72hours
Tier II (Medium-size business) Redundant systems but no concurrent maintenance Expected annual downtime: 22.0 hours Power outage tolerance: 24 hours
Tier I (Small business) Basic level of infrastructure with no redundancy and multiple points of failure Expected annual downtime: 28.8 hours
Tiering Concept
figure 1
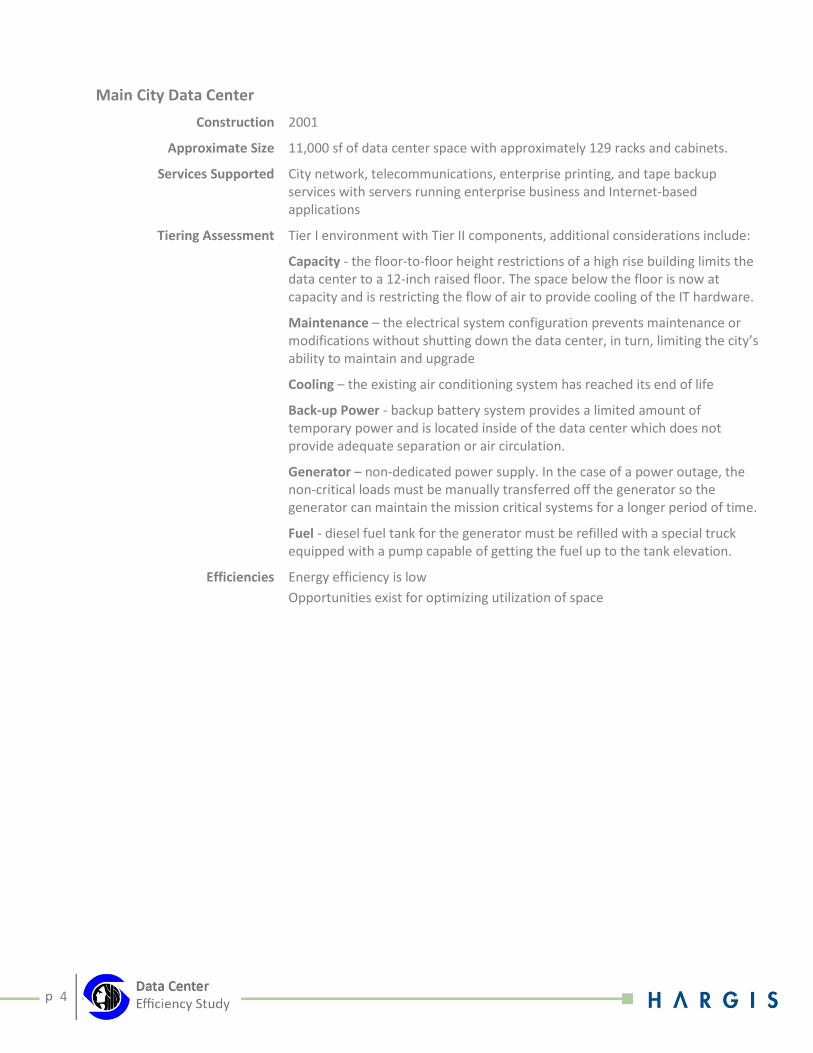
4
Main City Data Center
Construction 2001
Approximate Size 11,000 sf of data center space with approximately 129 racks and cabinets.
Services Supported City network, telecommunications, enterprise printing, and tape backup services with servers running enterprise business and Internet-based applications
Tiering Assessment Tier I environment with Tier II components, additional considerations include:
Capacity - the floor-to-floor height restrictions of a high rise building limits the data center to a 12-inch raised floor. The space below the floor is now at capacity and is restricting the flow of air to provide cooling of the IT hardware.
Maintenance – the electrical system configuration prevents maintenance or modifications without shutting down the data center, in turn, limiting the city’s ability to maintain and upgrade
Cooling – the existing air conditioning system has reached its end of life
Back-up Power - backup battery system provides a limited amount of temporary power and is located inside of the data center which does not provide adequate separation or air circulation.
Generator – non-dedicated power supply. In the case of a power outage, the non-critical loads must be manually transferred off the generator so the generator can maintain the mission critical systems for a longer period of time.
Fuel - diesel fuel tank for the generator must be refilled with a special truck equipped with a pump capable of getting the fuel up to the tank elevation.
Efficiencies Energy efficiency is low Opportunities exist for optimizing utilization of space

5
Seattle City Light
Construction 1998
Approximate Size 2,100 sf with 50 – 60 server and equipment racks.
Services Supported Mission critical electrical utility monitoring and marketing applications
Tiering Assessment Tier I environment with Tier II components, additional considerations include:
Maintenance – the electrical system configuration prevents maintenance or modifications without shutting down the data center
Cooling – some components have reached the end of their lifecycle and should be replaced
Generator – non-dedicated power supply. In the case of a power outage the non-critical loads must be manually transferred off of the generator so the generator can maintain the mission critical systems for a longer period of time.
Fuel - diesel fuel tank for the generator must be refilled with a special truck equipped with a pump capable of getting the fuel up to the tank elevation.
Efficiencies Older cooling systems are not energy efficient
Seattle Department of Transportation - Traffic Management Center
Construction 2001
Approximate Size 2,000 sf with 12 cabinets
Services Supported Operator stations and a large video wall which displays real time images of traffic conditions supported by servers that run the mission critical Intelligent Transportation System (ITS) used to operate and manage the traffic signals, cameras, and dynamic message signs
Tiering Assessment Tier I environment
Redundancy – Mission critical ITS is housed in small Equipment Room with several systems having single points of failure
Capacity – limited space to expand and accommodate conversions to new technology
Generator – non-dedicated power supply. In the case of a power outage the non-critical loads must be manually transferred off of the generator so the generator can maintain the mission critical systems for a longer period of time.
Fuel - diesel fuel tank for the generator must be refilled with a special truck equipped with a pump capable of getting the fuel up to the tank elevation
Maintenance – the electrical system configuration prevents maintenance or modifications without shutting down the data center
Efficiencies Opportunities for implementing virtual servers

6
Seattle Police Department (SPD)
Construction 2000-2006
Approximate Size 4,000 sf across 4 separate facilities with 50+ racks and cabinets
Services Supported 911, Network, Computer Aided Dispatch (CAD), Report Management (RMS), storage equipment, audio recording servers, digital evidence management systems and disaster recovery.
Tiering Assessment Tier I environment with Tier II components
Efficiencies Opportunities for consolidating spaces and systems
Seattle Fire Department (SFD)
Construction 2006
Approximate Size 4,000 sf distributed over 4 separate spaces with 50+ racks and cabinets
Services Supported processing of 911 calls and dispatch for the SFD units with the support of a server room, radio room, AV Room, and UPS battery room.
Back-up facility for SPD and DoIT
Tiering Assessment Tier I environment with Tier II components for mechanical, electrical, network and servers systems
Capacity – Space for existing systems but limited capacity for all of City’s mission critical applications.
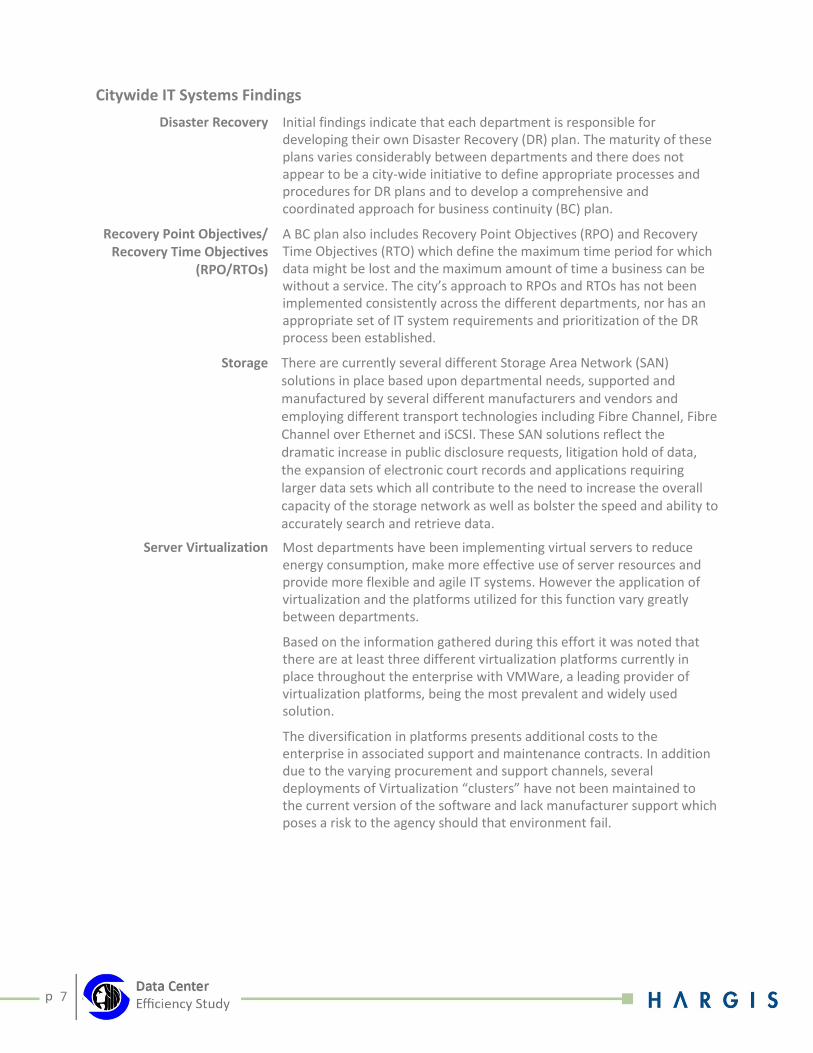
7
Citywide IT Systems Findings
Disaster Recovery Initial findings indicate that each department is responsible for developing their own Disaster Recovery (DR) plan. The maturity of these plans varies considerably between departments and there does not appear to be a city-wide initiative to define appropriate processes and procedures for DR plans and to develop a comprehensive and coordinated approach for business continuity (BC) plan.
Recovery Point Objectives/ Recovery Time Objectives
(RPO/RTOs)
A BC plan also includes Recovery Point Objectives (RPO) and Recovery Time Objectives (RTO) which define the maximum time period for which data might be lost and the maximum amount of time a business can be without a service. The city’s approach to RPOs and RTOs has not been implemented consistently across the different departments, nor has an appropriate set of IT system requirements and prioritization of the DR process been established.
Storage There are currently several different Storage Area Network (SAN) solutions in place based upon departmental needs, supported and manufactured by several different manufacturers and vendors and employing different transport technologies including Fibre Channel, Fibre Channel over Ethernet and iSCSI. These SAN solutions reflect the dramatic increase in public disclosure requests, litigation hold of data, the expansion of electronic court records and applications requiring larger data sets which all contribute to the need to increase the overall capacity of the storage network as well as bolster the speed and ability to accurately search and retrieve data.
Server Virtualization Most departments have been implementing virtual servers to reduce energy consumption, make more effective use of server resources and provide more flexible and agile IT systems. However the application of virtualization and the platforms utilized for this function vary greatly between departments.
Based on the information gathered during this effort it was noted that there are at least three different virtualization platforms currently in place throughout the enterprise with VMWare, a leading provider of virtualization platforms, being the most prevalent and widely used solution.
The diversification in platforms presents additional costs to the enterprise in associated support and maintenance contracts. In addition due to the varying procurement and support channels, several deployments of Virtualization “clusters” have not been maintained to the current version of the software and lack manufacturer support which poses a risk to the agency should that environment fail.

8
Data Center Services Customization – Many of the larger city departments provide their own set of data center services and staff to support their business needs and IT requirements, including technical support, application development, operations, maintenance, and administration. These separate IT organizations possess a high degree of expertise and knowledge and there exists a high degree of communication and collaboration between the individual IT organizations.
Each of the City’s individual IT organizations has over time, purchased and developed their own IT systems to address their specific business needs. These independent efforts have resulted in a distributed set of separate IT systems which often require a duplication of maintenance contracts, support skill sets, and technical resources which can translate into an inefficient use of IT support and technology resources.
Communication – Each of the city’s IT organizations must be responsive to their own department’s unique business needs; however this individual departmental focus has prevented the City from establishing a defined set of core city-wide shared services and standards. This has been a limiting factor in the City’s ability to find efficiencies in the IT systems and realize economies of scale possible with centralized and shared set of common IT systems.
Prioritization - There also does not appear to be an enterprise-wide process for identifying which applications and IT systems are mission critical and which are a priority for the operation of the City. This may be leading to a discrepancy between the understanding of the critical nature of the application and the infrastructure which supports it

9
Options Various options were considered for the City of Seattle data centers ranging from maintaining the existing facilities in their current state, upgrading all facilities to establishing a new main data center that provides the level of resilience and redundancy common to enterprises similar to the City of Seattle’s. Each of the options was evaluated based on factors including: current data center standards, industry best practices, total cost of ownership (TCO), business needs and IT efficiencies. The options were also assessed in their ability to address current and future needs, and their ability to accommodate and adapt to emerging technologies. Finally the level of reliability, resiliency, and fault tolerance of each of the options was rated based on the level of protection provided for mission critical operations.
The systems options were rated on common set of criteria (figure 3):
Meets city objectives
Contributes, but does not meet city objectives
Does not meet city objectives
This ranking system provides a common framework for assessing the relative value of the three options from an IT perspective.
Initial budgetary projections are included to provide a measure of relative costs for each option. The projections are based upon anticipated hard costs including material and equipment procurement, construction, implementation, configuration and testing. The budgetary projections do not include soft costs such as staff time required to plan, organize and coordinate the implementation of the options. The budgetary cost projections are based on preliminary data and best professional judgement. These figures need to be reviewed and assessed during a pre-design study to confirm estimated costs and potential cost savings based on a more detailed and defined set of design requirements.
Data Center Standards
Reliability & Resiliency
Disaster Recovery
Business Continuity
Mitigates Vulnerability of Failure
Best Practices
Server Virtualization
Cloud Computing
Energy Efficient
Reflective of Business-line Standard Practices
Capacity & Adaptability
Meets Current Needs
Capability to Expand
Flexible & Adaptive Environment
TCO
Code Compliant
Long Term Maintainability
Ease of Serviceability
Utilization of Resources (Economies of Scale)
Reduced Total Cost of Ownership
figure 2

10
Option 1
This is the lowest cost option that addresses some of the immediate needs at the existing main data center. It entails keeping the data center in its current location and replacing the existing aging and failing air conditioning system with a more energy efficient system and upgrading the facility to current energy and building codes.
Option 1 does not address the deficiencies or issues at the other city data centers. It lacks in bolstering a higher level of redundancy and reliability for the city’s mission critical operations. It also exposes the city to risk of failure through its inability to perform maintenance without shutting down the data center. Due to the inherent limitation of the existing location and building construction this option does not provide a facility which will meet long-term requirements for the city or adequately reduce the total cost of ownership. To implement this option, system modifications include:
Meets city objectives
Contributes, but does not
satisfy city objectives
Does not meet city objectives
Data Center Standards
Reliability & Resiliency
Disaster Recovery
Business Continuity
Mitigates Vulnerability of
Failure
Best Practices
Server Virtualization
Cloud Computing
Energy Efficient
Reflective of Business-line
Standard Practices
Capacity & Adaptability
Meets Current Needs
Capability to Expand
Flexible & Adaptive
Environment
TCO
Code Compliant
Long Term Maintainability
Ease of Serviceability
Utilization of Resources
Reduced Total Cost of
Ownership
• Replace existing air conditioning system and include outside air economization to meet current energy code requirements and reduce energy consumption.
• Improve air circulation and energy efficiency by implementing air containment strategies to direct cold air and exhaust hot air.
• Modify interior walls and spaces of the main city data center to provide the required separation and air circulation.
Initial budgetary cost projection1
Replace air conditioning system………………...…..$1,832,000 - $2,200,000
Airflow containment……………………………………..………$250,000 - $300,000
Space modifications and code updates..……………….$210,000 - $360,000
Total…….…………………………………………………………$2,292,000 - $2,860,000
1 Note: Cost projection does not include expected savings of $70,000 annually resulting from the more energy efficient cooling system.

11
Option 2
Option 2 expands upon Option 1 by upgrading critical systems in the main data center to ‘near’ Tier II levels and includes additional modifications to other data center spaces. However, this option leaves the city data center in its current location and operating environment with its significant limitations and deficiencies. These limitations make it impractical and cost prohibitive to achieve an enterprise data center environment with a Tier III level of redundancy, reliability and maintainability and which is capable of keeping pace with technical evolutions. To implement Option 2, system modifications would include:
Meets city objectives
Contributes, but does not
satisfy city objectives
Does not meet city objectives
Data Center Standards
Reliability & Resiliency
Disaster Recovery
Business Continuity
Mitigates Vulnerability of
Failure
Best Practices
Server Virtualization
Cloud Computing
Energy Efficient
Reflective of Business-line
Standard Practices
Capacity
Meets Current Needs
Capability to Expand
Flexible & Adaptive
Environment
TCO
Code Compliant
Long Term Maintainability
Ease of Serviceability
Utilization of Resources
Reduced Total Cost of
Ownership
• Replace existing air conditioning system serving the main data center with fully redundant, automated and energy efficient system.
• Implement hot-cold aisle topology and air containment strategies in the main data center to maximize energy efficiency.
• Upgrade the main data center’s electrical system, including UPS enhancements, increase generator capacity, increased fuel storage tank capacity and a redundant generator.
• Create redundant service entrance facilities for telecommunications networks, to include outside plant pathways into the building with dedicated rooms with minimum separation. Enhance seismic support of the existing technology cabinets and enclosures.
• Modifications based on code.
• Upgrade electrical, mechanical architectural and telecommunications systems at four other ancillary data center to provide Tier II level or near to level of redundancy and reliability.
Initial budgetary cost projection2
Replace air conditioning system…………………………$2,748,000 - $3,750,000
Increase airflow and circulation…………..……………..$2,000,000 - $3,000,000
Upgrade electrical system………..……………………….. $2,250,000 - $2,850,000
Telecommunications network upgrade…………………….$780,000 - $960,000
Space modifications and code updates……………………..$646,000 - $871,000
Ancillary data center upgrades………………...…………$2,000,000 - $3,000,000
Total……………………………….………..……..……….…$10,424,000 – $14,431,000
2 Note: Cost projection does not include expected savings of $70,000 annually resulting from the more energy efficient cooling system.

12
Option 3
Option 3 optimizes the utilization of the city’s existing resources while creating a fault tolerant enterprise environment capable of evolving with and capitalizing on technology advancements. It includes establishing a new Tier III data center and upgrading two existing, mission critical data centers to Tier II. It centralizes data center spaces and configures them to provide integrated support to achieve disaster recovery and business continuity goals.
Option 3 offers a flexible approach which can be implemented in multiple ways including building a new facility, leasing space or partnering with other organizations seeking similar resiliency in their computing environments. This approach also lends itself to a phased implementation allowing parts of the option to proceed independently or on a separate schedule from other parts.
Applying a mirror strategy to duplicate mission critical systems and data between all three locations allows the separate facilities to operate as a single integrated data center environment. Should any one of the three sites fail or require maintenance the city’s mission critical IT systems can continue to operate seamlessly from one of the other sites.
Within a shared data center environment, command and control of sensitive data and compliance with regulated applications can be maintained through network security strategies, physical separation, and other methods.
The budgetary cost projections for Option 3 include investments at the two existing city data centers including: upgrades to air conditioning systems, primary and backup power systems, redundant and diverse telecommunication and network systems and an enhanced fire protection system required to bring these facilities to a full Tier II performance level.
The budgetary cost projections for the Tier III facility are based on the construction costs of 15,000 square feet of usable data center space. This size was chosen based on the city’s current operating environment. However this space requirement and associated costs are contingent on the city’s direction with other strategies including reducing the quantity of concurrent applications, consolidating applications and systems, and shifting applications to the cloud. Exploring these options further could offset or reduce the initial cost projections.
Additionally the initial capital costs represented in the budgetary cost projections may be partially offset by annual cost savings realized by the City from reducing the number of data center spaces, lowering energy consumption and other IT efficiencies.
Option 3 is recommended based on its alignment with stakeholder objectives and its ability to provide a resilient and flexible approach for the citywide data center environment and IT infrastructure.
figure 3

13
Meets city objectives
Contributes, but does not
satisfy city objectives
Does not meet city objectives
Data Center Standards
Reliability & Resiliency
Disaster Recovery
Business Continuity
Mitigates Vulnerability of
Failure
Best Practices
Server Virtualization
Cloud Computing
Energy Efficient
Reflective of Business-line
Standard Practices
Capacity
Meets Current Needs
Capability to Expand
Flexible & Adaptive
Environment
TCO
Code Compliance
Long Term Maintainability
Ease of Serviceability
Utilization of Resources
Reduced Total Cost of
Ownership
Initial budgetary cost projections
Tier III Facility Ground-up construction (excludes land & utility costs) $33,750,000 - $37,500,000
or Leased Space (annual cost of $1.4 million)……………..……$ 29,250,000 - $33,000,000
Tier II Facilities (existing) Air condition system upgrades……………………………….…$200,000 - $300,000
Electrical system upgrades………………………………….…….$500,000 - $600,000
Telecommunications and network system upgrades…$530,000 - $660,000
Fire protection upgrades…..………………………….………….$175,000 - $225,000
Total……………………………………………………….…….$30,655,000 - $39,285,000 Cost savings contributions (annual)
Utility and energy costs………………………………………………………….…… $92,661
Reduction of existing data center environments………………….…….$588,615 (Includes estimated annual cost savings from rent on exsiting data center spaces no longer required.)
Total…………………………………………………………………………………..……$681,276

14
Other Enterprise IT Infrastructure Considerations
The following items represent additional opportunities to improve the data center infrastructure while contributing to overall efficiencies and reduction in the enterprise capital and operating expenditures for IT systems. They contribute to a more resilient environment with substantially less risk for outages. Although presented as an itemized list, all of these options should be considered collectively and in conjunction with substantial upgrades to existing data center environment to fully realize the associated benefits. Pursuing these options will require significant investment of resources to establish standards, processes and coordinate efforts to implement but with the potential return on investment of more than $500,000 in annual savings. The city could realize these savings by shifting the replacement costs of individual systems to investing in common shared systems and the economy of scale gained by establishing citywide core IT systems and data center infrastructure
Disaster Recovery - Develop IT system specific Disaster Recovery (DR) and Business Continuity (BC) plans that are regularly maintained, updated and tested for viability and ability to meet the specified recovery criteria. The DR and BC plans should include internal resources, external resources and technical resources like cloud-based services. Cloud-based services can positively contribute to DR and BC goals; however, the data stored in the cloud is not under the physical control and security of the enterprise and can become very costly based on the volume of data and speed of leased WAN connectivity.
Recovery Point Objectives/ Recovery Time Objectives – Evaluate individual systems and specify RPOs and RTOs. Review and document all systems’ technical and non-technical dependencies and a comprehensive catalog of system recovery options and requirements including RPOs and RTOs should be maintained. Information should become integrated into an overall disaster recovery process and operations guidelines for the associated systems.
Disaster Recovery Storage – Leverage technology approaches used within the Storage Area Networks (SAN) infrastructure (mirroring, snapshots etc.) to support disaster recovery, business continuity, recovery point objectives and recovery time objectives.
Storage and SAN Platform –Consolidate the multiple and disparate existing storage platforms by standardizing on a centralized, remote survivable enterprise class SAN solution and migrating to the new SAN in a phased approach as legacy equipment fails or requires replacement. The new enterprise class SAN solutions are designed to provide the scalability, fault tolerance, and energy efficiencty required by the internal and external users and city departments. Additional benefits can also be achieved by implementing features such as “snapshots”, de-duplication, data tiering and block level site to site replication.
These efforts offer the benefit of:
• Promoting informed decisions relating to system investments including back-up and recovery infrastructure
• Identifying and establishing the appropriate environments for housing systems and applications
• Contributing to business resiliency goals in the event of a failure
• Potential savings including:
o Reduced expenses related to emergency recovery operations and reduced reliance on outside vendors for recovery of critical information and systems
o Estimated reduction of 40% - 60% of expected total SAN platforms costs than if maintained separately (including hardware and support contracts)
o Estimated savings of 10% - 15% from capital expenditures related to IT system replacements and better leveraging the economy of scale for complete IT platforms
o Estimated savings of 30% - 40% of capital expenses related to physical server replacement based on better utilization of physical hardware throughout the enterprise and increased ability to support DR and BC objectives
15
Contracting – Create master procurement and support contracts to leverage the overall economy of scale, reduce costs, complexity and support to operate and maintain
Virtualization - Review the overall trends of data growth and the associated needs to support virtualization throughout the enterprise; identify master agreement and support contract opportunities to leverage economies of scale; review all applications and servers for virtualization candidacy with an aggressive migration schedule where possible.

APPENDIX 3. Oracle Insight Applications Rationalization, City of Seattle Prepared by Oracle September 10, 2012


Applications Rationalization City of Seattle
September 10, 2012
Final

i
Insight information, including this Oracle presentation, is the confidential, proprietary information of Oracle, is intended solely for your internal business use and shall not be disclosed to third parties without Oracle’s prior written consent.
Contents
Insight Statement of Purpose & Confidentiality ................................................................................................. v
Executive Summary .............................................................................................................................................. 6
Introduction ........................................................................................................................................................ 10
Background ...................................................................................................................................................... 10 About the City of Seattle .......................................................................................................................... 10
Objectives & Approach ...................................................................................................................................... 12
Business Objectives .......................................................................................................................................... 12
Approach .......................................................................................................................................................... 12 Application Inventory ............................................................................................................................... 12 Application Evaluation ............................................................................................................................. 17 Transformation Recommendations ........................................................................................................... 17 Ongoing Application Governance ............................................................................................................ 18
Recommendations .............................................................................................................................................. 20
Recommendations Summary ............................................................................................................................. 20 Recommendations ........................................................................................................................................ 20
Recommendation 1: Implement a business continuity plan for all mission critical applications. .. 20 Recommendation 2: Applications with low data sensitivity and minimal interfaces are good candidates for moving to a public cloud and supports the desire to leverage cloud. ........................ 22 Recommendation 3: Address security risks, by modernizing, decommissioning or replacing the systems where the sensitivity of the data is not adequately protected by the security level of the application ............................................................................................................................................... 23 Recommendation 4: Implement Single Sign-On across the City to help secure these applications as well as increase user satisfaction and lower the cost of administering these applications. .......... 25 Recommendation 5: Reduce the number of Reporting / BI tools and approaches. ......................... 25 Recommendation 6: Reduce the number of redundant or over-lapping applications. .................... 26 Recommendation 7: Develop a City-wide Integration strategy and initiative that follows industry best practices around Service Oriented Architecture (SOA). ............................................................. 29 Recommendation 8: Implement robust and compensative IT Portfolio Management tools and governance processes. ............................................................................................................................. 29
Benefits ................................................................................................................................................................ 31
Benefits ............................................................................................................................................................. 31
Estimated Financial Benefits ............................................................................................................................ 31
Appendix A - Data Validation ........................................................................................................................... 33
ii
Insight information, including this Oracle presentation, is the confidential, proprietary information of Oracle, is intended solely for your internal business use and shall not be disclosed to third parties without Oracle’s prior written consent.
Table of Figures
Figure 1 City of Seattle Application Inventory Scorecard ................................................................................ 6 Figure 2 Investor Map Business Contingency Plan vs. Business Criticality ................................................. 21 Figure 3 Investor Map Data Sensitivity of the Data in the Application vs. Number of Interfaces .............. 23 Figure 4 Investor Map Sensitivity of the Data vs. the Level of Security Provided by the Application ....... 24 Figure 5 Distinct Reporting / BI Tools and Approaches ................................................................................. 26 Figure 6 Scorecard of Planning and Budgeting Applications ......................................................................... 27

v
Insight information, including this Oracle presentation, is the confidential, proprietary information of Oracle, is intended solely for your internal business use and shall not be disclosed to third parties without Oracle’s prior written consent.
Insight Statement of Purpose & Confidentiality
• Insight is an Oracle marketing initiative that communicates the Oracle value proposition in the context of your information technology and business environment. It is intended as one component of your market research.
• Insight is provided for informational purposes only. There is no fee for the Insight presentation or any other aspect of Insight. It is not an offer by, commitment from or contract with Oracle to provide any technology solutions, hardware or services.
• Insight will focus on Oracle's commercial products, solutions and services as well as Oracle's view of their value to you.
• Insight is not a contract for and does not involve systems engineering or systems design work, the drafting or determination of specifications or work statements, technical direction to you, the evaluation of any other company's products or services, or any other activity that might give rise to an organizational conflict of interest.
• Insight involves discussions with your employees and information related to your operating data, practices, and conditions in order to focus our presentation of Oracle's products on their value you. A key purpose of the Insight exchange is to improve your understanding of industry capabilities in the private sector, and to enhance your ability to obtain quality supplies and services.
• Insight does not involve Oracle's access to any other company's proprietary data or source selection information. You should strictly protect such information and must not provide any such information to Oracle.
• Insight focuses on your objectives, as related by you to Oracle; documents information Oracle collected during the Insight; and provides information on Oracle technology that may be available to meet these objectives. You are solely responsible for choosing the best way to meet your objectives.
• Insight is an executive-level marketing presentation and, as such, is not intended to and cannot account for all risks and other factors that may affect results or performance, or for changes in the agency's practices, operations or procedures that may be required to realize results or performance that are projected or implied in any presentation.
• Oracle's Insight presentation may include third party data, information, research and/or reference materials (collectively referred to as "Third Party Information"). Oracle does not make any representation or warranty regarding the accuracy of the Third Party Information, which is provided "as is." The inclusion of the Third Party Information does not constitute any Third Party's endorsement of Oracle's products or services.
• Insight is not a commitment to deliver any material, code, or functionality. The development, release, and timing of any features or functionality are at the sole discretion of Oracle.
• Insight information, including this Oracle presentation, contains Oracle’s confidential and proprietary information (“Oracle’s information”), is intended solely for your internal business use, and shall not be disclosed to third parties without Oracle’s prior written consent. To the extent you engage a third party to assist you in your evaluation of the Insight information, you shall ensure such party (ies) are bound by non-disclosure obligations that prohibit disclosure of Oracle’s information and restrict the third party’s use of Oracle information to assisting you in the Insight and prohibit the third party’s use of the Oracle information for any other purpose.

6
Insight information, including this Oracle presentation, is the confidential, proprietary information of Oracle, is intended solely for your internal business use and shall not be disclosed to third parties without Oracle’s prior written consent.
Executive Summary Under the leadership and direction of the City Council and Mayor Mike McGinn, the City of Seattle started an initiative to align their information technology investments with the City’s vision for the future in ways only seen in some of the most forward thinking proactive institutions. The City collaboratively with Oracle reviewed the major applications using an Applications Rationalization methodology and tools to identify specific actionable recommendations to improve service to users, standardize systems and protocols, improve security and achieve cost efficiencies. The Information Technology (IT) Efficiencies Project is in response to City Council Statement of Legislative Intent (SLI 75-1-A-2) that requested IT systems and protocols citywide to identify efficiency, effectiveness, and security improvements.
Figure 1 City of Seattle Application Inventory Scorecard
The City’s IT environments have evolved over time through waves of technology innovations such as social networking, virtualization and cloud, new City initiatives, organizational changes, introduction of new business processes, regulatory requirements, and implementations of best-in-class applications. The result is a complex, inflexible, and costly heterogeneous IT environment with redundant processes and applications, information “silos,” and incompatible technology which may impact the efficiency and effectiveness of City operations. The City has more than 700 different applications that are supported by IT staff or hosted externally. Application portfolio rationalization is the act of managing the existing application portfolio with an explicit goal of improving efficiency, reducing complexity, and lowering the total cost of ownership (TCO) by:
Retiring aging and low-value applications. Modernizing aging and high-value applications. Eliminating redundant applications. Standardizing on common technology platform and version. Consolidating the applications—either physically, logically, or both.
As part of the Oracle Insight program, a team of Oracle solution architects and subject matter experts

7
Insight information, including this Oracle presentation, is the confidential, proprietary information of Oracle, is intended solely for your internal business use and shall not be disclosed to third parties without Oracle’s prior written consent.
worked collaboratively with City IT staff and leadership to create an application portfolio and evaluation criteria that was then used by Oracle to develop recommendations based on their experience with similar agencies and customers worldwide.
Below is a summary of the application rationalization recommendations and the benefits of implementing those recommendations for the City of Seattle. Recommendations Oracle recommends the following high level initiatives as a result of the application rationalization:
1. Improve the reliability and business continuity of critical systems in the event of an emergency or disaster. The City needs to identify these mission-critical systems and create a consistent business continuity plan where the impact to the City or Department warrants it. There are a number of systems with high impact to the City and departments that were identified as critical but don’t have a business continuity plan in place.
2. Applications with low data sensitivity and minimal systems interaction or interfaces are good candidates for moving to a public cloud. This supports the desire to leverage the cloud.
3. Address security risks, by modernizing, decommissioning or replacing the systems where the sensitivity of the data is not adequately protected by the security level of the application.
4. Implement Single Sign-On across the City to help secure these applications, as well as, increase user satisfaction and lower the cost of administering these applications over time.
5. Reduce the number of Reporting / BI tools and approaches. There are more than 60 different Reporting / BI tools and approaches. Most of these require some unique infrastructure and all require specialized skills and knowledge to use update and maintain. The cost of supporting the software and hardware are minor compared to the staffing and learning curve burdens put on the IT staff to meet end users exploding desire for more data and analysis to improve operations and transparency.
6. Reduce the number of redundant or over-lapping applications, examples include; Financial Management, Case Management, Human Resources, Timekeeping Budgeting Systems, and Asset Management applications. The quick wins could come from the redundant applications with poor technical health that have relatively low numbers of interfaces, are a security risk and have been identified for replacement or decommission.
7. Develop a City-wide Integration strategy and initiative that follow industry best practices around Service Oriented Architecture (SOA) to shift environments from “Silos” to “Shared Services” reducing duplicate data entry, high support costs and enabling operational efficiency for the City.
8. Implement robust and comprehensive IT Portfolio Management tools and governance processes around the City’s Municipal Information Technologies Investment Evaluation (MITIE) process to help facilitate moving the City from “Silos” to “Shared Services” and establish ongoing management to drive future efficiency, effectiveness, and security improvements. This operationalizes the intent of SLI 75-1-A-2 into the City’s processes.
Benefits
There are many benefits to managing Seattle’s application portfolio and instituting an application rationalization process. These benefits translate to substantial cost savings for the City:
Free up money and staff for new initiatives. The evaluation phase is almost certain to uncover significant opportunities for labor and cost savings. These savings can be applied to applications that

8
Insight information, including this Oracle presentation, is the confidential, proprietary information of Oracle, is intended solely for your internal business use and shall not be disclosed to third parties without Oracle’s prior written consent.
truly serve the needs of the citizens of Seattle and the business of running City.
Minimize future application purchases. Good portfolio management provides mechanisms for screening requests for new applications. With Application Portfolio Management (APM) in place, the decisions to deploy all future applications are made in the informed context of what is already deployed and what the benefits to the business would truly be.
Eliminate unnecessary investments. The strategic value of a formal evaluation of each application is in understanding its contribution to the objectives of the organization. There’s no point in investing in applications that don’t support the goals of the City.
Eliminate redundancy. Using a strong portfolio management toolset and process, it becomes easy to identify applications that perform similar or identical functions for different parts of the organization.
Consolidate to adhere to standards. A portfolio of applications that is too diverse in the infrastructure and technology it requires, costs far more to maintain than a consolidated portfolio. Consolidating applications reduces the standards with which Seattle must comply and saves money.
Reduce training and support requirements. Each application that is in use requires some amount of support from either your own staff or a vendor’s. This support costs money, and these costs decrease for a given population when the number of applications or vendors can be reduced.
Prevent the “patchwork problem” from recurring. With a sound application governance framework in place, you have a formal mechanism that ensures application deployments continue to move toward your organization’s goals, are consistent with existing IT architecture, align with the primary business and lower operating and support costs. Unlike a one-time review, ongoing governance pays dividends for years to come and ensures operating and capital funds are optimized.
Financial Benefits According to industry analysts such as Gartner, a focused applications rationalization effort will typically result in a 20% cost savings while improving support for the lines of business. Based on Oracle’s experience with customers around the world and our understanding of the City of Seattle we estimate the IT savings alone in the range below:
Estimated 5 Year Savings in Millions*
Conservative Pragmatic Reporting/BI Systems Consolidation $ 1.8 $ 6.0
Applications Consolidation $ 3.0 $ 6.0
Total $ 4.8 $ 12.0 * These are undiscounted These benefits are conservative as they do not include the benefits associated with: Improved business process productivity from standardization, reduced risks from more secure applications, user productivity from Single Sign-On and improved outcomes like strategic sourcing. It is almost always the case that these benefits are orders of magnitude larger than the IT benefits estimated above. These un-quantified benefits will more than balance out the implementation costs for these recommendations. Benefit Realization To realize these benefits it is important to ensure sustainable follow-through on application decisions

9
Insight information, including this Oracle presentation, is the confidential, proprietary information of Oracle, is intended solely for your internal business use and shall not be disclosed to third parties without Oracle’s prior written consent.
across Seattle by using a governance framework to oversee all projects, including those related to applications. Whichever mechanism is used, it is imperative to track portfolio changes through to completion and implement an on-going portfolio management process supported by effective tools.

10
Insight information, including this Oracle presentation, is the confidential, proprietary information of Oracle, is intended solely for your internal business use and shall not be disclosed to third parties without Oracle’s prior written consent.
Introduction
Background Oracle welcomes the City of Seattle’s participation in the Oracle Insight program. The Insight program is designed to help Oracle’s most important clients realize increased value in the investment they have made in Oracle’s products. The primary goal of this Insight engagement is review the City’s applications in support the of the City’s Information Technology (IT) Efficiencies Project which is in response to a Seattle City Council Statement of Legislative Intent (SLI 75-1-A-2). The Statement of Legislative Intent requests the Executive to review IT systems and protocols citywide to identify efficiency, effectiveness, and security improvements. An Applications Rationalization approach was taken to develop a portfolio of the City’s applications that was analyzed to 1) identify potential cost savings and other efficiencies, and 2) information to assist with the planning for future data center needs.
The approach is optimized to meet the City’s short and long term business needs and free up capacity of the scarce existing IT resources to pursue new priority initiatives. Without reducing the effort of supporting the existing or legacy systems it is very challenging for the City to move forward with critical new initiatives in this time of limited fiscal resources. Seattle IT has a long record of innovation and excellence and resources must be freed up to continue this outstanding service to the citizens. A few of the recent City IT success are shown below.
Seattle.Gov has been named the country's best city web portal by the Center for Digital Government. Data.Seattle.Gov was also named a Digital Government Achievement winner in the Government-to-citizen category. 2011 Best of the Web Cyber Security Site Seattle.Gov named best local government
cyber security web site by the MS-ISAC.
About the City of Seattle The City provides a full range of municipal services authorized by its charter and operates four rate funded utilities. The City builds roads, and, maintains electric, solid waste, sewer and drainage services. It provides police and fire protection as well as judicial services. It administers land use policy, and takes an active role in commercial and industrial development and environmental protection. The City designs and maintains many parks and golf courses, coordinates recreation activities, maintains libraries, fosters neighborhood livability, and works to preserve a satisfactory living environment for both community, individuals and much more. The City has more than 40 departments, offices and divisions of which 30 have appreciable Information Technology systems usage. The City’s Information Technology systems and staff are

11
Insight information, including this Oracle presentation, is the confidential, proprietary information of Oracle, is intended solely for your internal business use and shall not be disclosed to third parties without Oracle’s prior written consent.
managed in a distributed manner with most of the resources and systems owned and funded by the departments so they stay aligned with the business and Department of Information Technology (DoIT) the City’s central IT department being responsible for providing technology services and policy planning for their customers, Seattle's citizens and City of Seattle departments and employees. The Chief Technology Officer (CTO) sets technology standards and strategies to ensure City government uses technology tools efficiently, effectively and wisely. DoIT builds and operates a wide variety of technology tools and systems supporting the missions of every department in City government. DoIT provides telephone, computer, radio and fiber optic networks throughout the city. DoIT operates the City’s technology and network infrastructure that is used by every department to deliver power, water, recreation, safety and human services to the people of Seattle. The Seattle Channel and City’s Web site work together to keep Seattleites informed, give them access to services, and allow them to participate in governing. The City’s Municipal Information Technologies Investment Evaluation (MITIE) process is a governance process between the CTO office and the departments that reviews and evaluates large new IT projects. The MITIE process does not maintain an application portfolio or formally review existing systems unless they are part of a new project.

12
Insight information, including this Oracle presentation, is the confidential, proprietary information of Oracle, is intended solely for your internal business use and shall not be disclosed to third parties without Oracle’s prior written consent.
Objectives & Approach
Business Objectives The Insight methodology is structured so that it produces recommendations to address the City’s Business Objectives. For Seattle, the key objectives were spelled out in the City Council’s Statement of Legislative Intent (SLI 75-1-A-2) that requests “that the Executive branch conduct a review of information technology (IT) systems and protocols Citywide to identify efficiency, effectiveness, and security improvements. This review should result in specific actionable recommendations to improve service to users, standardize systems and protocols, and achieve cost efficiencies. The review should consider any reasonable recommendations that can achieve the purposes of this review, including, but not limited to, software standardization, uniform protocols for access and use of IT systems and software, department-specific applications and approval standards for such applications.” Application portfolio rationalization is the act of managing the existing application portfolio with an explicit goal of improving efficiency, reducing complexity, and lowering Total Cost of Ownership making it a great strategy to identify actionable recommendations for the Council’s Statement of Legislative Intent.
Approach Application rationalization is best achieved through the adoption of an Application Portfolio Management (APM) solution that provides a framework to evaluate and manage the portfolio. It also provides the necessary infrastructure for dealing with the next unforeseen event—whether it involves security remediation, architecture compliance, or some other new requirement. In its simplest terms, application rationalization can be described as a three-step process:
Application inventory Application evaluation Transformation recommendations
Application Inventory
The process of rationalizing your applications begins with capturing an inventory of all applications currently in use. Virtually every organization has executed an application inventory collection effort at some time or another. One element that characterizes these efforts is that they are usually one-time events marked by a push to collect application data, which results in a new spreadsheet, one that is probably different from the one collected months or years earlier for the last initiative.
For Seattle, Oracle worked with the City to develop a data collection spreadsheet to support the Statement of Legislative Intent analysis. The spreadsheet was distributed to all the departments to complete and return. Oracle requested that the City and the City’s departments exclude any systems or areas where there are active procurement activities to eliminate any potential procurement conflicts of interest. This likely did not cause a significant skewing of the results. The table below summarizes the attributes collected for each of the City’s significant applications:

13
Insight information, including this Oracle presentation, is the confidential, proprietary information of Oracle, is intended solely for your internal business use and shall not be disclosed to third parties without Oracle’s prior written consent.
Category Attribute Description / Values
Application Name Application Name
Description/Purpose Description/Purpose
Validation Group Groups of data where here are questions on validation
Primary Business Process Supported
Primary Business Process Supported
Department Department
Application Support Location
Application Support Location- E.g. Our Data Center, DOIT, Vendor Hosted, SaaS, Amazon, Other
Location Group Grouping of the Location: DoIT, External & Other
Service Level Agreement Is there a Service Level Agreement for the support of this application
Application Function Type
Application Function Type - Pick the one that fits best describes the functionality of the application. E.g. If it is a billing application select billing not Utilities-Operations
Application Function Group
Grouping of the Application Function Type The first part of the concatenated Application Function Type
Application Function Sub-type
Sub Grouping of the Application Function Type The second part of the concatenated Application Function Type
Application Configuration
Application Configuration COTS or Custom
Vendor Vendor who created or markets the application
Production Yr What year was the application out into production? (Can be estimated)
Plans or desire to replace or decommission the application
Does the department have plans or a desire to replace or decommission the application? Yes/No
Business Capability Business Capability to the department? Is this application strategic to the mission of the department, an important value add or a supporting activity Strategic -e.g. Computer Aided Dispatch for Fire Value Add- e.g. Donate online for Animals & Pets Supporting Activity e.g. Procurement to Police
Regulatory Compliance Regulatory Compliance - Is the application required to meet a legal requirement? Yes/No

14
Insight information, including this Oracle presentation, is the confidential, proprietary information of Oracle, is intended solely for your internal business use and shall not be disclosed to third parties without Oracle’s prior written consent.
Category Attribute Description / Values
Business Criticality Business Criticality of the application? Mission critical: Must be online during a disaster or restored within 15 minutes. The organization is willing to accept no risk or very little risk of failure Business Critical: These applications must be recovered quickly in 4 hours or less in the event of disaster. Required applications are required to run the business and must be recovered in 96 hours or less in the event of disaster. Other: These applications do not fit in any of the preceding categories, and most business operations can continue without them.
Business Contingency Plan
Is there a Business Contingency Plan that details what is done in the event the application is unavailable?
Impact to the Department or City
Impact to the Department or City High there are a large number of internal users (more than 100), it is citizen facing with large numbers of users (more than 500), has critical function (e.g. 911 call response or supports complex cross function business processes. Medium there are a medium number of internal users (50 to 100), it is citizen facing with significant users(100 to 500), has a important constituency (e.g. fisherman) or supports cross function business processes, Low - Supports a few users, is not public facing or used by the citizens and has a narrow scope to a single department or group
Technical Health Technical Health - What is the applications technical heath? High - It is a modern application that fits or is close to the current standards and is reasonable to support given its nature. Medium - The Application is not up to date or is an old version from the vendor and it is fragile or a challenge to support Low - The Application is legacy and a version no longer supported by the vendor or supported at extra cost, supporting it is a significant challenge where any changes are risky.
Estimated Number of Users
Estimated Number of Users
# Users -Numeric Public set to 608,000- Pop of City City Staff set to 10,000 - Staff of City All IVR Imports with set to values by working group All Imports with N/A set to values by working group
Annual Internal Support FTEs
Annual Internal Support FTEs (Add up People supporting part time for a total FTE)
FTEs Numeric Annual Internal Support FTEs numeric

15
Insight information, including this Oracle presentation, is the confidential, proprietary information of Oracle, is intended solely for your internal business use and shall not be disclosed to third parties without Oracle’s prior written consent.
Category Attribute Description / Values
Total Annual Support Cost
Total Annual Support Cost Example Software Support $300,000 Hardware Support $125,000 Contract Programming Services $950,000 Data Center Costs $100,000 Internal Staff Cost $400,000 Enter $1,875,000
Total Annual Support Cost Numeric
Total Annual Support Cost Numeric
Sensitivity of the Data Sensitivity of the data in the system or the system functionality? High - Contains information on domestic abuse victims or HIPPA data or Credit Card information Medium contains Personally Identifiable Information(PII) on Employees Low - Contains Procurement sensitive data, None - Only contains public Information
Security of the application
Security of the application? High - The system has passed external security evaluations or leverages high security features like data encryption, multifactor authentication Medium - The system has solid security features like strong passwords, up to date security patches, SSL, Firewalls, DVMs, Automatic inactivity timeout, port penetration testing, Low - Has basic security features like unique use rids and passwords. None - The system is not secure - no UserIds are required or data is not protected
Interface Interfaces - The number and importance of the interfaces with other systems. High the system has a large number (10 or more) of interfaces to other systems that are required or the interfaces are required by law, policy or fiscal reasons e.g. Payroll to banks, Medium (3 to 10), Low (none, 1 or 2)
Application Architectural Adherence
Application Architectural Adherence- What is the applications technical compatibility? High - It aligns with all current technical standards - Medium - The Application with most technical standards - Low - The application is legacy and does not fit many if any current technical standards
Middleware What application server does it use?
How large How large is the system Total server processors Small 2 or less, Medium 2-6 Large - More than 6)

16
Insight information, including this Oracle presentation, is the confidential, proprietary information of Oracle, is intended solely for your internal business use and shall not be disclosed to third parties without Oracle’s prior written consent.
Category Attribute Description / Values
Database What Database is used?
Database Size Approximate Database Size (Use Production Environment) Small - Less than 100 GB Medium 100 to 600 GB Large More than 600 GB
System Usage Growth Rate / Year
System Usage Growth Rate / Year High- More than 10%, Some - 0 to 10%, None, Declining
UserIds Passwords Where does the application store UserIds, Passwords and possibly Groups/Roles? LDAP, Application, DB Tables, Other
Single Sign-On Does the application have Single Sign-On (SSO)? Yes/No
Analysis Reporting What tools are used for analysis /reporting?
Datamart Is there a separate reporting environment or data mart? Yes/No
Major Strengths Briefly describe the major strengths of the application?
Major Weaknesses Briefly describe the major weakness of the Application?
Notes Notes - Anything else you feel is important to understand relative to this application E.g. Does this application
IT Investment Decision During the IT investment decision process did this IT project have a business case associated with it? Yes / No.
Measurement How is the value of the IT investment/return measured? Example ROI, cost savings, reduced time for service calls, reduced citizen calls to Depts., reduced cost per pot hole fixe, improved usage of parks, etc… Please provide any Key Performance Indicators (KPI’s)/ or metrics used to do so
The data collection spreadsheet was distributed via email. Over the next few weeks the responses were manually reviewed to identify missing or potentially incorrect data. It was an extremely labor intensive process for both the City staff and Oracle to get the data complete and consistent. The response and return rate was a very impressive: 97% return rate. There was only one office that did not return a completed inventory.
The consolidated data was then reviewed and cleaned up to make it more useful for analysis. Appendix A briefly summarizes what was done.
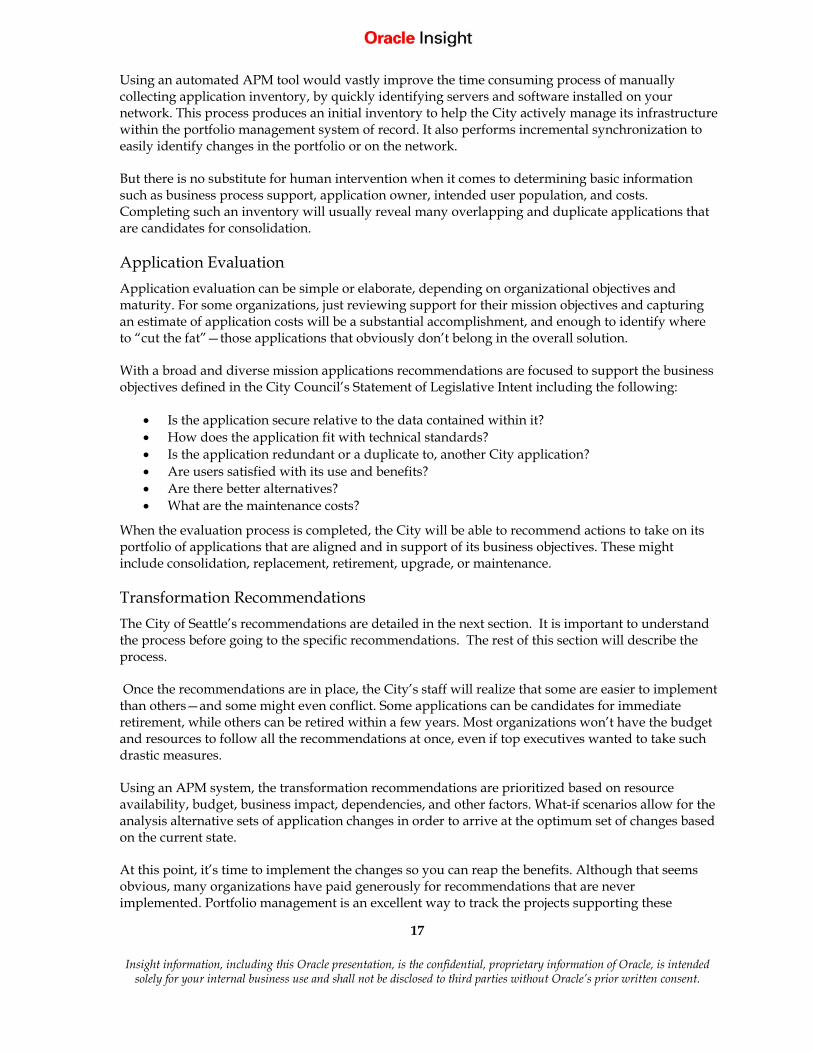
17
Insight information, including this Oracle presentation, is the confidential, proprietary information of Oracle, is intended solely for your internal business use and shall not be disclosed to third parties without Oracle’s prior written consent.
Using an automated APM tool would vastly improve the time consuming process of manually collecting application inventory, by quickly identifying servers and software installed on your network. This process produces an initial inventory to help the City actively manage its infrastructure within the portfolio management system of record. It also performs incremental synchronization to easily identify changes in the portfolio or on the network.
But there is no substitute for human intervention when it comes to determining basic information such as business process support, application owner, intended user population, and costs. Completing such an inventory will usually reveal many overlapping and duplicate applications that are candidates for consolidation.
Application Evaluation
Application evaluation can be simple or elaborate, depending on organizational objectives and maturity. For some organizations, just reviewing support for their mission objectives and capturing an estimate of application costs will be a substantial accomplishment, and enough to identify where to “cut the fat”—those applications that obviously don’t belong in the overall solution.
With a broad and diverse mission applications recommendations are focused to support the business objectives defined in the City Council’s Statement of Legislative Intent including the following:
Is the application secure relative to the data contained within it? How does the application fit with technical standards? Is the application redundant or a duplicate to, another City application? Are users satisfied with its use and benefits? Are there better alternatives? What are the maintenance costs?
When the evaluation process is completed, the City will be able to recommend actions to take on its portfolio of applications that are aligned and in support of its business objectives. These might include consolidation, replacement, retirement, upgrade, or maintenance.
Transformation Recommendations
The City of Seattle’s recommendations are detailed in the next section. It is important to understand the process before going to the specific recommendations. The rest of this section will describe the process.
Once the recommendations are in place, the City’s staff will realize that some are easier to implement than others—and some might even conflict. Some applications can be candidates for immediate retirement, while others can be retired within a few years. Most organizations won’t have the budget and resources to follow all the recommendations at once, even if top executives wanted to take such drastic measures.
Using an APM system, the transformation recommendations are prioritized based on resource availability, budget, business impact, dependencies, and other factors. What-if scenarios allow for the analysis alternative sets of application changes in order to arrive at the optimum set of changes based on the current state.
At this point, it’s time to implement the changes so you can reap the benefits. Although that seems obvious, many organizations have paid generously for recommendations that are never implemented. Portfolio management is an excellent way to track the projects supporting these

18
Insight information, including this Oracle presentation, is the confidential, proprietary information of Oracle, is intended solely for your internal business use and shall not be disclosed to third parties without Oracle’s prior written consent.
application recommendations and to see them through to completion in order to realize the full value of the process.
Ongoing Application Governance
Until now, the focus has been on the rationalization of existing application inventories. But keeping an application portfolio aligned with business objectives and cost effective is a vital, ongoing governance process. The following outlines the governance process:
Operational review. The results of the operational review might reveal the need for adjustments to the portfolio. It is important to track the operational quality of your applications to help determine the most appropriate adjustments. These reviews and the resulting adjustment recommendations might assist in budget planning as well.
New application proposals. Good portfolio management solutions provide scorecards and financial models to help determine when a new application should be acquired and deployed. You can capture application proposals, score and rank them, and model the alternatives, thus preventing wasteful expenditures. This is essential to operationalizing the objectives of the City Council’s Statement of Legislative Intent.
Application rationalization helps achieve ongoing governance with a three-step process, and incorporates continual review of new application proposals throughout the cycle.
As with any strategic initiative, it is important to build a strong business case before proceeding on the application rationalization journey. APM ensures that your investments are in sync with changing needs and trends. At the technology level, it improves the overall effectiveness of IT, ensuring that IT is not a reactive function anymore—no longer playing “catch-up” with the business.
At the business level, APM allows you to do more with less and helps to achieve overall business objectives.
The value and impact of APM can be understood in the context of various strategic initiatives:
Efficiency and business process management. Application rationalization can provide insights into gaps or redundancies in the current application portfolio, enhancing an organization’s ability to hone business processes. In doing so, the City can introduce innovative initiatives, provide customer service, and manage risks more efficiently and more effectively.
Compliance management. Organizations need to know if their applications put them in danger of noncompliance. Application rationalization allows the organization to look at its systems from an aggregate compliance score perspective, facilitates transparency, and then manages the application investments from a lifecycle management perspective.
Enterprise architecture. By consolidating technical and enterprise architecture, organizations are able to reduce the costs of their infrastructure. This provides agility to the business, which enables faster rollouts of new initiatives and technologies that drive citizen value.
Vendor management. Application rationalization can arm management for vendor negotiations by giving them the advantage of a detailed application inventory, the risks associated with it, and its business value. Once on an even playing field, the organization can negotiate wisely and put terms into an agreement that place demands back on the vendor to reduce risk or add business value—going way past pursuing price reductions.
19
Insight information, including this Oracle presentation, is the confidential, proprietary information of Oracle, is intended solely for your internal business use and shall not be disclosed to third parties without Oracle’s prior written consent.
Cloud or Software as a Service (SaaS). Prior to the Cloud, SaaS experts say organizations should have a good sense of the value of investments they have already made, the value and risks of the Cloud or SaaS. Knowing what assets are in their application portfolio and what services they need to acquire will ensure that businesses set up the right Cloud strategy and execution plan.
Security, audit prioritization and remediation. It is critical to know which aspects of operations run the highest security and technical risks, so they can be articulated and addressed. An APM solution allows executives to share insight into such risk by enabling them to create a single system of record that gives a consistent live view of the business benefits of their application inventory. Quantifying these benefits will be specific to the context of the particular organization.

20
Insight information, including this Oracle presentation, is the confidential, proprietary information of Oracle, is intended solely for your internal business use and shall not be disclosed to third parties without Oracle’s prior written consent.
Recommendations
Recommendations Summary The recommendations set forth in this document are based on Oracle’s wide body of internal research and expertise, the real-world experiences of our global customer base, and widely adopted industry best practices in this realm. The recommendations are focused on the City Council Statement of Legislative Intent (SLI 75-1-A-2) that requested a review of IT systems and protocols citywide to identify efficiency, effectiveness, and security improvements.
Recommendations
Recommendation 1: Implement a business continuity plan for all mission critical applications.
Oracle recommends that Seattle improve the reliability and business continuity of critical systems. The City should create a business continuity plan, decommission or replace the systems where the there is none and the impact to the City or Department warrants it. There are a number of systems with high impact to the city/department that were identified as critical but do not have a business continuity plan. The figure below shows an investor map of applications with/without a Business Contingency Plan vs. Business Criticality of the application.
Business contingency plans address the overall issue of maintaining or reestablishing production in the case of an interruption. These interruptions may take the form of a natural disaster (e.g. Major storm, earthquake, tsunami, flood,…) an unintentional man-made event (e.g., accidental equipment damage, fire, explosion, or operator error), an intentional man-made event (e.g., attack by bomb, firearm, vandalism, or, virus or malware attack), or an equipment failure. From a potential outage perspective, this may involve typical time spans of days, weeks, or months to recover from a natural disaster, or minutes or hours to recover from a malware infection or a mechanical/electrical failure.

21
Insight information, including this Oracle presentation, is the confidential, proprietary information of Oracle, is intended solely for your internal business use and shall not be disclosed to third parties without Oracle’s prior written consent.
Figure 2 Investor Map Business Contingency Plan vs. Business Criticality
Industry best practices call for a business continuity plan for each application based on the applications’ business criticality. Business Criticality was defined as follows:
Mission critical: Must be online during a disaster or restored within 15 minutes. The organization is willing to accept no risk or very little risk of failure
Business Critical: These applications must be recovered quickly in 4 hours or less in the event of disaster.
Required: Required applications are required to run the business and must be recovered in 96 hours or less in the event of disaster.
Other: These applications do not fit in any of the preceding categories, and business can continue without them.
In the figure above, the applications in the upper half all have Business Contingency Plans that detail what is done in the event the application is unavailable and those applications in the lower half do not. The table blow shows the number of applications by Business Critically that do not have a Contingency Plan as reported by the City’s staff
Business Criticality
Mission Critical
Business Critical
Required Other
# of Applications without a Contingency Plan
17 62 123 106

22
Insight information, including this Oracle presentation, is the confidential, proprietary information of Oracle, is intended solely for your internal business use and shall not be disclosed to third parties without Oracle’s prior written consent.
Due to the cost and importance of these contingency plans, they should only be developed where warranted. After the recovery procedures are documented, a schedule should be developed to test part or all of the recovery procedures. Particular attention must be paid to the verification of backups of system configuration and production data. Not only should these be tested and that they are kept in a secure location, so they can be quickly obtained by authorized individuals when needed.
Recommendation 2: Applications with low data sensitivity and minimal interfaces are good candidates for moving to a public cloud and supports the desire to leverage cloud.
One of the Seattle’s IT strategies is to leverage cloud computing where warranted. Most Government Information Technology (IT) environments are characterized by low asset utilization, a fragmented demand for resources, duplicative systems, environments which are difficult to manage, and long procurement lead times. These inefficiencies negatively impact the City’s ability to serve the City’s citizens. Cloud computing has the potential to play a major part in addressing these inefficiencies and improving City services delivery. The cloud computing model can significantly help agencies, grappling with the need, to quickly provide highly reliable, innovative services despite resource constraints. Commercial service providers are expanding their available cloud offerings to include the entire traditional IT stack of hardware and software infrastructure, middleware platforms, application system components, software services, and turnkey applications. The private sector has taken advantage of these technologies to improve resource utilization, increase service responsiveness, and accrue meaningful benefits in efficiency, agility, and innovation. Similarly, for Seattle, cloud computing holds tremendous potential to deliver public value by increasing operational efficiency and responding faster to constituent needs.
Even with the obvious benefits in these challenging fiscal times, public cloud use by government agencies plummeted in 2011 as the source of infrastructure or platform services, according to a January 2012 survey of almost 300 government officials by the 1105 Government Information Group.
Just 10 percent of respondents who have already adopted cloud computing are using a public cloud for Infrastructure as a Service (IaaS), down from 23 percent last year. Platform as a Service (PaaS) declined to 8 percent of respondents from the 17 percent in 2011.
Use of the public cloud for software as a service (SaaS) in 2012 increased slightly, up 2 percent to 25 percent of respondents.
For the vast majority of agency respondents who have dropped public cloud computing as a source of IT resources, the major concern is security. Survey participants rated public clouds as less secure than any other cloud computing model. Major security breaches by large public cloud users, including an attack on Google’s password system in 2010, a security breach involving about 60 million email addresses from Epsilon in 2011 and others.
In addition to security concerns the challenges of interfacing with Cloud based applications is a challenge for Cloud adoption. It is technically and organizationally more challenging to build and maintain interfaces between applications hosted inside the City’s data center and firewalls, with applications in a cloud datacenter and behind that set of firewalls, than interfaces with in a single City’s data center or data centers.
Below is an investor map that shows the sensitivity of the data in the application vs. number of interfaces the application has. The applications in the lower left box, those with low data sensitivity and a low number of interfaces, would be good candidates for moving to the cloud.

23
Insight information, including this Oracle presentation, is the confidential, proprietary information of Oracle, is intended solely for your internal business use and shall not be disclosed to third parties without Oracle’s prior written consent.
Figure 3 Investor Map Data Sensitivity of the Data in the Application vs. Number of Interfaces
These applications would be relatively lower risk and lower cost to move to the cloud to enable the City to benefit from the Cloud.
Recommendation 3: Address security risks, by modernizing, decommissioning or replacing the systems where the sensitivity of the data is not adequately protected by the security level of the application
The City Council Statement of Legislative Intent (SLI 75-1-A-2) specifically requested that security improvements be reviewed. To address the data collection survey asked City staff to assess the sensitivity of the data in each applications and the level of security of the applications using the guidance below.
The sensitivity of the data in the system or the system functionality was defined using examples as follows
High - Contains information on domestic abuse victims or HIPPA data or Credit Card information, etc.
Medium - contains Personally Identifiable Information(PII) on Employees Low - Contains Procurement sensitive data, None - Only contains public Information
The security of the application was defined as follows:
High - The system has passed external security evaluations or leverages high security features like data encryption, multifactor authentication
Medium - The system has solid security features like strong passwords, up to date security patches, SSL, Firewalls, DVMs, Automatic inactivity timeout, port penetration testing,
Low - Has basic security features like unique use rids and passwords.
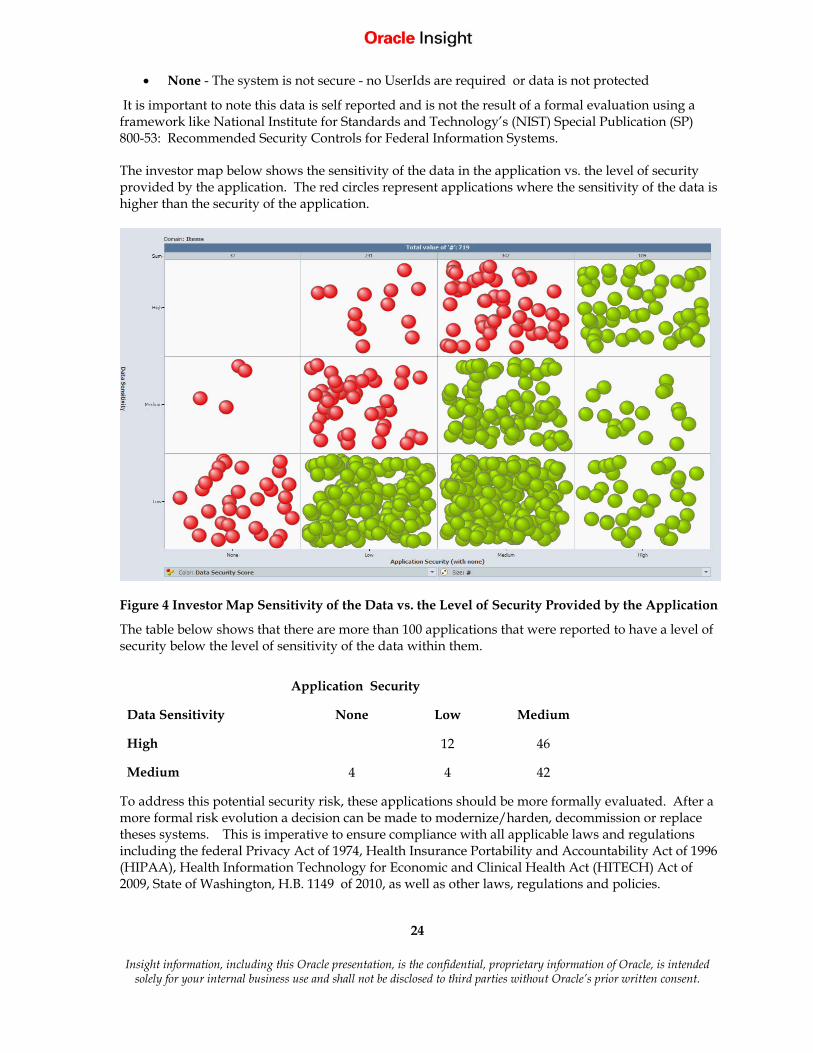
24
Insight information, including this Oracle presentation, is the confidential, proprietary information of Oracle, is intended solely for your internal business use and shall not be disclosed to third parties without Oracle’s prior written consent.
None - The system is not secure - no UserIds are required or data is not protected
It is important to note this data is self reported and is not the result of a formal evaluation using a framework like National Institute for Standards and Technology’s (NIST) Special Publication (SP) 800-53: Recommended Security Controls for Federal Information Systems.
The investor map below shows the sensitivity of the data in the application vs. the level of security provided by the application. The red circles represent applications where the sensitivity of the data is higher than the security of the application.
Figure 4 Investor Map Sensitivity of the Data vs. the Level of Security Provided by the Application
The table below shows that there are more than 100 applications that were reported to have a level of security below the level of sensitivity of the data within them.
Application Security
Data Sensitivity None Low Medium
High 12 46
Medium 4 4 42
To address this potential security risk, these applications should be more formally evaluated. After a more formal risk evolution a decision can be made to modernize/harden, decommission or replace theses systems. This is imperative to ensure compliance with all applicable laws and regulations including the federal Privacy Act of 1974, Health Insurance Portability and Accountability Act of 1996 (HIPAA), Health Information Technology for Economic and Clinical Health Act (HITECH) Act of 2009, State of Washington, H.B. 1149 of 2010, as well as other laws, regulations and policies.

25
Insight information, including this Oracle presentation, is the confidential, proprietary information of Oracle, is intended solely for your internal business use and shall not be disclosed to third parties without Oracle’s prior written consent.
Recommendation 4: Implement Single Sign-On across the City to help secure these applications as well as increase user satisfaction and lower the cost of administering these applications.
Enterprise Single Sign-On provides users fast access to systems and applications while increasing security, improving compliance, and providing operational efficiencies. Having a single UserId and password is a major customer satisfaction for all users internal and external to the City. Implementing citywide Enterprise Single Sign-On will help address the City Council Statement of Legislative Intent objectives for improving security, efficiency and cost effectiveness. Enterprise Single Sign-On handles the logon and logoff of applications for users, allowing them to focus on their task at hand without the need to remember their password. Enterprise Single Sign-On can be used to enforce strong application password policies and auditing capabilities, to not only increase security, it also provides an audit trail that shows application usage by each user to strengthen regulatory compliance.
Only six of the City’s 719 applications have true Enterprise Single Sign-On. Many of the applications share a common UserId and password, this is not the same as Enterprise Single Sign-On where users don’t have to repeatedly login when they open a new application. During the data analysis, careful attention was paid to just identify those applications with Enterprise Single Sign-On vs. those with a common UserId and password.
In a world where security and convenience almost always work at cross purposes to each other, and where every incremental increase in security typically comes at the cost of a degradation of usability, an Enterprise Single Sign-On Suite stands out as compelling way to improve security and, at the same time, increase satisfaction of the end user population for the comprehensive improvements in the usability it brings. And not only are there indirect cost savings from reduced user downtime, but, also, the product pays for itself in record time from a reduction in direct costs derived from reduced help-desk calls associated with password resets and user provisioning. Furthermore, security is greatly enhanced when a user, that is no longer employed by the City, can be deprovisioned from the systems quickly and effectively.
Recommendation 5: Reduce the number of Reporting / BI tools and approaches.
The application inventory identified that there are more than sixty different reporting / BI tools and approaches across the different applications and this is not counting reporting that is built into the application. In addition, many of the applications used more than one tool. Recognizing that all reporting tools and approaches require some unique infrastructure; specialized skills and knowledge to use, update and maintain; supporting this many different tools / approaches is costly. The cost of supporting the software and hardware are minor compared to the staffing and learning curve burdens put on the IT staff to meet end users exploding desire for more data and analysis to improve operations and transparency. Clearly the City should leverage the out of the box reporting provided by vendors as part of the application, but there appears to be room for significant savings in this area by standardizing.
Below is a table of the different reporting / BI tools and approaches identified in the data survey
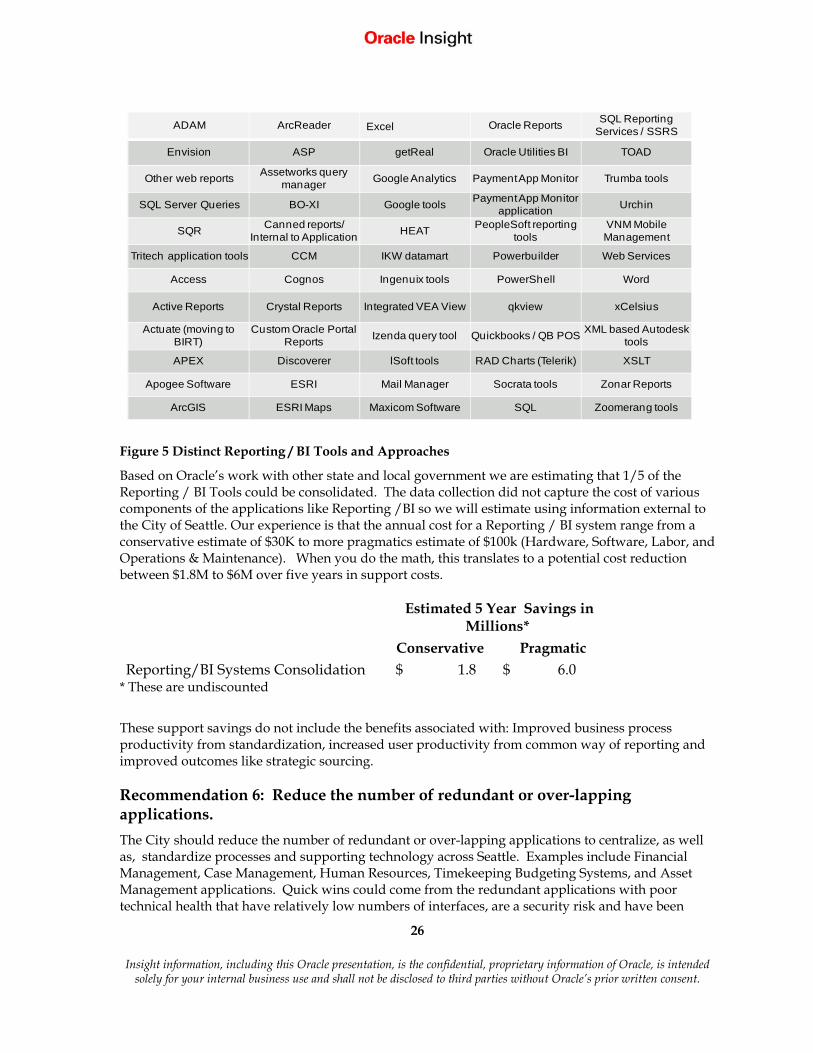
26
Insight information, including this Oracle presentation, is the confidential, proprietary information of Oracle, is intended solely for your internal business use and shall not be disclosed to third parties without Oracle’s prior written consent.
ADAM ArcReader Excel Oracle Reports SQL Reporting Services / SSRS
Envision ASP getReal Oracle Utilities BI TOAD
Other web reports Assetworks query manager Google Analytics Payment App Monitor Trumba tools
SQL Server Queries BO-XI Google tools Payment App Monitor application Urchin
SQR Canned reports/ Internal to Application HEAT PeopleSoft reporting
toolsVNM Mobile Management
Tritech application tools CCM IKW datamart Powerbuilder Web Services
Access Cognos Ingenuix tools PowerShell Word
Active Reports Crystal Reports Integrated VEA View qkview xCelsius
Actuate (moving to BIRT)
Custom Oracle Portal Reports Izenda query tool Quickbooks / QB POS XML based Autodesk
tools
APEX Discoverer lSoft tools RAD Charts (Telerik) XSLT
Apogee Software ESRI Mail Manager Socrata tools Zonar Reports
ArcGIS ESRI Maps Maxicom Software SQL Zoomerang tools
Figure 5 Distinct Reporting / BI Tools and Approaches
Based on Oracle’s work with other state and local government we are estimating that 1/5 of the Reporting / BI Tools could be consolidated. The data collection did not capture the cost of various components of the applications like Reporting /BI so we will estimate using information external to the City of Seattle. Our experience is that the annual cost for a Reporting / BI system range from a conservative estimate of $30K to more pragmatics estimate of $100k (Hardware, Software, Labor, and Operations & Maintenance). When you do the math, this translates to a potential cost reduction between $1.8M to $6M over five years in support costs.
Estimated 5 Year Savings in Millions*
Conservative Pragmatic Reporting/BI Systems Consolidation $ 1.8 $ 6.0
* These are undiscounted
These support savings do not include the benefits associated with: Improved business process productivity from standardization, increased user productivity from common way of reporting and improved outcomes like strategic sourcing.
Recommendation 6: Reduce the number of redundant or over-lapping applications.
The City should reduce the number of redundant or over-lapping applications to centralize, as well as, standardize processes and supporting technology across Seattle. Examples include Financial Management, Case Management, Human Resources, Timekeeping Budgeting Systems, and Asset Management applications. Quick wins could come from the redundant applications with poor technical health that have relatively low numbers of interfaces, are a security risk and have been
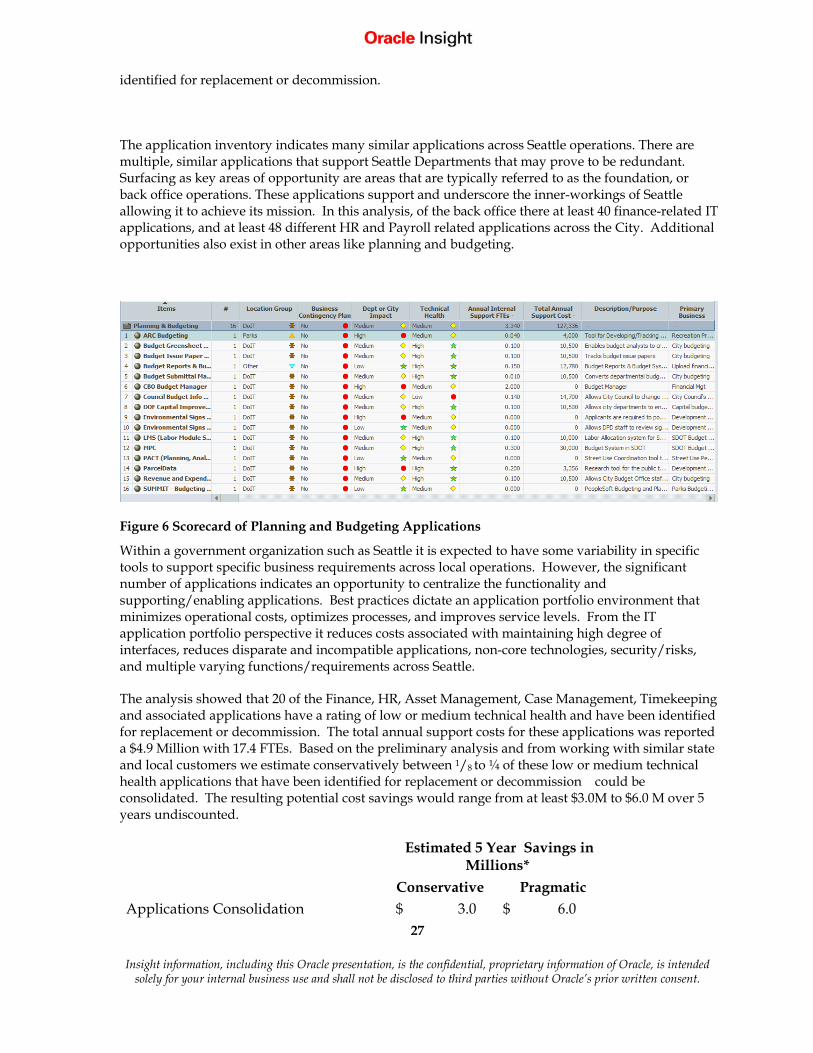
27
Insight information, including this Oracle presentation, is the confidential, proprietary information of Oracle, is intended solely for your internal business use and shall not be disclosed to third parties without Oracle’s prior written consent.
identified for replacement or decommission.
The application inventory indicates many similar applications across Seattle operations. There are multiple, similar applications that support Seattle Departments that may prove to be redundant. Surfacing as key areas of opportunity are areas that are typically referred to as the foundation, or back office operations. These applications support and underscore the inner-workings of Seattle allowing it to achieve its mission. In this analysis, of the back office there at least 40 finance-related IT applications, and at least 48 different HR and Payroll related applications across the City. Additional opportunities also exist in other areas like planning and budgeting.
Figure 6 Scorecard of Planning and Budgeting Applications
Within a government organization such as Seattle it is expected to have some variability in specific tools to support specific business requirements across local operations. However, the significant number of applications indicates an opportunity to centralize the functionality and supporting/enabling applications. Best practices dictate an application portfolio environment that minimizes operational costs, optimizes processes, and improves service levels. From the IT application portfolio perspective it reduces costs associated with maintaining high degree of interfaces, reduces disparate and incompatible applications, non-core technologies, security/risks, and multiple varying functions/requirements across Seattle.
The analysis showed that 20 of the Finance, HR, Asset Management, Case Management, Timekeeping and associated applications have a rating of low or medium technical health and have been identified for replacement or decommission. The total annual support costs for these applications was reported a $4.9 Million with 17.4 FTEs. Based on the preliminary analysis and from working with similar state and local customers we estimate conservatively between 1/8 to ¼ of these low or medium technical health applications that have been identified for replacement or decommission could be consolidated. The resulting potential cost savings would range from at least $3.0M to $6.0 M over 5 years undiscounted.
Estimated 5 Year Savings in Millions*
Conservative Pragmatic Applications Consolidation $ 3.0 $ 6.0

28
Insight information, including this Oracle presentation, is the confidential, proprietary information of Oracle, is intended solely for your internal business use and shall not be disclosed to third parties without Oracle’s prior written consent.
* These are undiscounted
This savings would allow Seattle to shift the available investment/resources to support other value-based investments. It is important to note that those benefits are understated as they do not include the benefits associated with improved productivity, reduced expenses and improved outcomes associated with a single integrated system (as were outside scope of the inventory effort). It is also, important to understand that consolidation does not equate to centralization.
The finance functions have multiple similar applications spanning across planning & budgeting, project costing/grants management, receivables, asset management, procurement and payables.
Recommended key areas of focus:
Standardize the budgeting and planning applications. There are more than 10 applications supporting the budgeting and planning activities with the overall impact to Seattle sub-optimized City is not using one approach to manage and plan its resources. The degree of importance in managing Seattle’s budgeting and planning activity is critical to clearly understand the impetus into managing resources, expenses, and future plans and reporting across departments. Centralize the budgeting and planning applications to support a standard, agreed-upon budget process that provides improved capabilities with an opportunity to leverage Seattle’s investment in Oracle.
Standardize the procurement applications. Streamline procurement with globally proven, best practices incorporated into the process with end-to-end automation throughout the procure-to-pay lifecycle. There are over 10 procurement applications supported across Seattle which underscores the opportunity to better centralize IT investment. In addition, there is high probability to improve the efficiency and effectiveness of procurement-to-pay through standard city-wide approach, improved visibility and analysis into City spend with an overall improvement through economies of scale and improved supplier relationships.
Standardize the project costing applications. There are over 10 project costing/grants management applications used across the City. Opportunity to centralize applications enhances uniform use of data and information for financial and planning purposes for managing costs.
Standardize the Human Resource processes. There are over 40 HR (HRIS) applications used across Seattle. Standardize an HR applications approach that incorporates a single integrated system that includes recruitment, on boarding, performance management, learning management, compensation, timekeeping, payroll, benefits, succession and workforce planning. Through improved reporting and analysis, Seattle will achieve benefits beyond IT portfolio benefits which will include improved productivity, and other outcomes to meet Seattle strategy.
There are multiple financial and qualitative benefits associated with a single integrated system across the City. These include:
• Leveraging the Oracle PeopleSoft investment - begin by reviewing operational risk, access to financial budget information, project costing/grants management and human resources.
• Highlight those applications that have poor technical health and have relatively low numbers of interfaces, security risk, and, have been identified for replacement or decommission.
• Clarify the requirements and capabilities associated with each department to reduce the redundancy that could be mitigated through a more centralized, single integrated approach

29
Insight information, including this Oracle presentation, is the confidential, proprietary information of Oracle, is intended solely for your internal business use and shall not be disclosed to third parties without Oracle’s prior written consent.
to support Seattle’s strategic vision.
Recommendation 7: Develop a City-wide Integration strategy and initiative that follows industry best practices around Service Oriented Architecture (SOA).
With more than 700 applications, many of them with a significant number of interfaces, Seattle can benefit from a strategy to develop a City-wide Integration strategy. The strategy would follow industry best practices around Service Oriented Architecture (SOA). Leveraging SOA will enable Seattle to shift environments from “Silos” to “Shared Services” reducing duplicate data entry, high support costs and enabling operational efficiency for the City.
Many of Seattle’s information systems have been developed in response to specific problems, often in isolation, with limited overall strategy for integration. Many interactions between systems are supported by “point-to-point” interfaces embedded within the software. A few systems exchange messages, but most interactions rely upon batch file transfers or manual replication of data. Seattle should modernize their infrastructure using Service Oriented Architecture (SOA) to leverage their existing assets while providing a sound foundation for future initiatives.
Oracle recommends standardizing on a single, integrated set of Service Oriented Architecture (SOA) tools for integration to enable cost effective and agile interfaces for Seattle’s numerous heterogeneous applications. Leveraging an Enterprise approach to SOA with a consistent and complete set of tools, templates, content and methodologies will provide business and IT agility, and lower the total cost of ownership. An Enterprise Integration environment provides flexible and efficient integration capability to achieve:
Standardized Integration Architecture to lower development and support costs Connect to virtually any data source, technology (messaging, database, etc.), applications or
business partner through a unified connectivity framework including adapters Route, transform and virtualize services through a scalable Service Bus Orchestrate and build process across systems and people Increase organizational agility by externalizing specific blocks of logic using Business Rules Gain real-time visibility into operation and performance of business processes, along with the
ability to respond to specific situations Consistently and simply secure all services through a policy-driven integrated security
framework
The result will be faster, lower cost and improved reliability for integrations. Seattle City Light has been very successful with SOA integration for their new mission critical applications.
Recommendation 8: Implement robust and compensative IT Portfolio Management tools and governance processes.
The City’s Municipal Information Technologies Investment Evaluation (MITIE) process is a governance process between the CTO office and the departments that reviews and evaluates large new IT projects. The MITIE process does not maintain an application portfolio or formally review existing systems unless they are part of a new project. Oracle recommends Seattle implement robust and compensative IT Portfolio Management tools and governance process either as a part of or in addition to the to help move the city from “Silos” to “Shared Services” and establish ongoing management to drive future efficiency, effectiveness, and security improvements . This operationalizes the intent of SLI 75-1-A-2 into the City’s processes. This effort used Oracle’s Primavera Portfolio Management system and the process detailed in the prior section to develop these recommendations.
The benefits of leveraging Oracle’s Primavera Portfolio Management system and the process detailed

30
Insight information, including this Oracle presentation, is the confidential, proprietary information of Oracle, is intended solely for your internal business use and shall not be disclosed to third parties without Oracle’s prior written consent.
in the prior section are presented in the next section.

31
Insight information, including this Oracle presentation, is the confidential, proprietary information of Oracle, is intended solely for your internal business use and shall not be disclosed to third parties without Oracle’s prior written consent.
Benefits
Benefits There are many benefits to managing Seattle’s application portfolio and instituting an application rationalization process. These benefits translate to substantial cost savings for your organization:
Free up staff and money for new initiatives. The evaluation phase is almost certain to uncover significant opportunities for staff and cost savings. These savings can be applied to applications that truly serve the needs of the business of running City of Seattle operations.
Minimize future application purchases. Good portfolio management provides mechanisms for screening requests for new applications. With APM in place, the decisions to deploy all future applications are made in the informed context of what is already deployed and what the benefits to the business would truly be.
Eliminate unnecessary investments. The strategic value of a formal evaluation of each application is in understanding its contribution to the objectives of the organization. There’s no point in investing in applications that don’t help drive business.
Eliminate redundancy. Using a strong portfolio management toolset and process, it becomes easy to identify applications that perform similar or identical functions for different parts of the organization.
Consolidate to adhere to standards. A portfolio of applications that is too diverse costs far more to maintain than a consolidated portfolio. Consolidating applications reduces the standards with which Seattle must comply and saves money.
Reduce training and support requirements. Each application that is in use requires some amount of support from either your own staff or a vendor’s. This support costs money, and these costs decrease for a given population when the number of applications or vendors can be reduced.
Prevent the “patchwork problem” from recurring. With a sound application governance framework in place, you have a formal mechanism that ensures application deployments continue to move toward your organization’s goals, are consistent with existing IT architecture, align with the primary business and lower operating and support costs. Unlike a one-time review, ongoing governance pays dividends for years to come and ensures operating and capital funds are optimized.
Estimated Financial Benefits To understand the impact of the recommendations the Oracle team was asked to estimate the financial benefits. According to industry analysts such as Gartner, a focused applications rationalization effort will typically result in a 20% cost savings while improving support for the lines of business. The City annually spends roughly $ 40 Million on Information Technology across all departments including hardware, software, internal city IT staff, contractors and staff as reported on the application inventory data. Appling Gartner’s rule of thumb would translate into $8 Million per year in savings. As detailed in each of the recommendations sections Oracle estimates the IT savings alone in the range below:

32
Insight information, including this Oracle presentation, is the confidential, proprietary information of Oracle, is intended solely for your internal business use and shall not be disclosed to third parties without Oracle’s prior written consent.
Estimated 5 Year Savings in
Millions* Conservative Pragmatic
Reporting/BI Systems Consolidation $ 1.8 $ 6.0
Applications Consolidation $ 3.0 $ 6.0
Total $ 4.8 $ 12.0 * These are undiscounted These benefits are conservative as they do not include the benefits associated with: Improved business process productivity from standardization, reduced risks from more secure applications, user productivity from Single Sign-On and improved outcomes like strategic sourcing. When you include these un-quantified savings the totals would be in the same ranges as the rule of thumb estimates from the independent analyst Gartner. These un-quantified benefits could also be used to offset the implementation costs for these recommendations. Benefit Realization To realize these benefits it is important to ensure sustainable follow-through on application decisions across Seattle. Use a governance framework to oversee all your projects, including those related to applications. Whichever mechanism is used, it is imperative to track portfolio changes through to completion and implement an on-going portfolio management process supported by effective tools.

33
Insight information, including this Oracle presentation, is the confidential, proprietary information of Oracle, is intended solely for your internal business use and shall not be disclosed to third parties without Oracle’s prior written consent.
Appendix A - Data Validation
The consolidated data was reviewed and cleaned up to make it more useful for analysis. The table blow briefly summarizes what was done.
Data Clean Up, and Validation Changes
Source Col Value Target Column Description of changes
Many Many Same Standardization - Making the values consistent mostly different abbreviation for the same thing e.g. (Doit, DOIT, DoIT -> DoIT MS Access, Access, Microsoft Access -> Access,…)
Application Name - Duplicate Entries
Validation Group Per Byron, Deb, Erin and Patti
1 These are not application per say more tools e.g. Visio,,, - These were not changed
2 Are all these SharePoint one and the same – e.g. duplicates Three were set to "2- Duplicate" will be excluded from the analysis
3 Are all these SUMMITs one and the same – e.g. duplicates Five were set to "3- Duplicate" and will be excluded from the analysis
4 Are all these HRIS one and the same – e.g. duplicates - Three were set to were set to "4- Duplicate" and will be excluded from the analysis
… The same was done for other sets of duplicate entries like CCCS, HEAT,….
Application Support Location
Location Group This a summarization of the Application Support Location field into high level groups that correspond roughly to the City Data Centers(DoIT FAC, Police, SCL, TMC, Parks and Seattle Center), "External" and "Other" These were validated by Debra Schlenker
Application Function Type
Many Application Function Group
Summarization of the Application Function Type into summarized groups - Some cauterization was done for the “Others”
Application Function Type
Many Application Function Sub-
Type
Sub Grouping of the Application Function Type It is for the most part it is the second part of the concatenated Application Function Type - Some cauterization was done the “Others” and a few others that were obvious - This was validated by Bryon Tokunaga

34
Insight information, including this Oracle presentation, is the confidential, proprietary information of Oracle, is intended solely for your internal business use and shall not be disclosed to third parties without Oracle’s prior written consent.
Data Clean Up, and Validation Changes
Source Col Value Target Column Description of changes
Estimated Number of Users
# Users Numeric Converted the # of users into numeric values changing the text to a representative numeric value. Here are the basic rules
Various Deleted the “+” when it was “100+”, “500+”, Various When it was a range I took the midpoint or
rounded out e.g. “2-5” was set to "4" "Public" Any text value with “Public” was set to 608,000
which is the lasted Census estimate for the population of the City of Seattle
"City Staff"
Any text value with “City Staff” or similar was set to 10,000 – An estimate for the total number of employees of the City of Seattle
“IVR Imports” Any “IVR Imports” application with N/A set to an estimate provided by DoIT staff
“Imports Any “Imports” application with N/A set to an estimate provided by DoIT staff - These are associated with the Data warehouse
Annual Internal Support FTEs
FTEs Numeric Converted the # of Internal support FTEs into numeric values changing the text to a representative numeric value. Here are the basic rules
Various Deleted extra characters “.5 FTE ” was changed to ".5" and similar
< .05 “< .05 ” was changed to ".049" < .5 “< .5” was changed to ".49" < 1 “< 1” was changed to ".99" Minimal "Minimal" set to ".1" as an estimate per DoIT staff Same 3 FTE Support all of
these systems Set to .0667 which is 3 / 45 as there were 45 of these entries from "Seattle Center"
Costs Included Above "Costs Included Above" set to "0" as the FTE are included elsewhere Per DoIT staff
Supported by SCL "Supported by SCL" set to "0" as the FTE are included elsewhere Per DoIT staff
Not supported separately "Not supported separately" set to "0" as the FTE are included elsewhere Per DoIT staff
N/A "N/A" set to "0" as it is a free public domain software Per DoIT staff
Blanks "Blanks" set to "0" Per DoIT staff Total Annual Support Cost Total Annual
Support Cost Numeric
Converted the Total Annual Support Cost into numeric values changing the text to a representative numeric value. Here are the basic rules
??? “??? ” was changed to "$ 0" Less than $10K
“Less than $10K ” was changed to "$ 9,999"

35
Insight information, including this Oracle presentation, is the confidential, proprietary information of Oracle, is intended solely for your internal business use and shall not be disclosed to third parties without Oracle’s prior written consent.
Data Clean Up, and Validation Changes
Source Col Value Target Column Description of changes
Contract Programming Services $150,000
"Contract Programming Services $150,000" ” was changed to "$150,000"
Costs are distributed between all applications.
"Costs are distributed between all applications" was changed to "$ 0" as there was only one of these
Costs included above "Costs included above" was set to "$ 0" as the $ are included elsewhere Per DoIT staff
Costs included in Field Apps - Minimal
"Costs included in Field Apps - Minimal" set to "$0" as it says minimal
FREE public domain software "FREE public domain software" was set to "$ 0" since is say FREE public domain
Included above
"Included above" was set to "$ 0" as the $ are included elsewhere Per DoIT staff
Included in above HRIS - EV5 costs.
"Included in above HRIS - EV5 costs." was set to "$ 0" as the $ are included elsewhere Per DoIT staff
Included in above Summit Financials costs.
"Included in above Summit Financials costs." was set to "$ 0" as the $ are included elsewhere Per DoIT staff
Minimal “Minimal ” was changed to "$ 0" N/A “N/A ” was changed to "$ 0" Not supported separately -
updating the hydraulic models depends on GIS
updates of water system data plus downloads from Banner for water consumption data
“Not supported separately... ” was changed to "$ 0"
Blanks "Blanks" set to "$ 0" Single Sign-On Updated Single
Sign-On City staff provided the list below of applications using SSO provided by the City. The rest were set to no
DPD Portal
DPD Online Electrical Permits SPD Online Reports My.Seattl
e.gov
HXM e-File(HEEFS) Application Configuration Total Annual
Support Cost Numeric
During the presentation to the Tech Board staff felt some of the Application Configurations provided by the City staff were incorrect, City Staff sent us the following updates
Exchange 2007 – Citywide Set to COTS HP Nearpoint – Citywide Set to COTS NetIQ – Citywide Set to COTS Salesforce.com – Mayor’s Set to COTS
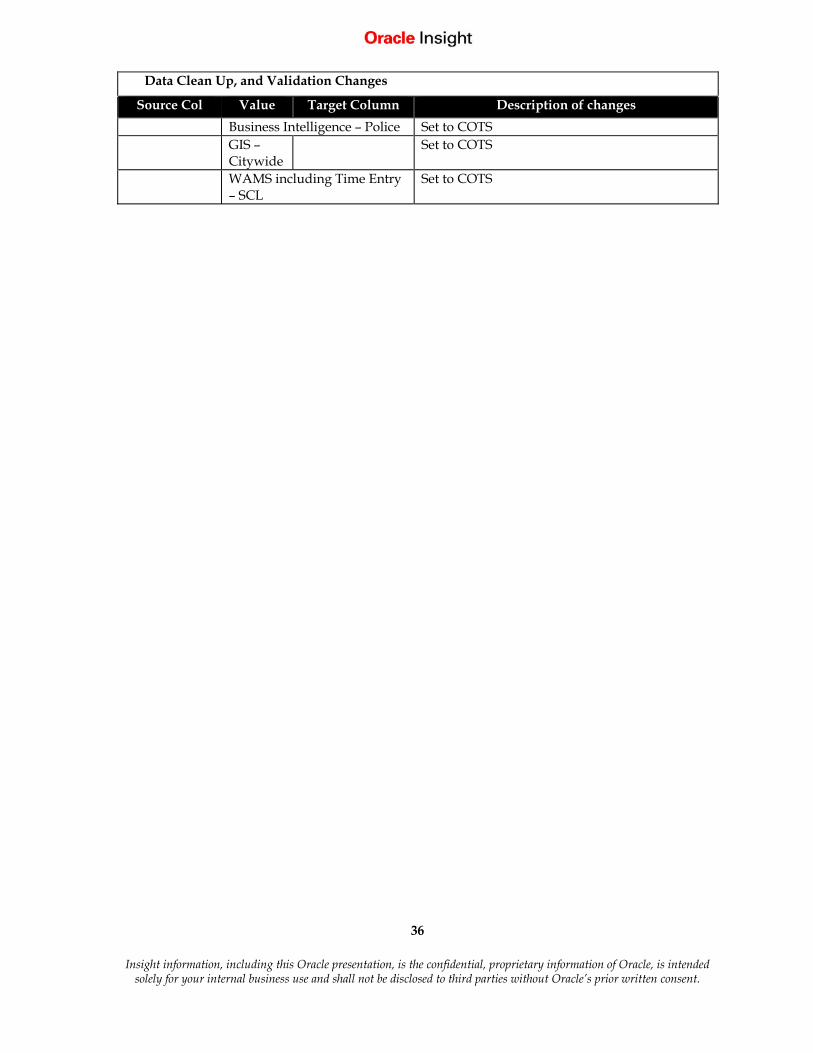
36
Insight information, including this Oracle presentation, is the confidential, proprietary information of Oracle, is intended solely for your internal business use and shall not be disclosed to third parties without Oracle’s prior written consent.
Data Clean Up, and Validation Changes
Source Col Value Target Column Description of changes
Business Intelligence – Police Set to COTS GIS –
Citywide Set to COTS
WAMS including Time Entry – SCL
Set to COTS


APPENDIX 4. Microsoft Infrastructure Optimization Assessment Results, Presentation to City Technology Board Prepared by Microsoft
July 24, 2012


City of Seattle Response to SLI 75-1-A-2, to perform: A review of information technology systems and protocols Citywide to identify efficiency, effectiveness, and security improvements
10/17/2012 1
Presented by: Andy Hill
Account Technology Strategist
Steve Finney Account Executive

Executive Summary
Purpose – To show what was learned from a citywide IT survey and
the benefits of increasing the level of IT optimization. – Develop a long term operational strategy to:
• Improve citywide IT efficiencies to lower costs, • Provide updated tools to increase employee productivity • Create agility to respond quicker to business
requirements, such as: – Mobile applications and devices, – Single sign-on, – Quicker outreach communications to citizens
10/17/2012 2

Executive Summary (continued) Outcomes
– Obtain City’s Support to Adopt City Optimization Strategy • Standardization of the IT platform allows for a more agile enterprise
– Invest in three citywide projects: • Upgrade to current desktop operating system (Windows 7) • Standardize on server and desktop management tools and methodology • Obtain a standard set of productivity tools, including:
» Instant messaging, for more expedient communication, » Web conferencing, to lower transportation costs and increase internal and
external communication, » Eforms to lower paper, printing, and storage costs, while increasing
processing efficiencies, » Enterprise search .
– Shift work efforts from maintenance to innovation • Combine common citywide tasks to redeploy resources for line-of-business specific
advancement • Take advantage of the tremendous scale of cloud services, such as:
– Moving to Microsoft Office 365 cloud services will cost the same as current, yet provide access to modernized tools.
10/17/2012 3
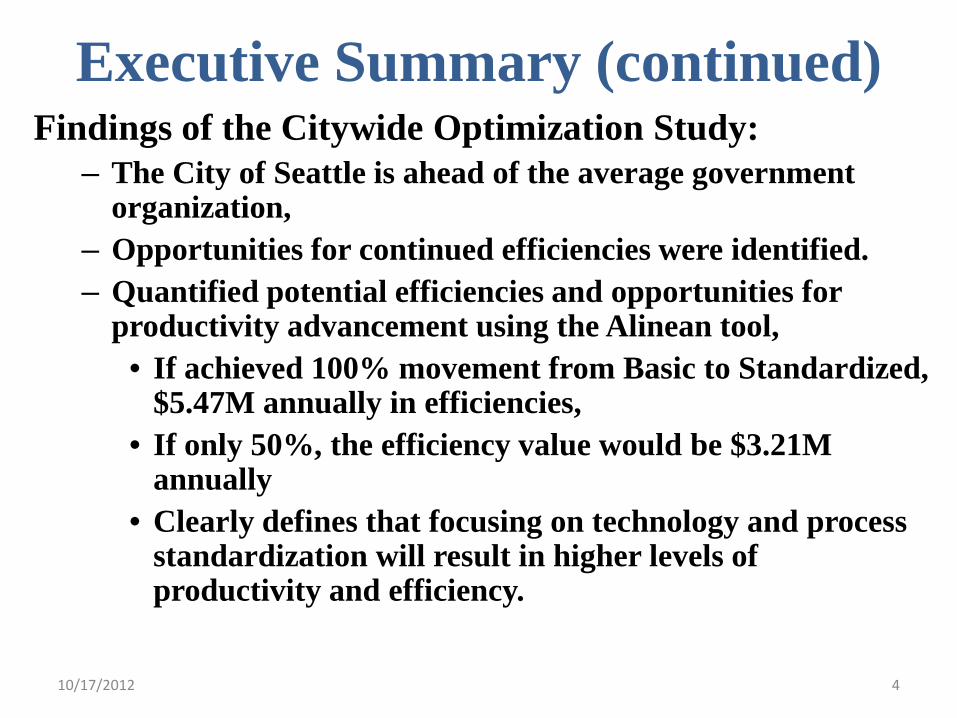
Executive Summary (continued) Findings of the Citywide Optimization Study:
– The City of Seattle is ahead of the average government organization,
– Opportunities for continued efficiencies were identified. – Quantified potential efficiencies and opportunities for
productivity advancement using the Alinean tool, • If achieved 100% movement from Basic to Standardized,
$5.47M annually in efficiencies, • If only 50%, the efficiency value would be $3.21M
annually • Clearly defines that focusing on technology and process
standardization will result in higher levels of productivity and efficiency.
10/17/2012 4

Infrastructure Optimization Model
• Definition: – Infrastructure Optimization is a focused process of assessing technology practices across
IT capabilities to aid in prioritizing projects that will increase productivity and efficiency.
• Basis of the Alinean Infrastructure Optimization Model: – Started with Carnegie-Mellon called it the Capacity Maturity Model (CMM). – Microsoft worked with Gartner and MIT to interview over 1,000 organizations. – Developed and refined the I/O model that outlines a progression through four stages of
optimizing an organization’s IT infrastructure. – Based on past and present work from Carnegie-Mellon, MIT, IDC, and Gartner.
• Examples of Governments that have adopted the I/O strategy: – Federal Office of Management and Budget (OMB):
• Established the U.S. Government Configuration Baseline (USGCB), and requires federal agencies to standardize desktop configurations to meet USGCB standards.
– http://www.microsoft.com/industry/government/solutions/usgcb/default.aspx
– US Air Force, 500,000 desktops: – http://download.microsoft.com/download/5/c/4/5c46c4a0-950f-40a9-9a8f-9af4a2869bc2/WhitePaper_FDCC%20AirForce.doc
– King County – Snohomish County
10/17/2012 5

Stages of IT Optimization: Goal: Move the City from Basic to Standardized
10/17/2012 6
As progress is made from Basic to Dynamic, automation is increased, operational costs decreased, and worker productivity is increased. Resources can then be reallocated from O&M to innovation.

Industry Average Savings of Optimization
• Lower cost per PC
• Increase Servers Managed by FTE
• Lower IT Labor Costs Per Server/Year
10/17/2012 7
The Spotlight on Costs study was commissioned by Microsoft as a blind study. The study was conducted by Hansa/GCR, an independent analyst firm, who collected the data used. http://download.microsoft.com/download/2/F/E/2FE024E8-F4ED-48AE-9190-5EFC99FB02D9/IO%20Customer%20Presentation.pptx

The Assessment Tool and Process • Alinean Tool
– Created to assess current state and future efficiencies of an IT environment – Includes independence research data from IDC, Gartner Consulting Research, and WiPro, – Based on data from over 1,000 similar organizations, – Used by over 15,000 organizations – The Alinean Tool provides guidance to develop an infrastructure optimization strategy. The
efficiency benefit is dependent on the level and timing of investments.
• The Process – 14 Departments that we surveyed:
• DOT, DPD, FAS, HSD, Law, Leg, Courts, Parks, Seattle Center., DoIT, SCL, SPU, SFD, SPD. – Surveys were conducted to collect data, such as:
• FTE Labor costs by staffing level • Number of support calls by type • Quantities and types of servers by department • Software types and versions • Number of desktop configurations • Storage amounts • Networking management costs
– Two levels of optimization, 50% and 100%, were modeled to provide a reasonable range of expected results.
10/17/2012 8

Citywide Findings of the Assessment Core Infrastructure Comparison with other Government organizations *
Current optimization level (B=Basic, S=Standardized, R=Rationalized and D=Dynamic) for the capabilities and workloads for Core IO at the City of Seattle.
Focus areas to move to Standardized: • Data Center Management and
Virtualization • Client Management and
Virtualization • Information Process and
Compliance • Information Protection and
Control
10/17/2012 9 * Comparison is with other government organizations similar in size using data from the Alinean database

Citywide Findings of the Assessment Business Productivity Comparison with other Government organizations*
Current optimization level (B=Basic, S=Standardized, R=Rationalized and D=Dynamic) for the capabilities and workloads for BP optimization at the City of Seattle.
Focus areas to move to Standardized: • Unified Communication
• IM/Presence • Conferencing
• Enterprise Content Management • Information management • Process Efficiency • Compliance and discovery
• Enterprise Search • Interactive Experience and
Navigation • Reporting and Analysis
• Dashboards • Analytics and Data Mining • Report Generation and
Distribution • Content Creation
• Authoring • Multi-device support (mobile
devices)
10/17/2012 10 * Comparison is with other government organizations similar in size using data from the Alinean database
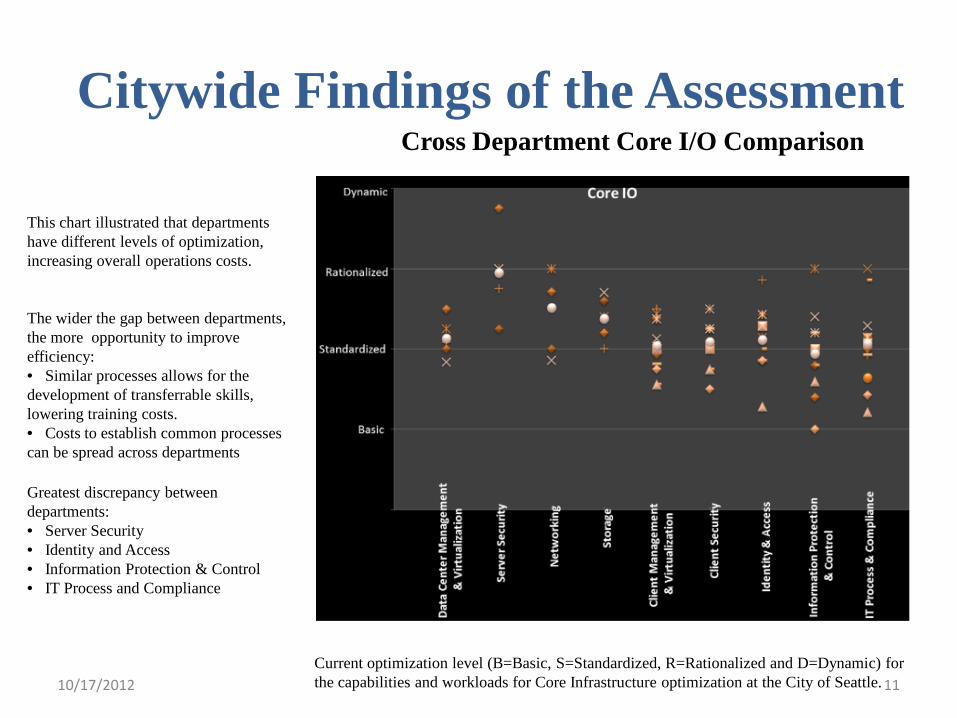
Citywide Findings of the Assessment Cross Department Core I/O Comparison
Greatest discrepancy between departments: • Server Security • Identity and Access • Information Protection & Control • IT Process and Compliance
Current optimization level (B=Basic, S=Standardized, R=Rationalized and D=Dynamic) for the capabilities and workloads for Core Infrastructure optimization at the City of Seattle.
The wider the gap between departments, the more opportunity to improve efficiency: • Similar processes allows for the development of transferrable skills, lowering training costs. • Costs to establish common processes can be spread across departments
10/17/2012 11
This chart illustrated that departments have different levels of optimization, increasing overall operations costs.

Citywide Findings of the Assessment Cross Department Business Optimization
Greatest discrepancy between departments: • Portals • Information Management • Compliance • Dashboards • Report generation and distribution • User Accessibility • Interoperability
Current optimization level (B=Basic, S=Standardized, R=Rationalized and D=Dynamic) for the capabilities and workloads for BP optimization at the City of Seattle.
10/17/2012 12
The wider the gap between departments, the more opportunity to improve efficiency: • Standardized processes allows for the
development of transferrable skills, lowering training costs.
• Costs to establish common processes can be spread across departments
This chart illustrated that departments have different levels of optimization, increasing overall operations costs.

Citywide Findings of the Alinean Tool Efficiency Benefit after Optimization
Core Infrastructure (Operational Cost Reductions*) Annual IT Operations Costs per User Current
Cost (As Is) Optimized Cost (To Be) Annual Benefits per User
50% 100% 50% 100%
PC Operations and Administration $540 $483 $428 $57 $113
Server Operations and Administration $633 $547 $461 $86 $172
IT Service Desk $201 $149 $105 $52 $96
Tools and Directory Management $248 $208 $168 $40 $80
Client Maintenance and Support Contracts $486 $475 $475 $11 $11
Server Maintenance and Support Contracts $230 $155 $155 $75 $75
Total Annual IT Operations Costs per User $2,338 $2,017 $1,792 $321 $547
Total Annual IT Benefit (Using 10,000 City employees)
$3.21M $5.47M
*Includes IT productivity improvements, operations, and maintenance costs. The Alinean tool estimates provide guidance to develop strategy and is not definitive. Benefits are dependent on level and timing of investments.
10/17/2012 13

Citywide Findings of the Alinean Tool Additional Efficiency Benefit after Optimization
Business Process (Efficiency)
10/17/2012 14
Business operations (indirect) Definition
End-user operations Ability to more efficiently accomplish daily tasks, such as searching for information, compatibility with modern applications, and the ability to intuitively use new capabilities
Service Desk Problem Resolution Downtime
A common set of technologies will allow the helpdesk to be more aware of exactly how a machine is built, reducing the amount of time required to solve user support tickets
PC Planned Downtime The more common the desktop and server design, the more efficiently the computers can be serviced.
PC Unplanned Downtime When unexpected events take place, a common configuration will allow for the resource pool to effectively assist a larger number of computers, reducing the amount of time required to close helpdesk tickets.

Opportunities Enabled by Standardization
• City Benefits: – Modernization: provides web conferencing, instant messaging, e-forms, mobile
devices and apps. – Agility: becoming responsive to emerging business demands. – Efficiency: striving to reduce support and maintenance costs, – Repurposing: strategic use of existing people and resources for new innovations.
• Employee Benefits – Less time spent on operations & maintenance- More time for innovative solution
development, – Use of more productive tools,
• IM, Web Conferencing, e-forms, – Increased job mobility between departments.
• Citizen Benefits: – Less taxpayer dollars directed at maintaining old systems, – Faster access to information with greater use of web technologies, – Higher levels of communication with web conferencing, – Easier to do business with the City using e-forms.
10/17/2012 15

Findings-based Projects
• Upgrade to current desktop operating system (Windows 7)
– Security: Support for the City’s Windows XP platform ends April 8, 2014
• Standardization of client and server management tools
– Reduces PC operations and Administration
– Decreases user downtime for problem resolution
– Reduces IT Service Desk costs – Reduces client and server
maintenance and support costs • Standardize on a common set of
productivity tools – Increases efficiency of end-user
operations – Reducing the wide distribution of
optimization levels
10/17/2012 16

Summary • Microsoft, being a strong partner of the City and an industry leader in
the co-development of an Infrastructure Optimization model, assisted the City by surveying departments and using the data as input into the Alinean assessment tool to map the City’s current state in the optimization model.
• Based on the output of the tool, Microsoft believes the City has opportunities to lower costs of operations and increase user productivity.
• Microsoft recommends the City adopt this optimization strategy to guide IT investments and repeat this process on an ongoing basis to measure progress.
• Three initial projects were identified to realize these opportunities: – Continue with the upgrade to Windows 7 prior to April 8, 2014. – Adopt a uniform set of productivity tools that leverage the scale of cloud
services. – Standardize on desktop and server management tools to support citywide
proficiencies. 10/17/2012 17

Cost Savings Increasing Optimization Lowers Cost of Operations*
10/17/2012 18
*Based on cost analysis data collected from City of Seattle departments
• Following a coordinated strategic approach to enterprise IT investments will decrease costs and allow for higher levels of agility.
• Having a common way to set-up and manage servers and desktops provides for higher leverage of scare resources.
• Allows for the redeployment of resources to high value tasks.
$2,338
$1,792 $1,735
$-
$500
$1,000
$1,500
$2,000
$2,500
Basic Standardized Rationalized
Annual Labor Cost/PC

Thank you
10/17/2012 19
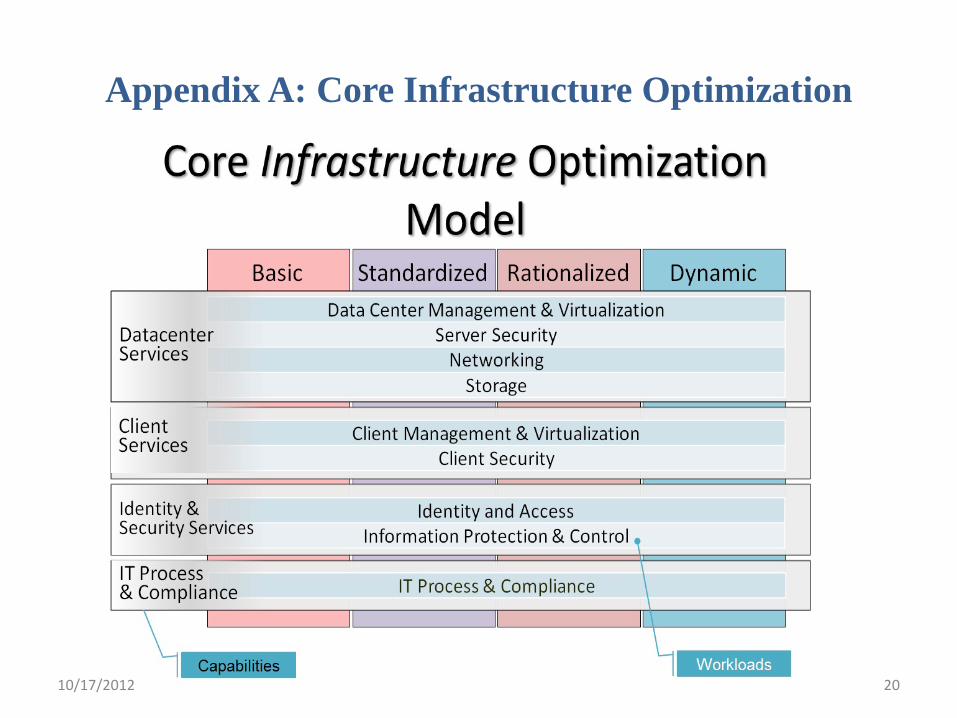
Appendix A: Core Infrastructure Optimization
10/17/2012 20

Appendix A: Core Infrastructure Optimization Data Center Services
Data Center Services describes how customers should manage and maintain the servers, storage devices, network components and other hardware and software assets in the data center. It includes deploying Operating Systems, patches, and applications across the organization, and also implementing virtualization for better optimization and control over the IT infrastructure. It covers the security aspects like firewalls, IPS and anti-virus, along with configuration for network resources and bandwidth allocations. It also describes about efficient storage practices for better security and high availability of data without putting any additional burden on the IT resources.
Client Services Client Services describes how customers should manage and maintain the client devices like desktops, laptops, mobiles devices, and other non-PC devices to ensure all time accessibility to business related information. It includes factors like deploying Operating Systems, application, and patches on client systems, application compatibility testing, configuration check, and implementing application virtualization to provide on-demand availability of business applications. It covers management of mobile and non-PC devices with auto-configuration and compliance checks. It also includes the security aspects, disk or drive encryption to ensure a complete secure environment for users to work.
Identity and Security Services Identity and Security Services describes how customers should manage and protect the identities of users, authentication and authorization for business resources and applications, and how to manage access for corporate mobile users, customers and/or partners outside the firewall. It also covers methods and policies to protect all kind of data residing inside the organization, either on servers, client systems, or any of network resources.
IT Process and Compliance IT Process and Compliance describes the guidelines about how to plan, develop, deploy, and support IT services and solutions while ensuring high reliability and availability. It includes planning about alignment of IT with business and defining policies and reliability definitions for the IT services. It also covers on-time delivery and deployment of project plans to ensure smooth operations including health and service monitoring. Security management, problem management, change and configuration control, service ownership and accountability along with compliance controls contribute to efficient management of IT processes.
10/17/2012 21

Appendix B: Business Productivity
10/17/2012 22

Appendix B: Business Productivity Collaboration describes how customers can use workspaces and portals to provide a productive collaboration environment to meet specific business needs with IT-defined processes and controls. It offers social computing capabilities, integration of portals with line-of-business applications, and federated relationships with partners and customers. It provides users with an information-rich collaborative environment deployed across on-premises and cloud environment. It also includes effective project planning and management and project portfolio management to better align to business strategy and goals. Unified Communications describes how customers should manage and secure their communications infrastructure from viruses, SPAM, and malware. As structured and un-structured data converge with different types of communication like e-mail, voice, presence, and conferencing; this capability provides a framework for IT to help simplify how people work together. Enterprise Content Management describes how customers can manage the full lifecycle of information from inception to archive or deletion. It helps manage both unstructured and structured data across the organization and helps avoid the chaos of unmanaged and unchecked content, duplication, and rework. It helps bring structure and management to all types of documents and information with the ability to regulate and track them. It also offers forms-based solutions integrated with line-of-business applications and extended across the organization, Web content and records management while ensuring compliance and supporting e-Discovery. Enterprise Search describes how customers can use a robust enterprise search solution to allow users to make the right decisions based on the corporate knowledge, search relevance models, and indexing of structured and unstructured content across different information sources. Reporting and Analysis describes how customers can enable users to make improved business decisions using dashboards, reports, analytics and data mining. Users can create, publish, and share highly formatted and interactive reports and dashboards to make business information easily and securely available to others. It helps provide a quick and consolidated view of information across all business dimensions and aspects. Content Creation describes how customers can author rich content with enhanced accessibility. It helps deliver integrated and high fidelity usability experience across client, Web, multiple devices, and other line-of-business applications. It helps improve creation efficiency and support content and application accessibility.
10/17/2012 23

Appendix C: Alinean Assessment Tool
The Alinean team, the developers of this IO Assessment Tool, have over 15 years of experience in the practical development and application of benchmarking, assessment, ROI and TCO methodologies, models and tools to optimize IT investment decision making. The Alinean team originally pioneered the concept of interactive ROI and TCO software in 1994, developing over 600 award-winning ROI sales tools for Intel, SAP, Microsoft, Dell, HP, IBM, Symantec, 3-Com and many others creating the industry-standard software for CIO budgeting, planning and ROI/TCO benchmarking. Alinean business value selling solutions are enterprise class, and have been custom developed to analyze and cost-justify most IT solutions, including: servers, storage, systems management, telecommunications, operating systems, eCRM, wireless, security, database management, ebusiness procurement, ERP, supply chain management, outsourcing, business intelligence, mobility, collaborative commerce, content and document management, asset management and office automation. Since 1994, the Alinean team has been the pioneering builder of tools to help quantify and improve the ROI and TCO of IT investments. Additional information about Alinean can be found at http://www.alinean.com
10/17/2012 24

Appendix D: City of Seattle’s Profile
User distribution: Total number of workers supported: 9,851 High performance workers: 532 Knowledge workers: 2,985 Structured task workers: 1,241 Data entry workers: 1,084 Other: 4,009
Total number of thin clients was found to be: 36
Other mobile messaging devices were: 1,300
The total number of servers was indicated to be 1,710
10/17/2012 25

Appendix D: City of Seattle’s Profile (continued)
10/17/2012 26
The workload profile was as follows: 104 File / Print Servers 264 Directory / Networking Servers 127 Security Servers 33 Messaging and Collaboration Servers 1,182 Other Core Infrastructure Servers
The current servers were determined to have the following operating system profile: 54 Windows NT and 2000 Servers 765 Windows Server 2003 servers 460 Windows Server 2008 servers 157 Linux Servers 189 UNIX Servers 85 Other OS Servers
The total storage was determined to be 136,166 GB in total, with total per server of: 72,433 GB for File / Print Servers 3,040 GB for Directory / Networking Servers 0 GB for Security Servers 57,000 GB for Messaging and Collaboration Servers 3,693 GB for Other Core Infrastructure Servers