NF-Y Binding Site Architecture Defines a C-Fos Targeted Promoter ...
27
RESEARCH ARTICLE NF-Y Binding Site Architecture Defines a C-Fos Targeted Promoter Class Martin Haubrock*, Fabian Hartmann, Edgar Wingender Institute of Bioinformatics, University Medical Center Göttingen (UMG), Georg-August-University Göttingen, Goldschmidtstrasse 1, 37077 Göttingen, Germany * [email protected] Abstract ChIP-seq experiments detect the chromatin occupancy of known transcription factors in a genome-wide fashion. The comparisons of several species-specific ChIP-seq libraries done for different transcription factors have revealed a complex combinatorial and context- specific co-localization behavior for the identified binding regions. In this study we have investigated human derived ChIP-seq data to identify common cis-regulatory principles for the human transcription factor c-Fos. We found that in four different cell lines, c-Fos targeted proximal and distal genomic intervals show prevalences for either AP-1 motifs or CCAAT boxes as known binding motifs for the transcription factor NF-Y, and thereby act in a mutu- ally exclusive manner. For proximal regions of co-localized c-Fos and NF-YB binding, we gathered evidence that a characteristic configuration of repeating CCAAT motifs may be responsible for attracting c-Fos, probably provided by a nearby AP-1 bound enhancer. Our results suggest a novel regulatory function of NF-Y in gene-proximal regions. Specific CCAAT dimer repeats bound by the transcription factor NF-Y define this novel cis-regula- tory module. Based on this behavior we propose a new enhancer promoter interaction model based on AP-1 motif defined enhancers which interact with CCAAT- box characterized promoter regions. Introduction Transcription factors (TFs) are proteins that control gene expression through a variety of mechanisms such as enhancing the efficiency of the basal transcription complex to assemble or re-model chromatin. Most of them act by recognizing cis-regulatory elements or TF binding sites (TFBS) in gene proximal (promoter) or distal (enhancer) regions in a sequence-specific way. Each regulatory region is defined by an array of such TFBSs. The cooperative binding of multiple TFs to these closely located TFBSs determines the transcription activity of their target genes [1, 2]. Potential TFBSs can be found everywhere in the genome, but only a minority of them appears to be functional in a given cellular context. Moreover, the activity of a proximal or a distal region in a certain cellular context is associated with its epigenetic status such as DNA- or histone modification, and can be monitored by its sensitivity against DNase I attack [3, 4]. However, it is unclear whether the binding of a TF is the prerequisite or the consequence PLOS ONE | DOI:10.1371/journal.pone.0160803 August 12, 2016 1 / 27 a11111 OPEN ACCESS Citation: Haubrock M, Hartmann F, Wingender E (2016) NF-Y Binding Site Architecture Defines a C-Fos Targeted Promoter Class. PLoS ONE 11(8): e0160803. doi:10.1371/journal.pone.0160803 Editor: Roberto Mantovani, Università degli Studi di Milano, ITALY Received: April 26, 2016 Accepted: July 25, 2016 Published: August 12, 2016 Copyright: © 2016 Haubrock et al. This is an open access article distributed under the terms of the Creative Commons Attribution License, which permits unrestricted use, distribution, and reproduction in any medium, provided the original author and source are credited. Data Availability Statement: All relevant data are within the paper and its Supporting Information files. Funding: The authors acknowledge support by the German Research Foundation and the Open Access Publication Funds of the Göttingen University. Competing Interests: The authors have declared that no competing interests exist.
Transcript of NF-Y Binding Site Architecture Defines a C-Fos Targeted Promoter ...
RESEARCH ARTICLE
NF-Y Binding Site Architecture Defines aC-Fos Targeted Promoter ClassMartin Haubrock*, Fabian Hartmann, Edgar Wingender
Institute of Bioinformatics, University Medical Center Göttingen (UMG), Georg-August-University Göttingen,Goldschmidtstrasse 1, 37077 Göttingen, Germany
AbstractChIP-seq experiments detect the chromatin occupancy of known transcription factors in a
genome-wide fashion. The comparisons of several species-specific ChIP-seq libraries
done for different transcription factors have revealed a complex combinatorial and context-
specific co-localization behavior for the identified binding regions. In this study we have
investigated human derived ChIP-seq data to identify common cis-regulatory principles for
the human transcription factor c-Fos. We found that in four different cell lines, c-Fos targeted
proximal and distal genomic intervals show prevalences for either AP-1 motifs or CCAAT
boxes as known binding motifs for the transcription factor NF-Y, and thereby act in a mutu-
ally exclusive manner. For proximal regions of co-localized c-Fos and NF-YB binding, we
gathered evidence that a characteristic configuration of repeating CCAAT motifs may be
responsible for attracting c-Fos, probably provided by a nearby AP-1 bound enhancer. Our
results suggest a novel regulatory function of NF-Y in gene-proximal regions. Specific
CCAAT dimer repeats bound by the transcription factor NF-Y define this novel cis-regula-
tory module. Based on this behavior we propose a new enhancer promoter interaction
model based on AP-1 motif defined enhancers which interact with CCAAT-
box characterized promoter regions.
IntroductionTranscription factors (TFs) are proteins that control gene expression through a variety ofmechanisms such as enhancing the efficiency of the basal transcription complex to assemble orre-model chromatin. Most of them act by recognizing cis-regulatory elements or TF bindingsites (TFBS) in gene proximal (promoter) or distal (enhancer) regions in a sequence-specificway. Each regulatory region is defined by an array of such TFBSs. The cooperative binding ofmultiple TFs to these closely located TFBSs determines the transcription activity of their targetgenes [1, 2]. Potential TFBSs can be found everywhere in the genome, but only a minority ofthem appears to be functional in a given cellular context. Moreover, the activity of a proximalor a distal region in a certain cellular context is associated with its epigenetic status such asDNA- or histone modification, and can be monitored by its sensitivity against DNase I attack[3, 4]. However, it is unclear whether the binding of a TF is the prerequisite or the consequence
PLOSONE | DOI:10.1371/journal.pone.0160803 August 12, 2016 1 / 27
a11111
OPEN ACCESS
Citation: Haubrock M, Hartmann F, Wingender E(2016) NF-Y Binding Site Architecture Defines aC-Fos Targeted Promoter Class. PLoS ONE 11(8):e0160803. doi:10.1371/journal.pone.0160803
Editor: Roberto Mantovani, Università degli Studi diMilano, ITALY
Received: April 26, 2016
Accepted: July 25, 2016
Published: August 12, 2016
Copyright: © 2016 Haubrock et al. This is an openaccess article distributed under the terms of theCreative Commons Attribution License, which permitsunrestricted use, distribution, and reproduction in anymedium, provided the original author and source arecredited.
Data Availability Statement: All relevant data arewithin the paper and its Supporting Information files.
Funding: The authors acknowledge support by theGerman Research Foundation and the Open AccessPublication Funds of the Göttingen University.
Competing Interests: The authors have declaredthat no competing interests exist.

of an epigenetic modification. Different genomic studies have shown the importance of so-called pioneer- or master-TFs in this process [5, 6]. In any case, the switching between the inac-tive and the active state of a regulatory region must be triggered by an event that involves a sig-nal encoded in its sequence [7].
The ChIP-seq technology is widely used to systematically identify gene regulatory regionsinteracting with a known TF. ChIP-seq experiments combine chromatin immunoprecipitationwith high-throughput sequencing to reveal TF-bound regions in a genome-wide fashion [8].The Encyclopedia of DNA Elements (ENCODE) project provides a large collection of humanrelated ChIP-seq data for more than 100 different TFs as well as their binding behavior in dif-ferent cell types/cell lines [9, 10]. Based on this rich information resource some importantobservations have been made regarding the cooperation of TFs: (a) Transcription factors co-localize (overlap of ChIP-seq regions for different TF) in a complex combinatorial and con-text-specific fashion; different groups of TFs tend to co-localize at distinct sets of proximal anddistal regulatory regions [10]. (b) Extensive changes of these TF co-localizations within a cellexposed to different conditions or across multiple cell types demonstrate the complexity of thegene regulatory syntax [11]. (c) ChIP-seq experiments cannot distinguish between direct andindirect TF occupancy [4, 12]. (d) The occurrence of general “non-targeted TF motifs”, i.e.motifs not known to be associated with the precipitated TF, seems to be a “systematic compo-nent of ChIP-seq data sets” [13].
The missing capability of ChIP-seq experiments to distinguish between direct and indirectTF binding is a notable fact which explains why the interpretation of ChIP-seq-derived regula-tory regions is still a challenging task. For example, the nuclear glucocorticoid receptor (GR)and the activator protein 1 (AP-1) have been shown to interact with each other in two differentmodes. GR can interact with AP-1 in a DNA-dependent mode using two adjacent compositeregulatory elements for the TFs GR and AP-1. Alternatively, the GR can interact with AP-1 atnon-composite elements through protein-protein interaction (tethering). These regions con-tain an AP-1 binding motif (TFBS), but no corresponding GR binding motif [14].
Complex and dynamic co-localization patterns were described for a set of TFs related toChIP-seq experiments done in one cell type under changing conditions or across different celltypes. As an example, it was shown that proximal and distal c-Fos precipitated ChIP-seq regionsare characterized by different sets of co-localized TFs [10]. For the cell line K562 it was shownthat this bisection of c-Fos ChIP-seq regions is an oversimplification [11]. Here, at least leastfive different sub-classes of co-associations with the transcription factor c-Fos were described.The c-Fos protein is part of a heterodimer called AP-1. For DNA-binding, c-Fos (or one of itsparalogs FosB, Fra-1 or Fra-2) has to heterodimerize with a member of the structurally andfunctionally related Jun protein family (Jun, JunB and JunD) [15, 16]. AP-1 regulates a numberof cellular processes including proliferation, differentiation, apoptosis and transformation [17].Therefore, an AP-1 derived regulatory influence should be accompanied by a defined co-locali-zation profile for Fos and Jun protein family members [10, 11]. The majority of all c-Fos precipi-tated ChIP-seq regions in the K562 cell line showed a c-Fos and JUND co-localization profile[11]. Interestingly, a subset of co-localized c-Fos and NF-YA/NF-YB ChIP-seq regions in K562cell lines exists that does not show any significant co-localization pattern to the Jun protein fam-ily. Another study reported that NF-YB precipitated regions extensively co-associate with c-Fostypically at those regulatory regions that lack an AP-1 motif [18]. More recently it was shownthat the CCAAT box motif is the primary binding site in these co-localizing c-Fos and NF-YBChIP-seq regions [19]. In addition the authors observed a distance relationship between twoCCAAT box motifs in the overlap of c-Fos and NF-YB bound regions [19].
In the light of these findings, we made an attempt to revisit the existing c-Fos and NF-YBChIP-seq data done in the ENCODE framework with regard to predominant sequence motifs.
NF-Y Binding Site Architecture Defines a C-Fos Targeted Promoter Class
PLOS ONE | DOI:10.1371/journal.pone.0160803 August 12, 2016 2 / 27

In this study, we present a systematic analysis of ChIP-seq data for the transcription factor c-Fos in the cell lines HUVEC, HeLa S3, K562, and GM12878. We developed a workflow basedon Receiver Operator Characteristic (ROC) curves to identify important TFBS motifs for eachproximal and distal ChIP-seq data sets separately. Using cell-type specific non-overlappingDNase-seq data sets as a negative control, we were able to identify the main regulators for eachbinding regions. We found that in four different cell lines, c-Fos precipitated proximal (pro-moter) and distal (enhancer related) genomic intervals show clear prevalences for either AP-1motifs or CCAAT boxes as known binding motifs for the transcription factor NF-Y, whichoccur in a mutually exclusive manner. Based on this behavior we propose a new enhancer pro-moter interaction model based on AP-1 motif defined enhancers which interact with CCAAT-box characterized promoter regions. We show that this type of interaction is specific for genesassociated with a certain group of biological processes of Gene Ontology.
Results
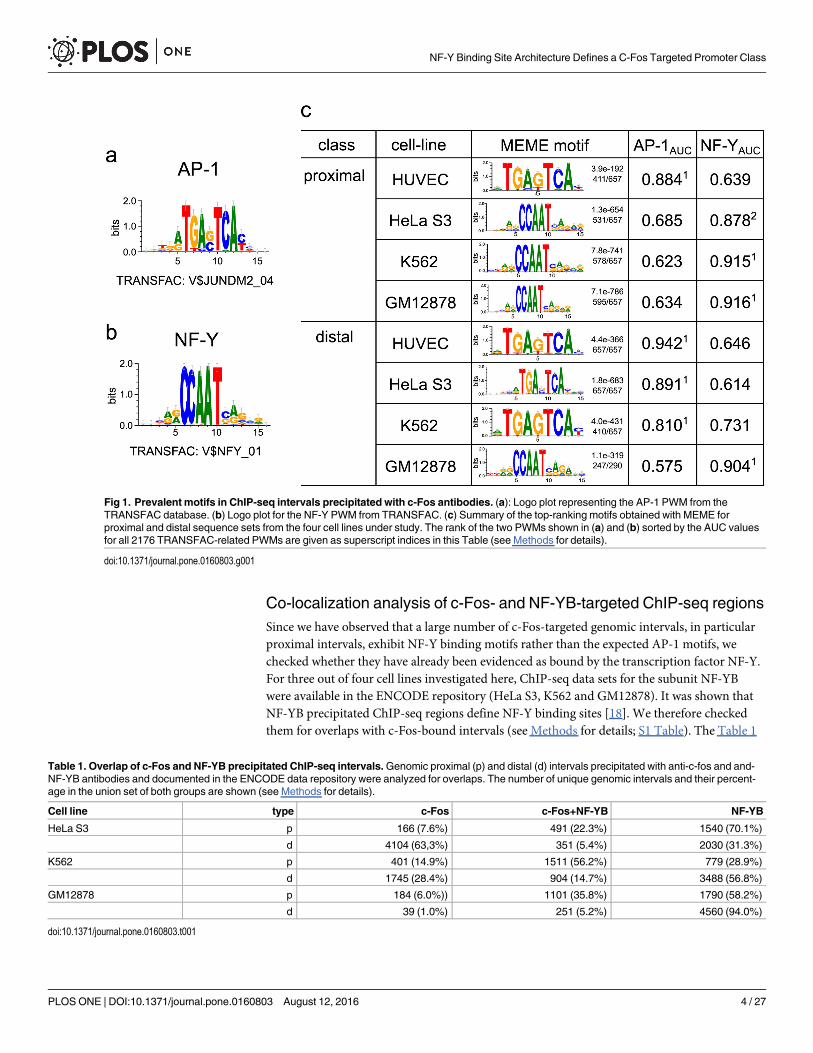
Many c-Fos-ChIP-seq data sets reveal CCAAT-motif rather than an AP-1 consensus as dominant motifWe launched a systematic analysis of c-Fos ChIP-seq data that are available in the ENCODErepository [10], using the PWM library of the TRANSFAC database [20]. When we started thisstudy, corresponding data were available for four different cell lines: HUVEC, HeLa S3, K562,and GM12878. Since it is also known that enhancer and promoter regions may behave differ-ently, we analyzed separately the ChIP-seq intervals that are located distally or proximally toannotated transcription start sites (TSS) in each cell line (see Methods for details). The analysiswas done (a) by recording Receiver Operating Characteristic (ROC) curves with TRANSFACmatrices in order to identify the best classifier compared to non-overlapping cell-type specificDHS regions for each sequence set or (b) by applying the MEME program to identify de novothe most prevalent sequence motif in each ChIP-seq data set (see Methods for details). TheFig 1 summarizes our findings. We found that besides the AP-1 motif, which was expectedlyindicative for some of the data sets, a couple of cell line specific ChIP-seq regions were charac-terized by position weight matrices (PWMs) for the transcription factor NF-Y, which binds toCCAAT boxes [21]. For the ROC curves obtained with two representative matrices for thesetwo TFs, we measured the Area Under the Curve (AUC) values (see Methods and S1 and S2Figs for details). The MEME analysis confirmed our ROC/AUC results. The top enriched motiffor each sequence set is shown in Fig 1 (see Methods for details and S3–S6 Figs).
The ROC curves and the corresponding MEME analysis proved that (a) proximal and distalregions differ in their prevalence of either AP-1 or NF-Y binding motifs, and (b) this feature isalso different among the four cell lines. In human umbilical vein endothelial cells (HUVEC),both proximal and distal c-Fos-bound regions are enriched for potential AP-1 sites. Both typesof ChIP-seq intervals (distal and proximal) from GM12878 (a human lymphoblastoid cell line)harbor CCAAT boxes as the most characteristic trait (see also S2 and S6 Figs). The low perfor-mance of this motif in discriminating either data set against the background sequences is dem-onstrated by the small AUC values (distal: 0.634, proximal: 0.575, see Fig 1 and S1 and S2 Figsfor details). It should be noticed, however, that the total number of c-Fos bound distal regionsin GM12878 is very small (Table 1, S1 Table). More complex are the situations in the case ofHeLa S3 and K562 cells. While the distal intervals revealed recognizable AP-1 motifs, the prox-imal regions showed a clear preponderance of potential NF-Y binding sites, i.e. CCAAT boxes(S1 and S2 Figs). The less pronounced motif, AP-1 in proximal and CCAAT boxes in distalregions, are close to the background noise and do not even show up among the top 5 motifsdetected by MEME (S4 and S5 Figs).
NF-Y Binding Site Architecture Defines a C-Fos Targeted Promoter Class
PLOS ONE | DOI:10.1371/journal.pone.0160803 August 12, 2016 3 / 27
Co-localization analysis of c-Fos- and NF-YB-targeted ChIP-seq regionsSince we have observed that a large number of c-Fos-targeted genomic intervals, in particularproximal intervals, exhibit NF-Y binding motifs rather than the expected AP-1 motifs, wechecked whether they have already been evidenced as bound by the transcription factor NF-Y.For three out of four cell lines investigated here, ChIP-seq data sets for the subunit NF-YBwere available in the ENCODE repository (HeLa S3, K562 and GM12878). It was shown thatNF-YB precipitated ChIP-seq regions define NF-Y binding sites [18]. We therefore checkedthem for overlaps with c-Fos-bound intervals (see Methods for details; S1 Table). The Table 1
Fig 1. Prevalent motifs in ChIP-seq intervals precipitated with c-Fos antibodies. (a): Logo plot representing the AP-1 PWM from theTRANSFAC database. (b) Logo plot for the NF-Y PWM from TRANSFAC. (c) Summary of the top-ranking motifs obtained with MEME forproximal and distal sequence sets from the four cell lines under study. The rank of the two PWMs shown in (a) and (b) sorted by the AUC valuesfor all 2176 TRANSFAC-related PWMs are given as superscript indices in this Table (see Methods for details).
doi:10.1371/journal.pone.0160803.g001
Table 1. Overlap of c-Fos and NF-YB precipitated ChIP-seq intervals.Genomic proximal (p) and distal (d) intervals precipitated with anti-c-fos and and-NF-YB antibodies and documented in the ENCODE data repository were analyzed for overlaps. The number of unique genomic intervals and their percent-age in the union set of both groups are shown (see Methods for details).
Cell line type c-Fos c-Fos+NF-YB NF-YB
HeLa S3 p 166 (7.6%) 491 (22.3%) 1540 (70.1%)
d 4104 (63,3%) 351 (5.4%) 2030 (31.3%)
K562 p 401 (14.9%) 1511 (56.2%) 779 (28.9%)
d 1745 (28.4%) 904 (14.7%) 3488 (56.8%)
GM12878 p 184 (6.0%)) 1101 (35.8%) 1790 (58.2%)
d 39 (1.0%) 251 (5.2%) 4560 (94.0%)
doi:10.1371/journal.pone.0160803.t001
NF-Y Binding Site Architecture Defines a C-Fos Targeted Promoter Class
PLOS ONE | DOI:10.1371/journal.pone.0160803 August 12, 2016 4 / 27
summarizes the cell-type specific co-localization patterns of these two TFs separately for proxi-mal (p) and distal (d) genomic intervals.
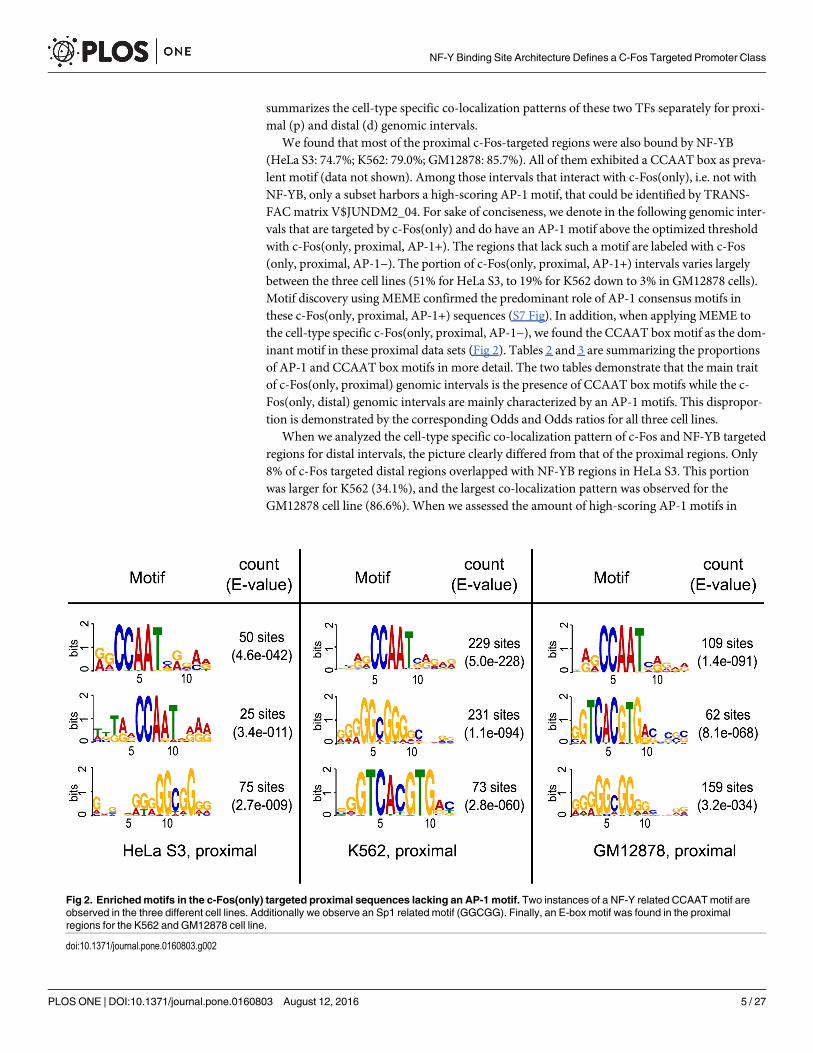
We found that most of the proximal c-Fos-targeted regions were also bound by NF-YB(HeLa S3: 74.7%; K562: 79.0%; GM12878: 85.7%). All of them exhibited a CCAAT box as preva-lent motif (data not shown). Among those intervals that interact with c-Fos(only), i.e. not withNF-YB, only a subset harbors a high-scoring AP-1 motif, that could be identified by TRANS-FACmatrix V$JUNDM2_04. For sake of conciseness, we denote in the following genomic inter-vals that are targeted by c-Fos(only) and do have an AP-1 motif above the optimized thresholdwith c-Fos(only, proximal, AP-1+). The regions that lack such a motif are labeled with c-Fos(only, proximal, AP-1−). The portion of c-Fos(only, proximal, AP-1+) intervals varies largelybetween the three cell lines (51% for HeLa S3, to 19% for K562 down to 3% in GM12878 cells).Motif discovery using MEME confirmed the predominant role of AP-1 consensus motifs inthese c-Fos(only, proximal, AP-1+) sequences (S7 Fig). In addition, when applying MEME tothe cell-type specific c-Fos(only, proximal, AP-1−), we found the CCAAT box motif as the dom-inant motif in these proximal data sets (Fig 2). Tables 2 and 3 are summarizing the proportionsof AP-1 and CCAAT box motifs in more detail. The two tables demonstrate that the main traitof c-Fos(only, proximal) genomic intervals is the presence of CCAAT box motifs while the c-Fos(only, distal) genomic intervals are mainly characterized by an AP-1 motifs. This dispropor-tion is demonstrated by the corresponding Odds and Odds ratios for all three cell lines.
When we analyzed the cell-type specific co-localization pattern of c-Fos and NF-YB targetedregions for distal intervals, the picture clearly differed from that of the proximal regions. Only8% of c-Fos targeted distal regions overlapped with NF-YB regions in HeLa S3. This portionwas larger for K562 (34.1%), and the largest co-localization pattern was observed for theGM12878 cell line (86.6%). When we assessed the amount of high-scoring AP-1 motifs in
Fig 2. Enrichedmotifs in the c-Fos(only) targeted proximal sequences lacking an AP-1 motif. Two instances of a NF-Y related CCAATmotif areobserved in the three different cell lines. Additionally we observe an Sp1 related motif (GGCGG). Finally, an E-box motif was found in the proximalregions for the K562 and GM12878 cell line.
doi:10.1371/journal.pone.0160803.g002
NF-Y Binding Site Architecture Defines a C-Fos Targeted Promoter Class
PLOS ONE | DOI:10.1371/journal.pone.0160803 August 12, 2016 5 / 27
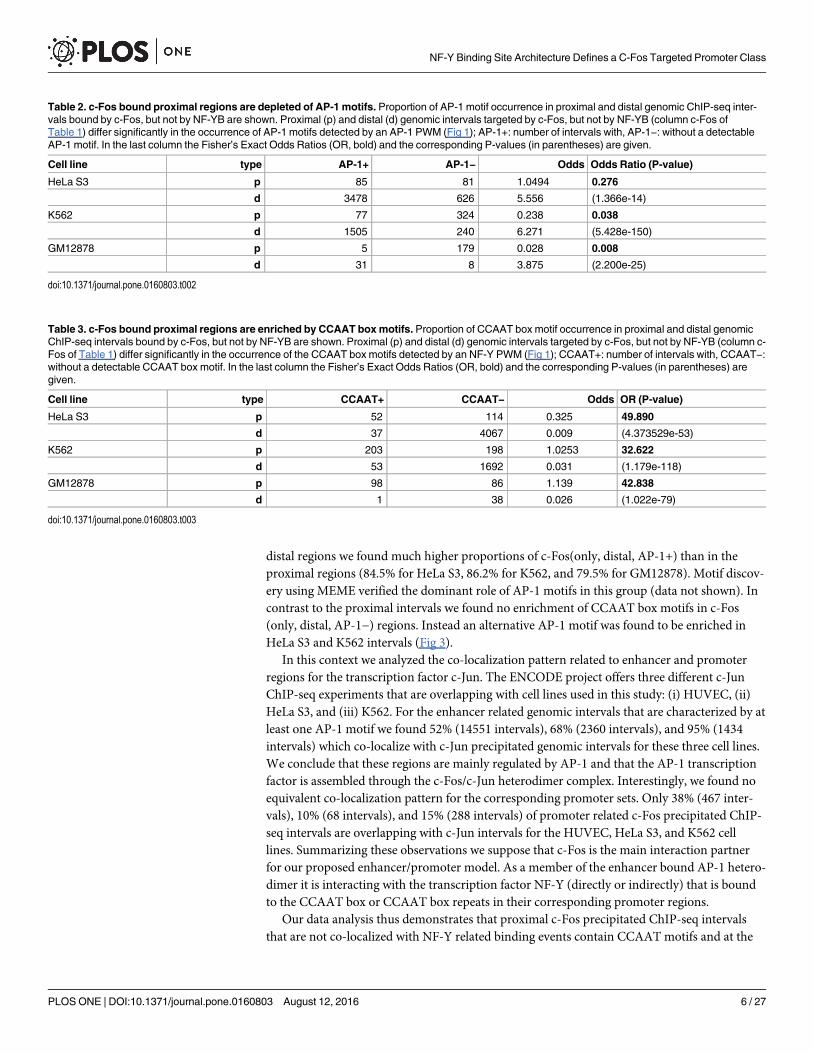
distal regions we found much higher proportions of c-Fos(only, distal, AP-1+) than in theproximal regions (84.5% for HeLa S3, 86.2% for K562, and 79.5% for GM12878). Motif discov-ery using MEME verified the dominant role of AP-1 motifs in this group (data not shown). Incontrast to the proximal intervals we found no enrichment of CCAAT box motifs in c-Fos(only, distal, AP-1−) regions. Instead an alternative AP-1 motif was found to be enriched inHeLa S3 and K562 intervals (Fig 3).
In this context we analyzed the co-localization pattern related to enhancer and promoterregions for the transcription factor c-Jun. The ENCODE project offers three different c-JunChIP-seq experiments that are overlapping with cell lines used in this study: (i) HUVEC, (ii)HeLa S3, and (iii) K562. For the enhancer related genomic intervals that are characterized by atleast one AP-1 motif we found 52% (14551 intervals), 68% (2360 intervals), and 95% (1434intervals) which co-localize with c-Jun precipitated genomic intervals for these three cell lines.We conclude that these regions are mainly regulated by AP-1 and that the AP-1 transcriptionfactor is assembled through the c-Fos/c-Jun heterodimer complex. Interestingly, we found noequivalent co-localization pattern for the corresponding promoter sets. Only 38% (467 inter-vals), 10% (68 intervals), and 15% (288 intervals) of promoter related c-Fos precipitated ChIP-seq intervals are overlapping with c-Jun intervals for the HUVEC, HeLa S3, and K562 celllines. Summarizing these observations we suppose that c-Fos is the main interaction partnerfor our proposed enhancer/promoter model. As a member of the enhancer bound AP-1 hetero-dimer it is interacting with the transcription factor NF-Y (directly or indirectly) that is boundto the CCAAT box or CCAAT box repeats in their corresponding promoter regions.
Our data analysis thus demonstrates that proximal c-Fos precipitated ChIP-seq intervalsthat are not co-localized with NF-Y related binding events contain CCAAT motifs and at the
Table 2. c-Fos bound proximal regions are depleted of AP-1 motifs. Proportion of AP-1 motif occurrence in proximal and distal genomic ChIP-seq inter-vals bound by c-Fos, but not by NF-YB are shown. Proximal (p) and distal (d) genomic intervals targeted by c-Fos, but not by NF-YB (column c-Fos ofTable 1) differ significantly in the occurrence of AP-1 motifs detected by an AP-1 PWM (Fig 1); AP-1+: number of intervals with, AP-1−: without a detectableAP-1 motif. In the last column the Fisher’s Exact Odds Ratios (OR, bold) and the corresponding P-values (in parentheses) are given.
Cell line type AP-1+ AP-1− Odds Odds Ratio (P-value)
HeLa S3 p 85 81 1.0494 0.276
d 3478 626 5.556 (1.366e-14)
K562 p 77 324 0.238 0.038
d 1505 240 6.271 (5.428e-150)
GM12878 p 5 179 0.028 0.008
d 31 8 3.875 (2.200e-25)
doi:10.1371/journal.pone.0160803.t002
Table 3. c-Fos bound proximal regions are enriched by CCAAT boxmotifs. Proportion of CCAAT box motif occurrence in proximal and distal genomicChIP-seq intervals bound by c-Fos, but not by NF-YB are shown. Proximal (p) and distal (d) genomic intervals targeted by c-Fos, but not by NF-YB (column c-Fos of Table 1) differ significantly in the occurrence of the CCAAT box motifs detected by an NF-Y PWM (Fig 1); CCAAT+: number of intervals with, CCAAT−:without a detectable CCAAT box motif. In the last column the Fisher’s Exact Odds Ratios (OR, bold) and the corresponding P-values (in parentheses) aregiven.
Cell line type CCAAT+ CCAAT− Odds OR (P-value)
HeLa S3 p 52 114 0.325 49.890
d 37 4067 0.009 (4.373529e-53)
K562 p 203 198 1.0253 32.622
d 53 1692 0.031 (1.179e-118)
GM12878 p 98 86 1.139 42.838
d 1 38 0.026 (1.022e-79)
doi:10.1371/journal.pone.0160803.t003
NF-Y Binding Site Architecture Defines a C-Fos Targeted Promoter Class
PLOS ONE | DOI:10.1371/journal.pone.0160803 August 12, 2016 6 / 27
same time were lacking AP-1 motifs. This observation was found in all three cell-types forproximal ChIP-seq intervals.
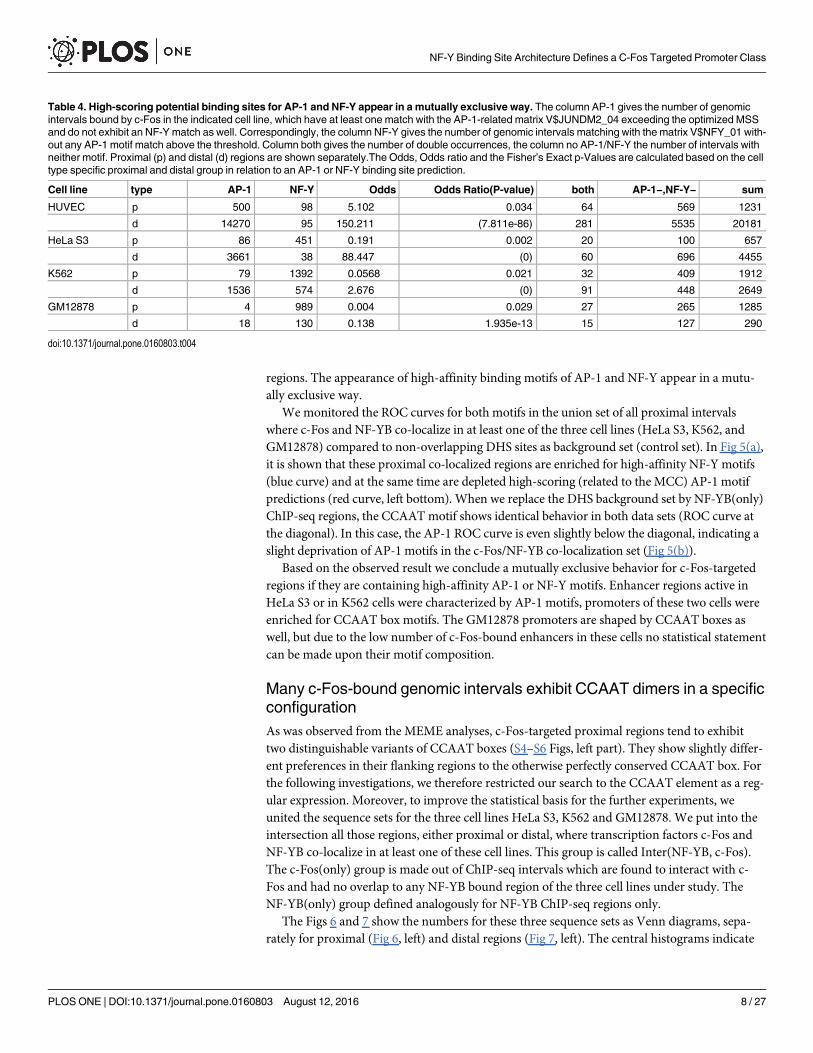
CCAAT and AP-1 motifs are mutually exclusive in c-Fos-targetedregionsTo get a more robust criterion for the co-occurrence probability of these two regulatory ele-ments, we checked the appearance of high-scoring potential AP-1 and NF-Y binding sites inthe proximal and distal regions bound by c-Fos in either of the four cell lines. We recorded thepresence of AP-1 or NF-Y binding motifs using TRANSFAC/Match [20, 22] and applying athreshold that was optimized with regard to Matthews Correlation Coefficient (MCC) (seeMethods and S1 and S2 Figs, bottom insets).
As can be seen in Table 4, by far most of the c-Fos-targeted regions in HUVEC cells onlypossess an AP-1 motif, and very few exhibit an NF-Y binding motif. The opposite is true forthe GM12878 cell line: It has very few c-Fos-bound distal regions (290 compared with morethan 20,000 in HUVEC cells), and is practically lacking AP-1 motifs in either type of regions. Itis also noticeable that considerable portions of the c-Fos-targeted regions exhibit neither ahigh-scoring AP-1 nor NF-Y binding motif (between 15.2% in HeLa S3 proximal regions and46.2% in HUVEC proximal regions). These intervals will be investigated in a separate study.
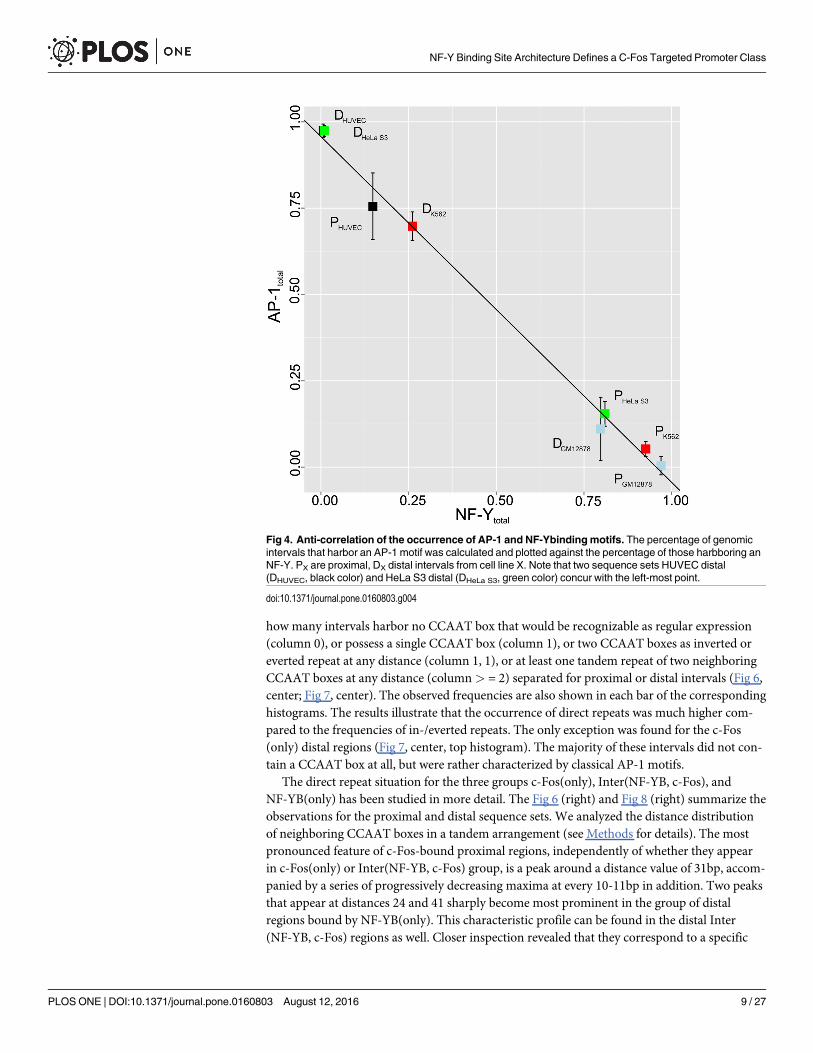
Focusing on those c-Fos-bound ChIP-seq interval sets that exhibit either motif, we observedin the sequence sets shown in Table 4 that the higher the percentage of AP-1 motif occurrenceis, the lower is that of the NF-Y binding motifs and vice versa. Plotting these values againsteach other for all eight sequence sets, we found a strict linear anti-correlation (R = −0.9571;Fig 4). This plot shows a big gap between putative AP-1 and NF-Y regulated c-Fos ChIP-seq
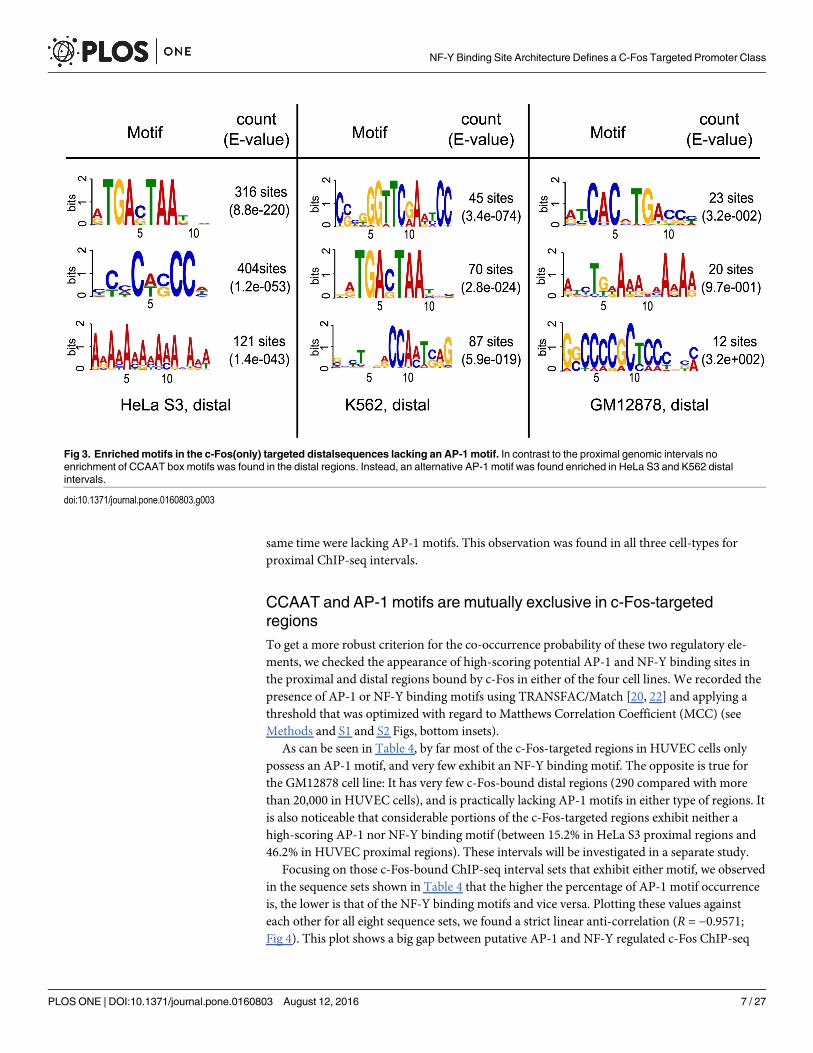
Fig 3. Enrichedmotifs in the c-Fos(only) targeted distalsequences lacking an AP-1 motif. In contrast to the proximal genomic intervals noenrichment of CCAAT box motifs was found in the distal regions. Instead, an alternative AP-1 motif was found enriched in HeLa S3 and K562 distalintervals.
doi:10.1371/journal.pone.0160803.g003
NF-Y Binding Site Architecture Defines a C-Fos Targeted Promoter Class
PLOS ONE | DOI:10.1371/journal.pone.0160803 August 12, 2016 7 / 27
regions. The appearance of high-affinity binding motifs of AP-1 and NF-Y appear in a mutu-ally exclusive way.
We monitored the ROC curves for both motifs in the union set of all proximal intervalswhere c-Fos and NF-YB co-localize in at least one of the three cell lines (HeLa S3, K562, andGM12878) compared to non-overlapping DHS sites as background set (control set). In Fig 5(a),it is shown that these proximal co-localized regions are enriched for high-affinity NF-Y motifs(blue curve) and at the same time are depleted high-scoring (related to the MCC) AP-1 motifpredictions (red curve, left bottom). When we replace the DHS background set by NF-YB(only)ChIP-seq regions, the CCAAT motif shows identical behavior in both data sets (ROC curve atthe diagonal). In this case, the AP-1 ROC curve is even slightly below the diagonal, indicating aslight deprivation of AP-1 motifs in the c-Fos/NF-YB co-localization set (Fig 5(b)).
Based on the observed result we conclude a mutually exclusive behavior for c-Fos-targetedregions if they are containing high-affinity AP-1 or NF-Y motifs. Enhancer regions active inHeLa S3 or in K562 cells were characterized by AP-1 motifs, promoters of these two cells wereenriched for CCAAT box motifs. The GM12878 promoters are shaped by CCAAT boxes aswell, but due to the low number of c-Fos-bound enhancers in these cells no statistical statementcan be made upon their motif composition.
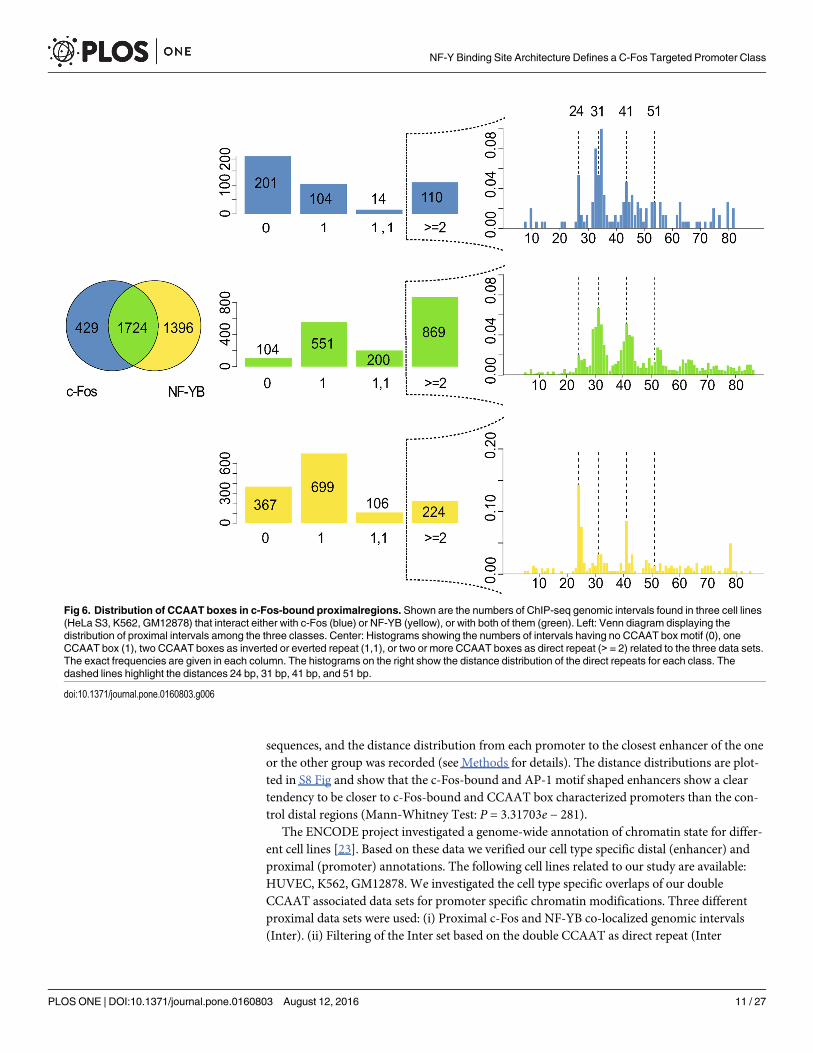
Many c-Fos-bound genomic intervals exhibit CCAAT dimers in a specificconfigurationAs was observed from the MEME analyses, c-Fos-targeted proximal regions tend to exhibittwo distinguishable variants of CCAAT boxes (S4–S6 Figs, left part). They show slightly differ-ent preferences in their flanking regions to the otherwise perfectly conserved CCAAT box. Forthe following investigations, we therefore restricted our search to the CCAAT element as a reg-ular expression. Moreover, to improve the statistical basis for the further experiments, weunited the sequence sets for the three cell lines HeLa S3, K562 and GM12878. We put into theintersection all those regions, either proximal or distal, where transcription factors c-Fos andNF-YB co-localize in at least one of these cell lines. This group is called Inter(NF-YB, c-Fos).The c-Fos(only) group is made out of ChIP-seq intervals which are found to interact with c-Fos and had no overlap to any NF-YB bound region of the three cell lines under study. TheNF-YB(only) group defined analogously for NF-YB ChIP-seq regions only.
The Figs 6 and 7 show the numbers for these three sequence sets as Venn diagrams, sepa-rately for proximal (Fig 6, left) and distal regions (Fig 7, left). The central histograms indicate
Table 4. High-scoring potential binding sites for AP-1 and NF-Y appear in a mutually exclusive way. The column AP-1 gives the number of genomicintervals bound by c-Fos in the indicated cell line, which have at least one match with the AP-1-related matrix V$JUNDM2_04 exceeding the optimized MSSand do not exhibit an NF-Ymatch as well. Correspondingly, the column NF-Y gives the number of genomic intervals matching with the matrix V$NFY_01 with-out any AP-1 motif match above the threshold. Column both gives the number of double occurrences, the column no AP-1/NF-Y the number of intervals withneither motif. Proximal (p) and distal (d) regions are shown separately.The Odds, Odds ratio and the Fisher’s Exact p-Values are calculated based on the celltype specific proximal and distal group in relation to an AP-1 or NF-Y binding site prediction.
Cell line type AP-1 NF-Y Odds Odds Ratio(P-value) both AP-1−,NF-Y− sum
HUVEC p 500 98 5.102 0.034 64 569 1231
d 14270 95 150.211 (7.811e-86) 281 5535 20181
HeLa S3 p 86 451 0.191 0.002 20 100 657
d 3661 38 88.447 (0) 60 696 4455
K562 p 79 1392 0.0568 0.021 32 409 1912
d 1536 574 2.676 (0) 91 448 2649
GM12878 p 4 989 0.004 0.029 27 265 1285
d 18 130 0.138 1.935e-13 15 127 290
doi:10.1371/journal.pone.0160803.t004
NF-Y Binding Site Architecture Defines a C-Fos Targeted Promoter Class
PLOS ONE | DOI:10.1371/journal.pone.0160803 August 12, 2016 8 / 27
how many intervals harbor no CCAAT box that would be recognizable as regular expression(column 0), or possess a single CCAAT box (column 1), or two CCAAT boxes as inverted oreverted repeat at any distance (column 1, 1), or at least one tandem repeat of two neighboringCCAAT boxes at any distance (column> = 2) separated for proximal or distal intervals (Fig 6,center; Fig 7, center). The observed frequencies are also shown in each bar of the correspondinghistograms. The results illustrate that the occurrence of direct repeats was much higher com-pared to the frequencies of in-/everted repeats. The only exception was found for the c-Fos(only) distal regions (Fig 7, center, top histogram). The majority of these intervals did not con-tain a CCAAT box at all, but were rather characterized by classical AP-1 motifs.
The direct repeat situation for the three groups c-Fos(only), Inter(NF-YB, c-Fos), andNF-YB(only) has been studied in more detail. The Fig 6 (right) and Fig 8 (right) summarize theobservations for the proximal and distal sequence sets. We analyzed the distance distributionof neighboring CCAAT boxes in a tandem arrangement (see Methods for details). The mostpronounced feature of c-Fos-bound proximal regions, independently of whether they appearin c-Fos(only) or Inter(NF-YB, c-Fos) group, is a peak around a distance value of 31bp, accom-panied by a series of progressively decreasing maxima at every 10-11bp in addition. Two peaksthat appear at distances 24 and 41 sharply become most prominent in the group of distalregions bound by NF-YB(only). This characteristic profile can be found in the distal Inter(NF-YB, c-Fos) regions as well. Closer inspection revealed that they correspond to a specific
Fig 4. Anti-correlation of the occurrence of AP-1 and NF-Ybindingmotifs. The percentage of genomicintervals that harbor an AP-1 motif was calculated and plotted against the percentage of those harbboring anNF-Y. PX are proximal, DX distal intervals from cell line X. Note that two sequence sets HUVEC distal(DHUVEC, black color) and HeLa S3 distal (DHeLa S3, green color) concur with the left-most point.
doi:10.1371/journal.pone.0160803.g004
NF-Y Binding Site Architecture Defines a C-Fos Targeted Promoter Class
PLOS ONE | DOI:10.1371/journal.pone.0160803 August 12, 2016 9 / 27

repetitive element class, the so-called Long Terminal Repeats (LTR), in particular the LTR12family. Their appearance among the c-Fos-bound proximal regions may be considered as “con-tamination” of this promoter class by these LTR sequences, which are known to interact withthe transcription factor NF-Y [18].
We conclude that c-Fos-targeted promoters that do not exhibit an AP-1 motif but are char-acterized by direct CCAAT box repeats, preferable at a distance of 31bp, define a novelsequence-specific regulatory module bound by the transcription factor NF-Y.
AP-1 positive enhancers tend to be close to c-Fos-targeted promotersIt has been discussed earlier, that enhancer-bound proteins may be cross-linked by the ChIPprocedure also to promoters targeted by these enhancers [12]. We therefore decided to investi-gate whether c-Fos-bound enhancer, characterized by AP-1 motifs, relate to c-Fos and NF-YBbound promoters with a CCAAT direct repeat. For this, we analyzed the distal and proximaldata for putative enhancer/promoter distance distribution. As potential promoters we took the1724 proximal regions which are targeted by c-Fos as well as by NF-YB (Fig 6, Venn diagram).Two groups of putative enhancers were defined as follows: As the first enhancer set we used c-Fos-targeted distal intervals that exhibit no CCAAT motif, but were found to be highlyenriched in high-scoring AP-1 motifs (in total 3571 segments, see Fig 7). The second enhancerset (control) was defined by NF-YB targeted ChIP-seq intervals with at least two CCAATmotifs in a direct tandem arrangement, which are mostly LTR elements (in total 3186 seg-ments, see Fig 7). Either group was sampled 1000 times into equal-sized subgroups of 1500
Fig 5. ROC curves for AP-1 and NF-Y bindingmotifs forco-localized c-Fos and NF-YB intervals. The ROC curves were monitored usingTRANSFACmatrix V$JUNDM2_04 for the AP-1 motif (red) and V$NFY_01 for the NF-Y binding motif (blue).
doi:10.1371/journal.pone.0160803.g005
NF-Y Binding Site Architecture Defines a C-Fos Targeted Promoter Class
PLOS ONE | DOI:10.1371/journal.pone.0160803 August 12, 2016 10 / 27
sequences, and the distance distribution from each promoter to the closest enhancer of the oneor the other group was recorded (see Methods for details). The distance distributions are plot-ted in S8 Fig and show that the c-Fos-bound and AP-1 motif shaped enhancers show a cleartendency to be closer to c-Fos-bound and CCAAT box characterized promoters than the con-trol distal regions (Mann-Whitney Test: P = 3.31703e − 281).
The ENCODE project investigated a genome-wide annotation of chromatin state for differ-ent cell lines [23]. Based on these data we verified our cell type specific distal (enhancer) andproximal (promoter) annotations. The following cell lines related to our study are available:HUVEC, K562, GM12878. We investigated the cell type specific overlaps of our doubleCCAAT associated data sets for promoter specific chromatin modifications. Three differentproximal data sets were used: (i) Proximal c-Fos and NF-YB co-localized genomic intervals(Inter). (ii) Filtering of the Inter set based on the double CCAAT as direct repeat (Inter
Fig 6. Distribution of CCAAT boxes in c-Fos-bound proximalregions. Shown are the numbers of ChIP-seq genomic intervals found in three cell lines(HeLa S3, K562, GM12878) that interact either with c-Fos (blue) or NF-YB (yellow), or with both of them (green). Left: Venn diagram displaying thedistribution of proximal intervals among the three classes. Center: Histograms showing the numbers of intervals having no CCAAT box motif (0), oneCCAAT box (1), two CCAAT boxes as inverted or everted repeat (1,1), or two or more CCAAT boxes as direct repeat (> = 2) related to the three data sets.The exact frequencies are given in each column. The histograms on the right show the distance distribution of the direct repeats for each class. Thedashed lines highlight the distances 24 bp, 31 bp, 41 bp, and 51 bp.
doi:10.1371/journal.pone.0160803.g006
NF-Y Binding Site Architecture Defines a C-Fos Targeted Promoter Class
PLOS ONE | DOI:10.1371/journal.pone.0160803 August 12, 2016 11 / 27

(CCAAT2+)). (iii) Co-localization of the Inter(CCAAT2+) group with p300 interactingregions. The Table 5 is summarizing the results.
For all three data sets (i-iii) we observe a large overlap (89–93%) to chromatin modificationsthat are observed for active promoter regions. This result verifies our proximal data sets as pro-moter regions and support the relevance of the double CCAAT box as a main feature in thisdata sets.
To verify our distal genomic intervals as potential enhancers we determine the overlap ofthe distal genomic intervals to chromatin modifications related to active enhancers. TheTable 6 is summarizing this situation.
AP-1 motifs that are characterizing distal genomic intervals show a large overlap with activeenhancer regions defined by the ChromHMM data sets.
Two-thirds of all enhancer/promoter interactions in the GM12878 cell line are directed tothe nearest active promoter [24]. Based on our results and the aforementioned statement wepropose a new functional coupling between AP-1 bound enhancer regions and their corre-sponding proximal regions shaped by these NF-Y bound CCAAT dimers.
Fig 7. Distribution of CCAAT boxes in c-Fos-bound distalregions. Shown are the numbers of ChIP-seq intervals found in three cell lines (HeLa S3,K562, GM12878) that interact with c-Fos (blue) or NF-YB (yellow), or with both of them (green). Left: Venn diagram displaying the distribution of proximalintervals among the three classes. Center: Histograms showing the numbers of intervals having no CCAAT box motif (0), one CCAAT box (1), twoCCAAT boxes as inverted or everted repeat (1,1), or two or more CCAAT boxes as direct repeat (> = 2). The histograms on the right show the distancedistribution of the direct repeats for each class. The dashed lines highlight the distances 24bp, 31bp, 41bp, and 51 bp.
doi:10.1371/journal.pone.0160803.g007
NF-Y Binding Site Architecture Defines a C-Fos Targeted Promoter Class
PLOS ONE | DOI:10.1371/journal.pone.0160803 August 12, 2016 12 / 27
c-Fos-targeted regulatory regions also interact with co-activator p300Both transcription factors c-Fos as well as NF-Y are known to interact with the co-activatorp300 by binding either to the C-terminal or a central region of the p300 molecule, respectively[25, 26]. Since most of the c-Fos-targeted promoters studied here are bound by NF-Y viaCCAAT boxes, it was tempting to hypothesize that binding of c-Fos to these promoters mightbe mediated by p300. Indeed, we observed a strong co-localization pattern of c-Fos ChIP-seqregions with genomic intervals bound by the co-activator p300. 87% of all distal c-Fos-targetedregions are bound by p300 (Table 7). Only 65% of the proximal c-Fos-precipitated regions alsointeract with p300. However, when we split the proximal set in AP-1(+) and AP-1(−) subsetsdepending on the presence/absence of a high-scoring AP-1 motif, we noticed that the formeroverlapped to 83% with the p300 ChIP-seq set, while only 57% of the AP-1(−) intervals exhib-ited a detectable p300 overlap. It is interesting to note that the two AP-1(+) data sets, c-Fos
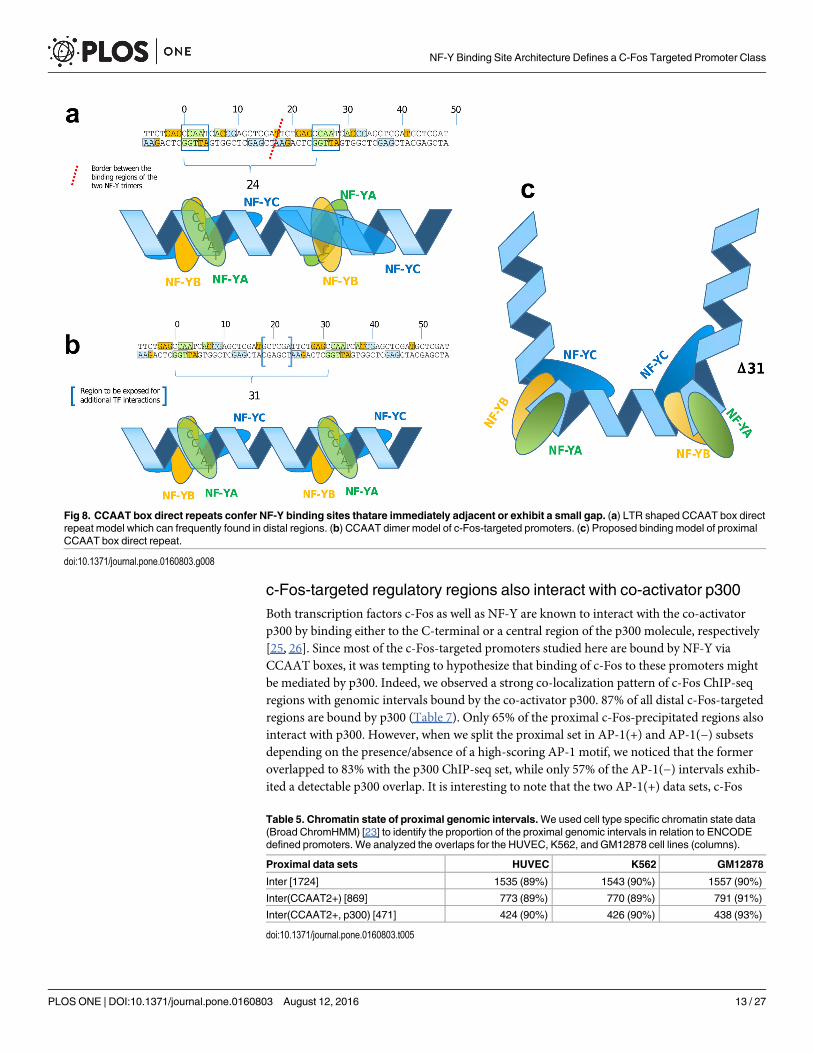
Fig 8. CCAAT box direct repeats confer NF-Y binding sites thatare immediately adjacent or exhibit a small gap. (a) LTR shaped CCAAT box directrepeat model which can frequently found in distal regions. (b) CCAAT dimer model of c-Fos-targeted promoters. (c) Proposed binding model of proximalCCAAT box direct repeat.
doi:10.1371/journal.pone.0160803.g008
Table 5. Chromatin state of proximal genomic intervals.We used cell type specific chromatin state data(Broad ChromHMM) [23] to identify the proportion of the proximal genomic intervals in relation to ENCODEdefined promoters. We analyzed the overlaps for the HUVEC, K562, and GM12878 cell lines (columns).
Proximal data sets HUVEC K562 GM12878
Inter [1724] 1535 (89%) 1543 (90%) 1557 (90%)
Inter(CCAAT2+) [869] 773 (89%) 770 (89%) 791 (91%)
Inter(CCAAT2+, p300) [471] 424 (90%) 426 (90%) 438 (93%)
doi:10.1371/journal.pone.0160803.t005
NF-Y Binding Site Architecture Defines a C-Fos Targeted Promoter Class
PLOS ONE | DOI:10.1371/journal.pone.0160803 August 12, 2016 13 / 27
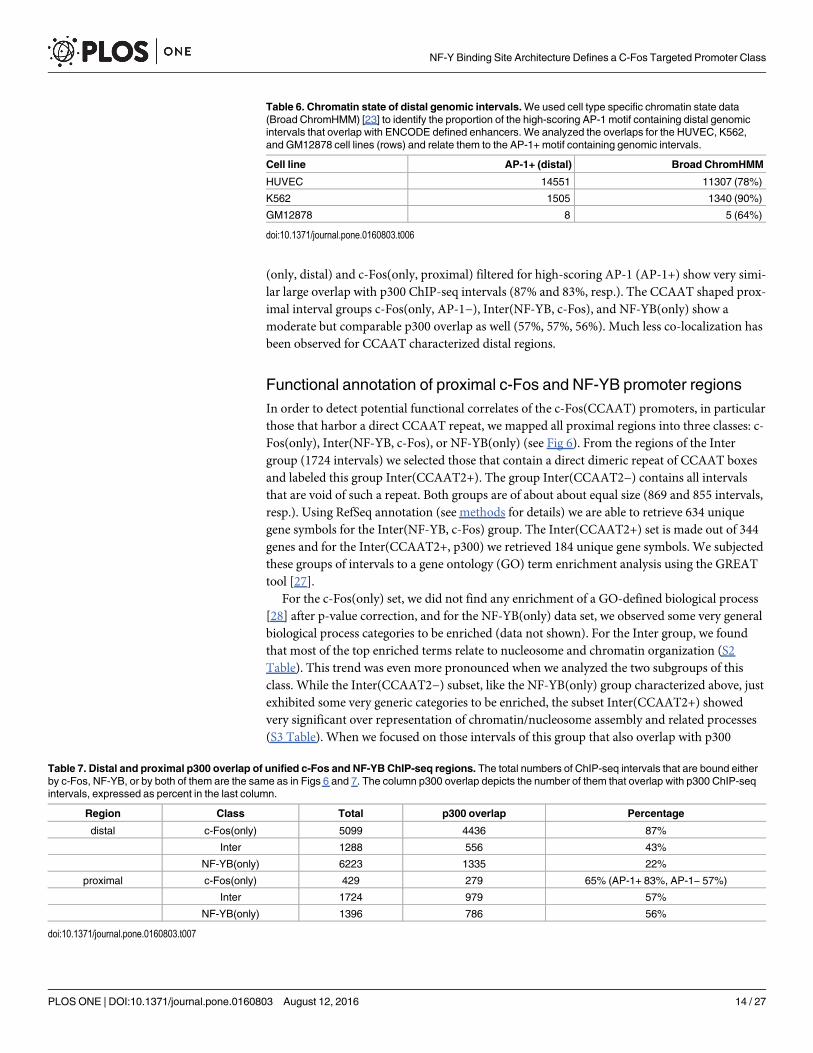
(only, distal) and c-Fos(only, proximal) filtered for high-scoring AP-1 (AP-1+) show very simi-lar large overlap with p300 ChIP-seq intervals (87% and 83%, resp.). The CCAAT shaped prox-imal interval groups c-Fos(only, AP-1−), Inter(NF-YB, c-Fos), and NF-YB(only) show amoderate but comparable p300 overlap as well (57%, 57%, 56%). Much less co-localization hasbeen observed for CCAAT characterized distal regions.
Functional annotation of proximal c-Fos and NF-YB promoter regionsIn order to detect potential functional correlates of the c-Fos(CCAAT) promoters, in particularthose that harbor a direct CCAAT repeat, we mapped all proximal regions into three classes: c-Fos(only), Inter(NF-YB, c-Fos), or NF-YB(only) (see Fig 6). From the regions of the Intergroup (1724 intervals) we selected those that contain a direct dimeric repeat of CCAAT boxesand labeled this group Inter(CCAAT2+). The group Inter(CCAAT2−) contains all intervalsthat are void of such a repeat. Both groups are of about about equal size (869 and 855 intervals,resp.). Using RefSeq annotation (see methods for details) we are able to retrieve 634 uniquegene symbols for the Inter(NF-YB, c-Fos) group. The Inter(CCAAT2+) set is made out of 344genes and for the Inter(CCAAT2+, p300) we retrieved 184 unique gene symbols. We subjectedthese groups of intervals to a gene ontology (GO) term enrichment analysis using the GREATtool [27].
For the c-Fos(only) set, we did not find any enrichment of a GO-defined biological process[28] after p-value correction, and for the NF-YB(only) data set, we observed some very generalbiological process categories to be enriched (data not shown). For the Inter group, we foundthat most of the top enriched terms relate to nucleosome and chromatin organization (S2Table). This trend was even more pronounced when we analyzed the two subgroups of thisclass. While the Inter(CCAAT2−) subset, like the NF-YB(only) group characterized above, justexhibited some very generic categories to be enriched, the subset Inter(CCAAT2+) showedvery significant over representation of chromatin/nucleosome assembly and related processes(S3 Table). When we focused on those intervals of this group that also overlap with p300
Table 6. Chromatin state of distal genomic intervals.We used cell type specific chromatin state data(Broad ChromHMM) [23] to identify the proportion of the high-scoring AP-1 motif containing distal genomicintervals that overlap with ENCODE defined enhancers. We analyzed the overlaps for the HUVEC, K562,and GM12878 cell lines (rows) and relate them to the AP-1+ motif containing genomic intervals.
Cell line AP-1+ (distal) Broad ChromHMM
HUVEC 14551 11307 (78%)
K562 1505 1340 (90%)
GM12878 8 5 (64%)
doi:10.1371/journal.pone.0160803.t006
Table 7. Distal and proximal p300 overlap of unified c-Fos and NF-YB ChIP-seq regions. The total numbers of ChIP-seq intervals that are bound eitherby c-Fos, NF-YB, or by both of them are the same as in Figs 6 and 7. The column p300 overlap depicts the number of them that overlap with p300 ChIP-seqintervals, expressed as percent in the last column.
Region Class Total p300 overlap Percentage
distal c-Fos(only) 5099 4436 87%
Inter 1288 556 43%
NF-YB(only) 6223 1335 22%
proximal c-Fos(only) 429 279 65% (AP-1+ 83%, AP-1− 57%)
Inter 1724 979 57%
NF-YB(only) 1396 786 56%
doi:10.1371/journal.pone.0160803.t007
NF-Y Binding Site Architecture Defines a C-Fos Targeted Promoter Class
PLOS ONE | DOI:10.1371/journal.pone.0160803 August 12, 2016 14 / 27
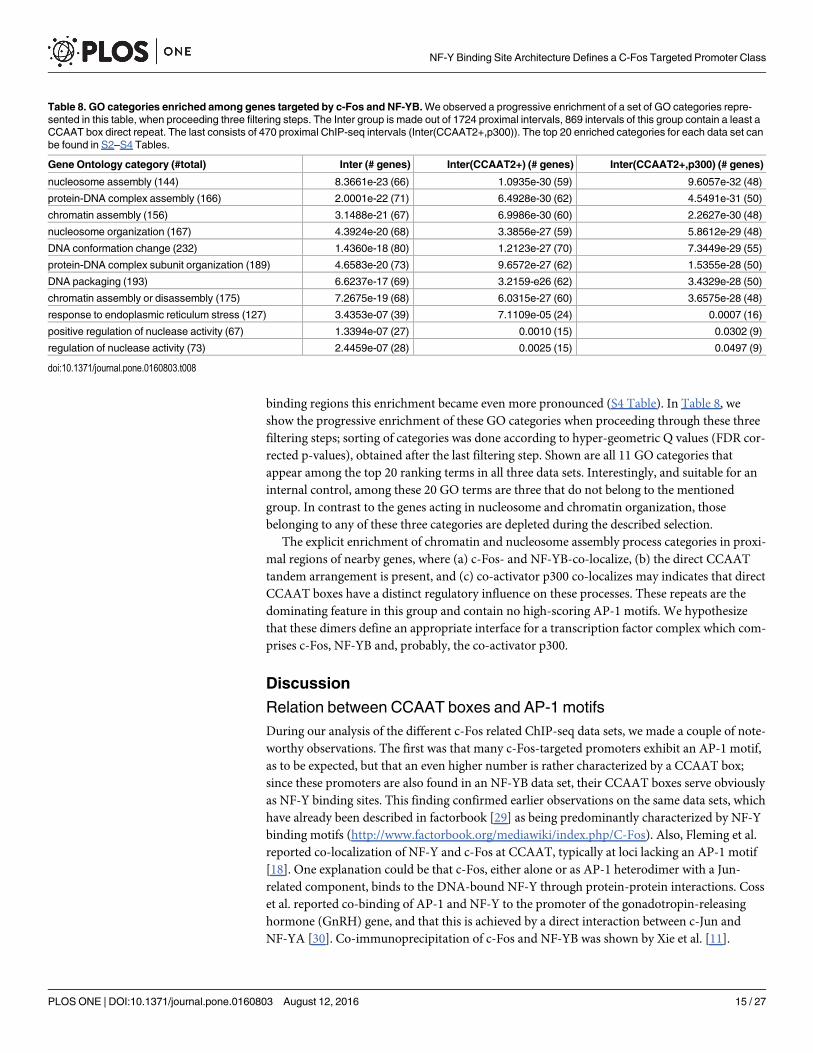
binding regions this enrichment became even more pronounced (S4 Table). In Table 8, weshow the progressive enrichment of these GO categories when proceeding through these threefiltering steps; sorting of categories was done according to hyper-geometric Q values (FDR cor-rected p-values), obtained after the last filtering step. Shown are all 11 GO categories thatappear among the top 20 ranking terms in all three data sets. Interestingly, and suitable for aninternal control, among these 20 GO terms are three that do not belong to the mentionedgroup. In contrast to the genes acting in nucleosome and chromatin organization, thosebelonging to any of these three categories are depleted during the described selection.
The explicit enrichment of chromatin and nucleosome assembly process categories in proxi-mal regions of nearby genes, where (a) c-Fos- and NF-YB-co-localize, (b) the direct CCAATtandem arrangement is present, and (c) co-activator p300 co-localizes may indicates that directCCAAT boxes have a distinct regulatory influence on these processes. These repeats are thedominating feature in this group and contain no high-scoring AP-1 motifs. We hypothesizethat these dimers define an appropriate interface for a transcription factor complex which com-prises c-Fos, NF-YB and, probably, the co-activator p300.
Discussion
Relation between CCAAT boxes and AP-1 motifsDuring our analysis of the different c-Fos related ChIP-seq data sets, we made a couple of note-worthy observations. The first was that many c-Fos-targeted promoters exhibit an AP-1 motif,as to be expected, but that an even higher number is rather characterized by a CCAAT box;since these promoters are also found in an NF-YB data set, their CCAAT boxes serve obviouslyas NF-Y binding sites. This finding confirmed earlier observations on the same data sets, whichhave already been described in factorbook [29] as being predominantly characterized by NF-Ybinding motifs (http://www.factorbook.org/mediawiki/index.php/C-Fos). Also, Fleming et al.reported co-localization of NF-Y and c-Fos at CCAAT, typically at loci lacking an AP-1 motif[18]. One explanation could be that c-Fos, either alone or as AP-1 heterodimer with a Jun-related component, binds to the DNA-bound NF-Y through protein-protein interactions. Cosset al. reported co-binding of AP-1 and NF-Y to the promoter of the gonadotropin-releasinghormone (GnRH) gene, and that this is achieved by a direct interaction between c-Jun andNF-YA [30]. Co-immunoprecipitation of c-Fos and NF-YB was shown by Xie et al. [11].
Table 8. GO categories enriched among genes targeted by c-Fos and NF-YB.We observed a progressive enrichment of a set of GO categories repre-sented in this table, when proceeding three filtering steps. The Inter group is made out of 1724 proximal intervals, 869 intervals of this group contain a least aCCAAT box direct repeat. The last consists of 470 proximal ChIP-seq intervals (Inter(CCAAT2+,p300)). The top 20 enriched categories for each data set canbe found in S2–S4 Tables.
Gene Ontology category (#total) Inter (# genes) Inter(CCAAT2+) (# genes) Inter(CCAAT2+,p300) (# genes)
nucleosome assembly (144) 8.3661e-23 (66) 1.0935e-30 (59) 9.6057e-32 (48)
protein-DNA complex assembly (166) 2.0001e-22 (71) 6.4928e-30 (62) 4.5491e-31 (50)
chromatin assembly (156) 3.1488e-21 (67) 6.9986e-30 (60) 2.2627e-30 (48)
nucleosome organization (167) 4.3924e-20 (68) 3.3856e-27 (59) 5.8612e-29 (48)
DNA conformation change (232) 1.4360e-18 (80) 1.2123e-27 (70) 7.3449e-29 (55)
protein-DNA complex subunit organization (189) 4.6583e-20 (73) 9.6572e-27 (62) 1.5355e-28 (50)
DNA packaging (193) 6.6237e-17 (69) 3.2159-e26 (62) 3.4329e-28 (50)
chromatin assembly or disassembly (175) 7.2675e-19 (68) 6.0315e-27 (60) 3.6575e-28 (48)
response to endoplasmic reticulum stress (127) 3.4353e-07 (39) 7.1109e-05 (24) 0.0007 (16)
positive regulation of nuclease activity (67) 1.3394e-07 (27) 0.0010 (15) 0.0302 (9)
regulation of nuclease activity (73) 2.4459e-07 (28) 0.0025 (15) 0.0497 (9)
doi:10.1371/journal.pone.0160803.t008
NF-Y Binding Site Architecture Defines a C-Fos Targeted Promoter Class
PLOS ONE | DOI:10.1371/journal.pone.0160803 August 12, 2016 15 / 27

However, such an interaction alone would not explain why some promoters containing aCCAAT-box are targeted by c-Fos but most are not, although all are bound by NF-Y, as evi-denced by NF-YB ChIP [18]. The reason for this differential activity must be encoded in thegenome. The most trivial case would be the existence of low-affinity, degenerate AP-1 motifs inthe environment of c-Fos(CCAAT) promoters. The presence of such AP-1 motifs has not beensupported by the ROC curves shown here, which in such a case should show a forced increasein the higher FPR range, nor have we been able to show enriched low-scoring AP-1 motifscompared with the NF-YB sequences that are not targeted by c-Fos (data not shown). AlsoFleming et al. [18] have not found AP-1 motifs in the neighborhood of c-Fos-targeted NF-Ybound regions, with the exception of LTRs (see below). This is explicitly also true for potentialAP-1 sites overlapping with the NF-Y consensus, which has some tendency to form an AP-1half-site motif (TGA or TCA) at its 3’-end (underlined): CCAAT(c/g)a. A particular instancewith a potential AP-1 half site 5’ to the CCAAT box was suggested as well [30]. However, ourstudies did not reveal any significant difference in the immediate flanks of the CCAAT boxeslocated in c-Fos-targeted or -non-targeted promoters. The same was true for other accompa-nying motifs. We consistently found the well-known Sp1 binding motif in the environment ofthe CCAAT boxes, but this also was to be observed independently of the c-Fos-targeting of therespective promoters. No accompanying motif was found that could be a candidate discrimina-tor between the two sets of CCAAT box promoters. The lack of recognizable AP-1 motifs in c-Fos(CCAAT) promoters is a clear evidence against a similar co-localization mechanismbetween NF-Y and AP-1 sites as it is known for NF-Y and Sp1 binding [31].
Moreover, our second observation was that CCAAT boxes and AP-1 motifs even appear ina mutually exclusive way. If a high-scoring AP-1 binding site is found in a c-Fos ChIP-seqregion, no NF-Y binding motif is detectable and vice versa by motif matching (TRANSFAC/MATCH) or motif discovery (MEME) approaches. We conclude that c-Fos-targeting of pro-moters that are characterized by CCAAT boxes even depends on the absence of a genuine AP-1 binding binding site in the same promoter. We suppose an interfering mechanism of such anAP-1 binding motif which prohibits formation of a proper enhanceosome.
Structural implications of the CCAAT box dimersWhile we could exclude the presence of obscure AP-1 motifs or other accompanying bindingsites to explain the c-Fos-targeting to c-Fos(CCAAT) promoters, we checked whether any par-ticular arrangement of the CCAAT boxes could provide an explanation. We were able to iden-tify recurring patterns of two tandem copies of CCAAT boxes specifically in the c-Fos-targetedpromoters, with a pronounced distance distribution profile. The main peak is at a distance of31 base pairs between the two CCAAT boxes, followed by decreasing maxima of around 41, 52and 63 bp. The difference of 10-11bp between these peaks indicates a conserved orientation ofthe two CCAAT boxes on the same side of the DNA double helix. It has been shown by struc-tural analysis of NF-Y/DNA co-crystals that the NF-Y heterotrimer induces a strong bendingof the DNA by about 80 degree between the second A and the T of the CCAAT box [32]. Sincethe distance between the two CCAAT boxes preferably is an integer multiple of one completeDNA turn, the two kinks point into the same direction resulting in a slightly diverging U-likestructure (Fig 8(c)). Shorter distances than three turns would not be feasible since subunitNF-YB contacts reach out to position +17 (starting with the first C of the upstream CCAATbox as position 0) and subunit NF-YC has contacts up to position -7. The minimum distancebetween two NF-Y binding sites is therefore 24 base pairs. This corresponds exactly to themost prominent peak found in the CCAAT dimer distance distribution in NF-YB-bound distalregions (Fig 8(a)), arising from repetitive elements of LTR-type 12, as we and others have
NF-Y Binding Site Architecture Defines a C-Fos Targeted Promoter Class
PLOS ONE | DOI:10.1371/journal.pone.0160803 August 12, 2016 16 / 27

found [18]. In these CCAAT dimers with distance 24bp, both NF-Y trimers bind immediatelyadjacent to each other, with the kinks two and a half turns apart causing a more S-like struc-ture. In contrast, the U-shaped NF-Y bound CCAAT dimer at distance 31 bp may expose ashort stretch of DNA between the two NF-Y binding areas, which may be targeted by otherTFs (Fig 8(b)).
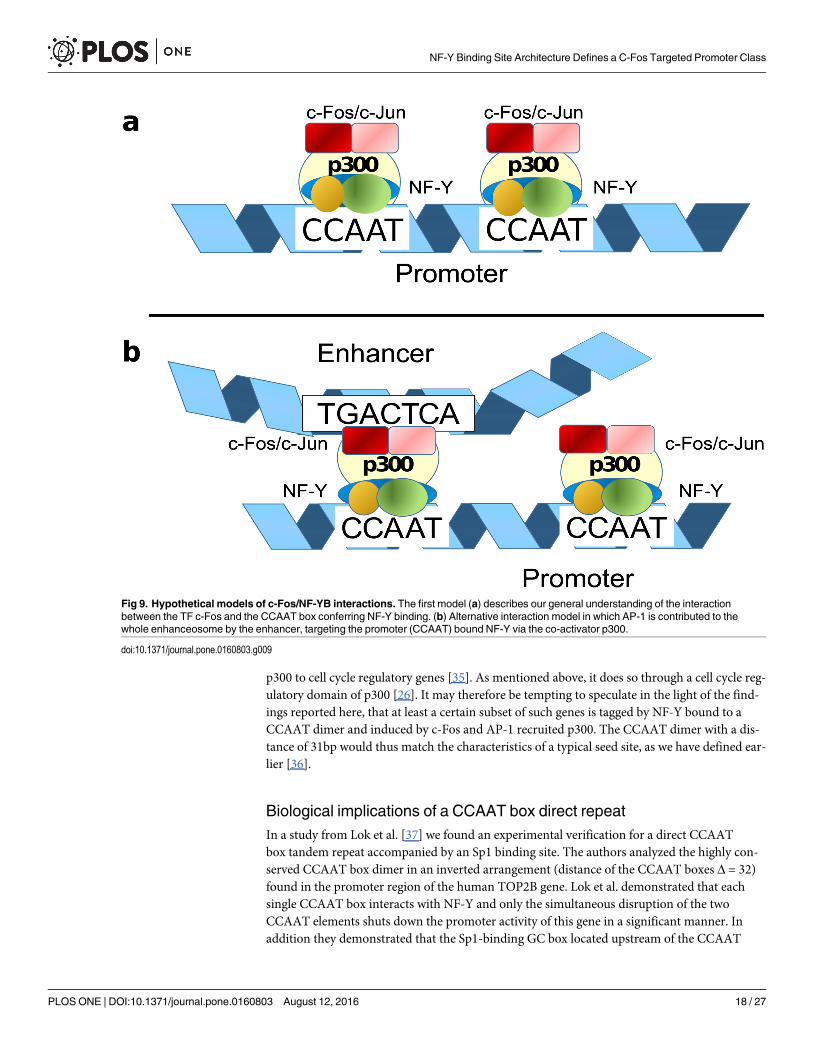
The role of enhancersIn contrast to the promoters related intervals, most of the enhancer intervals that are targetedby c-Fos in the cell lines HeLa S3 and K562 exhibit a clear AP-1 motif. This prompted the spec-ulation that it might have been the enhancers that contribute to the c-Fos-binding to therespective promoters, detected by ChIP after cross-linking of protein complexes that werebound to both enhancers and promoters as discussed by Mercer and Mattick [12]. This wassupported by our finding that c-Fos(AP-1+) enhancers tend to be closer to c-Fos(CCAAT)promoters, to which they were supposed to exert physical contacts, than to NF-YB(CCAAT)promoters that are not targeted by c-Fos (see Fig 9). Such a contact could either be a direct one,for instance via the above-mentioned potential interactions between c-Jun and NF-YA [30] orc-Fos and NF-YB [11]. In this study we have shown that c-Fos and at the same time AP-1motif containing enhancers (AP-1+) show a significant co-localization pattern with c-Jun pre-cipitated ChIP-seq intervals. Alternatively, such a contact could be mediated by a co-activatorsuch as p300. This co-activator is known to interact with both TFs, c-Fos [25, 33] and NF-Y[26], through different binding sites: c-Fos is bound to a C-terminal part of the p300 molecule(positions 1572–1818), where also the adenoviral TF E1A binds [25]. NF-Y interacts with amid-regional part of p300, positions 671–1194 [26], encompassing a bromo domain (1067–1139) and a cell-cycle regulatory domain CRD1 (1017–1029; UniProt: Q09472). As a conse-quence, both factors AP-1 and NF-Y can simultaneously bind to p300 [34]. Interestingly, sig-nificant portions of c-Fos-targeted proximal and distal regions are also bound by p300. Thisproportion is by far the lowest for distal regions that are bound by NF-YB, but are not targetedby c-Fos (22%). In contrast, it is the highest for c-Fos-targeted distal regions, most of themwith a recognizable AP-1 motif (87%) and to the few c-Fos-targeted promoters that have anAP-1 motif (83%), which we actually suspect to have been misclassified as promoters becauseof their vicinity to a TSS. We summarize these findings by proposing a model where the co-activator p300 is mainly recruited by enhancer-bound c-Fos/AP-1, which then loops back tothe promoter where it contacts the two NF-Y complexes bound to a CCAAT direct dimericrepeat, preferably with a 31bp distance between the two CCAAT boxes (see Fig 9). This modelmay work for those c-Fos-targeted genes that were identified in Hela S3 and in K562 cells. Forsome reason, such genes in GM12878 cells are regulated by c-Fos through a different mecha-nism. Here, practically no c-Fos-targeted enhancers are found which could recruit p300.Instead, we speculate that in these cases, c-Fos (or AP-1) already complexed with the co-activa-tor binds to NF-Y/CCAAT dimer promoters without being supported by an enhancer (see Fig9). The reason for this different behavior remains unclear so far, but may reflect a particularcellular condition in this cell line.
Functional implicationsThe functional categorization of genes with c-Fos-targeted promoters revealed as most promi-nent GO classes those that relate to chromatin remodeling processes. One of the most promi-nent functions of the FOS proto-oncogene is to promote cell proliferation, but it also plays arole in other processes like cell differentiation mediating some signal responses. On the otherside, NF-Y has been suggested to be a master regulator of cell cycle progression, recruiting
NF-Y Binding Site Architecture Defines a C-Fos Targeted Promoter Class
PLOS ONE | DOI:10.1371/journal.pone.0160803 August 12, 2016 17 / 27
p300 to cell cycle regulatory genes [35]. As mentioned above, it does so through a cell cycle reg-ulatory domain of p300 [26]. It may therefore be tempting to speculate in the light of the find-ings reported here, that at least a certain subset of such genes is tagged by NF-Y bound to aCCAAT dimer and induced by c-Fos and AP-1 recruited p300. The CCAAT dimer with a dis-tance of 31bp would thus match the characteristics of a typical seed site, as we have defined ear-lier [36].
Biological implications of a CCAAT box direct repeatIn a study from Lok et al. [37] we found an experimental verification for a direct CCAATbox tandem repeat accompanied by an Sp1 binding site. The authors analyzed the highly con-served CCAAT box dimer in an inverted arrangement (distance of the CCAAT boxes Δ = 32)found in the promoter region of the human TOP2B gene. Lok et al. demonstrated that eachsingle CCAAT box interacts with NF-Y and only the simultaneous disruption of the twoCCAAT elements shuts down the promoter activity of this gene in a significant manner. Inaddition they demonstrated that the Sp1-binding GC box located upstream of the CCAAT
Fig 9. Hypothetical models of c-Fos/NF-YB interactions. The first model (a) describes our general understanding of the interactionbetween the TF c-Fos and the CCAAT box conferring NF-Y binding. (b) Alternative interaction model in which AP-1 is contributed to thewhole enhanceosome by the enhancer, targeting the promoter (CCAAT) bound NF-Y via the co-activator p300.
doi:10.1371/journal.pone.0160803.g009
NF-Y Binding Site Architecture Defines a C-Fos Targeted Promoter Class
PLOS ONE | DOI:10.1371/journal.pone.0160803 August 12, 2016 18 / 27
tandem contributes to the TOP2B promoter activity in a synergistic manner. We have foundthis promoter region as part of our proximal intersection data set (co-localization of c-Fos andNF-YB). This example supports our hypothesis that the CCAAT box alone or in a tandemarrangement interacts with NF-Y. We think that these CCAAT modules define a very flexibleenhancer/promoter interface. We summarize our hypothetical CCAAT dimer model in Fig 9.In Fig 9(a) we describe the basis regulatory module of the CCAAT dimer active in GM12878cells. An additional gene regulatory influence could be performed if a distal/enhancer boundAP-1 can interact with a proximal CCAAT bound NF-Y promoter regions (Fig 9(b)). CCAATboxes are found in the regulatory regions of 30% of genes [38]. Multiple CCAAT boxes arefound in a large number of promoters and their genes are coding for so-called house-keepinggenes, as well as inducible cell-cycle regulated genes [39]. We observe a specific subset of thesegenes which are regulated by the transcription factors c-Fos/AP-1 and NF-Y at the same time.A defined spacing of a direct CCAAT box repeat is found for this specific promoter class. Inaddition the biological process enrichment of chromatin remodeling processes support the spe-cific function of the CCAAT dimer promoter class.
In human colorectal cancer cells it was shown that the transcription factor SOX9 binds tosome cell cycle regulatory genes as a cofactor of NF-Y through the CCAAT motif [40]. Thisexample demonstrates the capability of NF-Y to form regulatory active protein complexes. Itwas shown by Furumatsu et al. that SOX9 and p300 can interact [41]. We hypothesize that ourCCAAT dimer model that is summarized in Fig 9 could be valid also for other transcriptionfactors like SOX9 (see Fig 9). At least the manual inspection of the cell cycle regulatory genesCCNB1, CCNB2, CDK1, and TOP2A, which are targeted by SOX9 [40], contain one or moreCCAAT box direct repeats. Three out of these four genes are included in our gene-proximaldata set.
The intersection of FOS and NF-Y ChIP-seq regions were reported for the cell line K562[11, 18]. Dolfini et al. confirmed this observation for HeLa S3 and GM12878 cells [19]. In addi-tion the authors observed a “double CCAAT arrangment” in these peaks which are not foundin ChIP-seq experiments done for the transcription factors FOSL1 and FOSL2. In our study weconfirmed the lack of AP-1 motifs in co-localized ChIP-seq regions bound by the transcriptionfactors FOS and NF-Y for four different cell lines analyzed in the Encode project. In additionwe have shown a novel regulatory relationship between the transcription factors c-Fos/AP-1and NF-Y. We observe a clear distinction between c-Fos-bound enhancers, which exhibit acanonical AP-1 motif, and c-Fos-bound promoter regions, which are characterized by NF-Y-bound CCAAT boxes, preferably as a direct dimer with a distinct distance distribution. More-over, we observed mutually exclusive occurrence of AP-1 motifs and the CCAAT box in c-Fosbound regions, indicating that there is a polar interaction between AP-1 motif imprintedenhancers and CCAAT-containing promoters, which might be subject to interference uponpresence of the respective other motif in the wrong environment.
As discussed in the paper fromMercer and Mattick [12] we believe that these particularpromoter class can be found in ChIP-seq experiments because of a specific cross-linkingbetween these interacting distal and proximal regions (enhanceosome structure). This type ofenhancer-promoter correspondence is highly dependent on the biological context and, thus,differs between the four cell lines that we have investigated in our study. In our study we haveshown that these direct CCAAT box repeats which are interacting with FOS and NF-Y at thesame time are regulating a Gene Ontology defined biological process called nucleosome assem-bly. Recently it was shown that NF-Y controls the efficiency of DNA replication directly in anon-transcriptional way [42]. This observation supports our results: after replication the newsynthesized DNA need to pack to nucleosmes. The gene products that are related to this pro-cess are summarized in this biological process. The promoters of this defined pathway are
NF-Y Binding Site Architecture Defines a C-Fos Targeted Promoter Class
PLOS ONE | DOI:10.1371/journal.pone.0160803 August 12, 2016 19 / 27
highly enriched for CCAAT box direct repeats and show significantly shorter distances to AP-1 motif containing enhancers.
ConclusionsIn this study we propose a novel regulatory function of the transcription factor NF-Y in gene-proximal regions co-localized with the transcription factor c-Fos. These NF-Y binding sites arefound in a specific CCAAT dimer configuration around a distance value of 31 bp, accompaniedby a series of progressively decreasing maxima at every 10-11 bp in addition. More generally,our study shows how versatile direct and indirect transcription factor occupancy in ChIP-seqregions may be. A regulatory region is bound by a number of TFs and only a subset of thesefactor can be found on the sequence level. This novel regulatory module introduce an addi-tional level of complexity: the explicit missing of a transcription factor binding sites. We dem-onstrate that this level can be used to differentiate between direct or cis-regulatory influence incomparison to trans-regulatory (protein-protein interaction) effects.
Materials and Methods
ENCODE ChIP-seq and DNase-seq data setsAll data sets used in this study were taken from the ENCODE project [9] and performed on theGRCh37 (hg19) reference genome. ChIP-seq and DNase-seq genome-wide location data forthe cell lines HUVEC, HeLa S3, K562, and GM12878 were used in this study. For all data setswe made use of the ENCODE project defined table files (narrowPeak), which provide calledpeaks of signal enrichment bases on pooled, normalized data [43]. For the HUVEC cell line weused the ChIP-seq data obtained with a c-Fos antibody (GEO: GSM935585) and DNase-seqdata (GEO: GSM816646). No NF-YB related data set was available for this cell line. TheENCODE data sets analyzed for HeLa S3 cells were two ChIP-seq data sets for c-Fos (GEO:GSM935317) and NF-YB (GEO: GSM935408), and one DNase-seq data set (GEO:GSM816643). For K562 cells we examined ChIP-seq data for c-Fos, NF-YB, and DNase-seqdata linked to the following GEO accession numbers: GSM935355, GSM935429, andGSM816655, resp. Finally we studied ChIP-seq data for c-Fos (GEO: GSM935409), NF-YB(GEO: GSM935507) and DNase-seq (GEO: GSM816665) obtained from GM12878 cells.
Definition of proximal and distal regulatory regionsWe classified the corresponding ENCODE ChIP- or DNase-seq data into distal or proximalregions depending on their genomic annotations: if an experimentally identified genomicinterval was overlapping the minus 1000 bp region (-1kb) upstream of a RefSeq annotatedtranscription start site (TSS), including the first exon, we defined this interval as a proximalregion. Each interval, which did not overlap the corresponding -1 kb upstream region or itsrelated transcription unit was defined as a distal region. For the RefSeq data we used the UCSCgenome browser provided download (05/14/2014). Both the ENCODE ChIP-/DNase-seq dataand the RefSeq annotation used here were based on GRCh37 (hg19) reference genomeannotation.
Motif analysis using the TRANSFAC databaseWe used the TRANSFAC library (version 2013.3) together with the MATCH algorithm (Ver-sion 9.0) to analyze the different high-throughput data sets. We made use of all vertebratematrices in this profile, which were altogether 2176 PWWs. For all matrices in this library we
NF-Y Binding Site Architecture Defines a C-Fos Targeted Promoter Class
PLOS ONE | DOI:10.1371/journal.pone.0160803 August 12, 2016 20 / 27
chose a matrix similarity score (MSS) threshold of 0.5. The core similarity score (CSS) thresh-old was set to 0 (for details see references [20, 22]).
Performance analysis workflowWe developed a workflow to analyze experimentally determined regulatory sequence sets withPWMs stored in the TRANSFAC database. For each ChIP-seq data set under study, weremoved all overlapping intervals from the DNase-seq data set of the same cell line and usedthe remaining genomic intervals as specific control set. We received four distinct cell type spe-cific data sets: Two ChIP-seq data sets for c-Fos and NF-YB, resp., and two DNase-seq datasets as control for the c-Fos or the NF-YB set. We counted each ChIP-seq interval as a true pos-itive (TP), when it contained at least one PWMmatch above the set threshold, otherwise it wasclassified as a false negative (FN). Likewise each DNase-seq region with at least one PWMmatch above the chosen threshold was counted as a false positive (FP), otherwise as a true neg-ative (TN). For each of the PWMs we monitored TP, TN, FP and FN at gradually decreasingthresholds from the highest score (1.0) to 0.5. To determine the performance of a PWM, wemade use of the classical receiver operator characteristic (ROC) curves by plotting the true pos-itive rate (TPR: TPR ¼ TP
TPþFN) against the false positive rate (FPR: FPR ¼ FP
FPþTN). To summarize
the classification efficiency represented by one ROC curve, we calculated the correspondingarea under curve (AUC) values using R [44]. We computed Matthews Correlation Coefficient
(MCC:MCC ¼ ðTP�TNÞ�ðFP�FNÞffiffiffiffiffiffiffiffiffiffiffiffiffiffiffiffiffiffiffiffiffiffiffiffiffiffiffiffiffiffiffiffiffiffiffiffiffiffiffiffiffiffiffiffiffiffiffiffiffi
ðFPþTPÞ�ðTPþFNÞ�ðTNþFNÞ�ðTNþFPÞp ) to find the optimal MSS threshold for each
PWM.
De novo sequence motif discoveryDe novomotif searching was performed with the MEME version 4.9.1 [45]. For the relevantChIP-seq data, which are annotated as genomic location defined by their chromosomal loca-tions, we retrieved the corresponding complete sequences in FASTA format. For each MEMErun we chose the following parameterization: -dna, -revcomp, which instructs MEME to ana-lyze DNA sequences and to consider both strands. To optimize the run time, we limited theMEME motif search to maximally 10 motifs (-nmotifs 10) with a minimal motif width of 5 butnot more than 15 (-maxw 15). Finally, we chose the ‘zoops’MEME parameter as the model forthe distribution of motifs sites in our sequence set. Using this option MEME assumes that eachsequence may contain at most one occurrence of each motif.
Distance calculation of CCAAT box related tandem arrangementsCCAAT boxes were searched for as regular expressions. For all CCAAT boxes in a tandemarrangement, we computed the edge-to-edge distance. For concordant CCAAT boxes, the cor-responding distance situation can be displayed as follows: 5’-CCAAT-3’. . .5’-CCAAT-3’ forthe plus strand instance or 5’-ATTGG-3’. . .5’-ATTGG-3’ for its reverse complement. Otherconfigurations (inverted/everted repeats) were not separately considered.
Distance preferences between distal and proximal ChIP-seq regionsFor the distance analysis between putative enhancer regions (distal ChIP-seq intervals) andtheir proximal or putative promoter regions, we also calculated an edge-to-edge distance. Foreach promoter region we determined all available upstream enhancer regions with the samechromosomal annotation. For all possible upstream regions we calculated the distance by sub-tracting the enhancer end position from the start position of the corresponding promoterregion. Correspondingly, we subtracted all start positions of all downstream located enhancers
NF-Y Binding Site Architecture Defines a C-Fos Targeted Promoter Class
PLOS ONE | DOI:10.1371/journal.pone.0160803 August 12, 2016 21 / 27

from the same chromosome from the end position of the closest promoter element. From allthe distances we determined the closest enhancer, either up- or downstream, for each promoterregion. The distance is calculated from the first C of the first CCAAT to the first C of the sec-ond CCAAT box.
GO analysis using GREATProximal unified ChIP-seq intervals were submitted to the GREAT web service [27]. We chosethe standard parameters of the workflow Basal plus extension based on the whole-genomebackground set. The gene regulatory domain definition used the following parameters: proxi-mal extension 5 kb, downstream extension 1 kb, plusDistal up to 1000 kb.
Repeat mappingThe repeating elements identified by RepeatMasker [46] are download from the UCSC (URL:http://www.hgdownload.cse.ucsc.edu/goldenPath/hg19/database/rmsk.txt.gz). We filter thisfile for all Long Terminal Repeat (LTRs) elements which resulted in 717,656 different LTRregions.
p300 dataWe identified p300 interfering regions using the ENCODE Transcription Factor BindingTrack cluster(URL:http://hgdownload.cse.ucsc.edu/goldenPath/hg19/database/wgEncodeRegTfbsClusteredV3.txt.gz). Totally this file contains 138,836 p300 interferingregions.
Co-localization analysisFor the co-localization analysis of ChIP-seq regions, we used the University of California SantaCruz (UCSC) Table Browser tool collection [47].
Supporting InformationS1 Fig. ROC curves for characterizing c-Fos bound genomic intervals by AP-1 sequencemotifs. c-Fos ChIP-seq data sets obtained from HUVEC (black curves), HeLa S3 (green), K562(red) and GM12878 cells (blue) were analyzed with the TRANSFAC matrix V$JUNDM2_04(M02876), using non-overlapping sets of DNase I hypersensitive sites from the same cell linesas control. Top inset: Logo plot representing the AP-1 motif detected by matrix V$JUNDM2_04 (top); bottom inset: Plot of Matthews correlation coefficient (MCC) against theapplied threshold of the matrix similarity score (MSS) calculated by the Match program. Thevertical line together with the yellow circle point to the MSS threshold used for detecting poten-tial AP-1 sites in the further analyses. (A) Results for distal, (B) for proximal regions.(TIF)
S2 Fig. ROC curves for characterizing c-Fos-bound genomic intervals by NF-Y bindingmotifs. c-Fos ChIP-seq data sets obtained from HUVEC (black curves), HeLa S3 (green), K562(red) and GM12878 cells (blue) were analyzed with the TRANSFAC matrix V$NFY_01(M00287), using non-overlapping sets of DNase I hypersensitive sites from the same cell linesas control. Top inset: Logo plot representing the NF-Y binding motif detected by matrix V$NFY_01 (top); bottom inset: Plot of Matthews correlation coefficient (MCC) against theapplied threshold of the matrix similarity score (MSS) calculated by the Match program. Thevertical line together with the yellow circle point to the MSS threshold used for detecting
NF-Y Binding Site Architecture Defines a C-Fos Targeted Promoter Class
PLOS ONE | DOI:10.1371/journal.pone.0160803 August 12, 2016 22 / 27
potential AP-1 sites in the further analyses. (A) Results for distal, (B) for proximal regions.(TIF)
S3 Fig. Motif enrichment for the HUVEC cell line. Top five enriched motif for three differentproximal (P1-P3) and distal (E1-E3) sample sets are shown. The used sample size was set to657 (sample size of proximal c-Fos precipitated regions for the HeLa S3 cell line, see Table 4).(TIF)
S4 Fig. Motif enrichment for the HeLa S3 cell line. Top five enriched motif for proximal (P)and distal (E1-E3) sample sets are shown. The used sample size was set to 657 (sample size ofproximal c-Fos precipitated regions for the HeLa S3 cell line, see Table 4).(TIF)
S5 Fig. Motif enrichment for the K562 cell line. Top five enriched motif for proximal (P1-P3)and distal (E1-E3) sample sets are shown. The used sample size was set to 657 (sample size ofproximal c-Fos precipitated regions for the HeLa S3 cell line, see Table 4).(TIF)
S6 Fig. Motif enrichment for the GM12878 cell line. Top five enriched motif for proximal(P1-P3) and distal (E) sample sets are shown. The used sample size was set to 657 (sample sizeof proximal c-Fos precipitated regions for the HeLa S3 cell line, see Table 4).(TIF)
S7 Fig. Motif enrichment of c-Fos(only, proximal, AP-1+) sequence set.Motif discoveryusing MEME confirmed the predominant role of AP-1 consensus motifs in these c-Fos(only,proximal AP-1+) sequences.(TIF)
S8 Fig. Distance distribution of distal and proximal regions bound either by c-Fos orNF-YB. Proximal regions interacting with both c-Fos and NF-YB show significant shorter dis-tance relations to c-Fos(only) bound distal regions (left) compared to NF-YB(only) bound dis-tal regions (right).(TIF)
S1 Table. Distal and proximal gene regulatory regions derived by the Encode project.Shown are the number of genomic intervals bound by c-Fos or NF-YB in the indicated celllines, retrieved from the corresponding data sets of the ENCODE repository. For the HUVECcell lines no NF-YB ChIP-seq data is available (NA).(TIF)
S2 Table. Gene ontology enrichment of the Inter(c-Fos, NF-YB) group. The top 20 signifi-cantly enriched gene ontology biological process categories for proximal c-Fos and NF-YB co-localizing ChIP-seq regions are shown. 1724 proximal genomic intervals were analyzed (seeMethods for details).(TIF)
S3 Table. Gene Ontology enrichment of the Inter(CCAAT2+) sequence set. The top 20 sig-nificantly enriched gene ontology biological process categories for c-Fos and NF-YB co-localiz-ing ChIP-seq regions which contain at least one CCAAT dimer repeat were used as input set.869 genomic intervals were analyzed (see Methods for details).(TIF)
S4 Table. Gene Ontology enrichment of the Inter(CCAAT2+,p300) sequence set. The top20 significantly enriched gene ontology biological process categories for c-Fos and NF-YB co-
NF-Y Binding Site Architecture Defines a C-Fos Targeted Promoter Class
PLOS ONE | DOI:10.1371/journal.pone.0160803 August 12, 2016 23 / 27
localizing ChIP-seq regions which contain at least one CCAAT dimer repeat and are overlap-ping with ENCODE derived p300 ChIP-seq intervals were used as input set. 471 genomic inter-vals were analyzed (see Methods for details).(TIF)
S1 File. Gene-proximal c-Fos(only) data set.(BED)
S2 File. Gen-proximal c-Fos and NF-YB co-localization data set.(BED)
S3 File. Gen-proximal NF-YB(only) data set.(BED)
S4 File. Gen-distal c-Fos(only) data set.(BED)
S5 File. Gen-distal c-Fos and NF-YB co-localization data set.(BED)
S6 File. Gen-distal NF-YB(only) data set.(BED)
S7 File. Gene-proximal regions interfering with c-Fos and NF-YB, filtered CCAATbox direct repeats.(BED)
S8 File. Gene-proximal regions interfering with c-Fos and NF-YB, filtered CCAATbox direct repeats and p300 co-localization.(BED)
AcknowledgmentsWe thank Mehmet Gültas, Darius Wlochowitz, and Sebastian Zeidler for discussion and criti-cally reading the manuscript. We thank the ENCODE Consortium and the ENCODE produc-tion laboratories generating the particular data sets.
Author Contributions
Conceived and designed the experiments:MH EW.
Performed the experiments:MH FH.
Analyzed the data:MH.
Contributed reagents/materials/analysis tools:MH FH.
Wrote the paper:MH EW.
References1. Sanders DA, Ross-Innes CS, Beraldi D, Carroll JS, Balasubramanian S. Genome-wide mapping of
FOXM1 binding reveals co-binding with estrogen receptor alpha in breast cancer cells. Genome Biol.2013; 14(1):R6. doi: 10.1186/gb-2013-14-1-r6 PMID: 23347430
2. Jolma A, Yin Y, Nitta KR, Dave K, Popov A, Taipale M, et al. DNA-dependent formation of transcriptionfactor pairs alters their binding specificity. Nature. 2015; 527(7578):384–388. doi: 10.1038/nature15518 PMID: 26550823
NF-Y Binding Site Architecture Defines a C-Fos Targeted Promoter Class
PLOS ONE | DOI:10.1371/journal.pone.0160803 August 12, 2016 24 / 27
3. Boyle AP, Davis S, Shulha HP, Meltzer P, Margulies EH, Weng Z, et al. High-resolution mapping andcharacterization of open chromatin across the genome. Cell. 2008; 132(2):311–322. doi: 10.1016/j.cell.2007.12.014 PMID: 18243105
4. Neph S, Vierstra J, Stergachis AB, Reynolds AP, Haugen E, Vernot B, et al. An expansive human regu-latory lexicon encoded in transcription factor footprints. Nature. 2012; 489(7414):83–90. doi: 10.1038/nature11212 PMID: 22955618
5. Zaret KS, Carroll JS. Pioneer transcription factors: establishing competence for gene expression.Genes Dev. 2011; 25(21):2227–2241. doi: 10.1101/gad.176826.111 PMID: 22056668
6. Mullen AC, Orlando DA, Newman JJ, Loven J, Kumar RM, Bilodeau S, et al. Master transcription fac-tors determine cell-type-specific responses to TGF- signaling. Cell. 2011; 147(3):565–576. doi: 10.1016/j.cell.2011.08.050 PMID: 22036565
7. Sherwood RI, Hashimoto T, O’Donnell CW, Lewis S, Barkal AA, van Hoff JP, et al. Discovery of direc-tional and nondirectional pioneer transcription factors by modeling DNase profile magnitude andshape. Nat Biotechnol. 2014; 32(2):171–178. doi: 10.1038/nbt.2798 PMID: 24441470
8. Robertson G, Hirst M, Bainbridge M, Bilenky M, Zhao Y, Zeng T, et al. Genome-wide profiles of STAT1DNA association using chromatin immunoprecipitation and massively parallel sequencing. Nat Meth-ods. 2007; 4(8):651–657. doi: 10.1038/nmeth1068 PMID: 17558387
9. Dunham I, Kundaje A, Aldred SF, Collins PJ, Davis CA, Doyle F, et al. An integrated encyclopedia ofDNA elements in the human genome. Nature. 2012; 489(7414):57–74. doi: 10.1038/nature11247
10. Gerstein MB, Kundaje A, Hariharan M, Landt SG, Yan KK, Cheng C, et al. Architecture of the humanregulatory network derived from ENCODE data. Nature. 2012; 489(7414):91–100. doi: 10.1038/nature11245 PMID: 22955619
11. Xie D, Boyle AP, Wu L, Zhai J, Kawli T, Snyder M. Dynamic trans-acting factor colocalization in humancells. Cell. 2013; 155(3):713–724. doi: 10.1016/j.cell.2013.09.043 PMID: 24243024
12. Mercer TR, Mattick JS. Understanding the regulatory and transcriptional complexity of the genomethrough structure. Genome Res. 2013; 23(7):1081–1088. doi: 10.1101/gr.156612.113 PMID:23817049
13. Worsley Hunt R, WassermanWW. Non-targeted transcription factors motifs are a systemic componentof ChIP-seq datasets. Genome Biol. 2014; 15(7):412. doi: 10.1186/s13059-014-0412-4 PMID:25070602
14. Biddie SC, John S, Sabo PJ, Thurman RE, Johnson TA, Schiltz RL, et al. Transcription factor AP1potentiates chromatin accessibility and glucocorticoid receptor binding. Mol Cell. 2011; 43(1):145–155.doi: 10.1016/j.molcel.2011.06.016 PMID: 21726817
15. O’Shea EK, Rutkowski R, Kim PS. Mechanism of specificity in the Fos-Jun oncoprotein heterodimer.Cell. 1992; 68(4):699–708. doi: 10.1016/0092-8674(92)90145-3 PMID: 1739975
16. Wingender E, Schoeps T, Haubrock M, Donitz J. TFClass: a classification of human transcription fac-tors and their rodent orthologs. Nucleic Acids Res. 2015; 43(Database issue):97–102. doi: 10.1093/nar/gku1064
17. Hess J, Angel P, Schorpp-Kistner M. AP-1 subunits: quarrel and harmony among siblings. J Cell Sci.2004; 117(Pt 25):5965–5973. doi: 10.1242/jcs.01589 PMID: 15564374
18. Fleming JD, Pavesi G, Benatti P, Imbriano C, Mantovani R, Struhl K. NF-Y coassociates with FOS atpromoters, enhancers, repetitive elements, and inactive chromatin regions, and is stereo-positionedwith growth-controlling transcription factors. Genome Res. 2013; 23(8):1195–1209. doi: 10.1101/gr.148080.112 PMID: 23595228
19. Dolfini D, Zambelli F, Pedrazzoli M, Mantovani R, Pavesi G. A high definition look at the NF-Y regulomereveals genome-wide associations with selected transcription factors. Nucleic Acids Res. 2016;. doi:10.1093/nar/gkw096 PMID: 26896797
20. Wingender E. The TRANSFAC project as an example of framework technology that supports the analy-sis of genomic regulation. Brief Bioinformatics. 2008; 9(4):326–332. doi: 10.1093/bib/bbn016 PMID:18436575
21. Dolfini D, Mantovani R. Targeting the Y/CCAAT box in cancer: YB-1 (YBX1) or NF-Y? Cell Death Differ.2013; 20(5):676–685. doi: 10.1038/cdd.2013.13 PMID: 23449390
22. Kel AE, Gossling E, Reuter I, Cheremushkin E, Kel-Margoulis OV, Wingender E. MATCH: A tool forsearching transcription factor binding sites in DNA sequences. Nucleic Acids Res. 2003; 31(13):3576–3579. doi: 10.1093/nar/gkg585 PMID: 12824369
23. Ernst J, Kellis M. ChromHMM: automating chromatin-state discovery and characterization. Nat Meth-ods. 2012; 9(3):215–216. doi: 10.1038/nmeth.1906 PMID: 22373907
NF-Y Binding Site Architecture Defines a C-Fos Targeted Promoter Class
PLOS ONE | DOI:10.1371/journal.pone.0160803 August 12, 2016 25 / 27
24. Mifsud B, Tavares-Cadete F, Young AN, Sugar R, Schoenfelder S, Ferreira L, et al. Mapping long-range promoter contacts in human cells with high-resolution capture Hi-C. Nat Genet. 2015; 47(6):598–606. doi: 10.1038/ng.3286 PMID: 25938943
25. Preston GA, Srinivasan D, Barrett JC. Apoptotic response to growth factor deprivation involves cooper-ative interactions between c-Fos and p300. Cell Death Differ. 2000; 7(2):215–226. doi: 10.1038/sj.cdd.4400637 PMID: 10713736
26. Faniello MC, Bevilacqua MA, Condorelli G, de Crombrugghe B, Maity SN, Avvedimento VE, et al. TheB subunit of the CAAT-binding factor NFY binds the central segment of the Co-activator p300. J BiolChem. 1999; 274(12):7623–7626. doi: 10.1074/jbc.274.12.7623 PMID: 10075648
27. McLean CY, Bristor D, Hiller M, Clarke SL, Schaar BT, Lowe CB, et al. GREAT improves functionalinterpretation of cis-regulatory regions. Nat Biotechnol. 2010; 28(5):495–501. doi: 10.1038/nbt.1630PMID: 20436461
28. Ashburner M, Ball CA, Blake JA, Botstein D, Butler H, Cherry JM, et al. Gene ontology: tool for the unifi-cation of biology. The Gene Ontology Consortium. Nat Genet. 2000; 25(1):25–29. doi: 10.1038/75556PMID: 10802651
29. Wang J, Zhuang J, Iyer S, Lin X, Whitfield TW, Greven MC, et al. Sequence features and chromatinstructure around the genomic regions bound by 119 human transcription factors. Genome Res. 2012;22(9):1798–1812. doi: 10.1101/gr.139105.112 PMID: 22955990
30. Coss D, Jacobs SB, Bender CE, Mellon PL. A novel AP-1 site is critical for maximal induction of the folli-cle-stimulating hormone beta gene by gonadotropin-releasing hormone. J Biol Chem. 2004; 279(1):152–162. doi: 10.1074/jbc.M304697200 PMID: 14570911
31. Volkel S, Stielow B, Finkernagel F, Stiewe T, Nist A, Suske G. Zinc finger independent genome-widebinding of Sp2 potentiates recruitment of histone-fold protein Nf-y distinguishing it from Sp1 and Sp3.PLoS Genet. 2015; 11(3):e1005102. doi: 10.1371/journal.pgen.1005102 PMID: 25793500
32. Nardini M, Gnesutta N, Donati G, Gatta R, Forni C, Fossati A, et al. Sequence-specific transcription fac-tor NF-Y displays histone-like DNA binding and H2B-like ubiquitination. Cell. 2013; 152(1–2):132–143.doi: 10.1016/j.cell.2012.11.047 PMID: 23332751
33. Bannister AJ, Kouzarides T. Regulation of chromatin by histone modifications. Cell Res. 2011; 21(3):381–395. doi: 10.1038/cr.2011.22 PMID: 21321607
34. Faniello MC, Chirico G, Quaresima B, Cuda G, Allevato G, Bevilacqua MA, et al. An alternative modelof H ferritin promoter transactivation by c-Jun. Biochem J. 2002; 363(Pt 1):53–58. doi: 10.1042/0264-6021:3630053 PMID: 11903046
35. Gurtner A, Fuschi P, Magi F, Colussi C, Gaetano C, Dobbelstein M, et al. NF-Y dependent epigeneticmodifications discriminate between proliferating and postmitotic tissue. PLoS ONE. 2008; 3(4):e2047.doi: 10.1371/journal.pone.0002047 PMID: 18431504
36. Haubrock M, Li J, Wingender E. Using potential master regulator sites and paralogous expansion toconstruct tissue-specific transcriptional networks. BMC Syst Biol. 2012; 6 Suppl 2:S15. doi: 10.1186/1752-0509-6-S2-S15 PMID: 23282021
37. Lok CN, Lang AJ, Mirski SE, Cole SP. Characterization of the human topoisomerase IIbeta (TOP2B)promoter activity: essential roles of the nuclear factor-Y (NF-Y)- and specificity protein-1 (Sp1)-bindingsites. Biochem J. 2002; 368(Pt 3):741–751. doi: 10.1042/BJ20020791 PMID: 12197834
38. Mantovani R. The molecular biology of the CCAAT-binding factor NF-Y. Gene. 1999; 239(1):15–27.doi: 10.1016/S0378-1119(99)00368-6 PMID: 10571030
39. Oldfield AJ, Yang P, Conway AE, Cinghu S, Freudenberg JM, Yellaboina S, et al. Histone-fold domainprotein NF-Y promotes chromatin accessibility for cell type-specific master transcription factors. MolCell. 2014; 55(5):708–722. doi: 10.1016/j.molcel.2014.07.005 PMID: 25132174
40. Shi Z, Chiang CI, Labhart P, Zhao Y, Yang J, Mistretta TA, et al. Context-specific role of SOX9 in NF-Ymediated gene regulation in colorectal cancer cells. Nucleic Acids Res. 2015; 43(13):6257–6269. doi:10.1093/nar/gkv568 PMID: 26040697
41. Furumatsu T, Shukunami C, Amemiya-Kudo M, Shimano H, Ozaki T. Scleraxis and E47 cooperativelyregulate the Sox9-dependent transcription. Int J Biochem Cell Biol. 2010; 42(1):148–156. doi: 10.1016/j.biocel.2009.10.003 PMID: 19828133
42. Benatti P, Belluti S, Miotto B, Neusiedler J, Dolfini D, Drac M, et al. Direct non transcriptional role of NF-Y in DNA replication. Biochim Biophys Acta. 2016; 1863(4):673–685. doi: 10.1016/j.bbamcr.2015.12.019 PMID: 26732297
43. Laajala TD, Raghav S, Tuomela S, Lahesmaa R, Aittokallio T, Elo LL. A practical comparison of meth-ods for detecting transcription factor binding sites in ChIP-seq experiments. BMCGenomics. 2009;10:618. doi: 10.1186/1471-2164-10-618 PMID: 20017957
NF-Y Binding Site Architecture Defines a C-Fos Targeted Promoter Class
PLOS ONE | DOI:10.1371/journal.pone.0160803 August 12, 2016 26 / 27

44. RDevelopment Core Team. R: A Language and Environment for Statistical Computing; 2008. Availablefrom: http://www.R-project.org.
45. Bailey TL, Boden M, Buske FA, Frith M, Grant CE, Clementi L, et al. MEME SUITE: tools for motif dis-covery and searching. Nucleic Acids Res. 2009; 37(Web Server issue):W202–208. doi: 10.1093/nar/gkp335 PMID: 19458158
46. Jurka J. Repbase update: a database and an electronic journal of repetitive elements. Trends Genet.2000; 16(9):418–420. doi: 10.1016/S0168-9525(00)02093-X PMID: 10973072
47. Karolchik D, Hinrichs AS, Furey TS, Roskin KM, Sugnet CW, Haussler D, et al. The UCSCTable Browser data retrieval tool. Nucleic Acids Res. 2004; 32(Database issue):D493–496. doi: 10.1093/nar/gkh103 PMID: 14681465
NF-Y Binding Site Architecture Defines a C-Fos Targeted Promoter Class
PLOS ONE | DOI:10.1371/journal.pone.0160803 August 12, 2016 27 / 27