Next Stop: Sustainable Transport - REC...
121
Next Stop: Sustainable Transport A Survey of Public Transport in Six Cities of Central and Eastern Europe THE REGIONAL ENVIRONMENTAL CENTER for Central and Eastern Europe
Transcript of Next Stop: Sustainable Transport - REC...

Next Stop: Sustainable Transport
A Survey of Public Transport in Six Cities of Central and Eastern Europe
THE REGIONAL ENVIRONMENTAL CENTERfor Central and Eastern Europe

Next Stop: Sustainable Transport
A Survey of Public Transport in Six Cities of Central and Eastern Europe
EditorGrazyna Krzywkowska
Szentendre, HungarySeptember, 2004
Funded by The Royal Ministry of Environment, Norway

2 N E X T S T O P : S U S TA I N A B L E T R A N S P O R T
About the REC
The Regional Environmental Center for Central and Eastern Europe (REC) is a non-partisan, non-advocacy, not-for-profit international organisation with a mission to assist in solving environmental problems in Central and Eastern Europe(CEE). The REC fulfils this mission by promoting cooperation among non-governmental organisations, governments,businesses and other environmental stakeholders, and by supporting the free exchange of information and publicparticipation in environmental decision making.
The REC was established in 1990 by the United States, the European Commission and Hungary. Today, the REC islegally based on a charter signed by the governments of 28 countries and the European Commission, and on aninternational agreement with the government of Hungary. The REC has its head office in Szentendre, Hungary, and
country offices and field offices in 16 beneficiary countries which are: Albania, Bosnia and Herzegovina, Bulgaria,Croatia, the Czech Republic, Estonia, Hungary, Latvia, Lithuania, FYR Macedonia, Poland, Romania, Serbia andMontenegro, Slovakia, Slovenia and Turkey.
Recent donors are the European Commission and the governments of Austria, Belgium, Bosnia and Herzegovina,Canada, the Czech Republic, Denmark, Estonia, Finland, Germany, Hungary, Italy, Japan, Latvia, the Netherlands,Norway, Poland, Serbia and Montenegro, Slovenia, Sweden, Switzerland, the United Kingdom and the United States, aswell as other inter-governmental and private institutions.
The entire contents of this publication are copyright©2003 by the Regional Environmental Center for Central and Eastern Europe
No part of this publication may be sold in any form or reproduced for salewithout prior written permission of the copyright holder
ISBN: 963 9424 48 X
Published by:The Regional Environmental Center for Central and Eastern Europe
Ady Endre ut 9-11, 2000 Szentendre, HungaryTel: (36-26) 504-000, Fax: (36-26) 311-294
Website: <www.rec.org>
This and all REC publications are printed on recycled paper or paper produced without the use of chlorine or chlorine-based chemicals
The views of the authors in this publication do not necessarily reflect the views of relevant governmental organisationsor the Regional Environmental Center of Central and Eastern Europe. The presentations of national studies and best
practice cases reflect the opinions of national experts.

N E X T S T O P : S U S TA I N A B L E T R A N S P O R T 3
Foreword 5
Acknowledgements 7
Executive Summary 9
Introduction 13
Overview of the Case Studies 15
Part 1: Public Transport — Status, Priority Problems and Needs 21
Sofia, Bulgaria 23
Tallinn, Estonia 43
Warsaw, Poland 57
Part 2: Public Transport Financing — Status, Priority Problems and Needs 69
Bucharest, Romania 71
Budapest, Hungary 91
Vilnius, Lithuania 99
Annex 1: Moving Public Transport along in Central and Eastern Europe 115
Annex 2: Supporting Public Transport in Central and Eastern Europe 117
Annex 3: Proposed Priority Areas of Work on Promotion of Sustainable Transport in CEE 121

The urban areas in Central and Eastern Europe (CEE)are exposed to growing amounts of pollution that havemajor impacts on the environment and human health. Tak-ing into account the rapidly increasing number of cars, con-gestion, urban sprawl and other related problems, publictransport systems are of vital importance.
Central and Eastern European countries are known fortheir positive tradition of widely used public transport sys-tems. This trend can be preserved for the future onlythrough the continued implementation of necessary meas-ures for restructuring, modernisation, improved reliability,accessibility and quality. It is crucial to support these coun-tries if these efforts are to succeed. Policy guidance in theEuropan Commision’s white paper on “European TransportPolicy for 2010: Time to Decide” sets clear priorities fordoing so.
The success of public transport support is closely linkedto the integration of environmental concerns into transportpolicies. Sustainable development is impossible without truesectoral integration. The same is true for the integration ofenvironmental concerns into social and economic develop-ment. Therefore, the integration of environmental concernsinto the transport sector is not simply a cost to be borne,but a requirement for sustainable development. Moreover, itcreates conditions in which economies can thrive.
This publication summarises the results of a public trans-port support project in selected capitals of the EU’s newmember states and candidate countries. Both the publicationand the project were funded by the Royal Ministry of Envi-
ronment of Norway. Project beneficiaries (governmentalinstitutions, municipalities, public transport companies andindependent experts) established a discussion platform ofpolicy makers and practitioners to find the best ways toaddress current public transport-related needs and problemsin CEE. The project had a strong capacity-building side,thanks to site visits, exchanges of practical information, casestudies discussed at meetings, information exchanges viaelectronic tools, and presentations of best practices.
It pleases greatly that the findings of this project can beused by environmental stakeholders to further improve pub-lic transport organisation, demand management, contractualissues, private-public partnerships and investments. The proj-ect has remained strongly focused on the needs of benefici-aries by providing, for example, practical and first-handinformation on environmentally friendly public transportand ways to make more efficient use of available fundingsources in the expanded EU.
I am confident that project beneficiaries recognise thegreat value of exchanging knowledge and experience.Therefore, the beneficiaries will be pleased that the mate-rial compiled in this publication will be able to assist oth-ers in their work.
Marta Szigeti-BonifertExecutive Director
The Regional Environmental Center for Central and Eastern Europe
Szentendre, HungaryJune 2004
N E X T S T O P : S U S TA I N A B L E T R A N S P O R T 5
Foreword

N E X T S T O P : S U S TA I N A B L E T R A N S P O R T 7
Next Stop: Sustainable Transport is a summary of the find-ings of the REC project Promotion of Public Transport inCentral and Eastern Europe. Grazyna Krzywkowska, projectmanager (sectoral integration) of the Environmental PolicyProgramme at the REC, edited the publication. It was pre-pared in cooperation with Oreola Ivanova, the REC’s deputyexecutive director. The editor would like to thank her for hercomments and insight.
Thanks are also extended to Ausra Jurkeviciute, a RECproject manager (environmental assessment), for her valuablecontribution to this publication.
Financial support for the project came from the RoyalMinistry of Environment of Norway, whom the editor wouldlike to thank — especially Eldrid Nordbo and Marianne Gjorv.
The editor would like to thank the authors of the casestudies constituting the main body of this publication: DagoAntov, Inseneriburoo Stratuum, Talinn, Estonia • CristinaElena Balta and Victoria Carstea, Public Transport Company,Bucharest, Romania • Marija Burinskiene and Vytautas Grigo-nis, Vilnius Gediminas Technical University, Vilnius, Lithuania• Kristiana Chakarova, Institute for Transport and Commu-nication, Sofia, Bulgaria • Fiorentina Gheorghita, PublicTransport Company, Bucharest, Romania • James Lenoci,Lenoci and Partner Ltd, Budapest, Hungary • Andrzej Sam-bor and Wojciech Suchorzewski, Suchorzewski Konsulting,Warsaw, Poland.
The Overview of the Case Studies was written by AndrzejKraszewski, Warsaw Technical University, Poland. He alsocontributed to the executive summary.
National beneficiaries of the project mentioned above,alongside national and international experts, have provideda wealth of comments and additions to the case-study rec-ommendations and led lively discussions concerning possi-ble ways of achieving the goal of sustainable public transportin new member states of the European Union and candidatecountries. They also discussed tools for financing and pro-moting public transport in their countries, along with obsta-cles to sustainable public transport and sectoral integrationof environmental, health and transport concerns into policymaking. These comments, additions and discussions haveassisted the editor in making this publication complete.
Finally, the editor would like to thank the following indi-viduals, who cooperated on the project until August 2004:Metodi Avramov, Kristiana Chakarova, Mariana Krasteva,Ekaterina Tasheva (Bulgaria) • Jiri Bendl, Tomas Cocek,Marek Karban, Jiri Lavic, Libor Sima, Zdenek Suta, LukasSoukup (Czech Republic) • Eero Aarniste, Koit Kaevats, TiitSiimon, Terje Villemi (Estonia) • Laszlo Nagy, Aron Palvol-gyi, Veronika Kisvari, Peter Merza (Hungary) • GuntaBirzniece (Latvia) • Vaidotas Antanavicius, Viktorija Puzaite,Vesta Vinskute (Lithuania) • Andrzej Brzezinski, MarekChojecki, Filip Nowaczynski, Anna Piotrowska, Wlodz-imierz Rybarczyk, Maciej Warszakowski (Poland) • LilianaAndrei, Elena Boghina, Viorica Beldean, Dan Dumitru Ghe-orghiade, Miruna Matache, Rodica Sandu, Stelian Stancila,Geanina Elena Suditu, Ana Maria Xantopol (Romania) •Vladimir Lunacek, Vladimir Mikus (Slovakia).
Acknowledgments
Purpose of this publicationNext Stop: Sustainable Transport was prepared by the
Regional Environmental Center for Central and EasternEurope (REC) within the framework of the project on Pro-motion of Public Transport in Central and Eastern Europe.The project was financed by the Royal Ministry of Environ-ment of Norway. The main aim of the project is to developregional cooperation between public transport stakeholdersin the EU’s new member states and candidate countries inCentral and Eastern Europe. Such cooperation enables sus-tainable public transport to be promoted in the region andaddresses public transport problems in the framework of sec-toral integration. It also builds the capacity of public trans-port companies and municipalities, and establishes dialoguebetween them, donors and financial institutions.
BackgroundAfter a rapid loss of passengers from 1990 to 1995, vary-
ing between 15 and 25 percent in different countries, publictransport in Central and Eastern Europe (CEE) entered aperiod of slowed decline in usage, with an average yearlydecrease of between 1-3 percent. Urban areas in CEE are cur-rently facing growing traffic congestion, road safety issues,and rising air and noise pollution. Policy decisions andactions are needed to encourage a modal shift from road torail, the design and construction of multi-modal transportcorridors, changes in the present practice of priority highwayinvestments, promotion of walking and cycling, and manyother measures introducing or implementing sustainabletransport concepts.
Despite the financial constraints, CEE countries havemade efforts to address public transport problems in recentyears. Some of the larger cities have developed and adoptedsustainable urban transport policies. Interaction and dia-logue between competent authorities and public transportcompanies have improved, and the first steps towardsincreasing the efficiency of public transport have been made.
Also, the renewal of public transport f leets has begun, cityroad infrastructure has improved, ring roads have been built,and new underground, tram and trolley lines have opened,been extended or are planned. However, in many othertowns where populations still rely largely on public trans-port, many decision remain to be taken. If public transportdoes not improve quickly, the urban environment and healthwill deteriorate further.
This publication presents case studies prepared within theframework of the project and summarises their findings. Thecase studies were prepared by experts from Central andEastern Europe and fall into two categories. Case studies onSofia, Warsaw and Tallinn outline the status, needs and pri-ority measures to support public transport in these cities.Case studies on Bucharest, Budapest and Vilnius cover the pri-ority problems and needs of public transport financing.
Beneficiaries of the project are public transport stake-holders — that is, municipalities, public transport compa-nies, governmental institutions, and non-governmentalorganisations interested in the operation, financing andreform of public transport. The goal is to move towards sus-tainable transport and integration of environmental, healthand transport concerns into policy making. The process ofproject implementation showed the importance of buildingthe capacity of local bodies in sectoral integration and sus-tainable transport measures. It demonstrated their willing-ness to exchange information, knowledge and experience,with the aim of achieving stable financing for public trans-port, making it accessible for all — in short, an attractive,environmentally friendly alternative to swelling car usage inthe CEE region. Urban areas in CEE are currently facinggrowing traffic congestion, road safety issues, urban sprawland rising air and noise pollution. Policy decisions andactions are needed to encourage a modal shift from road torail, the design and construction of multi-modal transportcorridors, changes in the present practice of priority high-way investments, the promotion of walking and cycling, andmany other measures introducing and implementing sus-tainable transport concepts.
N E X T S T O P : S U S TA I N A B L E T R A N S P O R T 9
Executive Summary

A long-term process has only just begun, but the presentsituation offers unique potential and opportunities for publictransport in CEE. Active international support for ongoingefforts to improve efficiency, quality and reliability of the pub-lic transport service, combined with good existing practices,could lead to a stabilisation of public transport passenger vol-umes and positive short- and medium-term development per-spectives. The REC aims to support dialogue and cooperationbetween various interest groups and policy makers on local,national and pan-European levels, in search of solutions andoffering support to those seeking a healthier environmentthough improvements to the public transport sector.
In the European Union, the approach to promoting theintegration of environmental concerns during policy makingwas developed under the Cardiff Process. The Cardiff Pro-cess was initiated in 1998 to implement the provision of Arti-cle 6 of the Treaty Establishing European Community,which reads: “[E]nvironmental protection requirements mustbe integrated into the definition and implementation of theCommunity policies and activities.”
Transport has been a part of the Cardiff Process since itsinception, and the Transport Council submitted its strategyto the European Council in 1999. In June 2001 the Euro-pean Council adopted the EU’s Strategy for SustainableDevelopment: A Sustainable Europe for a Better World,”which stresses the need for sectoral integration where eco-nomic growth, social cohesion and environmental protec-tion must go hand in hand.
Transport congestion is identified by the strategy as oneof the main threats to sustainable development. According-ly, all policies should be judged on the basis of how theycontribute to sustainable development, but better informa-tion is needed to achieve this goal.
The EU Common Transport Policy of 2001 tackles risinglevels of congestion and pollution and encourages the use ofmore environmentally friendly modes of transport to preventcongestion. It also seeks the decoupling of transport growthfrom economic growth and the shift of modal splits in trans-port from roads to public transport — giving priority to infra-structure investment for public transport and integratedurban development strategies to avoid urban sprawl. Theregion’s current public transport systems can serve as a solidfoundation in this effort. Means of preventing congestionand providing sustainable mobility measures are discussed inthe European Commission’s white paper, “European Trans-port Policy for 2010: Time to Decide,” published in 2001.This publication underlines the links between commontransport policy, economic policy, land-use planning policyand town planning, social and education policy and localurban transport policy. It calls for “a new approach to urbantransport by local public authorities with rationalisation ofprivate car use.”
Key messagesThe analysis of the state of public transport in the case
studies reveals that changes are needed in the legal and insti-tutional set-up of bodies dealing with public transport. Thiscould involve the establishment of a public transport agencyor association of public transport (regional, urban and rail-ways) operators. The case studies point to unfair competi-tion between private and public operators, with private oper-ators not bearing the full costs of public transport infra-structure investments and maintenance. A need for integrat-ed revenue collection, reimbursement for concessionaryfares, and revenue allocation for public transport are alsomentioned as priority problems. Other measures to promotepublic transport, fight air pollution and congestion in cities(e.g. the establishment of park-and-ride systems, bus lines,rehabilitation of tram tracks, metro system, light railways,eco-f leet investment) are touched upon.
The Bucharest and Sofia case studies detail the barriers toobtaining financing for pubic transport from internationalfinancial institutions, while underscoring the problems withloan guarantees and conditions. The importance of externaland alternative sources of financing has been emphasised.
The case studies emphasise the importance of support-ing local authorities and institutions dealing with publictransport. The local governments were given responsibilitiesregarding the operation of and investment into public trans-port at the moment of political and economic transforma-tion. However, such legal and institutional changes were notfollowed by capacity building and sufficient financial sup-port. As the Bucharest case points out:
[R]evenues cannot be balanced by full costs of publictransport. Moreover, in order to evaluate efficiency, onemust not consider benefits difficult to express in figures:the degree of air pollution, urban congestion, energy andfuel consumption, comfort and safety.
Therefore, employer transportation plans and charges forenterprises have been proposed in Bucharest case studies.The Budapest case study concludes with:
[T]he challenge is how to achieve an acceptable balancebetween commercial concerns, raising the costs of pub-lic transport, decreasing shares of public transport useand social responsibilities of public transport, and, at thesame time, remain competitive in the wake of risingautomobile use.
Focus should placed on long- and medium-term invest-ment planning and on the effective tendering of services, infra-structure construction or fleet rehabilitation. Integrated traf-fic management systems are badly needed in the cities sur-veyed for the benefit of transport operators and everydayusers if public transport is to be made attractive and conven-ient. Currently the fleet in the surveyed cities is ageing. Thereis also a high loading factor of vehicles, thus making public
E X E C U T I V E S U M M A R Y
10 N E X T S T O P : S U S TA I N A B L E T R A N S P O R T

transport an unattractive choice to car users. It is even at riskof becoming a service to marginalised groups of society. Costsof ongoing or needed investments in public transport infra-structure and fleets are indicated in the case studies.
Pressure on city centres will continue because ofmotorisation followed by air and noise pollution and con-gestion, but traffic management measures, adequate urbanplanning and eco-friendly, adequately supported publictransport can limit them.
Next stepsDuring the preparation of the case studies and various
discussions, several areas were identified for further work inthe fields of capacity and institutional strengthening for the-operation and financing of public transport, including:
• integration of transport networks to promote publictransport (integration of public transport planning andland-use planning);
• private-public partnerships supporting public transportoperation and financing;
• exchange of experience and information regarding thefinancial aspects of investments (including tendering, therole of subsidies, bearing the costs of infrastructureinvestments, additional financial sources, loan proce-dures, fare setting, integrated fare collection, concession-ary fares, revenue allocation schemes and other chargingschemes that promote public transport);
• an overview of EU funding processes and programmes,access to these funds and their programming for publictransport projects (the importance of state aid regula-tions of the EC and the efficient use by public transportstakeholders of the EU Cohesion and Structural Fundsneed to be addressed);
• an overview of financial schemes supporting publictransport in each EU new-member state and candidatecountry in CEE (based on the principle that the order-ing party should pay for services);
• transport demand management measures, includingparking policies and practices, pricing policies and theestablishment of traffic restricted areas;
• development of information systems on public trans-port, marketing and promotion of public transport, usersupport with the use of electronic tools (the use of avail-able information technology tools is needed for publictransport reforms, improved decision making and man-agement, etc.); and
• the need for raising the awareness of the public and deci-sion-makers concerning public transport as an asset thatcontributes to sustainable development.
E X E C U T I V E S U M M A R Y
N E X T S T O P : S U S TA I N A B L E T R A N S P O R T 11
The project on Promotion of Public Transport in Cen-tral and Eastern Europe, supported financially by the RoyalMinistry of Environment of Norway, was conceived toaddress the need for integration of environmental, healthand transport issues during policy making through the pro-motion of public transport.
The project develops regional cooperation among pub-lic transport stakeholders in the new member states of theEuropean Union from Central and Eastern Europe. Suchcooperation is key to the development of sustainable pub-lic transport in the region and allows public transport prob-lems to be addressed in the framework of sectoral integra-tion. Activites are designed to build the capacity of publictransport companies and municipalities, and to establishcommunication among them, as well as with donors andfinancial institutions.
This publication summarises six case studies preparedunder the project, and seeks to identify common challenges,obstacles, needs and recommendations for the promotion ofpublic transport in CEE. An overview of the case studies fol-lows this introduction.
The scope and structure of this publication
Three of the case studies — Sofia, Tallinn and Warsaw —present a series of respective public transport realities, needsand priorities, as identified by the experts: the informationincluded is valid as of November 2003. The case studies ofBucharest, Budapest and Vilnius tackle priority problemsand needs related to public transport financing in thesecities: the information is valid as of April 2004.
The experts prepared these case studies in consultationwith relevant municipalities, public transport companiesand, if needed, other authorities or bodies responsible forpublic transport. The experts were advised to use andref lect on existing reports, assessments, analyses, strategiesand available studies.
Case studies contain the following:
• a description of the current state of legislative, policyand institutional developments since 1989 in eachdescribed city, with respect to public transport (opera-tion, maintenance, administration, financing of opera-tions and investments, etc.);
• data on public transport in each city, including: opera-tional network length in each city, number of lines permode, number of trips, average stop distance, averagespeed per transport mode, current percentage of munici-pal budget allocated to public transport — distinguishingbetween operational and investment costs — revenue fromtickets and revenue/cost ratios, and velocity/km ratios;
• sources used for public transport financing (state andmunicipal budgets, international financial institutions,available EU funds);
• economic instruments used to finance public transport(taxes);
• assessment of currently used procedures for publictransport operation and financing (procurement, servicecontracts); and
• recommended legislative, policy and institutional measuresto be taken to strengthen the capacity of public transportmanagement, administrative operations or financing.
All six case studies, which were prepared by the experts,were subject to discussions by public transport practitionersfrom the region. Such discussions assisted in identification ofthe most urgent issues to be addressed while developing sus-tainable transport systems. The case studies served as the basissfor formulating site visits organised under the project. Theyalso defined the scope of the organised meetings. The casestudies address political, economic, environmental and finan-cial aspects of public transport operation and investments.
The six case studies are followed by annexes with theconclusions of the December 2003 meeting and the back-
N E X T S T O P : S U S TA I N A B L E T R A N S P O R T 13
Introduction

14 N E X T S T O P : S U S TA I N A B L E T R A N S P O R T
ground paper prepared for this meeting. The backgroundpaper, the first attempt to identify common issues among theproject beneficiaries, set the stage for the project’s activitiesAnnex 3 outlines priority areas of work on the promotion ofsustainable transport in CEE, chosen in consultation withproject participants.
Overview of project activitiesThe main objective of the first meeting under the proj-
ect on December 16-17, 2003 was to present priority prob-lems and needs of public transport in the capitals of EUcandidate countries and new member states. Case studieswere presented for Sofia, Tallinn and Warsaw. The partici-pants investigated public transport management reformsin the other EU member states and identif ied directionsfor future activities to be undertaken under the projectand beyond.
During the Fast Track to Public Transport workshop onpublic transport financing in April 19-21, 2004, participantsdiscussed legislative, policy and institutional changes, financialsources and procedures used for investments and public trans-port operations. The discussions were based on case studiescarried out in Bucharest, Budapest and Vilnius. An overviewof public transport financing in Warsaw and Gdynia, Polandwas also provided. The role of EU Structural and CohesionFunds in public transport financing was presented, along withinformation about other sources of public transport financ-ing, including international financial institutions.
A visit to Graz Municipality allowed participants tobecome familiar with the city’s public transport systemmeasures, financing and planning. The EU public transportprogramme, Trendsetter, and the URBAN II programme onurban development were discussed. The site visit was com-pleted by paying a short visit to Graz’s Mobility Center.During the second site visit, Budapest Municipality and itspublic transport company outlined the Transport Develop-ment Plan for Budapest, along with a system of subsidies,cost-recovery measures, operational contracts, procedures forthe procurement of services, an informational system forpublic transport and international financing available to sup-port environmentally friendly public transport.
Site visits to Krakow and Warsaw took place on Septem-ber 9-11, 2004 under the Arriving at Sustainable Transportproject. Representatives of the environment and transportsectors, public transport companies, municipalities andtransport authroirites visited the Polish cities to discuss toolsused for giving priority to public transport, cycling andpedestrians, stakeholder dialogue and accesst to EU fundsfor public transport in these cities. They also discussed theupgrade of tram networks and tram-f leet renewal in Krakowand Warsaw, and examined the policy-making process forlocal transport, systems of transport planning and trafficmanagement, integrated ticketing, electronic ticketing andsystems for fare collection in both cities.
The Stationed for Sustainable Transport workshop wasorganised by the REC to complement the Ministerial Con-ference on Environment and Health in Budapest, held fromJune 23-24, 2004. The event took place on June 21-22, 2004.Workshop participants represented the environment, health,and transport sectors (including national environmentalhealth institutes, public transport companies, municipalitiesand NGOs active in the field). They discussed the impacts oftransport on environment and health, as well as ways to sup-port public transport and reduce the environmental andhealth risks of the transport f low in urban areas. They willdiscuss the integration of environmental, health and trans-port policy areas while drafting national sustainable develop-ment plans, clean technologies, information technology (IT)tools for effective public transport and traffic management,the Strategic Environmental Assessment Protocol and its sec-toral integration applications.
The following aspects of transport, environment andhealth integration should be taken into consideration in pol-icy making and implementation:
• the importance of providing society a full choice of trans-port modes, with emphasis on sustainable modes of trans-port such as attractive, accessible and efficient public trans-port, safe cycling and walking, as well as their integration;
• the impact of decentralisation of responsibilities in pub-lic transport, privatisation of public transport opera-tions, and their consequences for successful implementa-tion of sustainable transport policy;
• the importance of appropriate joint funding and financing(from a variety of sources such as the EU, internationalfinancial institutions, and national and local sources) forpublic transport, and conditions for safe cycling and walk-ing to enable long-term policy implementation;
• the use of available information technology tools foreff icient public transport and traff ic management, bet-ter education, and increased public awareness andcommunication to improve and promote sustainabletransport development.
• creation and support of an interdisciplinary network ofstakeholders dealing with sustainable transport; and
• local-level capacity building on integrating diferent environ-mentally friendly transport modes and land-use planning.
For more information on the project, visit:<www.rec.org/REC/Programs/EnvironmentalPolicy/PublicTransport>.
I N T R O D U C T I O N

N E X T S T O P : S U S TA I N A B L E T R A N S P O R T 15
Policy makers in Central and Eastern Europe must reori-ent their transport policies to give greater priority to sus-tainable development and to balance the growth of motori-sation with the capacity to develop road infrastructure. Inthis vein, the following policy directions should be adopted:
• promotion of public transport;
• reduction of car use in urban areas;
• improvements to traffic management;
• promotion of non-mechanised means of transport (bicy-cles, walking);
• improvements to traffic safety measures; and
• integration of land-use and transport planning.
These trends are already ref lected in policies adopted inWarsaw and Budapest. Bucharest, Tallinn and Vilnius stillneed both a general transport policy and a specific strategyto develop public transport.
It is crucial that financial resources are made available toimplement transport policies in CEE capital cities. The mostdesirable option is that the state assists the municipalitiesthrough participation in financing of the most importantcapital-intensive public transport investment projects, suchas underground or light rail systems, as well as local andregional development plans and programmes containingcomponents such as roads, tunnels and bridges. None of thecities included in the study have this option, althoughBudapest, Sofia and Warsaw are better off than the others.
Bucharest has a policy guaranteeing social protection,which means that tariffs are approved by the state. The rev-enue from tickets covers only 30 percent of total costs, andthe state is not able to subsidise public transport adequate-ly. Sofia operates under a different policy, whereby the rev-enues from ticket sales cover 94-98 percent of the costs oftransport operation. The implementation of social policy isleft to the municipality and the state, which pay the full dif-ference in price in the case of concessionary fares.
New legislative initiatives currently discussed in the Pol-ish parliament will empower Polish municipalities withmeasures to generate financial resources for the develop-ment, maintenance and operation of sustainable transportsystems. Parking charges have already been introduced inWarsaw. At the moment tolls for using bridges and enteringcity centres, and congestion pricing are being considered inthe most crowded cities in Poland, including Warsaw.
Summary of technical issuesWith 1.2-2.0 million inhabitants, Bucharest, Budapest,
Warsaw and Sofia are considerably larger than Vilnius andTallinn (see Table 1). Although the last two are smaller, theystill play a key role in stimulating their respective region'seconomical and cultural activity.
Transport infrastructure differs significantly from city tocity, a result of their different characteristics, history andsocial habits. The four biggest cities have underground rail-ways — in the case of Bucharest and Budapest there are fourunderground lines; Sofia and Warsaw have only one lineeach (under construction but operating) and other lines areplanned. Vilnius and Tallinn have no underground at all.
Overview of the Case Studies
TABLE 1
Population of cities in case studies
Inhabitants
Bucharest 2,000,000Budapest 1,861,383Warsaw 1,689,648Sofia 1,220,000Vilnius 553,200

Bus lines are the most developed mode of transport (seeTable 2), making them the backbone of the urban transport sys-tem in all of these cities. Bucharest, Budapest and Sofia containevery mode of transport in use, including buses, trams, trolleysand underground. There are also periodic water connections inBudapest. Warsaw does not have trolley connections, but it hasmany more bus lines that create a relatively dense network. Vil-nius’s transport system is based on buses and trolleys, with adense trolley network in the central district of the city.
All of the cities offer also some private taxies and mini-buses as a means of transport, but except for Sofia and Vil-nius, there is no reliable information on the number of con-nections realised per year.
Readers of the reports should note that different authorsprovided figures for the total length of lines that is signifi-cantly higher than the length of network, since lines fre-quently overlap. For example, in Warsaw:
• total length of the bus transport network: 849.1 kilometres;
• total length of the bus lines: 2,975.7 kilometres;
• total length of the tram transport network: 121.8 kilo-metres;
• total length of the tram lines: 469.8 kilometres.
Table 4 shows the number of passengers transported peryear, per mode of transport in Bucharest, Budapest, Warsaw,Sofia and Vilnius. Unfortunately, no such information wasprovided for Tallinn.
It is worthwhile to note again that in the four biggestcities, buses constitute the core of the transport systems. Inthe crowded districts where there are no dedicated lanes,buses are frequently obstructed in the same traffic jam as pri-vate vehicles.
O V E R V I E W O F T H E C A S E S T U D I E S
16 N E X T S T O P : S U S TA I N A B L E T R A N S P O R T
TABLE 2
Number of lines per mode of transport
Bucharest Budapest Warsaw Sofia Vilnius TallinnBus 123 153 201 95 62 53Tram 31 33 31 16 0 5Trolleybus 19 15 0 10 18 8Underground 4 3 1 1 0 0Total 177 204 233 170* 161** 66
* includes private carriers (48 lines)** includes private operators (19 lines of buses and 62 lines of minibuses)
Tallinn
Vilnius
Sofia
Warsaw
Budapest
Bucharest
50 1000 150 200 250
Bus Tram UndergroundTrolleybus

Looking at the operating f leet (Table 5), it is significantthat in Warsaw there are many more buses than in othercites. Its network of express, semi-express and ordinary buslines connecting to other modes, such as metro, tram and
suburban train stations, has offered efficient service over thepast few years. Unfortunately, there is no data on the trans-port f leet in Budapest.
The data available shows that the age of the operating
O V E R V I E W O F T H E C A S E S T U D I E S
N E X T S T O P : S U S TA I N A B L E T R A N S P O R T 17
Number of passengers transported per year (in thousands)
Bucharest Budapest Warsaw Sofia VilniusBus 403,300 570,469 470,000 364,000 12,627Tram 403,300 367,075 250,000 182,000 —Trolleybus 89,600 81,853 — 82,550 136,793Underground 250,000 315,046 70,000 21,450 —Total 1,146,200 1,334,443 790,000 650,000 263,068
TABLE 3
Operational network length in each city (in kilometres)
Bucharest Budapest Warsaw Sofia VilniusBus 430 no data** 849 1,250* 710*Tram 146 no data 122 145 —Trolleybus 74 no data — 90 423*Underground 33 63 14 8 —Total 683 1,133 985 — 1,133*
* Total length of lines and not the length of the network **no data was provided in the case study
Vilnius
Sofia
Warsaw
Budapest
Bucharest
200,000 400,0000 600,000 800,000 1,000,000 1,200,000 1,400,000
Bus Tram Trolleybus Underground
TABLE 4

f leet is high and the replacement of many vehicles must bedone in a relatively short period. This overhaul will beexpensive, but the modern, low-f loor cars with more eco-nomical and cleaner engines will certainly contribute to bet-ter services and reduce pollution levels.
The average distances between stops for each mode oftransport are lower in the central districts and generally cor-respond to the standards set. Another quality indicator is theaverage speed of the type of public transport. The data avail-able shows that those using the street network are slow andstill uncompetitive with a private car. In Warsaw this veloci-ty starts to increase after establishing bus lanes along princi-pal communication routes. Keeping these lanes free ofmotorists during rush hours is the primary challenge.
Summary of financial and economic aspects
Only the case studies of Bucharest, Budapest and Vilniusfocus on the financing of public transport.
The current amount of municipal funding allocated for
public transport has been provided for Bucharest (10 per-cent) and Budapest (32 percent) only. From the data pro-vided it is clear that the Bucharest and Budapest municipal-ities do not cover the operational costs of public transport.After revenue from tickets is accounted for, gaps remain ofabout EUR 39 and 163 million, respectively.
The low cost of tickets in Bucharest requires substantialtariff subsidies. Generally, the municipality bears only 70percent of the cost of a surface public transport trip. Thesubsidy received is between 72 percent and 82 percent of thetotal revenues.
Financial sources
BucharestThe financial resources of RATB (the surface public
transport operator of the Bucharest municipality) include:
• revenues from tickets and monthly passes sold at RATB’sown centres of sale (which represents approximately 30percent of the costs);
O V E R V I E W O F T H E C A S E S T U D I E S
18 N E X T S T O P : S U S TA I N A B L E T R A N S P O R T
TABLE 5
Bucharest Warsaw Sofia Vilnius TallinnBus 874 1,606 677 224 364Tram 360 869 190 — 100Trolleybus 200 — 157 258 126Underground 251 108 48 — —
Tallinn
Vilnius
Sofia
Warsaw
Bucharest
4000 800 1,200 1,600 2,4002,000 2,800
Bus Tram Trolleybus Underground
Average operating fleet

O V E R V I E W O F T H E C A S E S T U D I E S
N E X T S T O P : S U S TA I N A B L E T R A N S P O R T 19
TABLE 6
Average age of operating fleet (in years)
Warsaw Sofia Vilnius TallinnBus 8 13.8-15.2 10 13.7Tram 18.5 12 — 19Trolleybus — 14 13 13.7Underground 5 no data — —
TABLE 7
Average distance between stops (in metres)
Bucharest Budapest Warsaw VilniusBus 529 no data 520 640Tram 522 no data 456 —Trolleybus 553 no data — 550Underground no data 1,500 1,092 —
TABLE 8
Average public transport speed (in kilometers per hour)
Bucharest Budapest Warsaw Sofia VilniusBus 16.0 16.3 17.8 19.4 23.0Tram 13.3 13.3 15.0 no data —Trolleybus 11.6 11.6 — no data 18.0Underground no data 23.8 36.0 41.0 —Total no data no data no data 24.0 no data
TABLE 9
Operational costs per year, per mode (million EUR)
Bucharest Budapest VilniusBus 57.10 no data 13.82Tram 47.72 no data —Trolleybus 16.80 no data 13.51Operational costs 121.62 359.04 27.33

• the tariff difference allocated by the local council, whichis calculated in accordance with the methodologicalnorms of the Ministry of Finance and represents the socialprotection offered to certain categories of citizens; and
• budget allowances to cover capital expenses, in compli-ance with the Law on Public Finances.
BudapestCurrently there are three main sources of operational
revenue in the Hungarian capital:
• fare revenue;
• municipality operational compensation for concession-ary fares; and
• government price compensation for concessionary fares.
VilniusCommunication Services receive 4 percent of the revenue
of single tickets sold on vehicles, and a share of 15 percent ofall other tickets sold (e.g. monthly passes and single ticketssold in kiosks). Communication Services does not get a shareof the compensation for concessionary fares. The enterprisereceived 66.6 percent of the income from tickets in 2002 and65.5 percent in 2003. Other revenues were generated fromparking and other commercial activities. After the share toCommunication Services is deducted, the revenue is splitbetween the Bus Company and the Trolleybus Company.
Economic instruments
BucharestEconomic instruments mentioned in the case study:
• obtaining financing from international financing bodies;
• lowering subsidies to 50 percent (this is possible onlywith further investments intended to reduce operationalcosts and improve the quality of service); and
• obtaining external financing such as loans for invest-ments in infrastructure
BudapestThe case study describes two alternate financing sources:
• Public-Private Partnership Programme - encouraging pri-vate sector financing for the operation and the develop-ment of urban transport; and
• Polluter Pays — Parking Management Programme, con-sisting of park-and-ride facilities, new parking garages,and the establishment of pedestrian-only zones.
VilniusNo economic instruments are discussed in the case
study.
O V E R V I E W O F T H E C A S E S T U D I E S
20 N E X T S T O P : S U S TA I N A B L E T R A N S P O R T
TABLE 10
Annual ticket revenue (million EUR)
Bucharest BudapestBus 14.86 no dataTram 14.79 no dataTrolleybus 3.28 no dataTotal 32.94 134.51
TABLE 11
Amount of municipal budget allocatedfor public transport (million EUR)
Bucharest BudapestOperations 77.45 no dataInvestments 21.39 no dataTotal 98.84 62.84Percent of local budget 32% 10%

N E X T S T O P : S U S T A I N A B L E T R A N S P O R T 21
Part 1Public Transport — Status,
Priority Problems and Needs

22 N E X T S T O P : S U S T A I N A B L E T R A N S P O R T

General data Location, population
The historic city of Sofia is situated in southwest Bul-garia. The area governed by the Sofia Municipal Authorityis 1,194 square kilometres, of which 245 square kilometresare populated territories, 510 square kilometres are agricul-tural areas, 40 square kilometres are covered by water and467 square kilometres are forested. The area enclosed by theSofia ring road is 198 square kilometres, of which 20.9square kilometres are served by public transport.
The population of Sofia has changed dynamically, accordingto census data collected by the National Statistics Institute (NSI).It reached 1,177, 577 inhabitants in 2001, compared to 30,928 in1887 and 1,182,698 in 1992. The number of temporary residentsof the capital, such as students, commuting workers and for-eigners is 150,000-300,000. Thus, the number of Sofia residentscurrently exceeds 1.4 million, which is approximately one-sixth ofthe total population of the country. In the coming five years noserious changes in population levels are expected. An NSI fore-cast of demographic trends foresees a stabilisation of Sofia’s pop-ulation at approximately 1.2 to 1.3 million inhabitants in 2030.
The population density of the capital has also increasedfrom 826 people per square kilometre in 1980 to 918 in 1989and to 1,050 in 2000. The latest figure greatly exceeds thecountry’s average of 73.4. According to this indicator, Sofiais one of Europe’s most densely populated cities, but thecity is not overly compact due to disproportionally higherdensities in some peripheral regions. The majority of inhab-itants live in densely populated areas (73 percent in districtsof more than 1,500 people per square kilometre). The aver-age distance from the centre of the city is 4.4 kilometres perperson at a deconcentration index of 1.15.1.
The capital is an attractive place to live because of com-paratively low unemployment rates of 3.45 percent in 1998and 4.47 percent in 2000, while the average rates for thecountry were 12.2 percent in 1998 and 17.9 percent in 2000.The city also offers better work opportunities and highersalaries. The average annual salary in Sofia was BGN 2,525
in 1998 (EUR 1 = BGN 1.94) and BGN 3,245 in 2000, whichexceeded the average annual salary for the country by 13 to15 percent (BGL 2,199 and BGL 2,856) respectively.
Transport infrastructure Transport infrastructure covers 21 square kilometres in all.
The transport-communications system is built on the radial-circular principle, with distinct rings and incoming-outgoinghighways. Large residential districts are connected to the cen-tral part of the city and industrial regions via several maindiagonal roads. Some 75 to 80 percent of the total number ofdaily travellers in the city pass through the city centre.
This is a serious problem lacking a solution. The popula-tion outside of the ring road is serviced by Mass Public UrbanTransport (hereafter, MPUT) and Bulgarian Railways (BDZ).The length of the road network is 3,400 kilometres, of which422 kilometres are a main street network. Intersections areusually on a single level, although the infrastructure includes66 pedestrian underpasses, two pedestrian overpasses and 28automobile overpasses and underpasses. The busiest streetcrossings are equipped with traffic lights, 245 in all, of which65 are connected to an automated management system(AMS). The remaining 180 are on local regimes. Traffic inten-sity is marked by clear morning and evening peaks, with traf-fic jams in the centre of the city. There are major problems inparking and stopping in the central part of the city, due toinsufficient parking lots and garages. Traffic on the mainstreet network is one-way, with the exception of PartiarhEvtimii Boulevard, V. Levski Boulevard and riverbank boule-vards. Traffic on secondary streets in the centre is one-way.Access of heavy trucks and buses to the centre is restricted,except for the electrical transport of MPUT.
Sofia is Bulgaria’s most important transport node inview of its role as the capital and its geographic location —a point where three trans-European corridors (4, 8 and 10)cross. These factors determine the high intensity of incom-ing and outgoing traffic, as well as the level of local andinternational freight and passenger traffic.
N E X T S T O P : S U S T A I N A B L E T R A N S P O R T 23
Sofia, Bulgaria

Inter-city communications and trafficThree main road connections cross the territory of Sofia:
• E79 and the Hemus motorway, running north-south;
• E80 and the Trakia motorway, running northwest-south-east; and
• E871 running east-west.
The average daily intensity of traffic in these sections ofthe National Road Network (NRN) is among the highest inthe country:
• E79 (or I-1) between Sofia and Pernik – 28,888 vehiclesper 24-hour period;
• Hemus between Sofia and Botevgrad – 14,000 vehiclesper 24-hour period;
• Trakia between Sofia and Ihtima – 13,000 vehicles per24-hour period;
• E80 (or I-8) between Sofia and Kalotina – 5,000 vehiclesper 24-hour period; and
• E871 (or I-6) between Sofia and Pirdop/Zlatitza – 7,000vehicles per 24-hour period.
The extensions of these NRN roads within town bound-aries also form a part the main street network:
• Botevgradso Shosse (Vladimir Vazov Boulevard) andTzar Boris III Boulevard (Gornobanki pat);
• Tzarigradsko Shosse (Plovdsivsko Shosse andSamokovsko Shosse); and
• Slivnitza Boulevard and Evropa Boulevard.
The latter group receives the major part of incomingand outgoing road traffic in Sofia and is often subject totraffic jams.
Transit freight and passenger traffic is diverted to theSofia Ring Road (II-18) which has a total length of 61 kilo-metres and also takes part of the city traffic. The road ismostly single-lane, and its traffic capacity is largely exhaust-ed. In some sections the average daily intensity variesbetween 10,000 and 20,000 vehicles.
Especially difficult is the situation at the south arc of thering road, 20 kilometres of which pass very near or throughthe residential districts of Gorubliane, Mladost 4, Malinovadolina and Knyajevo.
Just as problematic is the situation along GornobankiPat (E79 and E871) where the Sofia Ring Road meets Vla-daya. This section goes along the Vladaiska River, parallel tothe Sofia–Pernik railway and through a limited space bor-dered by a densely built-up residential district. The road alsotakes urban traffic, MPUT routes (including tram lines), aswell as incoming and outgoing road traffic, of which almost50 percent is lorries.
Plans for the future development of Sofia’s roads envisage:
• inter-city communications;
• reconstruction of the northern arc of Sofia Ring Road tomotorway capacity; and
• construction of the 16-kilometre Ljulin motorway, whichis to take transit traffic f low from the north and north-west to the south.
The elaboration of designs for these sites and a search forsuitable financial sources are in progress.
Intra-city street networkThe street network of Sofia is 3,400 kilometres in total
length and represents about 5.2 percent of the city’s territory. As defined in the Law on the Organisation and Zoning
of Territories, the street networks of settlements consist of:
• a primary street network, which includes fast urbanmotorways (class I), urban motorways (class II), regionalroads (class III), and main streets (IV class); and
• a secondary street network, which includes collectingstreets (class V) and attending streets (class VI).
The basic carrier of mass public urban transport is themain street network. Its total length is 421 kilometres, ofwhich urban motorways are 128 kilometres; regional roads139 kilometres; and main streets 154 kilometres. The sec-ondary street network directly serves residential areas andbrings motor traffic to streets of higher classes.
The structure of the Sofia street network is radial-circu-lar and ref lects its historical development. In the central partof the city, which is also the historical centre, most of thestreets are narrow and do not provide the appropriate con-ditions for MPUT traffic.
The innermost ring surrounds that part of the city whichis accessible only by MPUT trams and trolleys. The ring isformed by Slivnitza, Skobelev, Patriarh Evtimmii and Levskiboulevards. The primary, fast urban motorways of Tzari-gradsko Shosse, Tzar Boris III, Botevgradsko Shosse andSlivnitza (Evropa) begin from this ring.
The second ring is formed by Konstantin VelichkovBoulevard, the recently opened extension of DimitarNestorov Boulevard (which has considerably eased north-bound and southbound traffic from the west side of the citycentre) and Bulgaria Boulevard. The next ring is formed byJitnitza Street and Gotze Delchev, Vaptzarov, Yavorov andSitniakovo boulevards. The fourth runs along TodorKableshkov and G. M. Dimitrov boulevards, and the outer-most ring is the Sofia Ring Road.
The rings mentioned above are currently incomplete, butthe radial-circular concept for Sofia’s infrastructure develop-ment is the basis of elaboration for the capital’s new generaltransport-communications plan (with 130 separate transportzones), which is to replace the old master plan from 1961.
PA R T 1 : P U B L I C T R A N S P O R T — S TAT U S , P R I O R I T Y P R O B L E M S A N D N E E D SS O F I A
24 N E X T S T O P : S U S T A I N A B L E T R A N S P O R T

Physical restrictions on development and expansion
The only possibility for urban development is to the southof the city toward Vitosha Mountain. The northeast part is notsuitable for residential areas because of its proximity to theindustrial site at Kremikovzi. Only technical crops may begrown here. Westward expansion is not acceptable either,because the city’s development would occur at the expense offertile agricultural lands, which is prohibited by law.
MotorisationSofia saw its first automobile in 1896. The number of
vehicles registered by the end of 2000 in the capital was494,496, of which 90 percent were personal cars. For the past10 years the total number of registered motor vehicles hasincreased nearly four-fold. From some 150 vehicles per 1,000inhabitants in 1990, the ratio reached 600 vehicles per 1,000in 2000, which is considerably greater than the national aver-age (see Figure 1). This avalanche-like increase in motor vehi-cles in Sofia creates enormous difficulties. The existing trans-port network can barely handle the increased traffic, whichrequires major capital investment to keep up with the rate ofexpansion. This is virtually impossible.
An important feature of the automobile f leet is the highaverage age: passenger cars are 15-16 years old. The f leetincreases by about 7,000 new cars each year in Sofia. The
trend is toward stabilisation of the number of vehicles in thenext few years, because a considerable number of old vehi-cles will be disposed of. Another reason for a decrease in theaverage age is that more new vehicles will be purchased.
MPUT organisationMPUT has a 100-year history. January 1, 1901 is consid-
ered the beginning of organised public transport in Sofia. Onthis date, six tramway lines with 23 kilometres of single trackserviced by 25 tramcars and 10 trailers were officially opened.
Today MPUT deals with the following modes of trans-port — tramways, trolleys, buses and the underground rail-way. Tram lines make up the backbone of the transportationnetwork, but the largest share of routes and passengers areserviced by bus transport. The total length of the MPUT net-work is 1,500 kilometres, including 1,250 kilometres of buslines, 145 kilometres of tram lines, 90 kilometres of trolleylines and 8.1 kilometres of underground.
MPUT is the primary mode of transport for the capital’spopulation. About 85 percent of those travelling within thecity use MPUT, which is a clear indication of the system’ssocio-economic significance.
Some 2,385,000 trips on public transportation aretaken each weekday — 650 million trips per year. Tramwaytransport consists of 16 lines, along which 190 tram unitsrun daily, servicing 28 percent of total trips in Sofia. Trol-
PA R T 1 : P U B L I C T R A N S P O R T — S TAT U S , P R I O R I T Y P R O B L E M S A N D N E E D SS O F I A
N E X T S T O P : S U S T A I N A B L E T R A N S P O R T 25
Number of passenger cars per 1,000 inhabitants
FIGURE 1
400
350
300
250
200
100
50
0
150
1990 1992 1994 1996
Bulgaria
Sofia
1998 2000

ley transport consists of 10 routes with 110 trolleys, whichservice 12.7 percent of total daily trips. There are 95 busroutes with 677 buses, which cover 56 percent of total dailytrips (including 47 percent in the centre and 9 percent inthe suburbs). The underground is 8 kilometres long andhas seven stations connecting the district of Lulin to thecentre of the city. It uses 10 metro units and services daily3.3 percent of total trips. These are the main types of pub-lic transport in Sofia.
In 1999 a supplementary transport mode withminibuses, called “route taxis,” started in Sofia. Currently,48 lines operate with 26 private carriers and daily use of357 route taxis. Their services represent 90,000-95,000 tripson weekdays.
Authorities and their responsibilitiesThe Sofia Municipality runs MPUT for the capital
and its suburbs. The municipality bears political respon-sibility for properly managing this signif icant public serv-ice. The authorities at various levels of regulation andtheir functions are presented in Figure 2. The main repre-sentatives of MPUT’s institutional framework and theirmajor functions are:
At the strategic level, the Sofia Municipal Council isresponsible for the following:
• determination of strategies for the development of pub-lic transport;
• approval of annual budgets for MPUT (transport respon-sibilities for all operators);
• approval of financing compensation to MPUT for itspreferentially tariffed tickets;
• tariff policies;
• approval of programmes for investments in transportcommunications;
• planning and coordination of transport on municipalityterritory; and
• announcement of tenders for transport services.
The permanent commission for transport, infrastructureand traffic safety is responsible for the following:
• legislative initiative for proposals on transport policy.
At the tactical level, the Transport Directorate is responsiblefor the following:
• tendering;
• issuing licenses for supplementary route operations,taxis, incidental and special transport, inter-city andinter-district transport;
• coordination of changes in MPUT routes; and
• coordination of projects for the permanent organisationof traffic.
Also at the tactical level, SKGT-Holding AD is responsi-ble for the following:
• central realisation and allocation of revenues, manage-ment of the ticket system;
• analysis, control and evaluation of operations;
• financing and allocation of compensation among trans-port operators;
• surveys concerning MPUT and travel demands; and
• centralised specialised services such as marketing, roadinformation, advertising and consulting services.
At the operational level, transport operators consist ofthe following:
• SKGT Autotransport (bus transport);
• SKGT Electrotransport (tram and trolley transport);
• Metropolitan AD (underground transport); and
• private bus operators (public transport of passengersalong detached MPUT bus routes).
These operators are responsible for the following:
• management and control of service quality; and
• maintenance and repair of the vehicle f leet (rolling stock,catenary, railway, etc.).
Legal frameworkThe legal and regulatory framework that determines the
activities of MPUT in Sofia consists of several significantnormative documents:
Related laws include the following:
• Local Government and Local Administration; publishedin the State Gazette (SG), No. 77/September 17, 2001,amended No. 1/January 1, 2001;
• Municipal Property, published in SG No. 44/May 21,1996, amended No. 34/2001;
• Public Procurement, published SG No. /June 6, 1999,amended No. 97/November 28, 2000;
• Road Traffic, published SG No. 20/March 3, 1999, lastamended No. 1/January 4, 2000;
• Roads, published SG No. 26/March 29, 2000, amendedNo. 111/December 28, 2001; and
• Environment Protection, published SG No. 86/October18, 1991; amended No. 1/January 2, 2001.
PA R T 1 : P U B L I C T R A N S P O R T — S TAT U S , P R I O R I T Y P R O B L E M S A N D N E E D SS O F I A
26 N E X T S T O P : S U S T A I N A B L E T R A N S P O R T

PA R T 1 : P U B L I C T R A N S P O R T — S TAT U S , P R I O R I T Y P R O B L E M S A N D N E E D SS O F I A
N E X T S T O P : S U S T A I N A B L E T R A N S P O R T 27
Related regulations include the following:
• Regulation 33 on public transport of passengers andfreight on the territory of Bulgaria;
• Regulation on passenger transport and conditions fortravelling via MPUT within the territory of the SofiaMunicipality, which was approved by the Sofia Munici-pal Council in Resolution 36, Protocol 8/March 14,2002, amended by Resolution 1, Protocol 10/April 4,2000, amended further by Resolution 3, Protocol11/April 27, 2000;
• Regulation of the proper public use of transport withinthe territory of the Sofia Municipality established in Res-olution 1 by Protocol 33/July 28, 1993, amended withResolution 3 by Protocol 13/June 26, 2000; and
• Regulation on public passenger transport along routessupplementary to the municipal transport network with-in the territory of the Sofia Municipality, approved bythe Sofia Municipal Council in Protocol 55/March 8,1999, based on Article 21, Article 22 of the Law on LocalSelf-Management and Local Administration (LLSMLA),item 6 and 11 from Regulation 33.
MPUT organisational structure
FIGURE 2
Strategic level
SKOT-Holding managesincome of vehicle sales,
centralised control system,supervision of affiliates
Operational levelTransport operators are responsible for
contracted provision of specific PUT services in theCommercial Act, management and control
MPUT MPUT: Annual BudgetDevelopment strategy
Transport Directorate:Implementation of MPUT
policy, assignment of transportservices, tendering
Private bustransport
Minibusoperators
Electro-transport
Bustransport
SKOT-Holding
TransportDirectorate
MAYORTRANSPORT
COMMISSION
MUNICIPALITY
Deputy Mayor
Metropolitan
Political level(policy, budget, strategy)

The Law on Municipal Property regulates the statutes ofmunicipal companies as entities specialised in satisfying theneeds of the population and ensuring the execution ofmunicipal activities and the related supply of goods andservices, including transport services. The Municipal Coun-cil approves the annual budget of municipal companies.
SKGT Holding AD, SKGT Autotransport AD, SKGTElectrotransport AD and Metropolitan AD are commercialcompanies with municipal property and owned by the SofiaMunicipal Council (100 percent of SKGT Holding, andMetropolitan and 66 percent of the daughter companiesAutotransport and Electrotransport).
According to LLSMLA, the Sofia Municipal Council maytake decisions on reorganisation, make changes in capital struc-ture, determine system- and management structures, and definetransport functions and the conditions for transporting passen-gers. The mayor may exercise these rights on behalf of the SMC.
Under the regulation on passenger transport, the SMCdetermines the prices and conditions under which the trans-port operators of MPUT perform passenger transport bytram, trolley, bus, underground and other means of transport.The execution of passenger transport is assigned by the SofiaMunicipality to SKGT Holding AD, which organises thetransport of passengers for MPUT. It assigns to differenttransport operators the execution of these services via variousmodes of transport or detached parts of the MPUT network.
Annual budget, financingThe Sofia Municipality determines the economic frame-
work of MPUT regarding responsibilities, costs and revenues. The responsibilities of transport fall within the following
parameters:
• annual kilometre run;
• fuel consumption per kilometre run (specified by routenetwork);
• stops;
• vehicles (in sufficient numbers and in adequate condition);
• traffic intervals;
• route length;
• kilometre run;
• number of tours; and
• hours of service operation.
The costs of activities are determined from calculationson expenses, such as operation, salaries, maintenance andrepair. Capital investments and the creation of SKGT Hold-ing, its daughter companies and Metropolitan are providedseparately by the Sofia Municipality and are not included inthe above budget.
The sources of revenues are the following:
• ticket sales (handled centrally by the Centre for RevenueRealisation [CRC] and at service points by transport drivers);
• the Sofia municipal budget (compensation for preferen-tial travel by Sofia Municipality); and
• the state budget (compensation and subsidies).
Sofia Municipality compensates operators for so-called“social trips,” which include free-of-charge travel for pen-sioners, the disabled, and children and adults with debilitat-ing injuries travelling with a companion. Sofia Municipalityalso pays for discounted trips for pensioners and students.The state budget subsidises the travel of war veterans andofficers disabled during service. It also subsidises the travelof certain employees from various institutions such as thetax administration, the Ministry of Internal Affairs, the Sofiaarmy garrison, Parliament, the State Automobile Inspectionand the Bureau of Investigation. The total amount dependsupon the funds approved by the ministries of internal affairs,finance, education and justice.
In 2001 revenues from ticket sales amounted to 61.2 per-cent of the total. The CRC represented 51.2 percent; com-panies 10 percent. The Sofia Municipality provided com-pensation equal to 34.1 percent of total revenues; subsidiesfrom the state budget provided 4.7 percent.
The total costs for transport activities exceeded total rev-enues by 6 percent.
The principle that “the sponsor of preferentially tariffedtickets must pay the full amount of the price for travel” isa basic concept of the present mechanism for balancing thecosts of transport activities with revenues from the servicesprovided. Data for the period after 1998 shows that theimplementation of this principle has worked: revenuesfrom sales cover 94-98 percent of the costs of transportactivities. Thus, it is fair to say that MPUT operations areno longer subsidised. The social function of MPUT andimplementation of social policy are the responsibility ofthe municipality and the state, and are no longer trans-ferred to commercial companies.
Ticket pricesSofia Municipal Council sets ticket prices and the gener-
al tariff policy. MPUT tariffs are fixed and specific, and coversingle-trip tickets, daily passes and a large variety of otherpasses. There are also several free passes and discounts. Theframework of MPUT in Sofia sets the price of a single-tripticket at BGL 0.40 for all types of transport (bus, tram, trol-ley and subway) independent of location, distance travelledor time elapsed. In this sense there are no differential tariffs.Ticket prices for public transport are always a touchy subject.
The recommended formulation of price (based on themarket principle for an economy in transition) is still diffi-
PA R T 1 : P U B L I C T R A N S P O R T — S TAT U S , P R I O R I T Y P R O B L E M S A N D N E E D SS O F I A
28 N E X T S T O P : S U S T A I N A B L E T R A N S P O R T

PA R T 1 : P U B L I C T R A N S P O R T — S TAT U S , P R I O R I T Y P R O B L E M S A N D N E E D SS O F I A
N E X T S T O P : S U S T A I N A B L E T R A N S P O R T 29
cult to apply with regard to MPUT in Sofia. However, pric-ing methods have changed considerably during transitionunder the recovery programme and the transformation ofoperational divisions into commercial companies. This dif-ference is definitely a decisive step towards the financial sta-bilisation of public transportation services.
The formulation of a unit price is pursuant to the prin-ciple of balancing activity costs with service revenues. Afterevaluating expected costs for services and estimating theannual number of trips, the price for a single trip is deter-mined by dividing the total cost by the total number oftrips. A price calculated according to this method allows theanticipated revenues from ticket sales to cover activity costs.In this case, a preliminary calculation of necessary, inherentcosts is the basis for sound price formulation and for fol-lowing basic market principles.
As far as municipal support for MPUT in the capital isconcerned, this is a serious matter for the SMC. The coun-cil pays 12-14 percent of its annual revenues in compensa-tion for preferentially tariffed trips.
The capital costs for vehicles and transport infrastructure area substantial budget item as well — the amount of which variesgreatly, depending on investment programmes over a given peri-od. From 1998-2000 the funds for this purpose represented 20-24 percent of the total self-generated revenues of the munici-pality (in addition to loans and foreign financing sources).
MPUT system management and control
Management and control of MPUT operations are per-formed by the Central Dispatching Centre (CDC) and itsdivisions — the dispatching centres for the management ofbus, tram, trolley and underground transport.
There is no unified, automated system for traffic man-agement (ASTM) for the whole MPUT. Bus transport ismanaged entirely by an ASTM based on radio communica-tions. Tramway transport at Iskar depot is part of an ASTMbased on global positioning system (GPS) communications(see Annex 1). Summarised information from all modal dis-patching centres goes to the CDC. MPUT is in extremeneed of an ASTM covereing the entire system’s transportprocess.There is a proposal to augment coverage of theASTM from Iskar depot to other tramway depots, then toinclude trolleybus depots and replace the bus system’s cur-rently operating ASTM.
Bus transportBus transport services on MPUT routes are provided by
the municipal company SKGT Avtotransport AD, and pri-vate operators as well.
SKGT Avtotransport ADSKGT Avtotransport AD is an affiliate of SKGT Hold-
ing, which owns 34 percent of total shares. The remaining 64percent are held by Sofia Municipality. The current structureof the company includes the operational divisions AT1 Zem-liane, AT2 Malashevtci, AT3 Drujba and AT4 Republica.
Fleet structure and production programmeThe number of route lines operated by SKGT Avto-
transport was 99 in 2000, 97 in 2001 and 95 in 2002. Thetotal length of bus routes within the last three years isbetween 1,100 and 1,250 kilometres.
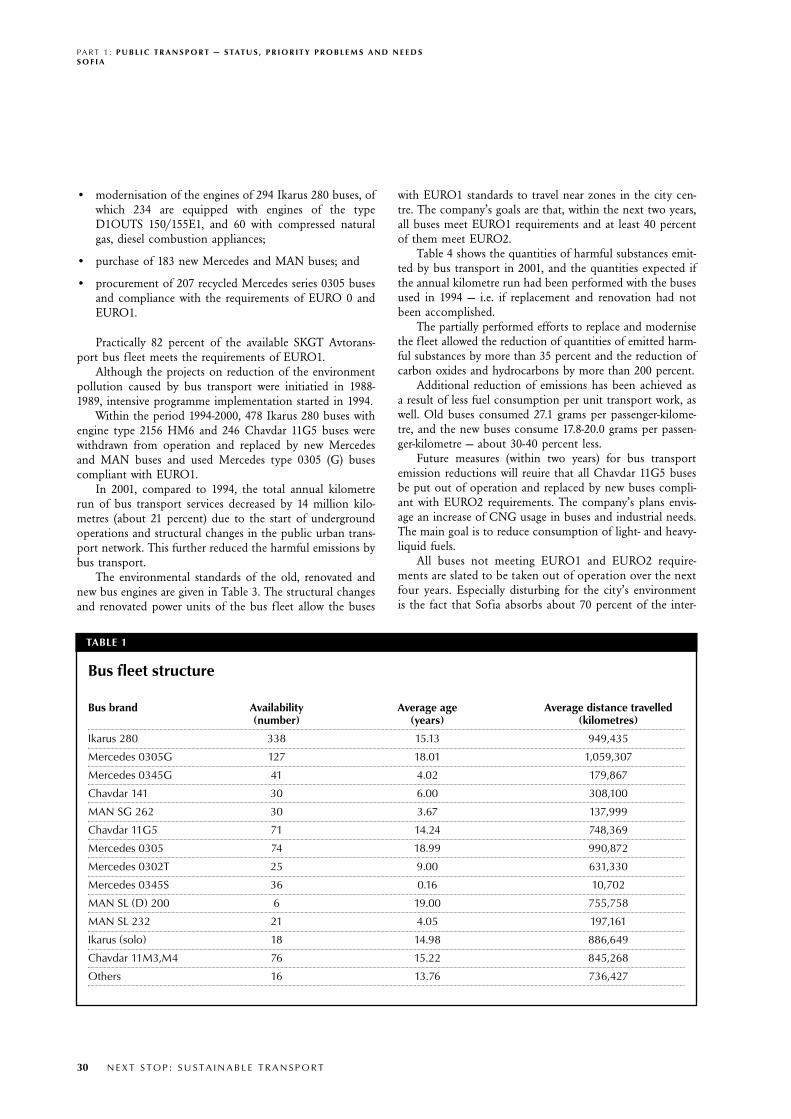
The bus f leet operated by SKGT Avtrotransport num-bers 817 buses in all, of which 566 are articulated. Accordingto the operational plan for 2002, the number of buses oper-ated daily on MPUT routes and providing support activities(repair and personnel services) is 677. The company operates92 single buses for non-MPUT services (i.e. tourist services).The bus f leet structure can be seen in Table 1.
The average operational speed of MPUT bus transportfor the year 2001 was 19.4 kilometres per hour.
Notwithstanding f leet renewal during the last few years,the average age of f leet vehicles is still high: 13.8 years forarticulated buses and 15.2 for single buses.
Since the second half of 2001, three of the company divi-sions perform transport services on MPUT routes and one fornon-MPUT services. Total company transport activity, meas-ured in kilometres run and actual operational costs of dieselfuel, can be seen in Table 2.
Programmes and measures to reduce harmfulemissions from SKGT Avtotransport buses
The SKGT Avtotransport programme for the reductionof harmful impact on the environment caused by MPUTbuses comprises a gradual operational withdrawal of old,obsolete bus brands like the Ikarus 280 and Chavdar 11G5.
The programme is focused on the following:
• fleet upgrading with buses that are compliant with Euro-pean legislation on harmful emissions from engines;
• use of alternative gas fuels for obsolete engines, mainlyfor the Ikarus 280 buses (the first projects were carriedout in 1990-91); and
• replacement of obsolete power units with new onesmeeting EURO1 and EURO2 requirements (the firstprojects were carried out in 1994).
Since 1992, under projects financed by the Sofia Munic-ipality and the Ministry of Environment and Water (MEW)through the National Fund for Environment Protection(NFEP) and funds from European Union pre-accession pro-grams 57 percent of the available bus f leet has been replacedand modernised, namely through:
• modernisation of the engines of 294 Ikarus 280 buses, ofwhich 234 are equipped with engines of the typeD1OUTS 150/155E1, and 60 with compressed naturalgas, diesel combustion appliances;
• purchase of 183 new Mercedes and MAN buses; and
• procurement of 207 recycled Mercedes series 0305 busesand compliance with the requirements of EURO 0 andEURO1.
Practically 82 percent of the available SKGT Avtorans-port bus f leet meets the requirements of EURO1.
Although the projects on reduction of the environmentpollution caused by bus transport were initiatied in 1988-1989, intensive programme implementation started in 1994.
Within the period 1994-2000, 478 Ikarus 280 buses withengine type 2156 HM6 and 246 Chavdar 11G5 buses werewithdrawn from operation and replaced by new Mercedesand MAN buses and used Mercedes type 0305 (G) busescompliant with EURO1.
In 2001, compared to 1994, the total annual kilometrerun of bus transport services decreased by 14 million kilo-metres (about 21 percent) due to the start of undergroundoperations and structural changes in the public urban trans-port network. This further reduced the harmful emissions bybus transport.
The environmental standards of the old, renovated andnew bus engines are given in Table 3. The structural changesand renovated power units of the bus f leet allow the buses
with EURO1 standards to travel near zones in the city cen-tre. The company’s goals are that, within the next two years,all buses meet EURO1 requirements and at least 40 percentof them meet EURO2.
Table 4 shows the quantities of harmful substances emit-ted by bus transport in 2001, and the quantities expected ifthe annual kilometre run had been performed with the busesused in 1994 — i.e. if replacement and renovation had notbeen accomplished.
The partially performed efforts to replace and modernisethe f leet allowed the reduction of quantities of emitted harm-ful substances by more than 35 percent and the reduction ofcarbon oxides and hydrocarbons by more than 200 percent.
Additional reduction of emissions has been achieved asa result of less fuel consumption per unit transport work, aswell. Old buses consumed 27.1 grams per passenger-kilome-tre, and the new buses consume 17.8-20.0 grams per passen-ger-kilometre — about 30-40 percent less.
Future measures (within two years) for bus transportemission reductions will reuire that all Chavdar 11G5 busesbe put out of operation and replaced by new buses compli-ant with EURO2 requirements. The company’s plans envis-age an increase of CNG usage in buses and industrial needs.The main goal is to reduce consumption of light- and heavy-liquid fuels.
All buses not meeting EURO1 and EURO2 require-ments are slated to be taken out of operation over the nextfour years. Especially disturbing for the city’s environmentis the fact that Sofia absorbs about 70 percent of the inter-
PA R T 1 : P U B L I C T R A N S P O R T — S TAT U S , P R I O R I T Y P R O B L E M S A N D N E E D SS O F I A
30 N E X T S T O P : S U S T A I N A B L E T R A N S P O R T
TABLE 1
Bus fleet structure
Bus brand Availability Average age Average distance travelled(number) (years) (kilometres)
Ikarus 280 338 15.13 949,435
Mercedes 0305G 127 18.01 1,059,307
Mercedes 0345G 41 4.02 179,867
Chavdar 141 30 6.00 308,100
MAN SG 262 30 3.67 137,999
Chavdar 11G5 71 14.24 748,369
Mercedes 0305 74 18.99 990,872
Mercedes 0302T 25 9.00 631,330
Mercedes 0345S 36 0.16 10,702
MAN SL (D) 200 6 19.00 755,758
MAN SL 232 21 4.05 197,161
Ikarus (solo) 18 14.98 886,649
Chavdar 11M3,M4 76 15.22 845,268
Others 16 13.76 736,427

city bus transport services performed, according to thenational transport scheme. Every day, 1,000 buses enter andleave the vicinity of the central part of the city. An adequatesolution for the problem of bus stations is still to be found.
Private bus operatorsThe first open public procurement procedure to assign an
operator for MPUT requirements on 16 detached bus lines wasannounced in 2001. The tender is based on the Law on PublicProcurement, Regulation No. 33 of MTC for Public TransportHaulage, and the Regulation of the Sofia Municipal Councilfor MPUT Passenger Haulage in Sofia. The assignment is for afive-year period, and it defines the route line, schedule,timetable and transport task for the annual kilometre run. Thetender price of fuel consumption per kilometre is offered bythe transport operators and is approved with the assignment.Payment is based on consumption for the actual distance trav-
elled in kilometres (kilometre run) and the approved price.The level of haulage prices for different types of tickets
(including season tickets) and conditions for MPUT usageare specified by the Sofia Municipal Council in accordancewith the regulation for MPUT passenger haulage on the ter-ritory of Sofia municipality.
Bus characteristics and relevant requirements depend onthe specific route line. According to ranking methodology,applicant evaluations are based on set criteria and a scoringsystem. Concerning vehicle age, buses more than 10 yearsold are not allowed to be used. The environmental require-ments are very strict as well, based on Regulation N 33,Chapter 3. Buses with engines covering EURO2 and EURO1standards score higher.
Three of the seven private operators assigned to certaindetached route lines are in operation. One company, CaratC, operates two route lines using eight Mercedes Benz 0345buses, of which seven are on line — representing a utilisation
PA R T 1 : P U B L I C T R A N S P O R T — S TAT U S , P R I O R I T Y P R O B L E M S A N D N E E D SS O F I A
N E X T S T O P : S U S T A I N A B L E T R A N S P O R T 31
TABLE 2
KGT Avtotransport transport activity
Indicators1999 2000 2001
Actual distance travelled, 60,039,940 57,530,428 54,517,950in kilometres (km)
Actual fuel consumption, 25,465,479 23,866,289 21,978,909in litres
Actual fuel consumption, 42.41 41.48 39.89in litres/100 km
Actual consumption of 227,760 191,746 60,996lubricants, in litres
TABLE 3
General technical and environmental indicators of old, renovated and new modern enginesTechnical Values of environment indicators, grammes/kilowatt-hourenvironmental indicators
EURO 1 EURO 2 Old diesel Old gas-diesel* Modernstandard standard engine* engine** engine***
CO 4.50 2.40 11.37 4.02 0.61
CH4 1.10 1.10 5.12 1.17 0.36
NOX 8.00 7.00 14.30 5.26 7.43
Particles 0.36 0.15 0.55 0.15 0.13
Notes:* engine D 2156 HM6u** engine D 2156 HM6u equipped with CNG combustion appliance *** new modern engines

ratio of 87.5 percent. Eridantrans operates two lines with 13Den Oudsten buses, of which 11 are on line with a utilisa-tion ratio of 84.62 percent.
SKGT Avtotransport is assigned as external operator of 26-kilometre Line 111, serviced by 27 Mercedes 345S100 buses. Theexpected total annual kilometre run included in the transportresponsibilities for private bus operators is 9.954 million kilo-metres, which represents an impressive 19 percent of the totalkilometre run of total bus transport. The fact that these are rel-atively long routes should be taken into account, however.
The opening of the transport market to private operatorsand tender-based service assignments are also movementstoward the incorporation of market principles and mecha-nisms into MPUT in Sofia.
Electrical transportTram transport
The total length of the existing tram network in Sofia is209 kilometres, of which 169 kilometres are single track witha gauge of 1,009 millimetres, and 39 kilometres of singletrack with a gauge of 1,435 mm.
Some 536 tram turnouts are in operation, of which 244are on open-air tracks and 292 are in tram depots. The lengthof the tram catenary network is 277.5 kilometres.
Vehicle distribution by type of tramcar and depot byDecember 31, 2001 is presented in Table 5.
The utilisation ratio of the vehicles in tram transport israther low at 58.54 percent for the first quarter of 2002. Thisunderscores the great necessity to overhaul a large part of thevehicles, as well as the high level of defectiveness.
Overhaul necessity for rolling stockFor trams with a gauge size of 1,009 millimetres and the
established norm of 120,000-150,000 kilometres, the numberof vehicles in need of overhaul is 47 vehicles (or, 18 percent).The most common type of tram car is the T8M-730 (76.9
percent), which has grown obsolete: most of these cars havebeen overhauled five times or more. For those trams with agauge size of 1,435 millimetres, the overhaul necessity rateexceeds 57 percent. This concerns mainly those cars manu-factured in Germany.
SKGT Tramcar has begun repairs on Czech tramcartypes T6A2 and T6B5.
Bulgarian trams require modernisation due to their highrate of defectiveness. It is expected that, within a three-yearperiod, up to 90 Bulgarian trams will be renovated. Renova-tion consists of overhauling management (electronic), brakesystems and interiors. The mono-articulated trams are length-ened with a middle low-f loor section, equipped with an auto-matic platform for wheelchairs.
Rail trackTram tracks are an important and indivisible part of
urban electric transport, and the appearance of the citydepends on tram tracks to a great extent. The world trendsin this field are:
• construction of tram tracks with anti-vibration and anti-noise elements, which will provide more comfort for pas-sengers and greater peace of mind for local residents(such types of track are especially adapted for streets withmixed-vehicle traffic); and
• construction of detached tracks upon which tram trafficacts independent of other traffic, and with traffic lightsgiving priority to tram traffic.
While detached tram tracks are appropriate for peripher-al residential areas (both environmentally and financially), itis extremely important for the city centre that the old tramtracks be replaced with the type creating less noise and vibra-tion. For this reason, 35-40 kilometres of old track needreplacement within the next three years.
For the period 1990–1998, substantial changes in quanti-ty and quality of tram track reconstruction have not been
PA R T 1 : P U B L I C T R A N S P O R T — S TAT U S , P R I O R I T Y P R O B L E M S A N D N E E D SS O F I A
32 N E X T S T O P : S U S T A I N A B L E T R A N S P O R T
TABLE 4
Annual emissions by buses in 1994 and 2001 (in tonnes)
Emission 1994 2001
CO 4,565.7 2,127.9
CH4 2,177.0 1,124.8
NOX 5,756.3 4,782.5
Particles 226.3 177.0
Total 12,725.3 8,212.2
Note: The calculation of emissions in grams per kilometre is based on an average operational speed of 18.5 kilometres per hour.

reported. Since 1998, a lot of reconstruction work has beendone (e.g. along the boulevards Christo Botev, Maria Luisa,Alabin Street, Scopie Street, Haidut Sider Street, Voskresse-nie Boulevard, Cherni Vrah Boulevard between Koshariteand Hladilnika, Tzar Boris III Boulevard between Shipka Sta-tion and Knjagevo), which has considerably improved thecondition of tram tracks.
Trolleybus transportThe total length of the existing trolleybus network is 257
kilometres. The length of the trolleybus catenary network is205.7 kilometres. The number of trolleybus routes was 10 in2002, and services were carried out by 157 trolleybuses.
Vehicle distribution by December 31, 2001 by type oftrolleybus and by depot is presented in Table 8.
The utilisation rate of the vehicles of trolleybus transportwas 72 percent for the first quarter of 2002. This is an indi-cator of the necessity for urgent replacement with new vehi-cles in order to operate the route lines normally. This doesnot preclude the need for vehicle overhaul, considering that75 percent of the vehicles are between 12 and 18 years old.The distance traveled by the vehicles exceeds 600,000 kilome-tres. Most have already had one overhaul, but these shouldtake place at least once every 200,000 kilometres. ZIU-682-type trolleybuses are the main problem. They are obsolete, inpoor condition, and 91 percent of them must be overhauled.
PA R T 1 : P U B L I C T R A N S P O R T — S TAT U S , P R I O R I T Y P R O B L E M S A N D N E E D SS O F I A
N E X T S T O P : S U S T A I N A B L E T R A N S P O R T 33
TABLE 5
Vehicle distribution
Gauge (mm) Type Depot Total tram cars
CrasnaPoljana Banishora Iskar
1,009 mm gauge
T8M – 730 Sofia70 13 13
T8M – 300 BG 1300 11 15 26
T8M – 700M 38 38
T8M – 503 1 1
T6M – 400 Sofia 100 36 21 57
T6M – 700 55 55
T4D – Cz(D)74 18 18
T6A2 – Czech Republic 57 57
Total 1,009 mm 135 130 265
1,435 mm gauge
T6M – 400 1 1
T6MD – 1000 24 24
T6B5 – Czech Republic 37 37
T4 – 201 Germany 2 2
T4 – 205 Germany 9 9
T6 – 231 Germany 10 10
T8 – 401 Germany 7 7
P4 – 280 Germany 9R 9R*
Total 1,435 mm 90+9R 90+9R
1,009 mm gauge
Training T6M – 400 1 1
Total training 1 1
Tram cars 136 130 90+9R 356+9R
*R= repair work

For the last 12 years, only three new vehicles have entered intooperation — two of them in 1990 and one in 1997. A pro-gramme for recycling the fleet of Ikarus 280T trolleybuses andtheir renovation is underway.
Metro The reason for the start of metropolitan construction in
Sofia is the sharply increased need for high-speed, off-streetMPUT transport. First, high-density road traffic and narrowstreets have led to sharp reductions in MPUT speeds (lessthan 15 kilometres per hour during peak hours and less than10 kilometres per hour in the centre of the city). Second, dueto the fact that large residential areas are located away fromthe centre, substantial passenger traffic f lows are generatedbetween the peripheral and central areas. Third, air pollutionis increasing to unacceptable levels because of thickeningtraffic and traffic jams.
According to the general plan of metro lines adopted bythe Council of Ministers, Sofia’s metropolitan area followsthe design of a classical, diametrical-type scheme for townswith 1.5-2.0 million inhabitants. The underground is plannedto consist of three lines, which will cross and form a trian-gle in the city centre to form key metro stations at SvetaNedelja Square, St Kliment Ohridski near Sofia University,
and a third in front of the National Palace of Culture. Thelength of the first line connecting the three residential com-plexes — Obelja, Ljulin and Mladost — will be 21 kilometreswith 17 metro stations. The length of the second line, run-ning from Hladilnika to the National Palace of Culture andon to the Central Railway Station and the Nadejda residen-tial complex, will be 18 kilometres with 16 metro stations.The third section between Kniajevo and Poduene will be 16kilometres long with 15 metro stations. The total length ofmetro lines will be 52 kilometres with 48 metro stations.After completion of the final construction stage, the metrowill serve over one million passengers per day.
The passenger-flow capacity of MPUT ground transporta-tion along the planned metro lines reaches 30,000-40,000 pas-sengers per hour, with the passenger flow along the first metroline being the largest. Only the metro has the capacity to pro-vide high-speed transport services for such passenger flows (upto 50,000 passengers per hour) while tram, bus and trolleybustransport have smaller capacities — 5,000 and 4,000 passengersper hour, respectively. For example, the trip duration using theexisting ground transport between Ljulin and the centre is 40minutes during peak hours, but is only eight minutes bymetro. The current average trip duration between Ljulin andMladost is 90 minutes for peak hours and, according to themetro schedules, is expected to fall to about 18 minutes.
PA R T 1 : P U B L I C T R A N S P O R T — S TAT U S , P R I O R I T Y P R O B L E M S A N D N E E D SS O F I A
34 N E X T S T O P : S U S T A I N A B L E T R A N S P O R T
Trams: age distribution
TABLE 6
Up to six years 17 (4.7 percent)
Between 6 and 12 years 105 (28.8 percent)
Between 12 and 18 years 141 (38.6 percent)
Between 18 and 24 years 58 (15.9 percent)
Over 24 years 44 (12 percent)
Total number 365
Average age 12 years
TABLE 7
Rolling stock distribution of tram cars by distance travelled (by thousand kilometres)
Up to 150 Up to 300 Up to 450 Up to 600 Up to 1,000 Up to 1,000 Total
Trams 59+2R 31+7R 12 104 126 24 356+9R
R – Underwent repairsCars not overhauled: 98Up to three overhauls: 171Up to five overhauls: 76Over five overhauls: 20

Operational schemeAccording to the underground plan, the first line to be
constructed is that with the largest passenger f low — the res-idential areas Ljulin and Mladost with the central part of thecity. The first section, between Ljulin and K. Velichkov Boule-vard, with a length of 6.5 kilometres and served by five metrostations, has been in operation since January 28, 1998. Metrostation 6, located between Opalchenska Street and ChristoBotev Boulevard, entered into operation in September 1999;and metro station 7 (Serdica) is located at Sveta NedeljaSquare and was opened in autumn 2000. The section betweenLjulin and Obelja, with a length of 1.8 kilometres, was putinto operation by the end of 2002. Thus, the inhabitants oftwo of the largest peripheral residential areas of about150,000 people will be 15 minutes from the city centre.
The general operational characteristics of the metro arethe following:
• 11 available metro units with four coaches;
• total availability — 48 coaches, manufactured in Russia1990-1991;
• operational speed — 90 kilometres per hour;
• average traffic speed — 41 kilometres per hour;
• average distance between stations — 1,100 metres;
• passenger capacity — 50,000 passengers per hour;
• traffic intervals — five minutes during peak hours andseven minutes for non-peak hours;
• minimum possible interval between sections — twominutes;
• hours of operation — 05:12 until 23:21 from MS7;
• costs per kilometre run — about BGN 10; and
• annual distance travelled — 760,000 kilometres.
The metro has become a part of daily life for the capi-tal’s inhabitants, and the number of trips by metro hasgrown continuously, especially after stations 6 and 7 openedin the city centre. The number of trips was 1,666 million in1998, 2,811 million in 1999, 11,910 million in 2000 and20,851 million in 2001.
Supplementary minibus route lines: route taxisPassenger route transport services started in 1999 after
adoption of a Sofia Municipal Council regulation concern-ing supplementary route lines. The assignment of public pas-senger transport services on supplementary routes is tender-based, and the procedure is in accordance with requirementsof the Law on Public Procurement and the regulation of the
PA R T 1 : P U B L I C T R A N S P O R T — S TAT U S , P R I O R I T Y P R O B L E M S A N D N E E D SS O F I A
N E X T S T O P : S U S T A I N A B L E T R A N S P O R T 35
TABLE 8
Trolleybus distribution
Type Depot Total
Iskar Nadejda Levski
Ikarus – 280T 56 3 59
Ikarus – 280T 41 44 85
ZIU 682 1 3 4
ZIU 682 4 3 7
TC – 130 1 1
ZIU – training 1 1
Total 57 50 50 157
Age composition
Up to 6 years 1
Between 6 and 12 years 0
Between 12 and 18 years 156
Between 18 and 24 years 0
Over 24 years 0
Total 157
Note: The average age of trolleybuses is 14 years.

Sofia Municipal Council for passenger transport services onsupplementary route lines. The principle is that the munici-pality defines routes and timetables, while stops are by pas-senger request. Ticket pricing is based on market principles,depending on supply and demand. This is a matter of com-petition between the different operators, and the municipal-ity does not interfere with price regulation.
When elaborating the process of route approval, the fol-lowing factors are taken into account:
• Traffic should not be overloaded.
• The routes should not copy MPUT routes to any greatextent.
• Routes in capital areas should either improve transportwhere MPUT is insufficient or provide completely newconnections.
For the right to perform passenger transport services, eachoperator pays the municipality a monthly fee per bus in oper-ation. The contracts are valid for three years (expired in July2002). There is a proposal to extend the term by two years andthen establish a five-year contract period. The initial numberof route lines was 34 in 1999, 46 in 2000, and 48 in 2001.
At the moment, 26 private operators run 48 supplemen-tary route lines within Sofia, using 357 minibuses with acapacity of 16+1 passengers. The buses are of differentbrands and models, namely: Ford-Transit, Peugeot-Boxer,Citroen-Jumper, Renault-Master, CIA-Prejio, a small numberof IVECO, and various types of Mercedes — all of which areequipped with diesel engines — and GAZ-2705s (45 in all)with petrol engines and liquid propane gas appliances. All ofthe minibuses are equipped with a catalyser and meetEURO2 standards. Some meet EURO3 standards.
The f leet distribution by age is as follows:Passenger requirements related to the urban transport
service are, to a great extent, met by the options offered bythe system of route taxis, which are vehicles with low capac-ities and costs. They are fast, easy to handle, relatively envi-ronmental and capable of accessing small city streets.
These transport services have entered the capital’s MPUTsystem very quickly, and are especially welcome for fast trips
over long distances without the need to change modes oftransport. The minibus system currently serves 90,000-95,000people per day, which represents about four percent of totalweekday trips.
The approximate number of private-operated vehicles inSofia is:
• Up to one year: 40
• Up to two years: 42
• Up to three years: 260
• More than three years: 12
The average operational speed is about 23-25 kilometres per hour.
Vision for MPUT developmentThe long-term strategy and the major part of the Sofia
Municipality’s programme for public transport in the capi-tal are related to the construction of its underground railway.The most environmentally friendly form of transport, itcomplies with the requirements of noiselessness, safety,ambient air purity, traffic capacity and comfort, while at thesame time curbing city sprawl.
MetroIn a number of governmental decisions the “metropoli-
tan” has been announced as a project of national signifi-cance and a top priority in the programmes for economicassistance to the Republic of Bulgaria rendered by interna-tional financial and bank institutions.
Rapid extension of the first metro line towards the Mla-dost residential area is envisaged to ensure effective transportservice to the capital and connections of western and east-ern passenger f lows along the metro line.
Sofia’s environmental situation has deteriorated sharplyin recent years. Mass urban transport is one of the majorpolluters — contributing particulate matter and more than200 harmful substances and toxic emulsions into the ambi-ent air. The established average annual concentration levelsof dust in the air in the east-west direction (coinciding with
PA R T 1 : P U B L I C T R A N S P O R T — S TAT U S , P R I O R I T Y P R O B L E M S A N D N E E D SS O F I A
36 N E X T S T O P : S U S T A I N A B L E T R A N S P O R T
TABLE 9
Trolleybus distribution by distance travelled (in thousand kilometres)
Up to 200 Up to 400 Up to 600 Over 600 Total
Trolleybuses 4 3 32 118 157
Vehicles not overhauled: 8Up to one overhaul: 118Over one overhaul: 31

the f irst metro line) for the past 10 years have reached0.36-0.41 milligrams per cubic metre (mg/m3), which is farabove the maximum admissible concentrations (MAC) of0.15 mg/m3. Lead aerosol concentration in the air, measuredalong the same route, is 0.0008-0.0014 mg/m3 — severaltimes higher than the MAC of 0.0003 mg/m3. The forecastsand calculations show categorically that once the first line isset in operation, the concentration of dust and lead aerosolsalong the track will diminish MAC levels. This will be a seri-ous breakthrough in bringing the environmental situation inthe capital under control. A final report of the environmentimpact assessment, which was elaborated and approved bythe High Council to the Ministry of Environment andWaters Final Report, clearly proves the environmental advan-tages of the metropolitan compared with other modes ofurban transport.
The first metro line is situated along the most populat-ed part of the city and will serve more than 45 percent ofSofia’s residents (about 550,000 people). With the presentstreet network and numerous routes of MPUT, the rate ofmotorisation in the town in the near future (the next four tofive years) will make the central part of the town (the “cen-trum”) impassable. It is envisaged that inter-city buses to theeastern and western suburban areas should stop at the endmetro stations.
According to the drafts for MPUT traffic organisation(after the first metro line is set in operation with incompara-bly better conditions for comfort and safety), the metro willtake passengers directly from three tram lines over a length of30 kilometres; 10 bus lines over 150 kilometres; and five trol-leybus lines over 65 kilometres. This makes 250 transportunits in total. When the wagon fleet is available for the wholemetro line, the total cost of withdrawal of the transport unitslisted above amounts to more than USD 20 million.
Furthermore, complimentary routes will be organised tobring passengers to the metro. In this way, the city will besubject to fewer means of transport.
Because of faster travel times, a daily average of morethan 150,000 man-hours can be saved after the first line isset in operation (or, roughly USD 7.5 million per year, as cal-culated according to the methodology of the European Bankfor Reconstruction and Development).
The new metro f leet of 48 wagons has a longer term ofserviceability (25-30 years) than the other urban transport.This term of serviceability of the rolling stock leads to sav-ings of more than USD 12 million.
Besides a decrease in the number of transport units ofMPUT, the first metro line is also an important factor ofurbanisation because of the expected build-up of moderninfrastructure along its route.
Tramway transportThe increasing orientation towards tramway transport
seen in many countries, including the United States, is dueto its exceptional advantages, namely:
• environmental friendliness — fewer emissions of harmfulgases and noise following the introduction of new tech-nologies;
• speed — detached/separate tracks with automatic man-agement of traffic lights;
• comfort — present technical developments create com-fort for passengers comparable to that of cars; and
• safety — availability of signalisation and on-board com-puters minimises driver error.
The main course of tram transport development in Sofiais the gradual introduction of trams with normal 1,435 mil-limetre gauge in the east-west direction, thereby replacing1,009-millimetre-gauge tram lines. Adopting the same type oftram network used in the rest of Europe has many advan-tages. Purchases of whole vehicles and spare parts from Euro-pean countries, for example, become much less costly.
Another important issue for the long term is the con-struction of high-speed tracks to connect more remote resi-dential regions with the central part of the city.
For the purposes of renovating and modernising rollingstock, possibilities are being explored for an independentmeans of production (or through a joint venture with a for-eign company) of a modern low-f loor type of tram with plat-forms for wheelchairs.
Trolleybus transportEnvironment-friendly transport will continue to be a signif-
icant consideration for future MPUT development in Sofia.There are two aspects of future development — the route net-work and the rolling stock. The changes in the trolleybus net-work will correspond with the concept of “bring-to-metro” trans-port, as well as an internal one for districts along the track. Aprogramme for more serious innovation foresees a change ofsituation for the rolling stock, which is overworked, obsolete andutilised well below its real capacity. Various possibilities are beinginvestigated. An idea has also emerged to have Russian debt toBulgaria partially paid off with trolley buses for Sofia MPUT.
From a technological point of view, the electro-busespowered by autonomous electric traction (batteries) andindependent from a stationary catenary network, will haveprospects for greater distances in future.
Bus transportBuses are the most popular mode of transport in Sofia
and in the near future will maintain this role. Regretfully, bustransport is also the biggest polluter of the environment, andthe course of its future development within the MPUT frame-work is directed toward reducing its environmental impact.
Sofia Municipality and the Ministry of Environmentand Waters (MEW) have joined efforts relatede to environ-mental protection of the capital.
PA R T 1 : P U B L I C T R A N S P O R T — S TAT U S , P R I O R I T Y P R O B L E M S A N D N E E D SS O F I A
N E X T S T O P : S U S T A I N A B L E T R A N S P O R T 37

These efforts include:
• using diesel engines in compliance with minimumEURO1 standards for recycled “second hand” buses (forthe currently available f leet of Ikarus buses, a pro-gramme to replace engines at major overhauls thatincludes improved combustion processes produced byHungary-based RABA, which meet EURO1 standards;
• using natural gas as an alternative fuel and continuing aprogramme to use engines working on a mixed CNG-diesel regime by fixing a combustion appliance withCNG under high pressure (the development of this pro-gramme envisages delivery of compressor modules forCNG for refilling CNG-equipped buses);
• studying alternative fuels such as bio-fuels, which areusable in Mercedes HDI engines and work on a mixeddiesel-rapeseed (coleseed) oil regime (some investor inter-est has emerged for implementation of the idea, initiallyfor the needs of taxi transport and later for MPUT busesequipped with such engines. Construction of a plant forproduction of bio-fuel near the town of Lom is alsobeing considered);
• strictly controlling emissions by implementing a moderndiagnostic apparatus to measure and limit harmful sub-stances in exhaust gases, power sources, oil consump-tion, etc. through a computerised system; and
• reorganising routes to correspond to the concept of“bring-to-metro” transport and to limit bus access as faras the second ring.
MonorailOne idea for the distant future is the possible realisation
of another type of transport — a monorail set on columnsalong the riverbeds of the Slivnitza and Perlovska rivers. Theidea is to provide quicker connections with radial MPUTroutes without going across the centre. This is an extremelyenvironmentally friendly mode of transport. Its realisationcan be by a catenary network (as with electrical transport) orby a draw-bar pulled cable on the principle of cable lines.The municipality’s Architecture and Urbanisation Direc-torate is studying possibilities for the track. Foreign investorshave shown an interest in the project.
Implementation of an automated system for traffic management and control (ASTMC) in MPUT operations
The present system of control for MPUT transportprocesses is not sufficiently effective and does not allow foroperational and prospective decisions to be made concern-ing its organisation and management. It is envisaged that theASTMC, along with GPS communications now used in the
Iskar tram depot, will be applied to include the rest of thetram depots and trolleybus lines. This would replace the cur-rent radio communications system in bus transport, andthus to spread to all MPUT operations.
Implementation of ASTMC for management and con-trol of the transport process is aimed to ensure improvementin the quality of MPUT service. Besides achieving increasedregularity of traffic and exercised control in real time, thesystem would allow recording and control of trips, routeloads and consequent optimisation, would minimise drivererror and make it possible to include private transport oper-ators in the system. Implementation of a new system forcharging and obtaining information from passengers inMPUT transport units would allow the development of af lexible tariff policy, based on the assessments of customersusing the transport service.
Major directions for development of the whole transportsystem of Sofia include:
• development of a new Master Transport Communica-tion Plan of Sofia;
• development of a programme for gradual improvementof the transport f leet with a goal of reaching a ratio of35:25:40 for the passengers of the three ground transporttypes — tram, trolley and bus transport;
• accelerated renovation of the transport infrastructure,the socket and catenary cable network, improving sta-tions, repair and maintenance facilities and equipment;and
• accelerated innovation of the rolling stock by importingnew units and producing Bulgarian units through a sys-tem of joint companies for transfer of know-how.
Priority problems and needs relatedto more effective MPUT operationsImplementation of ASTMC in Sofia
There is a strong need for implementation of an effectivecomputer-based system for management, dispatching andtotal control of Sofia’s traffic. The establishment of a centrefor management with respective computer equipment andsoftware, based on dispatching trunk systems on the princi-ple of cellular phones, working with geo-stationary satellitesand monitoring traffic in real time, would make the dis-patching process extremely f lexible and decrease the numberof traffic jams, schedule violations, fuel waste, etc. In spiteof the comparatively high value of investments in such sys-tems with GPS communication (about USD 10 million),they are paid off in a very short time sometimes within threeto five years.
38 N E X T S T O P : S U S T A I N A B L E T R A N S P O R T

AISTM implementation The system used at the moment is not sufficiently effec-
tive, does not cover the entire MPUT network and does notprovide the possibility for operational and perspective deci-sions to be made concerning MPUT organisation and man-agement. Implementation of a new system for charging andobtaining information from passengers in MPUT transportunits would allow for the development of a f lexible tariffpolicy based on the assessments of customers using thetransport service. An expected result of introducing such asystem is a drop in the number of free-loading passengersfrom 8.5 to 6.0 percent — about 18 million trips annually.
Metro construction priorities With the construction of the second metro section from
Sveta Nedelja Square to Mladost complex, the first metroline would service more than 45 percent of the capital’s pop-ulation (about 550,000 people), and other routes of MPUTwould be closed down. With the comfort and speed of themetro service, and easy access to the centre, the metro isexpected to attract people now using private cars. This wouldfurther ease the problems of heavy traffic, traffic jams andparking in the central part of the city. The track-road of thesecond section of the first metro line goes from stop 7 (Sv.Nedelja Square) to Tzar Osvoboditel Boulevard-Sofia Univer-sity, the Dragan Tzankov Tunnel, Interpred-Vartopo Bridgeand Mladost complex over a total length of 11.2 kilometresand nine stations. The phases of construction are:
Phase 1:Metro station 7, Dragan Tzankov Tunnel, length 2.4kilometres
Phase 2:Metro station 9 — metro station 13, Denitza, length 5.7kilometres
Phase 3:Metro station 13 — metro station 16, Mladost complex,length 3.2 kilometres
The construction technologies of the different sectionsallow concurrent as well as consecutive construction,depending on the financing provided. According to theSofia Municipality programme, the construction of the sec-tions included in phases 1 and 2 is to take place up to 2007.Phase 3 and the start of work on the second north-south sec-tion between the National Palace of Culture and the CentralRailway Station are envisaged after 2007. The necessary fundsare found in Table 10.
Funding for the metro is based on resolutions of theCouncil of Ministers, according to which the metropolitan,as a site of national importance, is financed from the statebudget. In recent years the Sofia Municipality has also par-ticipated in funding, especially renovating neglected engi-neering infrastructure and the construction of new infra-
structure and the boulevard above the metro track. In viewof the considerable amount of funds needed, possibilities arebeing investigated to acquire support and assistance fromforeign financial institutions and to encourage participationfrom foreign investors.
Priorities for effective operation of the urbantransport communication scheme
The main priorities related to creating an effective urbantransport communication scheme include:
• construction of infrastructure for traffic reorganisationand finalisation of ring construction as part of the trans-port communication scheme; and
• construction of parking lots, areas and garages to free thecentre of cars.
Major projects executed with national andmunicipal funds
Since 1992, 294 Ikarus buses have been modernised aspart of the Innovation and Modernisation of the AvailableBus Fleet programme of the Sofia Municipality and Ministryof Environment and Waters (MEW) through the NationalFund for Environment Protection (NFEP) and EU Pre-Acces-sion Economic Programme Fund (EUPAEPF). Some 234 ofthe total were provided with new engines and 60 withCGN–diesel combustion appliances. From 1994-1999, withfunds from NFEP, 151 RABA-type D10 UTS engines werepurchased. They comply with EURO1 standards.
Funds from the Phare Programme and NFEP were usedto purchase 33 engines in 1997-1998, and another 50 enginescomplying with EU standards were bought in 2000 with thefinancial support of Phare. Thus the share of buses with ren-ovated engines is 55 percent. Roughly calculated, the annualecological effect from replacement of only one engine typeD 1256 HM 6 U with D 10 UTS is the contribution of 9.7tonnes less harmful substances into the ambient air.
The 60 buses, equipped with CNG-diesel appliances (alsowith the financial support of Phare and Sofia Municipality),represent another 15 percent of all Ikarus buses. They notonly have an environmental effect, but save diesel fuel as well.
With funds from Sofia Municipality and EUPAEPF dur-ing the period mentioned above, a total of 187 newMercedes and MAN buses and 204 recycled buses of varioustypes, brands and conditions were purchased.
International support and assistance in projects
In 1994 the European Commission and Directorate forRegional Development (Brussels) supported a survey called“The State of and Perspectives for MPUT in Sofia.” Adetailed assessment was performed regarding the technical
N E X T S T O P : S U S T A I N A B L E T R A N S P O R T 39

and technological characteristics of MPUT operations withrespective short- and medium-term recommendations.
In 1997 the Phare Programme led an effort for financialrecovery of the Sofia MPUT company, SKGT. The recoveryprogramme concentrated on the company’s survival over ashort-term period of two years and focused on financial results.
In 1997-1998 the Phare Programme implemented a planfor the institutional development of MPUT in Sofia. Subjectto options and recommendations are: institutional restructur-ing, the level of MPUT regulation, implementation of marketprinciples, organisation, management and financial systems.
A direct result of FRP and PID is the reform of theSKGT’s holding structure by establishing SKGT-Holding andthe daughter companies Avtotransport, Eletrotransport,Avtoremont, Tramcar and Trans-remontstroy under a SofiaMunicipality Council resolution dated July 28, 1997.
Current cooperation with sponsors (on a bilateral basis) and international financial institutions
• On May 12, 1999 the Sofia Municipality issued its firstEurobonds at a total value of EUR 50 million placed onthe Luxembourg stock exchange. The bonds earned 9.75percent interest with a maturity of three years. The dead-line for the pay-off was June 2002. Almost 80 percent ofthe funds collected were used for fundamental replace-ment of road infrastructure in the capital and majoroverhaul of the main boulevards.
• On February 6, 2002 a contract was signed between theSofia Municipality and the Japanese Bank for Interna-tional Cooperation and Assistance to provide a loan forthe metro construction from Serdika to Interpred. Con-struction of the section is to be completed by the end of2006. The loan is for USD 104 million, with a grace peri-od of 10 years. The term of payment is 30 years at 2.2percent interest. The loan is guaranteed by the state.
• Sofia Municipality is negotiating a loan with the EBRDaimed at renovating the rolling stock of MPUT in Sofia.The total amount is EUR 35 million. The funds areintended to be utilised within a two to three year periodfor the following:
- modernisation of Bulgarian-made tram cars;
- delivery of 20 trolley buses;
- delivery of 49 buses; and
- implementation of ASTMC in MPUT.
ReferencesBotev, Christo. “Transport Problems in the Capital City.” Inteviewed onNational Radio. December 2000.
Capital Newspaper. May 1999. June 2000. June 2001.
Chakarov, Georgi (head of Transport Directorate), Diankov, Mr, and deputyheads of SKGT Avtotransport and SKGT Elektrotransport. Interviewed byauthor.
Mateevich, Erhard (deputy mayor of Sofia). Speech given at the Urban Elec-trical Transport 2000 conference.
Mateevich, Erhard. Report on “Mass Urban Transport: Structure, Current Sit-uation and Development.”
Naidenvo, Vassil (head of SKGT Holding). Speech given at the Urban Electri-cal Transport 2000 conference.
Naidenvo, Vassil. Interviewed by author.
Phare. Reports on the Financial Recovery Programme of SKGT. 1197.
Phare. Reports of the Plan of the Institutional Development of Public Trans-port in Sofia: 1997-1998. Phare project under the Framework Transport Con-tract. Main consultant: GOPA.
Regulations of the Sofia Municipality Council on Public Transport on the Terri-tory of Sofia. March 14, 2000.
Statistical Notebook of Sofia.
Strategy for Development of Sofia. Preliminary report. March 2001. Workinggroup led by Margaret Talvitz, Robert Bucley and Sasha Tzenkova.
40 N E X T S T O P : S U S T A I N A B L E T R A N S P O R T
Funds needed for development
TABLE 10
Section Value (in USD million)
First metro line
Phase 1: Sv. Nedelja Square-Interpred 107 (including interest)
Phase 2: Interpred-Denitza 68
Phase 3: Denitza-Mladost 4 complex 45
Second metro line
Central Station-National Palace of Culture 140

“The Transport in Sofia.” Programme on 2001 Television. Feb. 19, 2001.
Transport Directorate within the Sofia Municipality Council and SKGT Hold-ing. Annual reports and programmes. 2000-2001.
Appendix: System for Traffic Management and Control
The current system for traffic management and controlin MPUT is fragmentary and does not cover the wholeMPUT network.
There are two different automated systems for traffic man-agement in operation. One is used in SKGT Avtotransport tomonitor bus transport. The other is in the Iskar tram depot .Their main features are explained in more detail below:
Bus transportThe gradual construction of an automated system for the
monitoring and control of bus transport began after experi-ments in AT Drujba and AT Malashevci more than 10 yearsago. The basis of the system is the use of automated codedevices (ACD) in the buses and automated control points(ACP) along the track. The information is registered whenthe vehicle passes by the ACP and is scanned in the dis-patching centre (DC) of the corresponding bus division(there are four DCs for each of the bus divisions). In a 150-metre zone around the ACP, the driver of the vehicle canmake voice contact with the DC dispatcher. Thus, in realtime, the dispatchers are able to monitor traffic and reactaccording to the situation. Depending on the software prod-ucts developed and used, the incoming data can be sum-marised, stored and analysed. The summarised data is thentransferred to the Central Dispatching Centre of SKGT-Holding at the main dispatcher’s disposal.
The system includes all four bus divisions of Avtotrans-port and covers 100 percent of the buses from public trans-port, including the private bus operators who run detachedbus route lines from the MPUT transport scheme.
At present this “old” system is functioning successfully.The current reality is such that without the implementationof this system, bus transport could not operate normally.
Tram transportFor the needs of tram transport, an experimental tram
line was initially equipped with a new system for control andmanagement of the operation process.
A combined system is being used comprising GPS-posi-tioning and a two-channel radio station for voice informa-tion and dispatching digital data. The GPS system for posi-tioning transport objects is used one-way, i.e. free of charge.Positioning is achieved with the help of a special plate forspecifying the vehicle’s coordinates. Each tram is equippedwith an on-board device — a computer and a two-channelhigh range radio station. Information is sent to the dis-patching centre every 10-15 seconds. The digital data do notinterfere with the radio voice connections.
Various extras. such as the automatic announcement ofstops and the memory card for f luid crystal signs — with twolines of 16 symbols each displaying schedules are suppliedtogether with the on-board device modules.
The next element of this system is the dispatching cen-tre, for which there is no need for automated coding pointsalong the track.
This system allows for monitoring and managing traffic,as well as collecting and summarising various data and infor-mation for garage administration. Part of this software wasdeveloped by specialists who are well-acquainted with publictransport operations. Currently, all Iskar trams (all Ger-man/Czech production-fit for the standard gauge of 1,435millimetres) are installed with on-board devices for GPS-posi-tioning and radio connections. The idea is to spread the sys-tem to all tram depots.
In this respect, there is urgent need for implementationof an automated system for monitoring, dispatching andtotal control of the whole MPUT network. Establishment ofsuch a centre with the required computer equipment andsoftware built on a platform of trunk-radio systems (alongthe principle of cellular phones), which works with geo-sta-tionary satellites and monitors transport in real time, wouldensure extremely f lexible dispatching, immediate informa-tion, a decrease in the risk of traffic jams, fewer schedule vio-lations, better fuel economy, realisation of substantialeconomies of funds, etc. These types of systems with a GPS-connection have a relatively high value as an investmentamounting to about USD 10 million, but the pay-off periodis, typically, extremely short at up to three years.
N E X T S T O P : S U S T A I N A B L E T R A N S P O R T 41

42 N E X T S T O P : S U S T A I N A B L E T R A N S P O R T

N E X T S T O P : S U S T A I N A B L E T R A N S P O R T 43
City territory and overview The total area of the Tallinn’s administrative region is
158 square kilometres, which is divided into eight districts(see Table 1).
At the beginning of 2001 the city of Tallinn owned 8.6square kilometres (5.4 percent) of the total area as municipalland. Some 32.9 square kilometres (20.8 percent) of the ter-ritory of Tallinn has been privatised, and 4.3 square kilome-tres are owned by the state. The rest of the land also belongsto the state, as it has not been formalised in the cadastre.
In December 1997 the United Nations Educational, Sci-entific and Cultural Organisation (UNESCO) placed theOld Town of Tallinn on the World Heritage List. The OldTown covers only 0.7 percent of the present city territoryand is inhabited by approximately 4,000 residents. Table 2shows a breakdown of how land was used in the year 2000.
Responsibilities of the Public Transport andEnvironment Department
The Public Transport and Environment Department ofis responsible for:
• development, planning and supervision of the social andeconomic measures in the city;
• planning and introduction of common strategies envi-ronmental development, urban development, land useand transportation;
• carrying out studies and planning in the social, environ-mental and transportation sectors;
• cooperation with international, national and private bodies;
• supervising, monitoring and auditing the environmental,planning, urban development, construction and trans-port situations in Tallinn;
• management in all phases of planning activities;
• traffic and public transport management (includingparking, traffic management, infrastructure planning,road safety management);
• assessment and auditing of planning solutions, supervi-sion of planned constructions etc.;
• management of surveying and mapping activities for thecity; and
• name and address management.
The main responsibilities of the department concerningpublic transport management are:
• network- and service-level planning;
• collecting and processing information;
• contracting services from transport companies;
• financing the system (fares, tariffs and subsidies);
• monitoring service quality;
• paying according to the quantity and quality of the serv-ice performed;
• providing information to passengers; and
• ticket vending and inspection.
The department’s main traffic responsibilities include:
• urban traffic management;
• parking management (including paid parking) ;
• management of road works and temporary traffic solu-tions; and
• planning Tallinn’s road network and traffic management.
The main responsibilities of the Tallinn Traffic Manage-ment Centre are:
• traffic management and control;
Tallinn, Estonia

PA R T 1 : P U B L I C T R A N S P O R T — S TAT U S , P R I O R I T Y P R O B L E M S A N D N E E D STA L L I N N
44 N E X T S T O P : S U S T A I N A B L E T R A N S P O R T
Land use by area, 2000 (hectares)
Purpose Area
Blocks of flats 333.4
Single-family residence 2,172.5
Land returned to previous owners 836.4
Production buildings 1,225.9
Commercial land 723.0
Public buildings 736.6
Common uses 1,380.4
Other
- Military 64.4
- Purpose not defined 64.3
- Production buildings for agriculture
- Transport 248.1
- Waste dumps 126.6
- Nature preserves
Total 7,911.5
Forests, green areas 4,006
Streets, roads 1,321
Cemeteries 300
Bodies of water 1,206
Total 6,833
Source: Sustainable Development and Planning Department of Tallinn, 2000
TABLE 1
Name of district Area (square km) Percent of total area
Haabersti 18.6 11.8%
Kesklinn (Centre) 28.0 17.7%
Kristiine 9.4 5.9%
Lasnamae 30.0 19.0%
Mustamae 8.0 5.1%
Nomme 28.0 17.7%
Pirita 18.7 11.8%
Pohja-Tallinn (Northern Tallinn) 17.3 11.0%
TABLE 2

PA R T 1 : P U B L I C T R A N S P O R T — S TAT U S , P R I O R I T Y P R O B L E M S A N D N E E D STA L L I N N
N E X T S T O P : S U S T A I N A B L E T R A N S P O R T 45
• management of traffic signs, signals, information sys-tems, etc. in Tallinn;
• supervision of parking and taxi services; and
• Tallinn public transport tickets (printing, selling andoverall management).
Public transport operators and networks
There are three operators serving the Tallinn publictransport network today, which uses only a common (f lat)fare system.
Tallinna Autobussikoondise AS (Tallinn Bus CompanyLimited) is 100-percent owned by the city of Tallinn. The com-pany has 337 buses serving 48 lines. The number of employeesis 1,156, the number of passengers is 67.9 million, and the totalannual turnover is EEK 240.7 million (EUR 15.4 million).
Tallinna Trammi- ja Trollibussikoondise AS (TallinnTram and Trolley Company Limited) is 100-percent owned
by the city of Tallinn. The company owns 226 vehicles(trams and trolleybuses) operating on 13 lines (five tramlines and eight trolleybus lines). The total number ofemployees is 1,121, the number of passengers carried annu-ally is 67.2 million and the total annual turnover is EEK181.7 million (EUR 11.6 million).
MRP Liinide AS (MRP Liinid Limited) is a 100-percent privately-owned operator with 29 buses. Thenumber of employees is 70, the number of passengers isf ive million per year and annual turnover is EEK 15 mil-lion (EUR 1 million).
Tallinn's common-fare system network has been in placesince 1990. The network features 66 lines, including 10express (or non-stop) bus lines, eight trolleybus lines andfive tram lines. Presently, the biggest problems are connec-tions and service coordination between Tallinn and coun-ties outside of the city, such as Harju County, with its com-muter train network serviced by Elektriraudtes AS Services.This is especially important, as a number of citizens arelooking for new residences outside the city, in Harju Coun-ty, and thus commuting daily.
Dynamics of Tallinn’s resident population, 1959-2001*
FIGURE 1
600,000
500,000
400,000
300,000
200,000
100,000
01959 1970 1979 1989 1992 1994 1996 1998 2000 2001
279,
853
362,
536 42
8,53
7 478,
974
471,
445
442,
679
427,
510
415,
299
404,
005
399,
850
* Years 1959, 1970, 1979, 1989 and 2000 by population censuses; other years represented by resident population on January 1.Source: ESA, Statistical Office of Estonia
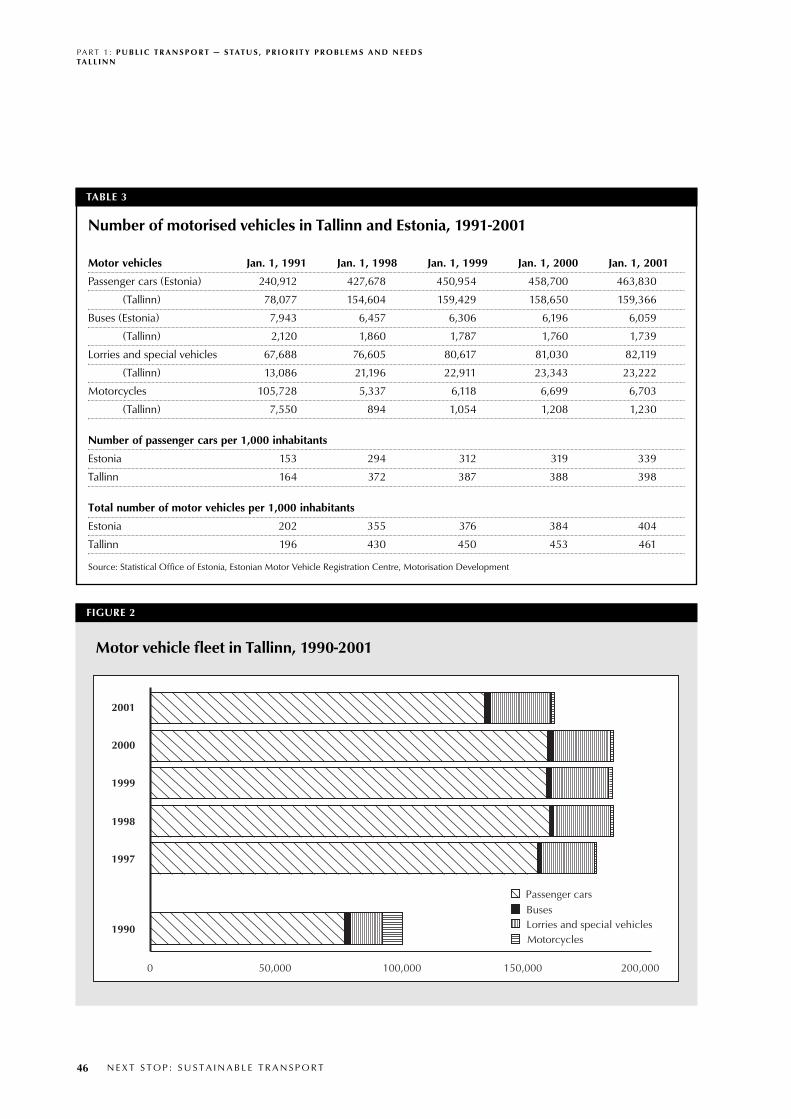
PA R T 1 : P U B L I C T R A N S P O R T — S TAT U S , P R I O R I T Y P R O B L E M S A N D N E E D STA L L I N N
46 N E X T S T O P : S U S T A I N A B L E T R A N S P O R T
TABLE 3
Number of motorised vehicles in Tallinn and Estonia, 1991-2001
Motor vehicles Jan. 1, 1991 Jan. 1, 1998 Jan. 1, 1999 Jan. 1, 2000 Jan. 1, 2001
Passenger cars (Estonia) 240,912 427,678 450,954 458,700 463,830
(Tallinn) 78,077 154,604 159,429 158,650 159,366
Buses (Estonia) 7,943 6,457 6,306 6,196 6,059
(Tallinn) 2,120 1,860 1,787 1,760 1,739
Lorries and special vehicles 67,688 76,605 80,617 81,030 82,119
(Tallinn) 13,086 21,196 22,911 23,343 23,222
Motorcycles 105,728 5,337 6,118 6,699 6,703
(Tallinn) 7,550 894 1,054 1,208 1,230
Number of passenger cars per 1,000 inhabitants
Estonia 153 294 312 319 339
Tallinn 164 372 387 388 398
Total number of motor vehicles per 1,000 inhabitants
Estonia 202 355 376 384 404
Tallinn 196 430 450 453 461
Source: Statistical Office of Estonia, Estonian Motor Vehicle Registration Centre, Motorisation Development
Motor vehicle fleet in Tallinn, 1990-2001
FIGURE 2
2001
2000
1999
1998
1997
1990
50,000 100,0000 150,000 200,000
Passenger carsBuses
MotorcyclesLorries and special vehicles

Some new projects, such as a tender on city bus servic-es and the introduction of an electronic fare collection sys-tem, have been stopped for various reasons — mainly becauseof financial problems.
The flat fare ticket system Line Network, Tallinn
The exchange rate for the Estonian kroon (EEK), as ofJuly 1, 2001, was EUR 1 = EEK 15.65.
With a one-hour ticket the passenger is allowed to boardany public transport vehicle (of the common public trans-port network) within one hour of the first boarding. Whenboarding an express bus the passenger must buy an addi-tional ticket.
Discounts are available only for residents of Tallinn or asstated by law.
Free use of public transport is provided for:
• children of pre-school age (documentation not required);
• disabled children and their companions;
• seriously disabled persons and their companions;
• veterans of the Liberty War;
• passengers 65 years old and over;
• orphans and children missing parents (with schoolapproval);
• children from families with three or more children; and
• police officers in uniform.
Discount tickets are available for:
• pupils of secondary and primary schools under the ageof 22;
• students under the age of 35;
• persons accompanying veterans of World War II;
• pensioners;
• persons (age 16 and over) with a serious or medium dis-ability; and
• parents of three or more children.
PA R T 1 : P U B L I C T R A N S P O R T — S TAT U S , P R I O R I T Y P R O B L E M S A N D N E E D STA L L I N N
N E X T S T O P : S U S T A I N A B L E T R A N S P O R T 47
Motor vehicle fleet in Estonia, 1990-2001
FIGURE 3
2001
2000
1999
1998
1997
1990
0 100,000 200,000 300,000 600,000400,000 500,000
Passenger cars
Lorries and special vehiclesBuses
Source: Estonian Motor Vehicle Registration Centre
Note: The 2001 decrease in the motor vehicle fleet is the result of a new registration policy. Since 2001 only motor vehicles receiving a technical inspec-tion, which allows them to be operated, are included in the register.
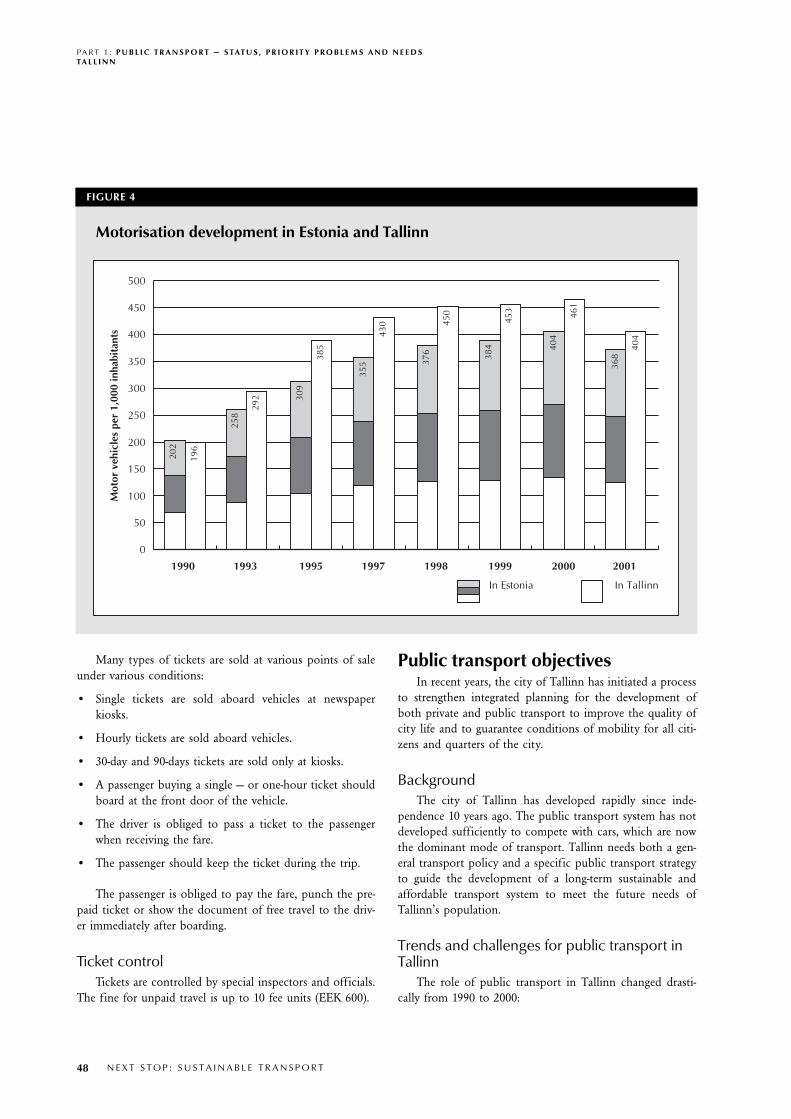
Many types of tickets are sold at various points of saleunder various conditions:
• Single tickets are sold aboard vehicles at newspaperkiosks.
• Hourly tickets are sold aboard vehicles.
• 30-day and 90-days tickets are sold only at kiosks.
• A passenger buying a single — or one-hour ticket shouldboard at the front door of the vehicle.
• The driver is obliged to pass a ticket to the passengerwhen receiving the fare.
• The passenger should keep the ticket during the trip.
The passenger is obliged to pay the fare, punch the pre-paid ticket or show the document of free travel to the driv-er immediately after boarding.
Ticket controlTickets are controlled by special inspectors and officials.
The fine for unpaid travel is up to 10 fee units (EEK 600).
Public transport objectivesIn recent years, the city of Tallinn has initiated a process
to strengthen integrated planning for the development ofboth private and public transport to improve the quality ofcity life and to guarantee conditions of mobility for all citi-zens and quarters of the city.
Background The city of Tallinn has developed rapidly since inde-
pendence 10 years ago. The public transport system has notdeveloped sufficiently to compete with cars, which are nowthe dominant mode of transport. Tallinn needs both a gen-eral transport policy and a specific public transport strategyto guide the development of a long-term sustainable andaffordable transport system to meet the future needs ofTallinn’s population.
Trends and challenges for public transport inTallinn
The role of public transport in Tallinn changed drasti-cally from 1990 to 2000:
PA R T 1 : P U B L I C T R A N S P O R T — S TAT U S , P R I O R I T Y P R O B L E M S A N D N E E D STA L L I N N
48 N E X T S T O P : S U S T A I N A B L E T R A N S P O R T
Motorisation development in Estonia and Tallinn
FIGURE 4
500
450
400
350
300
250
200
150
100
50
0
1990 1993 1995 1997 1998 1999 2000 2001
202
196
258
292 30
9
385
355
430
376
450
384
453
404
461
368
404
In Estonia In Tallinn
Mot
or v
ehic
les
per
1,00
0 in
habi
tant
s

PA R T 1 : P U B L I C T R A N S P O R T — S TAT U S , P R I O R I T Y P R O B L E M S A N D N E E D STA L L I N N
N E X T S T O P : S U S T A I N A B L E T R A N S P O R T 49
TABLE 4
Public transport modal split in Tallinn (flat-fare system)
1993 1994 1995 1996 1997 1998 1999 2000 2001
Bus traffic
Number of lines1 55 51 48 48 48 50 51 52 53
Length of lines1, 587 516 489 489 489 522 535 555 565kilometres (km)
Fleet peak-scheduled 266 254 237 239 246 268 280 285 302vehicles in traffic1
Vehicles 20,575.1 17,929.6 16,629.5 16,937.4 17,231.8 17,847.4 19,179.4 19,100.9 19,561.8(km, thousands)
Place 3,042.4 2,683.2 2,452.4 2,456.0 2,473.9 2,476.9 2,606.9 2,648.6 2,713.4(km, millions)
Number of trips 126.2 95.7 87.1 81.9 77.4 73.0 70.1 87.0 72.9(millions)
Tram traffic
Number of lines1 4 4 4 4 4 4 4 5 5
Length of lines1 (km) 33 33 33 33 33 33 33 42 42
Trains in traffic1 68 68 67 67 67 67 68 74 75
Vehicles 4,007.1 3,677.9 3,566.7 3,617.9 3,643.6 3,620.6 3,586.6 3,737.6 3,921.3(km, thousands)
Place (km, mill) 765.9 689.4 667.2 672.4 671.6 665.5 654.3 678.4 709.4
Number of 55.6 42.0 35.2 35.6 33.6 30.6 29.3 34.9 29.2boardings, (mill)
Trolley traffic
Number of lines1 9 9 9 9 9 9 9 8 8
Length of lines1 (km) 76 76 76 76 76 76 76 68 68
Vehicles in traffic1 108 105 101 103 103 103 103 97 97
Vehicles 7,550.2 6,808.6 6,667.0 6,659.7 6,700.7 6,750.3 6,818.5 6,658.1 6,626.2(km, thousands)
Place (km, mill) 882.3 791.2 767.3 774.1 774.8 779.7 788.6 787.8 794.5
Number of 49.8 37.6 31.5 31.8 42.1 38.9 37.4 45.1 38.0boardings (millions)
Public transport total
Number of lines1 68 64 61 61 61 63 64 65 66
Length of lines1 (km) 696 625 598 598 598 631 644 664 674
Vehicles in traffic1 442 427 405 409 416 438 451 456 474
Vehicles 32,132.4 28,416.1 26,863.2 27,215.0 27,576.1 28,218.3 29,584.5 29,496.6 30,109.3(km, thousands)
Place (km, mill) 4,690.6 4,163.8 3,886.9 3,902.5 3,920.3 3,922.1 4,049.8 4,114.8 4,217.3
Number of 231.6 175.3 153.8 149.3 153.1 142.5 136.8 167.0 140.1boardings, (mill)2
Car traffic total
Number of 117.0 132.0 165.0 174.0 180.0 185.0 190.0 209.9 222.7boardings, (mill)3
1 Year-end total2 Calibrated value for the total of year 2000. Because of a sharp increase in ticket prices, this value is not comparable with other years.3 Estimated value by the city of Tallinn

• The number of public transport trips has declined sig-nificantly for all public transport modes, and by almost60 percent overall.
• The public transport market share has decreased from 77percent to 31 percent.
• The number of car trips has increased almost three-fold.
In other words, the number of public transport users hasdecreased and the public transport share of motorised trans-port has decreased. At the same time, the expenses for pub-lic transport and ticket prices have increased.
The pressure on the entire city transport system, andespecially on the city centre from much more car traffic, willrequire traffic management measures and integrated plan-ning for public transport and car traffic.
Increasing car use in Tallinn will contribute to air pollu-tion, noise problems and congestion in the coming years, andthereby reduce the quality of life for city inhabitants andmake the city less appealing to visitors. Key issues include:
• The basic structure of the public transport system hasremained almost unchanged for the last 10 years.
• The lack of sufficient investment in public transport hasresulted in an outdated rolling stock f leet and fewerfunds for public transport infrastructure.
• The current public transport system does not offer anattractive alternative for the many new car owners.
• Fares are not adjusted on a regular basis, and no long-term fare policy exists.
• The high load factor of vehicles causes low service levels.
• Without significant and visible changes in present poli-cy, the negative trend of public transport system devel-opment will continue, and eventually transform the pub-lic transport system into a marginalised service for low-income groups only.
From 2001, municipal transport operators are entirelyresponsible for all investments in public transport. Theinvestments have to be covered by the price per line-kilome-tre paid by the city for operations, but no significant changein the price level has been agreed to until now.
The Public Transport Act allows for investment grantsfrom the state. As opposed to other Estonian local govern-ments in recent years (from 1997 up to now), the city ofTallinn has received no public transport subsidies from thestate due to the relatively high average income in the area.
The city of Tallinn is now faced with several strategicquestions:
• What kind of city do we want?
• What kind of public transport system is best for the city?
• How do we finance new developments?
Tallinn has changed into a “car” city over a relativelyshort period of time. If the present situation continues with-out a significant modal policy in favour of public transport— including traffic management measures — assessments sug-gest that the public transport market share in 2010 will bebetween 24 and 29 percent (depending on overall economic
PA R T 1 : P U B L I C T R A N S P O R T — S TAT U S , P R I O R I T Y P R O B L E M S A N D N E E D STA L L I N N
50 N E X T S T O P : S U S T A I N A B L E T R A N S P O R T
TABLE 5
Public transport expenditure and recovery of expenses in Tallinn (EEK millions )
Expenses 1996 1997 1998 1999 2000
Bus traffic 153.3 173.2 202.5 229.0 251.6
Trolley traffic 74.4 84.6 93.6 102.3 99.1
Tram traffic 57.6 63.5 80.0 79.9 77.2
Total of principal activities 285.3 321.3 376.1 411.2 427.9
Recovery of expenses
Revenue from tickets (excluding VAT) 126.2 133.7 170.3 166.2 172.4
Subsidies 141.4 172.1 186.9 216.7 232.8- Municipal 113.4 172.1 186.9 214.7 230.8- State 28.0 - - - -
Other revenues 17.7 15.5 18.9 28.5 22.7
Recovery of expenses 285.3 321.3 376.1 411.4 427.9(without independent revenue)
*Year-end figures. Data provided by the Sustainable Development and Planning Department

growth), and that the number of public transport trips maydecrease by 10 percent compared with 2000.
The evaluation of a vehicle replacement plan to accom-modate the present public transport passenger volumes with-in an investment window of EEK 32 million per year showsthat the average vehicle age of the three city public transportmodes will rise from the 2001 level by 40-50 percent.
If the current trend continues, the average age of vehiclesin 2010 will be:
• trams — 26.6 years;
• trolleys — 20.8 years;
• buses — 20.2 years.
PA R T 1 : P U B L I C T R A N S P O R T — S TAT U S , P R I O R I T Y P R O B L E M S A N D N E E D STA L L I N N
N E X T S T O P : S U S T A I N A B L E T R A N S P O R T 51
TABLE 6
Public transport split in Tallinn (flat-fare system)
Public transport 1993 1996** 1997 1998 1999 2000
Number of lines* 68 61 61 63 64 67
Length of lines* (kilometres) 696 598 598 631 648 665
Vehicles in traffic* 442 409 416 438 451 456
Vehicle, km (thousands) 32,132.4 27,215.0 27,576.1 28,218.3 29,584.5 29,496.6
Place, kilometres (millions) 4,690.6 3,902.5 3,920.3 3,922.1 4,049.8 4,114.8
Number of trips (millions) 231.6 149.3 153.1 142.5 136.8 167.0
1993 1997 1998 1999 2000
Bus traffic
Number of lines* 55 - 48 50 51 54
Length of lines (kilometres)* 587 - 489 522 542 555
Vehicles in traffic* 266 - 246 268 280 285
Vehicles, km (thousands) 20,575.1 - 17,231.8 17,847.4 19,179.4 19,100.9
Place, kilometres (millions) 3,042.4 - 2,473.9 2,476.9 2,606.9 2,648.6
Number of trips (millions) 126.2 - 77.4 73.0 70.1 87.0
Tram traffic
Number of lines* 4 - 4 4 4 5
Length of lines (kilometres)* 33 - 33 33 33 42
Trains in traffic* 68 - 67 67 68 74
Vehicles km (thousands) 4,007.1 - 3,643.6 3,620.6 3,586.6 3,737.6
Place, kilometres (millions) 765.9 - 671.6 665.5 654.3 678.4
Number of trips (millions) 55.6 - 33.6 30.6 29.3 34.9
Trolley traffic
Number of lines* 9 - 9 9 9 8
Length of lines (kilometres)* 76 - 76 76 76 68
Vehicles in traffic* 108 - 103 103 103 97
Vehicles, km (thousands) 7,550.2 - 6,700.7 6,750.3 6,818.5 6,658.1
Place, kilometres (millions) 882.3 - 774.8 779.7 788.6 787.8
Number of trips (millions) 49.8 - 42.1 38.9 37.4 45.1
Source: Sustainable Development and Planning Department
* Year-end total **Only total figures are available for 1996
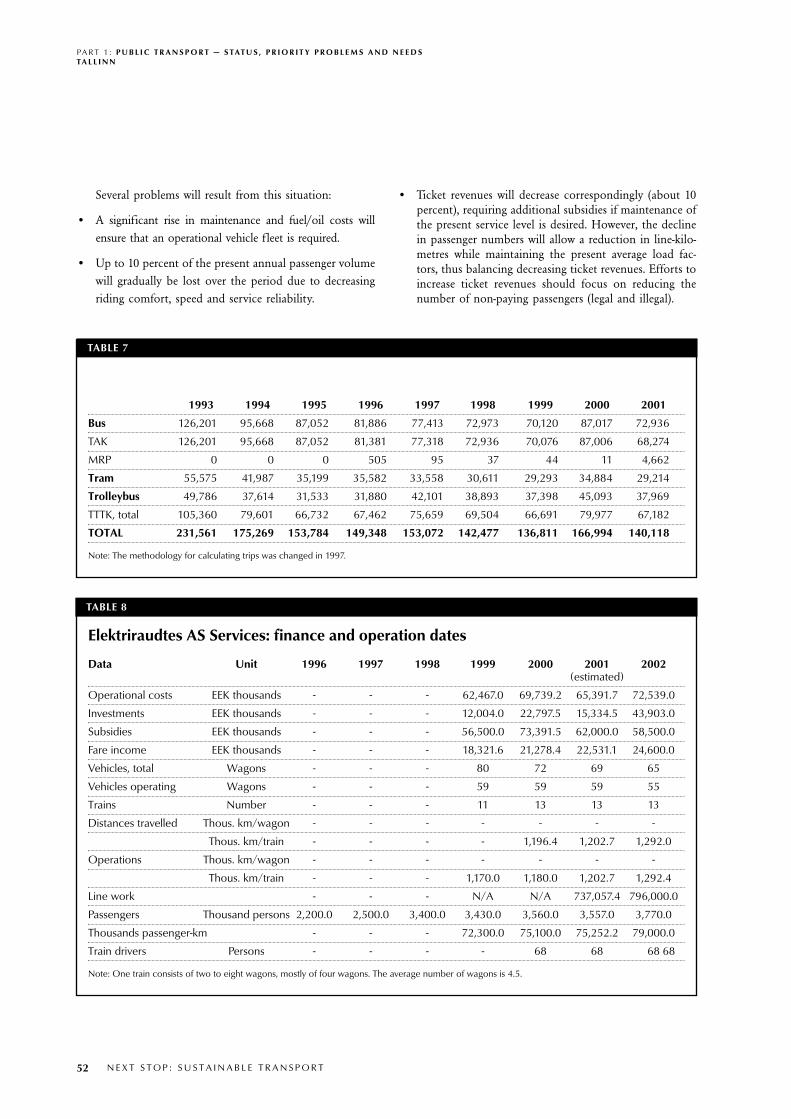
Several problems will result from this situation:
• A significant rise in maintenance and fuel/oil costs willensure that an operational vehicle fleet is required.
• Up to 10 percent of the present annual passenger volumewill gradually be lost over the period due to decreasingriding comfort, speed and service reliability.
• Ticket revenues will decrease correspondingly (about 10percent), requiring additional subsidies if maintenance ofthe present service level is desired. However, the declinein passenger numbers will allow a reduction in line-kilo-metres while maintaining the present average load fac-tors, thus balancing decreasing ticket revenues. Efforts toincrease ticket revenues should focus on reducing thenumber of non-paying passengers (legal and illegal).
PA R T 1 : P U B L I C T R A N S P O R T — S TAT U S , P R I O R I T Y P R O B L E M S A N D N E E D STA L L I N N
52 N E X T S T O P : S U S T A I N A B L E T R A N S P O R T
TABLE 7
1993 1994 1995 1996 1997 1998 1999 2000 2001
Bus 126,201 95,668 87,052 81,886 77,413 72,973 70,120 87,017 72,936
TAK 126,201 95,668 87,052 81,381 77,318 72,936 70,076 87,006 68,274
MRP 0 0 0 505 95 37 44 11 4,662
Tram 55,575 41,987 35,199 35,582 33,558 30,611 29,293 34,884 29,214
Trolleybus 49,786 37,614 31,533 31,880 42,101 38,893 37,398 45,093 37,969
TTTK, total 105,360 79,601 66,732 67,462 75,659 69,504 66,691 79,977 67,182
TOTAL 231,561 175,269 153,784 149,348 153,072 142,477 136,811 166,994 140,118
Note: The methodology for calculating trips was changed in 1997.
TABLE 8
Elektriraudtes AS Services: finance and operation dates
Data Unit 1996 1997 1998 1999 2000 2001 2002(estimated)
Operational costs EEK thousands - - - 62,467.0 69,739.2 65,391.7 72,539.0
Investments EEK thousands - - - 12,004.0 22,797.5 15,334.5 43,903.0
Subsidies EEK thousands - - - 56,500.0 73,391.5 62,000.0 58,500.0
Fare income EEK thousands - - - 18,321.6 21,278.4 22,531.1 24,600.0
Vehicles, total Wagons - - - 80 72 69 65
Vehicles operating Wagons - - - 59 59 59 55
Trains Number - - - 11 13 13 13
Distances travelled Thous. km/wagon - - - - - - -
Thous. km/train - - - - 1,196.4 1,202.7 1,292.0
Operations Thous. km/wagon - - - - - - -
Thous. km/train - - - 1,170.0 1,180.0 1,202.7 1,292.4
Line work - - - N/A N/A 737,057.4 796,000.0
Passengers Thousand persons 2,200.0 2,500.0 3,400.0 3,430.0 3,560.0 3,557.0 3,770.0
Thousands passenger-km - - - 72,300.0 75,100.0 75,252.2 79,000.0
Train drivers Persons - - - - 68 68 68 68
Note: One train consists of two to eight wagons, mostly of four wagons. The average number of wagons is 4.5.

If the present tendencies persist and no drastic counter-meas-ures are enacted (the “do-nothing” alternative) in the Tallinn citytransport sector in general, the following could happen:
• decreasing public transport usage and mode sharing(from 31 percent to 24-29 percent);
• increasing car ownership and car use;
• increasing street congestion and time delays for bothcars and public transport, affecting both passengers andoperational costs; and
• increasing traffic-related accidents, noise, air pollutionand energy consumption levels.
Pressure on the streets will increase and the parkingproblem will also be much more pronounced. The speed ofpublic transport and all other traffic will decrease, and trav-el time losses will increase significantly.
Land use in Tallinn is changing. New living areas arebeing constructed around the city, and serving these areaswith public transport may become impossible without newinvestments. As the number of passengers in public trans-port falls, additional funding will be needed to compensatefor reduced ticket revenues. This means that the investmentsmade are not used effectively to ensure vital mobility in thecity for both public transport and car users, and that thetotal transport system will be more expensive and of a lowerquality. Due to the decreased mobility in the city (both pub-lic transport and car transport) such a policy will have reper-cussions for city life in general.
Basically, the lack of investment and funding for publictransport running costs will eventually produce rising addi-tional demand for major road investments to avoid a localor total breakdown of the city transport system.
This would be a serious threat to continuing economicgrowth in general and, in particular, to successful imple-mentation of the Tallinn Land Use Master Plan.
The Tallinn StrategyThe city of Tallinn has proposed a mixed strategy based
on analyses of different strategic options (ambitious, moder-ate). The strategy and investment plan for the period 2002-2010 should remain focused on improving the cost effec-tiveness and quality of the basic existing public transportsystem — not on expanding the transport system. Expensive,low-impact investment in new public transport infrastructureshould be avoided.
The strategy includes clear measures to improve the attrac-tiveness of public transport and to discourage private vehiclesfrom entering the city. See Table 10 for details of the strategy.
The city has been chosen to direct all available invest-ment funds to vehicle procurement, as this is the only wayto address the major problems in maintaining an operationalf leet of the size necessary to keep the present level of serv-ices in terms of scheduling frequency and load factors.
The preliminary vehicle procurement plans of the strate-gy target the following reductions in average vehicle agefrom 2002 to 2010 (for the active f leet):
• trams: from 20.2 to 18.0 years (-5 percent);
• trolleys: from 14.5 to 12.0 years (-12 percent); and
• buses: from 13.8 to 10.0 years (-26 percent).
The strategy for 2002 to 2010 is as follows:
• Invest in both local and area-wide traffic managementschemes as soon as possible (EEK 85 million).
• Invest in new and modernised rolling stock to the extentaffordable, preferably around EEK 1,900 million over thenext eight years, and reduce the vehicle age for all modes(a minimum investment level of around EEK 1,300 mil-lion is required just to maintain present conditions forall three modes).
PA R T 1 : P U B L I C T R A N S P O R T — S TAT U S , P R I O R I T Y P R O B L E M S A N D N E E D STA L L I N N
N E X T S T O P : S U S T A I N A B L E T R A N S P O R T 53
TABLE 9
Elektriraudtes AS Servicesticketing systemTicket type Ticket fare (EEK)
Single ticket Prepaid Purchased in vehicle
Normal 10 15
Express buses 15 20
Discount or additional ticket 5 5
10-ticket pack 70 -
One-hour ticket, normal - 15
One-hour ticket for express bus - 20
One-hour discount ticket - 5
One-hour additional ticket - 5
Period tickets - -
90-day ticket, normal 460 -
90-day ticket for express buses 620 -
30-day ticket, normal 190 -
30-day ticket for express buses 250 -
30-day discount ticket 70 -
30-day ticket for express buses (students only) 140 -

• Elaborate financial needs for every year using the strate-gy investment plan.
• Be prepared to implement minor extensions of tram andtrolley networks and adjust bus networks if justified bychanges in passenger demand.
• Intensify efforts to improve the efficiency of transportoperators.
• Maintain all three public transport modes in the system(trams, trolleys and buses).
• Electric railways should not be part of the Tallinn strat-egy before the financial implications are clarified andacceptable to the city.
• After a preparation period, implement a tendering sys-tem for bus services — initially in two stages, starting in2004 and 2008, respectively (each covering 50 percent ofthe services). Later, on establish a continuous process bytendering of part of the services every year to improvecost efficiency in operations, but maintain TAK as amunicipal company that can bid on equal terms withprivate operators.
• Consider tendering of all trolley operations, but nottram operations.
• Develop public service contracts between the city andthe operators.
• Shift responsibility for tram track infrastructure from theTram and Trolley Company to the city administration.
• Strengthen the city administration in terms of publictransport management, (particularly for preparationand monitoring of tendering processes and public serv-ice contracts), as well as for strategic development ofservices.
• Base public transport ticket structure and ticket pricingon an average tariff (equals boarding price). Prices ofperiod passes will be increased to improve revenues, andprices will generally be adjusted annually, based on thegeneral inf lation rate.
• Aim for full integration of public transport services inHarju County and Tallinn with regard to planning andfares, but do not consider tram/electric train dualmode operations
PA R T 1 : P U B L I C T R A N S P O R T — S TAT U S , P R I O R I T Y P R O B L E M S A N D N E E D STA L L I N N
54 N E X T S T O P : S U S T A I N A B L E T R A N S P O R T
TABLE 10
Strategy characteristics
Package and option subjects Option key words
I/1: Future public transport network Trolley and bus network adjustments
I/2: Future role of city system modes (trams, trolleys, All modes retained, average vehicle age moderatelycity buses, taxi buses) reduced (trams to 18 years, trolleys to 12 years, buses to 10
years)
I/3: Traffic management, local (public transport network) Extensive measures (10 kilometres of public transport pre-emption)
II/4: Tallinn/Harju County/Elektriraudtes (ELR) public Integrated planning and ticketing (no dual-mode physicaltransport system relations integration)
II/5: Future of TAK (city bus company) Unified city-owned TAK maintained tendering of all busservices
II/6: Future of TTTK tram and trolley company Tram track infrastructure to city-owned company, (power supply maintained under TTTK) tendering of tram operations,
tendering of trolley operations (possibility),unified TTTK maintained (without track responsibility)
III/7: Ticketing and payment system Partly electronic, partly conventional
III/8: Traffic management, city-wide/area-wide Strict measures on car parking and access (parking fareincrease, new parking fare zone 3 and toll ring)
III/9: Cost economy Improved efficiency (covered by other options)
III/10: Public transport financing (ticket revenue/subsidy) Optimised fare structure
IV/11: Grant agreement, scope of work, point 14 Organisation, staffing and resources required to deal withstrategic planning, system regulation, safety issues, andmanagement of service delivery

The benefits of the strategy are:
• an attractive and sustainable public transport systemserving the citizens (and visitors) of Tallinn;
• an increase in public transport trips from 2002 to 2010by around six percent;
• a more modern and cleaner vehicle f leet;
• improved ticket revenue base, due to a price increase ofapproximately 10 percent for period passes, and a strongeffort to substantially reduce the number of non-payingpassengers; and
• a more focused organisational and institutional set-up tomeet requirements of the European Union.
The strategy implies a significant change in the need forfunding from the city, compared to the present situation.Some of the total costs of the public transport system willbe incurred by the operators (e.g. rolling stock) and others(e.g. for traffic management schemes) by different parts ofthe city administration. In any case, the city will have to payfor those parts of costs not covered by passengers; it is justa matter of timing and the concept chosen.
In addition to the investments in rolling stock, severalother investments in the first stage of the strategy required:
• to improve the quality and service level, includingincreased operations (in vehicle-kilometres) to decreasethe load factor of vehicles;
• various technical assistance/consultancy work to estab-lish the basis for tendering of services and to develop fur-ther public service contracts;
• investing in a public relations campaign for public trans-port can be considered when new rolling stock is pre-sented to the public; and
• investing more heavily in traffic management may alsobe considered early in the strategy period due to the veryhigh benefits from these schemes.
The city of Tallinn has decided that, from 2001, all costsof public transport operators, including investments in vehi-cles, shall be covered via the line-kilometre tariff paid by thecity to operators. This is a way of financing supported by theconsultants, as it paves the way for establishing a fair andtransparent tendering system in the future. However, thisway of financing costs requires that the tariff per line-kilo-metre is increased when investments are needed or requiredto improve the quality of services. However, in 2002, theline-kilometre tariff was reduced by about 18 percent, whichindicates that the operators will not be able to take on newinvestments unless the tariff per line-kilometre is increased.
Investment costs may be financed via loans taken byeither the city or the operators to spread the cost over sev-eral years — for example, the lifetime of the asset. Loans maybe obtained based on specific agreements between banksand the city about the future development of public trans-port in Tallinn.
Basically, the city of Tallinn has to decide how much itcan afford and is willing to pay for improvement of the pub-lic transport system over the coming years. The gross budgetfor public transport constitutes 10 percent of the total citybudget for 2002, which is about the same share as investmentsin road construction. The additional budget for public trans-port required by the strategy will increase its share of the citybudget from 10 percent to about 14 percent over a few years.
A pragmatic, affordable public transport strategy for thecity is a strategy that combines the total annual costs of thestrategy with the level of ticket revenues (depending on pas-senger fares) and the possibility to obtain funding from thecity budget. If the costs of the strategy are higher than thetotal funding likely available, the strategy has to be adjusted.
PA R T 1 : P U B L I C T R A N S P O R T — S TAT U S , P R I O R I T Y P R O B L E M S A N D N E E D STA L L I N N
N E X T S T O P : S U S T A I N A B L E T R A N S P O R T 55
TABLE 11
Average annual costs and revenues of investment plan, 2002-2010 (in million EEK, 2002 fixed price level)Key figures 2001 Tallinn city strategy
(average per year)
Investments 31 210
Operating and maintenance 438 442
Net ticket revenue 179 195
Funding need 290 458
Net financial contribution from city/total 62% 70%public transport costs
Line-kilometres (millions) 30.4 31.2
Note: Calculation of investments and funding needs is based on the assumption that investments are paid fully each year and are not financed over anumber of years.

When the present subsidy percentage in Tallinn is com-pared with other West and East European cities, it appearsto be in the middle of the range. The strategy assumes thatan increase in the real price of period passes will be imple-mented to create a better balance between ticket types andensure further financing for investments. The future fare formonthly passes in Tallinn compared to the purchasingpower of incomes will be higher than in cities like Pragueand Budapest, but lower than in Sofia.
However, the good prospects for high economicgrowth rates in Tallinn will soften the impact of thisincrease. A good principle to implement is that the insti-tution which introduces such fares covers all costs relatedto concessionary fares.
The specific goal of the strategy is that the public trans-port share of motorised transport in Tallinn is at least 30 per-cent in 2010. This goal requires dedicated commitment fromthe city of Tallinn in terms of more financial resources topublic transport. The strategy will increase the attractivenessof public transport and ensure a high probability of main-taining the present modal share for public transport, andthereby contribute to the sustainable development of Tallinn.
Transport legislation and development plans for Tallinn, Estonia
Legislation:
1999 — Road Act.
2000 — Motor Vehicle Transportation Act.
2000 — Public Transport Act.
2000 — General rules on passenger and luggage transportation on buses and taxis.
2001 — Traffic Act.
Development Plans of the Tallinn Transport System:
1992 — Tallinn Transportation Concept, IB Stratum OU.
1998 — Development Plan on Tallinn Public Transport 1999-2001, City of Tallinn.
1998 — Development Plan of Tallinn Traffic Management 1999-2001, City of Tallinn.
2002 — Development Plan of Tallinn Road Network, Stratum OU.
2002 — Development Plan on Tallinn Parking System 2002-2005, Stratum OU.
2002 — Tallinn Public Transport Strategy and Investment Programme, COWI Consult.
Overview of some studies and reports on the Tallinn transportationsystem:
1993 — Politics of Transportation Management in Tallinn. Analysis and Proposals, Teli Mobile Systems AB.
1993 — Optimisation of the Tallinn Public Transport Network, Teli Mobile Systems AB.
1994-1995 — Feasibility Study of the Tallinn LRT System, EU Commission
Phare Programme, DHV Consultants BV.
1994-1995 — Project on Tallinn Transportation Information System, City
of Tallinn, Financed by the Finnish Ministry of Transportation and Communications.
1995-1996 — Transportation Management Systems: a Transportation Study,
Ministry of Transportation, Denmark. RH&H Consult.
1997 — Number of Passenger Trips in Tallinn Public Transport, LT-Konsultite Eesti AS.
1997- 1998 — Optimisation of Tallinn Public Transport,
LT-Konsultite Eesti AS.
1999 — Study on Public Transport Vehicle Use, summer, IB Stratum OU.
1999 — Study on Public Transport Vehicle Use, winter, Inspro Konsultatsiooni OU.
1999 — Number of Passenger Trips in Tallinn Public Transport, LT-Konsultite Eesti OU.
2001 — Tram Traffic in Tallinn, Liikluskonsultant OU.
2001 — Study on Public Transport Vehicle Use, spring/winter, Inspro Konsultatsiooni OU.
2002 — Project on the Feasibility of the Introduction of Tallinn Public Transport Priority Systems, Stratum OU.
2002 — Traffic Management Systems of the Viru Public Transport Terminal in Tallinn, Stratum OU.
PA R T 1 : P U B L I C T R A N S P O R T — S TAT U S , P R I O R I T Y P R O B L E M S A N D N E E D STA L L I N N
56 N E X T S T O P : S U S T A I N A B L E T R A N S P O R T

N E X T S T O P : S U S TA I N A B L E T R A N S P O R T 57
General data The population of Warsaw is 1.615 million, with approxi-
mately 2.5 million inhabitants in the greater metropolitan area,depending on where the borders are drawn.
Motorisation
• The number of registered vehicles in Warsaw (all cate-gories) is 770,700.
• According to a recent analysis, there are 375 cars per1,000 inhabitants. This is down from earlier statisticsshowing 400 cars per 1,000 inhabitants). A closer lookat statistical data has led to the conclusion that the realnumber of vehicles in use is considerably lower than theone shown in official statistics: approximately 16 per-cent lower in the case of cars and 25-27 percent in caseof transport vehicles and buses.
• Increase projections: in the past there were projections ofcontinued rapid growth of motorisation up to the levelof 600-650 cars per 1,000 inhabitants. Recent years haveshown that the growth rate is much slower than in thefirst years of transition. Consequently, much slowergrowth is expected.
Transport infrastructureRoads
The urban road system of Warsaw has developed as atypical radial system, with most main roads going to the citycentre. Fifteen national and international roads meet in War-saw. The most important are three international roads:
• Route 2, east-west, Berlin-Poznan-Warsaw-Terespol-Moscow (E-30), A-2 motorway is planned;
• Route 7, north-south, Gdansk-Warsaw-Krakow-Bratis-lawa-Vienna (E-77); and
• Route 8, Helsinki-Tallinn-Riga-Kaunas-Bialystok-Warsaw-Wroclaw-Prague (E-67).
Some of these roads belong to two pan-European corri-dors: Number 1 is Via Baltica (Warsaw-Riga-Tallinn-Helsinki),and Number 2 is Berlin-Warsaw-Moscow.
All these roads serving international, national andregional traffic go through or are located at the edge of thecity centre. Ring roads are still under development.
RailwaysWarsaw is an important railway junction. All seven lines
are electrified (at 3,000 volts). Three lines belong to pan-European (Helsinki) corridors:
• E-65 (Czech Republic), Zebrzydowice-Warsaw-Gdynia
• E-20, Berlin-Poznan-Warsaw-Terespol-Minsk-Moscow; and
• Warsaw-Bialystok-Vilnius-Riga-Tallinn-St. Petersburg.
On the most important radial line (crossing the centre ina tunnel), there are two pairs of tracks, and suburban trafficis separated from long-distance traffic. The number of trainson various lines ranges from 16 to 44 per day. Service (num-ber of trains) has worsened in recent years. Consequently,patronage has dropped as a considerable number of passen-gers have shifted to buses and automobiles.
There is also one suburban line that is 32 kilometreslong and serves one corridor, which runs from the Warsawcity centre to Grodzisk Mazowiecki. It is powered at 750volts and operates special wagons. Generally, it can be clas-sified as light rail.
AirportsOkecie International Airport, located seven kilometres
from the city centre, served 4.7 million passengers and han-dled 41,023 tonnes of cargo in 2001. There were 95,877 oper-ations in all. The airport services 72 percent of all air pas-sengers using Polish airports. The catchment area of Okecieconsists of the Warsaw and capital city regions of 2.5 mil-lion, and another 4.1 million inhabitants from neighbouringareas, including the city of Lodz with 800,000 inhabitants.Roughly 6.6 million people live within two hours’ drivingtime of the airport.
Warsaw, Poland

PA R T 1 : P U B L I C T R A N S P O R T — S TAT U S , P R I O R I T Y P R O B L E M S A N D N E E D SWA R S AW
58 N E X T S T O P : S U S TA I N A B L E T R A N S P O R T
The airport’s runway capacity is close to 155,000 opera-tions, which is equivalent to serving 12-15 million passen-gers. At present, airport service potential is limited by thecapacity of the terminal (4 million passengers) and, to a highextent, by accessibility to the airport over land. The airportis served only by road transport (cars and buses), and accessroads have a limited capacity.
There are two other general-aviation airports in the Warsawmetropolitan area — Bemowo and Goraszka. They are used bysport, sanitary, private and other small planes and helicopters.
Physical development constraintsCrossing the Vistula River creates a special problem
because all road bridges are concentrated on one eight-kilo-metre stretch of the river in the city centre. The nearest otherbridges are located roughly 32 kilometres to the south and25 kilometres to the north on the Vistula River. Two railwaybridges are adequate to meet present needs.
Public transport patternsAuthorities and their responsibilities
The roles of management and operation are separatedin Warsaw. Under this arrangement, city authorities formu-late fare policy, routes and schedules, programme invest-ments, subsides and controlling services. This role is per-formed by a separate unit, the Municipal TransportAuthority (ZTM), which is responsible for organising pub-lic transport services in Warsaw. These services are provid-ed by bus and tram operators, as well as the undergroundrailway, known as the metro.
Legal and regulatory frameworkIn 1990 the legal framework for local transport services
was redefined by two acts of Parliament concerning self-gov-ernance. According to these acts, “meeting the commonneeds of local communities is the responsibility of the coun-ty (municipality).” In particular, the municipality’s responsi-bilities include communal streets, bridges, traffic manage-ment and local public transport.
Consequently, public transport companies were transferredto the municipalities and became communal enterprises.
The state has officially relinquished its role as owner andfinancier of urban transport (there is no ministry dealingwith urban public transport), but it maintains some controlover urban finances. It stipulates fare discounts for retirees,students, the disabled and some other groups of publictransport users. The right to discount fares or free-of-chargetrips greatly inf luences the size of ticket revenues.
Transport demand and modal splitFor a long time, comprehensive origin and destination
surveys have been carried out at intervals varying from fiveto 10 years. The last two were made in 1993 and 1998.
In recent years, mobility expressed in the number oftrips per inhabitant per day has not changed much. Selecteddata on the breakdown of transport modes is presented intables 1 and 2.
Transport managementIn the field of public transport management, the Munic-
ipal Transport Authority in Warsaw contracts those servicesprovided by the three most important operators owned bythe municipality:
• tram company: Tramwaje Warszawskie (TW);
• bus company: Miejskie Zaklady Autobusowe (MZA); and
• underground railway: Metro Warszawskie (MW).
In addition, there are two smaller bus operators con-tracted by the Municipal Transport Authority:
• RAPID-BUS Ltd; and
• PPKS Grodzisk Mazowiecki.
A standard contract between the Municipal TransportAuthority and the operator contains an Annex on Evalua-tion of Quality of Transport Operation. In this annex, spe-cial attention is paid to service reliability and punctuality.Evaluation methodology takes into account (in a systematicway) delays caused by traffic congestion.
The operator is obliged to provide services according todetailed routing and schedules defined by the MunicipalTransport Authority and is paid on the basis of per-vehiclekilometres. Quality and reliability requirements and penal-ties for not meeting such requirements are specified in theannex per agreement in the following areas:
• unreliability index, equal to the percent of scheduledservices not provided;
• punctuality index (applied to bus and tram serviceevaluations), equal to the percent of departures fromselected stops earlier than two minutes or delayed morethan three minutes according to schedule;
• regularity index (applied to underground service evalua-tions), which indicates the average waiting time for serv-ice at metro stations;
• technical deficiencies of vehicles, which reduce the stan-dard of travelling and/or safety;
• whether vehicles are clean;
• whether passengers have access to transport information;
• whether drivers stop at the designated stops or opendoors as required; and
• whether departures from end-stops are earlier thanscheduled.

PA R T 1 : P U B L I C T R A N S P O R T — S TAT U S , P R I O R I T Y P R O B L E M S A N D N E E D SWA R S AW
N E X T S T O P : S U S TA I N A B L E T R A N S P O R T 59
Public transport networkGeneral data about the public transport network:
• total length of bus transport network: 849.1 kilometres;
• total length of bus lines: 2,975.7 kilometres;
• total length of tram transport network: 121.8 kilometres;
• total length of tram lines: 469.8 kilometres;
• total length of underground line: 14.2 kilometres.
The bus transport network consists of:
• 87 ordinary lines with full-day service;
• 29 ordinary lines with partial-day service;
• 23 semi-express lines with full-day service;
• 16 semi-express lines with partial-day service;
• 5 express lines with partial-day service (peak hoursonly);
• 24 suburban lines with full-day service;
• 5 suburban lines with partial-day service; and
• 12 night-service lines.
The tram transport network consists of:
• 29 lines with full-day service; and
• 2 lines with partial-day service.
TABLE 1
Modal split
Travel mode All trips Non-walking trips
1993 1998 1993 1998
On foot 30.1% 20.5% - -
Car and taxi 20.4% 26.5% 29.2% 32.9%
Public transport 48.7% 52.5% 69.6% 66.0%
Bicycle 0.6% 0.4% 0.9% 0.6%
Other 0.2% 0.4% 0.3% 0.5%
Total 100% 100% 100% 100%
TABLE 2
Modal split in public transport trips between the northern and southern districts ofWarsaw during morning and afternoon peak hoursPeriod 7:00-8:00 15:00-16:00
North-South Persons/hour Percent Persons/hour Percent
Buses 18,875 55 18,502 55
Trams 11,254 32 11,245 33
Underground 4,450 13 4,104 12
Total 34,579 100 33,851 100
South-North
Buses 17,900 57 16,106 52
Trams 9,994 32 11,250 37
Underground 3,560 11 3,322 11
Total 31,454 100 30,678 100
Source: Warsaw Traffic Surveys, 1998
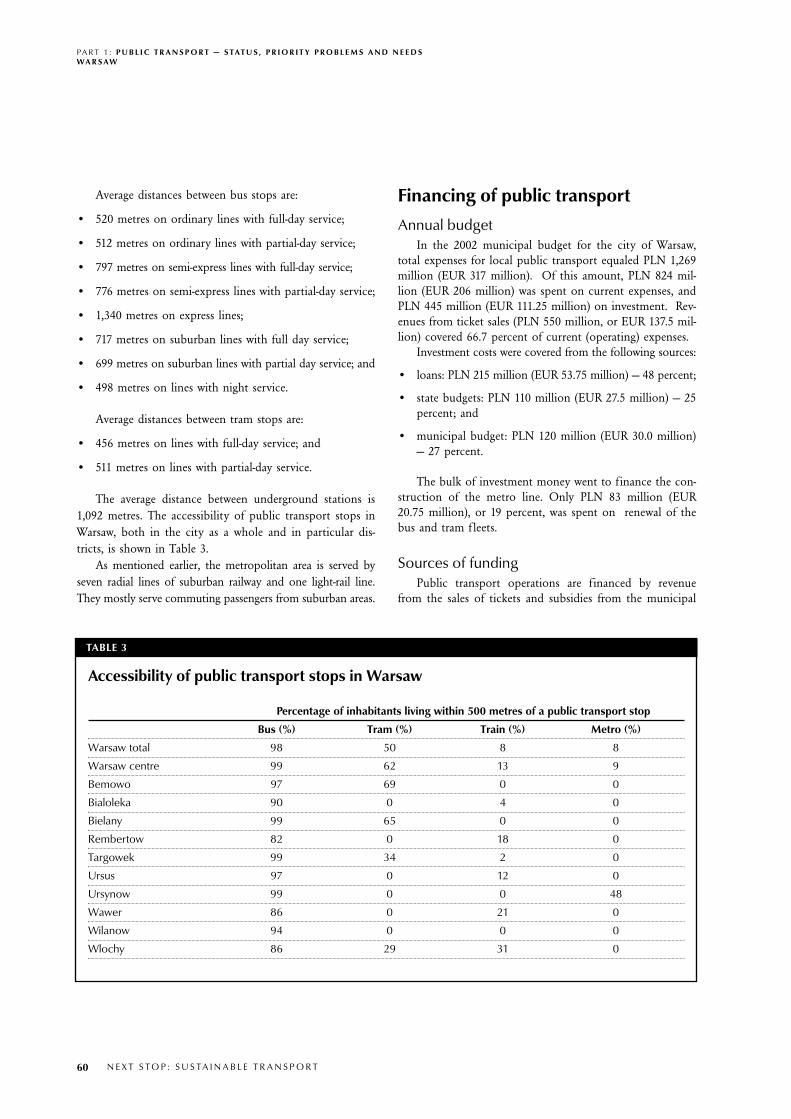
Average distances between bus stops are:
• 520 metres on ordinary lines with full-day service;
• 512 metres on ordinary lines with partial-day service;
• 797 metres on semi-express lines with full-day service;
• 776 metres on semi-express lines with partial-day service;
• 1,340 metres on express lines;
• 717 metres on suburban lines with full day service;
• 699 metres on suburban lines with partial day service; and
• 498 metres on lines with night service.
Average distances between tram stops are:
• 456 metres on lines with full-day service; and
• 511 metres on lines with partial-day service.
The average distance between underground stations is1,092 metres. The accessibility of public transport stops inWarsaw, both in the city as a whole and in particular dis-tricts, is shown in Table 3.
As mentioned earlier, the metropolitan area is served byseven radial lines of suburban railway and one light-rail line.They mostly serve commuting passengers from suburban areas.
Financing of public transportAnnual budget
In the 2002 municipal budget for the city of Warsaw,total expenses for local public transport equaled PLN 1,269million (EUR 317 million). Of this amount, PLN 824 mil-lion (EUR 206 million) was spent on current expenses, andPLN 445 million (EUR 111.25 million) on investment. Rev-enues from ticket sales (PLN 550 million, or EUR 137.5 mil-lion) covered 66.7 percent of current (operating) expenses.
Investment costs were covered from the following sources:
• loans: PLN 215 million (EUR 53.75 million) — 48 percent;
• state budgets: PLN 110 million (EUR 27.5 million) — 25percent; and
• municipal budget: PLN 120 million (EUR 30.0 million)— 27 percent.
The bulk of investment money went to finance the con-struction of the metro line. Only PLN 83 million (EUR20.75 million), or 19 percent, was spent on renewal of thebus and tram fleets.
Sources of fundingPublic transport operations are financed by revenue
from the sales of tickets and subsidies from the municipal
PA R T 1 : P U B L I C T R A N S P O R T — S TAT U S , P R I O R I T Y P R O B L E M S A N D N E E D SWA R S AW
60 N E X T S T O P : S U S TA I N A B L E T R A N S P O R T
TABLE 3
Accessibility of public transport stops in Warsaw
Percentage of inhabitants living within 500 metres of a public transport stop
Bus (%) Tram (%) Train (%) Metro (%)
Warsaw total 98 50 8 8
Warsaw centre 99 62 13 9
Bemowo 97 69 0 0
Bialoleka 90 0 4 0
Bielany 99 65 0 0
Rembertow 82 0 18 0
Targowek 99 34 2 0
Ursus 97 0 12 0
Ursynow 99 0 0 48
Wawer 86 0 21 0
Wilanow 94 0 0 0
Wlochy 86 29 31 0

budget. Since the beginning of the transition period, thestate has not financed local transport. The only exception isthe Warsaw metro development project, which is partiallyfinanced from the central budget. Decisions are made everyyear by Parliament and are usually subjects of heated debate.
Discount fares continue to strongly inf luence the finan-cial results of operators. It is estimated that if urban trans-port companies received financial support from municipali-ties to compensate discount fares and free rides, it wouldcause an increase in cost-recovery ratios and ensure full costcoverage for urban transport companies in most cities.
Because of insufficient funds for investment and repairs,Polish cities and companies search for different ways to gainfinancial resources for these purposes. Unfortunately, the legalstatus of municipalities and state policies make it practicallyimpossible (with very few exceptions) for municipalities to usethe funds given by international financial institutions theWorld Bank and the European Bank of Reconstruction andDevelopment (EBRD), for example, which have systematical-ly offered support for urban transport.
Changes in the occupancy (or, “loading” factors) ofbuses in the past 10 years are shown in Table 5. Vehiclecapacity was calculated using the standard rate of 6.7 personsper square metre.
Unfortunately, state guarantees are are necessary formunicipalities to use this opportunity.
Use of economic instrumentsTaxes are not directly used to regulate public transport
patterns. This occurs indirectly, however, because subsidiesto the Municipal Transport Authority are used to cover thedifference between total operating costs of transport com-panies and revenues from fares and other sources. These sub-sidies come from the municipal budget, which is based ontax revenues. Therefore, how much money is allocated topublic transport depends upon the political decisions of themunicipal government. This determines the quality of serv-ices commissioned.
Bus transport
• Size of vehicle f leet: 1,606 buses.
• Average age: eight years.
• Average operational speed: 17.77 kilometres per hour.
• Kilometres travelled: 97,129,000 kilometres per year.
Rolling stock inventoryWarsaw possess the following makes of low-f loor buses:
• IK 411 — 2 buses;
• Jelcz M121M — 109 buses;
• Jelcz M181M — 46 buses;
• MAN NG313 — 60 buses;
• Neoplan N4020 — 104 buses; and
• Solaris Urbino 15 — 153 buses.
Warsaw possesses the following makes of medium- andhigh-f loor buses:
• IK 405 — 5 buses;
• IK 435 — 5 buses;
• IK 260 — 322 buses;
• IK 280 — 768 buses;
• Jelcz M11 — 5 buses;
• Jelcz 120 M — 70 buses;
• MAN SD202 — 1 bus;
• DAB — 3 buses; and
• other — 6 buses.
PA R T 1 : P U B L I C T R A N S P O R T — S TAT U S , P R I O R I T Y P R O B L E M S A N D N E E D SWA R S AW
N E X T S T O P : S U S TA I N A B L E T R A N S P O R T 61
TABLE 4
Renewal of Warsaw bus fleet (1996-2001)
Year Number of buses
Delivered (D) Cancelled (C) D-C
1996 55 92 -37
1997 183 135 48
1998 95 159 -64
1999 45 54 -9
2000 0 27 -27
2001 211 124 87
Total 589 591 -2
TABLE 5
Vehicle loading factors in bus transport
Loading factor Percentage of bus lines
1990 2000
Up to 60% 30.9 29.0
61-75% 27.3 35.8
76-90% 30.9 26.7
Over 90% 10.9 8.5

Tram transport
• Size of vehicle f leet: 869
• Average age: 18.5 years
• Average operational speed: 15.01 kilometres per hour
• Kilometres travelled: 47,359,000 kilometres per year
Rolling stock inventory
• 105N — 584 vehicles
• 13N — 247 vehicles
• 114Na — 30 vehicles
Change in the loading factors of buses in the last 10 yearsare shown in Table 7. As with buses, vehicle capacity was cal-culated using the standard rate of 6.7 persons per square metre.
Metro
• Size of vehicle f leet: 108 wagons
• Average travel speed: 36 kilometres per hour
• Kilometres travelled in 2001: 10,573,000 wagon-kilometres
• Average age: five years (new wagons have been deliveredgradually from the year 2000, and a total of 108 wagonswill be delivered in 2004)
Rolling stock inventory
• Type-81 Russian-produced wagons for four-unit trains — 60
• New Metropolis (Alstom) wagons for six-unit trains — 48
The loading factor of underground trains during peakhours exceeds 90 percent. The growth rate of the number ofpassengers is illustrated in Table 8.
Vision for public transport development
National transport policyIn the first years of the transition period, the central
government left all responsibilities for urban transport tolocal authorities. In view of emerging problems, a newapproach has been adopted. A new law defined the govern-ment’s responsibility for urban transport, and a new draftnational transport policy (Suchorzewski, 2001) clearly showsan intention to provide some assistance and support to localgovernments in the urban transport sector.
The National Transport Policy for Sustainable Develop-ment for the Period 2000-2015 assumes that the presenttransport policy has to be re-oriented for (among others) thefollowing reasons:
• the need to assign higher priority to sustainable devel-opment;
• the need to adjust the transport system to requirementsof the European Union (EU); and
• the necessity to balance the growth of motorisation withthe capacity to develop road infrastructure.
The need for extensive promotion of public transport,especially in cities and metropolitan areas, was mentionedamong the four main challenges for the Polish transport sys-tem. After reviewing various policy options, a sustainabledevelopment strategy was selected as a basis for formulatingdetailed policy objectives and measures.
Solving emerging transport problems in cities and met-ropolitan areas was considered a great challenge for thedecentralised state and local governments. One option isthat the state will assist municipalities through participationin financing the most important capital-intensive publictransport investment projects (first of all, rail systems in largeurban agglomerations), providing loan guarantees for system-
PA R T 1 : P U B L I C T R A N S P O R T — S TAT U S , P R I O R I T Y P R O B L E M S A N D N E E D SWA R S AW
62 N E X T S T O P : S U S TA I N A B L E T R A N S P O R T
TABLE 7
Vehicle loading factors in tram and underground transportLoading factor Percentage of lines
1990 2000
Up to 60% 29.0 17.8
61-75% 38.7 26.5
76-90% 29.0 50.0
Over 90% 3.3 5.9
TABLE 6
Renewal rate of trams (1996-2001)
Year Number of trams
Delivered (D) Cancelled (C) D-C
1996 13 29 -16
1997 18 18 0
1998 27 27 0
1999 26 31 -5
2000 20 26 -6
2001 62 70 -8
Total 166 201 -35

project upgrades and disseminating information on and pro-moting best practices in urban transport, including non-mechanised means of transport (bicycles, walking).
It is also envisaged that the state (through the ministryresponsible for transport) will create conditions for better coor-dination of local and regional development plans and pro-grammes containing components (such as roads) belonging todifferent functional levels (national, regional, county, local).New legislative initiatives of the ministry will arm municipali-ties with measures to generate financial resources for the devel-opment, maintenance and operation of transport systems.Parking charges, tolls for using bridges and entering city cen-tres, and congestion pricing were mentioned as examples.
Finally, the need to promote reforms in local transportmanagement systems and the cooperation of local governmentsin organising metropolitan transport system was stressed.
There is no doubt that the elements of national transportpolicy described above would be favourable for urban publictransport. However, the document has not yet been approved.
Another fact of the new approach is the latest act ofParliament on restructuring and privatising the Polish StateRailway Enterprise (adopted October 12, 2000). This act,through the building of a legal framework for modern,commercially-oriented rail services, also addresses solu-tions for urban and regional rail services on a similar basis,as mentioned earlier.
Local transport policiesTransport policies adopted in recent years by the author-
ities of several Polish cities have many points in common. Allthese policies are based on the principle of sustainable devel-opment. The term “sustainability” is used in its broadest sense— i.e. social, economic and environmental sustainability.
Generally, it addresses matters such as:
• integration of land use and transport planning;
• promotion of public transport;
• reducing car use in urban areas, first of all in central areas;
• traffic management;
• traffic-easing measures for central areas and residentialdistricts;
• promotion of the use of bicycles; and
• traffic safety measures.
This does not mean that there are no intentions toimprove and develop road networks and parking facilities.However, in most places it is assumed that priority shouldbe given to the development of roads in such a way that thecentral- and high-density areas will not serve through-traffic.
WarsawThe decision to formulate a new transport policy for the
city of Warsaw was taken in the early 1990s. During prepara-tion of a draft policy document, the results and recommen-dations of the first European Conference of Ministers ofTransport/Organisation for Economic Cooperation andDevelopment (ECMT/OECD) project on sustainable urbantravel were taken into account and used in the process of pro-moting the draft. Four options were studied, ranging from a“motorised city” to a “car-free city.” City authorities proposeda “sustainable transport policy” option for consideration.
After long discussions and consultations, the Resolutionon Transportation Policy was unanimously passed by theWarsaw City Council on November 27, 1995.
The general objective of Warsaw’s transportation policywas formulated as:
. . . the application of a strategy of sustainable development for the city through the creation of condi-tions conducive to the efficient and safe transportationof persons and goods, while guaranteeing priority forpublic transport. The development of transportationshould stimulate economic development and a spatialorder in the city; it should improve the city’s prestigeand decrease differentiation in development and thequality of life in specific areas of the urban agglomera-tion, while fulfilling (under existing and expected eco-nomic conditions) the requirements of restricting thenegative impact of transportation on the environment.
PA R T 1 : P U B L I C T R A N S P O R T — S TAT U S , P R I O R I T Y P R O B L E M S A N D N E E D SWA R S AW
N E X T S T O P : S U S TA I N A B L E T R A N S P O R T 63
TABLE 8
Number of passengers served by the Warsaw metro
Year
1995 1996 1997 1998* 1999 2000 2001**
Passengers (millions) 19.9 27.0 29.5 36.4 48.8 57.5 70.0
*Extension of one more stop constructed
**Extension of two more stops constructed

Evaluations of how the Warsaw transport policy of 1995was implemented have been performed on several occasions,including at an ECMT/OECD conference held in Athens inJune 1998. While this evaluation was, by no means, the sub-jective opinion of this author, it provided a general impres-sion of the degree to which objectives have been met andmeasures applied. Out of 68 points (objectives and meas-ures) analysed, two were considered fully implemented, 40partially implemented; nine were not implemented, butpreparations for implementation were at an advanced stage.In 14 cases no action had been taken, and in four casesaction could not be taken for lack of legal bases.
City authorities have designated metro construction asthe highest-ranking priority. However, in spite of devotingconsiderable resources (including those from the centralbudget), the construction of the first line has not progressedmuch — just 15 kilometres built in 18 years. Limited progresswas made in improving bus and tram transport, and theprocess of deterioration of suburban railway services has notbeen stopped. In particular, priorities for trams and buseswere introduced to a very limited extent. Warsaw is amongthose cities for which implementation of medium- and long-term strategies is hampered by an annual budgeting systemthat makes the execution of larger projects difficult.
While implementation of policies and plans is slow,there are good reasons for optimism. So far, no proposalshave been made to amend the policy.
In Warsaw, the objectives and general directions and meas-ures of the transport policy of 1995 were taken as given duringmost of the recent planning studies and programmes, includ-ing the Study on Conditions and Directions of Spatial Devel-opment adopted by the city council in July 1998. The conclu-sions and recommendations of this study were fully consistentwith the transport policy adopted three years earlier.
At the same time, public opinion has not changedregarding the status of public transport. The results of twotravel surveys completed in 1993 and 1998 show that themajority of respondents (64 percent in 1993 and 66 percentin 1998) are in favour of priorities for buses and trams intraffic (even if it aggravates traffic conditions for privatecars) — and support is growing. Even the majority of carowners (59 and 61 percent, respectively) are still ready towelcome certain measures, such as exclusive bus lanes.
The same survey disclosed that, among public transportusers, there is a shift from the use of buses to tramways. This ishappening at a time when new buses are being purchased, butthe tramway fleet is ageing. This trend would certainly be evenmore visible if plans to renew the tramway fleet and upgradethe tracks and power-supply system had been implemented.
Warsaw in comparison to other Polish citiesKrakow (750,000 inhabitants) was the first city in Poland
to introduce such measures as limiting car traffic in the historiccentre of the city and imposing parking charges (in 1987). Anew transportation policy adopted in 1993 was coordinated
with the Local Master Spatial Development Plan (approved in1994). Both included objectives such as curbing urban sprawl,traffic zoning and easing, priority for public transport, and aparking policy. In particular, the potential of the existingtramway system was recognised. In 1996, the city counciladopted medium- and long-term programmes for tramwayupgrade and development — including plans to build a new,faster tram line. This project is gradually being implemented incooperation with the EBRD. At the same time, great effortshave been made to improve the existing tram system throughfleet replacement, with priority given to the most congestedsections of the network and applying advanced methods ofquality management through contracts with operators.
Several other cities have followed Krakow and Warsaw inadopting the strategy of sustainable development accordingto the following principles:
• limiting the role of the car in the city and giving priori-ty to mass transport, pedestrians and cycle traffic, espe-cially in city centres;
• elimination or reduction of through-traffic by buildingby-passes and ring roads;
• pressing on with rehabilitation and more effective util-isation and modernisation of existing infrastructureand equipment, which includes better utilisation andupgrading of the extensive tramway systems existing inmany Polish cities;
• installing advanced systems of traffic management, withpriority given to mass transport; and
• widening the scope for using financial instruments (thefirst stage includes parking fees, with road congestionpricing to be included in the future).
For public transport, with its limited financial resources,priority is now being given to investments in bus and tramfleets in almost all cities: this includes equipment and softwareto assist operations, maintenance and management. Somecities (Katowice, Krakow, Lodz) have started upgrading theirtramway systems.
Great effort has been made to restructure operating com-panies with a view to improving their performance and/orreducing costs. Several cities have turned their mass trans-port operators into corporate organisations to be run undercommercial law. At present, they are still 100-percent ownedby municipalities, but managerial independence has beenincreased and they are seeking private partners and investors.
It is becoming common for municipalities to retainthose regulatory functions (service patterns, schedules, fares)now often carried out by a specialised transport authority —thus leaving operations to company management.
Relationships between operators and municipalities areincreasingly regulated through service agreements based onfixed rates for agreed vehicle-kilometres of service and strin-gent performance control.
PA R T 1 : P U B L I C T R A N S P O R T — S TAT U S , P R I O R I T Y P R O B L E M S A N D N E E D SWA R S AW
64 N E X T S T O P : S U S TA I N A B L E T R A N S P O R T

There is growing awareness of the importance of qualityamong both authorities and operators. In cities where contractsare used, they contain quality requirements. Simple measures ofquality are evolving — from punctuality to more complex meth-ods of quality evaluation, with several criteria and advanced sta-tistical means of quality control. Financial incentives (bonusesand penalties) for operators have been introduced. Marketingstudies and stated preference surveys are becoming popular.
Influence of European UnionAs in other countries, most European Union accession-
related programmes, plans and EU directives in the transportsector pay high regard to matters of international and nation-al transport. During the whole transition period, only asmall part of EU financial and advisory assistance was relat-ed to local transport matters. Obviously, following EU direc-tives regarding transport as a whole (for instance, technicaland environmental standards, commercialisation and de-monopolisation) also has an impact on local transport.
In Warsaw’s case, there has been some assistance with for-mulating transport policies and plans. Examples of projectsto assist city authorities have been provided in this case study.
Priority problems and needs In Warsaw, as in other Polish cities with growing motori-
sation, the number of passengers using urban public trans-port is decreasing. In the process of decentralisation, moreresponsibility was passed to local governments, but the statestill intercepts a very high proportion of taxes. As a result ofnational policy, cost recovery from fare revenues sharplyincreased to levels much higher than in EU countries. Butthe long-term consequences were serious. With scant finan-cial resources, the scope for f leet renewal, infrastructurerepair and modernisation, and system development was nar-rowed to a minimum. Capital-intensive projects have almosttotally ceased, except for continuating construction of theWarsaw underground, which is co-financed by the statebudget on a year-to-year basis. In fact, in recent years, this isPoland’s sole example of state assistance for urban transport.
Warsaw authorities made great efforts to reduce subsidiesthrough increasing fares and by putting pressure on opera-tors to increase efficiency. The Municipal Transport Author-ity was created, and service agreements or contracts withmunicipal transport companies were introduced. Only inrecent years were private operators contracted to providesome services, but their role remains limited.
The integration of municipal transport with suburban rail-ways is another unsolved problem. In Poland, internationaland inter-city services have been emphasised in improvementprogrammes for railway operations. The concept of transfer-ring the responsibility for subsidising commuter/suburbanservices to local governments is often promoted, for example,by international finance institutions (i.e. the World Bank,
EBRD). This requires not only establishing a legal framework,but also the financial resources in municipal/county budgets.With the present difficulties in financing the operation anddevelopment of urban transport, the problem cannot beresolved without changes in the national finance system —namely in the formula for allocating national funds.
It is clear that long-term continuation of existing poli-cies will lead to degradation of the public transport system,and to other undesired effects. The need to increase theinf low of financial resources is obvious. The list of possi-ble steps includes:
• revising fare policy and refinancing of discounted fares;
• introducing various forms of taxation (such as taxingtransport system beneficiaries); and
• introducing charges for the use of roads and city parking,with allocation of part of the revenues to public transport.
The gap between the availability of city finances and theneed to maintain and modernise urban public transport leadsto the conclusion that the most promising ways of using lim-ited resources is through investment in:
• an advanced system of traffic management in urban pub-lic transport companies;
• rehabilitation of tramway infrastructure and upgradingexisting tramway lines (especially those on separatedtracks); and
• urban traffic management systems providing prioritiesfor public transport vehicles.
Last, but not least, a change in state policy with regardto urban transport is urgently needed. The government hasgone too far in decentralising the transport sector. In thiscontext, perhaps it is worthy to quote one opinion and rec-ommendation published in the 1995 World Bank report onurban transport in Poland (Warsaw City Office, 2000),where it was written:
. . . [T]he absence of any explicit state interest or actionrelated to mass transport is anomalous . . . It is recom-mended that the Ministry of Transport and MaritimeEconomy should be re-engaged as the functional “spon-sor” of mass transport. This would not be a return to oldpaternalistic ways and a purse-holding role, but wouldfollow an agenda common to ministries of transport inindustrial economies.
Unfortunately, this recommendation is still valid to theextent that in the recent World Bank memorandum“Poland: Strategic Priorities for the Transport Sector”(World Bank, 1994), among 10 “strategic recommendations”the following can be found: “set up an urban transport pol-icy and support unit in the Ministry of Transport (or in theMinistry of the Interior).”
PA R T 1 : P U B L I C T R A N S P O R T — S TAT U S , P R I O R I T Y P R O B L E M S A N D N E E D SWA R S AW
N E X T S T O P : S U S TA I N A B L E T R A N S P O R T 65

Measures to address problems andneeds at national and local levelsNational level
According to prevailing views of experts and the WorldBank, the state probably went too far in decentralising all urbanpublic transport and handing the responsibilities to municipal-ities. There is a need to change this situation — for example, byadopting solutions presented in the draft national transportpolicy described earlier. This would be consistent with practicesin European Union countries and some accession countries.
Other measures include resolving the following problems:
• financing public service obligations and redistributingtaxes (including the fuel excise tax) and revenues;
• financing suburban railway services; and
• developing cooperation between local governments inthe metropolitan area.
Local levelMeasures to be applied at the local level are determined
by the main directions of local transport policy. To imple-ment the sustainable transport policy adopted by the War-saw City Council, it is essential that high priority be givento urban public transport. This can be done throughincreased subsidies to cover the deficit of operating costsand implementing projects listed below.
National and municipal contributionAs mentioned earlier, state contributions for financing
public transport projects in the city was and is limited to co-financing the construction of the Warsaw metro. But evenin this case, this is done on a year-to-year basis, which doesnot allow for multi-year project planning and execution.
Metro construction is a priority public transport projectand, in fact, absorbs most of the municipality’s resourcesallocated to public transport investment. During the wholeperiod of transition (1989-2001) other investments in publictransport were limited to f leet renewal and extending thetram network by three kilometres. Only in recent years havemore resources been allocated to modernising tracks andpower-supply systems, but more improvements are necessary.
Transport programmesInternational support and assistance for feasibility stud-
ies, assessments, institutional strengthening, capacity build-ing, investments and loans include programmes such as:
• Warsaw Urban Transport Review, The World Bank, 1992.
• Warsaw Public Transport Investment Programme,EBRD, W.S./Atkins, 1993.
• Feasibility Study for the North-South Urban TransportCorridor, Phare Project, W.S. Atkins, Societe FrancaiseEtudes Realisations Transports Urbains (SOFRETU),French Engineering Consultants (BCEOM), WarsawPlanning Development Office (BPRW), 1996.
• Urban Transport in Warsaw. Railway East-West Connec-tions, Phare Project, WS Atkins, International Consult-ing Engineers for Rail and Urban Transport (SYSTRA),BCEOM, BPRW, Metroprojekt, 1997.
• Warsaw Transport Node, Phare Project, WS Atkins,BPRW, 2003.
Financial institutions International financial institutions (World Bank, EBRD)
offered loans to Warsaw a number of times but, for two rea-sons, without any success. First, there is a lack of willingnessfrom national governments to guarantee municipal debts.Second, city authorities have not necessarily been interestedin investigating the viability of implementing projects con-sidered by international financial institutions. Generally,banks have recommended concentration on maintenance,rehabilitation, and upgrading projects, as well as projectsaimed at making better use of existing facilities, such asadvanced traffic management systems. But policy makershave assigned highest priority to expensive, investment-heavyprojects, such as the Warsaw underground.
A list of priorities does exist, but the cost of implemen-tation is much beyond the city budget’s capabilities. The listincludes a number of projects that would improve the qual-ity of public transport. In addition to the metro project(which is to be accelerated, and which is the top priority ofcity authorities), the following projects are on the list:
• renewing tram and bus f leets;
• upgrading selected tram lines serving the main corridorscrossing the city centre (in addition to metro and sub-urban railways); upgrading would include: modernisationof tracks, stops and power supply, traffic priorities atintersections, advanced traffic management and real-timeinformation for passengers via internet and mobilephone (pre-feasibility study is completed);
• building short sections of trams in peripheral zones;
• introducing tram/bus priority traffic control at intersec-tions; this is to be incorporated into the Advanced Traf-fic Management System (CEZAR); a related tender isapproaching its second stage;
• increasing the length of bus lanes;
PA R T 1 : P U B L I C T R A N S P O R T — S TAT U S , P R I O R I T Y P R O B L E M S A N D N E E D SWA R S AW
66 N E X T S T O P : S U S TA I N A B L E T R A N S P O R T

• developing park-and-ride schemes; and
• establishing a railway connection between the city centreand Okecie International Airport.
Endnotes1 Rate of exchange – EUR1 = PLN4
2 Total amount allocated to metro construction.
3 Summarised in “Urban Travel and Sustainable Development,” ECMT/OECD, Paris 1995.
ReferencesIGKM (Chamber of Urban Transport). Urban Transport in Poland. workingdocument prepared in the framework of the QUATTRO project. Warsaw1997.
IGKM. Komunikacja miejska w liczbach (annual reports).
IGKM. Warsaw. 1999.
IGKM. Warsaw, 2001.
Implementing Strategies to Improve Public Transport for Sustainable UrbanTravel. International workshop. Athens. June 3-4, 1999.
Suchorzewski, W. Transportation Policy for the Capital City of Warsaw – ThreeYears After Adoption. ECMT/OECD.
Suchorzewski, W. “The Funding Of Public Transport Investment in CentralEurope.” Paper presented at the International Union of PublicTransport/European Conference of Ministers of Transport (UITP/ECMT)Seminar on Financing Urban Public Transport. Paris. October 13-14, 1999.
Suchorzewski, W. et al. Urban Transport in Poland. 1998.
Suchorzewski, W. et alt. (2001). Urban Transport in Poland. 2000.
Suchorzewski, W. “Transport Policies in the Countries of Central and EasternEurope - Policy Framework.” ECMT Transport Policy Forum. Paris. February26-27. 2001.
Warsaw City Council. Budget for Year 2002.
Warsaw City Office. Implementation of Policies for Sustainable Develop-ment. Questionnaire on urban travel. Prepared for ECMT/OECD project onsustainable urban travel. 2000.
World Bank. Poland: Urban Transport Review. Report No. 12962-POL. Wash-ington, D.C. October 28, 1994.
World Bank. Poland: Strategic Priorities for the Transport Sector. Report No.19450-POL. Washington, D.C. June, 1999.
PA R T 1 : P U B L I C T R A N S P O R T — S TAT U S , P R I O R I T Y P R O B L E M S A N D N E E D SWA R S AW
N E X T S T O P : S U S TA I N A B L E T R A N S P O R T 67

68 N E X T S T O P : S U S TA I N A B L E T R A N S P O R T

N E X T S T O P : S U S TA I N A B L E T R A N S P O R T 69
Part 2Public Transport Financing —
Status, Priority Problems and Needs

70 N E X T S T O P : S U S TA I N A B L E T R A N S P O R T

General Data Location, population
Situated in southwest Romania about 60 kilometres fromthe Danube River, 100 km from the Carpathians and 250 kmfrom the Black Sea, the city of Bucharest stretches along anarea of 228 km2, plus another 365 km2 that represent themetropolitan area. Bucharest has all the characteristics of ametropolis, including a population of 2 million (with a pop-ulation density of 36 inhabitants per hectare).
Bucharest represents the political, economic, adminis-trative and cultural centre of the country, with clear occi-dental tendencies in all its respects. Due to its dimensions— at least five times bigger than any other Romanian city— and also to its status as the nation’s capital, the admin-istration of city services involves special issues that requirespecial means and structures to solve.
A considerable area of agricultural land still existswithin city limits. In the north of the city there is a largeforest, Baneasa-Tunari. Along the urban perimeter, there isa series of lakes bordered by green areas, and within thelimits of the built territory there are many green areas andwater surfaces (these occupy 35 percent of the city sur-face). Bucharest has a compact urban area and a richnessof green zones and lakes that give it the potential for suc-cessful urban development.
The current urban development plans take into consid-eration the physical-geographical conditions of the area andimpose certain directions, both for the transport networkand dispersion of the attraction poles. At present, Law No.50 of 1991 (concerning the authorisation of constructionand some measures for house building) is the basic law thatprescribes procedure and norms for building and land use.
Law No. 50 of 1991 stipulates in Article 2: “The buildingpermit is issued on the basis of respecting the documents ofurban and territorial development approved in accordance withthe annex, which is an integral part of this law.” The annexshows documentation for urban planning and territory arrange-ment with the organisations in charge of assent and approval.
The Territory Arrangement Plan should be preparedfrom the national level down to the communal level. TheGeneral Urban Plan (PUG) runs from the municipal level tothe “village level” and for resort areas. The Zonal Urban Plan(PUZ) is prepared for the central part of each level of admin-istration and for zones of special use or protection. TheDetailed Urban Plan is a set of documents required for everyconstruction project in the urban area and classified intotwo categories: national and local.
Bucharest Municipality is now preparing its RegionalTerritory Arrangement Plan (PATZ) that covers theBucharest metropolitan area (BMA), including peripheralcommunities, as well as the PUG within the municipality.
Characteristics of the transport networkBucharest’s transport network features:
• an incomplete radial-circular road network (nine radialarteries, two semi-circular arteries and one outer circularartery at the edge of the urban area);
• an inter-regional/international railway network, with a ter-minal point at Gara de Nord (Northern Station) on theinner traffic ring, and on the outer traffic ring a railwayline for freight transport for the factories in these areas;
• an underground railway network that links the city cen-tre to the industrial/residential areas along every radialdirection, and a circular route below the inner trafficring (used as a link between local points of interest: Garade Nord and Obor); and
• surface networks for other transport modes such astrams, trolleybuses and buses, which are poorly integrat-ed, both with each other and with the underground.
Attraction polesAreas of interest to the public have a large impact on the
mobility of the population, and therefore on public trans-
N E X T S T O P : S U S TA I N A B L E T R A N S P O R T 71
Bucharest, Romania

port needs. The following factors inf luence the balance ofpublic transport in Bucharest:
• concentration of activities regarding luxury trade, educa-tion/culture, health and administrative services, as wellas the historical structures in the city centre;
• transformation of some old buildings located in the citycentre (ex-residential areas) in commercial areas;
• suspension of construction works on a considerablenumber of blocks of f lats in the city centre;
• change of the relationship between home and the work-place, and increasing distances have resulted in the stag-nation of industrial activity (prior to 1990 there was aprogramme in which high blocks of f lats were built forworkers near industrial platforms);
• existence of small or medium-sized factories within theperimeter of residential/commercial areas;
• construction of medium- or high-quality living spaces insuburban areas;
• recent construction of large commercial centres in sub-urban areas aimed at aff luent car owners;
• wholesale storehouses near the border of the urban area; and
• agricultural surfaces and vast forest areas in the suburbanarea to be built up.
Urban mobility and quality ofenvironment in the Bucharest area
Although a city is, in many ways, a superior arrangementof habitation, it is a dynamic system that depends heavily onother environmental systems and sub-systems. A study of therelations between the physical-geographic framework andguidelines for physical development of Bucharest’s urban areamust take into account the impact of any extension on thesystemic functions of the city. The structure of transportinfrastructure plays an important role in urban development;satisfying mobility need in turn, impacts the environment.
Urban mobility is bringing significant changes to theBucharest area. It is necessary to draw up some mobility sce-narios adjusted to the “personality” of urban structure. Inthis context, transport is an important factor for develop-ment, and accessibility to functional areas of the city has tobe a priority of urban-territory planning and transport net-work planning. Thus, the links are clearly defined amongurban-, transport- and environmental strategies.
Urban transport strategy is related to principles of urbandevelopment. It takes both the satisfaction of mobility needsand environmental impact into account. From this point ofview, improving the quality of environmental parameters inBucharest refers primarily to improving air quality and
decreasing noise and vibration levels, with priority given tocentral areas and residential districts.
The evaluation of environmental conditions in the urbanarea of Bucharest was included in the Transport Master Plancarried out by JICA. The conclusions of the study aboutquality of environment factors were the following:
• The transport sector plays an essential role in the quali-ty of the urban environment and the environment ingeneral. Transport contributes heavily to pollution levels,and different transport means are the main source ofnitrogen dioxide (NO2) and carbon monoxide (CO),which are the principal pollutant compounds in theurban environment. The harmful effect of pollution onhealth is more powerful in the urban environment,where most of the population lives. On the other hand,transport plays a key role in economic activities andincreasing travel convenience.
• The considerable impact on the environment by theroad transport sector is due to emissions of nitrogenoxides (NOx), carbon monoxide (CO), volatile organiccompounds (VOCs), lead and other particulate matters(PM). Those substances affect not only ambient air qual-ity directly, but also some substances causing adversepollution, such as photochemical smog.
• The emission volume of each substance is related to vehiclespeed, where the emission volume is greater at low speeds.
• In a comparison between Bucharest and other Europeancities, Bucharest is less polluted from NOx, sulphur diox-ide (SO2) and carbon dioxide (CO2), but more pollutedwith particulates, lead and VOCs. Particulate matter andlead concentrations sometimes exceed the standard values.These substances have larger concentrations in the citycentre, where traffic volume and congestion are greater.
A vehicle’s technical specifications are an important fac-tor in its emissions. In conformity with the survey carriedout by the Romanian Auto Register, 68 percent of all regis-tered vehicles in Bucharest do not correspond to EURO2standards from the point of view of technical conditions.This percentage includes the bus f leet belonging to RATB.Of the entire f leet, only 40 percent meet European stan-dards; the others have classic engines.
Regarding the fuel types sold in Bucharest during 1995-2000 — leaded petrol, unleaded gasoline and diesel oil — theshares are 59 percent, 7.2 percent and 33.8 percent respective-ly. According to statistical data, leaded gasoline represents 89.1percent and unleaded gasoline 0.9 percent of the total petrolsold. The large amount of leaded petrol sold is the result of thelarge number of vehicles that fail to meet European standards.
The growth of registered vehicles from 1995 to 2000 is 4.7percent on average, with large growth in private cars, lorries,trailers and motorcycles. In conclusion, the volume and tech-nical conditions of private cars would have to be considered
PA R T 2 : P U B L I C T R A N S P O R T F I N A N C I N G — S TAT U S , P R I O R I T Y P R O B L E M S A N D N E E D SB U C H A R E S T
72 N E X T S T O P : S U S TA I N A B L E T R A N S P O R T

as a major source of pollution in order to mitigate air pollu-tion in Bucharest. Table 1 lists technical measures in place inthe EU that reduce environmental impact, and the corre-sponding situation in Bucharest and Romania as a whole.
Analysis of traffic tendencies in the study area
The General Urban Plan regulates and guides city devel-opment and land use policies, including policies regarding theextension of the public transport network in Bucharest. Atpresent, the road network in the study area (Bucharest and itsmetropolitan area) includes the streets that belong to theperipheral inner traffic ring (administered by Bucharest Munic-ipality) and the road network that links the towns in the met-ropolitan area (administered by the Ministry of Transport).
Bucharest’s road network of is structured mainly on twoconcentric (central and peripheral traffic rings). It has a radi-al and circular distribution and a total length of approxi-
mately 1,900 km. The distance between the main streets inthe central area (the inner traffic ring) is roughly 1 km onthe east-west axis and 2-3 km on the north-south axis.
Traffic volume on the boulevard network (nine boule-vards converge on the inner traffic ring and city centre —Piata Unirii) and can reach 50,000 vehicles per day in bothdirections. At the same time, traffic congestion has causedmore and more problems, ref lecting the accelerated rhythmof individual traffic.
The congestion points are located in the main intersectionsalong the inner traffic ring, in the central area and on the road-way along the north-south axis. Congestion has a negativeimpact on travel times, air pollution and parking problems.The city does not have enough parking facilities in the centralarea, which leads to the occurrence of “parasite” parkingspaces on the roadway. The city’s traffic management is cur-rently done by using a traffic light system that covers 240 inter-sections (it has a synchronised flows only on the arterial roads)and the one-way traffic system implemented in the central area.
PA R T 2 : P U B L I C T R A N S P O R T F I N A N C I N G — S TAT U S , P R I O R I T Y P R O B L E M S A N D N E E D SB U C H A R E S T
N E X T S T O P : S U S TA I N A B L E T R A N S P O R T 73
Comparing transport-sector measures to reduce pollution in the EU and Romania
TABLE 1
EU ROMANIA/BUCHAREST
Technical measures
Emission standards on CO, VOCs, NOx and PM for • RNTR 1 – Romanian Car Registerall types of motor vehicles • Air Quality Standards – STAS 12574-87
Fuel-quality standards concerning lead, • Technical Conditions for Atmosphere Protection,sulphur and benzene Annex 4: MFWE gasoline features (STAS 176-80) and
diesel oil features (STAS 240-80). MFWE contains the norms for gasoline quality
Noise standards for motor vehicles • Only for type approval executed by the Romanianauto register
• Regulation 51-EU (with the amendments 51.01 and51.02), transposed in entirety from the European leg-islation
Construction measures
Low noise asphalt, noise protection walls along No legal regulationsmajor roads
Integration of transport infrastructure into the landscape Ordinance No. 43/1997 governs road transport
Bridges and tunnels for animals crossing roads No legal regulationsand railways
Transport planning and traffic management Ordinance No. 44/1997 governs road transport
Provision and improvement of public transport facilities There are some decisions made by local authorities
Provision of separate cycling lanes along roads No legal regulationsand in cities
Restriction of car use in inner cities and residential areas There are some decisions made by local authoritiesvia pedestrian zones, speed limits, parking restrictions,road safety measures, and alternate odd and evennumber plate access;

Analysis of public transport systemsoperating in Bucharest
The main public transport operators in Bucharest areRATB — the surface public transport operator under BucharestMunicipality — and METROREX — the metro network admin-istrator, subordinated to the Ministry of Transport.
Even if Bucharest has a solid public transport network oftrams, trolleybuses, buses, underground rail, and maxi-taxis, thevehicles of the fleet used by the public transport operators can-not cover transport demand, due to the following:
• The f leet has an insufficient number of vehicles.
• Average wear of the f leet is over 60 percent.
• The infrastructure of surface-rail transport is, on average,65 percent worn.
• There is no independent public transport authority.
• There is no specific information regarding the volume anddispersion of public transport demand in the territory.
PA R T 2 : P U B L I C T R A N S P O R T F I N A N C I N G — S TAT U S , P R I O R I T Y P R O B L E M S A N D N E E D SB U C H A R E S T
74 N E X T S T O P : S U S TA I N A B L E T R A N S P O R T
Comparing transport-sector measures to reduce pollution in the EU and Romania
TABLE 1 (CONTINUED)
Extension of rail, waterway and combined transport • Ordinance 42/1997• Ordinance 43/1997 – Roads• Ordinance 44/1997 – Road transport• Law 129/1996 – Railway transport• Government decision HG 190/1997 – Activity
contract of SNCFR (the Romanian Railway Authority)
Bans on through traffic No legal regulations
Economic instruments
Internalisation of external costs for all transport modes • Law 118/1997 (regarding the setting up of a special through taxes and fees (e.g. energy tax, fuel tax, fund for the public roads)road pricing and parking fees) • There are some taxes for the use of the Danube-
Black Sea canal and for civil airports• There are some parking fees in urban zones, locally
established (for Bucharest, Decision DPG1558/1994)
Differentiated purchase taxes (e.g. leaded and Only for petrol (unleaded is cheaper)unleaded fuel)
Scrap benefits to encourage owners to replace older For the moment, there are only small discounts onpolluting vehicles with cleaner vehicles with catalytic excises paid for imported cars that respect EURO2converters
Differentiated transport taxes (e.g. in the EU) Law 118/1996 (roads tax), completed by government ordinance 72/1998
Other
Regular in-service emission tests for vehicles RNTR 1 – Romanian auto registry: periodic technicalinspections, according to minister of transport order353/1998
Time restrictions on transport movements (e.g. bans Local authorities decide these restrictions locally. For on night and weekend driving for heavy vehicles) Bucharest there are some decisions regarding heavy
freight vehicles (HCLMB 18/1992, HCLMB 18/1993,DPG 67/1993)
Lowering and enforcement of speed limits for vehicles Decision of modifying and completing Decree No.328/1966 (March, 1999)
Educational campaigns There is no plan at the national level. Locally, the trafficpolice and NGOs have occasional events
Carrying out an existing resolution (e.g. European EU directives (e.g. EURO2)Conference of Ministers of Transport resolution ontransport and environment (No. 66) and power and speed(No. 91/5) and conventions (e.g. Sofia Protocol forNOx emissions)

The public transport structure, the quality level, thebringing of operational costs to an acceptable level, devel-oping and achieving an integrated, high-quality public trans-port — all of these depend on political and administrativecommitment, as well as on their social and economic impli-cations ref lected in the city’s dynamism and functionality.
Analysis of mobility and modal split in Bucharest
Studies were made on people’s travel choices in order toestablish the travel needs within the city and its metropoli-tan area. Three main mobility stages were determined, irre-spective of transport modes:
• daily travel alternation from/to home and office (gener-ates the most significant traffic f lows during peak hours);
• visits made during spare time in areas of interestendowed with social-cultural—, sports— and shoppingfacilities; and
• short trips for urban and extra-urban recreational areasfor rest and relaxation.
Public transport covers 80 percent of the 5 million dailytrips in the metropolitan area. Based on the origin-destinationpolls carried out by specialised institutions (PROED S.A.) dur-ing 1993-1995, the following modal split was estimated:
• 6 percent — pedestrian walks (registered in 15-20 minuteisochrones);
• 9 percent — trips by individual transport modes;
• 65 percent — trips by surface public transport modes(RATB fleet), including trips taken to the suburban area;
• 17 percent — trips by underground; and
• 3 percent — trips by maxi-taxis and taxis.
With its 2 million inhabitants (and a population densityof 36 inhabitants per hectare), the city of Bucharest has allthe characteristics of a metropolis. It represents the political,economic, administrative and cultural centre of the country,having an obvious tendency towards the “western” way oflife in all its respects. The capital is also the first and mostdirect promoter of the Romanian image to visitors. Due toits dimensions — at least five times bigger than any otherRomanian city — and also to its status as capital, public serv-ice management raises special issues — the solving of whichrequires special means and structures.
A well-balanced and motivated analysis of public trans-port functioning, of its effects on economic and social activ-ities, on the environment and urban landscape, can begin byunderlying its particularities as compared to other activities.A different approach must be used so that some of the gen-eral economic criteria should not lead, by a simplified man-
ner of application, to misdirected actions and conclusions.The “efficiency” criterion, in particular, requires an analysisthat takes into account all aspects exceeding the restrictedframework of the public transport operator.
Travel needs depend directly on the intensity of eco-nomic and social life and increases in living standards, duein part to the tendency to separate residential areas fromindustrial areas. More than that, transport demand aroundlarge cities ref lects their “areas of economic inf luence.”From this perspective the importance of public transport isdue to its advantages over private transport: bigger capacityat the same degree of carriage occupancy, with lower energyconsumption and pollution (per passenger-kilometre).
The general advantages brought to society by this travelmode provide the motivation to endorse some active meas-ures for protection and encouragement, namely: protectedtariffs and traffic facilities. The use of private cars is dis-couraged by introducing access restrictions and high parkingrates in the city centre, in addition to actions taken byauthorities to promote public transport.
A typical challenge in achieving a proper understandingof and support for public transport development inBucharest is pointing out the indirect benefits. These bene-fits are equivalent to the price paid by society for a possi-ble lack of action in the field, with major effects on energyconsumption, pollution levels, urban sprawl, road capacityand traffic safety. At present, Bucharest supports all thesecosts, and the environmental costs are higher and higher.
The benefits of public transport are, however, dissipatedin fields where we do not yet know the dimensions of finalenergy, environmental and social costs, but also “geograph-ic” time, for economic enterprises that have neither the habitnor interest in admitting the advantages of their activities.For example, we can demonstrate a 1 percent decrease ingeneral fuel consumption, which is an effect of public trans-port systematisation in an area with 10 major intersections.It is difficult to express these effects in figures, but it is acompulsory activity, at least when the feasibility studies arecarried out for international financing.
The structure of public transport in Bucharest, is basedon two principles:
• meet all the inhabitants’ needs; and
• maintain continuity in operations.
Surface public transport service is characterised by intenserequirements over a short period of time, various loadingdegrees according to travel directions, served areas and char-acteristic periods of the day, integration of general traffic, andthe crossing of numerous conflict points. In order to providea high-quality service, it is necessary to have regularity, an aver-age speed compared with general traffic speed, an acceptabledegree of comfort, geographical proximity to customer needs,and reasonable tariffs. Apart from these elements, there mustbe accessibility for people with special needs and for disad-vantaged social categories that modern and civilised societies
PA R T 2 : P U B L I C T R A N S P O R T F I N A N C I N G — S TAT U S , P R I O R I T Y P R O B L E M S A N D N E E D SB U C H A R E S T
N E X T S T O P : S U S TA I N A B L E T R A N S P O R T 75

should protect — children, the elderly, persons with physicaldisabilities, and low-income earners.
Urban public transport, which has become an importantpart of human activity, continues to be a problem in mod-ern cities and is generally subordinated to political inf lu-ences (trends). On the international level, technicians, econ-omists and specialised authorities warn politicians more andmore about the role of public transport in efficient land useand land arrangement, as well as the necessity to analyse thisactivity through indirect advantages, which are for all peo-ple, including those who do not use this service. Theseadvantages justify the involvement of authorities in financ-ing the development and operation of public transport,improper functioning or interruption of which hindersmany fields of activity.
Evolution of surface public transport in Bucharest (1989-2003)
Any analysis of public transport after 1990 must start fromthe state of this service provided by RATB from 1989 to 2003.
After continuous degradation during a decade markedby deficiencies and arbitrary interventions, and whichreached its climax with the total elimination of subsidies in1988 and 1989, the situation of surface public transport inBucharest became critical. During 1990-1991, programmeswere established, based on a diagnostic report and a long-term study. Although these programmes could not be fullycarried out due to financial difficulties, the progress madewas obvious and, in comparison with other efforts, spectac-ular. The main indicator of the public transport service,which takes into account both qualitative and quantitativeaspects (seats offered multiplied by kilometres) have regis-tered continuous and favourable evolution. In this respect,the truth lies more in the street than in the figures, becausethe reference points employed have changed: The maximumcalculated offer is different: it is not calculated at 8.5 pas-sengers per square metre, but at 6 passengers/m2, which isstill far short of European standards.
The city of Bucharest has a solid public transport net-work, as well as urban and social premises that can pro-mote and develop this activity. The light rail and tramwaynetwork, while featuring exclusively — or almost exclu-
PA R T 2 : P U B L I C T R A N S P O R T F I N A N C I N G — S TAT U S , P R I O R I T Y P R O B L E M S A N D N E E D SB U C H A R E S T
76 N E X T S T O P : S U S TA I N A B L E T R A N S P O R T
Operational network length, 1989-2003
FIGURE 1
0
50
100
150
200
250
300
350
400
450
1989 1995 2003
Tramway
Kilo
met
res
of T
wo-
way
tra
ck
BusTrolleybus

sively — surface routes, offers the general advantages ofelectric transport, but also creates dependency on a f ixedtrack and overhead network, which leads to an increasedvulnerability to disturbance caused on its own or by gen-eral traff ic. Acquisition and maintenance costs of therolling stock are important, but obviously lower thanunderground railway costs.
The bus network is characterised by a large movementtowards autonomy, rapid organisation and route modifica-tion and low initial investment (vehicles and street furni-ture, without infrastructure). Its disadvantages are lowerreliability and higher pollution levels. Buses are favouredby passengers because of their greater mobility.
The trolleybus network is conceived as a feeder networkfor the underground and tramway networks. Trolleybuses canalso replace some sections of the tramway route — normallyin extremities of the network or in central and/or historicalareas — where demand is lower, and to avoid the vibrationsgenerated, which have a damaging effect upon old buildings.
Bucharest has developed on a radial road structure, onwhich the public transport network was laid. The network’slength, covered by all surface public transport modes,
increased by 104 km from 1989 to the end of 2003. Althoughsome routes have been opened, and others have beenreopened, the density and structure of the network do notmeet transport demand. There are areas in the city where sur-face public transport is absent, or nearly: Calea 13 Septembrie,B-dul Mircea Voda, Cartierul Gherghitei, Cartierul Malaxa.
Figure 2 illustrates the increase in length of the busnetwork, mainly because of the extension of the coveredarea in the suburbs.
PA R T 2 : P U B L I C T R A N S P O R T F I N A N C I N G — S TAT U S , P R I O R I T Y P R O B L E M S A N D N E E D SB U C H A R E S T
N E X T S T O P : S U S TA I N A B L E T R A N S P O R T 77
Number of network lines, 1989-2003
FIGURE 2
0
20
40
60
80
100
120
140
160
180
1989 1995 2003
Num
ber
of li
nes
TotalBusTrolleybusTramway
TABLE 2
Average operating fleet
1989 1995 2003
Total fleet 1,192 1,457 1,434
Tramway 397 389 360Trolleybus 193 178 200Bus 602 890 874

The study period featured a decrease in length of theelectric rail transport network. This situation was caused bythe poor condition of the tram track, which had been con-structed in the 1980s. The track proved unreliable, and therewere severe deficiencies regarding operation and mainte-nance, as well as of discomfort from increasing noise levelsand vibrations caused by tram traffic. During 1994-1995,RATB dismantled some sections of track with lower trans-port demand and obsolete infrastructure.
An analysis of the number of transport lines shows anincrease in bus lines due to the extension of the transportnetwork in the suburban area. The link between Bucharestand the localities in the neighbouring counties, on a radiusof 40 km, is provided by RATB (with a few exceptions) byassigning 20 percent of its bus transport capacity for thispurpose. Regional transport is necessary and must bedeveloped, but the beneficiary communities do not con-tribute financially to the operational system, the entire dif-ference in tariff being supported by the local budget ofBucharest Municipality.
The average distance between tram stops decreased from0.528 km to 0.520 km due to restructuring of the public
transport network. For bus transport, the average distancebetween stops has decreased from 0.635 km to 0.529 km, andat the same time the operational fleet has increased, whichreflects an increase of the need for mobility and of the dis-persion of attraction poles in the entire city area.
The average public transport speed of transport modes isdecreasing due to the pressure of private transport on car-riageways and on public transport vehicles, as well as theprecarious state of the infrastructure.
The first light rail route, a transport system implementedfor the first time in Bucharest in 2001, somehow modifiesthese average values of commercial speed. This transport sys-tem includes a constructive solution for the tram track to besegregated from general traffic, which gives greater autonomyin traffic and the possibility to reach a higher travel speed (25km/h compared to an average of 13-16 km/h). See Figure 5to see how public transport speeds have changed over time.
The number of passengers transported is an indicatorderived from economic elements that are analysed based oninformation given by the volume of revenues for all types ofRATB transport titles — free passes being added for somesocial categories.
PA R T 2 : P U B L I C T R A N S P O R T F I N A N C I N G — S TAT U S , P R I O R I T Y P R O B L E M S A N D N E E D SB U C H A R E S T
78 N E X T S T O P : S U S TA I N A B L E T R A N S P O R T
Bus fleet by engine type
FIGURE 3
0
200
400
600
800
1000
1200
1400
1995 1998 20021990 1996 1999 2001 2003
IKARUS,classic engine
ROCAR,EURO I-II
SAVIEM,classic engine
DAF,EURO I-II
UDM,classic engine
1997 2000

It is estimated that, in the coming years, the intensifyinguse of private cars will drive down public transport demand by1-3 percent per year. This tendency is due to the fact that thereis no possibility to compensate for this phenomenon with anincrease in public transport attractiveness. No drastic drop inthe number of passengers using public transport is in sight, buttransport demand will change in the following ways:
• Peak hours will shift (e.g. the morning peak will shiftfrom 5:00-9:00 to 7:00-10:00).
• Travel directions will be modified due to diminishingindustrial activity.
• Some residential areas will rise in prominence.
• Certain market segments will demand special services,such as higher speed and comfort.
“Loading” is expressed by the number of passengers persquare metre of vehicle f loor space. The lower the indicatorvalue, the higher the quality of transport service offered topassengers. Service quality increased in 1995 and 2003, ascompared to 1989, but f leet reductions have led to a slightincrease of the indicator for tramways and buses.
The only reliable figures for loading degrees of urban pub-lic transport vehicles in Romania are the result of traffic surveys
carried out in the Cars to Public Transport in the Urban Envi-ronment (CAPTURE) project (half-financed by the EuropeanCommission, Directorate General VII — Transport Research &Technological Development). The project’s purpose was toassess the possibilities for modal and inter-modal transfer fromcars to urban public transport on a European scale.
The traffic surveys were carried out in the summer of1996 on two types of urban areas in order to study and com-pare general traffic behaviour. The areas chosen were:
• Central urban — B-dul Unirii; and
• Main circulation corridors — B-dul Iuliu Maniu (Pacii,Armata Poporului). The results of the surveys can befound in Table 3.
The occupancy for urban buses in Bucharest is esti-mated at 40 passengers per vehicle, as compared to 25-30 passengers per vehicle in developed Western coun-tries. The last values represent a desideratum and weestimate the quality of transport services will increasein order to provide higher comfort levels for passen-gers. This is a very important aspect for viability andspeeding up the modal transfer to public transport. Thetransport capacity def icit was estimated at 20 percentand this has negative effects on travel comfort, revenuelevels and vehicle loads.
PA R T 2 : P U B L I C T R A N S P O R T F I N A N C I N G — S TAT U S , P R I O R I T Y P R O B L E M S A N D N E E D SB U C H A R E S T
N E X T S T O P : S U S TA I N A B L E T R A N S P O R T 79
Average distances between stops
FIGURE 4
0.0
0.1
0.2
0.3
0.4
0.5
0.6
0.7
19951989 2003
km
Tramway Trolleybus Bus

The main causes of this situation are:
• a dilapidated transport network infrastructure (track androads), which inhibits everyday traffic and contributes,for example, to more than 200 incidents per year involv-ing trams;
• continuous over-demand for surface public transport inareas with underground routes, due to poor route plan-ning, average distance between stops and reduced trans-port offers (B-dul Iului Maniu, Cartier Berceni, Sos.Oltenitei, Cartier Titan, etc.); and
• the disorder that characterises Bucharest’s urban traffic:illegal parking (including parking in the bus and trolley-bus stops), non-observance of transport lanes and a badtraffic light system.
Public transport demand in a complex urban area cannotbe covered adequately by one single mode. An optimal solu-tion involves a major network of metro/light rail/tramway ina “spinal column” supported by a bus and trolleybus network.This solution is one of the common conclusions of consul-tancy and feasibility studies made by specialised companies. Inaccordance with these studies, the RATB’s position is that thispotential must be achieved through the rehabilitation of infra-structure and fleet inventory, and through good companymanagement of the economic and institutional environment.
RATB marketing strategyThe starting point for drawing up this strategy is the gen-
eral downward trend of public transport demand by 1-3 per-cent per year, due to the increase of private transport use.The objectives of this strategy are the following:
1. Maintain the present surface public transport network,which is split into three transport modes: fixed tramnetwork; f lexible bus network; complementary trolley-bus network.
2. Extend the new, light-rail transport system (LRV).Means: rehabilitation of some current tram lines for whichtransport demand exceeds 15,000 passengers per hour. Result: completion of a public transport system of medi-um capacity that could be extended to suburban areas tomeet greater transport demand.
3. Reorganise the public transport system according tomodern principles.Means: carrying out an integrated public transport sys-tem, based on the interaction of the current transportsystems (including the metro); arrangement of multi-modal stops; tariff integration (use of a unique transporttitle for all vehicle types belonging to the public trans-port operators); obtaining traffic facilities for publictransport (dedicated lanes, segregated track, preferentialtraffic control system).
PA R T 2 : P U B L I C T R A N S P O R T F I N A N C I N G — S TAT U S , P R I O R I T Y P R O B L E M S A N D N E E D SB U C H A R E S T
80 N E X T S T O P : S U S TA I N A B L E T R A N S P O R T
Average speeds of public transport modes
FIGURE 5
0
2
8
10
12
14
16
18
19951989 2003
km/h
Tramway Trolleybus
6
4
Bus

Result: improved service quality, increased attractivenessand travel speed, and reduced operational costs.
4. Proportion the f leet to best meet transport demand.Means: replacing worn-down buses and trolleybuses andrenewing the tram fleet.Result: reduction of the transport capacity deficit, offuel consumption, degree of chemical pollution andoperational costs.
5. Diminish the impact of transport on the environment.Means: rehabilitation of tram and trolleybus networks,use of buses equipped with EURO2-standard motors.Result: reduction of noise, vibration levels and air pollution.
6. Modernise the fare collection system.Means: adopting a computerised system.Result: precise information on transport loading (loadingdegree), fraud reduction, management improvement of thecirculating fleet; increased efficiency and attractiveness of
public transport activity as a result of tariff integrationbetween RATB and other public transport operators.
7. Introduce access facilities for people with special needs. Means: introducing low-f loor transport modes, creatingspecial access systems, and rearranging stops.Result: increased public transport attractiveness, andalignment with international standards.
8. Modernise passenger information systems.Means: adding general information items (maps,brochures) and displays in stops and on board vehicles.Result: increased public transport attractiveness, improve-ment of company image, reduced transfer times.
9. Install a high-quality computer system.Means: computer system modernisation by creating areal-time data collection system, procurement of vehicleidentification and tracking system (GPS).Result: optimising traffic management and reducingoperational costs.
PA R T 2 : P U B L I C T R A N S P O R T F I N A N C I N G — S TAT U S , P R I O R I T Y P R O B L E M S A N D N E E D SB U C H A R E S T
N E X T S T O P : S U S TA I N A B L E T R A N S P O R T 81
Transport capacity (total kilometres)
FIGURE 6
0
20
40
60
80
100
120
1989 1995 2003
Total Trolleybus
Mill
ions
Tramway Bus
“Vehicle per kilometre” is a quantitative indicator that shows the evolution of transport capacity relative to vehicle characteristics.
A slight discrepancy exists for 2003 due to the removal of obsolete vehicles, which reduced the size of the fleet.

10. Improve RATB’s financial parameters.Means: reducing operational costs and diversifyingfinancing sources.Result: halving operational subsidies and alleviating pressure on the local budget.
Several of these objectives have been achieved or are inprogress.
Subsidies for surface public transport
Surface public transport has always been subsidised inRomania. In the 1990s, especially between 1995 and 1997, therewere successive tariff increases for surface and undergroundpublic transport, as well as significant increases in fuel prices.
Public transport has a strong social aspect, whichexplains the high percentage of tariff subsidies. Generally,the municipality bears 70 percent per trip of the cost for sur-face public transport. The subsidy received by RATB during
1990-1995 was between 72 percent and 82 percent of totalrevenues. The purpose of this measure was to maintain ahigh level of public transport use.
The local budget of Bucharest Municipality benefitsfrom state budget allowances for subsidising some invest-ment activities. The amount takes into account an estimatemade by the local authority (Bucharest Municipality) onthe transfers needed from the central budget. The propos-als for budget allowances are submitted for approval to theMinistry of Finance, but the approved amounts are gener-ally less than required.
At the national level, the Ministry of Finance has estab-lished a policy to guarantee social protection, and it approvestariffs and subsidies for public transport. Because govern-ment policy is oriented towards the market economy, publictransport efficiency is a priority. Consequently, RATB hasimplemented a series of measures to increase the efficiency ofits activities by separating some auxiliary activities (a com-plete overhaul, construction of tram track, the washing ofvehicles) from the main activity of passenger transport.
PA R T 2 : P U B L I C T R A N S P O R T F I N A N C I N G — S TAT U S , P R I O R I T Y P R O B L E M S A N D N E E D SB U C H A R E S T
82 N E X T S T O P : S U S TA I N A B L E T R A N S P O R T
Coverage of transport demand in terms of seats per kilometre
FIGURE 7
0
2,000
6,000
8,000
10,000
12,000
14,000
1989 1995 2003
Total BusTrolleybus
Mill
ions
4,000
Tramway
The “offered seat per km” indicator, calculated at 6.5 passengers per square metre, illustrates how well the transport system covers transport demand.

The percentage of subsidies allocated to RATB, as com-pared to the percentages of subsidies allocated to other trans-port companies in large cities around the world — compa-nies whose performance parameters are similar to those ofRATB — is at a high level (see Table 4).
The significant subsidy reduction is due to the fact thatthe municipality faced an acute financial crisis that made itimpossible to grant budget allowances in the amountsrequired and justified by RATB in compliance with thenorms in force. The subsidy for 2003 was 20 percent lower.The impossibility to allocate the calculated amount led tothe restriction of RATB’s activities.
RATB’s financial resources include:
• revenues from tickets and monthly passes sold at RATB’sown centres of sale (which represents approximately 30percent of the costs);
• the tariff difference allocated by the Local Council, whichis calculated in accordance with the MethodologicalNorms of the Ministry of Finance and represents the socialprotection offered to certain categories of citizens; and
• budget allowances to cover capital expenses, in compli-ance with the Law on Public Finances.
In order to reduce pressure on the local budget, the effi-ciency and attractiveness of public transport service must beincreased. The primary way to do this is through investmentsin infrastructure and f leet modernisation.
The development of public transport costs less thanurban plans intended to cope with the explosive increase inindividual traffic. The efficiency of public transport mustnot be gauged by operational revenues, but rather by theindirect advantages for the urban community (increasedenvironmental protection, low fuel consumption, comfortand safety).
Public transport does not benefit by financing fromenvironmental funds. An environmental fund was estab-lished in Romania in 2002, but has yet to become fully oper-ational. No private-public partnership agreement has beenconcluded in Bucharest.
PA R T 2 : P U B L I C T R A N S P O R T F I N A N C I N G — S TAT U S , P R I O R I T Y P R O B L E M S A N D N E E D SB U C H A R E S T
N E X T S T O P : S U S TA I N A B L E T R A N S P O R T 83
Passengers transported per year per mode
FIGURE 8
0
50
100
200
250
350
400
450
19951989 2003
Mill
ions
Trolleybus
150
300
Tramway Bus

Financing investment programmes and state contributionfor infrastructure projects
Experience tells us that those countries with long histo-ries of public transportation have enjoyed state support forfinancing major infrastructural works — works that could notbe otherwise carried out by funds from independent opera-tors or local budgets. This is especially true for the infra-structure required for rail transport, which offers maximalcapacity, specific energy consumption and an environmen-tally friendly attitude, but this is extremely expensive anddoes not have any benefits — especially with controlled tar-iffs. Under these circumstances, privatisation and grantingare out of the question, and the public transport operatormust lay out a significant amount of capital. According tothe present European concept (as applied to national railwaytransport), performance infrastructure is the responsibility oflocal and central authorities, on the basis of some strategicand social measures. Infrastructure is available for freelytitled public operators within a contract that sets out, among
other things, the relation between allocated resources andoperator performance — especially transport offers comparedto operational costs.
As for Bucharest, the situation requires the centralauthorities’ involvement in performing the investmentworks, including guaranteeing some external loans. Consid-ering the local character of the activity, the volume of theseinvestments — absolutely necessary for quality service —exceeds and will continue to exceed the possibilities of localbudget, which was even increased because of the new legis-lation. Investments, especially those for infrastructure, areextremely expensive, and their achievements are directly con-ditioned on positive effects in order to increase the opera-tional efficiency. It is, in fact, fully required and justified todivide this effort between local and central authorities — arespective ratio of 40/60, for example.
The current level of subsidy is 66.3 percent, and this fallsamong the higher values reported by other administrations.The specific condition of public transport and its significantrole in the social-economic life of the urban communitypresent a particular approach to financing.
PA R T 2 : P U B L I C T R A N S P O R T F I N A N C I N G — S TAT U S , P R I O R I T Y P R O B L E M S A N D N E E D SB U C H A R E S T
84 N E X T S T O P : S U S TA I N A B L E T R A N S P O R T
Loading degree per vehicle
FIGURE 9
0
2
4
6
8
10
12
1989 1995 2003
Total TrolleybusTramway Bus
Pass
enge
rs p
er m
2

The situation in Bucharest is different from other Euro-pean metropolises; not necessarily with respect to the per-centage of subsidy, but in comparison to the level andsources of the local budget allocated for public transport.The lack of financial resources has led to a significant gapbetween transport demand and supply, as well as to somequality problems of the public transport service. On theother hand, due to the fact that the local budget is the onlysource for subsidy, the role of public transport is not mir-rored properly in the socio-economic life of the city. Thebenefits received by economic enterprises in the areas cov-ered by public transport should be ref lected by developmentresources offered to public transport operators.
External financing sourcesCompared to the great need for funds, especially for
infrastructure investments, the shortage of f inancial
resources, which could be available for RATB from the localbudget, is obvious. Obtaining an external loan is not a prob-lem in itself. There is money, but it is something that has itsprice — interest, guarantees, assurance and costs for handlingthe credit. The business plans submitted, the feasibility stud-ies, political support, present economic situation and its per-spectives, country’s risk factors, and the investment policy ofthe financing banks are crucial factors towards achieving suc-cess for receiving and managing a loan.
As for public transport, the loan objective — (investmentsfor infrastructure) and the reimbursement source (the publicbudget) require restrictive conditions beyond the offer of acommercial bank, and beyond what a public company canaccept: maximum interest of 6-7 percent, a grace period ofminimum three years, and a minimum reimbursement periodof 15 years. Therefore, reimbursable financing is allowed onlyfrom some other international specialised financial institu-tions — the World Bank, EBRD, EIB, as well as from somebanks in countries with great financial surplus, like Japan. Forcomplex reasons, these banks grant loans with profitable con-ditions for infrastructure investment projects provided theyare guaranteed by the Romanian government.
On the heels of the first loan of EUR 63 million obtainedfrom EIB (and completed with an equal allowance from thelocal budget) for modernisation of the tram network in south-west Bucharest, RATB intends to follow the same path towardscontinued rehabilitation of its own infrastructure. At the sametime, it has tried to identify complementary and non-reim-bursable sources: EC funds for environmental restructuringand protection, governmental funds available due to bilateralagreements, and others. For instance, Dutch assistance is partof this final category for achieving traffic management for thefirst light rail in Romania and for a pilot project to introducetransport systems with low emission levels (LPG buses).
Undertaking projects with external financing sources
The modern concept of public transport managementand the present situation in Bucharest contends that theorganisation of public transport should involve a trunk net-work covered with electric rail transport (metro, light rail,trams). It should be focused on areas with high populationdensity and on corridors with high traffic f low. Thereshould also be secondary and tertiary networks covered withbuses and trolleybuses.
The secondary network has to supply stations of the pri-mary network and to operate routes where demand does notjustify the existence of the primary route. In order to takeover some passenger f lows under 10,000 passengers per hourand direction, lines should be created in a tertiary network.
With this in mind, a programme to rehabilitate the infra-structure in southwest Bucharest was drawn up. The pro-posed sections for modernisation within this project havebeen selected with the following considerations:
PA R T 2 : P U B L I C T R A N S P O R T F I N A N C I N G — S TAT U S , P R I O R I T Y P R O B L E M S A N D N E E D SB U C H A R E S T
N E X T S T O P : S U S TA I N A B L E T R A N S P O R T 85
TABLE 3
Traffic survey results
Average capacities
• Bus: 100 passengers• Trolleybus: 100 passengers• Tram: 250 passengers
Bus-loading levels
• Level 1 — up to 20%• Level 2 — 20-40% • Level 3 — 40-60% • Level 4 — 60-80%• Level 5 — 80-100%
Traffic survey results
• Unirii Boulevard– private cars: 1.59 passengers per vehicle– buses: 64 passengers per vehicle (3.2 loading degree)• Iuliu Maniu Boulevard– traffic on main circulation corridors– input/output from Bucuresti-Pitesti highway– private cars: 1.98 passengers per vehicle– buses:input: 56 passengers per vehicle (loading degree 2.8)output: 40 passengers per vehicle (loading degree 2)
Summary of previous results: the following loading limits are for peak hours.
• Private cars: 1.59 (urban central traffic) with 1.98passengers per vehicle (traffic on main circulation corridors)• Buses: 40 (traffic on main circulation corridors) with64 (urban central traffic) passengers per vehicle

PA R T 2 : P U B L I C T R A N S P O R T F I N A N C I N G — S TAT U S , P R I O R I T Y P R O B L E M S A N D N E E D SB U C H A R E S T
86 N E X T S T O P : S U S TA I N A B L E T R A N S P O R T
TABLE 4
RATB subsidies
TABLE 5
RATB financial sources
Years 1989 1989 1995 1995 2003 2003
ROL mn USD mn ROL mn USD mn ROL mn USD mn
Central budget Revenues 423,473.5 28,382.94 14,684,300 7,221.97 241,235,500 7,266.11
Expenditures 423,473.5 28,382.94 16,616,700 8,172.36 291,045,100 8,766.40
Level of - - 528,078.3 259.71 10,171,539 306.37local budget
Revenues received - - 233,696 114.93 3,281,484 98.84from local budget
- operational costs - - 157,760 77.58 2,571,284 77.45
- investment costs - - 75,936 37.34 710,200 21.39
Percentage - 44.25% 32.26%
Parameters RATB RATB International average value(1995) (2003) (big cities)
Level of subsidy 70% 51.75% 50-75%
Trips per inhabitant 317 466 100-300
Vehicle * km/employee 5,900 7,132 10,000-15,000
Vehicle * km/inhabitant 43.8 54.8 30-40
Trips/vehicle * km 7.2 8.5 2-5
Network density 2 km/km2 1.57 1.5-3 km/km2
TABLE 6
RATB expenditures
Years 1995 2003
ROL mn USD mn EUR mn ROL mn USD mn EUR mn
Operation costs 225,990 111.14 85.94 4,567,901 137.58 121.62
Tram 90,040 44.28 34.24 1,792,160 53.98 47.72
Trolleybus 31,474 15.48 11.97 631,009 19.00 16.80
Bus 104,476 51.38 39.73 2,144,732 64.60 57.10

• technical condition of infrastructure;
• operational data;
• condition of other transport modes;
• unity and functionality of the area;
• organisation and works’ performance capacity within thedeadline; and
• financing capacity of investment and payment of exter-nal debt.
The modernisation programme of the tram track in south-west Bucharest is financed in equal proportions by the Gener-al Committee of Bucharest and the European InvestmentBank. The contract was concluded in 1999 at a value of EUR126 million. The loan provides for the rehabilitation of 110 kmof tram track in southwest Bucharest, including four depots.
The feasibility study was made in 1999 and the pro-gramme will last five years. RATB has provided continuanceof the loan, and contracts with suppliers and subcontractorsare being concluded directly by RATB.
In Luxembourg, on November 16, 1999, and inBucharest, on November 19, 1999, the Financing Contractbetween Romania, the European Investment Bank andRATB was concluded to finance the Rehabilitation Projectfor Public Transport in Bucharest. Ratification of the con-tract was made by Order No. 19 on January 27, 2000 and
was published in the Romanian Official Journal No. 38 onJanuary 29, 2000.
Financing for the investment project is guaranteed by anEIB loan (EUR 63 million) and allowances from the localbudget of the General Council of Bucharest, according tothe financing plan enclosed to the subsidiary loan agree-ment. The subsidiary loan agreement concluded between theMinistry of Finance, RATB and the General Council ofBucharest was signed on November 24, 2000.
The forecasts, after the completion of the project, are:
• The transport offer will be increased by 20 percent.
• Revenues will be increased by roughly 10 percent.
• Operational costs will be reduced (expenditures formaintenance and repair of track and electrical networks)by about 80 percent.
• Expenditures for maintenance and tram repair will bereduced by about 50 percent.
• Energy expenditures will be reduced by 15 percent.
Implementation of the first light rail route was accom-plished from this rehabilitation programme. The resultsobtained are greater than those anticipated in the feasibilitystudy. The operational differences between tram and lightrail are significant, as seen in Table 8.
Advantages of the light rail transport system include:
PA R T 2 : P U B L I C T R A N S P O R T F I N A N C I N G — S TAT U S , P R I O R I T Y P R O B L E M S A N D N E E D SB U C H A R E S T
N E X T S T O P : S U S TA I N A B L E T R A N S P O R T 87
TABLE 7
RATB financial sources — revenue
Years 1995 2003
ROL mn USD mn EUR mn ROL mn USD mn EUR mn
Revenue from tickets 66,865 32.88 25.42 1,237,417 37.27 32.94and passes
Tram 28,752 14.14 10.93 555,672 16.73 14.79
Trolleybus 9,361 4.60 3.56 123,483 3.72 3.28
Bus 28,752 14.14 10.93 558,262 16.81 14.86
TABLE 8
Trams versus light rail
Transport Mode Operation Frequency System capacity Averagespeed (km/h) interval (min.) (passengers/h/ distance
direction) between stops (m)
Tram 12-15 4-10 700-4,500 300-400
Light rail 20-25 2-3 5,500-6,500 500-800

• useful and feasible system, attractive from the point ofview of infrastructure costs (3-10 times lower than thosefor the metro);
• cheapest public transport system regarding infrastructurelifetime (at least 30 years);
• no emissions, greater travel speed, safe services, higherdegree of comfort compared to trams;
• possibilities to develop existing tram-network infrastruc-ture; and
• easy adjustment to the urban environment.
The operational data of the light rail system has beenmodified significantly due to the use of segregated track. Theextension of track for public transport, intended only forlight rail, has the following benefits:
• avoidance of traffic conflicts, which creates minimumconditions for maintaining the timetable and increasingoperating speed;
• increased passenger safety at stops through the con-struction of protective fences; and
• security for the access of track maintenance staff.
An experimental traffic management system was intro-duced on the light rail route in the interest of giving highpriority to public transport by increasing traffic f low onvery crowded networks and, thereby, showing public trans-portation as the most effective means of reducing theamount of lost time due to traffic jams.
Traffic Management assures prioritisation at light railintersections, contributing to the achievement of optimalcommercial speed. Implementation of this system also assuresthe possibility of keeping a record of the vehicles in traffic,as well as setting the operating hours. There are 11 traffic-lighted intersections in the SPOT/UTOPIA system, whichfacilitate the running of light rail. All of these intersectionsanticipate general traffic f lows and set the traffic-light cycles.
Out of the Programme for Tram InfrastructureModernisation in Southwest Bucharest, part of the workswere carried out, and the constructive solutions of thetrack were changed for the tram section that links one ofthe most crowded districts in Bucharest (Rahova) with thecentral area. Modernisation improved the operationparameters of Line 32 and increased its attractiveness tousers. In the future, according to provisions of the trans-port master plan issued by the Japan International Coop-eration Agency (JICA), this tram line will be connectedwith another much used tram line (Line 21) for perform-ing a transport corridor towards NE-SV.
Tariff integration and a new fare collection system
The fare collection system currently used by RATB oper-ates on inferior technology and, naturally, is performing atan inferior level. The system no longer corresponds to pres-ent company management requirements, and is not com-mercially viable in terms of a secure income. The system isextremely vulnerable to fraud by falsification of tickets, pass-es or free passes, and it does not provide any informationregarding the real transport capacity and its distribution perlines, vehicles, period of time and trip structure.
A new fare collection system for RATB will keep itsopenness, but should offer complete data regarding trans-port capacity. It should make a more attractive tariff policypossible and it should offer better security for company rev-enues. Halving the present fraud that affects 25-30 percent ofrevenues obtained out of direct returns is a minimum objec-tive, and fully possible through the securing of transporttitles. The investment can be recovered from this sourcealone within at least five years.
RATB benefits from a programme, co-financed by EIBand the General Council of Bucharest (in the amount ofEUR 14 million), to modernise the fare collection system. Itcontains a medium-term strategy that provides for an exten-sion of the infrastructure modernisation programme for elec-tric rail transport in north/northeast and east/southeastBucharest. This programme will include rehabilitation of 150km of single track, of which a great part will become lightrail lines so that, in the future, city development will includethe extension of this type of transport system, and that trans-port demands will be fully covered.
The development strategy is based on capital invest-ments for infrastructure and vehicles, as well as on its owneffort to restructe and increase work and management effi-ciency. Improving public relations and the company imageare also taken into consideration as new elements within thesensitive balance between subsidised activity and an eco-nomic reality that is more and more competitive. Finally,there is need for financial and legislative-institutional sup-port for public authorities. In our concept, all these ele-ments can determine a public transport service at a levelrequired by its importance to Bucharest city life.
ConclusionsRATB’s (Bucharest’s main surface public transport opera-
tor,) experience of concerning efforts to offer an attractive trans-port service in difficult economic-financial conditions can besummarised by underlining the importance of capital invest-ment for infrastructure and vehicles, as well as its own effortsto reorganise and increase work efficiency and management.
The light rail transport system is an attractive form ofpublic transport that also presents numerous environmentaladvanages. It is also a cost-effective investment. Its other ben-
PA R T 2 : P U B L I C T R A N S P O R T F I N A N C I N G — S TAT U S , P R I O R I T Y P R O B L E M S A N D N E E D SB U C H A R E S T
88 N E X T S T O P : S U S TA I N A B L E T R A N S P O R T

efits include avoidance of increased traffic congestion, lesspollution, and enhanced passenger safety at stops.
Public transport will continue to be subsidised. On theone hand, revenues cannot balance operational costs due tothe contrast between specific (high) costs and social expec-tations. On the other hand, in order to evaluate efficiency,one must not consider only the aspects related to book-keeping, since efficiency is ref lected in benefits difficult toexpress in figures: the degree of air pollution, crowded urbanareas, energy and fuel consumption, comfort and safety.
RATB’s objective is to lower the level of subsidy to 50percent, and the achievement of this objective is conditionedby the continuance of the investment programme meant tobring down operational costs while at the same time,improve the quality of the public transport service.
A possible solution is to supplement RATB’s budgetwith funds obtained by introducing a fee for economicenterprises with more than 10 employees (a method thatother European cities, such as Paris, have tried). A contribu-tion of 2 percent of wages applied to the economic enterpris-es in the area of influence in Bucharest would have a minimaleffect on raising taxes and costs, but would represent 25 per-cent of the company’s yearly investment needs.
A new fare collection system for RATB has been proposedthat would provide complete information about public trans-port demand and allow for easier, more secure fare collection.
Improvement in customer relationships and of the com-pany image is also being taken into consideration as new ele-ments in a sensitive equilibrium between a subsidised activi-ty and economic reality that is more and more competitive.
Finally, it is necessary to obtain financial, institutionaland legislative support from public authorities. The barriersidentified in obtaining financing from international financ-ing bodies include:
• level of interest;
• grace period;
• reimbursement period;
• bank-required guarantees; and
• the Romanian economy.
We believe all these elements can create a good publictransport service that will suit present and future needs forthe city of Bucharest.
PA R T 2 : P U B L I C T R A N S P O R T F I N A N C I N G — S TAT U S , P R I O R I T Y P R O B L E M S A N D N E E D SB U C H A R E S T
N E X T S T O P : S U S TA I N A B L E T R A N S P O R T 89

90 N E X T S T O P : S U S T A I N A B L E T R A N S P O R T

N E X T S T O P : S U S TA I N A B L E T R A N S P O R T 91
General data Budapest was at the forefront of urban transport devel-
opment in the first half of the 20th century. The “Millen-nium” underground railway line, M1, was the first on theEuropean continent. It was completed in 1894, and thecity’s planned radial roads date back to the early commer-cialisation of the automobile. Two additional metro lineswere built after WWII, and during the roughly 40 yearsthat followed, the public transport system further expand-ed into a well-developed, multi-modal network. The systemincluded three metros, suburban railway lines, and exten-sive street-based bus-, trolleybus-, and tramway lines. Priorto 1990, public transport modes represented 70-80 percentof daily urban trips, automobile use was low, and theurban transport network was much more developed thanthe road infrastructure.
Similar to the situation in other former Eastern Bloccities, public transport was low-priced. The Budapest Trans-port Company (BKV), the operator of all urban transit serv-ices, recovered less than one-third of its operating costs frompassenger fares. The balance was compensated from the cen-tral budget. The state also contributed capital grants forinfrastructure improvement and rolling stock purchases.With the economic and political changes that began in thelate 1980s, it became clear that BKV’s public transportfinancing procedures were unsustainable.
Ownership of BKV was transferred to the Municipalityof Budapest, as part of the Self-Government Act of 1990.The municipality received substantial real assets and therequisite fiscal and spending powers, including the right toborrow. However, decentralisation coincided with govern-ment austerity measures aimed at reducing the budgetarydeficit — i.e. funds provided to local governments wereconstricted. On top of this, the government acted to pre-vent the municipality from proposed fare increases. Sincethe public transport fares are part of the consumer basketfor calculating the consumer price index, as an inf lationarycontrol measure the government restricted fare increases,without corresponding compensation to BKV.
BKV experienced difficult transformation consequencesfollowing decentralisation. The Municipality of Budapestwas unable to increase its revenue in line with reductions incompensation from the state, and this led to under-spendingfor vehicle replacement/maintenance and resultant difficul-ties in providing a high level of service. On the demand side,passenger numbers began to decline in the early transitionyears, as a result of economic recession and an employmentshift from the industrial to the service sector. Unemploy-ment and inf lation increased, and real wages decreasedamong the lower income brackets of society. Meanwhile, thesectors of the economy experiencing dynamic growth quick-ly adopted an automobile-centred way of doing business,which in turn led to an increase in the development of sub-urban areas. Demand for public transport dropped and traf-fic congestion increased. BKV was faced with the challengeof providing quality service to a declining number of users.
BKV realised considerable reforms throughout the 1990saimed at improving the financial position and performanceof the company. The Municipality of Budapest also madesubstantial progress in its financial position, particularly withrespect to developing its own revenue streams. Passengerdecline has levelled off, and BKV continues to make inroadstowards recovering more of its operating expenses from fares.However, BKV still does not fully recover its operating costsfrom all sources of compensation, liquidity has deteriorated,and working capital has been running negative for the lastseveral years. Unable to maintain its f leet and facilities, thecompany has been running down its assets.
Legislative policy and institutional developmentsRelevant legislative developments
Parliamentary Act LXV of 1990 on Local Self-Govern-ments (with an important amendment: Act LXIII of 1994)initiated decentralisation of power to local governments.This act laid the legal framework for defining the role of
Budapest, Hungary

PA R T 1 : P U B L I C T R A N S P O R T — S TAT U S , P R I O R I T Y P R O B L E M S A N D N E E D SB U D A P E S T
92 N E X T S T O P : S U S TA I N A B L E T R A N S P O R T
municipalities in local public-service delivery and infrastruc-ture investments. The scale of local government expendituresis exceptional, due to the extensive responsibilities at thelocal level. Revenue sources for the local government budg-ets consist of four main elements: independent revenues,shared revenues, normative grants from the central budget,and capital investment financing. Act XXXIII of 1992 onPublic Finances (important amendments: Act CV of 1995,CXXI of 1996, and CXLVI of 1997), ref lects on the local gov-ernments borrowing capacity. Municipalities can borrow attheir discretion within certain debt service limits.
The great number of tasks of the local government sec-tor (including public transport) creates dependence on fund-ing by intergovernmental transfers from the central govern-ment. The government provides funds for public transportin the form of compensation for revenue losses due to gov-ernment-imposed fare discounts for students and pensioners.Otherwise, legally, the government has no other role in pub-lic transport services. In 1996, the government discontinuedits operational compensation, which represented 7 percentof BKV’s operating cost in 1995.
Act LXXXVII of 1990 on Pricing transferred to municipalauthorities the power to set tariffs and prices of public utili-ty services. In 1995-1996, substantial fare increases wererealised, at rates considerably higher than inflation. For exam-ple, fare increases of 33 percent and 39 percent were approvedin March 1995 and January 1996, respectively, while the 1994inflation rate was 18.8 percent and the 1995 rate was 28.2 per-cent. Starting in 1998, fare increases were generally well underinflation, as the Ministry of Finance maintains leverage in tar-iff-setting as an anti-inflationary measure. The governmentpays no compensation for revenue losses due to its refusal toallow general fare increases at levels requested by the Munic-ipality of Budapest (MoB). This has led to the reluctance ofMoB in providing BKV with the financial support to breakeven, as the general feeling within the General Assembly ofMoB is that the government should provide additional com-pensation due to their refusal to raise tariffs to levels pro-posed by the municipal authorities.
A new Passenger Transport Law, expected to coincidewith EU accession, should help to promote a more con-ducive intergovernmental approach to financing BKV’s oper-ations. According to EU policies, if the compensation oflosses is not provided for, state or local self-governments areobliged to exempt the service provider from carrying outactivities causing losses upon request of the service provider— in some cases this procedure can severely disrupt the serv-ice activities. When taking their decisions, the authorities areobliged to select the transport modality causing minimumfiscal burdens.
Hungary passed the Act on Public Procurement (Act XL1995 and an important amendment to Act LX of 1999),which is applicable to BKV’s purchases from its ownresources. A new procurement law, which conforms fullywith the EU, takes effect on May 1, 2004. The law extends
public procurement obligations to certain utility companiesand entities using money coming from the EU cohesion andstructural funds.
Urban transport policiesPublic transport planning in Budapest has developed
from communist-era planning, to supply-oriented thinking,to integrated demand management. The first shift in urbandevelopment planning took place in 1991, and in 1994 a gen-eral master plan for the city was established. Throughout the1990s, there was increasing coordination among transport,financial, and urban development strategies. A conceptualurban development plan was accepted by the General Assem-bly in 2000.
The major long-term urban transport policy objectivesare to balance economic growth and social developmentmeasures, and to protect the environment. The key featuresof the urban transport strategy include (MoB 2004b):
• Improve the financial position and performance of BKVthrough a combination of revenue increases, operationalimprovements, and cost-reduction measures. Revenueswill be increased through fare hikes, a new fare systemand technology, fare unification to cover all metropolitanarea operators, and action against fare evasion. Improvedperformance and reduced costs will be achieved throughBKV plant modernisation, increased priority measures forstreet-based mass transport vehicles, service network ratio-nalisation, adjustment of service standards to reflectdemand, spinning off non-operational functions, and bet-ter organisation and management.
• Restrain vehicular automobile traffic in the inner citythrough a combination of traffic and parking manage-ment measures, including a new system of parkingcharges and better enforcement. The parking policy willcharge car users for parking in the city centre, but con-venient park-and-ride facilities will be provided in the out-skirts. The introduction of road user charges will also beexplored at a later date.
• Develop new sources and modes of public transportfunding, including a link between net revenue from park-ing and public transport financing.
• Establish the Budapest Transport Association (BTA), anintegration of BKV’s operations with the Hungarian Rail-way Authority (MAV) and the national bus lines (Volancompanies). The objective of the association is to offerintegrated transport solutions for customers commutingfrom the suburban areas.
• Adopt private transport restraint measures, includingpedestrianisation of city centres and promotion ofbicycle and pedestrian travel, coupled with parkingmanagement solutions.

PA R T 1 : P U B L I C T R A N S P O R T — S TAT U S , P R I O R I T Y P R O B L E M S A N D N E E D SB U D A P E S T
N E X T S T O P : S U S TA I N A B L E T R A N S P O R T 93
BKV reformsBKV was transformed from a state-owned enterprise to a
joint stock company in 1996, managed by a Board of Direc-tors. It is fully owned by MoB, which exercises its ownershiprights in two ways: through majority representation onBKV’s Board of Directors, and through an operational con-tract, negotiated annually.
BKV’s internal organisation has been restructured andstreamlined. Some activities were divested, and separate sub-sidiaries were formed for core services. Maintenance work-shops were also set up as subsidiaries, with the intention ofdivestiture in the near future. Personnel was reduced by 38percent: from 21,000 in 1995 to 13,000 in 2001.
Since 1998, the company has strengthened its marketingand public information activities by operating a system ofupgraded “brand lines,” which provide more comfortableservice on some key routes. These service improvements, inaddition to the procurement of new vehicles and improvedtracks and roads, helped level off the loss of passengers, asseen in Table 1.
Operating costs were difficult to reduce, given BKV’sf leet, which overall is still obsolete. BKV did manage toreduce total operating expenses in real terms by 20 percentbetween 1995 and 2001. The company has increased fareevasion inspection, but widespread illegal travel continuesto deprive BKV of needed revenues.
The company has significantly changed procedures forprocurement of renewed or replacement rolling stock andinfrastructure improvements. The Budapest Urban TransportProject (World Bank 2001) allowed BKV managers to honeproject management skills and shift from an engineering-dominated procurement process to a value-for-money andcompetition-focused procedure.
The World Bank project also led to the first opera-tional agreement between BKV and MoB; the first versionwas signed in 1995. The agreement outlines route andschedule specif ications for the network, performance indi-cators, remuneration of managers, and incentives based onoutput and service-quality indicators. Separately, BKV sub-mits a business plan, including an operational budget andinvestment programme. The MoB’s General Assemblyapproves the business plan and the amount of operationaland capital grants to the company.
Financial reform in the municipality of Budapest
Since the early 1990s, the Municipality of Budapest hasrealised exceptional growth of revenues from local taxes andfrom sales of properties and securities. The proportion ofMoB’s own revenues reached 48 percent in 2001 (MoB 2004b).Intergovernmental transfers include a share of personal tax,normative support, and earmarked funds. In 2000, total munic-ipal expenditures were roughly HUF 260 billion (i.e. thousandmillion), of which HUF 138 billion were allocated for the oper-ation of municipal institutions, and the remainder for devel-opment. MoB operation compensation to BKV (HUF 14.2 bil-lion in 2000) represents roughly 10 percent of the municipaloperating budget. In addition, MoB funds BKV with capitalgrants (HUF 5 billion in 2000).
MoB has also gained considerable borrowing experience.(First, access to domestic — then international — markets, andfrom money, to capital and bond markets were realised (Pallai,2001). MoB maintains a favourable credit rating and a sophis-ticated loan portfolio.
There is an ongoing debate between MoB and the gov-ernment regarding financing BKV’s operations. The govern-ment maintains that MoB should use more of its reserves tofund public transport, while MoB asserts that the govern-ment should meet a greater share of compensation due totheir refusal to raise tariffs according to MoB proposals.
Public transport operations in Budapest
Budapest has nearly two million inhabitants, roughly 20percent of the country’s population, and extends over an areaof 525 square kilometres. The history of the Budapest Trans-port Company dates back more than a century, and from1996, the enterprise was operated as a joint stock companyunder 100-percent MoB ownership.
More than 200 lines operate on the roughly 1,130 kmlong public transport network. BKV served almost 1.5 bil-lion passengers in 2000, and of these, roughly 40 percenttravelled by bus, 26 percent by tram, 23 percent by under-ground railway (i.e. M1, M2 and M3), 6 percent by trolley-bus, and 5 percent by suburban railway. Some further oper-ational details are listed in Table 2.
TABLE 1
Public transport ridership (in millions)
Year 1990 1995 1998 2003
Total passengers 1,690 1,520 1,390 1,390

Current sources of public transport financing
BKV has three main sources of operational revenue: farereceipts, MoB operational compensation, and governmentprice compensation (for discounts allotted to students andpensioners). Cost recovery from BKV’s own revenues hasincreased from 24 percent in 1989 to more than 50 percentin 2000, as seen in Figure 1.
However, the combined effects of fare revenue increas-es, cost reductions, and subsidies have not been sufficientfor BKV to break even. The company has seen its liquiditysuffer considerably in recent years due to reductions incompensation from the government and MoB that out-paced the increases in fare revenue it has taken in. Its networking capital at the end of 2000 was HUF 19.2 billion inthe red. BKV has insufficient income to cover either nec-essary renewals or new acquisitions, and thus has a rapidlydeteriorating f leet.
Alternate financing sources, lessons learnedPublic-private partnership
BKV has taken modest strides with respect to encourag-ing private sector financing for the operation and develop-ment of urban transport. The first phase in increasing therole of the private sector was divestiture of non-core servicesand the creation of subsidiaries, which facilitated the possi-bilities for outsourcing. The second phase was a pilot pro-gramme, starting in 1997 and expanding in 2000, involvingeight bus lines in southern Buda.
Financing preferences of MoB remain conservative, andboth MoB and BKV officials continue to evaluate the bene-fits and timing of increased private sector involvement. Sever-al municipal services were privatised in Budapest in the 1990s,including gas, water, and wastewater works. There was no pres-sure from private operators or international investors to enter
PA R T 1 : P U B L I C T R A N S P O R T — S TAT U S , P R I O R I T Y P R O B L E M S A N D N E E D SB U D A P E S T
94 N E X T S T O P : S U S TA I N A B L E T R A N S P O R T
TABLE 2
BKV data for 1989, 1995 and 2003
Year 1989 1995 2003
Total operational network (km) 1133.7 1133.3 1133.2
Total number of lines 263 214 232
Average public transport speed (minutes)
Bus 18.1 17.0 16.3
Underground railway 24.9 24.1 23.8
Suburban railway (HEV) 23.6 22.3 22.5
Trolleybus 13.2 13.0 11.6
Tram 15.7 13.7 13.3
Boat 5.2 5.6 n/a
Passengers transported (thousands)
Bus 840,210 749,391 570,469
Underground railway 331,893 271,113 315,046
Suburban railway 95,675 66,952 63,494
Trolleybus 112,198 82,488 81,853
Tram 453,331 350,472 367,075
Boat 1,183 204 0
Total 1,834,490 1,520,620 1,397,937
Total operational cost (HUF millions) 14,908 33,751 84,141
Revenue from Fare Receipts (HUF millions) 3,099 10,098 30,850
Source of data: BKV 2004

PA R T 1 : P U B L I C T R A N S P O R T — S TAT U S , P R I O R I T Y P R O B L E M S A N D N E E D SB U D A P E S T
N E X T S T O P : S U S TA I N A B L E T R A N S P O R T 95
the public transport sector. BKV was progressing well in costefficiency and level of service, but intergovernmental disputesresulted in uncertainty regarding external compensation.
Polluter paysBudapest has implemented a highly successful parking
management programme, consisting of park-and-ride facili-ties, new parking garages, and the establishment of pedestri-an-only zones. The parking scheme uses a pay-and-displaytechnique, and is under private management. Parking fees arehighest in the inner districts and diminish towards the fringes.
Starting in 2004, certain portions of parking receipts areearmarked for public transport financing (MoB 2004a).
Congestion pricing was a component of the BudapestUrban Transport Project (World Bank 2001), but was ruledout as “premature” just after the project was implemented.The introduction of parking fees was difficult enough tomanage, and the project team decided that in order to con-sider road pricing as a viable option, all other restraint meas-ures should already be in place. Proceeds from congestion
pricing could be used to supplement public transportfinancing, but bank and company officials agreed thatimplementation of road pricing should focus on urban roadinfrastructure development, not public transport.
Capacity strengtheningIntegration of public transport and land-use planning
For a number of years, integration of state-owned trans-port companies and BKV has been proposed for a numberof reasons, including:
• improved creditworthiness (larger organisations);
• increased competitiveness (with the onslaught of motori-sation), by offering more integrated transport solutionsfor customers commuting from the suburban areas intoBudapest; and
• harmonised lines, junctions, timetables, etc.
Breakdown of BKV revenue
FIGURE 1
1989 1995 2000
Gov
ernm
ent
oper
atin
g su
bsid
y
Gov
ernm
ent
pric
e su
bsid
y
Fare
s
Gov
ernm
ent
spec
ial s
ubsi
dy
Oth
er in
com
eof
BKV
MO
B op
erat
ing
subs
idy
Fare
s
Gov
ernm
ent
pric
e su
bsid
y
Oth
er in
com
eof
BKV
Gov
ernm
ent
spec
ial s
ubsi
dy
MO
B op
erat
ing
subs
idy
Fare
s
Gov
ernm
ent
pric
e su
bsid
y
44
32
24
30
24
7
32
7
41
12
2423
0
Perc
enta
ge

There is general consensus regarding the desira-bility of the association, not only from the passengers’ pointof view, but also to reduce costs and increase patronage ofthe public transport system. However, there has been noagreement on compensating the three operators for predi-cated revenue losses.
Service agreement between BKV and MoBThe service agreement between BKV and MoB should be
further developed, particularly with regard to compensationcovenants and longer-term planning. This will also requirereconciliation of intergovernmental compensation transfers.
The bonus/penalty system could also be expanded toallow more incentives for cost efficiency of the company.
Streamlining BKV operationsWhile public transport operators are pressured to maintain
continuity, it is also important to adapt their systems in line withurban development and in accordance with externalities such asenergy prices. The general trend of improving financial per-formance is to impose limits on the extent to which organisa-tions can undertake unprofitable social services. For example,BKV should continue to evaluate the viability of the tramwaysystem, a major money-losing operation for the company.
Bias towards capital-intensive planningCity planners should further develop the integration of
urban development objectives with improvements to thepublic transport system.
The decision to approve construction of the fourthunderground railway line (M4) involved complex forecastingamong municipal planners, government authorities, andinternational financial institutions. Reconciliation of theconsiderable debt burden to the central and municipal budg-ets was a major stumbling block, as well as possible restric-tions on other public transport developments. Certainorganisations, however, maintain that the funds to be spenton the M4 could have been better allocated in solving awider scope of public transport development in Budapest,reaching a larger proportion of the passenger supply andhaving greater environmental and economic benefits (CEEBankwatch Network, Clean Air Action Group 2002).
Alternate sources of financingMoB will start earmarking a proportion of parking
receipts to supplement public transport financing. There area number of other possible revenue streams to be consid-ered. For example, in Paris, employers and retailers areobliged to pay a fee for increased access to labour and retailmarkets that public transport provides to them (UITP 2003).Earmarking portions of the central environmental fund,automobile registration fees, and other public revenuesources should be debated.
Engaging the private sector in the public transport sec-tor will likely occur as risk conditions are gradually reducedand EU-conform regulations are in play. Ultimately, themunicipality will need to justify whether outsourcing to pri-vate contractors will result in real gains in productivity orcost savings, as compared to financing public transport withits own reserves or borrowing capacity.
Benchmarking practicesBenchmarking among the different transport modes
offered by BKV and among comparable public transportproviders throughout Europe would provide the companywith a means to establish whether or not value for taxpayermoney is being achieved.
Customer serviceMaintaining passenger supply is paramount to sustain-
able public transport development. Increasing fares, particu-larly at levels above inf lation rates, must be accompaniedwith tangible improvements in quality. The public authori-ties ultimately have the responsibility to ensure that theyhave achieved best value for taxpayer money. It is essentialthat the public understands and supports measures taken toenhance public transport and curb traffic growth. Effectivepublic communication is key to gaining this support.
Barriers to financial reformsThe major factors affecting implementation of financial
reforms in the public transport sector have been actions bythe government with regard to local government finance,and the leverage it maintains on prices.
Decision-making power has been transferred from thecentral government to municipalities without the necessarycontrol over sources of financing for these systems —notably the fiscal system.
Sustainability, conclusionsThe challenge facing Budapest (like many other urban
metropolises) is how to achieve an acceptable balancebetween commercial concerns and social responsibilities ofpublic transport, and, at the same time, remain competitivein the wake of rising automobile use. Investing scarceresources in a sector exhibiting a decline in demand is a dif-ficult dilemma facing many governmental authorities. Asdocumented by the International Union of Public Transport(UITP, 2003), the potential for public transport to con-tribute to mobility, to the functioning of urban economies,to the urban environment, and to combat social exclusion,should be recognised as the objectives of public transport.The fact that external funding is necessary for public trans-port providers should not lead one to the conclusion that
PA R T 1 : P U B L I C T R A N S P O R T — S TAT U S , P R I O R I T Y P R O B L E M S A N D N E E D SB U D A P E S T
96 N E X T S T O P : S U S TA I N A B L E T R A N S P O R T

the companies are inefficient.BKV is required to operate commercially and take the
same legal form as any private enterprise, but the companyoperates under a sensitive socio-economic context. The com-pany underwent substantial restructuring throughout the1990s: it divested many of its non-core activities, created sub-sidies with an outlook towards possible outsourcing later,and made considerable improvements in productivity. Near-ly 50 percent of BKV’s operating revenue is now obtainedfrom fare receipts and other own sources. However, decen-tralisation of fiscal management has been incomplete, andthe government’s concern about inf lation and its desire topush public-sector companies towards greater cost efficiency,without balancing its interventions regarding fare increasesand discounted travel with appropriate compensation, hashad a negative impact on the company (World Bank 2001).With due respect, the government has had the delicate taskof timing price liberalisation with wage movements andinflationary control.
Reconciliation of intergovernmental fiscal responsibili-ties needs to be achieved so that the financial viability ofBKV’s operations can be evaluated against long-term devel-opment strategies. With proper compensation covenants,creditworthiness will increase as external revenue streams areclearly definable and risk levels decrease (Cromwell andBruggeman, 2004). This will foster greater interest from theprivate sector and financial institutions; hence, competitionand levels of service will increase.
Public transport in Budapest has several positive aspectsthat could form the basis for long-term, sustainable urbantransport development. Firstly, the network is well-developed,and there is a strong tradition of public transport use.Although public transport passenger trips decreased duringthe 1990s, they still represent more than 60 percent of thetotal passenger trips in the capital. Realisation of land-use andtransport initiatives could be effective in reducing excessivesuburbanisation and traffic congestion. This will depend par-tially on what MoB and the government will do to regulatethe use of city streets by motor vehicles. MoB has madeimpressive progress using parking management as a means ofrestraint. Road pricing might be a more effective solution, butthis will require considerably more foresight and coordinationbetween urban road infrastructure and public transport plan-ners. In the shorter term, the authorities are more in a posi-tion to realise that the associations between urban publictransport (BKV), national railway operations (MAV), and thenational bus service (Volan) request a crucial step in laying thefoundation for a sustainable urban and interurban transportsystem in Budapest.
ReferencesBKV. 2004a. Personal communication. Budapest Transport Company. March2004.
BKV. 2004b. Publicly available information: <www.bkv.hu>.
CEE Bankwatch Network. Clean Air Action Group. 2002. Press release datedJuly 4, 2002.
Cornwell, P. and G. Bruggeman. Key Factors in Financing Urban TransportModernisation: Some Lessons from Central Europe. European Bank for Recon-struction and Development. London, 2004.
MoB. 2004a. Personal communication. Municipality of Budapest, Depart-ment of Public Transportion. March, 2004.
MoB. 2004b. Publicly available information: <www.budapest.hu>.
Pallai, K. Financial Management Reform in the Municipality of Budapest. WorldBank Institute. Atlanta, 2001.
UITP. The Financing of Public Transport Operations. Position paper. Interna-tional Association of Public Transport. Brussels, 2003.
World Bank. Budapest Urban Transport Project. World Bank. WashingtonD.C., 2001.
World Bank. 2001b. Cities on the Move. Conference Proceedings: WorldBank Urban Transport Strategy Review. Regional Consultation Workshop.Budapest, February 28-March 01, 2001.
PA R T 1 : P U B L I C T R A N S P O R T — S TAT U S , P R I O R I T Y P R O B L E M S A N D N E E D SB U D A P E S T
N E X T S T O P : S U S TA I N A B L E T R A N S P O R T 97

98 N E X T S T O P : S U S TA I N A B L E T R A N S P O R T

N E X T S T O P : S U S T A I N A B L E T R A N S P O R T 99
General data On March 11, 1990 the Supreme Council of the Repub-
lic of Lithuania passed the Act for the Re-establishment of theState of Lithuania. Before that date and slightly after, all ele-ments of the public transport sector were organised with aplanned economy in mind. All subsidies for public transportduring the Soviet period were provided by the ministries ofcommunication and finance. Depots (for buses and trolley-buses) were obligated to prepare plans and forecasts fordeferred income, runs and number of buses on routes for thenext year. Ministries allocated subsidies for the following yearaccording to these plans. Depots were able to cut down onthe number of runs when facing insufficient subsidisation.
However, following the re-establishment of independ-ence, the situation worsened. The lack of a clear legal basisfor providing funding caused both Vilnius municipal buscompanies to build up enormous debts. The main cause wasthe lack of reimbursements from the municipality for con-cessionary fares. Public transport in Vilnius suffered mostfrom the economic declines of 1991-1994 and 1998-2000. Themunicipality provided compensation, but due to the eco-nomic situation and disputes with the government concern-ing the allocation of money for this activity, only a part ofthe calculated compensation has been given since 1994/95.
Private operators did not account for a large share of thepublic transport market in Vilnius in 1993-1995 and the pro-vision of services was chaotic. The preconditions for operat-ing a route were simple: a licence (purchase in tax inspection)was needed, along with coordination of the route with thetransport group in the municipality, which was responsible
for taxis and all other public transport operators. Thedepartment is very small, and employees are unable to con-trol and coordinate such a large number of transport vehicles,which explains why the data on private operators is lacking.
Huge changes began with the establishment of Commu-nication Services, a municipal enterprise that was founded(according to Resolution No. 230 of Vilnius City Council asof July 15, 1998) as part of the overall development of thepublic transport sector in Vilnius. Since the inception ofCommunication Services, the public transport system in Vil-nius has undergone faster and more progressive changes.However, there are unsolved legal and organisational prob-lems concerning the status of this enterprise.
General information about Vilnius public transport
The average population density in the city of Vilniuswas 13.8 inhabitants per hectare in 2003. The city has beenexpanding on the account of private constructions andadopted suburban areas. Usually the construction consistsof semi-detached or detached private houses, whichdecreases population density. The construction of multi-apartment houses is still very slow, although its rate is thefastest in Lithuania.
Changes in the number of inhabitants in Vilnius during1998-2003 are presented in Table 1.
All in all, it may be presumed that both residents andworkplaces are going to be placed farther and farther fromthe city centre, resulting in urban sprawl. This trend cancause further problems for public transport because the net-
Vilnius, Lithuania
TABLE 1
Number of Vilnius inhabitants: 1998-2003
1998 1999 2000 2002 2003
578,400 578,300 578,000 553,400 553,200
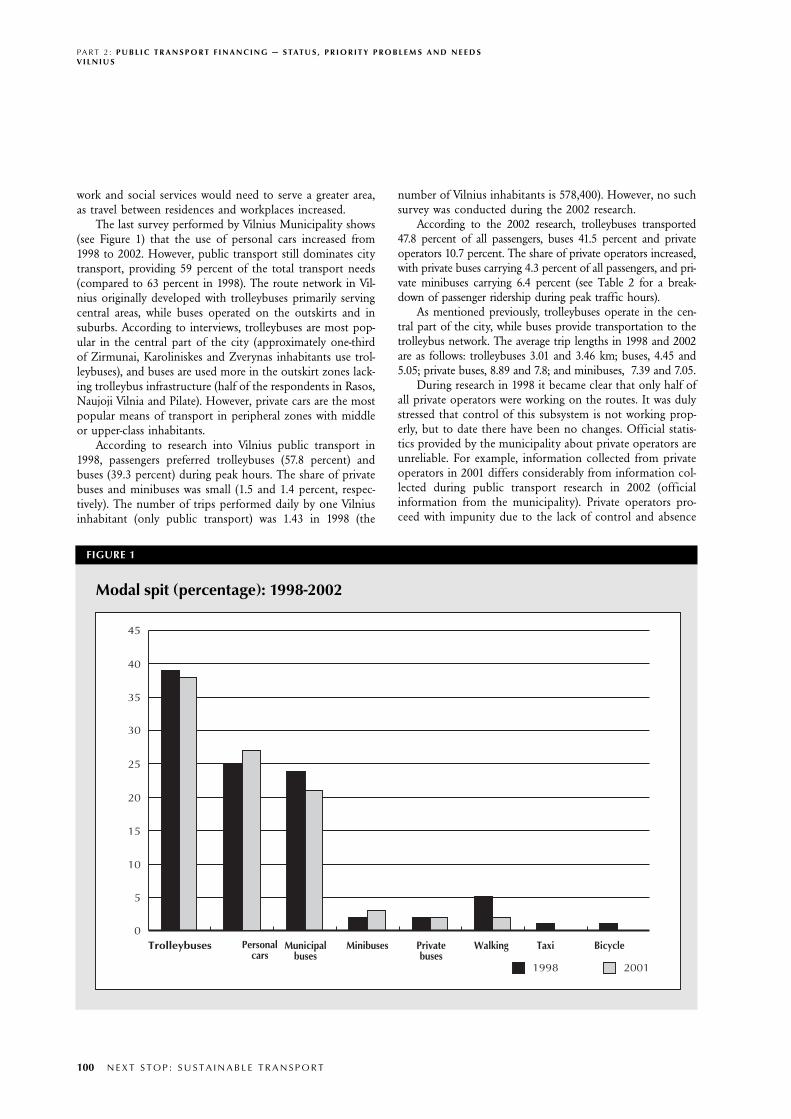
PA R T 2 : P U B L I C T R A N S P O R T F I N A N C I N G — S TAT U S , P R I O R I T Y P R O B L E M S A N D N E E D SV I L N I U S
100 N E X T S T O P : S U S T A I N A B L E T R A N S P O R T
work and social services would need to serve a greater area,as travel between residences and workplaces increased.
The last survey performed by Vilnius Municipality shows(see Figure 1) that the use of personal cars increased from1998 to 2002. However, public transport still dominates citytransport, providing 59 percent of the total transport needs(compared to 63 percent in 1998). The route network in Vil-nius originally developed with trolleybuses primarily servingcentral areas, while buses operated on the outskirts and insuburbs. According to interviews, trolleybuses are most pop-ular in the central part of the city (approximately one-thirdof Zirmunai, Karoliniskes and Zverynas inhabitants use trol-leybuses), and buses are used more in the outskirt zones lack-ing trolleybus infrastructure (half of the respondents in Rasos,Naujoji Vilnia and Pilate). However, private cars are the mostpopular means of transport in peripheral zones with middleor upper-class inhabitants.
According to research into Vilnius public transport in1998, passengers preferred trolleybuses (57.8 percent) andbuses (39.3 percent) during peak hours. The share of privatebuses and minibuses was small (1.5 and 1.4 percent, respec-tively). The number of trips performed daily by one Vilniusinhabitant (only public transport) was 1.43 in 1998 (the
number of Vilnius inhabitants is 578,400). However, no suchsurvey was conducted during the 2002 research.
According to the 2002 research, trolleybuses transported47.8 percent of all passengers, buses 41.5 percent and privateoperators 10.7 percent. The share of private operators increased,with private buses carrying 4.3 percent of all passengers, and pri-vate minibuses carrying 6.4 percent (see Table 2 for a break-down of passenger ridership during peak traffic hours).
As mentioned previously, trolleybuses operate in the cen-tral part of the city, while buses provide transportation to thetrolleybus network. The average trip lengths in 1998 and 2002are as follows: trolleybuses 3.01 and 3.46 km; buses, 4.45 and5.05; private buses, 8.89 and 7.8; and minibuses, 7.39 and 7.05.
During research in 1998 it became clear that only half ofall private operators were working on the routes. It was dulystressed that control of this subsystem is not working prop-erly, but to date there have been no changes. Official statis-tics provided by the municipality about private operators areunreliable. For example, information collected from privateoperators in 2001 differs considerably from information col-lected during public transport research in 2002 (officialinformation from the municipality). Private operators pro-ceed with impunity due to the lack of control and absence
Modal spit (percentage): 1998-2002
FIGURE 1
0
5
10
15
20
25
30
35
40
45
Trolleybuses
20011998
Personalcars
Municipalbuses
Minibuses Privatebuses
Walking Taxi Bicycle

PA R T 2 : P U B L I C T R A N S P O R T F I N A N C I N G — S TAT U S , P R I O R I T Y P R O B L E M S A N D N E E D SV I L N I U S
N E X T S T O P : S U S T A I N A B L E T R A N S P O R T 101
of legal consequences, and are free to choose the best timeto operate or close down a non-profitable route without anynotification, which was pinpointed during all interviews withCommunication Services. Meanwhile, municipal operatorshave to work according to contracts and schedules.
More detailed technical information about the perform-ance of Vilnius public transport can be found in the appen-dix. The currency used in calculations is the Litas, which wasofficially introduced on July 25, 1993. From 1994 untilFebruary 2002, the Litas was linked to the US dollar, and therate was fixed at USD 1 = LTL 4. From February 2, 2002, theLitas became fixed to the Euro at EUR 1 = LTL 3.4528.
Related studies and perspectivesA considerable number of previous studies within the
areas of public transport in Lithuania and the city of Vilniushave been carried out in the past. The implementation ofvarious recommendations from these studies, however, hasbeen rather limited. This study will take into considerationand build upon the research and recommendations fromprevious studies as listed in the references.
One of the most significant outcomes of these studieswas the establishment of Communication Services in 1998.The necessity of one management company was emphasisedin the Master Plan of Urban Transport for Vilnius City(1997). Other studies also recommended the strengtheningof the public transport management body. However, becauseof legal and political problems, to date there is no clear divi-sion of functions between public transport actors in Vilnius.
There are studies related to the public transport sectorthat are financed/performed by foreign funds/specialists.Recent studies include one on the Vilnius public transportorganisational structure (2001), a mobility and light tram fea-sibility study (2002), a project on route network planning(2002), and an ongoing new ticketing system project in Vil-nius. Plans are to install new ticket machines (electroniccards) instead of punches, and to switch from one-time tick-ets to a time-based ticket system by 2006.
Organisational development of public transport in VilniusMain actors and roles
Pubic transport in Vilnius is undertaken by VilniusMunicipality. The bus and trolleybus companies are jointstock companies wholly owned by the municipality.
However, the bus and trolleybus depots were state-ownedcompanies until 1992, and the bus company operated not onlyon urban, but also on interurban routes. The Lithuanian gov-ernment decided to remise both depots to Vilnius Municipali-ty in 1992. Later, in 1995, depots were re-registered as closelyheld joint stock ventures (CHJV) with special status. All sharesof the companies belonged to Vilnius Municipality, and in1996 the council decided to reorganise Vilnius Bus Depot,CHJV into two companies: Vilnius Bus Depot, CHJV with spe-cial status and Long Range Passenger Transportation Compa-ny, CHJV. After reorganisation, Vilnius Bus Depot assumed therole of urban/suburban operator. However, these were not thelast changes of status for the municipal companies, and in thebeginning of 2003, companies were registered as Vilnius Buses,CHJV (without special status) and Vilnius Trolleybuses, CHJV.Theoretically, this status allows the selling of shares to otherparties but, for the time being, 100 percent of shares in munic-ipal depots belongs to Vilnius Municipality.
There are a number of stakeholders acting within the Vil-nius transport sector today. The major stakeholders are:
• Public Transport Group (in the City Economy Division,Energy and City Economy Department of VilniusMunicipality);
• Communication Services, municipal enterprise;
• Vilnius Buses, CHJV (or, Bus Company);
• Vilnius Trolleybuses, CHJV (or, Trolleybus Company);
• private operators with medium-sized buses; and
• private operators with small buses (minibuses).
TABLE 2
Public transport passengers in Vilnius in 1998 and 2002 (peak hours)
Passengers transported
1998 2002 Change
Trolleybuses 74,371 – 50.5% 54,437 – 47.8% - 19,934
Buses 68,026 – 46.1% 47,242 – 41.5% - 20,784
Private buses 2,600 –1.8% 4,912 – 4.3% + 2,312
Private minibuses 2,400 – 1.6% 7,239 – 6.4% + 4,839
Total 147,397 113,830 - 33,567

There are neither city trains nor a light rail system. Vil-nius train services play a role in regional traffic, but are anegligible part of urban transport. The current relationshipsbetween main actors in the organisation of public transportare shown in Figure 2.
Vilnius public transport is financed from municipalsources. The state covers part of the delegated duties (con-cessionary fares), but investments in municipal depots comeexclusively from municipal financial sources. Almost all newvehicles purchased in recent years have been financed fromthe municipal budget (most recently from the municipalfund for environmental protection).
Delegated responsibilities are calculated during certainprocedures. Communication Services prepares a forecast ofneeded compensation in the middle of the year, which ittransmits to Vilnius Municipality. The municipality collectsall information about needed compensation and submitsinformation to the Ministry of Finance. The ministry thentransfers the allocated sum for compensation (on the budgetline for “transport and communications”) to the municipali-ty at the end of the year. There is no special line for publictransport in this lump sum and, theoretically, all statedamounts should be covered. The municipality adds subsidies
and then transfers these amounts to Communication Ser-vices. However, not all amounts have been covered throughthe years. Nowadays, the state is in debt to the municipality,and bus companies are in debt to the state (unredeemedtaxes). Therefore, it is nearly impossible to distinguish state,municipal, and fare subsidies in these amounts.
Since the 1990s the municipality has been regularly nego-tiating this matter with the state administration, but nothinghas been earmarked yet to transfer state funds to the munici-pality for public transportation. This situation makes it diffi-cult to make more specific calculations and for the state andmunicipality to negotiate compensation.
Communication Services is the municipal enterprise thatdeals with public transport matters on behalf of the munici-pality. The group is a technical secretariat and the executorof the transport policy set by the municipality. As shown inFigure 2 and Table 3, the municipality and CommunicationServices have different roles in relation to the different oper-ators. In reality this means that Communication Servicestoday has no power to control or negotiate with private oper-ators, since licenses and ticket prices are negotiated with themunicipality in a separate department. However, the moni-toring system is not working well under the Public Transport
PA R T 2 : P U B L I C T R A N S P O R T F I N A N C I N G — S TAT U S , P R I O R I T Y P R O B L E M S A N D N E E D SV I L N I U S
102 N E X T S T O P : S U S T A I N A B L E T R A N S P O R T
Main actors in Vilnius public transport and their basic relations
FIGURE 2
Subcontracts
Ministry ofFinance
Municipality ofVilnius
CommunicationServices
Block transfer forfinancial year
Funds forcompensation
Direct revenuefrom ticket sales
Licenseagreement
Bus purchasing
Share of revenueand compensation
Trolleybus Company
Bus Company
Private buses
Minibuses (Private op.)
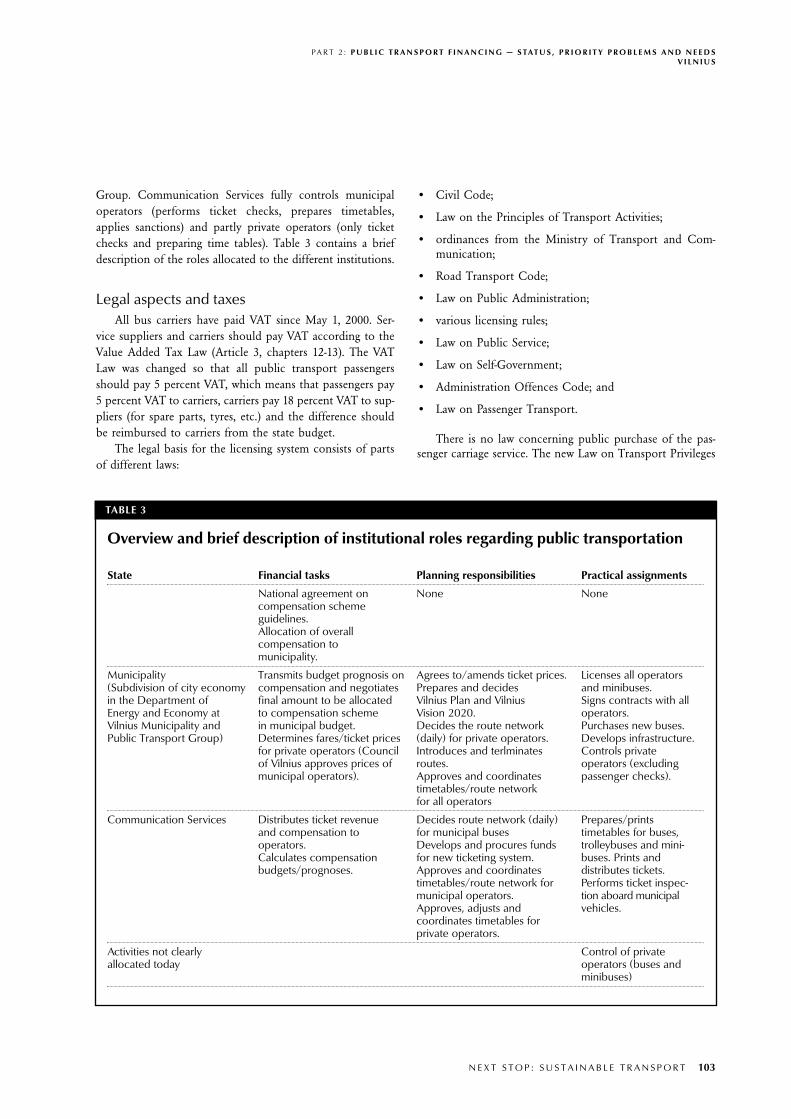
Group. Communication Services fully controls municipaloperators (performs ticket checks, prepares timetables,applies sanctions) and partly private operators (only ticketchecks and preparing time tables). Table 3 contains a briefdescription of the roles allocated to the different institutions.
Legal aspects and taxesAll bus carriers have paid VAT since May 1, 2000. Ser-
vice suppliers and carriers should pay VAT according to theValue Added Tax Law (Article 3, chapters 12-13). The VATLaw was changed so that all public transport passengersshould pay 5 percent VAT, which means that passengers pay5 percent VAT to carriers, carriers pay 18 percent VAT to sup-pliers (for spare parts, tyres, etc.) and the difference shouldbe reimbursed to carriers from the state budget.
The legal basis for the licensing system consists of partsof different laws:
• Civil Code;
• Law on the Principles of Transport Activities;
• ordinances from the Ministry of Transport and Com-munication;
• Road Transport Code;
• Law on Public Administration;
• various licensing rules;
• Law on Public Service;
• Law on Self-Government;
• Administration Offences Code; and
• Law on Passenger Transport.
There is no law concerning public purchase of the pas-senger carriage service. The new Law on Transport Privileges
PA R T 2 : P U B L I C T R A N S P O R T F I N A N C I N G — S TAT U S , P R I O R I T Y P R O B L E M S A N D N E E D SV I L N I U S
N E X T S T O P : S U S T A I N A B L E T R A N S P O R T 103
TABLE 3
Overview and brief description of institutional roles regarding public transportation
State Financial tasks Planning responsibilities Practical assignments
National agreement on None Nonecompensation schemeguidelines.Allocation of overallcompensation tomunicipality.
Municipality Transmits budget prognosis on Agrees to/amends ticket prices. Licenses all operators(Subdivision of city economy compensation and negotiates Prepares and decides and minibuses.in the Department of final amount to be allocated Vilnius Plan and Vilnius Signs contracts with allEnergy and Economy at to compensation scheme Vision 2020. operators.Vilnius Municipality and in municipal budget. Decides the route network Purchases new buses.Public Transport Group) Determines fares/ticket prices (daily) for private operators. Develops infrastructure.
for private operators (Council Introduces and terlminates Controls privateof Vilnius approves prices of routes. operators (excludingmunicipal operators). Approves and coordinates passenger checks).
timetables/route networkfor all operators
Communication Services Distributes ticket revenue Decides route network (daily) Prepares/prints and compensation to for municipal buses timetables for buses,operators. Develops and procures funds trolleybuses and mini-Calculates compensation for new ticketing system. buses. Prints and budgets/prognoses. Approves and coordinates distributes tickets.
timetables/route network for Performs ticket inspec-municipal operators. tion aboard municipalApproves, adjusts and vehicles.coordinates timetables forprivate operators.
Activities not clearly Control of privateallocated today operators (buses and
minibuses)

came into force May 1, 2000. The law provides fewer privi-leges for passengers, and compensation for “privileged pas-sengers” (see below) on local routes must be covered fromthe municipality budgets.
The law states that several socially disadvantaged groupsare entitled to a discount of 50 or 80 percent on selectedpublic transport fares. It should be noted that the discountis relative, which implies, for example, that the price for adisabled person to travel by bus in Vilnius might be differ-ent than in other Lithuanian cities.
Political factors are often a bigger influence on fare pricesthan economic ones. Recently, after an increase in fare pricesin September 2000, the situation in Vilnius has improved,although complete operating costs are still not covered.
Private operators running medium-sized buses on acontractual basis with the municipality are obliged to carryprivileged passengers at the reduced ticket price, but theydo not receive any compensation for the “loss” of revenuerelated to lower ticket prices.
Communication Services would like to control transportoperators. According to Lithuania’s legal system, however,Communication Services can execute such functions only onan agreement basis. Nowadays Communication Services hascontracts with municipal enterprises to perform such func-tions. Contracts with private operators have yet to be signed.
The Road Transport Code was changed in 2002. Changesto this act enable the municipality to transmit certain powers(control of operators) to a public agency. There will be noneed to make agreements between the controlling institutionand operators; this will be performed according to the Codeof Administrative Offences and the Road Transport Code.The status of a “public agency” is suitable to perform thesefunctions. A public agency is a non-profit organisation thatalso has the right to carry out economic-commercial activi-ties in order to reach its goals. A political decision couldtransform Communication Services into an agency.
Energy pricesFuel prices in Lithuania more or less depend upon the
situation on the world market and existing taxes set by Par-liament. The excise tax has also been balanced and increasedup to minimum requirements of the European Commission.However, European Union common policy has had limitedinfluence on energy prices since a minimal level of excise taxwas defined after negotiations with Lithuanian authorities. Adecision has yet to be made whether the excise tax on fuelwill be returned to operators of regular routes.
The new Law on Excise (currently being elaborated bythe Ministry of Finance) stipulates that the excise tax ondiesel fuel should grow from year 2002. As of April 4, 2004,the wholesale price of diesel fuel was LTL 2,451.79 per tonne,and A-95 petrol was LTL 3,015.41 per tonne.
The Law on Excise provides that the excise tax on dieselfuel will grow from LTL 560 per tonne to LTL 720 per tonne.It also proposes to increase the excise tax on liquid gas from
LTL 170 per 1,000 litres to LTL 220 per 1,000 litres. In orderto meet the minimum requirements of the EU, the excise ondiesel should rise to LTL 1,200 per tonne. The excise tax onpetrol is not likely to increase in the future, and shouldremain around LTL 1,250 per tonne. Besides the excise tax,the retail price of any fuel contains 18 percent VAT, as wellas any profit for retail traders. However, this part of the priceremains a trade secret and is negotiated with retail traders.
Another factor is import taxes on fuel. Starting fromMay 1, 2004 Lithuania introduced new taxes on importedfuel, according to EU requirements. The tax on importedfuel will fall from 15 percent to 4.7 percent. Experts predictthat fuel prices will drop by LTL 5-7 cents.
Electricity prices have remained stable, but may rise inthe near future because of the intended decommissioningof the first block of the Ignalina Nuclear Power Plant in2005. Experts have forecasted price growth to be between10-15 percent. However, the electricity market is alreadyopen (large consumers are able to buy electricity directlyfrom the supplier), and the price depends on the ability tonegotiate, which also creates the potential for discounts tothe Trolleybus Company.
The expenditure structure of the Bus Company and theTrolleybus Company indicates that the costs for fuel/energywere 21.9 percent and 11.5 percent, respectively. From thisperspective the Bus Company will be much more vulnerableto the expected rise in fuel prices than the Trolleybus Com-pany will be to higher prices on electricity.
Development of ticketing systemDuring 1991-1992, ticket prices were raised on six occa-
sions because of hyperinf lation (the price of a single ticketrose from 16 kopecks to 2 roubles). Later, with the intro-duction of a national currency, prices were raised severaltimes, and in 1996 the price of single ticket became 60 cents.The ticket system was divided between municipal operators,who then became responsible for revenue collection.
All operators had separate tickets, and different depart-ments were responsible for revenue collection until 1999.The ticket system was partly integrated in 1999 (see Figure3). Ticket prices were approximately 33-40 percent inSeptember 2000, and a common monthly ticket for bothbuses and trolleybuses was introduced at that time. Com-munication Services became responsible for revenue collec-tion. However, the system covers only municipal operatorsand private operators are not included in this system. Tick-ets are valid for one trip only (there is no time-based sys-tem). Moreover, each separate private transport enterprisehas its own accounting system (usually every private vehicleoperating on route has a ticket dispenser on board), and itis extremely difficult to obtain data about revenue collec-tion in this private sector.
In general, municipal public operators generate revenuefrom four types of tickets (with subcategories):
PA R T 2 : P U B L I C T R A N S P O R T F I N A N C I N G — S TAT U S , P R I O R I T Y P R O B L E M S A N D N E E D SV I L N I U S
104 N E X T S T O P : S U S T A I N A B L E T R A N S P O R T

• single ticket for a bus or trolley bus (purchasable in vehi-cles for LTL 1.0 and at Kiosks for LTL 0.8; 50-percent or80-percent discount for certain passengers, with the 80-percent discount tickets only available at kiosks);
• monthly ticket for bus or trolleybus (purchasable atkiosks at a price of LTL 35; 50-percent or 80-percent dis-count for certain groups; monthly card for workdays isLTL 28 with no discount available);
• monthly ticket for both bus and trolleybus (purchasableat kiosks at a price of LTL 50; 50-percent or 80-percentdiscount for certain groups; monthly card for workdaysis LTL 40 with no discount available; introduced inSeptember 2000 and has a rising market share); and
• one-, three- and 10-day tickets for both trolleybuses andbuses (purchasable in two places for LTL 4, 10, and 20with no discounts).
Ticket prices for private operators are LTL 0.7 for large buses,and often between LTL 1-2 for minibuses (max. LTL 2.5). There
are no official figures (private operators provide data about car-ried passengers to the Department of Statistics, but this data isnot separated from municipal operators in the official statistics)about the turnover of private operators, but a rough estimate isbetween LTL 5-6 million per year. (Some stakeholders think thatmedium-sized buses generate LTL 15-20 million).
Finally, it should again be stressed that the sale of ticketsand revenue to private operators on minibuses, medium busesand large buses is a closed and parallel system to the munici-pal system. Each operator who keeps the revenue also sells tick-ets separately. That is one of the main hindrances to obtainingdata about the entire public transport system in Vilnius.
Financial set-upCommunication Services gets a 4-percent share of the
revenue of single tickets sold aboard vehicles, and a share of15 percent of all other tickets sold (e.g. monthly tickets andsingle tickets sold in kiosks). Communication Services doesnot get a share of the compensation for concessionary fares.
PA R T 2 : P U B L I C T R A N S P O R T F I N A N C I N G — S TAT U S , P R I O R I T Y P R O B L E M S A N D N E E D SV I L N I U S
N E X T S T O P : S U S T A I N A B L E T R A N S P O R T 105
Distribution of revenue and compensations before and after 1999
FIGURE 3
PassengersVilnius Municipality
Subsidies
Communication Services
Trolleybus depot Bus depot
Revenue fromown tickets
Passengers PassengersVilnius Municipality
Revenue fromown tickets Subsidies
Revenue fromown tickets
Trolleybus depot Bus depot
Before
After

The enterprise received 66.6 percent of income from ticketsin 2002 and 65.5 percent in 2003. Other revenues were gen-erated from parking and other commercial activities.
After the share to Communication Services is deducted,revenue is split between the Bus Company and the TrolleybusCompany according to the following methodology:
• Revenue from monthly tickets for buses is transferred tothe Bus Company, and monthly tickets for trolleybusesis transferred to the Trolleybus Company.
• Revenue from single tickets (which can be used in busesor trolleybuses) sold at kiosks and the revenue fromcommon monthly tickets are split proportionally to thecompany’s share of total number of kilometres run byboth the Bus Company and Trolleybus Company. Forexample, the bus company receives a share of the totalcommon revenue according to the formula below:
85% x total common revenue x Bus km
(bus km + trolleybus km)
The factor of 85 percent is used because Communica-tion Services receives 15 percent of this revenue. In Vilniusthe basic financial set-up for the Bus Company and Trolley-bus Company is as follows:
• Companies get a share of revenue from ticket sales. Theactual share and calculation method is negotiated andagreed upon between the companies and Communica-tion Services.
• Communication Services calculates the amount of privi-leged passengers and the matching economic compensa-tion. The municipality provides the compensation, but dueto economics and disputes with the government concern-ing the allocation of money for this activity, only a part ofthe calculated compensation has been given since 1994/95.
• The municipality owns and invests in the infrastructureand the rolling f leet.
Over the years, missing compensations (and, perhaps,politically imposed fare restrictions) have caused the actualincome for the two companies to be less than operatingcosts, which has led to increased debt and insolvency (seeFigure 4). In April 2001, total debts for both companies wereLTL 61.5 million. LTL 57.8 million of this was income taxesfrom physical persons, together with fines on unpaid taxes.Annual turnover for both companies is LTL 79 million.
Due to the activity of Communication Services, LTL 2.1million has already been saved by taking over the functionsof fare selling and passenger control from the Bus Companyand Trolleybus Company. The enterprise started to preparetimetables for the municipal operators in 1999, and for pri-vate operators in 2000. The coordination of bus and trolley-bus work (route optimisation and reduction of idle runs)helped to economise further LTL 1.7 million.
As mentioned before, the municipality for some years hasnot paid the total calculated amount for compensation of con-cessionary fares to the bus companies, which is a main factorin the poor financial results. The municipality argues that reim-bursement from the state is too low, and that in general thereis not enough money for all the activities. Starting from July 1,2000, Communication Services has presented invoices to themunicipality concerning passenger carriage, according to thenumber of tickets sold, and from 2002 the municipality beganto cover debts to the public transport sector (the municipalityintends to cover debts through investments until 2006).
Fleet renewalBad financing of the Vilnius public transport caused “per-
force renewal” of the fleet in municipal enterprises. Purchasesof second-hand buses and trolleybuses were financed mostlyfrom independent budgets. Most of the new buses and trol-leybuses were financed from the municipal budget (leasing,bank guarantees or the special municipal fund). To bring innew buses, the municipality has signed a triangular agreementwith the bus/trolleybus companies and a leasing company.
During its first years of operating independently, thebus depot received, gratis, 10 second-hand buses from Nor-wegian, German and Austrian municipalities. During 1993-1994, the municipality and Bus Company bought 16 sec-ond-hand buses from German municipalities. The BusCompany covered only 30 percent of the costs. Vilnius BusCompany bought new Karosa B-741 buses in 1994 for test-ing. After the tests, the municipality and the Ministry ofCommunications bought 11 such buses in 1995. Later themunicipality financed the purchase of 36 buses (LTL22,660,000) in 1996, 31 (LTL 19,340,000) in 1997, 10 (LTL5,077,000) in 1998 and 28 (LTL 14,216,000) in 1999. Thevalue of all these buses increased the authorised capital ofVilnius Bus Company. The company then sold old Russianbuses and bought approximately 30 second-hand busesfrom Western Europe. Maintaining such a variety of brandshas a negative inf luence on operational costs.
Vilnius Trolleybus Company purchased old vehicles fromneighbouring countries and used these vehicles as spare partsto repair the old fleet — a main reason the old vehicles werekept on routes. However, the municipality also invested in thetrolleybus fleet and bought new vehicles in 1990 (15 Skoda,270,000 roubles), 1991 (8 Skoda, LTL 11,880,000), 1996 (30Skoda, LTL 17,880,000), 1997 (30 Skoda, LTL 19,080,000),1999 (15 Skoda, LTL 10,980,000) and 2000 (8 Skoda, LTL5,856,000). The extension of trolleybus infrastructure (approx-imately two kilometres of cable network and substations) tothe student district cost LTL 6,000,000 in 1998.
The number of vehicles owned by transport enterprisesof Vilnius Municipality in 2001 can be seen in Figure 5. Asof June 2001, the Vilnius Bus Company had 246 buses, ofwhich 98 buses (40 percent) were up to 5 years old, 12buses (5 percent) 5 to 10 years old, and 136 buses (55 per-cent) older than 10 years.
PA R T 2 : P U B L I C T R A N S P O R T F I N A N C I N G — S TAT U S , P R I O R I T Y P R O B L E M S A N D N E E D SV I L N I U S
106 N E X T S T O P : S U S T A I N A B L E T R A N S P O R T

The Trolleybus Company had an older vehicle f leet. Ofa total of 303 trolleybuses, 77 (25 percent) were up to 5 yearsold, 7 (3 percent) were 5 to 10 years old and 219 (72 percent)were older than 10 years.
The municipality is planning to participate in theCIVITAS 2 programme and to receive funding for the f leetrenewal. There were no attempts to finance public transportfrom foreign funds before this programme.
The municipality is neither participating in such projectsnor searching for other funds because:
• There was huge competition during CIVITAS, and theprocedure is time-consuming.
• Information about such environmental funds or interna-tional funding institutions is in short supply in Lithuania.
• The financial situation limits contact with foreign partners.
“Private and public partnership” is not defined inLithuanian legalisation. Some municipal buses performtransport to the biggest mall centres on a public-private
partnership basis, but it is a minor activity. Moreover, therewere no private companies interested in public transport sec-tor privatisation. There was some interest in privatising theBus Company, but after an analysis of the current financialsituation, the investors lost interest. The financial situationstabilised only a few years ago, and therefore the present sit-uation is perhaps more favourable to initiatives.
Finally, the municipality bought 14 new Mercedes-Benz(4 CITO and 10 CITARO) buses for LTL 14 million in2003. The buses were purchased from a special environ-mental fund (municipal allocations for environment pro-tection). The municipality plans to renew the bus and trol-leybus f leet during the next three years and to purchase 90new buses and 45 trolleybuses. A three-year purchase pro-gramme shows that 30 new buses (20 medium size and 10articulated) and 15 larger-sized trolleybuses will access Vil-nius streets annually. The tenders have already beenannounced and the first contract could be signed in April2004. Planned investments include LTL 70 million forbuses and LTL 50 million for trolleybuses.
PA R T 2 : P U B L I C T R A N S P O R T F I N A N C I N G — S TAT U S , P R I O R I T Y P R O B L E M S A N D N E E D SV I L N I U S
N E X T S T O P : S U S T A I N A B L E T R A N S P O R T 107
Compensation to Vilnius municipal operators (LTL thousands)
FIGURE 4
0
-10,000
10,000
20,000
30,000
40,000
50,000
60,000
1996 1997 1998 1999 2000 2001 2002 2003
Not compensatedCalculated compensation Allocated compensation in municipal budgetCompensated

Development of contracting systemService levels and contracts are decided both by the Vil-
nius Public Transport Group and Communication Services.The division of responsibility between the two parties seemsunclear and separated from the discussions of fare levels. Theprovision of an actual level of service in public transportalso affects operating costs.
Theoretically, private operators can propose or closeroutes and departures on specific stretches if the municipal-ity and Communication Services agree to it. Licensing andtimetable- and route approval for private operators is per-formed by the municipal Public Transport Group (withinthe Department of Energy and City Economy), while munic-ipal route planning goes to Communication Services and thePublic Transport Group: thus, levels of service and financialmatters are difficult to coordinate.
The current contracting process seems to be a mostlyreactive process. The municipality receives initiatives for newroutes (the municipal operator, Communication Services ormunicipality may start the procedure) and then analysesthese with the assistance of Communication Services. Usu-ally, the new route is initiated by agreement from all parties,
so changes in the route system have been quite smallthroughout the five-year period. (Some routes were addedmostly because of technical/political issues, rather thanaccording to need.) Public services are needed in new,remote areas of the city, for example in the north and southof Vilnius (new single-house territories).
If an enterprise wants to operate on a route, it should have:
• a license for an enterprise (for public transportation activity);
• a license for a transport unit;
• a permit for a route; and
• an agreement with the municipality.
The municipal Bus Company has licenses, while theTrolleybus Company currently is not included in the licens-ing system (they have permission to operate without cards).
Communication Services has contracts with municipaloperators concerning the provision of services and distribu-tion of revenue. To ensure clear and fair competition amongoperators, Communication Services has a vision of becom-
PA R T 2 : P U B L I C T R A N S P O R T F I N A N C I N G — S TAT U S , P R I O R I T Y P R O B L E M S A N D N E E D SV I L N I U S
108 N E X T S T O P : S U S T A I N A B L E T R A N S P O R T
Age of buses and trolleybuses in 2001
FIGURE 5
98
12
136
77
7
219
Up to 5 years 5 to 10 years More than 10 years0
50
100
150
200
250
Vilnius Trolleybuses, CHJVVilnius Buses, CHJV

ing the sole contracting unit for the municipality. Thisincludes establishing clear guidelines and unified proceduresfor the tendering out of routes. However, there have been noattempts to tender municipal operator routes.
The problem is that this system puts both the municipal-ity — and especially Communication Services — in a morereactive than proactive role. They respond to outside initia-tives instead of taking the lead in the planning route networks.
The contracting system itself seems to enhance this reac-tive role. As it is today, a license/contract with an operator(public or private) gives the operator the right to a renewalthe contract if he or she has fulfilled the requirements. Themunicipality planning and reorganising the route network isthus restricted by existing contracts for a number of years.
Communication Services also clearly states that theythemselves would prefer a management model, where theyhave a “service contract” with the municipality, with a sta-bile funding agreement and a clear and formalised set ofgoals to be achieved.
All in all, Communication Services has the ambition tobecome a full-scale management agency that has the compe-tence to prepare and participate in planning, as well as poli-cy making, while at the same time remaining a public enter-prise. As described earlier, this is not possible within theexisting legislation on public administration.
Main challenges and recommended action plan
The main challenges are:
• distributing funds and revenues;
• improving the decision-making process when definingthe service level;
• defining the future role of Communication Services; and
• assuring adequate data on passengers and traffic (espe-cially for private operators).
For each challenge a number of concrete recommenda-tions on necessary actions have been defined. The actionsrange from long-term changes of the legal framework, tochanges of organisational and financial management of thesector in the short term.
Distribution of funds and revenuesThe lack of stability and coherence between service level
requirements and the actual allocation of public funds has creat-ed a very serious financial threat to the publicly owned operators.
The budget procedures between state, municipality andCommunication Services concerning the cost of the com-pensation scheme have resulted in underfunding, where theoperating costs of the publicly owned operators are not evencovered. At the same time, some of the private bus compa-
nies are facing demand to transport privileged passengers atreduced rates without receiving public compensation fortickets sold at those prices.
Recommendations for short-term actionA new financing model should be defined.
• This model should be based on gross contracts. In reali-ty this implies subsidising non-profit routes, where actu-al revenue is lower than the operators’ cost to deliver apolitically mandated level of service. Operators receive acontractual fixed sum to cover operating costs. The costsare revealed in tendering procedures.
• Revenue from ticket sales should be collected throughthe municipal entity (future agency).
• A financing and practical model should be defined for acommercial super-system of minibuses (ensuring fullcontrol of private operators).
A new set of gross contracts between operators and themunicipality should be defined and described.
• Contracts should ultimately be applied to all routes andthe entire system (bus or trolleybus). In order to achievethis, the municipal entity should create a long-term planfor tendering the routes/system.
• As mentioned, there shall be a special contract/licensesystem for minibus operators.
• Contracts should be for four or five years, with obliga-tory re-tendering after the end of the contract period.
• The criteria for awarding operator contracts (public or pri-vate) should be based on operating costs and the qualityof service the operator will provide for the specific route.
• Potential routes should be contracted out logically in logis-tically coherent packages. When tendering one system, thecontract should include all bus or trolleybus routes.
The data collection system should be redesigned so thatit is in alignment with a new revenue distribution model.
• In order to support cost estimates and passenger forecasts,data collection should be improved and aligned with thestrategy. This creates demand for new ticketing facilities.
Recommendations for medium/long-term actionCompensation funding coming from the government
should be earmarked in the transfer of block subsidies tothe municipality.
• The Ministry of Transport and Communication shouldnegotiate on behalf of the municipalities with the Ministryof Finance on the required subsidises in order to maintaina high level of service for privileged passengers. The budg-et should be transferred directly from the Municipal Enti-
PA R T 2 : P U B L I C T R A N S P O R T F I N A N C I N G — S TAT U S , P R I O R I T Y P R O B L E M S A N D N E E D SV I L N I U S
N E X T S T O P : S U S T A I N A B L E T R A N S P O R T 109

ty/Agency with a clear calculation of costs related to car-rying privileged passengers at reduced ticket prices.
• Subsidies related to operating costs should be allocatedon a separate budget line in the municipal budget.
The Agency should enter a service contract with themunicipality securing a certain level of financing on thebasis of a clearly defined set of responsibilities and tasks.
• The service agreement should be a two-year contractassuring financial stability for the agency. After twoyears, the contract should be revised and the agencyshould set new targets.
The cost of maintaining the infrastructure and rolling fleetshould be transparent and part of the contract agreement.
• Detailed costs for such items as garages, offices, otherbuildings and the purchase of vehicles should be clearlystated. For trolleybuses there should also be some contri-bution to maintenance and renewal of the cable network.
Improving the decision-making process fordefining levels of service
There should be a clear connection between the organisa-tional level that defines the required service level (number ofroutes, frequency, kind of vehicles, etc.) and the financing level.In order to establish this, it is necessary to have the possibilityto calculate operating costs and possible revenue from a singleroute in order to establish the level of required subsidies.
Each decision concerning an expansion or reduction ofthe current service level should be accompanied by cost-,revenue- and subsidy anayses.
Recommendations for reaching this goal include:
• Service levels should be defined by one authority(municipal) only.
• Service levels should be based on consumer demand andbudgetary constraints.
• A single unit should assume management of all con-tracts, ensuring transparency and equal terms.
Defining the future role of Communication Services
In order to accomplish the strategy, a strong, profession-al and independent organisational body should be responsi-ble for contracts and relations with operators, as well as theplanning and management of transport services.
It must be emphasised that it is necessary to establish anorganisation that has a clear definition of tasks and financialframework in order to maintain independence and profes-sionalism.
Recommendations for short-term action
• A clear separation of roles must be defined between themunicipality and Communication Services.
• Future tender procedures should be planned (the munici-pality, with the assistance of Communication Services,should prepare a long-term plan for tendering of all routes).
Recommendations for long-term action
• The implementation of tendering procedures for allroutes should be completed within five years (if it is nottendering for the bus or trolleybus system as a whole).
• The role of a future agency should be defined during dis-cussions between operators, the municipality and Com-munication Services.
Adequate data on passengers and trafficWhen the city of Vilnius invests in a new ticket system,
it should also be used to facilitate and strengthen the col-lection of data concerning traffic.
Data on traffic is essential input for:
• planning and managing capacity of the network androutes (including supplementary vehicles during hoursof operation — especially peak hours);
• optimising service operations (e.g. number of vehicles onthe streets according to actual schedules for routes in thenetwork);
• optimising the network according to passenger needs;
• dividing revenue (optimal splits for every bus departurein the normal system and for minibuses, which willundoubtedly involve great cost); and
• providing input during discussions and decisions (politi-cal and otherwise) concerning general service levels (e.g.the number of departures from specific locations at par-ticular times of day).
New technology with on-board computers, automaticbus-positioning systems (often based on global positioningsystems) and computerised ticket machines enable a greatdeal of automatically generated data about traffic, which (intheory) can be easily collected and processed by computer.Planned and used in the right way, these systems can deliververy useful management and planning information, but theyalso are expensive and costly to maintain.
It should also be noted that these systems cannot pro-duce data concerning what passengers do before and afterentering the public transport system, indicating that there isno precise information about passenger origins and destina-tions. This sort of supplementary data is needed when plan-ning networks and route services.
PA R T 2 : P U B L I C T R A N S P O R T F I N A N C I N G — S TAT U S , P R I O R I T Y P R O B L E M S A N D N E E D SV I L N I U S
110 N E X T S T O P : S U S T A I N A B L E T R A N S P O R T

ConclusionsIn general, the Lithuanian public transport sector lacks
the financial resources or revenue from fares to finance theactual costs of operators. Additionally, the level of publicsubsidies is unstable — due not only to the budgetary rela-tions between the state and municipalities but also internal-ly in Vilnius Municipality.
In reality, Communication Services has insufficientinf luence on private operators. This clearly has a negativeeffect on the overall coordination and integration of thetransport system as a whole. The future role of Communi-cation Services is highly uncertain due to political and eco-nomic factors.
The actual tendering procedures and licensing carriedout by the municipality (mini-buses) is characterised by alack of transparency and has resulted in competition on thestreets — and less competition in the tender procedures.
The system of licensing to different operators and theplanning of routes and lines is not integrated. Similarly, thedifferent ticketing systems are not adequately integrated.
However, the establishment of Communication Serviceshas been a good initiative and an important first step in cre-ating a competent organisation of the public transport sec-tor in Vilnius.
Communication Services has, after a problematic start-up period and difficult situation in general, demonstratedgood personal skills and relevant competence. Even thoughthe financial situation has been and still is problematic, asuccessful investment plan has been implemented, whichresulted in about one-third of all buses and trolleybusesbeing less than five years old in 2001. Moreover, due to theactivity of Communication Services, LTL 2.1 million hasbeen saved each year.
During recent years, passenger information has, tosome extent, been improved in the form of updated maps,signs on buses, information at bus stops and informationon the Internet.
The existence of new bus operators on the street hasstrengthened the passenger’s ability to choose between alter-natives, and has provided incentives for improved servicefrom operators.
ReferencesEvaluation of the Organisation of Public Transportation in Vilnius (Lithuania-Denmark). VGTU and Ramboll sponsored by the Danish Transport Ministry.2001.
COWIconsult, Urban Public Transport in Lithuania: Strategy Study for theCommission of the European Communities Directorate General for Energy.DG XVII, THERMIE. May 1994.
Atkins, W.S. Master Plan of Vilnius Urban Transport. TRANSURB CONSULT,FIDA. Phare, June 1996.
COWI, W.S. Atkins, FIDA, LITDANIA. Master Plan of Urban Transport for MainLithuanian Cities. Commission of the European Communities. Phare-Pro-gramme, 96-0241.00-PHARE LI9404/0202. June 1997.
Implementation of Urban Transportation Plans in Lithuania Phare FrameworkContract within the Field of Transport. FC 209. March 1999.
State Department of Statistics. www.std.lt
Communication Services. www.vilniustransport.lt
Research of Vilnius public transport system in 1998 and 2002 reports. VilniusGediminas Technical University, Department of Urban Engineering.
Conference Proceedings, of Urban Public Transport: Problems, Solutions,Perspectives. Vilnius. 2002.
ME Vilnius Plan, Special Plan of Vilnius Transportation Infrastructure VilniusGediminas Technical University.
SYSTRA. Tram feasibility study in Vilnius. 2002.
Technical and financial data collected during interviews with representativeof Communication Services, Vilnius Municipality, CJSV Vilnius buses andCJSV Vilnius trolleybuses.
PA R T 2 : P U B L I C T R A N S P O R T F I N A N C I N G — S TAT U S , P R I O R I T Y P R O B L E M S A N D N E E D SV I L N I U S
N E X T S T O P : S U S T A I N A B L E T R A N S P O R T 111

PA R T 2 : P U B L I C T R A N S P O R T F I N A N C I N G — S TAT U S , P R I O R I T Y P R O B L E M S A N D N E E D SV I L N I U S
112 N E X T S T O P : S U S T A I N A B L E T R A N S P O R T
TABLE 7
Vilnius public transport data summary: 1996-2003
Year 1996 1997 1998 1999 2000 2001 2002 2003
1. Operational network length (km)
Municipal buses 590 612 612 669 709 710
Municipal trolleybuses 376.9 373.3 429.7 429.7 418.7 423.3
Private operators (buses) 202 261
Private operators (minibuses) 649.3 776
2. Number of vehicles per mode (on routes)
Municipal buses 214 221 201 215 220 224
Municipal trolleybuses 242 249 245 250 252 258
Private operators (buses) 84 90 62
Private operators (minibuses) 319 380 359
3. Number of lines per mode
Municipal buses 57 56 57 60 63 62
Municipal trolleybuses 17 17 18 18 18 18
Private operators (buses) 17 19 19
Private operators (minibuses) 74 51 62
4. Number of trips (per Vilnius inhabitant) 1.43
Municipal buses
Municipal trolleybuses
Private operators (buses)
Private operators (minibuses)
5. Average length of trip (km)
Municipal buses 3.01 3.46
Municipal trolleybuses 4.45 5.05
Private operators (buses) 8.89 7.85
Private operators (minibuses) 7.39 7.05
6. Average stop distance (According to Lithuanian standards, the distance should be 500m.)
Municipal buses 636 640
Municipal trolleybuses 548 550
7. Average public transport speed
Municipal buses 18.75 19 21 22 23 23
Municipal trolleybuses 17.00 17 17.8 17.8 17.8 18
Private operators (buses) 26.94
Private operators (minibuses) 26.15
8. Passengers transported per year
Municipal buses 107,500,000 98,109,050 93,872,697 107,378,979 116,750,084 126,274,912
Municipal trolleybuses 127,400,000 131,387,643 129,629,364 129,966,072 132,089,872 136,793,404
Private operators (buses)
Private operators (minibuses)
Appendix

N E X T S T O P : S U S T A I N A B L E T R A N S P O R T 113
PA R T 2 : P U B L I C T R A N S P O R T F I N A N C I N G — S TAT U S , P R I O R I T Y P R O B L E M S A N D N E E D SV I L N I U S
TABLE 7 (CONTINUED)
Vilnius public transport data summary: 1996-2003 (LTL figures given in thousands)
Year 1996 1997 1998 1999 2000 2001 2002 2003
9. Operational costs per year (LTL)
Municipal buses 44,558 41,983 38,094 42,143 45,372 47,736
Municipal trolleybuses 46,727 41,217 38,900 42,529 45,860 46,657
Private operators (buses)
Private operators (minibuses)
10. Municipal budget (LTL) 383,300 447,400 583,100 510,100 455,100 487,500 533,586 569,705
11. Investments (LTL) 40,540 38,420 11,077 25,196 5,856 0 0 0
Municipal buses 22,660 19,340 5,077 14,216 0 0 0 0
Municipal trolleybuses 17,880 19,080 6,000 10,980 5,856 0 0 0
12. Allocated sum to PT 23,000 20,000 20,200 20,000 14,650 16,500 29,004 30,000for compensation (LTL)
13. Current percentage of the municipal budget allocated to PT(indicating the division between operating costs and investment)
Operation 6.00% 4.47% 3.46% 3.92% 3.22% 3.38% 5.44% 5.27%
Investment 10.58% 8.59% 1.90% 4.94% 1.29% 0.00% 0.00% 0.00%
14. Ticket revenues 39,449 37,971 46,166 55,724 56,987 58,560(only municipal operators,LTL)
15. Revenue/cost ratio
16. Vehicle/km (million km)
Municipal buses 14.41 14.14 13.52 14.90 15.73 16.29
Municipal trolleybuses 16.70 15.90 14.60 14.64 15.04 15.65
Private operators (buses) 3.5 3.18
Private operators (minibuses) 33 26.88

114 N E X T S T O P : S U S T A I N A B L E T R A N S P O R T

N E X T S T O P : S U S TA I N A B L E T R A N S P O R T 115
This document contains conclusions from the meet-ing on Supporting Public Transport in CEE EU New-Mem-ber States and Candidate Countries held on December16-17, 2003. Written by the participants themselves, theconclusions outline possible areas for work under a proj-ect supporting public transport in Bulgaria, Romania andthe new member states of the European Union.
Representatives from Sofia, Bulgaria; Prague, the CzechRepublic; Tallinn, Estonia; Budapest, Hungary; Vilnius,Lithuania; Warsaw, Poland; Bucharest, Romania; and Bratisla-va, Slovakia (see list of participants) met in Szentendre, Hun-gary on December 16-17, 2003 to review the status of publictransport in the CEE EU new-member states and candidatecountries. The reviews were based on information collectedby case studies and contributions of the participants.
By identifying and discussing current problems relatedto public transport, the participants engaged in dialogueon public transport reforms and developments at local,regional, national and pan-European levels. The exchangeof experiences and practices was another importantdimension of the meeting.
The ultimate goal of the project is to achieve a healthi-er urban environment through sustainable public transport.
The participants discussed the scope for possiblefuture activities within the project. They may be sum-marised as follows:
• organisation of the public transport, including integra-tion of networks, contractual issues and private-publicpartnerships; and
• exchange of experience and information regarding finan-cial aspects of investments (long- and medium term),public transport operation and the EU public transport-related projects (including tendering, role of governmentand subsidies, additional financial sources, loan proce-dures and state guarantee issues, co-funding, fare setting,integrated ticketing, revenue collection, allocation
schemes and charges).The exchange of experience andinformation will lead to capacity building in this field atlocal, regional and national levels.
• There will be an overview of the EU funding process,access to these funds and their programming — includingidentification of key decision makers in this field in eachCEE EU new-member state and candidate country.
• There will also be an overview of the financial schemesto support public transport in each CEE EU new-mem-ber state and candidate country.
It was recommended to collect information, identify indi-cators, compare statuses, practices and performances of differ-ent countries, and to draw conclusions from them, based onstudy visits. Good examples from Budapest, Pecs (Hungary),Prague, Sofia and Warsaw were mentioned. The informationand experience accumulated by, for example, UITP projectsand other projects should be used to this end and to developthe following:
• parking policies and practices, including pricing policiesand establishment of traffic restricted areas.
It was recommended to prepare case studies and in-depthanalyses. It will be important to show both results andprocesses that lead to achieving these goals. Interesting casestudies could be already found in ELTIS database. Otherimportant tasks include the following:
• efficient provision of information on public transport,marketing and promotion of public transport, and trav-eller support via electronic tools; and
• awareness-raising of the public and decision makers onpublic transport as an asset contributing sustainabledevelopment.
Annex 1Moving Public Transport
along in Central and Eastern Europe

A N N E X 1 : M O V I N G P U B L I C T R A N S P O R T A L O N G I N C E N T R A L A N D E A S T E R N E U R O P E
116 N E X T S T O P : S U S TA I N A B L E T R A N S P O R T
The following issues were also emphasised during thediscussions:
• Development and investment in the public transport sec-tor (infrastructure and eco-f leet) should be undertakenwith the goal of maintaining a relatively high (50-60percent) public transport market share in CEE EU new-member states and candidate countries.
• The importance of state aid regulations of the EC andthe efficient use by public transport stakeholders of theEU Cohesion and Structural Funds need to be addressed.
• The decentralisation of public transport responsibili-ties to the local level should be accompanied by ade-
quate legal/regulatory means, capacity building andfinancial measures.
• Public transport planning and land-use planning mustbe integrated in order to gain efficient, sustainable,public transport.
• Use of available information technology tools for publictransport reforms, improved decision-making, manage-ment and everyday operations were also highlighted. Theuse of such tools will also help to overcome the lack of suf-ficient and reliable data and information on public trans-port trends and challenges.
• Further work is needed to make public transport attrac-tive, cleaner, safer, more reliable and accessible.

This document served as a basis for discussion during a meeting onpublic transport in the candidate countries and new member states ofthe European Union. It was written by Ausra Jurkeviciute andGrazyna Krzywkowska, project managers in the EnvironmentalPolicy Programme of the Regional Environmental Center for Centraland Eastern Europe (REC). The meeting was held at the REC inSzentendre, Hungary on December 16-17, 2003. Conclusions of themeeting by its participants can be found in Annex 1.
Major trends and challenges based on case studies of Sofia, Tallinn and Warsaw
IntroductionAfter the rapid loss of passengers in 1990-1995, varying
between 15 and 25 percent in different countries, publictransport in Central and Eastern Europe (CEE) entered aperiod of slower decline, with an average annual decrease inuse of between 1-3 percent. According to the case-studyauthors, the reduction in public transport use amid thepolitical and economic changes of the 1990s was caused by:
• a shift from public transport to passenger cars (duemainly to the opening of car markets, higher living stan-dards, increased demand for public transport servicequality and changing mobility needs);
• a the significant reduction of state subsidies to publictransport;
• deteriorating public transport systems across theregion; and
• a shift of urban transport responsibility from centralgovernments to municipalities, which in most caseslacked the institutional capacity and financial resourcesto fulfil such obligations.
Currently, urban areas in CEE face growing traffic con-gestion, road safety issues, and rising air and noise pollu-tion. Policy decisions and actions are needed to encourage
a modal shift from road to rail, the design and construc-tion of multi-modal transport corridors, changes in thepresent practice of priority highway investments, promo-tion of walking and cycling, and many other measuresintroducing and implementing sustainable transport con-cepts. The issues should be tackled comprehensivelythrough a multi-dimensional approach.
Despite the financial constraints, CEE countries havemade efforts to address public transport problems in recentyears. Some big cities have developed and adopted sustainableurban transport policies; interaction and dialogue among com-petent authorities and public transport companies has startedto improve; the first steps towards increasing the efficiency ofpublic transport have been made; public transport fleets arebeing renewed; city road infrastructures have improved; ringroads have been built; and new metro-, tram- and trolley linesare being planned, extended or have started operating. How-ever, in many other towns where the population still relieslargely on public transport, many actions await final decisions.If the public transport sector is not improved immediately,urban environment and health will further deteriorate.
A long-term process has only just begun, but the presentsituation offers unique potential and opportunity for publictransport in CEE. Active international support for ongoingefforts to improve efficiency, quality and reliability of thepublic transport service, combined with good existing prac-tices, could lead to a stabilisation of public transport pas-senger volumes and positive short- and mid-term develop-ment. The project to promote public transport in the CEEregion made a number of findings that are now on the tablefor review and comment. By introducing this set of prob-lems, the REC aims to establish communication betweenvarious interest groups and policy makers at local, nationaland pan-European levels, to find solutions and offer supportto those seeking a healthier environment though improve-ments to the public transport sector.
The following major trends and challenges in publictransport have been identified though the studies conduct-ed in Sofia, Tallinn and Warsaw by public transport expertspreparing case studies.
N E X T S T O P : S U S TA I N A B L E T R A N S P O R T 117
Annex 2Supporting Public Transport
in Central and Eastern Europe

Mobility
• The number of trips has declined significantly for allmeans of public transport — in some countries by asmuch as 70 percent.
• Private car ownership has increased: hence the numberof car trips has increased (nearly three-fold in Tallinn).
• The current public transport system does not offerattractive alternatives for the numerous new car owners.
• Time delays and street congestion are increasing for bothprivate cars and public transport, affecting both passen-gers and operational costs.
• Traffic -related accidents, noise, air pollution end energyconsumption levels are all increasing.
• Car parking needs, road/street blocking and, hence, traf-fic obstruction are also on the rise.
• New residential areas often lag behind old urban areas inestablishing public transport services: private car owner-ship is promoted as a result.
Public transport management
• There is a lack of inter-modality, connections and linkswith other exiting public transport modes.
• Public transport systems have not developed fast enoughto compete with private cars.
• With few financial resources, attempts at f leet renewal,infrastructure repair, modernisation and system develop-ment are reduced to bare minimums.
• The market share of public transport in relation to othermeans of transport has decreased — in some cases as lowas 31 percent (Tallinn, for example).
• The average age of buses and trolleys in some countriesis 20 years, and more then 26 years for trams.
• The basic structure of public transport systems hasremained almost unchanged for the last 10 decade.
• Overcrowding and ageing f leets cause low service levels.
• There are no significant modal policies or traffic-man-agement measures favouring public transport.
• The average speed of buses has slowed to 17.8 kilometresper hour in Warsaw — trams to 15 kilometres per hour.
• Suburban railway services have deteriorated.
• Municipalities have retained regulatory functions forpublic transport (service patterns, schedules, fares),which are often carried out by a specialised transportauthority, leaving operations to company management.
Relations between operators and municipalities are regu-lated by service agreements (contracts).
Public transport financing
• Expenses for public transport have increased since thebeginning of the transition period, and most state gov-ernments in the region have stopped financing publictransport (with the exception of the underground rail-way). States do not subsidise public transport operations— or provide very low amounts.
• Responsibility for public transport has been shifted tomunicipalities, but, as a rule, the state collects tax revenues.
• The lack of sufficient investment in public transport hasresulted in an outdated rolling stock f leet and under-investment in public transport infrastructure.
• Fares are not adjusted on a regular basis, and no long-term fare policies are in place.
• Public transport companies do not receive full compen-sation for discounted fares and free rides given by thestate (e.g. in Warsaw).
• State policies make it practically impossible or very dif-ficult for municipalities to use funds from internationalfinancial institutions at their disposal, and state-loanguarantees remain an issue, as is the case in Warsaw.
• The fact that municipalities operate according to annualbudgets makes long-term investment into public trans-port virtually impossible.
Conclusions and recommendations• Cities in the region have developed good policies and
plans on how to manage or move towards sustainabledevelopment in the public transport sector, but theymust now be put into practice.
• Without a significant and visible change in current poli-cies, the negative trend in public transport system devel-opment will continue — marginalising public transportas a means for low income groups only.
• Surveys reveal a public preference for buses and trams,even among private car owners. There is a notable pas-senger preference for trams over buses. This option canbe exploited further.
• Tram systems need to be rehabilitated and modernised.
• Advanced systems of public transport management andtraffic control should be introduced, with priority givento public transport.
A N N E X 2 : D I S C U S S I O N PA P E R : S U P P O R T I N G P U B L I C T R A N S P O R T I N C E E
118 N E X T S T O P : S U S TA I N A B L E T R A N S P O R T

• Revision of fare policy (and integrated ticketing and con-trol), refinancing of discount fares, an introduction ofcharges for roads and city parking use, with direct allo-cation of a part of the revenues to public transportshould be planned.
• The absence of any state interest in public transport man-agement issues is abnormal and has brought the publictransport situation to its current status of degradation.
• Adequate financing for public service obligations andredistribution of taxes (including fuel excise tax) and rev-enues need to be assured.
• Financing for suburban railway services needs to be assured.
• Cooperation between local governments in the metro-politan areas needs to be strengthened.
Urgent needs in the surveyed citiesThe following public transport needs regarding manage-
ment, infrastructure and financing call for urgent attention:
• renewal of tram and bus f leets (public tenders, eco-f leet);
• upgrade of selected tram lines serving main corridorscrossing city centres;
• introduction of short sections of tram line in peripheralzones;
• introducing tram and bus priority traffic control atintersections;
• extension of bus lanes;
• introduction of integrated management and control ofpublic transport and car traffic (and control system)system; and
• improvement of the quality and service level, includingan increase of operations (vehicle/kilometre), to decreasevehicle impact.
Urgent issues related to mobility management include:
• discouraging private vehicles from entering the city,introducing paid parking (zoning), building more park-ing lots, adjusting parking fees, development of a park-and-ride system, and employers/schools mobility plansor car-pooling; and
• public transport promotion as environment friendly,quick, comfortable, reliable, accessible and safe.
A N N E X 2 : D I S C U S S I O N PA P E R : S U P P O R T I N G P U B L I C T R A N S P O R T I N C E E
N E X T S T O P : S U S TA I N A B L E T R A N S P O R T 119

120 N E X T S T O P : S U S TA I N A B L E T R A N S P O R T

IntroductionEnvironmental impact of urban transport and European Union policy response
With two-thirds of the EU's population now living incities, measures need to be taken to reverse the ever-growingmotorisation, congestion, air, noise and soil pollution causedby transport. Such measures are taken by the EC bearing alsoin mind growing transport needs, growing transport energyneeds, oil dependency of 98 percent and transport’s contri-bution to global warming, deterioration of public health andquality of life. Dealing with these problems in urban areas isimperative because estimates suggest that passenger cars cause40 percent of the transport sector's CO2 emissions. A thor-ough integration of environmental concerns into transportpolicy requires that the environmental impacts of a transportpolicy are taken into account alongside economic and socialconcerns when the policy is designed.
The EC has implemented Article 6 of the EC Treaty1 onsectoral integration through the Cardiff process since 1998.Integration involves agriculture, transport, energy, industry,internal market, economic and financial affairs, and fish-eries. Additionally, the EC 6th Environmental Action Pro-gramme (EAP) “Environment 2010: Our Future, OurChoice”2 provides for the development of thematic strategiesby 2005. The strategies directly related to the integration oftransport and environment concerns are: the Strategy onEnvironment and Health3; the Strategy on Urban Environ-ment4; and the Strategy on Air Quality.
The 6th EAP calls for extensive sectoral integration,which means monitoring progress with indicators andbenchmarking, stimulating it though integrated land-use andtransport planning, or “greening” the EC funding. The EAPdeclares the public transport of new member states and can-didate countries an asset that needs to be protected. More-over, the alternatives to road transport need to be support-ed to reduce air and noise pollution and to address envi-ronmental health problems caused by increasing motorisedtransport. For example, car ownership has risen by 65 per-
cent in these countries in the past 10 years (compared to 20percent in the EU 15).
The need to reduce energy consumption and increase theuse of renewable energy sources is recognised by the ECGreen Paper, "Towards a European Strategy for the Securityof Energy Supply" of 2000.5 The EC Sustainable Develop-ment Strategy, adopted by the Gothenburg European Coun-cil in 20016 recognises congestion and global warming amongthe main threats to sustainable development. It calls for anincrease of inter-modality in transport and the developmentof public transport and/or railway infrastructure. This goeshand in hand with EC transport policy guidelines until 2010.
The 2001 EC White Paper, “European Transport Policyfor 2010: Time to Decide”7 (hereinafter White Paper) seeksgreater transport inter-modality, the elimination of bottle-necks and the consideration of transport users’ rights inefforts to combat congestion and air and noise pollution. TheWhite Paper proposes over 60 measures that could assist inbuilding sustainable transport in, ideally, 30 years. The meas-ures would gradually decouple economic growth and trans-port growth. At the same time, it warns that sustainable trans-port must be achieved without compromising the economy,well-being and mobility demands of all European citizens.
Sustainable transport is transport that meets the mobili-ty needs of society without endangering public health orecosystems. Creating such transport can be done by devel-oping public transport, promoting non-motorised means oftransport (such as railways, waterways, cycling and walking),discouraging car usage in urban areas and by supportingcleaner technologies for motorised transport. Sustainabletransport measures currently in use in the EU include: pro-moting cleaner vehicles; promoting public transport andnon-motorised transport; promoting integrated land andurban planning with transport planning; making publictransport fully accessible and attractive; improving city logis-tics for freight transport; introducing transport managementschemes through parking policies and access restrictions; andintroducing information technology systems for traffic man-agement. The EC has supported sustainable transport policymaking and implementation through projects such as the
N E X T S T O P : S U S TA I N A B L E T R A N S P O R T 121
Annex 3Proposed Priority Areas of Work on
Promotion of Sustainable Transport in CEE
CIVITAS Initiative, Clean Urban Transport for Europe(CUTE) and the Voyager initiative.
New member states and candidate countriesChallenges of EU policy
Many institutions in the new member states and candi-date countries are new or newly reformed. They currentlyimplement EU policy guidelines, legislation and standards.To this end, they need access to appropriate financingsources. These institutions are also often weak and inexperi-enced and still lack the capacity to implement innovativemeasures. There are frequent lapses in the implementation ofnew laws and policies in the new member states, often dueto a lack of experience or the need for training and aware-ness building. These and many other developmental pre-con-ditions in the new member states and candidate countrieshave significantly added to the challenge at the Europeanlevel to meet the goals of the White Paper and to worktowards a sustainable transport system. Moreover, the statusof transport infrastructure within these countries lags con-siderably behind that of the EU 15, such that considerableplanning and investment is still needed to fully moderniseinfrastructure, as well as to meet economic demands.
Implementing EU policy New member states and candidate countries have a good
modal split between passenger car use and public transportuse, or among road, railways and air transport. They also havelower transport energy consumption and emissions than theEU 15. The summary of the case studies included in this pub-lication outlines local actions undertaken to improve publictransport and promote it. These include fleet renewal, trafficmanagement information technology (IT) tools, giving prior-ity to public transport, and limiting car usage in the surveyedcities. These measures require significant resources and there-fore advance slowly. Despite financial problems, municipali-ties have started introducing traffic management systems pro-moting public transport, for example, and discouraging theuse of private cars. This should not be reversed and the pro-motion of good practices in urban transport in building sus-tainable transport systems should continue.
National policies in the new member states and candidatecountries tend to be ambitious and wide-ranging, with a stat-ed focus on sustainable development, including a modal shiftaway from car use in cities. At the same time, national actionprogrammes, including development programmes and invest-ment plans, tend to focus on infrastructure development andimprovements. To achieve the shift from the stated focus onsustainability to actions, the continuous capacity building ofpolicy makers and implementing bodies of the new memberstates and candidate countries is needed.
Priority areasThe project on Promotion of Public Transport in CEE
implemented by the REC until September 2004 (the activitiesof which are described in the executive summary of this pub-lication) focused on building the capacity of the local publictransport operators and transport or environment authoritiesin sectoral integration. More than 120 practitioners participat-ed in the meetings, workshops and site visits, and their ‘ net-work has been created and maintained during the project’simplementation. They formulated the areas of future worksummarised below. These priorities go beyond public transportand deal with sustainable transport development to reflect theimportance of providing society a full range of transportoptions, such as attractive, accessible and efficient public trans-port, safe cycling and walking, as well as their integration.
The REC’s in-house expertise and activities will continueto address the complex needs of sustainable transport — pub-lic transport in particular — in CEE. One example is the inte-gration of the REC’s work under the Partnership for CleanFuels and Vehicles. In its future work the REC will continueto take into account and build upon the new developmentsin the EU, as well as the work of the Health and Environ-ment Pan-European Programme (THE PEP) ofUNECE/WHO, the European Committee of the Ministriesof Transport (ECMT), OECD, UITP and other organisa-tions active in the field of sustainable transport.
The following priority areas of work on sustainable trans-port promotion in CEE are proposed:
• Integrated urban planning to reduce the number of cartrips in favour of use of public transport, railways,cycling and walking — promotion of best practices inintegration of environment concerns into transport pol-icy making and implementation in order to reduce trans-port emissions, congestion, urban sprawl and increasingenergy use. This includes the use of strategic environ-mental assessment (SEA) as such a tool at all levels ofpolicy making, having in mind the requirements of theEC Directive on SEA, adopted in 2004.
• Use of available information technology tools for effi-cient urban transport planning and management — pro-motion of best practices in, for example, public trans-port prioritisation via traffic management systems, mak-ing inter-sections safer for cyclists or electronic ticketing.
• Capacity building in the use of economic tools, fiscalmeasures, and other financial and legal measures tofinance sustainable transport. These include: subsidies,environmental funds, international financial institutions,private sources and private-public partnerships. The useof the Structural Funds and the Cohesion Fund provid-ed for regional development under EU cohesion policywill be explored here in particular. The two fundinginstruments currently cover investments in such sustain-able modes of transport as modernisation and develop-
A N N E X 3P R O P O S E D P R I O R I T Y A R E A S O F W O R K O N P R O M O T I O N O F S U S TA I N A B L E T R A N S P O R T I N C E E
122 N E X T S T O P : S U S TA I N A B L E T R A N S P O R T

ment of railways and urban public transport. Beneficia-ries of the planned project can be given training on thespecifics of the planning and programming processes, aswell as general requirements for the preparation of appli-cations for EC funding. Beneficiaries of this project willalso be able to engage in dialogue with authorities deal-ing with fund programming.
Work in these three fields will be done on the local levelthrough exchanges and the preparation and dissemination ofbest practices. It will be possible thanks to the creation andsupport of an interdisciplinary network of CEE stakeholdersdealing with sustainable transport, built upon an informal net-work of public transport practitioners created under the proj-ect on Promotion of Public Transport in CEE.
The interdisciplinary network of stakeholders will facilitate:
• the exchange of knowledge on sustainable transport pol-icy making trends;
• the exchange of experience on financial aspects of pub-lic transport investments and operations; and
• the exchange of experience related to integration oftransport, land and urban planning and the integrationof different environmentally friendly transport modes.
The network will assist the coordination of work andunderstanding between municipalities, public transportoperators and NGOs, and in the promotion of non-motorised modes of transport. It will also assist in inform-ing local decision makers on the impacts of transport on theurban environment and the urgency of environmental prob-lems caused by transport. The network’s work will commu-nicate sectoral integration needs and principles to decisionmakers on the local level. The network will enable projectbeneficiaries to be continuously updated on EC-level policymaking in transport and environment, as well as with theirsectoral integration. Additionally, beneficiaries will get toknow each other’s national priorities and trends in policymaking in these sectors and their integration, and they willexplore solutions for common problems.
Endnotes1 Consolidated text of the Treaty Establishing the European Community, OJ
C 325, December 24, 2002. Decision No. 1600/2002/EC of the Euro-pean Parliament and the Council of July 22, 2002 laying down the Sixth
3 Community Environmental Action Programme, OJ, L 242 September 10,2002.
3 Communication from the Commission to the Council, the European Par-liament, and the European Economic and Social Committee. A EuropeanEnvironment and Health Strategy, COM(2003) 338 final, June 11, 2003.
4 Communication from the Commission to the Council, the European Par-liament, the European Economic and Social Committee and the Com-mittee of Regions. Towards a Thematic Strategy in the Urban Environ-ment. COM(2004) 60 final, February 11, 2004.
5 COM (2000) 769, November 29, 2000.
6 Communication from the Commission. A Sustainable Europe for a BetterWorld: A European Union Strategy for Sustainable Development, COM(2001) 2 64 final, May 15, 2001.
7 COM (2001) 370 September 12, 2001.
A N N E X 3P R O P O S E D P R I O R I T Y A R E A S O F W O R K O N P R O M O T I O N O F S U S TA I N A B L E T R A N S P O R T I N C E E
N E X T S T O P : S U S TA I N A B L E T R A N S P O R T 123

THE REGIONAL ENVIRONMENTAL CENTER FOR CENTRAL AND EASTERN EUROPE (REC) is a
non-partisan, non-advocacy, not-for-profit international organisation with a mission to assist in solving
environmental problems in Central and Eastern Europe (CEE). The REC fulfils this mission by promoting
cooperation among non-governmental organisations, governments, businesses and other environmental
stakeholders, and by supporting the free exchange of information and public participation in environ-
mental decision making.
The REC was established in 1990 by the United States, the European Commission and Hungary. Today,
the REC is legally based on a charter signed by the governments of 28 countries and the European
Commission, and on an international agreement with the government of Hungary. The REC has its head
office in Szentendre, Hungary, and country offices and field offices in 16 beneficiary countries which
are: Albania, Bosnia and Herzegovina, Bulgaria, Croatia, the Czech Republic, Estonia, Hungary, Latvia,
Lithuania, FYR Macedonia, Poland, Romania, Serbia and Montenegro, Slovakia, Slovenia and Turkey.
Recent donors are the European Commission and the governments of Austria, Belgium, Bosnia and
Herzegovina, Canada, the Czech Republic, Denmark, Estonia, Finland, Germany, Hungary, Italy,
Japan, Latvia, the Netherlands, Norway, Poland, Serbia and Montenegro, Slovenia, Sweden,
Switzerland, the United Kingdom and the United States, as well as other inter-governmental and
private institutions.
Next Stop: Sustainable TransportA Survey of Public Transport in Six Cities of Central and Eastern Europe