NEWS RELEASE - cwb.com/media/cwb group/documents/investor relations/repor… · dedication in...
38
CWB 2018 First Quarter Report 1 NEWS RELEASE CWB reports very strong first quarter financial performance Pre-tax, pre-provision income up 14% compared to last year Adjusted cash earnings per common share of $0.75 up 23% from last year Positive operating leverage and common share dividend increase “CWB is off to a great start in fiscal 2018. Strong first quarter financial performance included record pre-tax, pre-provision income, record common shareholders’ net income and 23% growth of adjusted cash earnings per share from the first quarter last year. We also delivered positive operating leverage and strong credit quality, including a lower balance of gross impaired loans compared to last quarter and a provision for credit losses at the low end of our historical range,” said Chris Fowler, President and CEO. “With continued strong execution of CWB’s Balanced Growth strategy, and supported by our very strong capital position, we’re pleased to deliver to our shareholders another common share dividend increase this quarter.” “We were also excited to close our largest ever portfolio acquisition on the last day of the quarter. The $850 million of assets we acquired are right on strategy and we expect the transaction to be accretive immediately. With more than 75% of the portfolio originated in Central and Eastern Canada, this transaction moves us further toward our strategic goal to grow CWB’s Ontario loans to 30% of our total. Most importantly, the acquisition allows us to introduce 3,000 business owners to CWB Financial Group, with the opportunity to develop full-service relationships with targeted clients across the country. We are already working hard to deliver exceptional experiences to these prospects, and I want to thank our people for their teamwork and dedication in bringing this important deal over the finish line.” First Quarter 2018 Highlights (1) (compared to the same period in the prior year) Very strong operating performance with record common shareholders’ net income of $62 million, up 25%, record pre-tax, pre-provision income of $107 million, up 14%, and strong 10% growth of total revenue to $193 million. Diluted and adjusted cash earnings per common share of $0.69 and $0.75, both 23% higher. One-time gains related to the appointment of successor trustees for certain Canadian Western Trust (CWT) accounts contributed approximately $0.03 to adjusted cash earnings per common share. Operating leverage of 3.9%. Strong execution of CWB’s balanced growth strategy with 11% loan growth, including approximately $850 million of business lending assets acquired on January 31, 2018; the acquired assets are broadly diversified across Canada in the equipment finance and leasing, and general commercial lending sectors. Strong execution of CWB’s funding diversification strategy, with 4% growth of branch-raised deposits, including 14% growth of fixed term funding, as well as increased use of both securitization and capital markets funding. Of note, CWB completed the asset purchase at quarter end with no increase in broker- sourced deposits as a proportion of total funding. Net interest margin of 2.52%, up six basis points. Strong credit quality, with the provision for credit losses as a percentage of average loans at 18 basis points, down from 27 basis points last year and 20 basis points last quarter. Gross impaired loans represented 0.57% of total loans, consistent with last year and down from 0.72% in the previous quarter. Very strong Basel III regulatory capital ratios under the Standardized approach for calculating risk-weighted assets of 9.4% common equity Tier 1 (CET1), 10.6% Tier 1 and 12.3% Total capital, including the impact of the assets acquired on January 31, 2018. Common share dividend declared on March 7 of $0.25 per share, up two cents, or 9%, from the dividend declared one year ago and one cent, or 4%, from the dividend declared last quarter. (1) Highlights include certain non-IFRS measures – refer to definitions following the table of Selected Financial Highlights on page 21.
Transcript of NEWS RELEASE - cwb.com/media/cwb group/documents/investor relations/repor… · dedication in...

CWB 2018 First Quarter Report 1
NEWS
RELEASE
CWB reports very strong first quarter financial performance
Pre-tax, pre-provision income up 14% compared to last year
Adjusted cash earnings per common share of $0.75 up 23% from last year
Positive operating leverage and common share dividend increase
“CWB is off to a great start in fiscal 2018. Strong first quarter financial performance included record pre-tax, pre-provision income, record common shareholders’ net income and 23% growth of adjusted cash earnings per share from the first quarter last year. We also delivered positive operating leverage and strong credit quality, including a lower balance of gross impaired loans compared to last quarter and a provision for credit losses at the low end of our historical range,” said Chris Fowler, President and CEO. “With continued strong execution of CWB’s Balanced Growth strategy, and supported by our very strong capital position, we’re pleased to deliver to our shareholders another common share dividend increase this quarter.” “We were also excited to close our largest ever portfolio acquisition on the last day of the quarter. The $850 million of assets we acquired are right on strategy and we expect the transaction to be accretive immediately. With more than 75% of the portfolio originated in Central and Eastern Canada, this transaction moves us further toward our strategic goal to grow CWB’s Ontario loans to 30% of our total. Most importantly, the acquisition allows us to introduce 3,000 business owners to CWB Financial Group, with the opportunity to develop full-service relationships with targeted clients across the country. We are already working hard to deliver exceptional experiences to these prospects, and I want to thank our people for their teamwork and dedication in bringing this important deal over the finish line.”
First Quarter 2018 Highlights(1)
(compared to the same period in the prior year)
Very strong operating performance with record common shareholders’ net income of $62 million, up 25%, record pre-tax, pre-provision income of $107 million, up 14%, and strong 10% growth of total revenue to $193 million.
Diluted and adjusted cash earnings per common share of $0.69 and $0.75, both 23% higher. One-time gains related to the appointment of successor trustees for certain Canadian Western Trust (CWT) accounts contributed approximately $0.03 to adjusted cash earnings per common share.
Operating leverage of 3.9%. Strong execution of CWB’s balanced growth strategy with 11% loan growth, including approximately $850
million of business lending assets acquired on January 31, 2018; the acquired assets are broadly diversified across Canada in the equipment finance and leasing, and general commercial lending sectors.
Strong execution of CWB’s funding diversification strategy, with 4% growth of branch-raised deposits, including 14% growth of fixed term funding, as well as increased use of both securitization and capital markets funding. Of note, CWB completed the asset purchase at quarter end with no increase in broker-sourced deposits as a proportion of total funding.
Net interest margin of 2.52%, up six basis points. Strong credit quality, with the provision for credit losses as a percentage of average loans at 18 basis
points, down from 27 basis points last year and 20 basis points last quarter. Gross impaired loans represented 0.57% of total loans, consistent with last year and down from 0.72% in
the previous quarter. Very strong Basel III regulatory capital ratios under the Standardized approach for calculating risk-weighted
assets of 9.4% common equity Tier 1 (CET1), 10.6% Tier 1 and 12.3% Total capital, including the impact of the assets acquired on January 31, 2018.
Common share dividend declared on March 7 of $0.25 per share, up two cents, or 9%, from the dividend declared one year ago and one cent, or 4%, from the dividend declared last quarter.
(1) Highlights include certain non-IFRS measures – refer to definitions following the table of Selected Financial Highlights on page 21.

CWB 2018 First Quarter Report 2
Edmonton, March 8, 2018 – Canadian Western Bank (TSX: CWB) (CWB) today announced very strong operating performance with record common shareholders’ net income of $62 million and record pre-tax, pre-provision income of $107 million, up 25% and 14%, respectively, from the first quarter last year. Total revenue of $193 million was up 10% from last year, including a 10% increase in net interest income and 13% growth in non-interest income. Of note, first quarter total revenue includes pre-tax gains of approximately $3 million related to the process to appoint successor trustees for clients holding certain securities within CWT self-directed accounts. Further such appointments may occur but related gains on sale are not expected to be material. Net interest margin of 2.52% was up six basis points from last year. Total loans increased 11%, with 3% contributed from the January 31 acquisition of approximately $850 million of business lending assets in the equipment finance and leasing and general commercial segments. Credit quality was strong, with the provision for credit losses representing 18 basis points of average loans compared to 27 basis points last year. These factors were partly offset within common shareholders’ net income by increases in non-interest expenses and acquisition-related fair value changes. Diluted and adjusted cash earnings per common share of $0.69 and $0.75 were both up 23% from last year. The CWT-related gains contributed approximately $0.03 of adjusted cash earnings per common share this quarter.
Compared to the prior quarter, common shareholders’ net income and pre-tax, pre-provision income were up 2% and 3%, respectively. Total revenue was down 1%, as growth of net interest income was offset by lower non-interest income. Lower non-interest income mainly reflects smaller gains this quarter related to the process to appoint successor trustees for CWT accounts holding certain securities. Total loans increased 4%, or 1% excluding assets acquired on January 31. Net interest margin was down 11 basis points, mainly reflecting conservative funding and liquidity management in anticipation of the asset purchase at quarter end. The provision for credit losses of 18 basis points of average loans was down from 20 basis points last quarter. Non-interest expenses were 6% lower, while acquisition-related fair value changes increased with sustained strong performance of CWB Maxium. Diluted and adjusted cash earnings per common share were both 1% higher than last quarter, during which the CWT-related gains contributed approximately $0.06 of adjusted cash earnings per common share.
Execution of CWB Financial Group’s Balanced Growth strategy
Balanced Growth Objective Strategic Execution
Full-service client growth with a focus on business owners, including further geographic and industry diversification
11% annual loan growth including the acquisition of approximately $850 million of assets, and 3,000 relationships with business borrowers concentrated in Central and Eastern Canada.
8% organic loan growth, including 15% growth outside of Alberta. Proportion of loan portfolio in Central and Eastern Canada increased to
26% from 20% one year ago, with Ontario up to 21% from 16%. Increased business diversification with 23% annual growth of general
commercial loans and 22% growth of equipment financing and leasing.
Growth and diversification of funding sources
4% growth of branch-raised deposits, including 14% growth of fixed term funding and stable balances of lower cost demand and notice deposits.
Increased use of securitization, with the acquired portfolio primarily funded through CWB’s established securitization channels.
Increased use of debt capital markets with two successful senior deposit note issuances totaling $600 million in the first quarter.
Optimized capital management through transition to the Advanced Internal Ratings Based Approach (AIRB)
On track for transition to the AIRB approach in 2020, subject to regulatory approval.
Balanced Growth of assets and funding sources
Total loans at January 31, 2018 of $24,393 million were up 11% from last year and 4% from the prior quarter. This includes the approximately $850 million portfolio acquired on the last day of the first quarter. The composition of year-over-year loan growth was consistent with CWB’s Balanced Growth strategy, including further industry and geographic diversification. Approximately 80% of the acquired portfolio is comprised of equipment financing and leasing exposures, with the remaining 20% made up of general commercial loans. More than 75% of the acquired assets are concentrated in Central and Eastern Canada, with Ontario representing approximately 60%. Ontario accounted for 70% of CWB’s loan growth from last year, reflecting the combined impact of acquired growth and ongoing strong performance from CWB’s previously established businesses with a national footprint, including CWB Maxium, CWB Optimum Mortgage, National Leasing, and CWB Franchise Finance. Central and Eastern Canada now account for 26% of CWB’s total loan portfolio, up from 20% last year. British Columbia represents 34%, and Alberta comprises 32% of the total.

CWB 2018 First Quarter Report 3
CWB also continues to execute on key strategic objectives to grow and diversify core funding sources. Total deposits increased 10% from January 31, 2017. Branch-raised deposits were up 4% on an annual basis, including very strong 14% growth of branch-raised term deposits. Lower-cost branch-raised demand and notice deposit balances were relatively stable compared to the first quarter last year. We doubled the balance of outstanding securitization funding compared to one year ago, and increased the proportion of total funding from capital markets to 12% from 9%. Increased securitization primarily reflects our success in funding the January 31 asset purchase mainly through CWB’s existing securitization channels. Of note, there was no increase in broker-sourced deposits as a proportion of total funding this quarter. Growth of funding from capital markets reflects the impact of four successful senior deposit note issuances totaling $1.3 billion over the past twelve months.
Ongoing enhancements to CWB’s client experience in support of full-service client relationships
CWB continues to deliver enhanced client experiences through a number of targeted initiatives. We were excited to launch the pilot phase of our Virtual Branch this quarter, which promises to be a differentiated remote banking experience for business owners. CWB’s Virtual Branch offers access to high-touch, personal client service from experienced commercial banking relationship managers and cash management specialists. This unique approach to remote service delivery is complemented by convenient on-line banking options, including our recently deployed remote deposit capture technology. We also further improved CWB’s on-line wire transfer capabilities this quarter to enable business owners to send payments in over 130 currencies to more than 200 countries. This will complement the introduction of next generation online banking tools for businesses, which will allow clients to house their business and personal banking on a common platform. These are key steps to enhance CWB’s full-service banking experience for business owners. Together we expect these initiatives to improve our client experience and support development of broader client relationships across the country.
Strong Credit Quality
Strong overall credit quality continues to reflect CWB’s secured lending business model, disciplined underwriting practices and proactive loan management. Gross impaired loans this quarter totaled $137 million and represented 0.57% of total loans. This compares to $124 million, or 0.57%, last year and $168 million, or 0.72%, last quarter. While Alberta-based loans comprised 32% of CWB’s total portfolio at January 31, 2018, Alberta-based impaired loans accounted for 58% of total impairments this quarter, up from 41% in the same period last year and down from 63% last quarter. The relative concentration of impaired loans in Alberta continues to reflect the lagging impacts of the 2015 – 2016 regional recession, and is consistent with management’s expectations. Gross impairments outside of Alberta represented 0.36% of total non-Alberta loans, compared to 0.52% last year and 0.40% in the prior quarter.
The first quarter provision for credit losses of 18 basis points of average loans was down from 27 basis points in the same period last year and 20 basis points in the prior quarter. The level of the provision in each of the last three quarters is consistent with CWB’s traditional range of 18 – 23 basis points.
Although periodic increases in the balance of impaired loans may occur, loss rates on current and future impaired loans are expected to be consistent with CWB’s prior experience, where write-offs have been low as a percentage of impaired loans. We continue to carefully monitor the loan portfolio for signs of weakness.
Efficient operations and positive operating leverage
The first quarter efficiency ratio of 44.6%, which measures non-interest expenses, excluding the pre-tax amortization of acquisition-related intangible assets, divided by total revenue, compares favourably with 46.2% in the same period last year and 46.8% in the previous quarter.
Operating leverage, which is calculated as the growth rate of total revenue less the growth rate of non-interest expenses, excluding the pre-tax amortization of acquisition-related intangible assets, over the same period last year was positive 3.9%, compared to 2.4% last year and 1.0% in the prior quarter.

CWB 2018 First Quarter Report 4
Prudent capital management and dividends
At January 31, 2018, CWB’s capital ratios were 9.4% CET1, 10.6% Tier 1 and 12.3% Total capital. With a very strong capital position under the more conservative Standardized approach for calculating risk weighted assets, CWB is well-positioned to create value for shareholders through a range of capital deployment options consistent with our balanced growth strategy. Ongoing support and development of each of CWB’s businesses will remain a key priority, and we will continue to evaluate potential strategic acquisitions. We evaluate common share dividend increases every quarter against our dividend payout ratio target of approximately 30% of common shareholders’ net income, the current strength of our capital position, as well as capital requirements under the Standardized approach to support ongoing strong and balanced asset growth. The common share dividend declared yesterday of $0.25 per share is up two cents, or 9%, from the dividend declared one year ago and one cent, or 4%, from the dividend declared last quarter. While the dividend payout ratio this quarter was approximately 34%, we expect earnings growth to result in migration of this metric toward 30% while supporting our track record of dividend increases over the medium-term.
Medium-term Performance Target Ranges
CWB’s performance target ranges for key financial metrics reflect the objectives embedded within CWB’s strategic direction and a time horizon consistent with the longer-term interests of our shareholders. These targets are based on expectations for moderate economic growth and a relatively stable net interest margin environment in Canada over the three- to five-year forecast horizon. Our target ranges are presented in the following table:
Key Metrics(1) Medium-term
Performance Target Ranges
Current Context
Adjusted cash earnings per common share growth
7 - 12% Exceeded target at 23%.
Adjusted return on common shareholders’ equity
12 - 15% Met target at 12%.
Operating leverage Positive Met target at positive 3.9%.
Common equity Tier 1 capital ratio under the Standardized approach
Strong Delivered a very strong ratio of 9.4%.
Common share dividend payout ratio ~30% Delivered 34%, with an increase in the quarterly common share dividend declared to $0.25.
(1) See definitions on page 21.

CWB 2018 First Quarter Report 5
About CWB Financial Group
CWB Financial Group (CWB) is a diversified financial services organization serving businesses and individuals across Canada. Operating from its headquarters in Edmonton, Alberta, CWB’s key business lines include full service business and personal banking offered through 42 branches of Canadian Western Bank and Internet banking services provided by Motive Financial. Highly responsive specialized financing is delivered under the banners of CWB Optimum Mortgage, CWB Equipment Financing, National Leasing, CWB Maxium Financial and CWB Franchise Finance. Trust Services are offered through Canadian Western Trust. Comprehensive wealth management offerings are provided through CWB Wealth Management, which includes the businesses of McLean & Partners Wealth Management and Canadian Western Financial. As a public company on the Toronto Stock Exchange (TSX), CWB trades under the symbols “CWB” (common shares), “CWB.PR.B” (Series 5 Preferred Shares) and “CWB.PR.C” (Series 7 Preferred Shares). Learn more at www.cwb.com.
Fiscal 2018 First Quarter Results Conference Call
CWB’s first quarter results conference call is scheduled for Thursday, March 8, 2018, at 2:00 p.m. ET (12:00 noon MT). CWB’s executives will comment on financial results and respond to questions from analysts and institutional investors.
The conference call may be accessed on a listen-only basis by dialing (703) 736-7380 or toll-free (844) 400-1695. The call will also be webcast live on the CWB’s website, www.cwb.com.
A replay of the conference call will be available until March 15, 2018, by dialing (855) 859-2056 (toll-free) and entering passcode 6166089.
FOR FURTHER INFORMATION CONTACT:
Matt Evans, CFA Senior AVP, Strategy & Investor Relations Phone: (780) 969-8337 Email: [email protected]
Contents
Selected Financial Highlights 6
Management’s Discussion and Analysis 7
Interim Consolidated Financial Statements 22
Shareholder Information 38

CWB 2018 First Quarter Report 6
Selected Financial Highlights(1)
For the three months ended Change from
January 31
2017
(unaudited) January 31
2018
October 31
2017
January 31
2017
($ thousands, except per share amounts)
Results from Operations
Net interest income $ 171,267 $ 170,494 $ 155,749 10 % Non-interest income 21,950 24,628 19,478 13
Total revenue 193,217 195,122 175,227 10
Pre-tax, pre-provision income 107,064 103,902 94,264 14
Common shareholders’ net income 61,929 60,833 49,542 25 Earnings per common share
Basic 0.70 0.69 0.56 25
Diluted 0.69 0.68 0.56 23
Adjusted cash 0.75 0.74 0.61 23 Return on common shareholders’ equity 11.1 % 11.2 % 9.5 % 160 bp(2)
Adjusted return on common shareholders’ equity 12.0 12.0 10.4 160
Return on assets 0.91 0.94 0.78 13
Efficiency ratio 44.6 46.8 46.2 (160)
Net interest margin 2.52 2.63 2.46 6 Operating leverage 3.9 1.0 2.4 150
Provision for credit losses as a percentage of average loans 0.18 0.20 0.27 (9)
Number of full-time equivalent staff 2,085 2,058 1,977 5 %
Per Common Share
Cash dividends $ 0.24 $ 0.24 $ 0.23 4 % Book value 24.98 24.82 23.77 5
Closing market value 38.70 36.34 29.59 31
Common shares outstanding (thousands) 88,772 88,494 88,253 1
Balance Sheet and Off-Balance Sheet Summary
Assets $ 27,914,204 $ 26,447,453 $ 24,814,678 12 Loans 24,268,866 23,229,239 21,773,449 11
Deposits 22,812,435 21,902,982 20,683,360 10
Debt 2,083,444 1,476,336 1,234,050 69
Shareholders’ equity 2,482,909 2,461,045 2,362,658 5 Assets under administration 9,027,373 10,408,012 11,119,927 (19)
Assets under management 2,187,193 2,114,861 1,971,535 11
Capital Adequacy
Common equity Tier 1 ratio 9.4 % 9.5 % 9.5 % (10) bp(2)
Tier 1 ratio 10.6 10.8 10.8 (20) Total ratio 12.3 12.5 13.0 (70)
(1) Non-IFRS measures defined on page 21.
(2) bp – basis point change.

CWB 2018 First Quarter Report 7
Management’s Discussion and Analysis S Discuss
This management’s discussion and analysis (MD&A), dated March 7, 2018, should be read in conjunction with Canadian Western Bank’s (CWB) unaudited condensed interim consolidated financial statements for the period ended January 31, 2018, and the audited consolidated financial statements and MD&A for the year ended October 31, 2017, available on SEDAR at www.sedar.com and CWB’s website at www.cwb.com.
Forward-looking Statements
From time to time, CWB makes written and verbal forward-looking statements. Statements of this type are included in the Annual Report and reports to shareholders and may be included in filings with Canadian securities regulators or in other communications such as press releases and corporate presentations. Forward-looking statements include, but are not limited to, statements about CWB’s objectives and strategies, targeted and expected financial results and the outlook for CWB’s businesses or for the Canadian economy. Forward-looking statements are typically identified by the words “believe”, “expect”, “anticipate”, “intend”, “estimate”, “may increase”, “may impact”, “goal”, “focus”, “potential”, “proposed” and other similar expressions, or future or conditional verbs such as “will”, “should”, “would” and “could”. By their very nature, forward-looking statements involve numerous assumptions and are subject to inherent risks and uncertainties, which give rise to the possibility that management’s predictions, forecasts, projections, expectations and conclusions will not prove to be accurate, that its assumptions may not be correct and that its strategic goals will not be achieved. A variety of factors, many of which are beyond CWB’s control, may cause actual results to differ materially from the expectations expressed in the forward-looking statements. These factors include, but are not limited to, general business and economic conditions in Canada, including the volatility and level of liquidity in financial markets, fluctuations in interest rates and currency values, the volatility and level of various commodity prices, changes in monetary policy, changes in economic and political conditions, legislative and regulatory developments, legal developments, the level of competition, the occurrence of natural catastrophes, changes in accounting standards and policies, the accuracy and completeness of information CWB receives about customers and counterparties, the ability to attract and retain key personnel, the ability to complete and integrate acquisitions, reliance on third parties to provide components of business infrastructure, changes in tax laws, technological developments, unexpected changes in consumer spending and saving habits, timely development and introduction of new products, and management’s ability to anticipate and manage the risks associated with these factors. It is important to note that the preceding list is not exhaustive of possible factors. Additional information about these factors can be found in the Risk Management section of CWB’s annual Management’s Discussion and Analysis (MD&A). These and other factors should be considered carefully, and readers are cautioned not to place undue reliance on these forward-looking statements as a number of important factors could cause CWB’s actual results to differ materially from the expectations expressed in such forward-looking statements. Unless required by securities law, CWB does not undertake to update any forward-looking statement, whether written or verbal, that may be made from time to time by it or on its behalf. Assumptions about the performance of the Canadian economy over the forecast horizon and how it will affect CWB’s businesses are material factors considered when setting organizational objectives and targets. In determining expectations for economic growth, CWB primarily considers economic data and forecasts provided by the Canadian government and its agencies, as well as an average of certain private sector forecasts. These forecasts are subject to inherent risks and uncertainties that may be general or specific. Where relevant, material economic assumptions underlying forward looking statements are disclosed within the Outlook sections of this MD&A, and/or Outlook sections of CWB’s MD&A for the year ended October 31, 2017.

CWB 2018 First Quarter Report 8
Management’s Discussion and Analysis S Discuss
Strategic Transactions
On October 30, 2017, CWB entered into a definitive asset purchase agreement to acquire for cash approximately $900 million of equipment loans and leases, and general commercial lending assets. The transaction closed on January 31, 2018, and totaled approximately $850 million. The loans and leases acquired are fully aligned with CWB’s balanced growth strategy, including strategic objectives for industry and geographic diversification. The portfolio is primarily comprised of assets concentrated within the transportation, construction and healthcare industries, with approximately three quarters of the exposures distributed across Central and Eastern Canada. CWB expects the transaction to be immediately accretive to earnings per common share and return on common shareholders’ equity, with positive contributions beginning in the second quarter of fiscal 2018 to net interest margin and operating leverage. Management expects the acquired portfolio to contribute at least $0.10 of adjusted cash earnings per common share in both fiscal 2018 and 2019, while contributing to a slight increase in the provision for credit losses as a percentage of average loans. CWB’s common equity Tier 1 capital (CET1) ratio remained in a very strong position upon closing, with approximately 25 basis points of existing CET1 capital deployed as part of the purchase. Management funded the portfolio primarily through its securitization facilities.
On August 16, 2017, CWB announced that Canadian Western Trust (CWT) will focus its activities within business lines that are most aligned with the strategic objectives of CWB Financial Group, and will no longer offer self-directed account services to holders of certain securities, and CWT initiated a process to appoint successor trustees for these accounts. As a result of this process, CWB realized pre-tax gains on sale of approximately $6 million, or $0.06 of adjusted cash earnings per common share, in the fourth quarter of fiscal 2017 and approximately $3 million, or $0.03 of adjusted cash earnings per common share, this quarter. Annual revenue associated with the transferred accounts to date was approximately $3 million. In aggregate, approximately $93 million of CWT branch-raised deposits and $3 billion of assets under administration has transferred to the successor trustees. Further transfers of deposits and assets under administration related to this process, with associated gains on sale, may occur in forthcoming periods, but are not expected to be material.
Overview of Financial Performance
Q1 2018 vs. Q1 2017
Record common shareholders’ net income of $62 million and record pre-tax, pre-provision income of $107 million were up 25% and 14%, respectively. Strong earnings growth reflects the combined positive impact of 10% growth of total revenue to $193 million and a lower provision for credit losses, partially offset by higher non-interest expenses and increased acquisition-related fair value changes. Net interest income of $171 million was up 10%, reflecting the benefits of 7% loan growth, on an average balance basis, and a six basis point increase in net interest margin to 2.52%. Non-interest income increased 13%, primarily due to pre-tax gains of approximately $3 million from the strategic transactions within CWT. Wealth management performance was also strong, with a 17% increase in revenue from this business line. Credit related fee income and trust services revenue were each lower, with the latter reflecting the above-mentioned CWT strategic transactions. The provision for credit losses as a percentage of average loans improved to 18 basis points, down from 27 basis points in the same period last year. Non-interest expenses were up 6%. Acquisition-related fair value changes increased 14% reflecting continued strong performance from CWB Maxium. Growth of diluted and adjusted cash earnings per common share to $0.69 and $0.75, respectively, was very strong, with both metrics up 23%. The CWT-related gains contributed approximately $0.03 of adjusted cash earnings per common share (2017 – nil).
Q1 2018 vs. Q4 2017
Compared to the prior quarter, common shareholders’ net income and pre-tax, pre-provision income were up 2% and 3%, respectively. Total revenue was down 1%, as 1% growth in net interest income was offset by an 11% decline in non-interest income. Moderate sequential growth of net interest income reflects the combined impact of 2% loan growth, on an average balance basis, and lower net interest margin. The decrease in non-interest income primarily reflects lower gains related to strategic transactions within CWT this quarter. Gains related to the CWT process contributed approximately $3 million to non-interest income this quarter, or $0.03 of earnings per common share, compared to approximately $6 million, or $0.06 of earnings per common share, in the prior quarter. Excluding these gains in both quarters, non-interest income increased 2%. The provision for credit losses was down two basis points from last quarter and non-interest expenses were 6% lower. Diluted and adjusted cash earnings per common share were both up 1%.

CWB 2018 First Quarter Report 9
Management’s Discussion and Analysis S Discuss
Adjusted ROE and ROA
The first quarter adjusted return on common shareholders’ equity (ROE) of 12.0% was up 160 basis points from the same period last year and unchanged from the prior quarter. Strong year-over-year growth of profitability reflects effective execution of CWB’s Balanced Growth strategy, with well-diversified loan growth, strong growth and diversification of funding sources, higher net interest margin, a normalized credit experience and disciplined control of non-interest expense growth. The CWT-related gains on sale also contributed to higher profitability.
Return on assets (ROA) of 0.91% was 13 basis points higher than last year’s 0.78% driven by the same factors mentioned above. ROA was down three basis points sequentially as growth of common shareholders’ net income was more than offset by the increase in total assets.
Outlook for Profitability Ratios
Over the medium-term, management expects CWB’s earnings growth and profitability to benefit from the expansion of existing client relationships through exceptional service and enhanced client experiences, the attraction of new full-service clients and the planned transition to the AIRB methodology for managing credit risk and calculating risk-weighted assets. The assets acquired on January 31, 2018, offer relatively higher yields at a lower average risk-weighting than CWB’s overall portfolio. Incorporating the expected credit performance of these assets, their estimated contribution to earnings per common share in fiscal 2018 is expected to be accretive to overall profitability beginning in the second quarter.
Total Revenue
First quarter total revenue of $193 million, comprised of net interest income and non-interest income, increased 10% compared to the same quarter last year. Compared to the previous quarter, total revenue was down 1%.
Net Interest Income
Of note, commencing this quarter, CWB has discontinued the use of taxable equivalent basis (teb) non-IFRS measures as the teb adjustment is no longer of material significance to CWB’s results. Previously, teb increased interest income and the provision for income taxes to what they would have been had certain tax-exempt securities been taxed at the statutory rate. Comparative figures have been restated to conform with the current period presentation.
Q1 2018 vs. Q1 2017
Net interest income of $171 million increased 10%, reflecting the combined benefits of 7% loan growth, on an average balance basis, and a six basis point increase in net interest margin to 2.52%. The increase in net interest margin primarily reflects higher asset yields, mainly due to an increase in the average prime rate of more than 50 basis points, which more than offset higher funding costs. Q1 2018 vs. Q4 2017
Net interest income was up 1%, reflecting the combined impact of 2% loan growth, on an average balance basis, and an 11 basis point decline in net interest margin. Within net interest margin, the benefit of higher asset yields was more than offset by changes in asset and funding mix. Of note, elevated average balances of cash and securities compared to the prior quarter reflect conservative funding and liquidity management in anticipation of the asset purchase on January 31, 2018.
Interest rate sensitivity
Note 15 to the unaudited interim consolidated financial statements summarizes CWB’s exposure to interest rate risk as at January 31, 2018. The estimated sensitivity of net interest income to a change in interest rates is presented in the table below. The amounts represent the estimated change in net interest income that would result over the following 12 months from a one-percentage point change in interest rates. The estimates are based on a number of assumptions and factors, which include:

CWB 2018 First Quarter Report 10
Management’s Discussion and Analysis S Discuss
a constant structure in the interest sensitive asset and liability portfolios;
interest rate changes affecting interest sensitive assets and liabilities by proportionally the same amount, except floor levels for various deposit liabilities and certain floating rate loans, and applied at the appropriate repricing dates; and,
no early redemptions.
($ thousands)
January 31
2018
October 31
2017
January 31
2017
Estimated impact on net interest income of a 1% increase in interest rates 1 year $ 1,427 $ 8,324 $ 7,230
1 year percentage change 0.21 % 1.39 % 1.17 %
Estimated impact on net interest income of a 1% decrease in interest rates
1 year $ (6,115) $ (13,226) $ (4,016)
1 year percentage change (0.90) % (2.21) % (0.65) %
In addition to the projected changes in net interest income noted above, it is estimated that a one-percentage point increase in all interest rates at January 31, 2018 would increase unrealized losses related to available-for-sale securities and the fair value of interest rate swaps designated as hedges, and result in a reduction in other comprehensive income of approximately $90 million, net of tax (January 31, 2017 – $80 million).
It is estimated that a one-percentage point decrease in all interest rates at January 31, 2018 would have the opposite effect, increasing other comprehensive income by approximately $88 million, net of tax (January 31, 2017 – $82 million). Management maintains the asset liability structure and interest rate sensitivity within CWB’s established policies through pricing and product initiatives, as well as the use of interest rate swaps.
Outlook for net interest margin
CWB’s Balanced Growth strategy targets growth of lower-cost funding sources along with selective, geographically diversified loan growth in higher yielding portfolios with an acceptable risk profile. The combined positive impact of successful strategic execution, including the expected contributions of assets acquired at the end of the first quarter, and the higher interest rate environment is expected to support incrementally higher net interest margin in fiscal 2018 compared to last year. The impact of higher average balances of cash and securities with a lower average yield on net interest margin is expected to be less prevalent in the second half of this year, partly as a result of expected loan growth. Management may periodically increase balance sheet liquidity in the event of macroeconomic or financial market volatility, and in preparation for upcoming maturities and/or transactions. Acceleration of loan growth in 2018 may require increased utilization of the relatively higher-cost broker deposit funding channel. Competitive pressure on loan yields is expected to remain apparent, and deposit costs are expected to move incrementally higher this year, due to both competitive factors and expectations for impacts from the Bank of Canada’s rate increases in both 2017 and this year.
Non-interest Income
Q1 2018 vs. Q1 2017
Non-interest income of $22 million was up 13% ($3 million) from last year, primarily due to gains of approximately $3 million recorded within ‘other’ non-interest income from the CWT strategic transactions. Wealth management revenue increased 17% ($1 million) with strong 11% growth of assets under management. These factors were partially offset by lower credit related fees and trust services revenue. The decrease in credit related fees partly relates to the shift in organic loan growth to emphasize general commercial loans, which tend to be associated with lower fees as compared to real estate loans with more complex structures, while the change in trust services revenue primarily reflects the above-mentioned appointment of successor trustees for certain CWT accounts.
Q1 2018 vs. Q4 2017
Non-interest income was down 11% ($3 million) sequentially. Strong performance from wealth management was more than offset by factors related to the strategic transactions within CWT, as well as lower credit related fee income. Gains related to the CWT process contributed approximately $3 million to non-interest income this quarter, compared to approximately $6 million in the prior quarter, and trust services revenue also declined with the transfer of accounts. Lower credit related fee income mainly reflects the same factors noted in the year-over-year comparison above.

CWB 2018 First Quarter Report 11
Management’s Discussion and Analysis S Discuss
Outlook for non-interest income
Growth of non-interest income is expected to reflect CWB’s strategy to extend and deepen relationships with both new and existing business owner clients. This includes a continued focus to deliver strong, high-quality loan growth with associated fee income, as well as enhanced transactional capabilities in cash management and other retail services, including CWB’s relationship-based, branch-raised deposit franchise. Credit related fee income may be somewhat volatile in view of the factors noted above. Management expects further increases in wealth management revenue to result over the medium term from solid performance within CWB Wealth Management, including organic growth of discretionary investment services, and further growth of proprietary investment products. Trust services revenue will likely be lower this year compared to 2017 as a result of the appointment of successor trustees for certain accounts. Further gains related to this process may occur, but are not expected to be material. Based on the current composition of the securities portfolio, net gains/losses on securities are not expected to contribute materially to non-interest income in fiscal 2018; however, the magnitude and timing of gains or losses are dependent on market factors that are difficult to predict. CWB may realize gains on the sale of residential mortgage portfolios as opportunities become available. Such gains are anticipated to be a recurring, although sporadic, source of ‘other’ non-interest income.
Acquisition-related Fair Value Changes
The change in estimated fair value of contingent consideration related to the acquisition of CWB Maxium was $5 million this quarter, compared to $4 million in the same quarter last year and $5 million last quarter. Quarterly changes approximately similar in magnitude through the remainder of the three-year earn out period would represent the maximum amount available through the purchase agreement.
This quarter CWB paid the second annual instalment of the contingent consideration, reflecting very strong operating performance of CWB Maxium since the acquisition was completed on March 1, 2016.
Non-interest Expenses
Q1 2018 vs. Q1 2017
Non-interest expenses of $88 million were up 6% ($5 million), primarily due to a 7% ($4 million) increase in salaries and benefits. Higher salaries and benefits mainly reflected hiring activity to support overall business growth and annual salary increments. Premises and equipment expenses increased 4% ($1 million), primarily reflecting ongoing investment in technology infrastructure to position CWB for future growth.
Q1 2018 vs. Q4 2017
Non-interest expenses were down 6% ($5 million), mainly due to the customary seasonal increase across most categories of non-interest expenses last quarter. The 20% ($4 million) decline in ‘other’ expenses primarily reflects an expected seasonal decrease in advertising expenses, along with lower regulatory costs and consultant fees.
Efficiency ratio and operating leverage
The first quarter efficiency ratio of 44.6%, which measures non-interest expenses, excluding the pre-tax amortization of acquisition-related intangible assets, divided by total revenue, compares favourably to 46.2% in the same period last year and 46.8% in the previous quarter. The difference compared to both prior periods primarily reflects revenue growth associated with CWB’s strong strategic execution, in combination with disciplined control of non-interest expenses.
Operating leverage, which is calculated as the growth rate of total revenue less the growth rate of non-interest expenses, excluding the pre-tax amortization of acquisition-related intangible assets, over the same period last year was 3.9%, compared to 2.4% last year and 1.0% last quarter.
Outlook for the efficiency ratio and operating leverage
CWB’s medium-term targets for growth of adjusted cash earnings per share and positive operating leverage incorporate expectations for strong business growth supported through strategic investment in people, technology and infrastructure, along with effective control of expense growth. Management anticipates CWB will deliver positive operating leverage over the medium-term, albeit at a considerably more moderate rate than was apparent this quarter. CWB’s average annual efficiency ratio over the past three years is approximately 46%, and the efficiency ratio is expected to continue to fluctuate around this level.

CWB 2018 First Quarter Report 12
Management’s Discussion and Analysis S Discuss
Income Taxes
The first quarter effective income tax rate was 26.7%, compared to 27.6% last year. The difference compared to last year’s effective rate mainly relates to the tax treatment of the CWT-related gains.
Outlook for income taxes
CWB’s expected income tax rate for 2018 is approximately 27.5%.
Comprehensive Income
Comprehensive income is comprised of net income and other comprehensive income (OCI), all net of income taxes.
Q1 2018 vs. Q1 2017
Comprehensive income of $41 million was relatively consistent with the same period last year, as a $15 million decrease in OCI was partially offset by $12 million higher net income.
Changes in OCI, all net of tax, mainly resulted from decreases in the change in fair value of available-for-sale securities ($11 million) and derivatives designated as cash flow hedges ($4 million). CWB’s portfolio of available-for-sale securities is comprised of debt securities and investment grade preferred shares. Fluctuations in value are generally attributed to changes in interest rates, movements in market credit spreads and shifts in the interest rate curve. The difference compared to last year primarily reflects the impact on market values of government debt securities from three successive Bank of Canada rate increases, both in respect to the level of interest rates and the shape of the interest rate curve, as well as lower unrealized losses on preferred shares.
Balance Sheet
The quarter end balance of total assets of $27,914 million was up 12% from last year and 6% from last quarter.
Cash and Securities
Cash and securities totaled $3,062 million at January 31, 2018, compared to $2,552 million last year and $2,709 million last quarter. CWB maintains prudent liquidity levels at all times while remaining compliant with the Liquidity Adequacy Requirements guideline established by the Office of the Superintendent of Financial Institutions Canada (OSFI). CWB’s liquidity management is based on an internal stressed cash flow model, with the level of cash and securities driven primarily by the term structure of both assets and liabilities. Higher average balances of cash and securities compared to last quarter mainly reflect conservative funding and liquidity management in anticipation of the asset purchase on January 31, 2018.
The cash and securities portfolio is comprised of high quality debt instruments and investment grade preferred shares that are not held for trading purposes and, where applicable, are typically held until maturity. Net unrealized losses on cash and securities recorded on the balance sheet of $52 million were up from $43 million last year and $40 million last quarter. The benefit of higher market values of preferred shares compared to both the same quarter last year and last quarter was more than offset by lower market values of government debt securities.
Net realized gains/losses on securities were negligible in all periods. Based on the current composition of the securities portfolio, net gains/losses on securities going forward are not expected to have a material impact on non-interest income, although debt security and preferred share market conditions are inherently unpredictable in the short-term.

CWB 2018 First Quarter Report 13
Management’s Discussion and Analysis S Discuss
Loans
Total loans, excluding the allowance for credit losses, of $24,393 million increased 11% ($2,510 million) from last year and 4% ($1,047 million) from the prior quarter. Total loan growth this quarter included the portfolio acquisition on January 31 of approximately $850 million, with approximately 80% of the acquired total comprised of equipment financing and leasing exposures, and 20% comprised of general commercial loans. Organic loan growth was 8% from last year and 1% from the prior quarter.
% Change from
January 31
2017
(unaudited) January 31
2018
October 31
2017
January 31
2017
(millions)
General commercial loans $ 6,769 $ 6,307 $ 5,500 23 %
Personal loans and mortgages 4,786 4,726 4,178 15
Equipment financing and leasing 4,534 3,892 3,711 22
Commercial mortgages 4,265 4,267 4,126 3
Real estate project loans 3,939 4,030 4,195 (6)
Oil and gas production loans 100 124 173 (42)
Total loans outstanding(1) $ 24,393 $ 23,346 $ 21,883 11 %
(1) Total loans outstanding by lending sector exclude the allowance for credit losses.
Year-over-year growth by lending sector was consistent with CWB’s Balanced Growth strategy, including increased industry and geographic diversification. The general commercial category led growth by lending sector in dollar terms with an increase of $1,269 million, including approximately $190 million of acquired growth. Growth of $823 million in equipment financing and leasing, included approximately $660 million from the portfolio acquisition. Growth of personal loans and mortgages of $608 million was also strong, mainly reflecting continued strong performance from CWB Optimum Mortgage. Commercial mortgages were up $138 million from last year. Real estate project loans contracted $256 million, with net growth in British Columbia more than offset by the impact of successful project completions and payouts in Alberta and Ontario. Lagging impacts of the 2015 – 2016 regional recession have resulted in fewer new real estate project lending opportunities in Edmonton and Calgary. CWB maintained a proactive approach in managing its small portfolio of oil and gas production loans over the past year, reducing outstanding balances by $73 million.
On a sequential basis, total loan growth was led by equipment financing and leasing ($642 million), mainly reflecting the portfolio acquisition, followed by general commercial loans ($462 million) and personal loans and mortgages ($60 million). Outstanding balances of real estate project loans and loans to oil and gas producers contracted from last quarter, while commercial mortgages were relatively stable.
% Change
from
January 31
2017
(unaudited) January 31
2018
October 31
2017
January 31
2017
(millions)
British Columbia $ 8,258 $ 8,145 $ 7,691 7 %
Alberta 7,835 7,728 7,822 -
Ontario 5,032 4,397 3,458 46
Saskatchewan 1,344 1,343 1,319 2
Manitoba 745 737 716 4
Other 1,179 996 877 34
Total loans outstanding(1) $ 24,393 $ 23,346 $ 21,883 11 %
(1) Total loans outstanding by province exclude the allowance for credit losses.
More than 75% of the portfolio acquired on January 31 is comprised of exposures in Central and Eastern Canada, with Ontario accounting for approximately 60%. Partly on this basis, Ontario continued to lead loan growth by province in dollar terms ($1,574 million) from last year. Increased exposure within Central and Eastern Canada reflects the geographic diversification objectives clearly defined within CWB’s Balanced Growth strategy. With further support from the portfolio acquisition this quarter, this objective is underpinned by ongoing strong performance from CWB’s businesses that have a national footprint, including CWB Maxium, CWB Optimum Mortgage, National Leasing, and CWB Franchise Finance. This combination of organic and acquired growth drove a 43% increase in CWB’s outstanding loans within Central and Eastern Canada. This region now accounts for 26% of CWB’s total loan portfolio, up from 20% one year ago. British Columbia, which represents 34% of CWB’s total loan balances, also delivered strong annual growth of $567 million, while outstanding loans in Saskatchewan and Alberta increased $24 million and $13 million, respectively.

CWB 2018 First Quarter Report 14
Management’s Discussion and Analysis S Discuss
Compared to the prior quarter, the same geographic diversification trends are apparent, with Ontario and British Columbia accounting for more than 80% of CWB’s growth in dollar terms. Alberta also delivered growth of $107 million on a sequential basis.
CWB Optimum Mortgage
Net of portfolio sales, total loans of $2,826 million within CWB Optimum increased 18% ($427 million) year-over-year and 3% ($80 million) compared to the prior quarter. Growth for the quarter was driven almost exclusively by alternative mortgages secured via first mortgages carrying a weighted average loan-to-value at initiation of approximately 68%. The book value of alternative mortgages represented 95% of CWB Optimum’s total portfolio at quarter end, compared to 92% last year and unchanged from the prior quarter. At approximately 56% of the total, Ontario represents the largest geographic exposure by province within CWB Optimum’s portfolio, followed by Alberta at 18% and British Columbia at 17%. The average size of CWB Optimum mortgages originated in the first quarter was approximately $340,000, and the average size of mortgages outstanding at January 31, 2018 was $290,000.
Outlook for loans
CWB will continue to support high-quality borrowers with a focus on business owners operating within targeted industry segments across Canada. Management remains committed to delivering double-digit annual loan growth whenever prudent. This includes a continued focus on secured loans that offer an appropriate return and acceptable risk profile. Loan growth is expected to be strong across most of CWB’s national geographic footprint. Business opportunities within Alberta and Saskatchewan are expected to gain momentum as these provincial economies continue to recover from two years of recession in 2015 and 2016.
Within Ontario, growth is expected to continue to benefit from increasing contributions of CWB Maxium and CWB Franchise Finance, as well as ongoing strong activity within National Leasing and CWB Optimum Mortgage. The portfolio acquired on January 31 is also expected to provide incremental growth over the long-term through retention and renewal of client relationships that are consistent with management’s risk appetite. However, in view of the acquired portfolio’s relatively short, approximately two-year weighted average duration, some degree of near-term run-off is expected. Management expects the outstanding balance of the acquired portfolio to be approximately $600 – $700 million at October 31, 2018.
In respect to housing-related growth opportunities, revisions to OSFI’s Guideline B-20: Residential Mortgage Underwriting Practices and Procedures are expected to somewhat curtail market activity and reduce the pace of home price increases across the country. In particular, the 200 basis point qualifying stress test and limits on co-lending arrangements could make it more difficult for certain prospective buyers to qualify for uninsured mortgages, and have a negative impact on originations within CWB Optimum; however, the changes may also result in increased renewals with existing borrowers, as well as incremental lending opportunities within the alternative mortgage space as all federally-regulated mortgage lenders are affected by revisions to the guideline. Management will also continue to assess the potential impact of further macroprudential measures introduced through the British Columbia government’s recently released budget and plan for housing affordability. In consideration of the full scope of regulatory changes affecting residential mortgages, management expects the growth rate for CWB Optimum to more closely resemble overall growth across the rest of the loan portfolio going forward. This includes the expected moderating impact of changes to Guideline B-20 and the above-mentioned measures recently introduced in British Columbia, as well as CWB’s overall risk appetite for Alt-A mortgages as a proportion of total loans. Compared to fiscal 2017 quarterly originations, originations within CWB Optimum this quarter were consistent with these expectations.
While CWB does not expect changes to Guideline B-20 to have a material impact on growth opportunities within its real estate project lending portfolio, management will continue to assess the potential impact of the new measures in British Columbia on future construction-related opportunities in that province. In general, CWB expects to continue to identify opportunities to finance well-capitalized developers on the basis of sound loan structures and acceptable pre-sale/lease levels.
Subsequent to January 31, 2018, CWB amended its Credit Risk Concentration policy to increase the single risk exposure lending limit to $75 million from $50 million. The single risk exposure Credit Risk Concentration policy was last revised in 2005, when shareholders’ equity was less than $0.5 billion, compared to nearly $2.5 billion at January 31, 2018. For certain quality connections that confirm debt service capacity and loan security from more than one source, the connection limit was amended to $150 million from $100 million. The policy to limit exposure to connected borrowers to not more than 10% of CWB’s shareholders’ equity is unchanged.

CWB 2018 First Quarter Report 15
Management’s Discussion and Analysis S Discuss
Credit Quality
Strong overall credit quality continues to reflect CWB’s secured lending business model, disciplined underwriting practices and proactive loan management.
For the three months ended Change from
January 31 2017
(unaudited)
January 31
2018
October 31
2017
January 31
2017
($ thousands)
Gross impaired loans, beginning of period $ 168,261 $ 168,684 $ 127,212 32 %
New formations 22,525 54,214 31,486 (28)
Reductions, impaired accounts paid down or returned to performing status (46,646) (37,132) (20,554) 127
Write-offs (6,946) (17,505) (13,705) (49)
Total(1) $ 137,194 $ 168,261 $ 124,439 10 %
Balance of the ten largest impaired accounts $ 57,420 $ 70,935 $ 55,544 3 %
Total number of accounts classified as impaired(2) 239 237 228 5
Gross impaired loans as a percentage of total loans 0.57 % 0.72 % 0.57 % - bp(3)
(2)
(1) Gross impaired loans include foreclosed assets held for sale with a carrying value of $4,093 (October 31, 2017 –1,983 and January 31, 2017 – $2,419).
(2) Total number of accounts excludes National Leasing. (3) bp – basis point change.
The dollar level of gross impaired loans this quarter totaled $137 million, compared to $124 million last year and $168 million in the prior quarter. The dollar level of gross impaired loans represented 0.57% of total loans at quarter-end, unchanged from last year and down from 0.72% in the previous quarter. Gross impaired loans within Alberta this quarter totaled $80 million and accounted for 58% of total impairments, compared to $51 million or 41% of gross impairments in the same period last year and $106 million or 63% of total impairments last quarter. The relative concentration of impaired loans in Alberta continues to reflect the lagging impacts of the 2015 – 2016 regional recession, and is consistent with management’s expectations. Gross impairments outside Alberta represented 0.36% of total non-Alberta loans, compared to 0.52% last year and 0.40% last quarter.
The level of gross impaired loans fluctuates as loans become impaired and are subsequently resolved, and does not directly reflect the dollar value of expected write-offs given tangible security held in support of lending exposures. The overall loan portfolio is reviewed regularly with credit decisions undertaken on a case-by-case basis to provide early identification of possible adverse trends.
As at January 31, 2018, the total allowance for credit losses (collective and specific) was $142 million, compared to $130 million one year ago and $136 million last quarter. The total allowance for credit losses represented 114% of gross impaired loans at quarter end, compared to 104% last year and 81% in the prior quarter. The collective allowance for credit losses increased 4% over the past twelve months and was relatively unchanged from the prior quarter.
Provision for Credit Losses
The first quarter provision for credit losses of 18 basis points of average loans was down from 27 basis points in the same period last year and 20 basis points in the previous quarter. The level of the provision in each of the last three quarters is consistent with CWB’s traditional range of 18 – 23 basis points. CWB will adopt IFRS 9 – Financial Instruments, the new accounting standard for loan losses and impairment, and begin to calculate the provision for credit losses using the expected credit loss methodology on November 1, 2018.
Outlook for credit quality
Overall credit quality is expected to continue to reflect CWB’s secured lending business model, disciplined underwriting practices and proactive loan management. Periodic increases in the balance of impaired loans may occur across the portfolio, and gross impaired loans within CWB Optimum may increase in the event of a material correction of residential home prices. Loss rates on current and future impaired loans are expected to be low. This expectation is consistent with CWB’s prior experience, where write-offs have typically been low as a percentage of impairments.

CWB 2018 First Quarter Report 16
Management’s Discussion and Analysis S Discuss
Deposits and Funding CWB continues to execute on key strategic objectives to grow and diversify core funding sources. Total deposits increased 10% from last year ($2,129 million) and 4% ($909 million) from the previous quarter. Branch-raised deposits were up 4% on an annual basis, including very strong 14% growth of fixed term deposits. Lower-cost, branch-raised demand and notice deposit balances were relatively stable compared to last year and the prior quarter. CWB doubled the balance of outstanding securitization funding compared to one year ago and raised $600 million of senior deposit notes through two successful capital markets issuances during the first quarter. Increased use of securitization this quarter reflects success in funding the January 31 asset purchase primarily through CWB’s existing securitization channels, with no increase in broker-sourced deposits as a proportion of total funding this quarter.
Total deposits by type and source are summarized below:
As at Change from
January 31
2017
(unaudited)
January 31
2018
October 31
2017
January 31
2017
($ millions)
Deposits by type
Demand and notice deposits $ 7,579 $ 7,641 $ 7,615 - %
Term deposits 12,469 12,098 11,292 10
Capital markets 2,764 2,164 1,776 56
Total Deposits $ 22,812 $ 21,903 $ 20,683 10 %
As at Change from
January 31
2017
(unaudited)
January 31
2018
October 31
2017
January 31
2017
($ millions)
Deposits by source
CWB Group branch-raised $ 11,916 $ 11,816 $ 11,414 4 %
Deposit brokers 8,132 7,923 7,493 9
Capital markets 2,764 2,164 1,776 56
Total Deposits $ 22,812 $ 21,903 $ 20,683 10 %
Personal deposits represented 60% of total deposits at January 31, 2018, compared to 63% last year and 61% last quarter. Total branch-raised deposits accounted for 52% of total deposits at quarter end, down from 55% in the same period last year and 54% in the prior quarter. Demand and notice deposits comprised 33% of total deposits, compared to 37% last year and 35% last quarter, partly reflecting the impact of $22 million of branch-raised demand and notice deposits transferred to the successor trustees for certain CWT accounts in the first quarter, and a total of $93 million transferred since January 31, 2017. Changes in the proportion of funding derived from branch-raised sources also reflect efforts to diversify funding sources through issuance of capital markets deposits. Total funding raised through the debt capital markets of $2.8 billion represented 12% of total deposits at January 31, 2018, up from 9% last year and 10% last quarter. The deposit broker network remains an efficient source for raising insured fixed term retail deposits and has proven to be a reliable and effective way to access funding and liquidity over a wide geographic base. CWB raises only fixed-term broker deposits, with terms to maturity between one and five years, and does not offer a High Interest Savings Account (HISA) product. Term deposits raised through the broker network represented 36% of total funding at quarter end, unchanged from both last year and last quarter.
Securitization
Securitized leases, loans and mortgages are reported on-balance sheet with total loans. The gross amount of securitized leases and loans at January 31, 2018 was $1,816 million, compared to $996 million one year ago and $1,212 million last quarter. The gross amount of mortgages securitized under the National Housing Act Mortgage Backed Securities (NHA MBS) program was $460 million (Q1 2017 – $381 million). Total funding from the securitization of leases, loans and mortgages in the first quarter was $743 million (Q1 2017 – $83 million), with the increase mainly reflecting success in funding the January 31 asset purchase primarily through securitization, as noted above.
Outlook for deposits and funding
CWB’s strategic focus to grow and diversify funding sources will continue. This includes a goal to increase relationship-based branch-raised deposits, with particular emphasis on demand and notice deposits. This funding segment is typically lower cost and provides associated transactional fee income. Continued growth in the proportion of branch-raised funding is also a key strategic objective because it reflects success in strengthening targeted multi-product client relationships.

CWB 2018 First Quarter Report 17
Management’s Discussion and Analysis S Discuss
The capabilities of CWB’s new core banking system support various growth initiatives related to branch-raised funding over the medium term. Continued development of new and more effective products, along with an ongoing strategic focus on business transformation and process improvement, are expected to enhance CWB’s client experience and strengthen CWB’s competitive position. CWB’s growing market presence to support strong performance against these goals will include further development of digital banking capabilities and may also include periodic expansion of full-service branches.
For example, CWB launched the pilot phase of its Virtual Branch this quarter, which promises to be a differentiated remote banking experience for business owners. CWB’s Virtual Branch offers access to high-touch, personal client service from experienced commercial banking relationship managers and cash management specialists. This unique approach to remote service delivery is complemented by convenient on-line banking options, including our recently deployed remote deposit capture technology. CWB also further improved its on-line wire transfer capabilities this quarter to enable business owners to send payments in over 130 currencies to more than 200 countries. This will complement the introduction of next generation online banking tools for businesses, which will allow clients to house their business and personal banking on a common platform. These are key steps to enhance CWB’s full-service banking experience for business owners. Management expects these initiatives to improve CWB’s client experience and support development of broader client relationships across the country.
Continued diversification of funding sources is also expected to include increased utilization of both debt capital markets and CWB’s growing securitization capabilities. Securitization of leases through National Leasing and residential mortgages through the National Housing Administration Mortgage Backed Security (NHA MBS) program and the Canada Mortgage Bonds (CMB) program this year is expected to continue, and will increase over the medium–term.
Other Assets and Other Liabilities
Other assets totaled $584 million at January 31, 2018, compared to $490 million last year and $509 million last quarter, with the difference primarily due to a commodity tax receivable related to the asset purchase at quarter end.
Other liabilities totaled $533 million at January 31, 2018, relatively unchanged from last year and down from $604 million last quarter.
Off-Balance Sheet
Off-balance sheet items include assets under administration and assets under management. Total assets under administration, which are comprised of trust assets and third-party leases under administration, as well as mortgages under service agreements, totaled $9,027 million at January 31, 2018, compared to $11,120 million one year ago and $10,408 million last quarter. Approximately $3,042 million of assets under administration have transferred to successor trustees for certain CWT accounts over the past two quarters. Further transfers related to this process may occur in forthcoming periods, but are not expected to be material. Assets under management were $2,187 million at quarter end, up 11% from $1,971 million a year earlier and $2,115 million last quarter.
Other off-balance sheet items are comprised of standard industry credit instruments (guarantees, standby letters of credit and commitments to extend credit). CWB does not utilize, nor does it have exposure to, collateralized debt obligations or credit default swaps. For additional information regarding other off-balance sheet items refer to Note 13 of the unaudited interim consolidated financial statements for the period ended January 31, 2018, as well as Note 21 of the audited consolidated financial statements in CWB’s 2017 Annual Report.
Capital Management
OSFI requires Canadian financial institutions to manage and report regulatory capital in accordance with the Basel III capital management framework. CWB currently reports its regulatory capital ratios using the Standardized approach for calculating risk-weighted assets, which requires CWB to carry significantly more capital for certain credit exposures compared to requirements under the Advanced Internal Ratings Based (AIRB) methodology. For this reason, regulatory capital ratios of banks that utilize the Standardized approach are not directly comparable with the large Canadian banks and other financial institutions which utilize the AIRB methodology. CWB’s required minimum regulatory capital ratios, including a 250 basis point capital conservation buffer, are 7.0% common equity Tier 1 (CET1), 8.5% Tier 1 and 10.5% Total capital.

CWB 2018 First Quarter Report 18
Management’s Discussion and Analysis S Discuss
CWB is well-positioned to continue to execute against its Balanced Growth strategy with a very strong capital position, including 9.4% CET1, 10.6% Tier 1 and 12.3% Total capital ratios at January 31, 2018. The portfolio acquisition at quarter end reduced CWB’s CET1 ratio by approximately 25 basis points, consistent with management’s expectations. This change was partially offset by contributions to retained earnings from strong growth of common shareholders’ net income. CWB’s Basel III leverage ratio of 8.0% at quarter end remains very conservative. A normal course issuer bid (NCIB) authorizing CWB to purchase for cancellation prior to September 30, 2018, up to 1,767,000 common shares, representing approximately 2% of the issued and outstanding common shares, has been approved by OSFI and the Toronto Stock Exchange. No shares have been purchased through the NCIB as at January 31, 2018. Management may choose to activate the NCIB in fiscal 2018 should appropriate circumstances become apparent.
Further details regarding CWB’s regulatory capital and capital adequacy ratios are included in the following table:
(unaudited)
As at January 31
2018
As at October 31
2017
As at January 31
2017 ($ millions)
Regulatory capital
CET1 capital before deductions $ 2,254 $ 2,216 $ 2,104
Net CET1 deductions (211) (206) (207)
CET1 capital 2,043 2,010 1,897
Tier 1 capital(1) 2,308 2,275 2,162
Total capital(1) 2,679 2,644 2,602
Risk-weighted assets $ 21,825 $ 21,082 $ 20,028
Capital adequacy ratios
CET1
9.4
%
9.5
%
9.5
% Tier 1 10.6 10.8 10.8
Total 12.3 12.5 13.0
(1) The 2018 inclusion of non-common equity instruments that do not include NVCC clauses is capped at 40% of the January 1, 2013 outstanding
balances (2017 - 50%). For all periods presented, there were no exclusions from regulatory capital related to NVCC.
Book value per common share at January 31, 2018 was $24.98, up from $23.77 last year and $24.82 last quarter, mainly reflecting growth of retained earnings.
Common shareholders received a quarterly dividend of $0.24 per common share on January 4, 2018. On March 7, 2018, CWB’s Board of Directors declared a cash dividend of $0.25 per common share, payable on March 30, 2018 to shareholders of record on March 16, 2018. This quarterly dividend is up two cents, or 9%, from the dividend declared one year ago and one cent, or 4%, from the previous quarter. The Board of Directors also declared a cash dividend of $0.275 per Series 5 Preferred Share, and a cash dividend of $0.390625 per Series 7 Preferred Share, both payable on April 30, 2018 to shareholders of record on April 23, 2018.
Management evaluates common share dividend increases every quarter against CWB’s dividend payout ratio target of approximately 30% of common shareholders’ net income, the current strength of CWB’s capital position, and capital requirements under the Standardized approach to support ongoing strong and balanced asset growth. While the dividend payout ratio this quarter was approximately 34%, CWB’s current capital position is very strong and management expects earnings growth to result in migration of the dividend payout ratio toward the 30% target while supporting CWB’s track record of dividend increases over the medium-term.
Further information relating to CWB’s capital position is provided in Note 16 of the unaudited interim consolidated financial statements for the period ended January 31, 2018 as well as the audited consolidated financial statements and MD&A for the year ended October 31, 2017.
Outlook for Capital Management
CWB continues to operate from a very strong capital position. Management will maintain strong capital ratios under the Standardized approach for calculating risk-weighted assets, above CWB’s target thresholds and OSFI’s required minimums. Target capital ratios, including an appropriate capital buffer over the prescribed OSFI minimums, are reconfirmed through CWB’s regulatory capital planning.
The ongoing retention of earnings, net of expected common and preferred share dividends, is expected to support capital requirements associated with the anticipated achievement of CWB’s medium-term performance target for a strong common equity Tier 1 ratio.

CWB 2018 First Quarter Report 19
Management’s Discussion and Analysis S Discuss
The Basel Committee on Banking Supervision finalized Basel III reforms this quarter and OSFI indicated it will launch a public consultation on the domestic implementation of the proposed reforms in spring 2018. Management does not believe that the reforms to the Standardized approach for credit risk as recommended by the Basel Committee would have a material impact on CWB’s capital position or capital management.
AIRB transition plan
CWB’s project continues in support of an application to OSFI for transition to the AIRB methodology for capital and risk management, including an anticipated three-year time frame ending in fiscal 2019. The AIRB approach will put CWB on more equal footing with its competition. It will add risk sensitivity to CWB’s framework for capital management, increase risk quantification processes, improve risk-based pricing capabilities and economic capital estimations, improve CWB’s stress testing capabilities and enhance CWB’s ability to comply with new accounting standards and Internal Capital Adequacy Assessment Process (ICAAP) reporting requirements. These improved risk management capabilities will better equip CWB to allocate resources to target business segments that generate the most attractive risk-adjusted returns.
CWB’s AIRB transition project is separated into several discrete phases, including: establishment of formalized project governance; creation of models including data collection, development and testing, deployment, operationalization and use test; model validation; implementation of CWB’s risk-weighted asset production and capital reporting tool; and, submission of final application to OSFI. All material AIRB models and related scorecards have now been developed and operationalized within the business.
Work continues toward development of an enhanced enterprise data warehouse to serve as the repository for required data. Model validation and continuous improvement of existing models continues. Further development of CWB’s risk function, including: three lines of defence enhancement; stress testing capabilities; and, economic capital estimation are also underway.
Significant Changes in Accounting Policies and Financial Statement Presentation The unaudited interim consolidated financial statements for the quarter were prepared using the same accounting policies as the audited consolidated financial statements for the year ended October 31, 2017.
Future Accounting Changes
A number of standards and amendments have been issued by the International Accounting Standards Board (IASB) and are described in further detail in CWB’s 2017 Annual Report. These standards and amendments may impact the presentation of financial statements in the future and management is currently reviewing these changes to determine the impact, if any. CWB continues to monitor the IASB’s proposed changes to IFRS.
IFRS 9 – Financial Instruments CWB will adopt IFRS 9 effective November 1, 2018. CWB’s IFRS 9 transition activities in 2017 concentrated on assessing the classification and measurement of financial instruments, developing impairment models and building a comprehensive expected credit loss (ECL) calculation process. All material AIRB models, which are being leveraged to satisfy IFRS 9 requirements with consideration for specific differences between regulatory and accounting requirements, have been deployed into the business this quarter and related scorecards are being populated to generate risk parameters for use in the estimation of ECL. During the current year, CWB will focus on implementing and testing a comprehensive governance framework, validating and refining impairment models and the expected credit loss calculation process and performing a parallel run. CWB is on schedule to meet transition timelines and continues to monitor industry interpretations of IFRS 9 requirements and adjust implementation plans accordingly. The impact of transitioning to IFRS 9 has not yet been quantified.
Controls and Procedures There were no significant changes in CWB’s disclosure controls and procedures and internal controls over financial reporting that occurred during the quarter ended January 31, 2018 that have materially affected, or are reasonably likely to materially affect, CWB’s disclosures of required information and internal controls over financial reporting. Prior to its release, this quarterly report to shareholders was reviewed by the Audit Committee and, on the Audit Committee’s recommendation, approved by the Board of Directors of CWB.

CWB 2018 First Quarter Report 20
Management’s Discussion and Analysis S Discuss
Third-party Credit Ratings
DBRS Limited (DBRS) maintains published credit ratings on CWB’s senior debt (deposits), short-term debt, subordinated debentures and preferred shares of “A (low)”, “R1 (low)”, “BBB (high)” and “Pfd-3”, respectively, all with a stable outlook. Credit ratings do not consider market price or address the suitability of any financial instrument for a particular investor and are not recommendations to purchase, sell or hold securities. Ratings are subject to revision or withdrawal at any time by the rating organization. Management believes the ratings widen the base of clients and investors who can participate in CWB’s offerings, while also lowering overall funding costs and the cost of capital.
Updated Share Information
As at February 28, 2018, there were 88,772,455 common shares and 2,958,752 stock options outstanding. For additional information on share capital and stock options, see Notes 18 and 19 of audited annual consolidated financial statements for the year ended October 31, 2017 and Notes 11 and 12 to the interim consolidated financial statements for this quarter.
Dividend Reinvestment Plan
CWB common shares (TSX: CWB) and preferred shares (TSX: CWB.PR.B; CWB.PR.C) are deemed eligible to participate in CWB’s dividend reinvestment plan (the Plan). The Plan provides holders of eligible shares of CWB the opportunity to direct cash dividends toward the purchase of CWB common shares. CWB has elected to issue common shares for the Plan at the average market price (as defined in the Plan). Further details for the Plan are available on CWB’s website.
Summary of Quarterly Financial Information
2018 2017 2016
($ thousands) Q1 Q4 Q3 Q2 Q1 Q4 Q3 Q2
Total revenue $ 193,217 $ 195,122 $ 183,843 $ 172,443 $ 175,227 $ 168,252 $ 168,412 $ 163,730
Common shareholders’ net income
61,939
60,833
56,308
47,594
49,542
47,834 45,582
32,213
Earnings per common share Basic 0.70 0.69 0.64 0.54 0.56 0.54 0.55 0.40 Diluted 0.69 0.68 0.64 0.54 0.56 0.54 0.55 0.40 Adjusted cash 0.75 0.74 0.69 0.59 0.61 0.59 0.60 0.41 Total assets ($ millions) 27,914 26,447 25,345 24,618 24,815 25,223 25,185 24,237
The financial results for each of the last eight quarters are summarized above. In general, CWB’s performance reflects a relatively consistent trend, although the second quarter contains three fewer revenue-earning days in non-leap years, and two fewer days in leap years such as 2016. Total revenue in the first quarter of 2018 and the fourth quarter of 2017 includes the impact of gains related to the CWT process to appoint successor trustees for certain accounts. Common shareholders’ net income in the second quarter of 2016 reflects the impact of the credit performance of oil and gas production loans.
Among other things, quarterly results can also fluctuate from the recognition of periodic income tax items.
For additional details on variations between the prior quarters, refer to the summary of quarterly results section of CWB’s MD&A for the year ended October 31, 2017 and the individual quarterly reports to shareholders which are available on SEDAR at www.sedar.com and on CWB’s website at www.cwb.com.

CWB 2018 First Quarter Report 21
Management’s Discussion and Analysis S Discuss
Non-IFRS Measures
CWB uses a number of financial measures to assess its performance. These measures provide readers with an enhanced understanding of how management views the results. Non-IFRS measures may also provide readers the ability to analyze trends and provide comparisons with our competitors. These non-IFRS measures do not have standardized meanings prescribed by IFRS and therefore may not be comparable to similar measures presented by other financial institutions. The non-IFRS measures used in this MD&A are calculated as follows:
pre-tax, pre-provision income - total revenue less non-interest expenses, excluding the pre-tax amortization of acquisition-related intangible assets (see calculation below);
adjusted cash earnings per common share – diluted earnings per common share calculated with adjusted common shareholders’ net income (see calculation below), which excludes the amortization of acquisition-related intangible assets and contingent consideration fair value changes, net of tax. Excluded items are not considered to be indicative of ongoing business performance;
return on common shareholders’ equity – annualized common shareholders’ net income divided by average common shareholders’ equity;
adjusted return on common shareholders’ equity – annualized common shareholders’ net income excluding the amortization of acquisition-related intangible assets and contingent consideration fair value changes, net of tax (see calculation below), divided by average common shareholders’ equity;
return on assets – annualized common shareholders’ net income divided by average total assets;
efficiency ratio – non-interest expenses, excluding the pre-tax amortization of acquisition-related intangible assets, divided by total revenue, (see calculation below);
net interest margin – net interest income divided by average total assets;
provision for credit losses as a percentage of average loans – provision for credit losses divided by average total loans;
operating leverage – growth rate of total revenue less growth rate of non-interest expenses, excluding the pre-tax amortization of acquisition-related intangible assets;
common share dividend payout ratio - common share dividends declared during the past twelve months divided by common shareholders’ net income earned over the same period;
Basel III common equity Tier 1, Tier 1 and Total capital ratios – in accordance with guidelines issued by OSFI; and
average balances – average daily balances. Of note, commencing with the first quarter of 2018, CWB has discontinued the use of the taxable equivalent basis (teb) non-IFRS measure as it is no longer of material significance to CWB’s results. Previously, teb increased interest income and the provision for income taxes to what they would have been had certain tax-exempt securities been taxed at the statutory rate. Comparative figures have been restated to conform with the current period presentation.
Adjusted financial measures
For the three months ended Change from January 31
2017
(unaudited) January 31
,2018
October 31
2017
January 31
2017
($ thousands)
Non-interest expenses $ 87,917 $ 93,129 $ 82,815 6 %
Adjustments (before tax):
Amortization of acquisition-related intangible assets (1,764) (1,909) (1,852) (5)
Adjusted non-interest expenses $ 86,153 $ 91,220 $ 80,963 6 %
Common shareholders’ net income
$ 61,929 $ 60,833 $ 49,542 25 %
Adjustments (after tax):
Acquisition-related fair value changes 3,640 3,462 3,184 14
Amortization of acquisition-related intangible assets 1,344 1,408 1,364 (1)
Adjusted common shareholders’ net income $ 66,913 $ 65,703 $ 54,090 24 %
Pre-tax, pre-provision (PTPP) income
For the three months ended Change from
January 31 2017
(unaudited) January 31
2018
October 31
2017
January 31
2017
($ thousands)
Total revenue
$ 193,217 $ 195,122 $ 175,227 10 %
Less:
Adjusted non-interest expenses (see above) 86,153 91,220 80,963 6
Pre-tax, pre-provision income $ 107,064 $ 103,902 $ 94,264 14 %

CWB 2018 First Quarter Report 22
Consolidated Balance Sheets S Discuss
As at
January 31 2018
As at
October 31 2017
As at
January 31 2017
Change from
January 31 2017
(unaudited) ($ thousands)
Assets
Cash Resources
Cash and non-interest bearing deposits with financial institutions $ 52,776 $ 17,491 $ 46,778 13 %
Interest bearing deposits with regulated financial institutions (Note 4) 320,394 503,895 403,925 (21) Cheques and other items in transit 18,639 410 - 100
391,809 521,796 450,703 (13)
Securities (Note 4)
Issued or guaranteed by Canada 1,639,543 1,307,298 1,330,814 23
Issued or guaranteed by a province or municipality 640,303 438,858 349,646 83 Other debt securities 257,768 308,421 275,628 (6)
Preferred shares 132,348 132,410 144,921 (9)
2,669,962 2,186,987 2,101,009 27
Loans (Notes 5 and 7)
Personal 4,786,226 4,725,715 4,177,551 15
Business 19,606,672 18,619,853 17,705,173 11
24,392,898 23,345,568 21,882,724 11 Allowance for credit losses (Note 6) (124,032) (116,329) (109,275) 14
24,268,866 23,229,239 21,773,449 11
Other
Property and equipment 54,798 56,115 56,557 (3)
Goodwill 85,353 85,669 85,669 - Intangible assets 150,923 149,730 148,901 1
Derivative related (Note 9) 15,464 12,393 8,456 83
Other assets 277,029 205,524 189,934 46
583,567 509,431 489,517 19
Total Assets $ 27,914,204 $ 26,447,453 $ 24,814,678 12 %
Liabilities and Equity Deposits
Personal $ 13,722,242 $ 13,394,562 $ 13,096,585 5 %
Business and government 9,090,193 8,508,420 7,586,775 20
22,812,435 21,902,982 20,683,360 10
Other
Cheques and other items in transit 54,756 55,545 49,444 11 Securities sold under repurchase agreements - 58,358 108,480 (100)
Derivative related (Note 9) 54,745 35,381 13,243 313
Other liabilities 423,530 455,009 363,029 17
533,031 604,293 534,196 -
Debt Debt securities (Note 8) 1,833,444 1,226,336 909,050 102
Subordinated debentures 250,000 250,000 325,000 (23)
2,083,444 1,476,336 1,234,050 69
Equity
Preferred shares (Note 11) 265,000 265,000 265,000 -
Common shares (Note 11) 740,133 731,885 724,252 2 Retained earnings 1,528,682 1,488,634 1,384,221 10
Share-based payment reserve 23,819 24,979 26,932 (12)
Other reserves (74,725) (49,453) (37,747) 98
Total Shareholders’ Equity 2,482,909 2,461,045 2,362,658 5
Non-controlling interests 2,385 2,797 414 476
Total Equity 2,485,294 2,463,842 2,363,072 5
Total Liabilities and Equity $ 27,914,204 $ 26,447,453 $ 24,814,678 12 %
The accompanying notes are an integral part of the interim consolidated financial statements.

CWB 2018 First Quarter Report 23
Consolidated Statements of Income S Discuss
For the three months ended
Change from
January 31
2017
(unaudited) January 31
2018
October 31
2017
January 31
2017(1)
($ thousands, except per share amounts)
Interest Income
Loans $ 273,544 $ 264,575 $ 243,800 12 %
Securities 8,891 7,326 7,030 26 Deposits with regulated financial institutions 1,982 1,614 2,069 (4)
284,417 273,515 252,899 12
Interest Expense
Deposits 104,247 95,630 89,474 17
Debt 8,903 7,391 7,676 16
113,150 103,021 97,150 16
Net Interest Income 171,267 170,494 155,749 10
Non-interest Income Credit related 7,893 8,381 8,769 (10)
Wealth management services 5,042 4,427 4,302 17
Retail services 2,763 2,521 2,747 1
Trust services 2,177 2,754 2,949 (26)
Gains on securities, net 7 9 70 (90)
Other 4,068 6,536 641 535
21,950 24,628 19,478 13
Total Revenue 193,217 195,122 175,227 10
Provision for Credit Losses (Note 6) 10,561 11,411 14,992 (30)
Acquisition-related Fair Value Changes 4,953 4,710 4,361 14 Non-interest Expenses
Salaries and employee benefits 58,103 57,761 54,364 7
Premises and equipment 14,901 16,634 14,348 4
Other expenses 14,913 18,734 14,103 6
87,917 93,129 82,815 6
Net Income before Income Taxes 89,786 85,872 73,059 23 Income Taxes 24,007 21,227 19,695 22
Net Income 65,779 64,645 53,364 23
Net Income Attributable to Non-Controlling Interests 287 250 259 11
Shareholders’ Net Income 65,492 64,395 53,105 23
Preferred share dividends 3,563 3,562 3,563 -
Common Shareholders’ Net Income $ 61,929 $ 60,833 $ 49,542 25 %
Average number of common shares (in thousands) 88,629 88,409 88,185 1
Average number of diluted common shares (in thousands) 89,217 88,783 88,492 1
Earnings Per Common Share
Basic $ 0.70 $ 0.69 $ 0.56 25 %
Diluted 0.69 0.68 0.56 23
(1) During the fourth quarter of 2017, certain fee income was reclassified from retail services to wealth management services within Non-interest Income.
Comparative figures have been restated to conform with the current period presentation.
nm – not meaningful
The accompanying notes are an integral part of the interim consolidated financial statements.

CWB 2018 First Quarter Report 24
Consolidated Statements of Comprehensive Income S Discuss
For the three months ended
(unaudited)
($ thousands)
January 31
2018
January 31
2017
Net Income $ 65,779 $ 53,364
Other Comprehensive Income (Loss), net of tax
Available-for-sale securities:
Gains (losses) from change in fair value(1) (9,222) 1,438
Reclassification to net income(2) (5) 51
(9,227) 1,489
Derivatives designated as cash flow hedges: Losses from change in fair value(3) (14,448) (10,247)
Reclassification to net income(4) (1,597) (1,410)
(16,045) (11,657)
(25,272) (10,168)
Comprehensive Income for the Period $ 40,507 $ 43,196
Comprehensive income for the period attributable to: Shareholders of CWB $ 40,220 $ 42,937
Non-controlling interests 287 259
Comprehensive Income for the Period $ 40,507 $ 43,196
(1) Net of income tax of $3,375 (2017 - $523). (2) Net of income tax of $2 (2017 - $19). (3) Net of income tax of $5,317 (2017 - $3,770). (4) Net of income tax of $588 (2017 - $519).
Items presented in other comprehensive income will be subsequently reclassified to the Consolidated Statements of Income when specific conditions are met.
The accompanying notes are an integral part of the interim consolidated financial statements.
For the three months ended
(unaudited) January 31
2018
January 31
2017 ($ thousands)
Retained Earnings
Balance at beginning of period $ 1,488,634 $ 1,354,966 Shareholders’ net income 65,492 53,105
Dividends – Preferred shares (3,563) (3,563)
– Common shares (21,288) (20,287)
Decrease in equity attributable to subsidiary (593) -
Balance at end of period 1,528,682 1,384,221
Other Reserves
Balance at beginning of period (49,453) (27,579)
Changes in available-for-sale securities (9,227) 1,489
Changes in derivatives designated as cash flow hedges (16,045) (11,657)
Balance at end of period (74,725) (37,747)
Preferred Shares (Note 11) Balance at beginning and end of period 265,000 265,000
Common Shares (Note 11)
Balance at beginning of period 731,885 718,377
Issued on acquisition-related contingent consideration instalment payment (Note 14) 5,750 -
Issued under dividend reinvestment plan 814 968 Transferred from share-based payment reserve on the exercise or exchange of options 1,684 4,907
Balance at end of period 740,133 724,252
Share-based Payment Reserve
Balance at beginning of period 24,979 31,276
Amortization of fair value of options (Note 12) 524 563
Transferred to common shares on the exercise or exchange of options (1,684) (4,907)
Balance at end of period 23,819 26,932
Total Shareholders’ Equity 2,482,909 2,362,658
Non-Controlling Interests
Balance at beginning of period 2,797 773
Net income attributable to non-controlling interests 287 259
Dividends to non-controlling interests (699) (501) Partial ownership increase - (117)
Balance at end of period 2,385 414
Total Equity $ 2,485,294 $ 2,363,072
The accompanying notes are an integral part of the interim consolidated financial statements.
Consolidated Statements of Changes in Equity

CWB 2018 First Quarter Report 25
Consolidated Statements of Cash Flow S Discuss
For the three months ended
(unaudited) January 31
2018
January 31
2017 ($ thousands)
Cash Flows from Operating Activities
Net income $ 65,779 $ 53,364
Adjustments to determine net cash flows:
Provision for credit losses 10,561 14,992
Depreciation and amortization 7,332 7,135 Current income taxes receivable and payable (8,672) 1,398
Amortization of fair value of employee stock options (Note 12) 524 563
Accrued interest receivable and payable, net 9,413 (11,441)
Deferred income taxes, net (6,472) (905)
Net gain on CWT strategic transactions (3,009) - Gains on securities, net (7) (70)
Fair value change in contingent consideration (Note 14) 4,953 4,361
Change in operating assets and liabilities:
Deposits, net 909,453 (511,193) Loans, net (1,051,806) 169,724
Securities sold under repurchase agreements, net (58,358) 163,318
Securities purchased under resale agreements, net - 108,481
Other items, net (70,069) (18,175)
(190,378) (18,448)
Cash Flows from Financing Activities Debt securities issued 734,057 74,220
Debt securities repaid (126,949) (108,368)
Dividends (24,037) (22,882)
Dividends to non-controlling interests (699) (501)
582,372 (57,531)
Cash Flows from Investing Activities
Interest bearing deposits with regulated financial institutions, net 183,501 486,591
Securities, purchased (1,135,566) (1,789,114)
Securities, sale proceeds 311,913 989,665 Securities, matured 324,138 401,186
Proceeds from CWT strategic transactions 3,059 -
Property, equipment and intangible assets (7,487) (4,902)
Partial ownership increase - (1,838)
Acquisition-related contingent consideration instalment payment (Note 14) (17,250) (10,132)
(337,692) 71,456
Change in Cash and Cash Equivalents 54,302 (4,523)
Cash and Cash Equivalents at Beginning of Period (37,643) 1,857
Cash and Cash Equivalents at End of Period * $ 16,659 $ (2,666)
* Represented by:
Cash and non-interest bearing deposits with financial institutions $ 52,775 $ 46,778
Cheques and other items in transit (included in Cash Resources) 18,639 - Cheques and other items in transit (included in Other Liabilities) (54,755) (49,444)
Cash and Cash Equivalents at End of Period $ 16,659 $ (2,666)
Supplemental Disclosure of Cash Flow Information
Interest and dividends received $ 292,083 $ 255,733 Interest paid 106,542 107,381
Income taxes paid 28,817 15,650
The accompanying notes are an integral part of the interim consolidated financial statements.

CWB 2018 First Quarter Report 26
Notes to Interim Consolidated Financial Statements
(unaudited) ($ thousands, unless otherwise noted)
1. Basis of Presentation and Significant Accounting Policies
These unaudited condensed interim consolidated financial statements of Canadian Western Bank (CWB) have been prepared in accordance with International Accounting Standard (IAS) 34 – Interim Financial Reporting as issued by the International Accounting Standards Board (IASB) using the same accounting policies as the audited consolidated financial statements for the year ended October 31, 2017. These interim consolidated financial statements of CWB, domiciled in Canada, have also been prepared in accordance with subsection 308 (4) of the Bank Act and the accounting requirements of the Office of the Superintendent of Financial Institutions Canada (OSFI). Under International Financial Reporting Standards (IFRS), additional disclosures are required in annual financial statements and accordingly, these unaudited interim consolidated financial statements should be read in conjunction with the audited consolidated financial statements for the year ended October 31, 2017.
The interim consolidated financial statements were authorized for issue by the Board of Directors on March 7, 2018.
2. Future Accounting Changes
CWB continues to monitor the IASB’s proposed changes to accounting standards. Although not expected to materially impact CWB’s 2018 consolidated financial statements, proposed changes may have a significant impact on future financial statements. Additional discussion on certain accounting standards that may impact CWB is included in the audited consolidated financial statements within CWB’s 2017 Annual Report.
IFRS 9 – Financial Instruments
CWB will adopt IFRS 9 effective November 1, 2018. CWB’s IFRS 9 transition activities in 2017 concentrated on assessing the classification and measurement of financial instruments, developing impairment models and building a comprehensive expected credit loss (ECL) calculation process. All material AIRB models, which are being leveraged to satisfy IFRS 9 requirements with consideration for specific differences between regulatory and accounting requirements, have been deployed into the business this quarter and related scorecards are being populated to generate risk parameters for use in the estimation of ECL. During the current year, CWB will focus on implementing and testing a comprehensive governance framework, validating and refining impairment models and the expected credit loss calculation process and performing a parallel run. CWB is on schedule to meet transition timelines and continues to monitor industry interpretations of IFRS 9 requirements and adjust implementation plans accordingly. The impact of transitioning to IFRS 9 has not yet been quantified.
3. Strategic Transactions
Equipment Loans and Leases and General Commercial Lending Assets
On January 31, 2018, CWB acquired a portfolio of equipment loans and leases and general commercial lending assets, which added $846.0 million to performing loans at fair value. No goodwill or intangible assets were included in the purchase. No allowance for credit losses was recorded on the acquisition date and loans are evaluated for impairment at each balance sheet date using the same methodology as other CWB loans.
Canadian Western Trust (CWT)
On August 16, 2017, CWB announced that CWT, a wholly-owned subsidiary of CWB, will no longer offer self-directed account services to clients holding certain securities, and CWT initiated a process to appoint successor trustees for these accounts. Pre-tax gains of $3.0 million this quarter, along with $5.7 million in the fourth quarter of 2017 related to these transactions are recorded in other non-interest income in the consolidated statements of income, reflecting sales proceeds less the carrying value of assets sold and related transaction costs. The carrying value of deposits transferred this quarter totalled $21.9 million and the market value of the related assets under administration totalled $1.7 billion, along with $71.3 million of deposits and $1.3 billion of assets under administration in the fourth quarter of 2017..
The operations and cash flows of CWT’s self-directed account services provided to clients holding certain securities cannot be clearly distinguished operationally or financially from the rest of CWB, nor do they represent a separate major line of business or geographic area of operations. As such, the transaction does not require the presentation of discontinued operations within the consolidated statements of income.
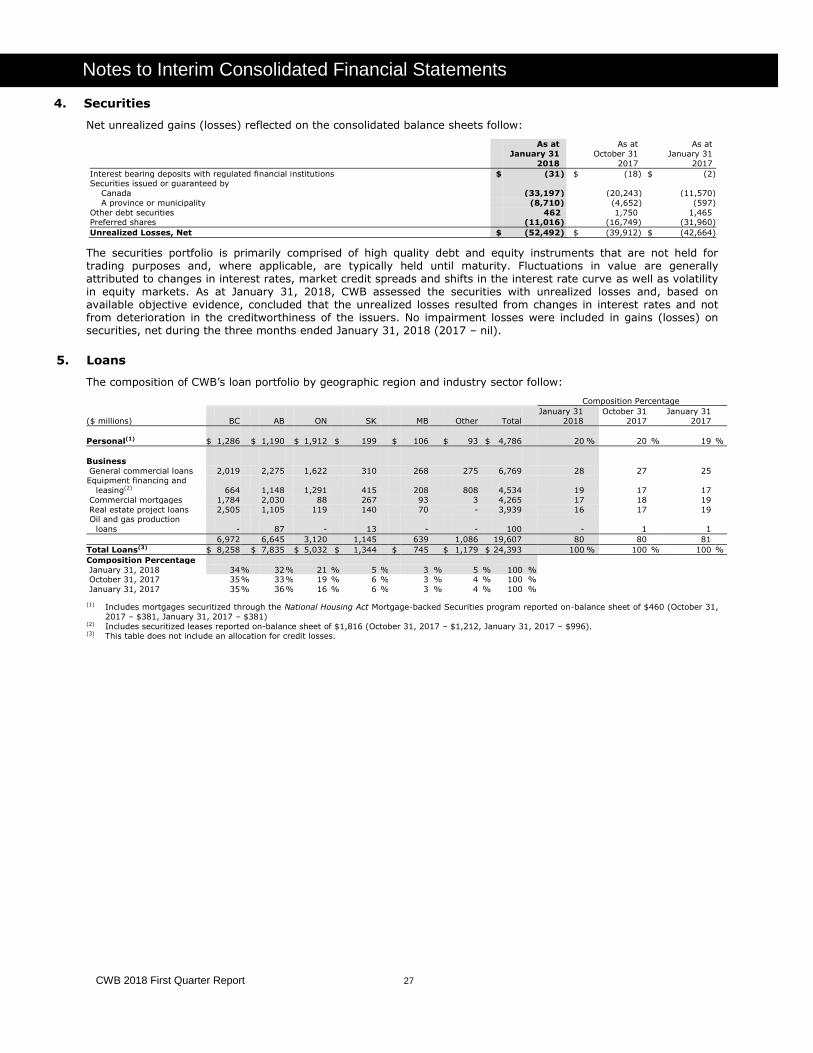
CWB 2018 First Quarter Report 27
Notes to Interim Consolidated Financial Statements
4. Securities
Net unrealized gains (losses) reflected on the consolidated balance sheets follow:
As at
January 31
2018
As at
October 31
2017
As at
January 31
2017
Interest bearing deposits with regulated financial institutions $ (31) $ (18) $ (2) Securities issued or guaranteed by
Canada (33,197) (20,243) (11,570)
A province or municipality (8,710) (4,652) (597)
Other debt securities 462 1,750 1,465 Preferred shares (11,016) (16,749) (31,960)
Unrealized Losses, Net $ (52,492) $ (39,912) $ (42,664)
The securities portfolio is primarily comprised of high quality debt and equity instruments that are not held for trading purposes and, where applicable, are typically held until maturity. Fluctuations in value are generally attributed to changes in interest rates, market credit spreads and shifts in the interest rate curve as well as volatility in equity markets. As at January 31, 2018, CWB assessed the securities with unrealized losses and, based on available objective evidence, concluded that the unrealized losses resulted from changes in interest rates and not from deterioration in the creditworthiness of the issuers. No impairment losses were included in gains (losses) on securities, net during the three months ended January 31, 2018 (2017 – nil).
5. Loans
The composition of CWB’s loan portfolio by geographic region and industry sector follow:
Composition Percentage
($ millions) BC AB ON SK
MB Other Total January 31
2018 October 31
2017 January 31
2017
Personal(1) $ 1,286 $ 1,190 $ 1,912 $ 199 $ 106 $ 93 $ 4,786 20 % 20 % 19 %
Business
General commercial loans 2,019 2,275 1,622 310 268 275 6,769 28 27 25 Equipment financing and
leasing(2) 664 1,148 1,291 415
208 808 4,534 19 17 17
Commercial mortgages 1,784 2,030 88 267 93 3 4,265 17 18 19
Real estate project loans 2,505 1,105 119 140 70 - 3,939 16 17 19 Oil and gas production
loans - 87 - 13
- - 100 - 1 1
6,972 6,645 3,120 1,145 639 1,086 19,607 80 80 81
Total Loans(3) $ 8,258 $ 7,835 $ 5,032 $ 1,344 $ 745 $ 1,179 $ 24,393 100 % 100 % 100 %
Composition Percentage
January 31, 2018 34 % 32 % 21 % 5 % 3 % 5 % 100 % October 31, 2017 35 % 33 % 19 % 6 % 3 % 4 % 100 %
January 31, 2017 35 % 36 % 16 % 6 % 3 % 4 % 100 %
(1) Includes mortgages securitized through the National Housing Act Mortgage-backed Securities program reported on-balance sheet of $460 (October 31,
2017 – $381, January 31, 2017 – $381) (2) Includes securitized leases reported on-balance sheet of $1,816 (October 31, 2017 – $1,212, January 31, 2017 – $996). (3) This table does not include an allocation for credit losses.

CWB 2018 First Quarter Report 28
Notes to Interim Consolidated Financial Statements
6. Allowance for Credit Losses
The following table shows the changes in the allowance for credit losses:
For the three months ended
January 31, 2018
For the three months ended
October 31, 2017
Specific
Allowance
Collective
Allowance for Credit
Losses Total
Specific
Allowance
Collective
Allowance for Credit
Losses Total
Balance at beginning of period $ 16,617 $ 119,298 $ 135,915 $ 22,796 $ 118,307 $ 141,103
Provision for credit losses 9,576 985 10,561 10,420 991 11,411
Write-offs (6,946) - (6,946) (17,506) - (17,506) Recoveries 2,469 - 2,469 907 - 907
Balance at End of Period $ 21,716 $ 120,283 $ 141,999 $ 16,617 $ 119,298 $ 135,915
Represented by:
Loans $ 21,716 $ 102,316 $ 124,032 $ 16,617 $ 99,712 $ 116,329
Committed but undrawn exposures and letters of credit
-
17,967
17,967
-
19,586
19,586
Total Allowance $ 21,716 $ 120,283 $ 141,999 $ 16,617 $ 119,298 $ 135,915
For the three months ended
January 31, 2017
Specific
Allowance
Collective
Allowance
for Credit
Losses Total
Balance at beginning of period $ 16,269 $ 110,943 $ 127,212 Provision for credit losses 10,587 4,405 14,992
Write-offs (13,705) - (13,705)
Recoveries 1,017 - 1,017
Balance at End of Period $ 14,168 $ 115,348 $ 129,516
Represented by: Loans $ 14,168 $ 95,107 $ 109,275
Committed but undrawn exposures and
letters of credit
-
20,241
20,241
Total Allowance $ 14,168 $ 115,348 $ 129,516
7. Impaired and Past Due Loans
Outstanding gross loans and impaired loans, net of allowance for credit losses, by loan type, follow:
As at January 31, 2018 As at October 31, 2017
Gross
Amount
Gross Impaired
Amount
Specific
Allowance
Net Impaired
Loans
Gross
Amount
Gross Impaired
Amount
Specific
Allowance
Net Impaired
Loans
Personal $ 4,786,226 $ 22,675 $ 546 $ 22,129 $ 4,725,715 $ 19,816 $ 209 $ 19,607
Business
General commercial loans 6,769,048 35,042 8,716 26,326 6,307,560 58,183 3,071 55,112 Equipment financing and leasing 4,533,746 46,781 8,464 38,317 3,892,150 50,760 10,132 40,628
Commercial mortgages(1) 4,264,485 20,454 2,370 18,084 4,266,702 16,571 385 16,186
Real estate project loans 3,939,378 12,242 1,620 10,622 4,029,810 21,391 2,020 19,371
Oil and gas production loans 100,015 - - - 123,631 1,540 800 740
Total(2) $ 24,392,898 $ 137,194 $ 21,716 115,478 $ 23,345,568 $ 168,261 $ 16,617 151,644
Collective Allowance(3) (120,283) (119,298)
Net Impaired Loans After Collective
Allowance $ (4,805) $ 32,346
As at January 31, 2017
Gross
Amount
Gross Impaired
Amount
Specific
Allowance
Net Impaired
Loans
Personal $ 4,177,551 $ 21,988 $ 202 $ 21,786
Business
General commercial loans 5,499,699 34,988 1,835 33,153 Equipment financing and leasing 3,711,113 38,803 8,531 30,272
Commercial mortgages(1) 4,125,729 14,226 - 14,226
Real estate project loans 4,195,191 12,965 2,700 10,265
Oil and gas production loans 173,441 1,469 900 569
Total(2) $ 21,882,724 $ 124,439 $ 14,168 110,271
Collective Allowance(3) (115,348)
Net Impaired Loans After Collective Allowance $ (5,077)
(1) Multi-family residential mortgages are included in real estate loans. (2) Gross impaired loans include foreclosed assets with a carrying value of $4,093 (October 31, 2017 – $1,983; January 31, 2017 - $2,419) which are held
for sale. CWB pursues timely realization on foreclosed assets and does not use the assets for its own operations. (3) The collective allowance for credit loss includes amounts related to committed by undrawn credit exposures and is not allocated by loan type.
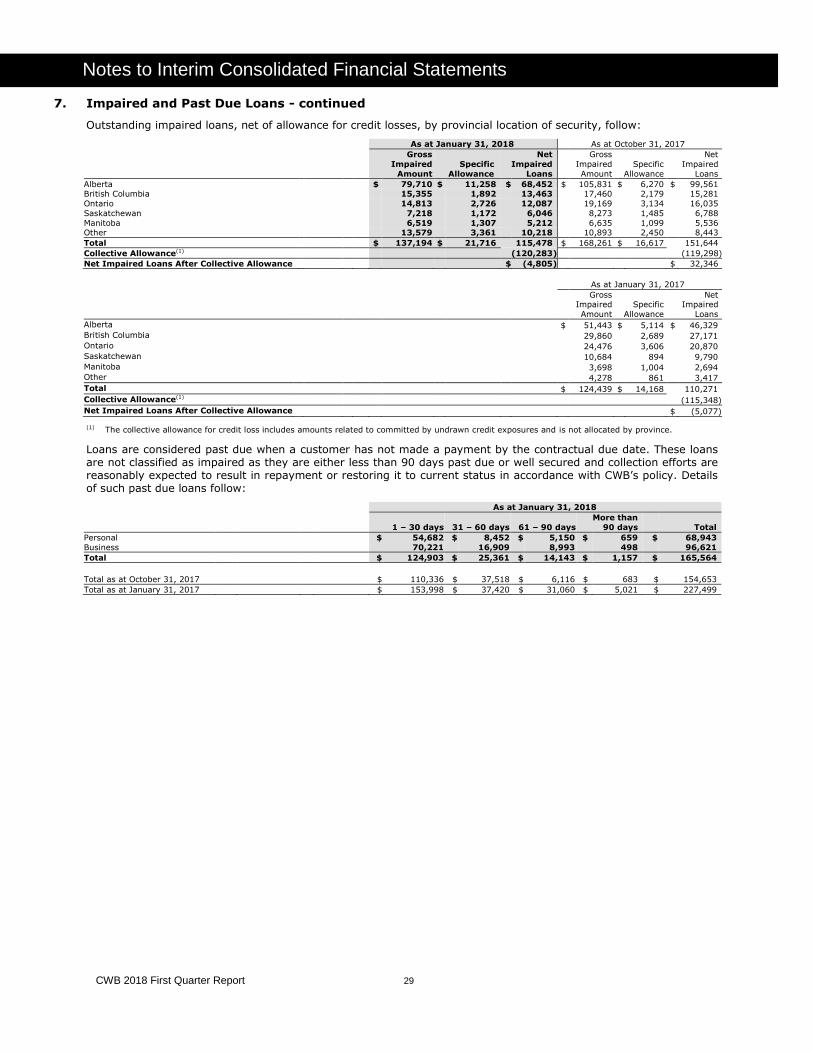
CWB 2018 First Quarter Report 29
Notes to Interim Consolidated Financial Statements
7. Impaired and Past Due Loans - continued
Outstanding impaired loans, net of allowance for credit losses, by provincial location of security, follow:
As at January 31, 2018 As at October 31, 2017
Gross
Impaired
Amount
Specific
Allowance
Net
Impaired
Loans
Gross
Impaired
Amount
Specific
Allowance
Net
Impaired
Loans
Alberta $ 79,710 $ 11,258 $ 68,452 $ 105,831 $ 6,270 $ 99,561 British Columbia 15,355 1,892 13,463 17,460 2,179 15,281
Ontario 14,813 2,726 12,087 19,169 3,134 16,035
Saskatchewan 7,218 1,172 6,046 8,273 1,485 6,788
Manitoba 6,519 1,307 5,212 6,635 1,099 5,536 Other 13,579 3,361 10,218 10,893 2,450 8,443
Total $ 137,194 $ 21,716 115,478 $ 168,261 $ 16,617 151,644
Collective Allowance(1) (120,283) (119,298)
Net Impaired Loans After Collective Allowance $ (4,805) $ 32,346
As at January 31, 2017
Gross Impaired
Amount
Specific
Allowance
Net Impaired
Loans
Alberta $ 51,443 $ 5,114 $ 46,329
British Columbia 29,860 2,689 27,171
Ontario 24,476 3,606 20,870
Saskatchewan 10,684 894 9,790
Manitoba 3,698 1,004 2,694 Other 4,278 861 3,417
Total $ 124,439 $ 14,168 110,271
Collective Allowance(1) (115,348)
Net Impaired Loans After Collective Allowance $ (5,077)
(1) The collective allowance for credit loss includes amounts related to committed by undrawn credit exposures and is not allocated by province.
Loans are considered past due when a customer has not made a payment by the contractual due date. These loans are not classified as impaired as they are either less than 90 days past due or well secured and collection efforts are reasonably expected to result in repayment or restoring it to current status in accordance with CWB’s policy. Details of such past due loans follow:
As at January 31, 2018
1 – 30 days 31 – 60 days 61 – 90 days
More than
90 days Total
Personal $ 54,682 $ 8,452 $ 5,150 $ 659 $ 68,943
Business 70,221 16,909 8,993 498 96,621
Total $ 124,903 $ 25,361 $ 14,143 $ 1,157 $ 165,564
Total as at October 31, 2017 $ 110,336 $ 37,518 $ 6,116 $ 683 $ 154,653
Total as at January 31, 2017 $ 153,998 $ 37,420 $ 31,060 $ 5,021 $ 227,499

CWB 2018 First Quarter Report 30
Notes to Interim Consolidated Financial Statements
8. Financial Assets Transferred But Not Derecognized
Securitization of leases and loans
CWB securitizes equipment financing leases and loans to third parties. These securitizations do not qualify for derecognition as CWB continues to be exposed to certain risks associated with the leases and loans; therefore, CWB has not transferred substantially all of the risk and rewards of ownership. As the leases and loans do not qualify for derecognition, the assets are not removed from the consolidated balance sheet and a securitization liability is recognized within debt securities for the cash proceeds received.
During the three months ended January 31, 2018, CWB sold securitized equipment financing leases and loans of $743,020 to third parties (2017 - $82,648) for cash proceeds of $675,127 (2017 - $74,220).
Securitization of residential mortgages
CWB securitizes fully insured residential mortgages through the creation of mortgage-backed securities under the National Housing Act Mortgage Backed Securities (NHA MBS) program sponsored by Canada Mortgage Housing Corporation (CMHC). The mortgage-backed securities are sold directly to third-party investors, sold to the Canada Housing Trust (CHT) as part of the Canada Mortgage Bond (CMB) program or are held by CWB. The CHT issues CMBs, which are government guaranteed, to third party investors and uses resulting proceeds to purchase NHA MBS from CWB and other mortgage issuers in the Canadian market.
During the three months ended January 31, 2018, CWB sold securitized residential mortgages of $59,798 to the CHT
(2017 – nil) for cash proceeds of $58,930 (2017 – nil).
The third-party sale of the mortgage pools that comprise the NHA MBS does not qualify for derecognition as CWB retains the credit and interest rate risks associated with the mortgages, which represent substantially all of the risks and rewards associated with the transferred assets. As a result, the mortgages remain on the consolidated balance sheets as personal loans and are carried at amortized cost. Cash proceeds from the third-party sale of the mortgage pools, including those sold as part of the CMB program, are recognized within debt securities.
Securities sold under repurchase agreements
CWB enters into repurchase agreements under which it sells previously recognized securities, with a simultaneous agreement to purchase them back at a specific price on a future date, but retains substantially all of the credit, price, interest rate, and foreign exchange risks and rewards associated with the assets. These securities are not derecognized and the cash proceeds from the sale are recognized within other liabilities on the balance sheet.
Details about the nature of transferred financial assets that do not qualify for derecognition and the associated liabilities follow:
As at January 31, 2018 As at October 31, 2017
Carrying
value Fair
Value Carrying
value Fair
Value
Transferred assets that do not qualify for derecognition
Securitized leases and loans $ 1,816,381 $ 1,900,215 $ 1,211,816 $ 1,248,146
Securitized residential mortgages 173,954 169,534 119,180 116,374
Securities sold under repurchase agreements - - 58,358 58,358
1,990,335 2,069,749 1,389,354 1,422,878
Associated liabilities(1) 1,833,444 1,760,515 1,284,694 1,280,758
Net position $ 156,891 $ 309,234 $ 104,660 $ 142,120
As at January 31, 2017
Carrying
value
Fair
Value
Transferred assets that do not qualify for derecognition
Securitized leases and loans 995,692 1,058,953
Securities sold under repurchase agreements $ 108,480 $ 108,480
1,104,172 1,167,433
Associated liabilities(1) 1,017,530 1,018,550
Net position $ 86,642 $ 148,883
(1) Associated liabilities consist of $1,658,576 related to securitized equipment financing leases and loans (October 31, 2017 - $1,105,180; January 31,
2017 - $909,050), $174,868 related to residential mortgages securitized through the NHA MBS program (October 31, 2017 - $121,156; January 31,
2017 - nil) and no amount related to securities sold under repurchase agreements (October 31, 2017 - $58,358; January 31, 2017 - $104,480).
In addition, CWB has securitized residential mortgages through the NHA MBS program totaling $285,561 with a fair value of $278,306 (October 31, 2017 - $262,213 with a fair value of $256,038; January 31, 2017 – $380,785 with a fair value of $355,397) that were not transferred to third parties.

CWB 2018 First Quarter Report 31
Notes to Interim Consolidated Financial Statements
9. Derivative Financial Instruments
When designated as accounting hedges by CWB, certain derivative financial instruments are designated as either a hedge of the fair value of recognized assets or liabilities or firm commitments (fair value hedges), or a hedge of highly probable future cash flows attributable to a recognized asset or liability or a forecasted transaction (cash flow hedges). Changes in fair value attributed to both the interest rate swaps designated as fair value hedges and the associated hedged risk are included in non-interest income. Any difference between the two represents hedge ineffectiveness. Changes in fair value of the effective portion of equity, interest rate swap and bond forward derivatives designated as cash flow hedges are recorded in other comprehensive income and are reclassified to net income in the same period that the hedged item affects income. On an ongoing basis, the derivatives used in hedging transactions are assessed to determine whether they are effective in offsetting changes in fair values or cash flows of the hedged items. Changes in fair value related to the ineffective portion of a designated cash flow hedge and derivatives not designated as an accounting hedge are recognized in net income.
During the three months ended January 31, 2018, CWB entered into a bond forward contract which is a contractual obligation to purchase or sell a bond at a predetermined future date. Bond forward transactions are used as hedging instruments to manage interest rate risk on commitments on loans to be pooled through the NHA MBS program and issued as CMBs. CWB enters into bond forward transactions for its own account and does not act as an intermediary in this market. The risk is limited to the change in price of the bond due to adverse change in interest rates.
The notional value outstanding and related fair value for derivative financial instruments follow:
As at January 31, 2018 As at October 31, 2017
Notional
Amount
Positive
Fair Value
Negative
Fair Value
Notional
Amount
Positive
Fair Value
Negative
Fair Value
Cash Flow Hedges
Interest rate swaps(1) $ 3,993,000 $ - $ 52,864 $ 3,553,000 $ 239 $ 31,483
Equity swaps(2) 18,222 9,625 - 18,222 7,769 - Bond forward(3) 6,000 - 16 - - -
Not Designated in a Hedging Relationship
Foreign exchange contracts(4) 160,837 4,060 1,865 170,194 2,627 3,898
Equity swaps(5) 3,449 1,779 - 4,237 1,758 -
Derivative Related Amounts $ 4,181,508 $ 15,464 $ 54,745 $ 3,745,653 $ 12,393 $ 35,381
As at January 31, 2017
Notional
Amount
Positive
Fair Value
Negative
Fair Value
Cash Flow Hedges
Interest rate swaps $ 3,683,000 $ 2,711 $ 12,574 Equity swaps 20,117 2,338 621
Not Designated in a Hedging Relationship
Foreign exchange contracts 127,290 2,942 48
Equity swaps 3,628 465 -
Derivative Related Amounts $ 3,834,035 $ 8,456 $ 13,243
(1) Interest rate swaps designated as cash flow hedges outstanding at January 31, 2018 mature between February 2018 and January 2023. (2) Equity swaps designated as cash flow hedges outstanding at January 31, 2018 mature between June 2018 and June 2020. (3) Bond forwards designated as cash flow hedges outstanding at January 31, 2018 mature in March 2018. (4) Foreign exchange contracts outstanding at January 31, 2018 mature between February and July 2018. (5) Equity swaps not designated as hedges outstanding at January 31, 2018 mature in June 2018.
At January 31, 2018, hedged cash flows are expected to occur and affect profit or loss within the next five years. There were no forecasted transactions that failed to occur during the three months ended January 31, 2018.
CWB limits its exposure to credit losses related to derivative financial instruments by dealing with creditworthy counterparties and entering into contracts that provide for the exchange of collateral between parties where the fair value of the outstanding transactions exceeds an agreed upon threshold. The impact of pledged and received collateral is discussed in Note 10.

CWB 2018 First Quarter Report 32
Notes to Interim Consolidated Financial Statements
10. Financial Instruments – Offsetting
The following table provides a summary of financial assets and liabilities which are subject to enforceable master netting agreements and similar arrangements, as well as financial collateral received to mitigate credit exposures related to these financial instruments. The agreements do not meet the netting criteria required by IAS 32 Financial Instruments: Presentation as the right to set-off is only enforceable in the event of default or occurrence of other predetermined events.
Amounts not offset in the consolidated balance sheet
As at January 31, 2018
Gross amounts
reported on the
consolidated balance sheets
Impact of
master
netting agreements
Cash collateral(1)
Securities
received as collateral(1)(2)
Net amount
Financial Assets
Derivative instruments $ 15,464 $ 4,757 $ 10,707 $ - $ -
Financial Liabilities
Derivative instruments $ 54,745 $ 4,757 $ 43,320 $ - $ 6,668
As at October 31, 2017
Financial Assets Derivative instruments $ 12,393 $ 3,106 $ 6,670 $ - $ 2,617
Financial Liabilities
Derivative instruments $ 35,381 $ 3,106 $ 30,914 $ - $ 1,361
As at January 31, 2017
Financial Assets Derivative instruments $ 8,456 $ 4,198 $ 3,733 $ - $ 525
Financial Liabilities
Derivative instruments $ 13,243 $ 4,198 $ 8,528 $ - $ 517
(1) Financial collateral is reflected at fair value. The amount of financial instruments and cash collateral disclosed is limited to the net balance sheet
exposure, and any over-collateralization is excluded from the table. (2) Collateral received in the form of securities is not recognized on the consolidated balance sheets.
11. Capital Stock
Share Capital For the three months ended
January 31, 2018 January 31, 2017
Number of
Shares Amount
Number of
Shares Amount
Preferred Shares - Series 5
Outstanding at beginning and end of period 5,000,000 $ 125,000 5,000,000 $ 125,000
Preferred Shares - Series 7 Outstanding at beginning and end of period 5,600,000 140,000 5,600,000 140,000
10,600,000 265,000 10,600,000 265,000
Common Shares
Outstanding at beginning of period 88,494,353 731,885 88,103,120 718,377
Issued on acquisition-related contingent consideration
instalment payment (Note 14) 160,293 5,750 - - Issued on exercise or exchange of options(1) 97,036 1,684 118,635 4,907
Issued under dividend reinvestment plan 20,767 814 31,458 968
Outstanding at end of period 88,772,449 740,133 88,253,213 724,252
Share Capital $ 1,005,133 $ 989,252
(1) Represents shares issued and amounts transferred from the share-based payment reserve to share capital upon cashless settlement of option
exercises.
On October 2, 2017, CWB announced the approval of OSFI and the Toronto Stock Exchange to repurchase for cancellation up to 1,767,000 common shares, representing 2% of the issued and outstanding common shares, under a normal course issuer bid (NCIB) during the 12 month period expiring September 30, 2018. No common shares have been repurchased under the NCIB.

CWB 2018 First Quarter Report 33
Notes to Interim Consolidated Financial Statements
12. Share-based Payments
Stock Options For the three months ended
January 31, 2018 January 31, 2017
Number of Options
Weighted
Average
Exercise Price
Number of Options
Weighted
Average
Exercise Price
Options
Balance at beginning of period 3,390,759 $ 31.02 5,205,794 $ 29.63
Exercised or exchanged (429,174) 30.07 (1,049,067) 26.52
Expired (2,672) 28.09 (4,092) 26.70 Forfeited - - (6,272) 39.12
Balance at End of Period 2,958,913 $ 31.16 4,146,363 $ 30.40
All exercised options are settled via cashless settlement, which provides the option holder the number of shares equivalent to the excess of the market value of the shares under option, determined at the exercise date, over the exercise price. During the three months ended January 31, 2018, option holders exercised 429,174 options (2017 – 1,049,067) in exchange for 97,036 shares (2017 – 118,635) by way of cashless settlement.
For the three months ended January 31, 2018, salary expense of $524 (2017 – $563) was recognized relating to the estimated fair value of options granted. No stock options were granted during the three months ended January 31, 2018 or January 31, 2017.
Further details relating to stock options outstanding and exercisable at January 31, 2018 follow:
Options Outstanding Options Exercisable
Range of Exercise Prices
Number of Options
Weighted
Average
Remaining
Contractual Life (years)
Weighted
Average
Exercise Price
Number of Options
Weighted
Average
Exercise Price
$23.70 to $26.13 1,263,411 3.5 $ 24.97 - $ -
$28.47 to $30.85 557,984 3.9 29.91 218,354 28.47
$37.50 to $39.42 1,137,518 1.2 38.66 1,137,518 38.66
Total 2,958,913 2.7 $ 31.16 1,355,872 $ 37.02
13. Contingent Liabilities and Commitments
In the normal course of business, CWB enters into various commitments and has contingent liabilities, which are not reflected in the consolidated balance sheets. At January 31, 2018, these items include guarantees and standby letters of credit of $461,315 (October 31, 2017 - $451,486; January 31, 2017 - $464,547). Significant contingent liabilities and commitments, including guarantees provided to third parties, are discussed in Note 21 of CWB’s audited consolidated financial statements for the year ended October 31, 2017 (see page 104 of the 2017 Annual Report).
In the ordinary course of business, CWB and its subsidiaries are party to legal proceedings. Based on current knowledge, CWB does not expect the outcome of any of these proceedings to have a material effect on the consolidated financial position or results of operations.

CWB 2018 First Quarter Report 34
Notes to Interim Consolidated Financial Statements
14. Fair Value of Financial Instruments
Financial Assets and Liabilities by Measurement Basis
The table below provides the carrying amount of financial instruments by category as defined in IAS 39 – Financial Instruments: Recognition and Measurement and by balance sheet heading. The table does not include assets and liabilities that are not considered financial instruments. The table also excludes assets and liabilities which are considered financial instruments, but are not recorded at fair value and for which the carrying amount approximates fair value.
As at January 31, 2018
Derivatives
Loans and
Receivables
and Non-trading
Liabilities
Available-
for-sale
Total Carrying
Amount
Fair Value
Fair Value
Over
(Under) Carrying
Amount
Financial Assets
Cash resources $ - $ - $ 391,809 $ 391,809 $ 391,809 $ -
Securities - - 2,669,962 2,669,962 2,669,962 - Loans(1) - 24,406,861 - 24,406,861 24,677,790 270,929
Derivative related 15,464 - - 15,464 15,464 -
Total Financial Assets $ 15,464 $ 24,406,861 $ 3,061,771 $ 27,484,096 $ 27,755,025 $ 270,929
Financial Liabilities Deposits(1) $ - $ 22,818,548 $ - $ 22,818,548 $ 22,749,600 $ (68,948)
Debt - 2,083,444 - 2,083,444 2,013,258 (70,186)
Derivative related 54,745 - - 54,745 54,745 -
Contingent consideration - 14,873 - 14,873 14,873 -
Total Financial Liabilities $ 54,745 $ 24,916,865 $ - $ 24,971,610 $ 24,832,476 $ (139,134)
As at October 31, 2017
Total Financial Assets $ 12,393 $ 23,365,410 $ 2,708,783 $ 26,086,586 $ 26,370,982 $ 284,396
Total Financial Liabilities $ 35,381 $ 23,425,840 $ 58,358 $ 23,519,579 $ 23,439,165 $ (80,414)
As at January 31, 2017
Total Financial Assets $ 8,456 $ 21,880,110 $ 2,551,712 $ 24,440,278 $ 24,764,778 $ 324,500
Total Financial Liabilities $ 13,243 $ 21,959,606 $ 108,480 $ 22,081,329 $ 22,190,786 $ 109,457
(1) Loans and deposits exclude deferred premiums, deferred revenue, allowances for credit losses and fair value hedge adjustments, which are not
financial instruments.
Fair values are based on management’s best estimates based on market conditions and pricing policies at a certain point in time. The estimates are subjective and involve particular assumptions and matters of judgment and, as such, may not be reflective of future fair values. Further information on how the fair value of financial instruments is determined is included in Note 27 of the October 31, 2017 consolidated audited financial statements (see page 109 of the 2017 Annual Report).
Fair Value Hierarchy
CWB categorizes its fair value measurements of financial instruments recorded on the consolidated balance sheets according to a three-level hierarchy. Level 1 fair value measurements reflect unadjusted quoted prices in active markets for identical assets and liabilities that CWB can access at the measurement date. Level 2 fair value measurements were estimated using observable inputs, including quoted market prices for similar assets or liabilities in active markets, quoted prices for identical or similar assets or liabilities in inactive markets, and model inputs that are either observable or can be corroborated by observable market data for substantially the full term of the assets or liabilities. Level 3 fair value measurements were determined using one or more inputs that are unobservable and significant to the fair value of the asset or liability. Unobservable inputs are used to measure fair value to the extent that observable inputs are not available at the measurement date.

CWB 2018 First Quarter Report 35
Notes to Interim Consolidated Financial Statements
14. Fair Value of Financial Instruments – continued
The following table presents CWB’s financial assets and liabilities that are either carried at fair value on the balance sheet or for which fair value is disclosed, categorized by level under the fair value hierarchy:
Fair Value Hierarchy
Valuation Technique
As at January 31, 2018 Fair Value Level 1 Level 2 Level 3
Financial Assets
Cash resources $ 391,809 $ 92,941 $ 298,868 $ -
Securities 2,669,962 307,043 2,362,919 - Loans 24,677,790 - - 24,677,790
Derivative related 15,464 - 15,464 -
Total Financial Assets $ 27,755,025 $ 399,984 $ 2,677,251 $ 24,677,790
Financial Liabilities
Deposits $ 22,749,600 $ - $ 22,749,600 $ - Debt 2,013,258 - 2,013,258 -
Derivative related 54,745 - 54,745 -
Contingent consideration(1) 14,873 - - 14,873
Total Financial Liabilities $ 24,832,476 $ - $ 24,817,603 $ 14,873
As at October 31, 2017
Financial Assets $ 26,370,982 $ 313,438 $ 2,407,738 $ 23,649,806
Financial Liabilities $ 23,439,165 $ - $ 23,406,245 $ 32,920
As at January 31, 2017
Financial Assets $ 24,764,778 $ 202,136 $ 2,358,032 $ 22,204,610
Financial Liabilities $ 22,190,786 $ - $ 22,172,300 $ 18,486
Financial instruments that are not carried on the balance sheet at fair value, but for which fair value is disclosed above, include loans, deposits and debt.
Level 3 Financial Instruments
The level 3 financial liabilities measured at fair value on the consolidated balance sheets are comprised of contingent consideration on business acquisitions and sales. The following table shows a reconciliation of the fair value measurements related to the Level 3 valued instruments:
For the three months ended
January 31
2018 2017
Acquisitions
Balance at beginning of period $ 32,420 $ 24,257
Acquisition-related fair value changes 4,953 4,361 Contingent consideration instalment payment(1) (23,000) (10,132)
14,373 18,486
Dispositions
Balance at beginning and end of period 500 -
Balance at End of Period $ 14,873 $ 18,486
(1) Under the terms of the March 2016 purchase agreement relating to the acquisition of CWB Maxium Financial, contingent payment instalments will be
made annually with determination of the total amount payable based on CWB Maxium Financial’s cumulative business performance over a 36-month
period. Up to 50% of each contingent consideration payment may be settled with CWB common shares at the vendor’s option, provided the average share price over the preceding 20 days exceeds $30.00, with the remainder to be paid in cash. CWB completed the second contingent instalment
payment in the first quarter of 2018 with cash totaling $17,250 and the issuance of 160,293 CWB common shares with a fair value of $5,750. The
2017 instalment was paid in cash.

CWB 2018 First Quarter Report 36
Notes to Interim Consolidated Financial Statements
15. Interest Rate Sensitivity
CWB’s exposure to interest rate risk as a result of a difference or gap between the maturity or repricing behavior of interest sensitive assets and liabilities, including derivative financial instruments, is discussed in Note 26 of the audited consolidated financial statements for the year ended October 31, 2017 (see page 108 of the 2017 Annual Report). The following table shows the gap position for selected time intervals.
Asset Liability Gap Positions
($ millions)
Floating
Rate
and
Within 1 Month
1 to 3 Months
3
Months
to 1 Year
Total
Within 1 Year
1 Year
to 5 Years
More than 5 Years
Non-
interest Sensitive
Total
January 31, 2018
Assets
Cash resources and securities $ 348 $ 80 $ 603 $ 1,031 $ 2,005 $ 26 $ - $ 3,062
Loans 10,757 1,184 3,999 15,940 8,055 409 (135) 24,269 Other assets - - - - - - 583 583
Derivative financial
instruments(1) 270 380 1,338 1,988 2,027 - 167 4,182
Total 11,375 1,644 5,940 18,959 12,087 435 615 32,096
Liabilities and Equity Deposits 7,603 1,576 4,796 13,975 8,843 - (6) 22,812
Other liabilities - - - - - - 533 533
Debt 50 105 447 602 1,482 - - 2,084
Equity - - - - 265 - 2,220 2,485
Derivative financial instruments(1) 4,015 - - 4,015 - - 167 4,182
Total 11,668 1,681 5,243 18,592 10,590 - 2,914 32,096
Interest Rate Sensitive Gap $ (293) $ (37) $ 697 $ 367 $ 1,497 $ 435 $ (2,299) $ -
Cumulative Gap $ (293) $ (330) $ 367 $ 367 $ 1,864 $ 2,299 $ - $ -
Cumulative Gap as a
Percentage of Total Assets (0.9)
% (1.0)
% 1.1 % 1.1
% 5.8 % 7.2
% -
% -
%
October 31, 2017 Cumulative Gap $ 351 $ 717 $ 752 $ 752 $ 1,960 $ 2,358 $ - $ -
Cumulative Gap as a
Percentage of Total Assets 1.2
% 2.4
% 2.5 % 2.5
% 6.5 % 7.8
% -
% -
%
January 31, 2017 Cumulative Gap $ (1,069) $ (283) $ 30 $ 30 $ 1,855 $ 2,085 $ - $ -
Cumulative Gap as a
Percentage of Total Assets (3.7)
% (1.0)
% 0.1 % 0.1
% 6.5 % 7.3
% -
% -
%
(1) Derivative financial instruments are included in this table at the notional amount. (2) Accrued interest is excluded in calculating interest sensitive assets and liabilities. (3) Potential prepayments of fixed rate loans and early redemption of redeemable fixed term deposits have not been estimated. Redemptions of fixed term
deposits where depositors have this option are not expected to be material. The majority of fixed rate loans, mortgages and leases are either closed or
carry prepayment penalties.
The effective weighted average interest rates of financial assets and liabilities are shown below:
January 31, 2018
Floating
Rate and
Within 1
Month
1 to 3
Months
3
Months
to 1 Year
Total
Within 1
Year
1 Year to
5 Years
More
than 5
Years
Total
Total assets 3.9 % 3.2 % 3.5 % 3.7 % 3.5 % 5.2 % 3.7 %
Total liabilities 1.4 1.9 1.9 1.6 2.2 - 2.2
Interest rate sensitive gap 2.5 % 1.3 % 1.6 % 2.1 % 1.3 % 5.2 % 1.5 %
October 31, 2017
Total assets 3.6 % 3.5 % 3.4 % 3.5 % 3.5 % 4.8 % 3.5 %
Total liabilities 0.7 1.7 1.8 1.1 2.2 - 2.0
Interest rate sensitive gap 2.9 % 1.8 % 1.6 % 2.4 % 1.3 % 4.8 % 1.5 %
January 31, 2017
Total assets 3.4 % 2.7 % 3.6 % 3.4 % 3.2 % 4.6 % 3.3 % Total liabilities 0.9 2.0 1.8 1.2 2.2 - 2.0
Interest rate sensitive gap 2.5 % 0.7 % 1.8 % 2.2 % 1.0 % 4.6 % 1.3 %
Based on the current interest rate gap position, it is estimated that a one-percentage point increase in all interest rates would increase net interest income by approximately $1,427 (October 31, 2017 – $8,324; January 31, 2017 – $7,230) and decrease other comprehensive income by $89,735 (October 31, 2017 - $77,293; January 31, 2017 – $80,308) net of tax, respectively over the following twelve months. A one-percentage point decrease in all interest rates would decrease net interest income by approximately $6,115 (October 31, 2017 –$13,226; January 31, 2017 –$4,016) and increase other comprehensive income by $88,099 (October 31, 2017 - $76,173; January 31, 2017 - $81,848) net of tax.
Notes to Interim Consolidated Financial Statements

CWB 2018 First Quarter Report 37
Notes to Interim Consolidated Financial Statements
16. Capital Management
Capital for Canadian financial institutions is managed and reported in accordance with a capital management framework specified by OSFI commonly called Basel III using the Standardized approach for calculating risk-weighted assets. Additional information about CWB’s capital management practices is provided in Note 30 to the fiscal 2017 audited consolidated financial statements within the 2017 Annual Report and in the Capital Management section in the first quarter of 2018 Management’s Discussion and Analysis.
Capital funds are managed in accordance with policies and plans that are regularly reviewed and approved by the Board of Directors and take into account forecasted capital needs and markets. The goal is to maintain adequate regulatory capital to be considered well capitalized, protect customer deposits and provide capacity for internally generated growth and strategic opportunities that do not otherwise require accessing the public capital markets, all while providing a satisfactory return for shareholders.
Capital Structure and Regulatory Ratios
As at
January 31
2018
As at
October 31
2017
As at
January 31
2017
Regulatory capital, net of deductions
Common equity Tier 1 $ 2,043,260 $ 2,009,530 $ 1,896,565 Tier 1 2,308,450 2,274,727 2,161,636
Total 2,678,778 2,644,071 2,601,999
Capital ratios
Common equity Tier 1 9.4 % 9.5 % 9.5 %
Tier 1 10.6 10.8 10.8 Total 12.3 12.5 13.0
Leverage ratio 8.0 8.3 8.4
During the three months ended January 31, 2018, CWB complied with all internal and external capital requirements.

CWB 2018 First Quarter Report 38
Shareholder Information S Discuss
Head Office
CWB Financial Group Suite 3000, Canadian Western Bank Place 10303 Jasper Avenue Edmonton, AB T5J 3X6 Telephone: (780) 423-8888 Fax: (780) 423-8897 cwb.com
Contact Information
National Leasing Group Inc. 1525 Buffalo Place Winnipeg, MB R3T 1L9 Toll-free: 1-800-665-1326 Toll-free fax: 1-866-408-0729
nationalleasing.com
CWB Maxium Financial 30 Vogell Road, Suite 1 Richmond Hill, ON L4B 3K6 Toll-free: 1-800-379-5888 Fax: (905) 780-3273 maxium.net CWB Optimum Mortgage Suite 1010, Canadian Western Bank Place 10303 Jasper Avenue Edmonton, AB T5J 3X6 Toll-free: 1-866-441-3775 Fax: 1-866-477-8897 optimummortgage.ca Canadian Western Trust Company Suite 300, 750 Cambie Street Vancouver, BC V6B 0A2 Toll-free: 1-800-663-1124 Fax: (604) 669-6069 cwt.ca CWB Wealth Management Ltd. Suite 1250, Canadian Western Bank Place 10303 Jasper Avenue Edmonton, AB T5J 3N6
Telephone: (855) 292-9655 cwbwealth.com
McLean & Partners Wealth Management Ltd.
801 10th Avenue SW Calgary, AB T2R 0B4 Telephone: (403) 234-0005 Fax: (403) 234-0606 mcleanpartners.com Stock Exchange Listings The Toronto Stock Exchange Common Shares: CWB Series 5 Preferred Shares: CWB.PR.B Series 7 Preferred Shares: CWB.PR.C
Transfer Agent and Registrar Computershare 100 University Avenue, 8th Floor Toronto, ON M5J 2Y1 Telephone: (416) 263-9200 Fax: 1-888-453-0330 Website: www.computershare.com
Eligible Dividends Designation
CWB designates all dividends for both common and preferred shares paid to Canadian residents as “eligible dividends”, as defined in the Income Tax Act (Canada), unless otherwise noted.
Dividend Reinvestment Plan
CWB’s dividend reinvestment plan allows common and preferred shareholders to purchase additional common shares by reinvesting their cash dividend without incurring brokerage and commission fees. For information about participation in the plan, please contact the Transfer Agent and Registrar or visit cwb.com.
Investor Relations
CWB Financial Group Telephone: (780) 969-8337 Toll-free: 1-800-836-1886 Fax: (780) 969-8326 Email: [email protected]
Online Investor Information
Additional investor information including supplemental financial information and corporate presentations are available on CWB’s website at cwb.com.
Quarterly Conference Call and Webcast
CWB’s quarterly conference call and live audio webcast will take place on March 8, 2018 at 2:00 p.m. ET. The webcast will be archived on CWB’s website at cwb.com for sixty days. A replay of the conference call will be available until March 15, 2018, by dialing (855) 859-2056 and entering
passcode 6166089.