Newmarket Gold Investor Presentation May Metals Investment Forum
Upload
adnet-communicationsCategory
view
408download
4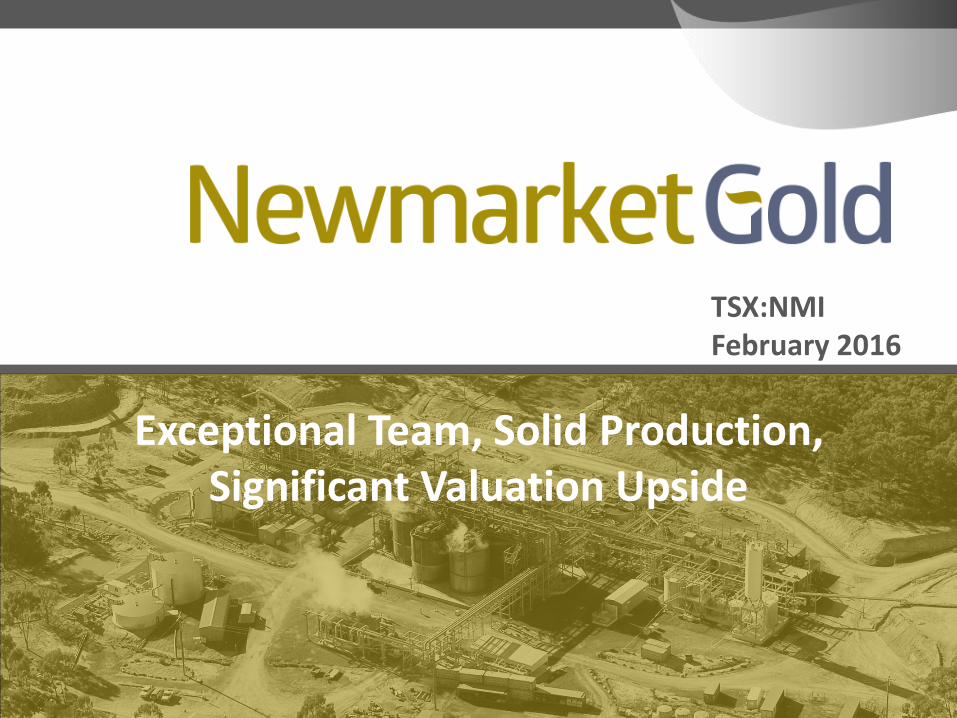
TSX:NMIFebruary 2016
Exceptional Team, Solid Production,Significant Valuation Upside
2TSX:NMI
Forward-looking StatementsCertain information set forth in this presentation contains “forward-looking statements”, and “forward-lookinginformation under applicable securities laws. Except for statements of historical fact, certain information containedherein constitutes forward-looking statements, which include the Company’s expectations about its business andoperations, and are based on the Company’s current internal expectations, estimates, projections, assumptions andbeliefs, which may prove to be incorrect. Some of the forward-looking statements may be identified by words such as“will”, “expects”, “anticipates”, “believes”, “projects”, “plans”, and similar expressions. These statements are notguarantees of future performance or outcomes and undue reliance should not be placed on them. Forward-lookingstatements are based on the opinions and estimates of management as of the date such statements are made and theyare subject to known and unknown risks, uncertainties and other factors that may cause the actual results, level ofactivity, performance or achievements of the Company to be materially different from those expressed or implied bysuch forward-looking statements or forward-looking information. Although management of the Company hasattempted to identify important factors that could cause actual results to differ materially from those contained inforward-looking statements or forward-looking information, there may be other factors that cause results not to be asanticipated, estimated or intended. There can be no assurance that such statements will prove to be accurate, as actualresults and future events could differ materially from those anticipated in such statements. Accordingly, readers shouldnot place undue reliance on forward-looking statements and forward-looking information. The Company does notundertake to update any forward-looking statements or forward-looking information that are included in thispresentation or incorporated by reference herein, except in accordance with applicable securities laws.
3TSX:NMI
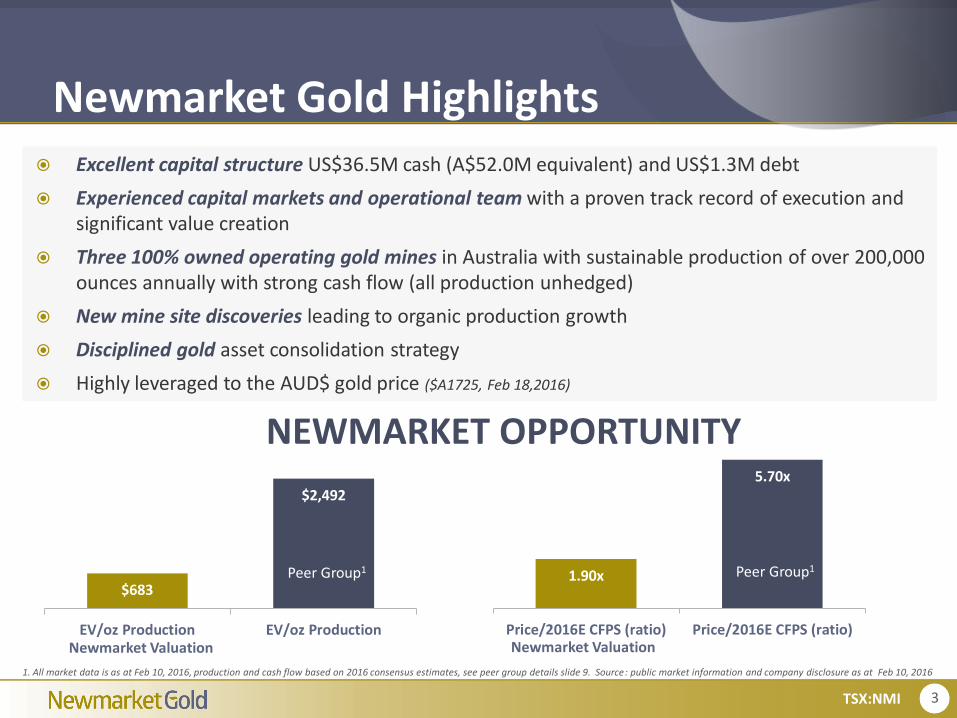
Newmarket Gold Highlights Excellent capital structure US$36.5M cash (A$52.0M equivalent) and US$1.3M debt
Experienced capital markets and operational team with a proven track record of execution and significant value creation
Three 100% owned operating gold mines in Australia with sustainable production of over 200,000 ounces annually with strong cash flow (all production unhedged)
New mine site discoveries leading to organic production growth
Disciplined gold asset consolidation strategy
Highly leveraged to the AUD$ gold price ($A1725, Feb 18,2016)
NEWMARKET OPPORTUNITY
1. All market data is as at Feb 10, 2016, production and cash flow based on 2016 consensus estimates, see peer group details slide 9. Source: public market information and company disclosure as at Feb 10, 2016
$683
$2,492
EV/oz Production EV/oz Production
1.90x
5.70x
Price/2016E CFPS (ratio) Price/2016E CFPS (ratio)
Peer Group1Peer Group1
Newmarket Valuation Newmarket Valuation
4TSX:NMI
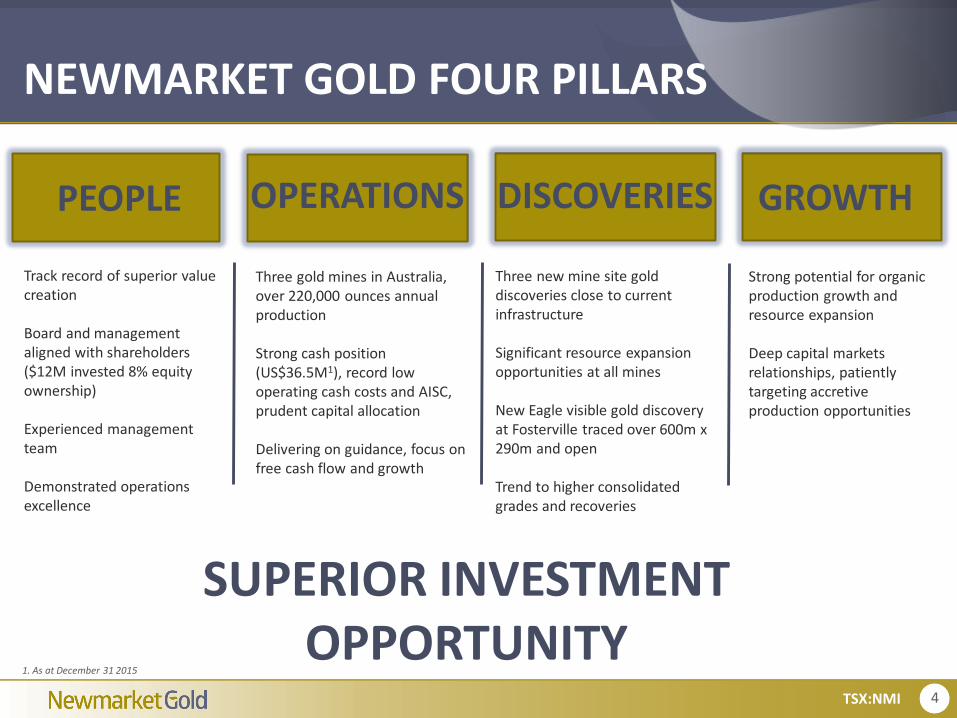
NEWMARKET GOLD FOUR PILLARS
SUPERIOR INVESTMENT OPPORTUNITY
PEOPLE
Track record of superior value creation
Board and management aligned with shareholders ($12M invested 8% equity ownership)
Experienced management team
Demonstrated operations excellence
OPERATIONS
Three gold mines in Australia, over 220,000 ounces annual production
Strong cash position (US$36.5M1), record low operating cash costs and AISC, prudent capital allocation
Delivering on guidance, focus on free cash flow and growth
DISCOVERIES
Three new mine site gold discoveries close to current infrastructure
Significant resource expansion opportunities at all mines
New Eagle visible gold discovery at Fosterville traced over 600m x 290m and open
Trend to higher consolidated grades and recoveries
GROWTH
Strong potential for organic production growth and resource expansion
Deep capital markets relationships, patiently targeting accretive production opportunities
1. As at December 31 2015
5TSX:NMI
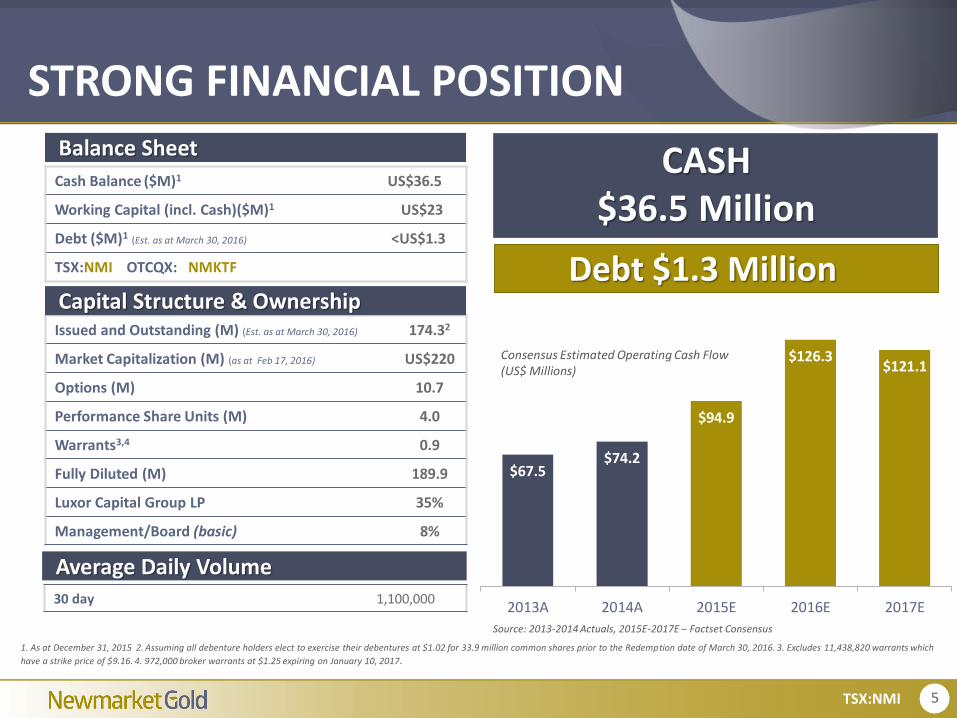
STRONG FINANCIAL POSITION
Cash Balance ($M)1 US$36.5
Working Capital (incl. Cash)($M)1 US$23
Debt ($M)1 (Est. as at March 30, 2016) <US$1.3
TSX:NMI OTCQX: NMKTF
1. As at December 31, 2015 2. Assuming all debenture holders elect to exercise their debentures at $1.02 for 33.9 million common shares prior to the Redemption date of March 30, 2016. 3. Excludes 11,438,820 warrants which
have a strike price of $9.16. 4. 972,000 broker warrants at $1.25 expiring on January 10, 2017.
Balance Sheet
Issued and Outstanding (M) (Est. as at March 30, 2016) 174.32
Market Capitalization (M) (as at Feb 17, 2016) US$220
Options (M) 10.7
Performance Share Units (M) 4.0
Warrants3,4 0.9
Fully Diluted (M) 189.9
Luxor Capital Group LP 35%
Management/Board (basic) 8%
Capital Structure & Ownership
Average Daily Volume30 day 1,100,000
CASH$36.5 Million
$67.5$74.2
$94.9
$126.3$121.1
2013A 2014A 2015E 2016E 2017E
Source: 2013-2014 Actuals, 2015E-2017E – Factset Consensus
Consensus Estimated Operating Cash Flow (US$ Millions)
Debt $1.3 Million
6TSX:NMI
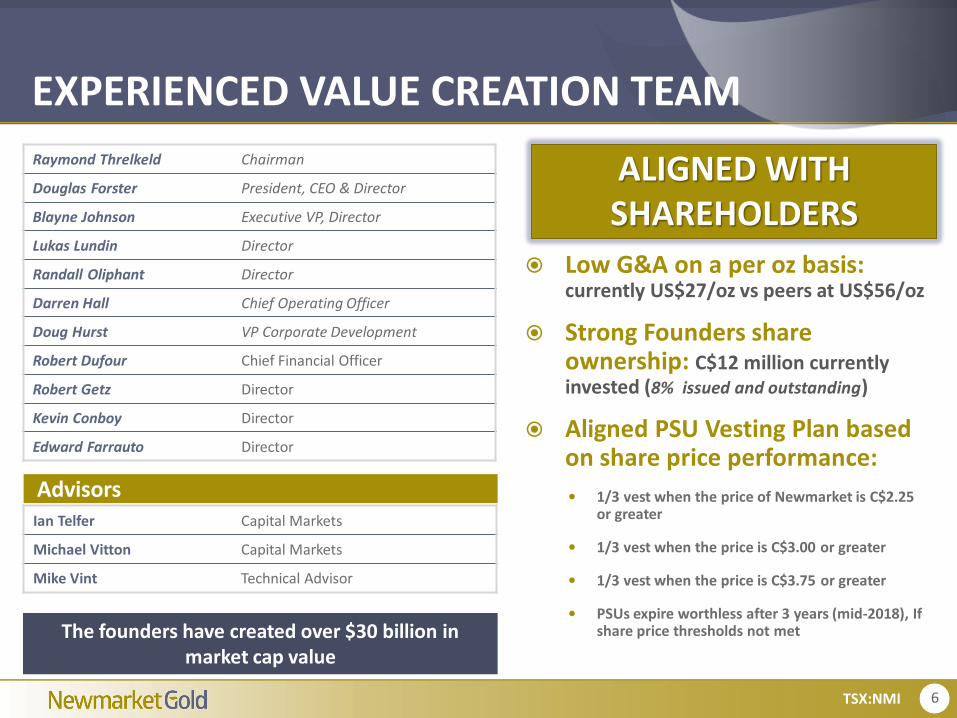
Low G&A on a per oz basis: currently US$27/oz vs peers at US$56/oz
Strong Founders share ownership: C$12 million currently invested (8% issued and outstanding)
Aligned PSU Vesting Plan based on share price performance:
1/3 vest when the price of Newmarket is C$2.25 or greater
1/3 vest when the price is C$3.00 or greater
1/3 vest when the price is C$3.75 or greater
PSUs expire worthless after 3 years (mid-2018), If share price thresholds not met
EXPERIENCED VALUE CREATION TEAM
Raymond Threlkeld Chairman
Douglas Forster President, CEO & Director
Blayne Johnson Executive VP, Director
Lukas Lundin Director
Randall Oliphant Director
Darren Hall Chief Operating Officer
Doug Hurst VP Corporate Development
Robert Dufour Chief Financial Officer
Robert Getz Director
Kevin Conboy Director
Edward Farrauto Director
AdvisorsIan Telfer Capital Markets
Michael Vitton Capital Markets
Mike Vint Technical Advisor
The founders have created over $30 billion in market cap value
ALIGNED WITH SHAREHOLDERS
7TSX:NMI
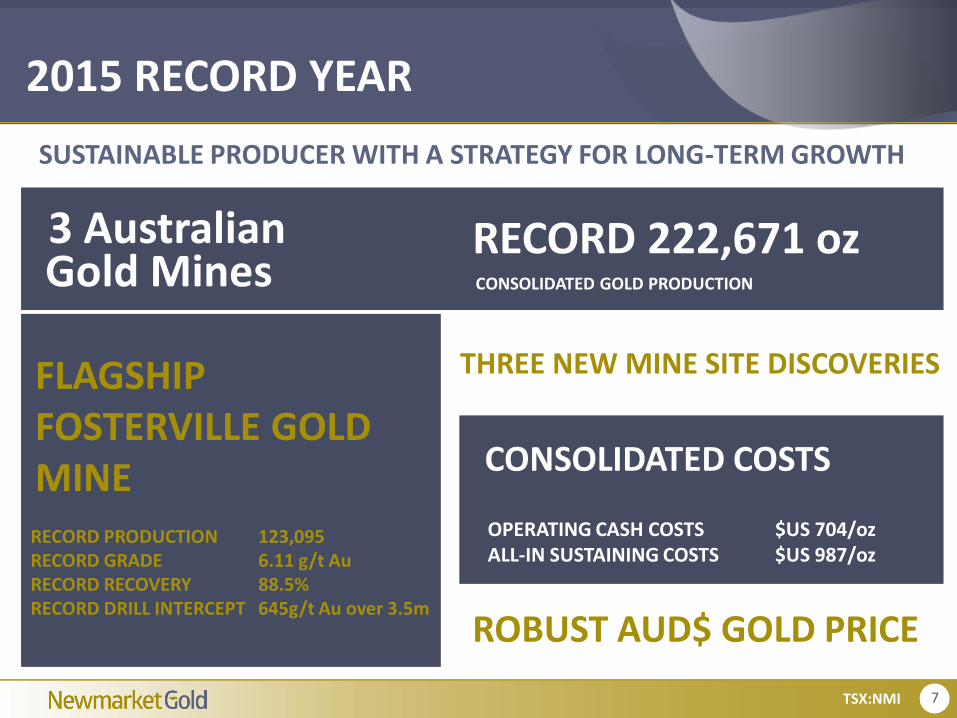
SUSTAINABLE PRODUCER WITH A STRATEGY FOR LONG-TERM GROWTH
RECORD 222,671 oz
FLAGSHIP FOSTERVILLE GOLD MINE
3 AustralianCONSOLIDATED GOLD PRODUCTION
2015 RECORD YEAR
RECORD PRODUCTION 123,095RECORD GRADE 6.11 g/t AuRECORD RECOVERY 88.5%RECORD DRILL INTERCEPT 645g/t Au over 3.5m
CONSOLIDATED COSTS
OPERATING CASH COSTS $US 704/ozALL-IN SUSTAINING COSTS $US 987/oz
Gold Mines
THREE NEW MINE SITE DISCOVERIES
ROBUST AUD$ GOLD PRICE
8TSX:NMI
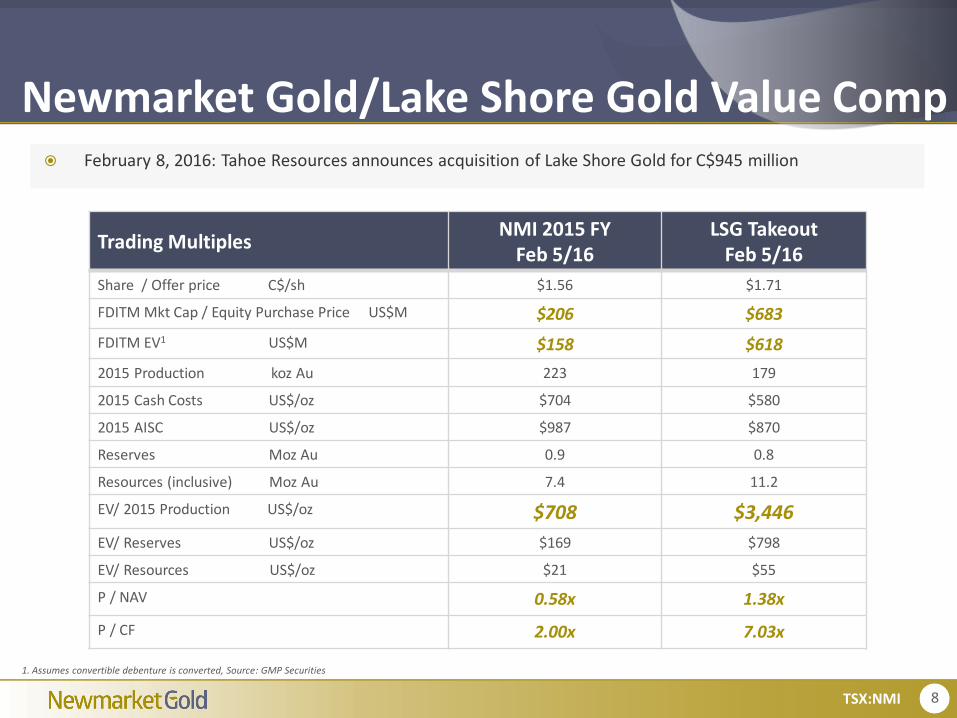
Newmarket Gold/Lake Shore Gold Value Comp
Trading MultiplesNMI 2015 FY
Feb 5/16LSG Takeout
Feb 5/16
Share / Offer price C$/sh $1.56 $1.71
FDITM Mkt Cap / Equity Purchase Price US$M $206 $683
FDITM EV1 US$M $158 $618
2015 Production koz Au 223 179
2015 Cash Costs US$/oz $704 $580
2015 AISC US$/oz $987 $870
Reserves Moz Au 0.9 0.8
Resources (inclusive) Moz Au 7.4 11.2
EV/ 2015 Production US$/oz $708 $3,446
EV/ Reserves US$/oz $169 $798
EV/ Resources US$/oz $21 $55
P / NAV 0.58x 1.38x
P / CF 2.00x 7.03x
1. Assumes convertible debenture is converted, Source: GMP Securities
February 8, 2016: Tahoe Resources announces acquisition of Lake Shore Gold for C$945 million
9TSX:NMI
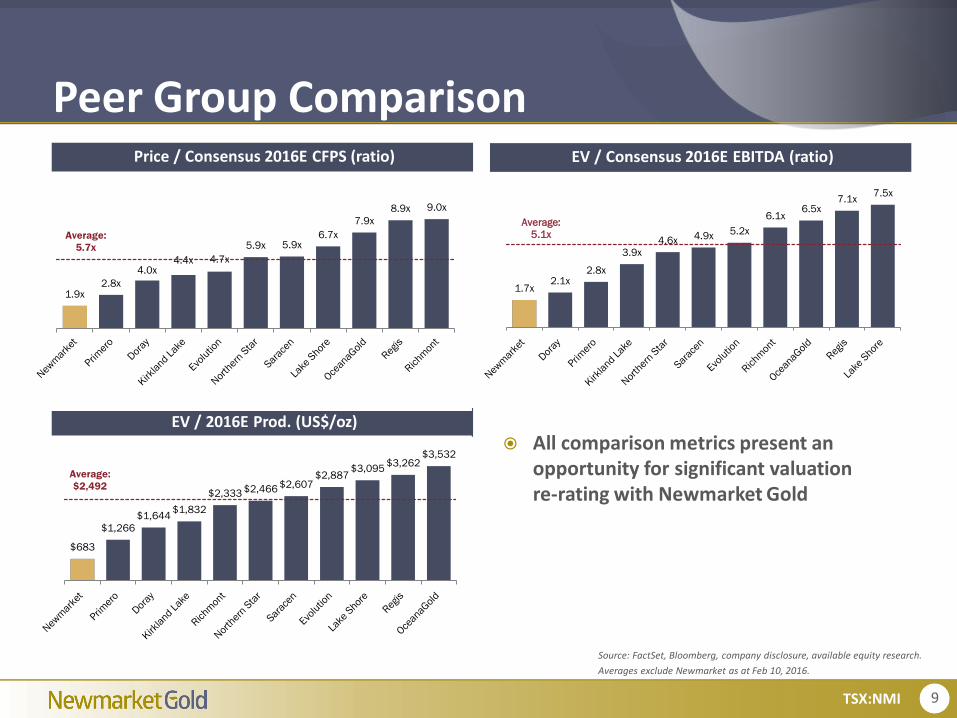
Source: FactSet, Bloomberg, company disclosure, available equity research.
Averages exclude Newmarket as at Feb 10, 2016.
Peer Group Comparison
All comparison metrics present an opportunity for significant valuation re-rating with Newmarket Gold
EV / 2016E Prod. (US$/oz)
Price / Consensus 2016E CFPS (ratio) EV / Consensus 2016E EBITDA (ratio)
$683
$1,266
$1,644 $1,832
$2,333 $2,466 $2,607 $2,887
$3,095 $3,262
$3,532
Average:
$2,492
1.9x 2.8x
4.0x 4.4x 4.7x
5.9x 5.9x 6.7x
7.9x
8.9x 9.0x
Average:
5.7x
1.7x 2.1x
2.8x
3.9x
4.6x 4.9x 5.2x
6.1x 6.5x
7.1x 7.5x
Average:
5.1x

10TSX:NMI
PRODUCING IN A TOP MINING JURISDICTIONCOSMO/UNION REEF
Location Northern TerritoryOwnership 100%Metals GoldMining UndergroundCapacity 2.0Mtpa Yrs in Production 2.5 Prod. Guidance 60k – 65k ouncesDiscovery Western Lodes Discovery
MAUD CREEK GOLD PROJECT
Location Northern TerritoryOwnership 100%Metals GoldMining Open Pit + UndergroundStage PEAM&I Resources 871,000 ozs @ 3.5 g/t1
1. See slide 25 for details on Mineral Resource and Reserve details 2. see Non-IFRS Disclosure p.32
FOSTERVILLE GOLD MINE
Location Bendigo, VictoriaOwnership 100% (2% Royalty)Metals GoldMining UndergroundCapacity 850Ktpa Yrs in Production +10 Prod. Guidance 110k – 120k ouncesDiscovery Eagle Fault Zone
STAWELL GOLD MINE
Location Stawell, VictoriaOwnership 100% (1% Royalty)Metals GoldMining UndergroundCapacity 1.0Mtpa Yrs in Production +30Prod. Guidance ~35k ouncesDiscovery Aurora B Gold Zone
2016E CONSOLIDATED GUIDANCE
Production: 205,000 - 220,000 ouncesOperating Cash Cost2: US$650 - US$725 per ounceAll-in sustaining costs2: US$950 - US$1,025 per ounce
AUSTRALIA
BIG HILL GOLD PROJECT
Location VictoriaOwnership 100%Metals GoldMining Open PitStage PermittingM&I Resources 160,000 ozs @ 1.68 g/t1
Producing Mine
Development Project
Mine site Discovery

11TSX:NMI
$1,000
$1,200
$1,400
$1,600
$1,800
$2,000
Feb 2011 Feb 2012 Feb 2013 Feb 2014 Feb 2015 Feb 2016
Gold
Pri
ce (
$/o
z)
Gold (US$/oz) (LHS) Gold (A$/oz) (LHS)
Source: Capital IQ as of February 11, 2016
AUSTRALIAN ADVANTAGE
A$1725/oz(Feb 18, 2016)

12TSX:NMI
2015 Record Production 123,095 oz
2015 Record Grade 6.11 g/t Au
Q3/15 Record Production 32,793
Q3/15 Record Grade 6.42g/t Au
Q3/15 Record Recoveries 89.7%
Q3/15 Operating Cash Costs per ounce $481
Q3/15 All-In Sustaining Costs per ounce $7971
Flagship Fosterville Mine – Low Cost Producer
U.S. Dollars unless stated otherwise 1. excludes corporate G&A
Eagle Fault discovery traced 600m along strike by 290m vertical height, open for expansion in all directions
Highlight drill intercepts include; 161g/t gold over 4.9m & 645g/t gold over 3.5m
Good continuity and mill reconciliation on Eagle fault ore
DISCOVERY

13TSX:NMI
Fosterville Mine (Longitudinal Projection)
Harrier Drill Drive
14TSX:NMI
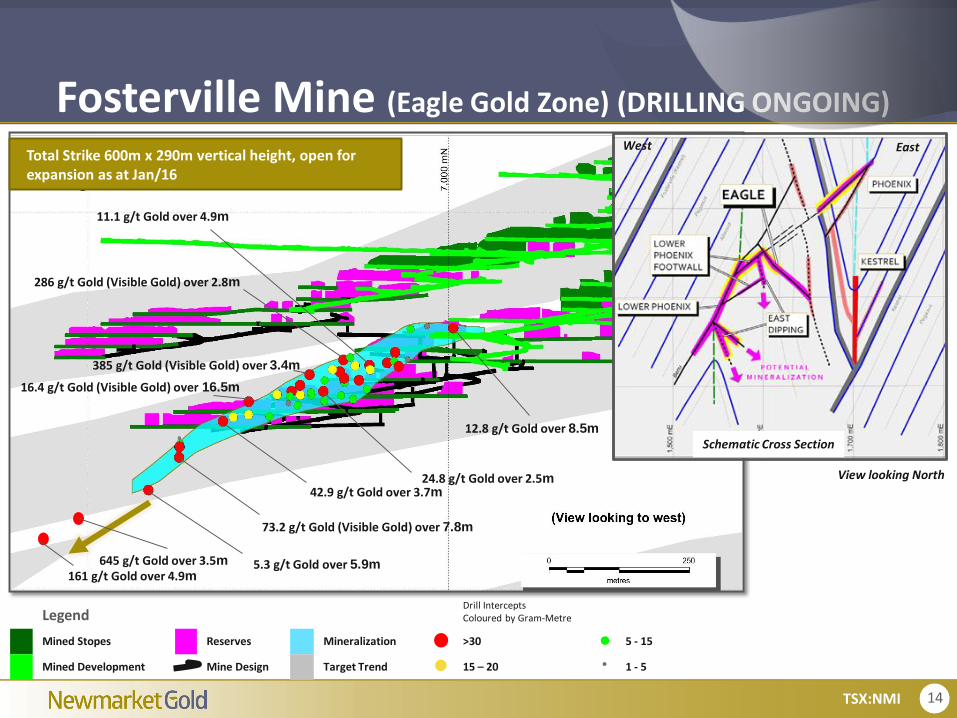
LegendDrill InterceptsColoured by Gram-Metre
Mined Stopes Reserves Mineralization >30 5 - 15
Mined Development Mine Design Target Trend 15 – 20 1 - 5
12.8 g/t Gold over 8.5m
24.8 g/t Gold over 2.5m
16.4 g/t Gold (Visible Gold) over 16.5m
73.2 g/t Gold (Visible Gold) over 7.8m
385 g/t Gold (Visible Gold) over 3.4m
Fosterville Mine (Eagle Gold Zone) (DRILLING ONGOING)
View looking North
West East
5.3 g/t Gold over 5.9m
Schematic Cross Section
286 g/t Gold (Visible Gold) over 2.8m
11.1 g/t Gold over 4.9m
42.9 g/t Gold over 3.7m
161 g/t Gold over 4.9m645 g/t Gold over 3.5m
Total Strike 600m x 290m vertical height, open for expansion as at Jan/16
15TSX:NMI
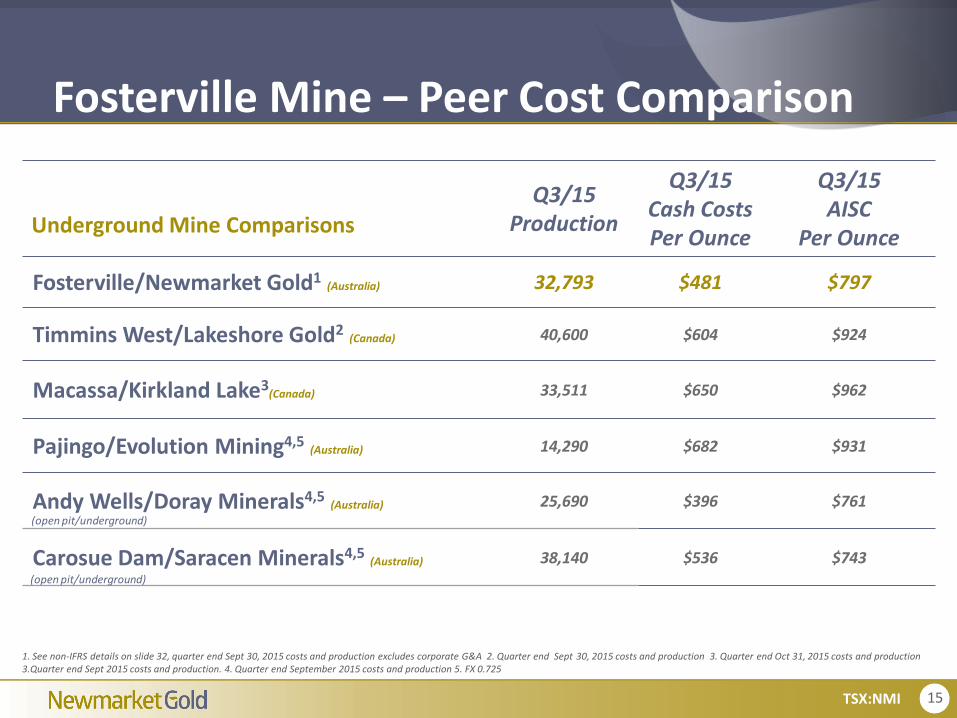
Fosterville Mine – Peer Cost Comparison
Q3/15Production
Q3/15Cash CostsPer Ounce
Q3/15 AISC
Per Ounce
Fosterville/Newmarket Gold1(Australia) 32,793 $481 $797
Timmins West/Lakeshore Gold2(Canada) 40,600 $604 $924
Macassa/Kirkland Lake3(Canada) 33,511 $650 $962
Pajingo/Evolution Mining4,5(Australia) 14,290 $682 $931
Andy Wells/Doray Minerals4,5(Australia) 25,690 $396 $761
Carosue Dam/Saracen Minerals4,5(Australia) 38,140 $536 $743
1. See non-IFRS details on slide 32, quarter end Sept 30, 2015 costs and production excludes corporate G&A 2. Quarter end Sept 30, 2015 costs and production 3. Quarter end Oct 31, 2015 costs and production 3.Quarter end Sept 2015 costs and production. 4. Quarter end September 2015 costs and production 5. FX 0.725
(open pit/underground)
(open pit/underground)
Underground Mine Comparisons
16TSX:NMI
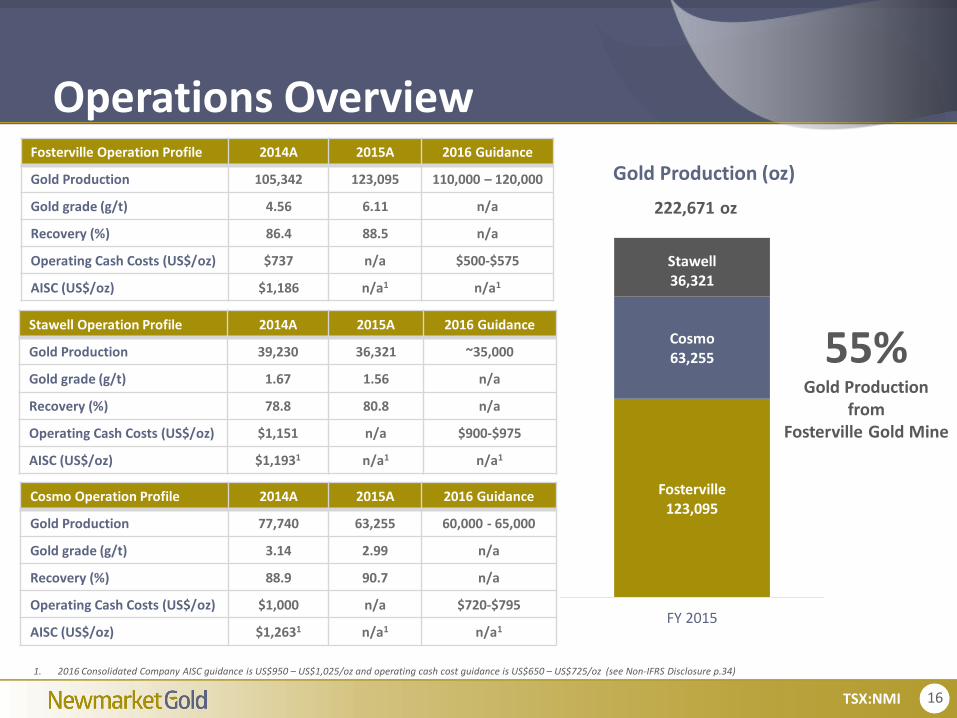
Fosterville123,095
Cosmo63,255
Stawell36,321
FY 2015
Gold Production (oz)
222,671 oz
Fosterville Operation Profile 2014A 2015A 2016 Guidance
Gold Production 105,342 123,095 110,000 – 120,000
Gold grade (g/t) 4.56 6.11 n/a
Recovery (%) 86.4 88.5 n/a
Operating Cash Costs (US$/oz) $737 n/a $500-$575
AISC (US$/oz) $1,186 n/a1 n/a1
Operations Overview
1. 2016 Consolidated Company AISC guidance is US$950 – US$1,025/oz and operating cash cost guidance is US$650 – US$725/oz (see Non-IFRS Disclosure p.34)
Cosmo Operation Profile 2014A 2015A 2016 Guidance
Gold Production 77,740 63,255 60,000 - 65,000
Gold grade (g/t) 3.14 2.99 n/a
Recovery (%) 88.9 90.7 n/a
Operating Cash Costs (US$/oz) $1,000 n/a $720-$795
AISC (US$/oz) $1,2631 n/a1 n/a1
Stawell Operation Profile 2014A 2015A 2016 Guidance
Gold Production 39,230 36,321 ~35,000
Gold grade (g/t) 1.67 1.56 n/a
Recovery (%) 78.8 80.8 n/a
Operating Cash Costs (US$/oz) $1,151 n/a $900-$975
AISC (US$/oz) $1,1931 n/a1 n/a1
55% Gold Production
from Fosterville Gold Mine
17TSX:NMI
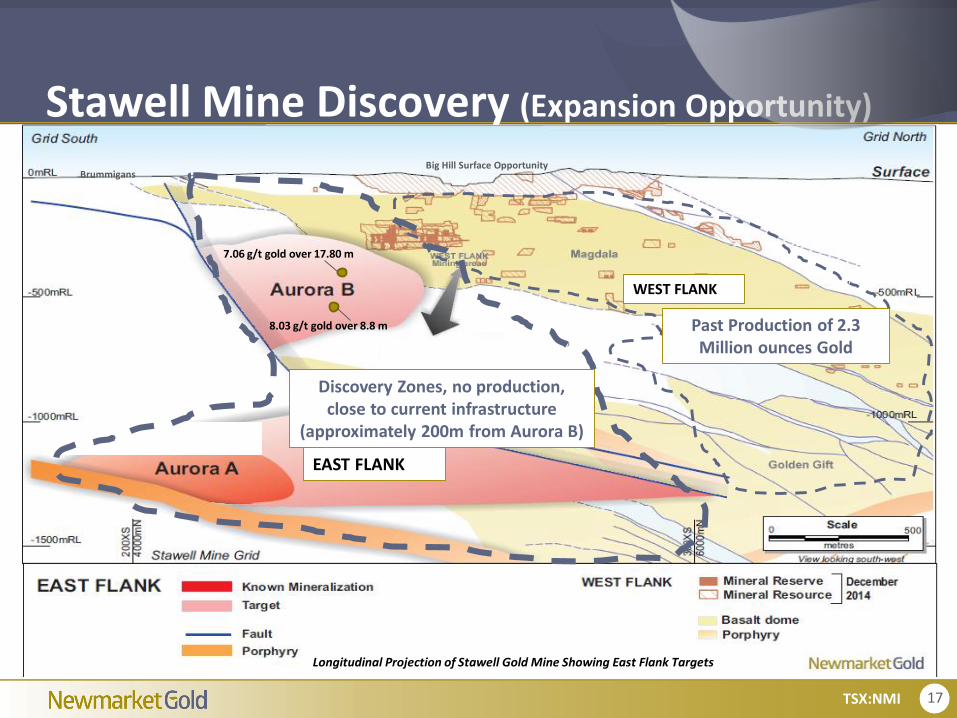
Stawell Mine Discovery (Expansion Opportunity)
Longitudinal Projection of Stawell Gold Mine Showing East Flank Targets
BrummigansBig Hill Surface Opportunity
WEST FLANK
Past Production of 2.3 Million ounces Gold
Past old
8.03 g/t gold over 8.8 m
EAST FLANK
7.06 g/t gold over 17.80 m
Discovery Zones, no production, close to current infrastructure
(approximately 200m from Aurora B)
18TSX:NMI
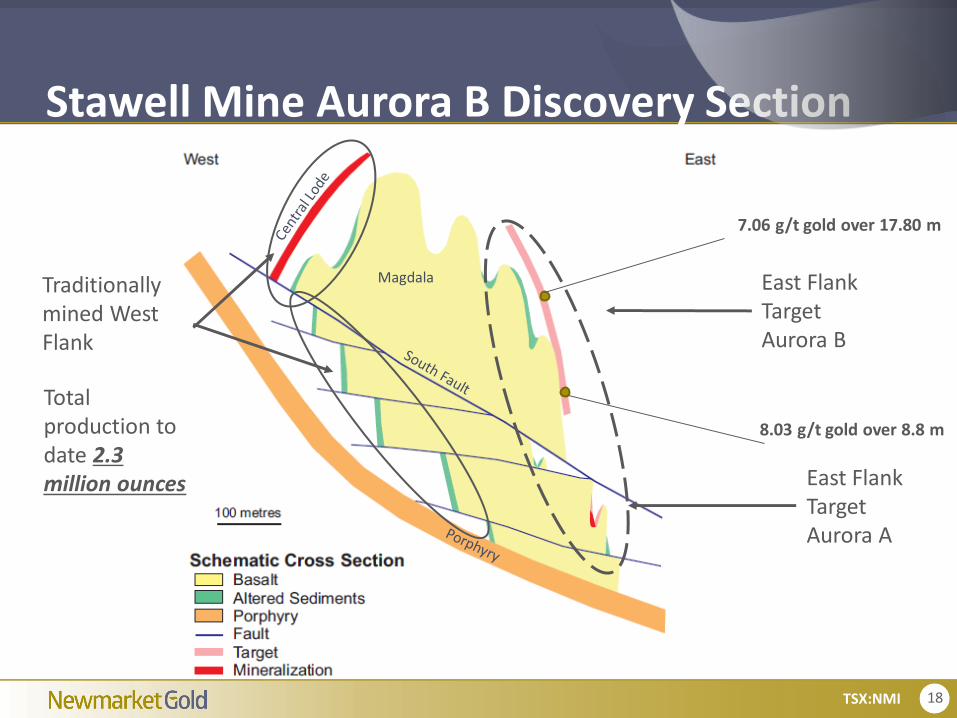
Stawell Mine Aurora B Discovery Section
East Flank TargetAurora B
East Flank TargetAurora A
Traditionally mined West Flank
Total production to date 2.3 million ounces
8.03 g/t gold over 8.8 m
7.06 g/t gold over 17.80 m
Magdala
19TSX:NMI
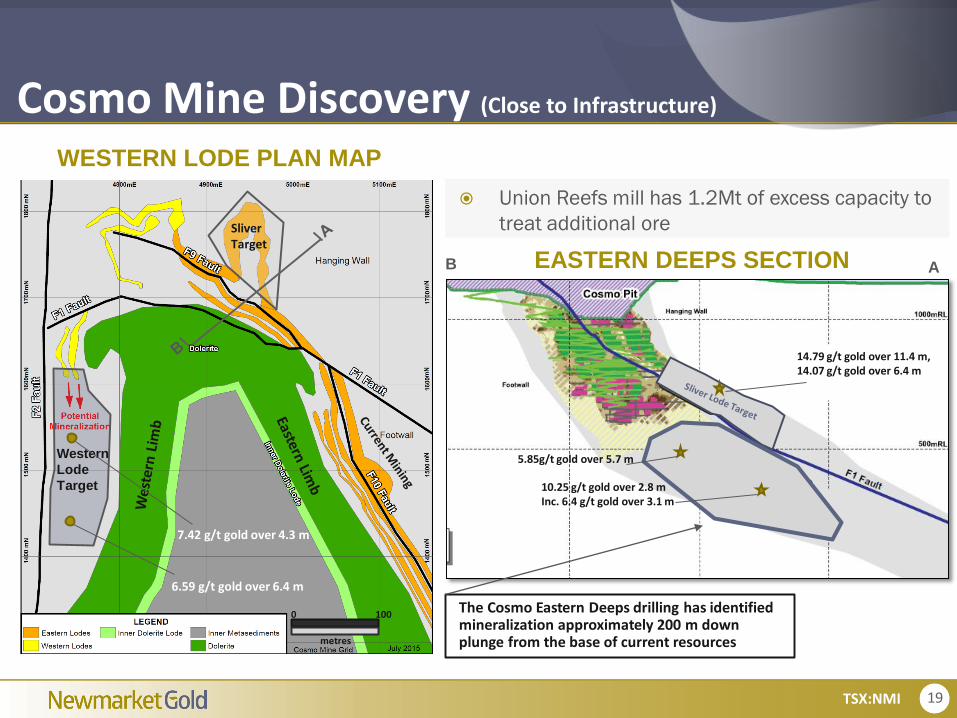
Cosmo Mine Discovery (Close to Infrastructure)
0 100
metres
Western
Lode
Target
SliverTarget
7.42 g/t gold over 4.3 m
6.59 g/t gold over 6.4 m
Cosmo Long Section
14.79 g/t gold over 11.4 m, 14.07 g/t gold over 6.4 m
5.85g/t gold over 5.7 m
10.25 g/t gold over 2.8 mInc. 6.4 g/t gold over 3.1 m
The Cosmo Eastern Deeps drilling has identified mineralization approximately 200 m down plunge from the base of current resources
WESTERN LODE PLAN MAP
EASTERN DEEPS SECTION
Union Reefs mill has 1.2Mt of excess capacity to
treat additional ore
AB

20TSX:NMI
0.56x
1.06x
1.35x
P/NAV NMI P/NAV top 25% quartile P/NAV Mean Mid-Tier
M&A Strategy Prudently acquire quality gold production to grow to 500,000 ounces of annual production
Targeting Australia and North America as preferred jurisdictions
Focus on operating cash costs below US$800 and All-in-costs below US$1000
Targeting +100,000 oz annual production opportunities and increased life of mine reserves
Accretive to CFPS, All-Sustaining costs, operating cash costs and market cap per share
NMI Opportunity
Source: company disclosure, Factset, Bloomberg, Peer Averages exclude Newmarket Gold, as at Feb 16, 2016
Top 1.42x
Top 1.26x
Australia Junior Gold Producers Australia Mid-tier Gold Producers
< 200,000 ounces
> 300,000 ounces
Newmarket Gold Valuation
21TSX:NMI
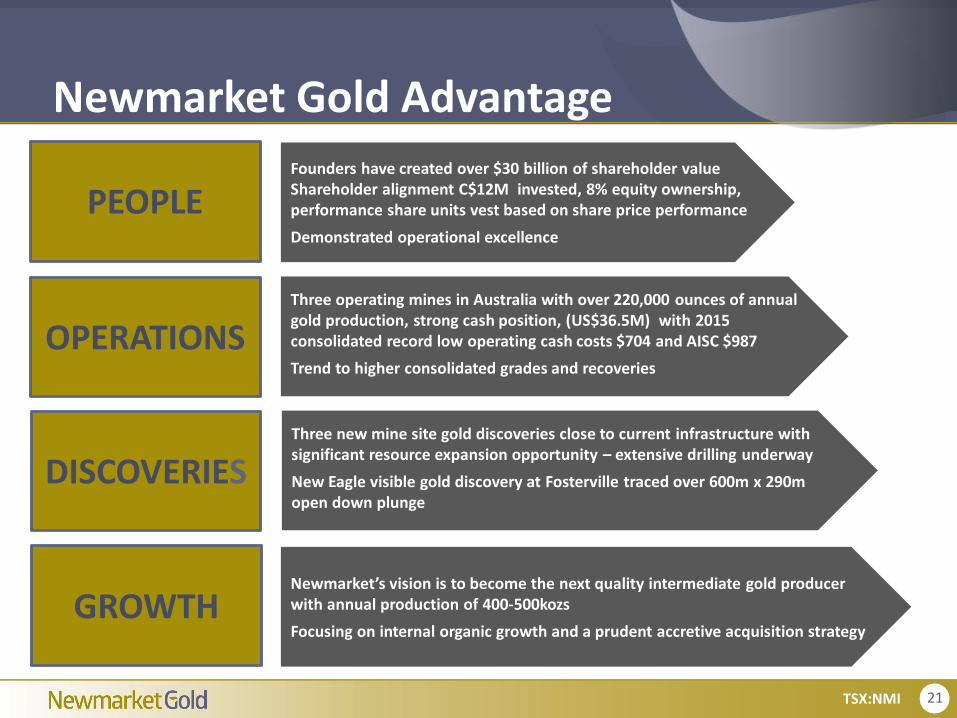
PEOPLEFounders have created over $30 billion of shareholder value Shareholder alignment C$12M invested, 8% equity ownership, performance share units vest based on share price performance
Demonstrated operational excellence
OPERATIONSThree operating mines in Australia with over 220,000 ounces of annual gold production, strong cash position, (US$36.5M) with 2015 consolidated record low operating cash costs $704 and AISC $987
Trend to higher consolidated grades and recoveries
GROWTHNewmarket’s vision is to become the next quality intermediate gold producer with annual production of 400-500kozs
Focusing on internal organic growth and a prudent accretive acquisition strategy
Newmarket Gold Advantage
DISCOVERIESThree new mine site gold discoveries close to current infrastructure with significant resource expansion opportunity – extensive drilling underway
New Eagle visible gold discovery at Fosterville traced over 600m x 290m open down plunge

Douglas ForsterPresident & CEO, Director
T: 604-559-8040E: [email protected]
www.newmarketgoldinc.com
Contact Us
Ryan KingVice President, Corporate Communications
T: 778-998-3700E: [email protected]
Laura LeporeDirector, Investor Relations
T: 416-728-3707E: [email protected]
TSX:NMI
23TSX:NMI
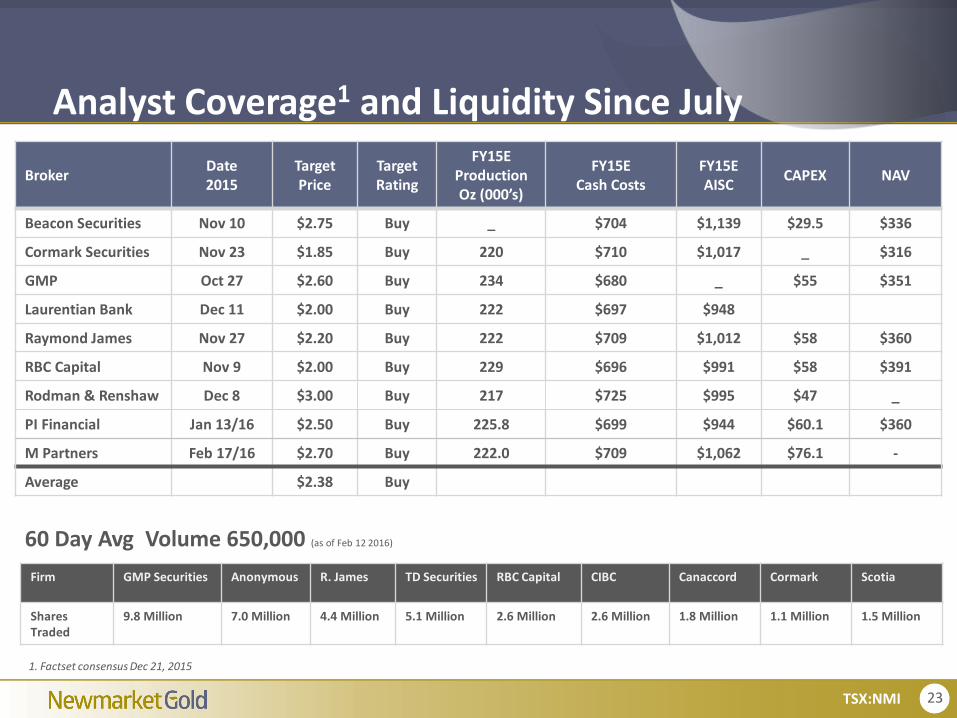
Analyst Coverage1 and Liquidity Since July
Firm GMP Securities Anonymous R. James TD Securities RBC Capital CIBC Canaccord Cormark Scotia
Shares Traded
9.8 Million 7.0 Million 4.4 Million 5.1 Million 2.6 Million 2.6 Million 1.8 Million 1.1 Million 1.5 Million
60 Day Avg Volume 650,000 (as of Feb 12 2016)
BrokerDate2015
Target Price
TargetRating
FY15EProductionOz (000’s)
FY15ECash Costs
FY15EAISC
CAPEX NAV
Beacon Securities Nov 10 $2.75 Buy _ $704 $1,139 $29.5 $336
Cormark Securities Nov 23 $1.85 Buy 220 $710 $1,017 _ $316
GMP Oct 27 $2.60 Buy 234 $680 _ $55 $351
Laurentian Bank Dec 11 $2.00 Buy 222 $697 $948
Raymond James Nov 27 $2.20 Buy 222 $709 $1,012 $58 $360
RBC Capital Nov 9 $2.00 Buy 229 $696 $991 $58 $391
Rodman & Renshaw Dec 8 $3.00 Buy 217 $725 $995 $47 _
PI Financial Jan 13/16 $2.50 Buy 225.8 $699 $944 $60.1 $360
M Partners Feb 17/16 $2.70 Buy 222.0 $709 $1,062 $76.1 -
Average $2.38 Buy
1. Factset consensus Dec 21, 2015
24TSX:NMI
$400
$800
$1,200
$1,600
$2,000
2000 2001 2002 2003 2004 2005 2006 2007 2008 2009 2010 2011 2012 2013 2014 2015
Go
ld S
po
t (i
n A
UD
$)
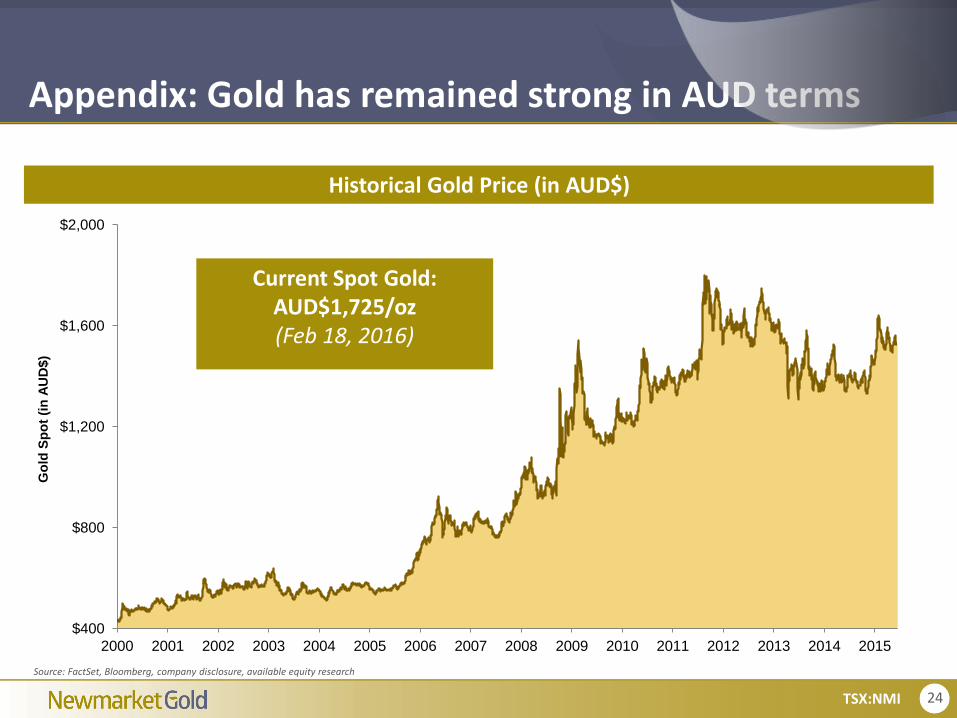
Historical Gold Price (in AUD$)
Appendix: Gold has remained strong in AUD terms
Source: FactSet, Bloomberg, company disclosure, available equity research
Current Spot Gold:AUD$1,725/oz(Feb 18, 2016)

25TSX:NMI
Appendix: Mineral Reserves and Resources
Inferred Resources Tonnes (Mt) Grade Au (g/t) Au (kozs)
Fosterville 5.8 3.72 699
Cosmo 1.0 2.72 84
Stawell 0.8 3.07 77
Burnside 6.9 1.47 323
Maud Creek 4.2 2.55 344
Union Reefs 4.3 2.23 305
Pine Creek 2.5 2.34 191
Inferred Resources 31.3 2.48 2,024
M&I Resources (incl.) Tonnes (Mt) Grade Au (g/t) Au (kozs)
Fosterville 16.6 4.18 2,151
Cosmo 5.0 3.35 539
Stawell 4.2 1.80 243
Burnside 7.5 1.38 335
Maud Creek 7.7 3.50 871
Union Reefs 3.0 2.43 236
Pine Creek 8.4 1.41 379
M&I Resources (incl.) 52.5 2.82 4,754Source: Crocodile Gold March 31, 2015 press release announcing 2014 year-end mineral reserves and mineral resources
2P Reserves Tonnes (Mt) Grade Au (g/t) Au (kozs)
Fosterville (Under Ground) 1.02 5.55 182
Fosterville (CIL Residues) 0.4 8.89 126
Cosmo 1.3 3.57 148
Stawell 0.8 2.80 36
Big Hill 2.9 1.54 145
Burnside 0.2 1.93 10
Maud Creek 1.1 5.40 184
Union Reefs 0.3 4.40 42
Pine Creek 1.3 1.55 62
2P Reserves 9.2 3.15 935
26TSX:NMI
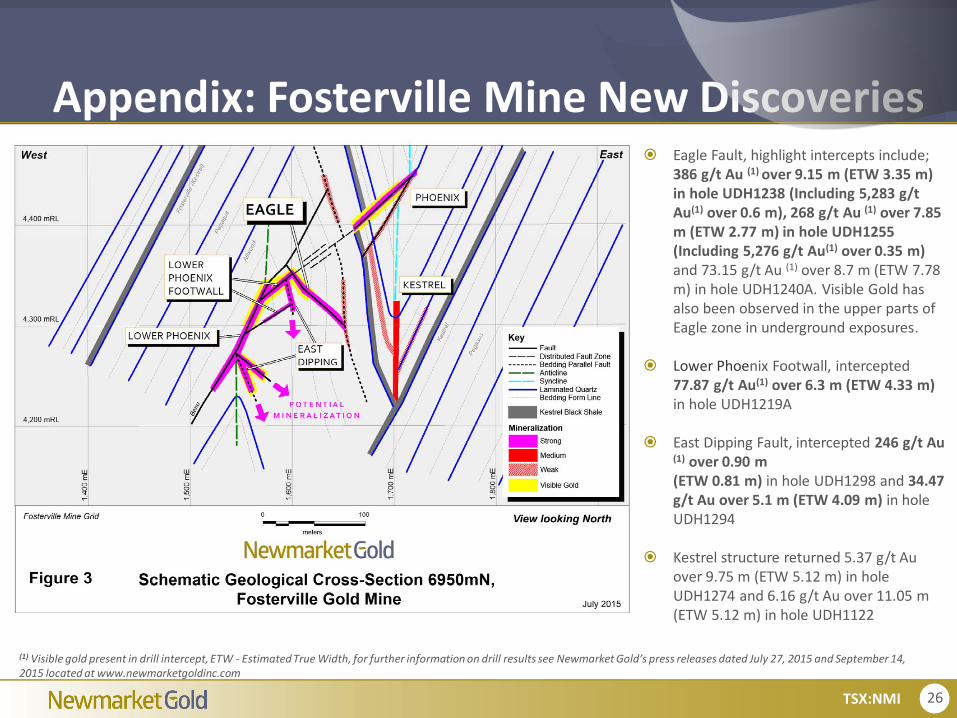
Appendix: Fosterville Mine New Discoveries Eagle Fault, highlight intercepts include;
386 g/t Au (1) over 9.15 m (ETW 3.35 m) in hole UDH1238 (Including 5,283 g/t Au(1) over 0.6 m), 268 g/t Au (1) over 7.85 m (ETW 2.77 m) in hole UDH1255 (Including 5,276 g/t Au(1) over 0.35 m)and 73.15 g/t Au (1) over 8.7 m (ETW 7.78 m) in hole UDH1240A. Visible Gold has also been observed in the upper parts of Eagle zone in underground exposures.
Lower Phoenix Footwall, intercepted 77.87 g/t Au(1) over 6.3 m (ETW 4.33 m)in hole UDH1219A
East Dipping Fault, intercepted 246 g/t Au (1) over 0.90 m (ETW 0.81 m) in hole UDH1298 and 34.47 g/t Au over 5.1 m (ETW 4.09 m) in hole UDH1294
Kestrel structure returned 5.37 g/t Au over 9.75 m (ETW 5.12 m) in hole UDH1274 and 6.16 g/t Au over 11.05 m (ETW 5.12 m) in hole UDH1122
(1) Visible gold present in drill intercept, ETW - Estimated True Width, for further information on drill results see Newmarket Gold’s press releases dated July 27, 2015 and September 14, 2015 located at www.newmarketgoldinc.com

27TSX:NMI
Appendix: Fosterville Mine (Eagle Zone - Visible Gold)

28TSX:NMI
Appendix: Cosmo Mine Western Lodes
A number of drill holes have now penetrated the Western Lodes Target.
Drill results for the Cosmo Western Lodes which are outside of the current mine plan include 7.42 g/t gold over 4.3 m (estimated true width 2.85 m) and 6.59 g/t gold over 6.4 m (estimate true width 1.65 m).
Work continues to fully define the potential of the Western Lodes
Target is located only 160 m from current development and has the potential to increase resources at Cosmo and expand the current mine plan to alternative mining areas.
Note: For further information on drill results see Newmarket Gold’s press release dated July 22, 2015 located at www.newmarketgoldinc.com
29TSX:NMI
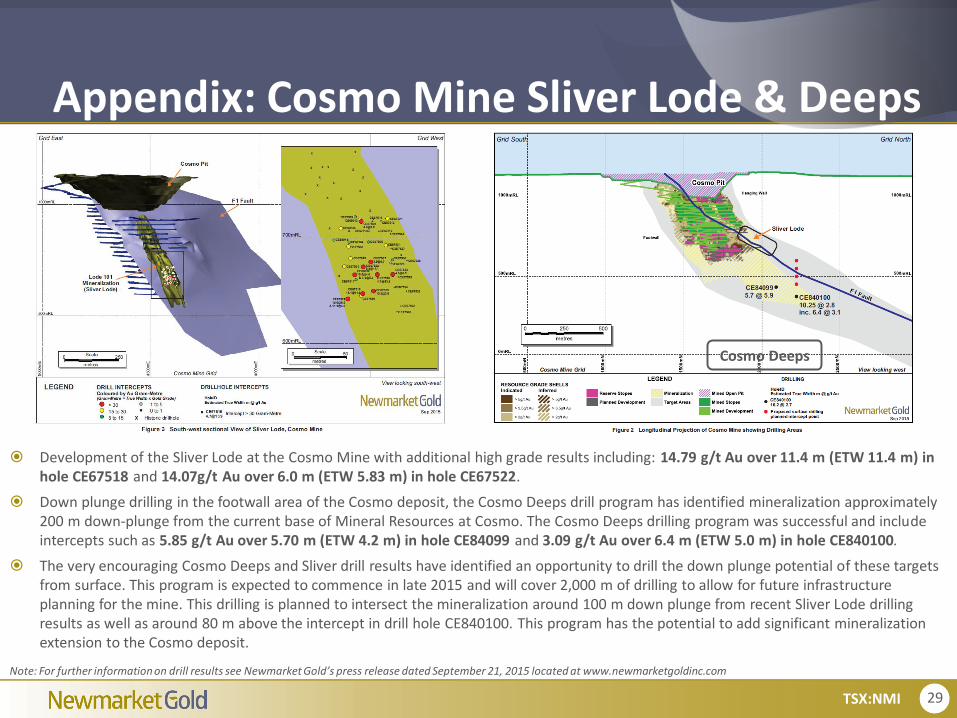
Appendix: Cosmo Mine Sliver Lode & Deeps
Development of the Sliver Lode at the Cosmo Mine with additional high grade results including: 14.79 g/t Au over 11.4 m (ETW 11.4 m) in hole CE67518 and 14.07g/t Au over 6.0 m (ETW 5.83 m) in hole CE67522.
Down plunge drilling in the footwall area of the Cosmo deposit, the Cosmo Deeps drill program has identified mineralization approximately 200 m down-plunge from the current base of Mineral Resources at Cosmo. The Cosmo Deeps drilling program was successful and include intercepts such as 5.85 g/t Au over 5.70 m (ETW 4.2 m) in hole CE84099 and 3.09 g/t Au over 6.4 m (ETW 5.0 m) in hole CE840100.
The very encouraging Cosmo Deeps and Sliver drill results have identified an opportunity to drill the down plunge potential of these targets from surface. This program is expected to commence in late 2015 and will cover 2,000 m of drilling to allow for future infrastructure planning for the mine. This drilling is planned to intersect the mineralization around 100 m down plunge from recent Sliver Lode drilling results as well as around 80 m above the intercept in drill hole CE840100. This program has the potential to add significant mineralization extension to the Cosmo deposit.
Note: For further information on drill results see Newmarket Gold’s press release dated September 21, 2015 located at www.newmarketgoldinc.com
Cosmo Deeps

30TSX:NMI
Appendix: Stawell Aurora B East Flank
New discovery of Aurora B East Flank mineralization is a significant event in the long history of the Stawell mine.
West Flank at Stawell has produced 2.3 million oz gold whereas the East Flank, where the Aurora B discovery has been made has no recorded production.
Drilling on the Aurora B discovery returned high-grade intercepts containing visible gold including: 7.06 g/t gold over 17.80 m (estimate true width 8.3 m).
Additional drilling on this new discovery is on-going.
Note: For further information on drill results see Newmarket Gold’s press release dated July 22, 2015 located at www.newmarketgoldinc.com
31TSX:NMI
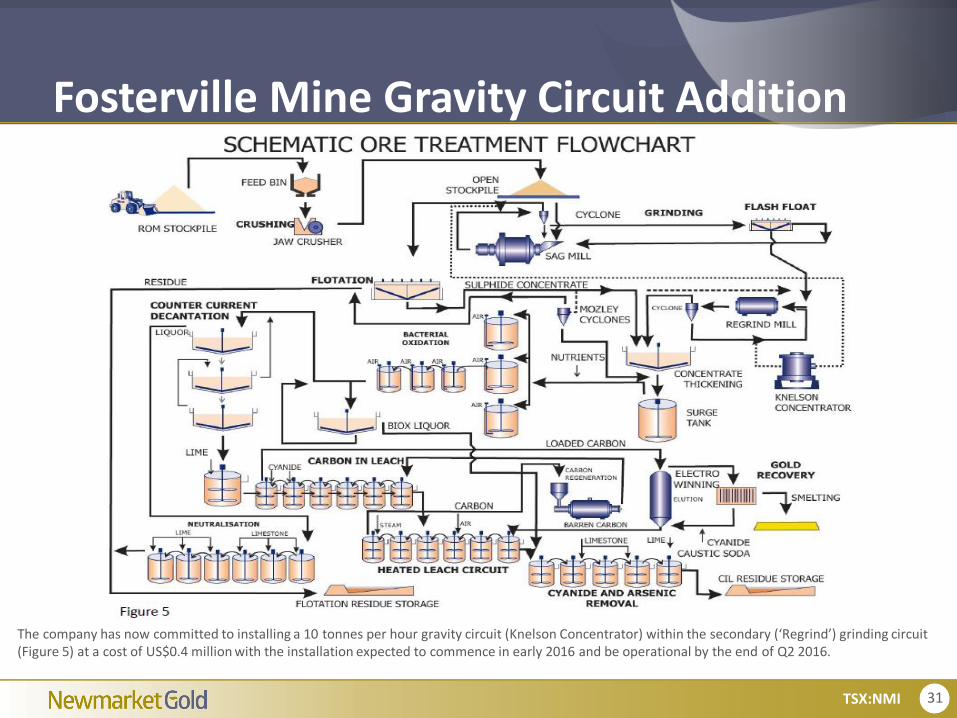
Fosterville Mine Gravity Circuit Addition
The company has now committed to installing a 10 tonnes per hour gravity circuit (Knelson Concentrator) within the secondary (‘Regrind’) grinding circuit (Figure 5) at a cost of US$0.4 million with the installation expected to commence in early 2016 and be operational by the end of Q2 2016.
32TSX:NMI
Appendix: Non-IFRS and Additional InformationNon-IFRS MeasuresNewmarket Gold believes that investors use certain indicators to assess gold mining companies. The indicators are intended to provide additional information and should not beconsidered in isolation or as a substitute for measures of performance in accordance with the International Financial Reporting Standards.“OperationalCash Costs perOunce” is a non-IFRS performance measure which could provide an indication of the mining and processing efficiency at the operations.The Company calculates operating cash costs per ounce by deducting silver sales revenue as a by-product from operating expenses per the consolidated statement ofoperations, then dividing by the gold ounces sold during the applicable period. Operating expenses include mine site operating costs such as mining, processing andadministration as well as royalties, however excludes depletion and depreciation, share-based payments and rehabilitation costs. There are variations in the method ofcomputation of “operational cash costs per ounce” as determined by the Company compared with other mining companies. For more detail on the operational cash costs perounce determination for Crocodile Gold, please visit www.sedar.com or www.newmarketgoldinc.com and review the latest Annual Financial Statements issued on March 19,2014.
“All-In Sustaining Costs per Ounce of Gold (“AISC”) Effective December 31, 2013, the Company has adopted an all-in sustaining cost (“AISC”) performance measure that reflectsall of the expenditures that are required to produce an ounce of gold from current operations. While there is no standardized meaning of the measure across the industry, theCompany’s definition conforms to the AISC definition as set out by the World Gold Council in its guidance dated June 27, 2013. The World Gold Council is a non-regulatory, non-profit organization established in 1987 whose members include global senior mining companies. The Company believes that this measure will be useful to external users inassessing operating performance and the ability to generate free cash flow from current operations. The Company defines AISC as the sum of operating cash costs (per above),sustaining capital (capital required to maintain current operations at existing levels), capital lease repayments, corporate general and administrative expenses, mine explorationwithin the known resources and rehabilitation accretion and amortization related to current operations. AISC excludes capital expenditures for significant improvements atexisting operations deemed to be expansionary in nature, exploration and evaluation related to growth projects, rehabilitation accretion and amortization not related to currentoperations, financing costs, debt repayments, share-based compensation not related to operations, and taxes.
Additional InformationNotes for Page 25: For information regarding mineral resource and reserve estimates, including parameters used to generate the estimates and depletion, please see thetechnical reports titled: NI43-101 TECHNICAL REPORT FOSTERVILLE GOLD MINE, VICTORIA, AUSTRALIA PREPARED FOR CROCODILE GOLD CORP dated March 31, 2015 and;NI43-101 TECHNICAL REPORT – BIG HILL ENHANCED DEVELOPMENT PROJECT AT STAWELL GOLD MINE MINERAL RESOURCES & RESERVES PREPARED FOR CROCODILE GOLDCORP dated June 6, 2014. For the Northern Territory Mineral Reserve Estimates please refer to the technical reports titled: REPORT ON THE MINERAL RESOURCES & MINERALRESERVES OF THE COSMO DEEPS GOLD PROJECT dated March 31, 2015; NI 43-101 TECHNICAL REPORT STAWELL GOLD MINE, VICTORIA, AUSTRALIA PREPARED FOR CROCODILEGOLD CORP dated March 31, 2015; REPORT ON THE MINERAL RESOURCES & MINERAL RESERVES OF THE UNION REEFS GOLD PROJECT dated December 31, 2012; REPORT ONTHE MINERAL RESOURCES & MINERAL RESERVES OF THE PINE CREEK GOLD PROJECT dated December 31, 2012; REPORT ON THE MINERAL RESOURCES & MINERAL RESERVES OFTHE MAUD CREEK GOLD PROJECT dated December 31, 2012 and; REPORT ON THE MINERAL RESOURCES & MINERAL RESERVES OF THE BURNSIDE GOLD AND BASE METALPROJECT dated December 12, 2013.Mineral resources that are not mineral reserves do not have demonstrated economic viability.
Qualified PersonMark Edwards, MAusIMM (CP), MAIG, General Manager, Exploration, Newmarket Gold, is a "qualified person" as such term is defined in National Instrument 43-101 and hasreviewed and approved the technical information and data included in this presentation.