
NEWFOUNDLAND AND LA BRADO R HYDRO - pub.nl.ca · Appendix 3 Details – Holyrood Availability ... 2...
58
NEWF FOUNDLAND A Generati Ma AND LA ion Availab rch 2014 BRADO bility OR HYDR RO
Transcript of NEWFOUNDLAND AND LA BRADO R HYDRO - pub.nl.ca · Appendix 3 Details – Holyrood Availability ... 2...

NEWFFOUNDLAND A
Generati
Ma
AND LA
ion Availab
rch 2014
BRADO
bility
OR HYDRRO
Generation Availability
NEWFOUNDLAND AND LABRADOR HYDRO I
Table of Contents
EXECUTIVE SUMMARY .................................................................................................................... 1
1 INTRODUCTION ....................................................................................................................... 2
2 REVIEW PROCESS .................................................................................................................... 2
3 BACKGROUND ......................................................................................................................... 2
4 SEQUENCE OF EVENTS: RELEVANT TIME FRAME ................................................................. 15
5 KEY FINDINGS AND RECOMMENDATIONS ............................................................................ 22
ACRONYMS ................................................................................................................................... 28
Appendices:
Appendix 1 Detailed Capability Comparison
Appendix 2 Details – Gas Turbine Availability
Appendix 3 Details – Holyrood Availability
Appendix 4 Details – Hydroelectric Generation Availability
Appendix 5 Details – Wind Generation Availability
Appendix 6 Details – Under‐Frequency Event History 2004 to 2013

Generation Availability
NEWFOUNDLAND AND LABRADOR HYDRO 1
EXECUTIVE SUMMARY 1
Newfoundland and Labrador Hydro (Hydro) has completed an extensive review of the events 2
surrounding the supply disruptions on the Island Interconnected system during January 2 to 8, 3
2014. The review included investigation of the rotating outages that occurred between 4
January 2 to 8, 20141 and the transmission/terminal station equipment failures that occurred 5
on January 4 and 5, 2014. 6
7
This report outlines the results of the investigation/assessment of Hydro’s generation assets 8
availability leading up to, and during the January 2 to 8, 2014 system event. It is intended to 9
summarize the results of Hydro’s internal review of its generation availability, specifically 10
addressing the following: 11
Gas turbine availability 12
Holyrood availability 13
Hydro generation availability 14
Wind generation availability 15
16
The Key Findings and Recommendations are provided in Section 5. 17
18
The main recommendations from this review are: 19
Through the existing Critical Spares Council, follow‐up on the critical spares program as 20
is currently in Hydro’s plan in early 2014. 21
Create a senior position reporting to the Vice‐President for Hydro whose accountability 22
includes the oversight of asset management plans, maintenance standards and capital 23
submissions related to gas turbines. 24
1 Rotating outages occurred on January 2, 3, 5 and 8, 2014.
Generation Availability
NEWFOUNDLAND AND LABRADOR HYDRO 2
1 INTRODUCTION 1
This report outlines the results of the investigation/assessment of the Island Interconnected 2
System generation assets availability before, leading up to, and during the January 2 to 8, 2014, 3
system event. 4
5
The scope of this focus area/element involves an assessment of: 6
Factors that contributed to unplanned unavailability. 7
Long term asset management plans. 8
Maintenance plans and execution thereof. 9
Critical spares availability. 10
Winter readiness, including availability of fuel. 11
Scheduling of gas turbine overhauls/outages. 12
13
2 REVIEW PROCESS 14
The review process involved internal Hydro generation asset experts, as well as generation 15
expertise support from AMEC Americas. The (AMEC) work included: 16
Review of existing Hydro data relevant to historical generation asset availability. 17
Review of information on generation availability and issues leading up to and during the 18
January 2 to 8, 2014 system event. 19
Discussions/interviews with Hydro staff. 20
21
3 BACKGROUND 22
3.1 Overview of Facilities 23
Planning on the Island Interconnected System is designed to address: 24
Capacity planning criteria: The Island Interconnected System should have sufficient 25
capacity to satisfy a Loss of Load Hours (LOLH) expected target of <2.8 hours per year. 26
Generation Availability
NEWFOUNDLAND AND LABRADOR HYDRO 3
Energy planning criteria: The Island Interconnected System should have sufficient 1
capability to supply all of its firm energy requirements with firm system capability. 2
A Transmission Planning Criteria that establishes operating assumptions and the various 3
transmission contingencies for which the system is planned to survive. 4
5
Other factors impacting Operational Planning include: 6
Dispatch generation to maintain an “n‐1” generation reserve.2 7
Holyrood fuel use minimization is a priority but may be limited by available inflows, 8
reservoir storages and by system security considerations, such as system capacity and 9
voltage constraints. 10
11
Figure 1 provides a general overview of Hydro generating facilities and their in‐service dates. 12
13
In addition, the Island Interconnected System has about 163 MW of non‐dispatchable 14
generation sources (the power system operator in the Energy Control Centre (ECC) cannot 15
control and thereby set the level of output), as follows: 16
54 MW of wind generation, varies with wind conditions; 17
90 MW of run‐of‐river Exploits River generation (63 MW of output can be sustained by 18
varying the flow out of Red Indian Lake; 27 MW is dependent on uncontrolled flows in 19
the river); 20
4 MW of run‐of‐river generation at Rattle Brook, dependent on river flow; and 21
15 MW Corner Brook Pulp and Paper co‐generation, dependent on the paper mill’s 22
steam requirements. 23
2 “n‐1” refers to having generation reserves readily available and able to be started quickly to replace the loss of the largest unit currently in‐service in order to avoid a prolonged customer interruption. Operational planning will typically result in extended planned maintenance only occurring during non‐winter periods. It is possible that during the winter peak period this criteria could be violated while still adhering to the 2.8 hour criterion.

Generation Availability
NEWFOUNDLAND AND LABRADOR HYDRO 4
Figure 1: Overview of Generating Units on the Island System 1 Note: 1) The difference at Bay d’Espoir is not due to station service, but due to low water conditions. 2 2) Cat Arm generating units can produce > 63.5 MW each. Installed capacity closer to 67 MW. 3 3) Diesel units (Hawkes Bay and St. Anthony) provide approximately 15 MW of capacity and were 4
important contributors to the system during rotating outages. 5
Hydro's generation planning assessments take into account this non‐dispatchable nature and 6
under most normal operating conditions, there is more than enough firm dispatchable 7
generation available to meet peak loads. The current level of non‐dispatchable generation has 8
not affected Hydro's ability to meet its peak load. The non‐dispatchable generation, when 9
available, increases the level of generation potentially availableasreserve. Actual dispatch is 10
based on optimizing the generation mix to get the most cost effective power mix while meeting 11
system reliability requirements. 12
13
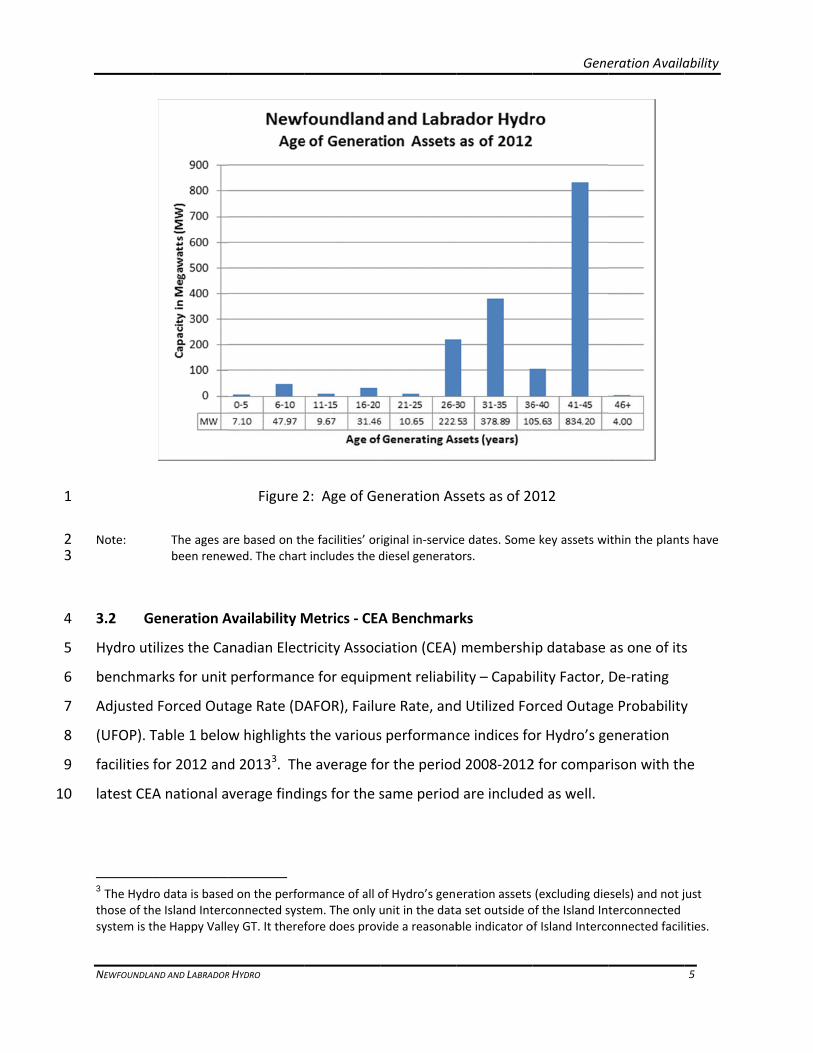
Figure 2 provides a view of the Hydro generating facilities’ age distribution. 14
1
2 3
4
5
6
7
8
9
10
NEWFOUNDLA
Note:
3.2 G
Hydro ut
benchma
Adjusted
(UFOP). T
facilities
latest CE
3 The Hydrthose of thsystem is t
AND AND LABRADOR
The ages abeen renew
Generation A
tilizes the Ca
arks for unit
d Forced Out
Table 1 belo
for 2012 and
A national a
ro data is basedhe Island Intercthe Happy Valle
R HYDRO
Figure 2
re based on thwed. The chart
Availability M
nadian Elect
performanc
tage Rate (DA
w highlights
d 20133. Th
verage findi
d on the perfoconnected systey GT. It theref
2: Age of Ge
he facilities’ ort includes the d
Metrics ‐ CEA
tricity Assoc
ce for equipm
AFOR), Failu
s the various
e average fo
ngs for the s
rmance of all otem. The only ufore does prov
eneration As
iginal in‐servicdiesel generato
A Benchmar
iation (CEA)
ment reliabi
ure Rate, and
s performanc
or the period
same period
of Hydro’s genunit in the datavide a reasonab
ssets as of 20
ce dates. Someors.
rks
membershi
lity – Capab
d Utilized Fo
ce indices fo
d 2008‐2012
d are include
eration assets a set outside oble indicator o
Gene
012
e key assets wi
ip database
ility Factor,
orced Outage
or Hydro’s ge
2 for compar
ed as well.
(excluding dieof the Island Intof Island Interco
eration Availa
ithin the plant
as one of its
De‐rating
e Probability
eneration
rison with th
esels) and not jterconnected onnected facili
ability
5
s have
s
y
he
ust
ities.

Generation Availability
NEWFOUNDLAND AND LABRADOR HYDRO 6
Table 1: Generation Performance Indices – CEA Benchmarks 2012‐2013 1
Generation Performance Indices – CEA Benchmarks
Index Hydro Thermal Gas Turbine
Failure Rate
(Forced Outages per 8,760
operating hours)
NLH 2013 1.42 8.84 144.46
NLH 2012 1.78 8.22 231.67
NLH '08‐'12 2.62 6.38 137.89
CEA ‘08‐‘12 2.06 7.11 22.30
Incapability
Factor
(Percent of Time)
NLH 2013 7.97 53.96 26.73
NLH 2012 9.26 26.92 31.28
NLH '08‐'12 7.83 30.99 23.12
CEA ‘08‐‘12 9.33 25.62 13.81
De‐rating Adjusted Forced
Outage Rate
(Percent of Time)
NLH 2013 0.55 36.58
NLH 2012 0.95 5.98
NLH '08‐'12 0.76 10.03
CEA ‘08‐‘12 3.66 9.23
Utilization
Forced Outage
Probability (Percent of Time)
NLH 2013 28.07
NLH 2012 56.33
NLH '08‐'12 22.64
CEA ‘08‐‘12 11.84
Hydro Unit Performance 2
Hydro unit measures improved in 2013 when compared to 2012 and are better than the latest 3
five year CEA national averages. Hydroelectric unit de‐rating adjusted forced outage rate is 4
significantly better than the latest five year CEA national average. 5
6
Thermal Unit Performance 7
Thermal unit performance deteriorated in 2013, particularly the Incapability Factor and De‐8
rating Adjusted Forced Outage Rate measures. Performance in 2013 was worse than the CEA 9
national five year average. The decline is primarily owing to the failure experienced on 10
Holyrood Unit 1 in January 2013 and the lengthy outage that resulted. 2012 Hydro data is 11
Generation Availability
NEWFOUNDLAND AND LABRADOR HYDRO 7
similar to the CEA average, and the 2008‐ 2012 Hydro average values for its thermal units is 1
consistent with the CEA benchmark. (Note: Hydro’s data is comparable despite having less 2
operating time because of its primary winter peak load period role as well as longer summer 3
maintenance outages due to units not being required to meet system load. This is offset by the 4
better availability during operating periods as a result of the additional maintenance and 5
condition assessment activities in the summer months. 6
7
Gas Turbine Unit Performance 8
Hydro’s gas turbine performance is much worse than the CEA national average, however it 9
improved in 2013 in all areas. The Hydro Gas Turbine (GT) performance reflects their infrequent 10
peaking role to provide system emergency support. A condition assessment was undertaken by 11
Stantec in 2007‐2008 and refurbishment work was carried out between 2010 and 2013. The 12
Stephenville Unit was returned to service in June 2013 after a 20 month forced outage. A 13
decision was made to allow for a longer outage period given planned system needs at the time. 14
The improvements in some of the 2013 performance data were impacted by extended planned 15
outages at Hardwoods for refurbishment and generator alternator replacement. The Utilization 16
Forced Outage Probability is of particular importance to Hydro’s use of gas turbines. It describes 17
the degree to which a standby unit can be called upon to supply load when requested. 18
19
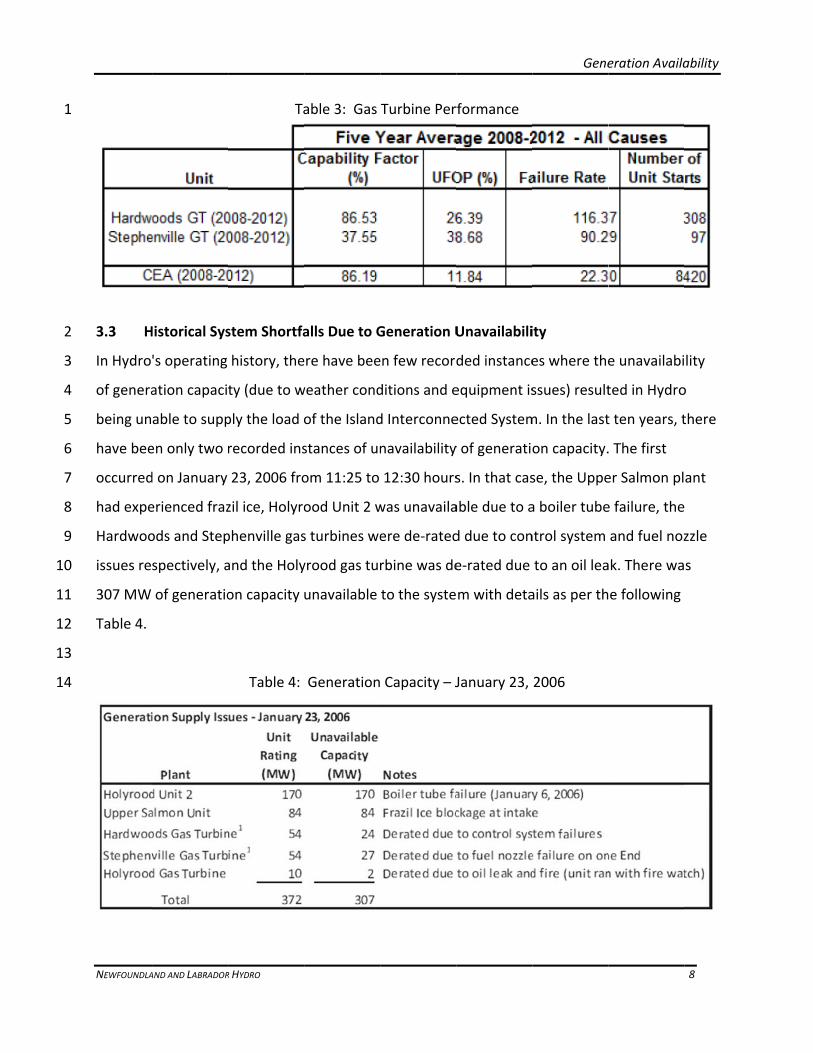
Table 3 further illustrates the poor gas turbine performance compared to other gas turbines in 20
the CEA database4. It should be noted that the Hydro GTs also have a poor start performance. 21
The roles and operating patterns of the gas turbines in the CEA database may include those 22
operating more frequently. 23
4 Capability Factor is defined as unit available time, the ratio of a unit’s available time to the total number of unit hours. Incapability = 1 minus Capability Factor. The Utilization Forced Outage Probability is the probability that a generating unit will not be available when required and measures performance of standby units with low operating time such as gas turbines. Failure Rate is defined as the rate that a generating unit encounters a forced outage = the number of transitions from an operating to a forced outage state divided by the total operating time. It can be greatly influenced by limited operating time for gas turbines.
1
2
3
4
5
6
7
8
9
10
11
12
13
14
NEWFOUNDLA
3.3 H
In Hydro
of genera
being un
have bee
occurred
had expe
Hardwoo
issues re
307 MW
Table 4.
AND AND LABRADOR
Historical Sys
's operating
ation capaci
able to supp
en only two r
d on January
erienced fraz
ods and Step
spectively, a
of generatio
R HYDRO
Ta
stem Shortfa
history, the
ty (due to w
ply the load o
recorded ins
23, 2006 fro
zil ice, Holyro
phenville gas
and the Holy
on capacity
Table 4:
able 3: Gas
alls Due to G
ere have bee
weather cond
of the Island
stances of un
om 11:25 to
ood Unit 2 w
s turbines we
yrood gas tur
unavailable
Generation
Turbine Per
Generation U
en few record
ditions and e
d Interconne
navailability
12:30 hours
was unavaila
ere de‐rated
rbine was de
to the syste
Capacity – J
rformance
Unavailabili
ded instance
equipment is
ected System
y of generatio
s. In that cas
able due to a
d due to con
e‐rated due
m with deta
January 23,
Gene
ity
es where the
ssues) result
m. In the last
on capacity.
se, the Uppe
a boiler tube
ntrol system
to an oil lea
ails as per th
2006
eration Availa
e unavailabi
ted in Hydro
t ten years, t
. The first
er Salmon pl
e failure, the
and fuel noz
ak. There wa
e following
ability
8
lity
o
there
ant
zzle
s

1
2
3
4
5
6
7
8
9
10
11
12
13
14
15
16
17
18
19
NEWFOUNDLA
The seco
initiated
resulted
several g
time is p
unavailab
Interconn
There ha
Island Int
isolated s
(due to in
some loa
This auto
shedding
interrupt
maintain
under‐fre
AND AND LABRADOR
ond event oc
outage that
in failures in
generation u
resented in
ble for much
nected Syste
ve also been
terconnecte
system so th
ncidents, suc
ads must be
omatic action
g, is necessar
tions are usu
ns an availab
equency eve
R HYDRO
curred on Ja
t had a subse
n the Holyro
nits tripping
the followin
h of 2013. Th
em after the
Table 5:
n an average
d System fro
hat when the
ch as slow c
interrupted
n of power s
ry to ensure
ually less tha
le reserve to
ents in 2004
anuary 11, 2
equent impa
od Terminal
g, including a
ng table. Holy
his impacted
e terminal sta
Generation
e of approxim
om 2004 to
ere is a sudd
learing trans
for short pe
system prote
the integrit
an 30 minute
o cover off t
to 2013 are
013. There w
act on gener
l Station and
all three Holy
yrood Unit 1
d Hydro bein
ation and tra
Capacity – J
mately six un
2013. The Is
den loss imb
smission fau
eriods to brin
ection, refer
ty and reliab
es for these
he failure of
presented i
was an initia
ration unava
d 230 kV line
yrood units.
1 was damag
ng able to su
ansmission l
January 11,
nder‐freque
sland Interco
alance betw
ults or sudde
ng generatio
rred to as un
bility of syste
events beca
f the largest
in Appendix
Gene
al transmissi
ailability. Sev
e outages th
. Unavailable
ged and as a
pply the loa
line repairs w
2013
ency events p
onnected Sy
ween loads a
en large loss
on output eq
nder‐frequen
em equipme
ause Hydro g
unit. Detail
6.
eration Availa
on system
vere weathe
at resulted i
e capacity at
a result
d of the Isla
were compl
per year on
stem is an
nd generatio
of generatio
qual to dema
ncy load
nt. Load
generally
ls of these
ability
9
r
n
t the
nd
eted.
the
on
on)
and.

Generation Availability
NEWFOUNDLAND AND LABRADOR HYDRO 10
3.4 Generation Asset Readiness 1
3.4.1 Long Term Asset Management Plans 2
Hydro’s long term asset management planning is comprehensive and consistent with good 3
industry practices. The principles are used for Hydro’s thermal, hydroelectric, and gas turbine 4
facilities. Its focus is to achieve maximum value based on the required standard of service to 5
current and future generations. For details of long term asset management plans and planning, 6
the report Asset Management Strategy and Practices should be referenced. Condition 7
assessment is a key tool in the development of Hydro’s asset management plans, using 8
methods such as those developed by the Electric Power Research Institute (EPRI). 9
Hydro has actively been undertaking priority condition assessments to better refine 10
maintenance, refurbishment and replacement requirements and reflect those in short and long 11
term work plans. The long term asset management plans are followed, except where 12
unplanned and higher priority work are required or when changes in system production plans 13
may occur. This results in reprioritization of annual plans and may require formal revisions to 14
longer term plans. An example is the impact that the repair work to Holyrood Unit 1 in 2013 15
had on plans for Unit 2 maintenance work plans. 16
17
3.4.2 Maintenance Plans and Execution 18
Hydro’s annual execution work plan is the key to its maintenance plans and their execution. The 19
plan is intended to ensure that the activities, resources and outage window availabilities for all 20
of its facilities converge into a viable overall program. The execution of the plan undertakes 21
those elements to achieve the cost, schedule, performance, and environmental and regulatory 22
goals associated with the work. Hydro has competent and skilled staff, including those in 23
project management, planning, engineering, operations and skilled trades. Details of the 24
maintenance planning and execution process are included in the report entitled Asset 25
Management Strategy and Practices. 26
Generation Availability
NEWFOUNDLAND AND LABRADOR HYDRO 11
Hydro’s maintenance execution largely reflects the maintenance, refurbishment and 1
replacement activities in its annual execution plans. Plans do change due to reprioritization 2
where unplanned and higher priority work is required. The example in Section 3.4.1 of the 3
impact the repair work to Holyrood Unit 1 in 2013 had on plans for Unit 2 maintenance work 4
applies here as well. 5
6
3.4.3 Critical Spares Management 7
Hydro maintains critical capital and consumable spares for all its facilities based on vendor 8
recommendations, as well as operational experience, failure history and equipment condition 9
assessments. Hydro has developed a strategy, framework and process that are consistent with 10
good industry practice for its facilities. 11
12
The availability of generation asset critical spares did not impact the extent or duration of the 13
large January 4 to 5, 2014 transmission/terminal station failure events. Issues at the generation 14
facilities did, however, contribute to some of the rotating outages before the event on 15
January 4, 2014 and during the system restoration activities. Two instances where equipment 16
that might have been considered critical spares may have played a role in the rotating outages 17
were: i) the outage of the Hardwoods GT due to the lack of an available spare fuel control valve; 18
and ii) the de‐rating of Holyrood Unit 3 due to lack of a spare 4 kV forced drive (FD) fan motor. 19
The fuel valve was new and it would be a reasonable expectation that it should not fail during 20
initial installation. A spare 4 kV FD fan motor had been suggested for procurement 21
consideration in the 2011 Holyrood condition assessment. It was examined, costed and 22
submitted as part of the 2012 capital approval process, but was not pursued further based on 23
Hydro’s capital prioritization process. The subsequent year, it was determined not to be a 24
capital item and did not proceed further. A procurement decision would examine a number of 25
factors, including spare motor cost, potential risk, generation contingency availability, time to 26
repair, remaining generation life and the number of different 4 kV motors that would be 27
required to cover off all of the 4 kV motor applications in the plant. Details of the overall critical 28
Generation Availability
NEWFOUNDLAND AND LABRADOR HYDRO 12
spares management program are presented in the report Asset Management Strategy and 1
Practices. 2
3
3.4.4 Winter Readiness (including Availability of Fuel) 4
Winter readiness of generation facilities has been and continues to be a high importance area 5
for Hydro with regular tracking and reporting of performance to bring a higher focus on this 6
period than can be obtained using standard CEA measures. Up until the end of 2012, Hydro 7
used an internal winter availability measure to track winter generation performance from 8
December 1 to March 31 each year. In 2013, Hydro replaced this with a contingency reserve 9
performance measure. The newer contingency reserve measure allows for minor maintenance 10
in the winter period when demand permits while the older measure did not take the level of 11
demand into consideration. This measure will continue to be a key performance indicator with 12
which Hydro will establish targets to focus its efforts on. 13
14
In order to meet these targets, planned major project work and high priority corrective and 15
preventive maintenance work on generation assets is planned to be completed so as to be 16
winter ready. In the late fall of 2013, an external review was undertaken by AMEC which 17
included a review of the winter readiness of Holyrood Unit 2 and its fuel systems review as well 18
as Bay d’Espoir Unit 7 and its auxiliary systems. For Holyrood, it was identified that: 19
the high priority Unit 2 outage maintenance work had been completed in shorter 20
outages in late November and early December 2013, and 21
fuel issues had been mitigated and additional spares procured to address potential fuel 22
related maintenance issues. 23
24
Bay d’Espoir Unit 7 was considered to be in good condition for operation in the 2013/14 winter 25
period. The external review did not identify any issues that were causal or contributing factors 26
to the January 2 to 8, 2014 system event. 27

Generation Availability
NEWFOUNDLAND AND LABRADOR HYDRO 13
With the exception of the Stephenville and Hardwoods gas turbines, Hydro's generation assets 1
were considered to be winter ready. The Hardwoods gas turbines would, to a large extent, have 2
been winter ready by mid to late December if no issues had arisen at the end of its generator 3
refurbishment. The failure of the fuel control valve at Hardwoods was unexpected and its 4
extended return to service is the result of the time of year and limited service expertise in the 5
market. The timeliness of the procurement and delivery of the Stephenville insulation blanket is 6
an issue that may have been addressed sooner to minimize its potential impact. However, due 7
to the very cold temperatures at the time of the low generation availability and the steps Hydro 8
took at that time, the insulating blankets did not restrict the turbines output. On January 8, the 9
Stephenville gas turbine experienced an unexpected bearing failure in the recently refurbished 10
B end engine. Its impact could not likely have been prevented by additional inspection prior to 11
the winter (for complete details, refer to Appendix 2). 12
13
Liquid fuel availability became an issue throughout the island of Newfoundland during the 14
holiday period and the system event due to the nature of the fuel delivery contracting 15
practices. Typically, fuel delivery in the province is done by contractors many of whom were on 16
holiday in the period before the January 2 to 8, 2014 system event, and then unavailable due to 17
the extreme weather during the rotating outages and system event. It did not, however, have 18
an incremental impact on gas turbine availability. Hydro has a priority delivery contract, but 19
manages its requirements so as not to impact other liquid fuel deliveries. It also undertook 20
special efforts due to the short supply to secure 80,000 litres from the Canadian Coast Guard. 21
The gas turbine fuel storage practice has been to maintain conservative levels of 60% of tank 22
capacity to allow for plenty of room for fuel expansion, to increase the fuel inventory turnover, 23
and to minimize the potential for environmental spills. An 80 to 90% storage volume could 24
have been employed which would have allowed for longer operation without a delivery if 25
necessary. This may have moderately reduced the requirements for some of the rotating 26
outages if the gas turbines had been fully available during this period. It would not have had an 27
impact on the larger January 4 and 5, 2014 transmission/terminal station failure events. 28

1
2
3
4
5
6
7
NEWFOUNDLA
3.5 W
The follo
In more d
Newfoundlan
Owned
Owned
Owned
Owned
Total Owned
Purchased
Purchased
Purchased
Total Purchase
Total NLH Sys
Customer Ow
Corner Brook
Newfoundland
Newfoundland
Newfoundland
Total Custome
Total Island In
AND AND LABRADOR
Winter Gene
wing summa
detail, it is co
T
nd and Labrador Hy
Hy
Ho
Ga
Di
Hy
Co
W
ed
tem
wned
Pulp and Paper Hy
d Power Hy
d Power Ga
d Power Di
er Owned
nterconnected Sys
Generation
R HYDRO
ration Capa
arizes the to
Table 6
omposed of
Table 6: Isla
N
Low
ydro
ydroelectric 92
olyrood 46
as Turbine 10
esel 14
150
ydroelectric 78
o‐Generation 8
Wind
86
159
ydroelectric 99
ydroelectric 78
as Turbine 36
esel 5
21
stem 18
bility
otal installed
6: Island Inte
f the followin
nd Intercon
Net
Head
Nameplate
27.3 19.0
65.5
00.0
4.7
07.5 19.0
8.0
8.0
6.0 0.0
93.5 19.0
9.1
8.7
6.5
5.0
19.3 0.0
12.8 19.0
Low Supply
d capacity fo
erconnected
ng:
nected Syste
Hig
High Head
12.0 9
4
1
12.0 1
0.0
12.0 1
0.0 2
12.0 1
Firm (Dependa
y Adjustments
r the Island
System Sup
em Supply (D
Net Station
gh Head Service
958.3
465.5 24.5
100.0
14.7
538.5 24.5
78.0
8.0
0.0
86.0 0.0
624.5 24.5
99.1
78.7
36.5
5.0
219.3 0.0
843.8 24.5
ble)
Gene
Interconnec
pply
Detailed) Non‐
Gross
High Head
After Stn.
Service* Addit
958.3
490.0
100.0
14.7
1563.0 0
78.0 31
8.0 7
0.0 54
86.0 92
1649.0 92
99.1 22
78.7 18
36.5
5.0
219.3 40
1868.3 13
eration Availa
1
cted System
‐Firm
Net
tional Low Supply
927.3
465.5
100.0
14.7
0.0 1507.5
1.8 109.8
.0 15.0
4.0 54.0
2.8 178.8
2.8 1686.3
2.3 121.4
8.2 96.9
36.5
5.0
0.5 259.8
3.3 1946.1
To
ability
14
.
Gross
High Head
After Stn.
y Service
958.3
490.0
100.0
14.7
1563.0
109.8
15.0
54.0
178.8
1741.8
121.4
96.9
36.5
5.0
259.8
2001.6
otal

Generation Availability
NEWFOUNDLAND AND LABRADOR HYDRO 15
The net capabilities are primarily used for long term generation planning. For long term 1
planning purposes the more conservative Low Head capabilities are assumed. Short term 2
operational planning uses gross capabilities and these can vary between the Low Head and High 3
Head limits depending on actual reservoir conditions. 4
5
4 SEQUENCE OF EVENTS: RELEVANT TIME FRAME 6
4.1 Incident Review Process – January 2014 7
The review process of the sequence of events was carried out in a manner consistent with good 8
industry practice in terms of working towards determining a root cause and actionable steps for 9
the future. The methodology and detailed results are found in report Root Cause Investigation 10
of System Disturbances. 11
12
No generation asset was identified as having been a root cause of the January 4 and 5, 2014 13
transmission/terminal station failure events. The generation assets responded appropriately to 14
the faults occurring within the overall transmission system. The unavailability of some 15
generation assets or de‐rating of others did, however, contribute to the extent of some of the 16
rotating outages leading up to the system event and during the restoration efforts. 17
18
4.2 Preceding Events Associated with the January 2014 System Incident 19
Several generation asset issues, which are identified below, arose prior to and early in January 20
2014 that resulted in the need for rotating outages on January 2 and 3, 2014. They were also 21
present during the January 4 and 5, 2014 transmission/terminal station failure events, but they 22
were not initiating factors. Some of these are discussed in more detail in the Appendices to this 23
report. 24

Generation Availability
NEWFOUNDLAND AND LABRADOR HYDRO 16
DECEMBER 15, 2013
DATE EVENT COMMENT
December 15, 2013
Exploits River reduced to 38 MW
The Exploits River generation reduced due to frazil ice accumulation in the water channels leading into the Grand Falls generating station Limited success to clear the ice. Resolved on January 15, 2014.
DECEMBER 16, 2013
DATE EVENT COMMENT
December 16, 2013
Granite Canal reduced 8 MW to 32 MW
Reduced due to turbine axial vibration. No definitive cause identified (associated with extreme cold water and turbine ice accumulation). Further reviews are planned.
DECEMBER 21, 2013
DATE EVENT COMMENT
December 21, 2013
Hardwoods GT (50 MW) unavailable
Failure of a new fuel control valve. Service provider staff unavailable during holiday period. Restored to service on January 12, 2014
DECEMBER 23, 2013
DATE EVENT COMMENT
December 23, 2013
Stephenville GT de‐rated from 50 to 25 MW
Series of issues (initially asbestos pipe couplings, later B engine bearing failure) result in de‐rating through January 2‐ 8, 2014 period and beyond. Unit in service using vendor loaner engine for engine B at 40 MW.
DECEMBER 25, 2013
DATE EVENT COMMENT
December 25, 2013
Holyrood Unit 2 de‐rated 25 MW to 142 MW
Steam turbine valve issue. Inspections and repairs carried out. Keeping unit on‐ line (even in a de‐rated state was important). On‐line solution implemented January 3, 2014.
Generation Availability
NEWFOUNDLAND AND LABRADOR HYDRO 17
DECEMBER 26, 2013
DATE EVENT COMMENT
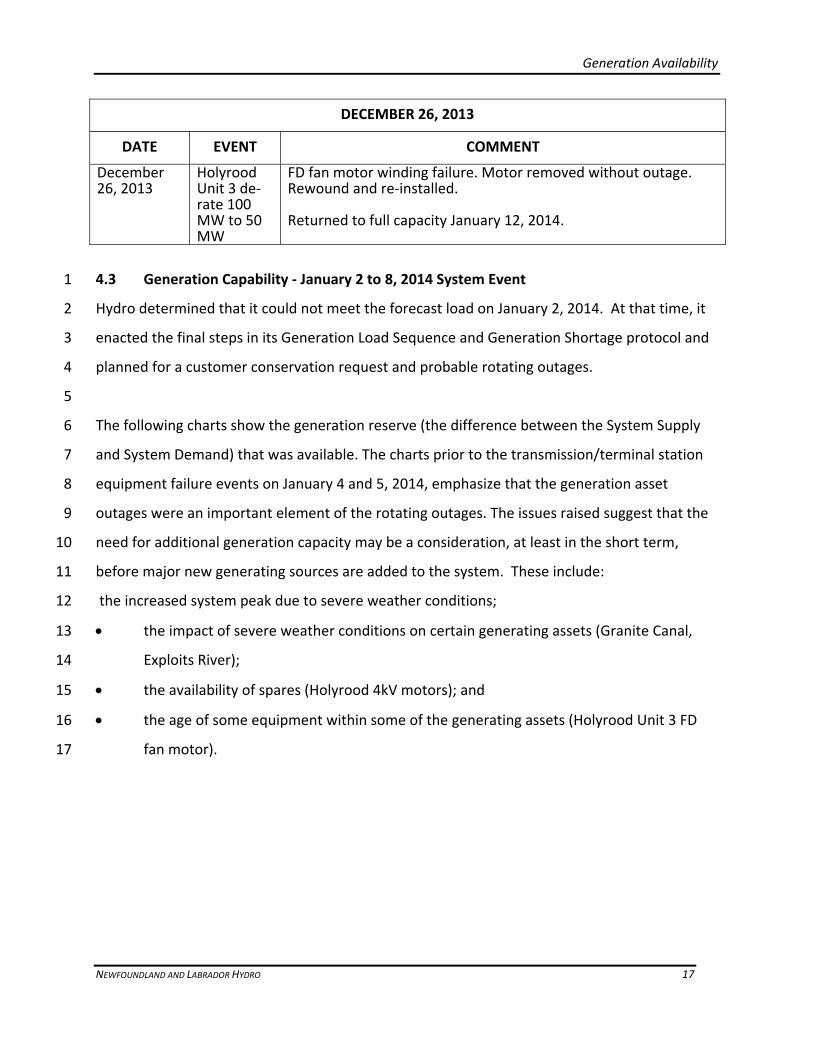
December 26, 2013
Holyrood Unit 3 de‐rate 100 MW to 50 MW
FD fan motor winding failure. Motor removed without outage. Rewound and re‐installed. Returned to full capacity January 12, 2014.
4.3 Generation Capability ‐ January 2 to 8, 2014 System Event 1
Hydro determined that it could not meet the forecast load on January 2, 2014. At that time, it 2
enacted the final steps in its Generation Load Sequence and Generation Shortage protocol and 3
planned for a customer conservation request and probable rotating outages. 4
5
The following charts show the generation reserve (the difference between the System Supply 6
and System Demand) that was available. The charts prior to the transmission/terminal station 7
equipment failure events on January 4 and 5, 2014, emphasize that the generation asset 8
outages were an important element of the rotating outages. The issues raised suggest that the 9
need for additional generation capacity may be a consideration, at least in the short term, 10
before major new generating sources are added to the system. These include: 11
the increased system peak due to severe weather conditions; 12
the impact of severe weather conditions on certain generating assets (Granite Canal, 13
Exploits River); 14
the availability of spares (Holyrood 4kV motors); and 15
the age of some equipment within some of the generating assets (Holyrood Unit 3 FD 16
fan motor). 17

Generation Availability
NEWFOUNDLAND AND LABRADOR HYDRO 18
Figure 3: Hydro System Supply & Demand – January 2, 2014
JANUARY 3, 2014
DATE EVENT COMMENT
January 3, 2014
Wind Turbine Out of Service of 54 MW
Wind turbine generators tripped due to high winds and transmission system conditions. Required manual reset. High winds and site access delayed restart. Returned to service January 6 to 8, 2014.

Generation Availability
NEWFOUNDLAND AND LABRADOR HYDRO 19
Figure 4: Hydro System Supply & Demand – January 3, 2014 1
2
The following charts show the system reserve on January 4 and January 5, 2014 during the 3
system incident. The chart for January 4, 2014 shows the reducing reserve early in the morning 4
up to the first system disruption. The January 5, 2014 chart shows that the reserve varied 5
between a minimum of 30 MW at 0830 hours to a maximum of 438 MW following the 6
separation of the east and west systems at 21:27 hours with the disturbance on the power 7
system that originated at the Holyrood Terminal Station. The increased reserve immediately 8
following the disturbance up to the end of the day was a result of the time required to restore 9
generating equipment, transmission equipment and customer load. In particular, due to the 10
limitations in transmission line power transfer capability serving the Avalon Peninsula, 11
customer load could not be completely restored until generating equipment at Holyrood and 12
transmission lines were restored over the next several hours. 13

Generation Availability
NEWFOUNDLAND AND LABRADOR HYDRO 20
Figure 5: Hydro System Supply & Demand – January 4, 2014
Figure 6: Hydro System Supply & Demand – January 5, 2014

Generation Availability
NEWFOUNDLAND AND LABRADOR HYDRO 21
The charts show the recovery of both the system supply and loads in the January 6 to 8, 2014 1
period. 2
3
Figure 7: Hydro System and Demand – January 6, 2014
Figure 8: Hydro System Supply and Demand – January 8, 2014
Generation Availability
NEWFOUNDLAND AND LABRADOR HYDRO 22
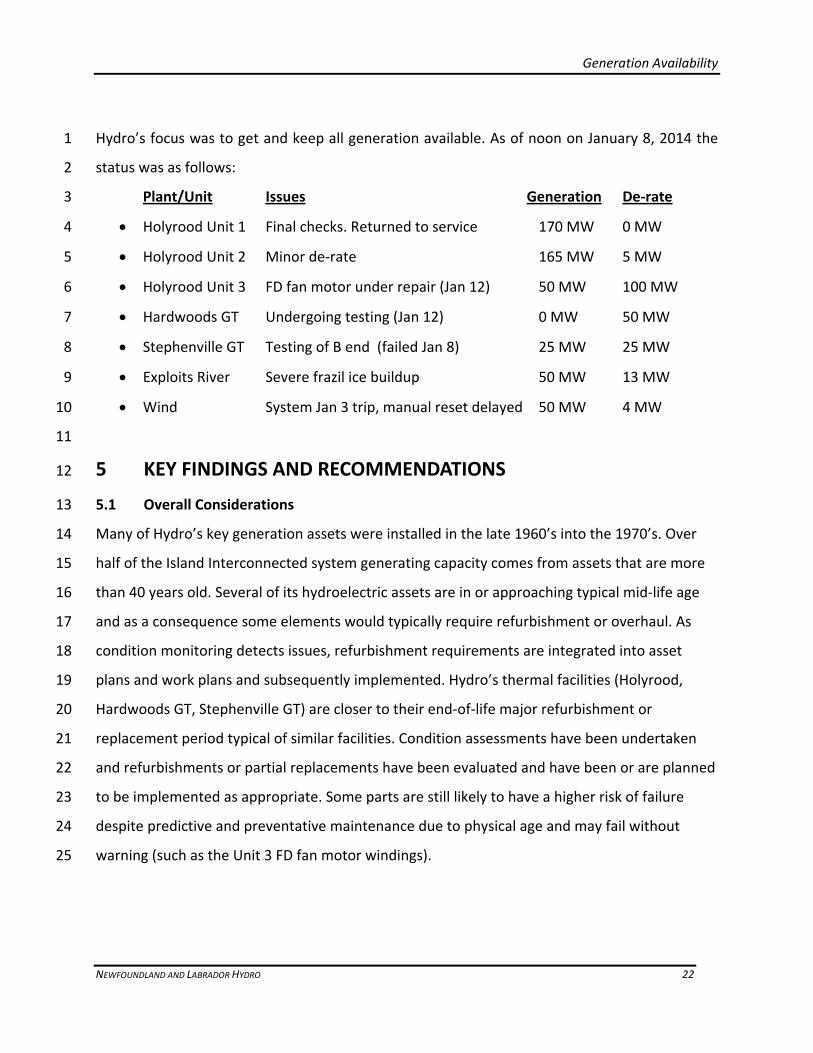
Hydro’s focus was to get and keep all generation available. As of noon on January 8, 2014 the 1
status was as follows: 2
Plant/Unit Issues Generation De‐rate 3
Holyrood Unit 1 Final checks. Returned to service 170 MW 0 MW 4
Holyrood Unit 2 Minor de‐rate 165 MW 5 MW 5
Holyrood Unit 3 FD fan motor under repair (Jan 12) 50 MW 100 MW 6
Hardwoods GT Undergoing testing (Jan 12) 0 MW 50 MW 7
Stephenville GT Testing of B end (failed Jan 8) 25 MW 25 MW 8
Exploits River Severe frazil ice buildup 50 MW 13 MW 9
Wind System Jan 3 trip, manual reset delayed 50 MW 4 MW 10
11
5 KEY FINDINGS AND RECOMMENDATIONS 12
5.1 Overall Considerations 13
Many of Hydro’s key generation assets were installed in the late 1960’s into the 1970’s. Over 14
half of the Island Interconnected system generating capacity comes from assets that are more 15
than 40 years old. Several of its hydroelectric assets are in or approaching typical mid‐life age 16
and as a consequence some elements would typically require refurbishment or overhaul. As 17
condition monitoring detects issues, refurbishment requirements are integrated into asset 18
plans and work plans and subsequently implemented. Hydro’s thermal facilities (Holyrood, 19
Hardwoods GT, Stephenville GT) are closer to their end‐of‐life major refurbishment or 20
replacement period typical of similar facilities. Condition assessments have been undertaken 21
and refurbishments or partial replacements have been evaluated and have been or are planned 22
to be implemented as appropriate. Some parts are still likely to have a higher risk of failure 23
despite predictive and preventative maintenance due to physical age and may fail without 24
warning (such as the Unit 3 FD fan motor windings). 25
Generation Availability
NEWFOUNDLAND AND LABRADOR HYDRO 23
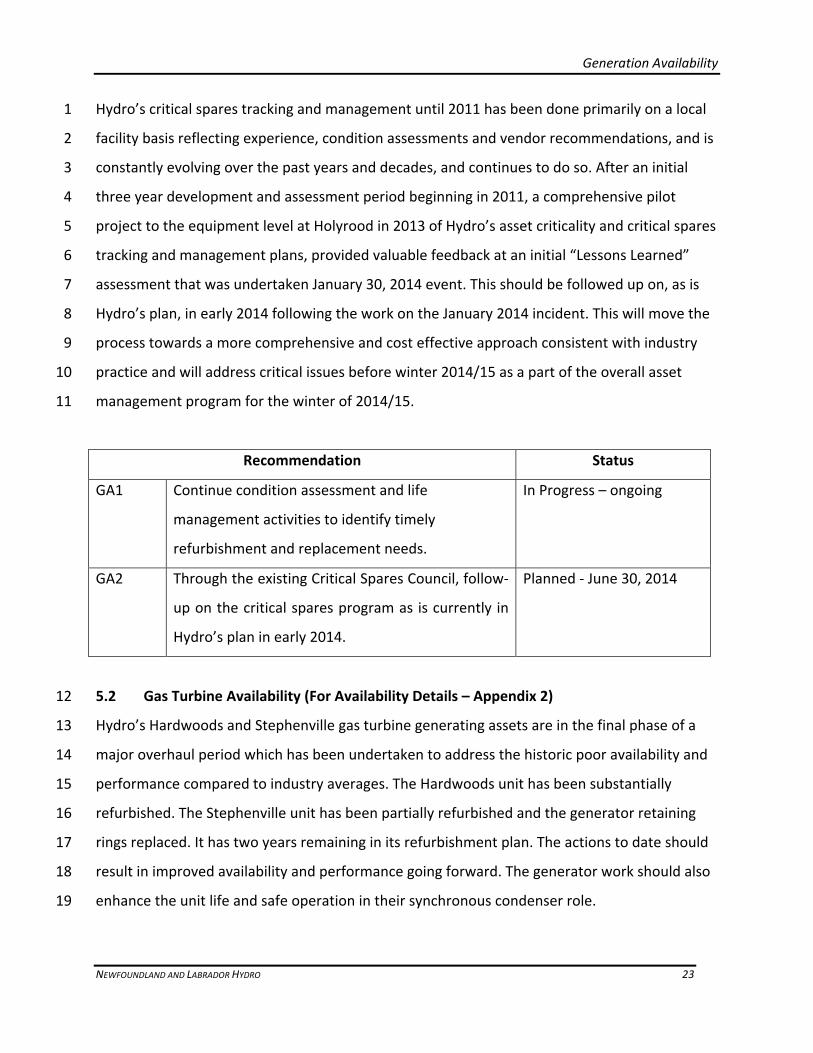
Hydro’s critical spares tracking and management until 2011 has been done primarily on a local 1
facility basis reflecting experience, condition assessments and vendor recommendations, and is 2
constantly evolving over the past years and decades, and continues to do so. After an initial 3
three year development and assessment period beginning in 2011, a comprehensive pilot 4
project to the equipment level at Holyrood in 2013 of Hydro’s asset criticality and critical spares 5
tracking and management plans, provided valuable feedback at an initial “Lessons Learned” 6
assessment that was undertaken January 30, 2014 event. This should be followed up on, as is 7
Hydro’s plan, in early 2014 following the work on the January 2014 incident. This will move the 8
process towards a more comprehensive and cost effective approach consistent with industry 9
practice and will address critical issues before winter 2014/15 as a part of the overall asset 10
management program for the winter of 2014/15. 11
Recommendation Status
GA1 Continue condition assessment and life
management activities to identify timely
refurbishment and replacement needs.
In Progress – ongoing
GA2 Through the existing Critical Spares Council, follow‐
up on the critical spares program as is currently in
Hydro’s plan in early 2014.
Planned ‐ June 30, 2014
5.2 Gas Turbine Availability (For Availability Details – Appendix 2) 12
Hydro’s Hardwoods and Stephenville gas turbine generating assets are in the final phase of a 13
major overhaul period which has been undertaken to address the historic poor availability and 14
performance compared to industry averages. The Hardwoods unit has been substantially 15
refurbished. The Stephenville unit has been partially refurbished and the generator retaining 16
rings replaced. It has two years remaining in its refurbishment plan. The actions to date should 17
result in improved availability and performance going forward. The generator work should also 18
enhance the unit life and safe operation in their synchronous condenser role. 19

Generation Availability
NEWFOUNDLAND AND LABRADOR HYDRO 24
Hardwoods and Stephenville gas turbines were unavailable or de‐rated during the January 2 to 1
8, 2014 system event due to issues identified late in major planned generator refurbishments 2
(Hardwoods fuel valve failure; Stephenville B end replacement of deteriorated asbestos pipe 3
couplings and deteriorated insulating blankets). There was a subsequent Stephenville B engine 4
failure on January 8, 2014. Their unavailability contributed to the size and duration of the 5
rotating outages in the period between January 2 and 4, 2014 and during system restoration 6
attempts between January 4 and January 8, 2014. 7
8
The unavailability or de‐rating of the Hardwoods and Stephenville gas turbines were not a 9
causal factor in, nor would their operation have mitigated, the January 4 to 5, 2014 10
transmission/terminal station failure events. 11
12
Hydro has a priority contract in place for its gas turbine fuel delivery, but managed its demands 13
to minimize the delivery impacts on other liquid fuel users. Hydro’s gas turbine fuel inventory 14
levels were maintained below maximum available storage levels. 15
Recommendation Status
GA3 Review the maintenance tactics of the Hardwoods
and Stephenville gas turbines.
In Progress ‐ Units
refurbished. May 30, 2014
GA4 Assess the impacts of increasing the frequency of
starting and running the GT’s prior to severe
weather to allow time to identify and correct
issues.
In Progress – May 30, 2014
GA5 Identify repeat failure events on the GT units and
address the root causes.
In Progress – Aug 30, 2014
GA6 Continue to review actual work completed on
recent overhauls. Identify and plan for additional
GT balance of plant equipment refurbishment not
completed.
In Progress – April 30, 2014
GA7 Complete review of GT site fuel storage operating
requirements, processes and procedures.
In Progress ‐ April 30, 2014
Generation Availability
NEWFOUNDLAND AND LABRADOR HYDRO 25
5.3 Holyrood Availability (For Availability Details – Appendix 3)1
Hydro’s Holyrood thermal generating station assets availability and performance up to 2013 are 2
consistent with industry averages. Its 2013 availability and performance was significantly 3
poorer due to the time required to repair Unit 1 after it was damaged during tripping in the 4
January 2013 extreme weather event and an extended planned outage on Unit 3 for some 5
equipment replacements. 6
7
Hydro’s Holyrood generating assets’ availability and performance did not contribute to the 8
initiation or duration of the January 4 to 5, 2014 transmission/terminal station failure events. 9
They responded as they should have to the initial transmission system failures when the system 10
separated the large hydroelectric supply in the west from the large load in the east. The 11
Holyrood units could not sustain the load and so they tripped off. They were returned to service 12
as the system was restored. 13
14
Holyrood Unit 1’s first re‐start was delayed due to turbine vibration issues related to the 15
thermal shock of the trip and the pace at which it was re‐started, as well as to remaining issues 16
from the January 2013 failure trip and repairs. This was resolved by employing a slower, staged 17
start‐up approach. 18
19
Hydro’s Holyrood generating assets unavailability and/or de‐ratings did contribute to the 20
number and/or duration of the rotating outages between January 2 to 4, 2014 and during the 21
system restoration activities between January 4 to 8, 2014. The rotating outage impacts in the 22
period January 6 to 8, 2014, were largely due to Unit 1 which was available to generate but 23
unable to connect to the System due to a terminal station breaker issue. If some or all of the 24
following had been avoided or resolved more quickly, some of the rotating outages might have 25
been avoided or reduced: 26
Holyrood Unit 3 was de‐rated from 150 MW to about 50 MW from December 26, 2013 27
to January 12, 2014 due to an FD fan motor winding failure 28

Generation Availability
NEWFOUNDLAND AND LABRADOR HYDRO 26
Holyrood Unit 2 had a steam turbine valve issue and was de‐rated 25 MW to 142 MW 1
from December 25, 2013 to January 2, 2014, when inspections and repairs were made. 2
Keeping the unit on line even in a de‐rated state was important and delayed the de‐rate 3
recovery until January 2, 2013. 4
5
Holyrood’s 4 kV motors are subject to physical and operational aging and the station has no 6
spare 4 kV motors. Although the motors were removed, repaired and re‐installed expeditiously, 7
the potential impact during repairs on available capacity is significant. The Unit 3 FD fan motor 8
windings failure contributed significantly to the duration and extent of some of the rotating 9
outages. 10
Recommendation Status
GA8 Investigate improvements to Holyrood Unit 1
steam turbine generator to prevent future
vibration issues and reduce starting times.
In Progress (May 30, 2014)
GA9 Review in early 2014 the cost‐benefit analysis of
one or more spare 4 kV motors for Holyrood.
In Progress (May 1, 2014)
11
5.4 Hydro Generation Availability (For Availability Details – Appendix 4)12
Hydro’s hydroelectric generating assets availability and performance up to 2013 are consistent 13
with or better than industry averages. 14
15
Hydro’s hydroelectric generating assets availability and performance did not contribute to the 16
initiation or duration of the January 4 to 5, 2014 transmission/terminal station failure events. 17
Hydroelectric generating facility unavailability and/or de‐ratings did contribute to the number 18
and/or duration of the rotating outages between January 2 to 4, 2014 and during the system 19
restoration January 4 to 8, 2014. 20
Generation Availability
NEWFOUNDLAND AND LABRADOR HYDRO 27
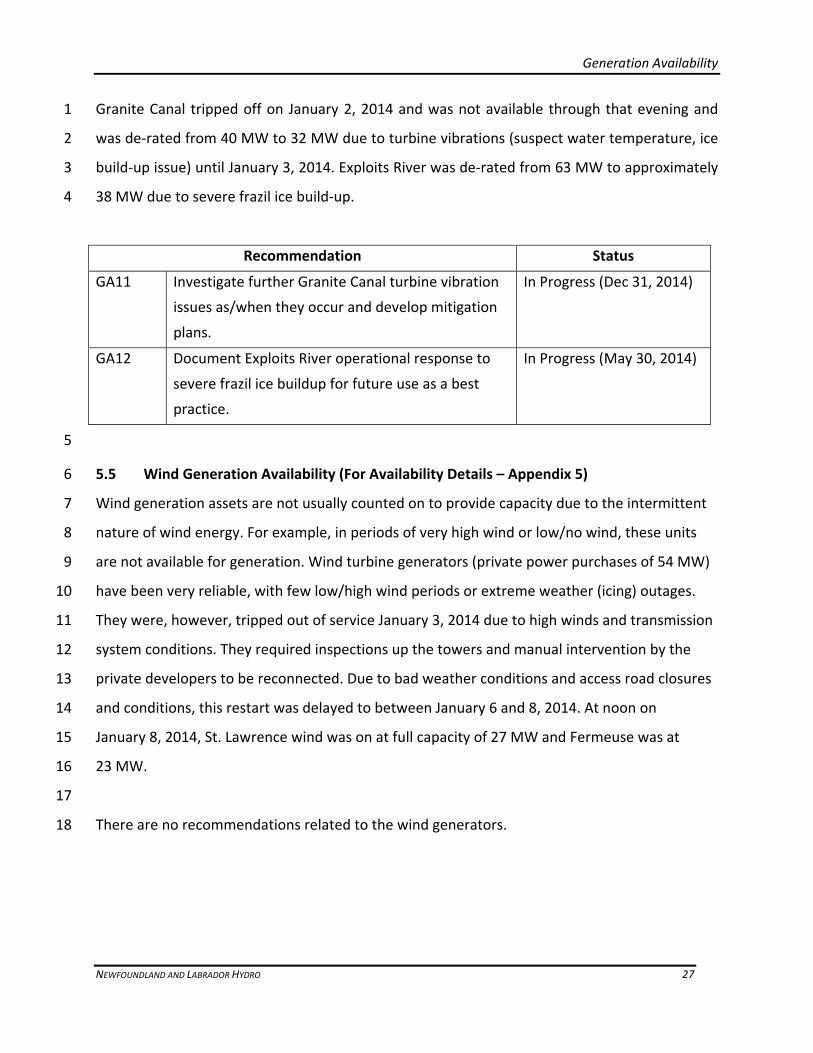
Granite Canal tripped off on January 2, 2014 and was not available through that evening and 1
was de‐rated from 40 MW to 32 MW due to turbine vibrations (suspect water temperature, ice 2
build‐up issue) until January 3, 2014. Exploits River was de‐rated from 63 MW to approximately 3
38 MW due to severe frazil ice build‐up. 4
Recommendation Status
GA11 Investigate further Granite Canal turbine vibration
issues as/when they occur and develop mitigation
plans.
In Progress (Dec 31, 2014)
GA12 Document Exploits River operational response to
severe frazil ice buildup for future use as a best
practice.
In Progress (May 30, 2014)
5
5.5 Wind Generation Availability (For Availability Details – Appendix 5) 6
Wind generation assets are not usually counted on to provide capacity due to the intermittent 7
nature of wind energy. For example, in periods of very high wind or low/no wind, these units 8
are not available for generation. Wind turbine generators (private power purchases of 54 MW) 9
have been very reliable, with few low/high wind periods or extreme weather (icing) outages. 10
They were, however, tripped out of service January 3, 2014 due to high winds and transmission 11
system conditions. They required inspections up the towers and manual intervention by the 12
private developers to be reconnected. Due to bad weather conditions and access road closures 13
and conditions, this restart was delayed to between January 6 and 8, 2014. At noon on 14
January 8, 2014, St. Lawrence wind was on at full capacity of 27 MW and Fermeuse was at 15
23 MW. 16
17
There are no recommendations related to the wind generators. 18

Generation Availability
NEWFOUNDLAND AND LABRADOR HYDRO 28
ACRONYMS 1
AC Asset Criticality 2
AM Asset Management 3
BDE Bay d’Espoir 4
BOD Board of Directors 5
CBC Come‐By‐Chance 6
CBPP Corner Brook Pulp & Paper 7
CEA Canadian Electricity Association 8
CEO Chief Executive Officer 9
CM Corrective Maintenance 10
CS Critical Spares 11
EPRI Electric Power Research Institute 12
FD Forced Draft 13
GS Generating Station 14
GT Gas Turbine 15
HRD/HTGS Holyrood Thermal Generating Station 16
JDE JD Edwards 17
OEM Original Equipment Manufacturer 18
NLH Newfoundland and Labrador Hydro 19
P&P Pulp and Paper 20
PM Preventive Maintenance 21
PUB Board of Commissioners of Public Utilities 22
SOE Sequence of Events 23
SSD Sunnyside Terminal Station 24
T&D Transmission and Distribution 25
TS Terminal Station 26
WAV Western Avalon Terminal Station27

Generation Availability
Appendices
Appendix 1, Page 1 of 11
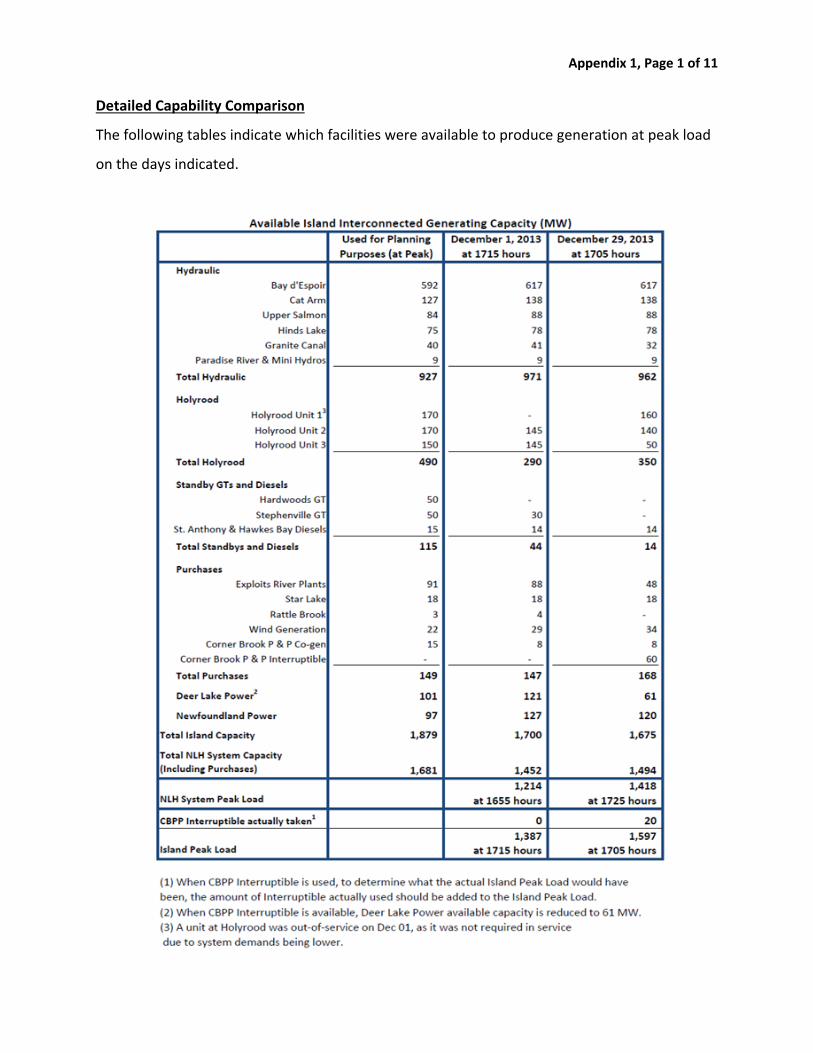
Detailed Capability Comparison
The following tables indicate which facilities were available to produce generation at peak load
on the days indicated.
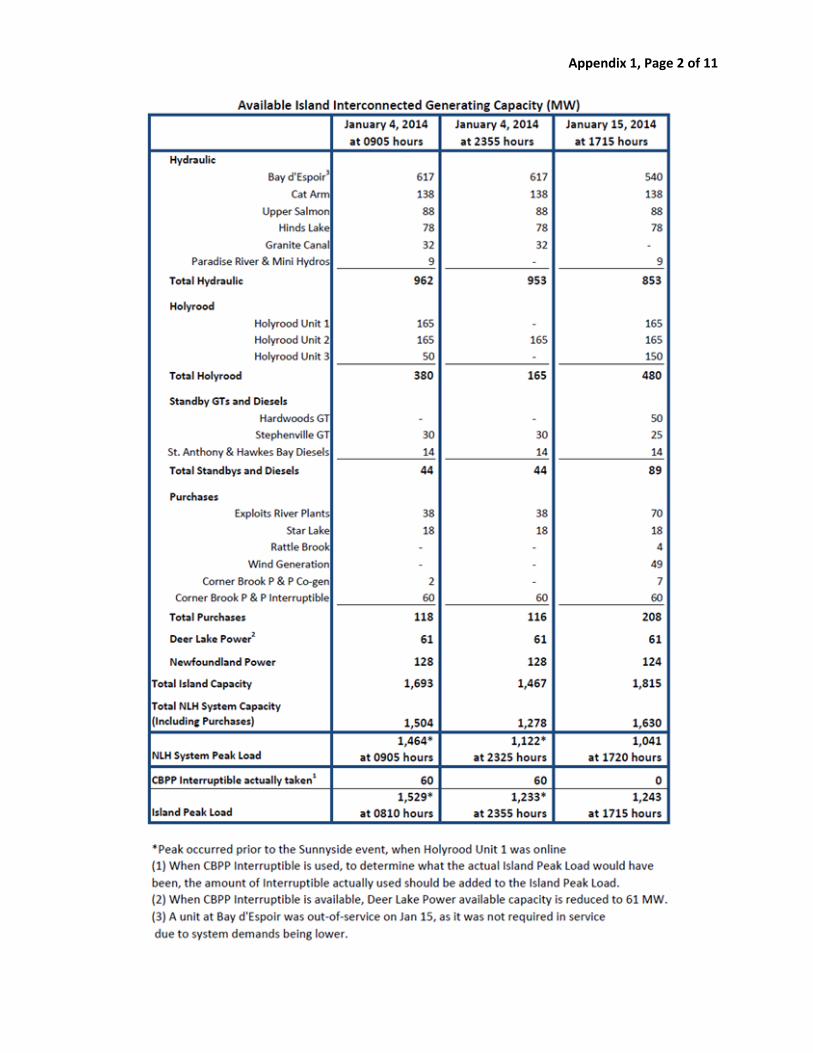
Appendix 1, Page 2 of 11
Appendix 1, Page 3 of 11
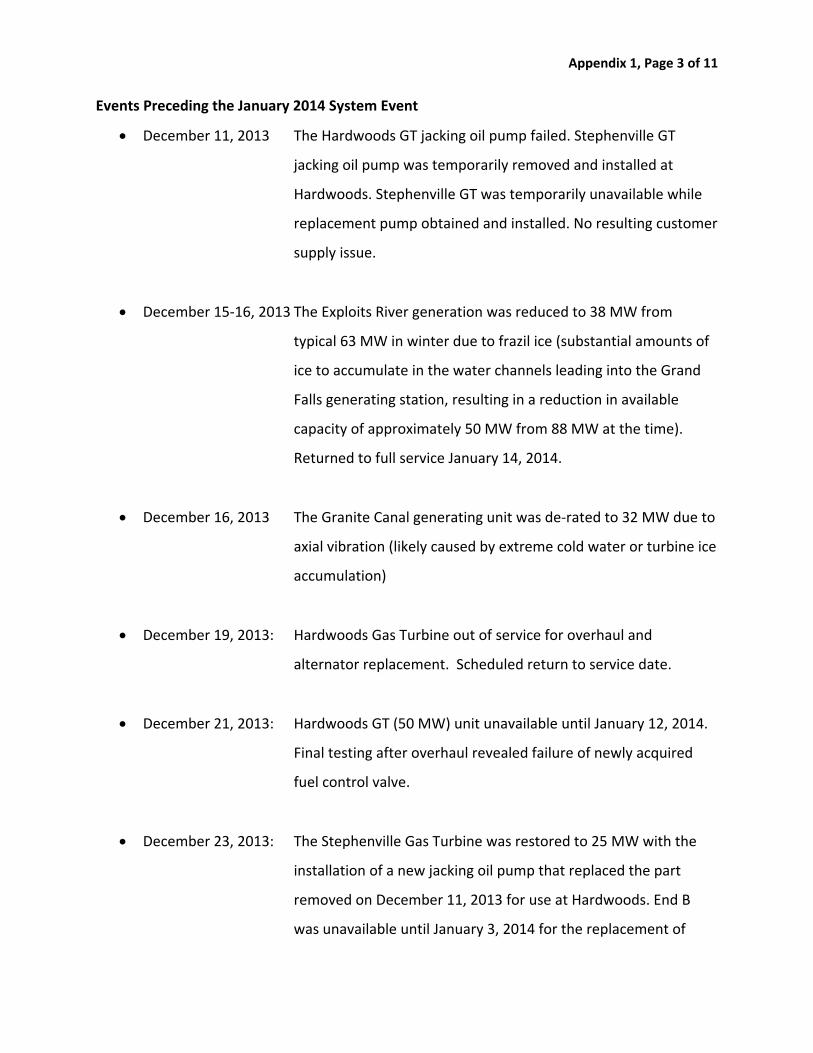
Events Preceding the January 2014 System Event
December 11, 2013 The Hardwoods GT jacking oil pump failed. Stephenville GT
jacking oil pump was temporarily removed and installed at
Hardwoods. Stephenville GT was temporarily unavailable while
replacement pump obtained and installed. No resulting customer
supply issue.
December 15‐16, 2013 The Exploits River generation was reduced to 38 MW from
typical 63 MW in winter due to frazil ice (substantial amounts of
ice to accumulate in the water channels leading into the Grand
Falls generating station, resulting in a reduction in available
capacity of approximately 50 MW from 88 MW at the time).
Returned to full service January 14, 2014.
December 16, 2013 The Granite Canal generating unit was de‐rated to 32 MW due to
axial vibration (likely caused by extreme cold water or turbine ice
accumulation)
December 19, 2013: Hardwoods Gas Turbine out of service for overhaul and
alternator replacement. Scheduled return to service date.
December 21, 2013: Hardwoods GT (50 MW) unit unavailable until January 12, 2014.
Final testing after overhaul revealed failure of newly acquired
fuel control valve.
December 23, 2013: The Stephenville Gas Turbine was restored to 25 MW with the
installation of a new jacking oil pump that replaced the part
removed on December 11, 2013 for use at Hardwoods. End B
was unavailable until January 3, 2014 for the replacement of
Appendix 1, Page 4 of 11
deteriorated asbestos pipe couplings. The recovery of the
remaining 25 MW capacity was pending the delivery and
installation of new insulating blankets, scheduled for early
January, but on January 5, 2014, it was determined that colder
ambient temperatures would allow for increased output without
the blankets. On January 8, 2014, the B end of gas turbine failed
and tripped reducing the output of the machine to 25 MW. (See
Appendix 2 for more detail.)
December 25, 2013: Holyrood Unit 2 was de‐rated by 25 MW, to 142 MW due to a
control valve issues. Careful assessment required to recover lost
capacity without removing unit from service and delayed the de‐
rate recovery until about January 2, 2014.
December 26, 2013: A Holyrood Unit 3 forced draft fan motor failure resulted in a 100
MW de‐rating to approximately 50 MW from 150 M. The motor
was removed over the next two days, without requiring Unit 3 to
be taken out of service. It was repaired in St. John’s and returned
to service January 12, 2014.
December 26, 2013: Minor de‐rate of Granite Canal (Corrected Jan 2, 2014).
The following tables provide an account of the events and actions each day related to
generation leading up to the rotating outages on January 2, 2014. They also identify where
discussions on the Generation Loading Sequence and Shortage Protocol were held.

Appendix 1, Page 5 of 11
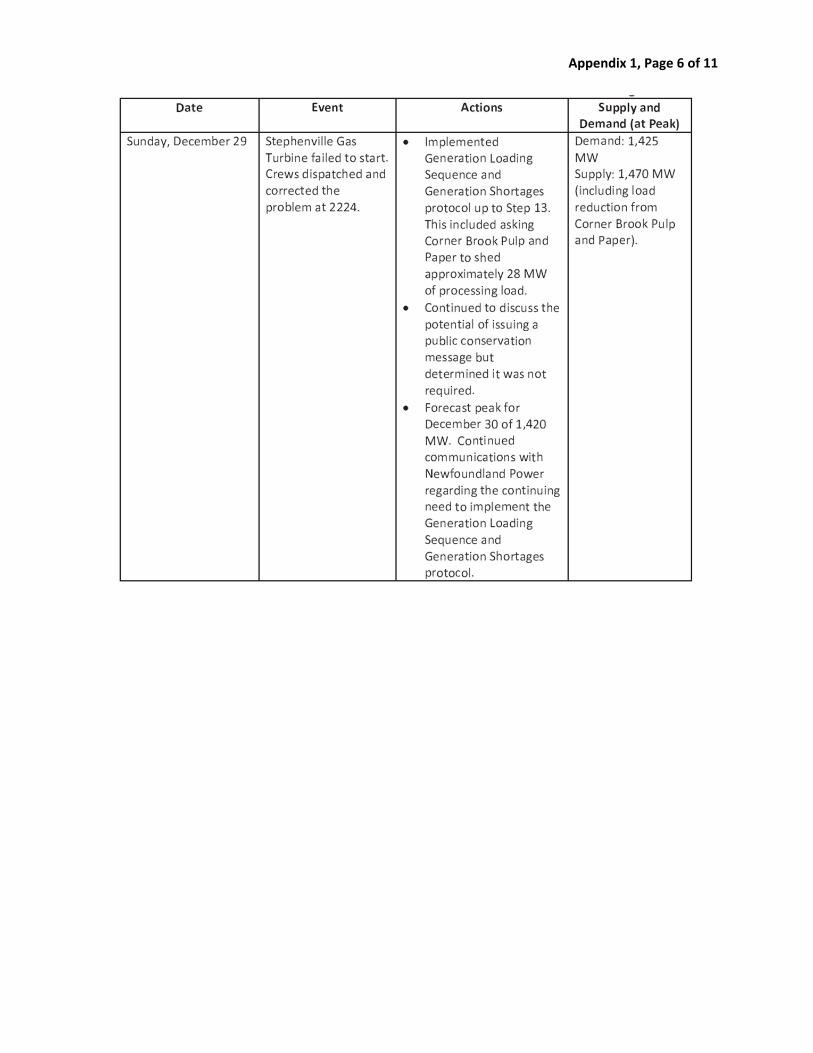
Appendix 1, Page 6 of 11

Appendix 1, Page 7 of 11

Appendix 1, Page 8 of 11
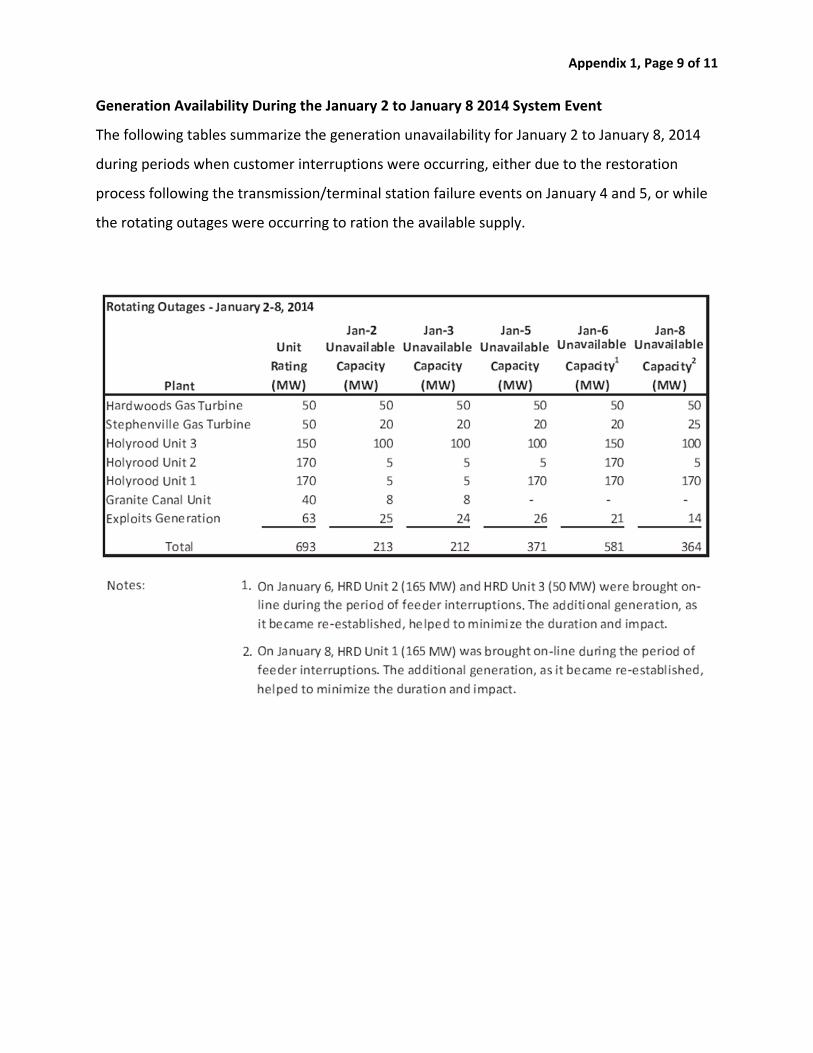
Appendix 1, Page 9 of 11
Generation Availability During the January 2 to January 8 2014 System Event
The following tables summarize the generation unavailability for January 2 to January 8, 2014
during periods when customer interruptions were occurring, either due to the restoration
process following the transmission/terminal station failure events on January 4 and 5, or while
the rotating outages were occurring to ration the available supply.
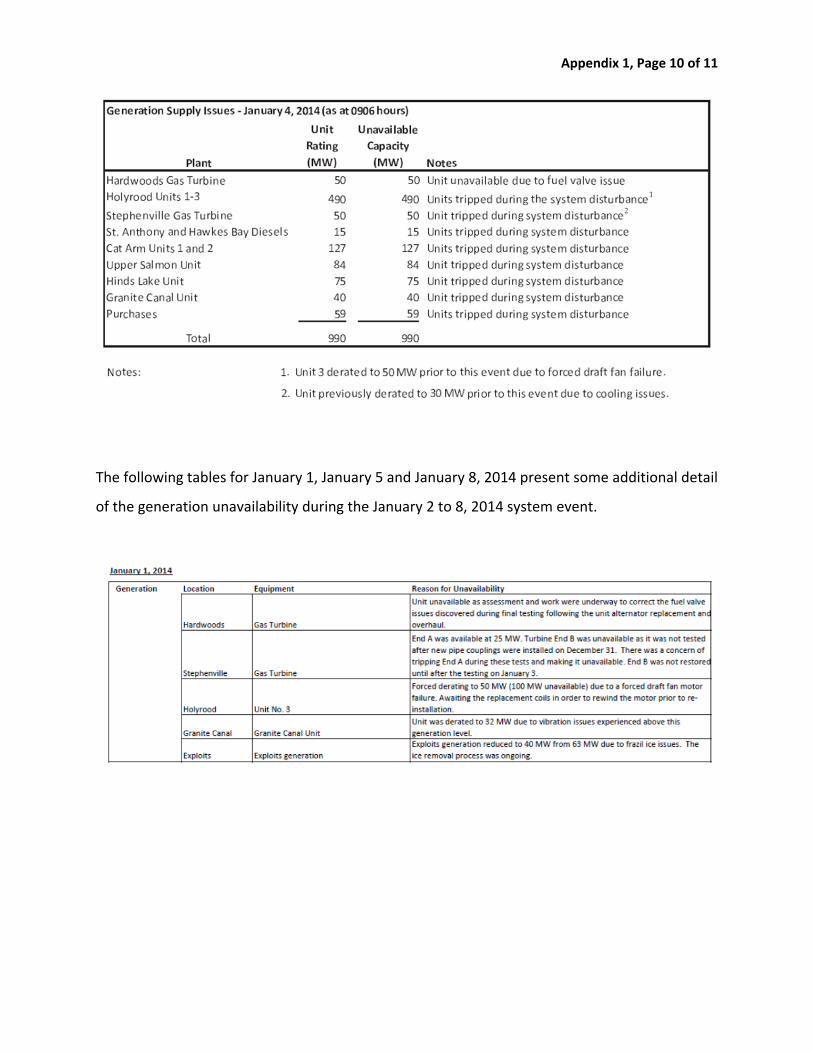
Appendix 1, Page 10 of 11
The following tables for January 1, January 5 and January 8, 2014 present some additional detail
of the generation unavailability during the January 2 to 8, 2014 system event.

Appendix 1, Page 11 of 11
Generation Availability after the January 2014 System Event
The following table for January 15, 2014 presents a picture of generation availability after the
January 2 to January 8, 2014 system event.
Appendix 2, Page 1 of 8
Details – Gas Turbine Availability
Hardwoods Gas Turbine
Plant Information
The 50 MW Hardwoods gas turbine installation, located in the St. John’s area, is operated as a
synchronous condenser for voltage support of the transmission system on the Avalon
Peninsula, and to generate power under system peak and Avalon Peninsula
emergency/contingency conditions. The unit is also utilized to enable efficient loading and
dispatch of the Holyrood Thermal Generating Station by being available to respond to a
contingency which would otherwise have to be provided by having an additional unit operating
at Holyrood at inefficient loads.1
The Hardwoods gas turbine was installed in 1977 and has been in‐service for about 37 years.
Between 1993 and 2013, the unit operated in generating mode an average of 69 hours per year
(1456 hours over the period) and in synchronous condensing mode an average of 3,057 hours
per year (64,196 hours over the period).
In 2007‐2008, Hydro hired Stantec consulting engineers to undertake a condition assessment of
the Hardwoods and Stephenville gas turbines. Given their age, a number of issues were
identified and a four‐ year refurbishment program was identified. Hardwoods refurbishment
was initiated in 2010 for completion in 2013. Some balance of plant work may not have been
completed due to resources (i.e. junction boxes and wiring termination replacement/upgrade
due to possible corrosion issues).
Gas Turbine Incident Availability
In January 2013, it was determined that the Hardwoods unit should be operated in emergency
1 The Holyrood generating units cannot be quickly turned on and off like gas turbine units to respond to a system problem. Therefore, to provide the same response as a gas turbine, a Holyrood unit must be placed on line and operated at its minimum output level of 70 MW in order to be available to quickly respond to a problem. As problems are unpredictable, this would result in a Holyrood unit being on for many days consuming large amounts of fuel when there would otherwise be no requirement for the unit to operate.
Appendix 2, Page 2 of 8
conditions only. This restriction was based on the recommendations from Brush GMS (Brush),
the alternator original equipment manufacturer (OEM), due to conditions identified during an
inspection of its sister unit in Stephenville in 2012. During this inspection, it was discovered
that the rotor retaining rings on the Stephenville unit had cracks that could have led to a
catastrophic failure of the unit if it had continued to operate. Based on these findings, and the
fact that the Hardwoods and Stephenville alternators were both installed in 1976‐77, in service
for over 35 years and have never had the rotor retaining rings replaced, Brush recommended
that the Hardwoods unit be restricted to run only in emergency conditions until a
repair/refurbishment of the unit (including replacement of the retaining rings) could be carried
out.
This unforeseen repair caused Hydro to re‐evaluate its 2013 planned generation outage
schedule. Project planning proceeded with the evaluation of the available options for the
repair/refurbishment of the Hardwoods unit. After considering the options, it was decided that
the most cost efficient and optimal approach was to replace the alternator. The earliest project
implementation start date was October 1, 2013, even with aggressive expedited delivery of the
replacement alternator from Brush, and involved a 2.5 month outage to the unit.
Hydro also considered the operating forecast for December 2013 which indicated at the time
that there were appropriate reserves on the system to accommodate the outage and still meet
forecast demand. Furthermore, once this outage window for Hardwoods was set, Hydro
considered the unavailability of this unit in the scheduling and outage planning of the remaining
generation to continue to provide for safe and reliable operation of the power system. It has
been past practise, if required, to allow a generation outage to extend into December if the
operating load forecast can accommodate it.
Hydro submitted an application to the PUB on April 24, 2013 for the approval of the
recommended least cost option which was subsequently approved in May 2013.
Appendix 2, Page 3 of 8
The scope of work for the alternator replacement was significant including:
An asphalt crane pad for removal and installation of the alternator assemblies;
Relocation of the main lube oil cooler to allow crane access;
Disassembly of the alternator enclosure, air treatment system and stator canopy;
Disconnection of all auxiliary systems ‐ electrical, mechanical, and fire protection;
Removal of existing alternator and site assembly of new alternator (rotor and stator);
Installation and alignment of the new alternator in the enclosure;
Reassembly of the alternator enclosure;
Reconnection of auxiliary systems and recertification of the fire protection system; and
Commissioning.
The outage began on October 3, 2013, once Holyrood Unit 2 was in full operation. Work
proceeded on a six day per week, ten hour per day schedule and the unit was placed on‐ line
for testing on December 17, 2013. The unit tested successfully to full load (50 MW) on
December 19, 2013. However, during run‐up tests for remote operation on December 20, 2013
there was an unexpected failure of a fuel control valve that made the unit unavailable again.
Given the holiday period and the unavailability of the required vendor equipment and service
expert, repairs on the Hardwoods gas turbine were delayed and the unit was not restored to
full service until January 12, 2014.
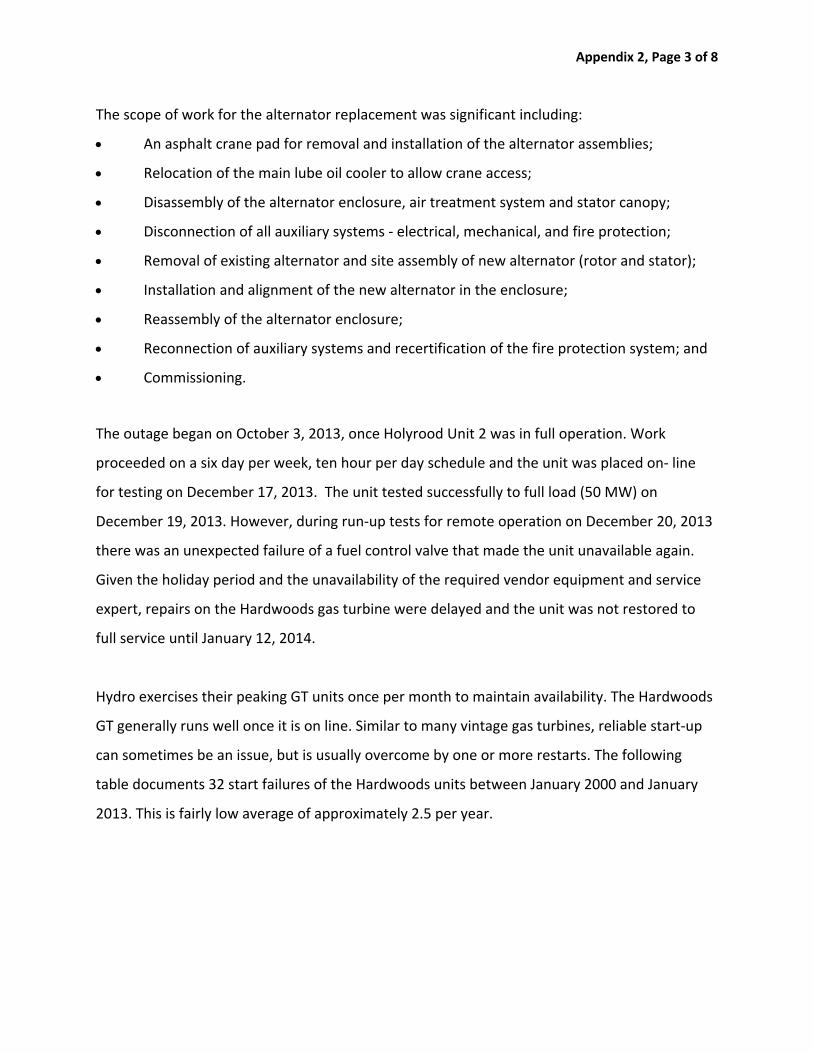
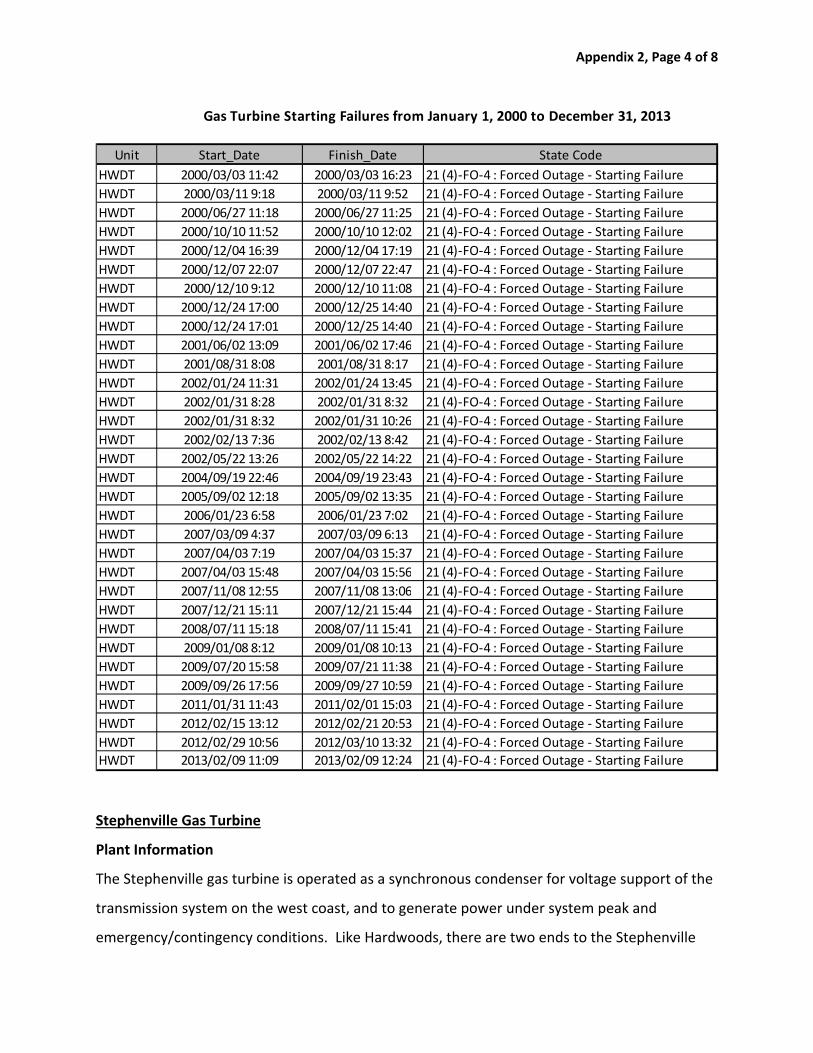
Hydro exercises their peaking GT units once per month to maintain availability. The Hardwoods
GT generally runs well once it is on line. Similar to many vintage gas turbines, reliable start‐up
can sometimes be an issue, but is usually overcome by one or more restarts. The following
table documents 32 start failures of the Hardwoods units between January 2000 and January
2013. This is fairly low average of approximately 2.5 per year.
Appendix 2, Page 4 of 8
Stephenville Gas Turbine
Plant Information
The Stephenville gas turbine is operated as a synchronous condenser for voltage support of the
transmission system on the west coast, and to generate power under system peak and
emergency/contingency conditions. Like Hardwoods, there are two ends to the Stephenville
Unit Start_Date Finish_Date State Code
HWDT 2000/03/03 11:42 2000/03/03 16:23 21 (4)‐FO‐4 : Forced Outage ‐ Starting Failure
HWDT 2000/03/11 9:18 2000/03/11 9:52 21 (4)‐FO‐4 : Forced Outage ‐ Starting Failure
HWDT 2000/06/27 11:18 2000/06/27 11:25 21 (4)‐FO‐4 : Forced Outage ‐ Starting Failure
HWDT 2000/10/10 11:52 2000/10/10 12:02 21 (4)‐FO‐4 : Forced Outage ‐ Starting Failure
HWDT 2000/12/04 16:39 2000/12/04 17:19 21 (4)‐FO‐4 : Forced Outage ‐ Starting Failure
HWDT 2000/12/07 22:07 2000/12/07 22:47 21 (4)‐FO‐4 : Forced Outage ‐ Starting Failure
HWDT 2000/12/10 9:12 2000/12/10 11:08 21 (4)‐FO‐4 : Forced Outage ‐ Starting Failure
HWDT 2000/12/24 17:00 2000/12/25 14:40 21 (4)‐FO‐4 : Forced Outage ‐ Starting Failure
HWDT 2000/12/24 17:01 2000/12/25 14:40 21 (4)‐FO‐4 : Forced Outage ‐ Starting Failure
HWDT 2001/06/02 13:09 2001/06/02 17:46 21 (4)‐FO‐4 : Forced Outage ‐ Starting Failure
HWDT 2001/08/31 8:08 2001/08/31 8:17 21 (4)‐FO‐4 : Forced Outage ‐ Starting Failure
HWDT 2002/01/24 11:31 2002/01/24 13:45 21 (4)‐FO‐4 : Forced Outage ‐ Starting Failure
HWDT 2002/01/31 8:28 2002/01/31 8:32 21 (4)‐FO‐4 : Forced Outage ‐ Starting Failure
HWDT 2002/01/31 8:32 2002/01/31 10:26 21 (4)‐FO‐4 : Forced Outage ‐ Starting Failure
HWDT 2002/02/13 7:36 2002/02/13 8:42 21 (4)‐FO‐4 : Forced Outage ‐ Starting Failure
HWDT 2002/05/22 13:26 2002/05/22 14:22 21 (4)‐FO‐4 : Forced Outage ‐ Starting Failure
HWDT 2004/09/19 22:46 2004/09/19 23:43 21 (4)‐FO‐4 : Forced Outage ‐ Starting Failure
HWDT 2005/09/02 12:18 2005/09/02 13:35 21 (4)‐FO‐4 : Forced Outage ‐ Starting Failure
HWDT 2006/01/23 6:58 2006/01/23 7:02 21 (4)‐FO‐4 : Forced Outage ‐ Starting Failure
HWDT 2007/03/09 4:37 2007/03/09 6:13 21 (4)‐FO‐4 : Forced Outage ‐ Starting Failure
HWDT 2007/04/03 7:19 2007/04/03 15:37 21 (4)‐FO‐4 : Forced Outage ‐ Starting Failure
HWDT 2007/04/03 15:48 2007/04/03 15:56 21 (4)‐FO‐4 : Forced Outage ‐ Starting Failure
HWDT 2007/11/08 12:55 2007/11/08 13:06 21 (4)‐FO‐4 : Forced Outage ‐ Starting Failure
HWDT 2007/12/21 15:11 2007/12/21 15:44 21 (4)‐FO‐4 : Forced Outage ‐ Starting Failure
HWDT 2008/07/11 15:18 2008/07/11 15:41 21 (4)‐FO‐4 : Forced Outage ‐ Starting Failure
HWDT 2009/01/08 8:12 2009/01/08 10:13 21 (4)‐FO‐4 : Forced Outage ‐ Starting Failure
HWDT 2009/07/20 15:58 2009/07/21 11:38 21 (4)‐FO‐4 : Forced Outage ‐ Starting Failure
HWDT 2009/09/26 17:56 2009/09/27 10:59 21 (4)‐FO‐4 : Forced Outage ‐ Starting Failure
HWDT 2011/01/31 11:43 2011/02/01 15:03 21 (4)‐FO‐4 : Forced Outage ‐ Starting Failure
HWDT 2012/02/15 13:12 2012/02/21 20:53 21 (4)‐FO‐4 : Forced Outage ‐ Starting Failure
HWDT 2012/02/29 10:56 2012/03/10 13:32 21 (4)‐FO‐4 : Forced Outage ‐ Starting Failure
HWDT 2013/02/09 11:09 2013/02/09 12:24 21 (4)‐FO‐4 : Forced Outage ‐ Starting Failure
Gas Turbine Starting Failures from January 1, 2000 to December 31, 2013

Appendix 2, Page 5 of 8
gas turbine (A and B), both rated at 25 MW each.
The gas turbine was installed in 1976 and has been in‐service for approximately 38 years.
Between 1993 and 2013, the unit operated in generating mode an average of 29 hours per year
(607 hours over the period) and in synchronous condensing mode an average of 2,461 hours
per year (51,679 hours over the period).
In 2007‐ 2008, Stantec undertook a condition assessment. Given the unit’s age and operating
history a number of issues were identified and a refurbishment program was put in place with
two years remaining before completion.
Gas Turbine System Incident Availability
The planned major overhaul at the Stephenville Gas Turbine was completed in the summer of
2013 after completion of an alternator refurbishment (a stator and rotor rewind). In June 2013,
the unit was released for service. At this time, it was determined that there was deterioration
of the insulation blankets (to prevent excessive heat build‐up and a potential trip) on End B, and
it was limited to an output of 15 MW, a de‐rating of 10 MW from the engine’s rated output of
25 MW. It was limited to 30 MW when both ends were operating due to the requirement to
keep the output on each end equal. The unit was also released for full synchronous condenser
capability.
The blankets on End B required replacement to restore the unit to its original operating
condition. These were the original blankets on the unit and specifications had to be developed
before a quotation could be obtained. On‐site inspections and data collection were required to
develop the specification in consultation with the supplier. A quotation for the supply and
installation of the insulating blankets on October 18, 2013 would not meet Hydro’s date for
winter readiness so another supplier quote was received on December 3, 2013 and a purchase
order placed. The blankets were received at the end of the first week of January 2014.
Appendix 2, Page 6 of 8
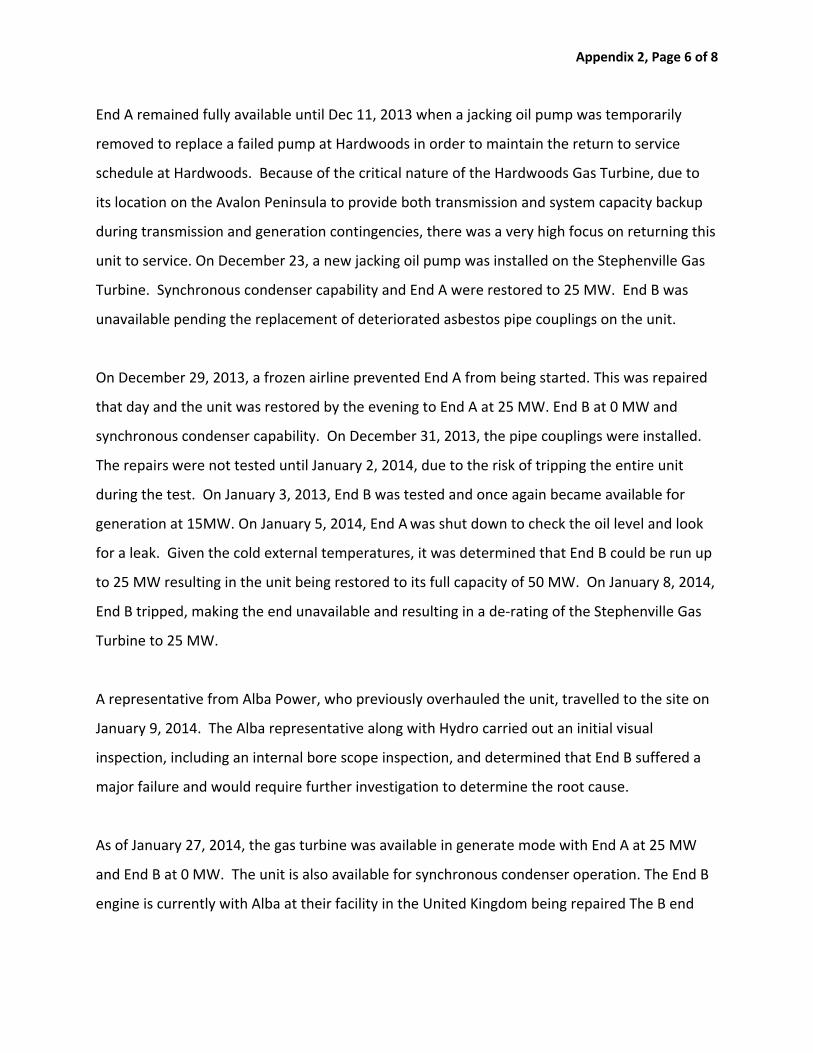
End A remained fully available until Dec 11, 2013 when a jacking oil pump was temporarily
removed to replace a failed pump at Hardwoods in order to maintain the return to service
schedule at Hardwoods. Because of the critical nature of the Hardwoods Gas Turbine, due to
its location on the Avalon Peninsula to provide both transmission and system capacity backup
during transmission and generation contingencies, there was a very high focus on returning this
unit to service. On December 23, a new jacking oil pump was installed on the Stephenville Gas
Turbine. Synchronous condenser capability and End A were restored to 25 MW. End B was
unavailable pending the replacement of deteriorated asbestos pipe couplings on the unit.
On December 29, 2013, a frozen airline prevented End A from being started. This was repaired
that day and the unit was restored by the evening to End A at 25 MW. End B at 0 MW and
synchronous condenser capability. On December 31, 2013, the pipe couplings were installed.
The repairs were not tested until January 2, 2014, due to the risk of tripping the entire unit
during the test. On January 3, 2013, End B was tested and once again became available for
generation at 15MW. On January 5, 2014, End A was shut down to check the oil level and look
for a leak. Given the cold external temperatures, it was determined that End B could be run up
to 25 MW resulting in the unit being restored to its full capacity of 50 MW. On January 8, 2014,
End B tripped, making the end unavailable and resulting in a de‐rating of the Stephenville Gas
Turbine to 25 MW.
A representative from Alba Power, who previously overhauled the unit, travelled to the site on
January 9, 2014. The Alba representative along with Hydro carried out an initial visual
inspection, including an internal bore scope inspection, and determined that End B suffered a
major failure and would require further investigation to determine the root cause.
As of January 27, 2014, the gas turbine was available in generate mode with End A at 25 MW
and End B at 0 MW. The unit is also available for synchronous condenser operation. The End B
engine is currently with Alba at their facility in the United Kingdom being repaired The B end
Appendix 2, Page 7 of 8
engine has been replaced with a vendor engine and the unit is currently operational at up to
40 MW capacity.
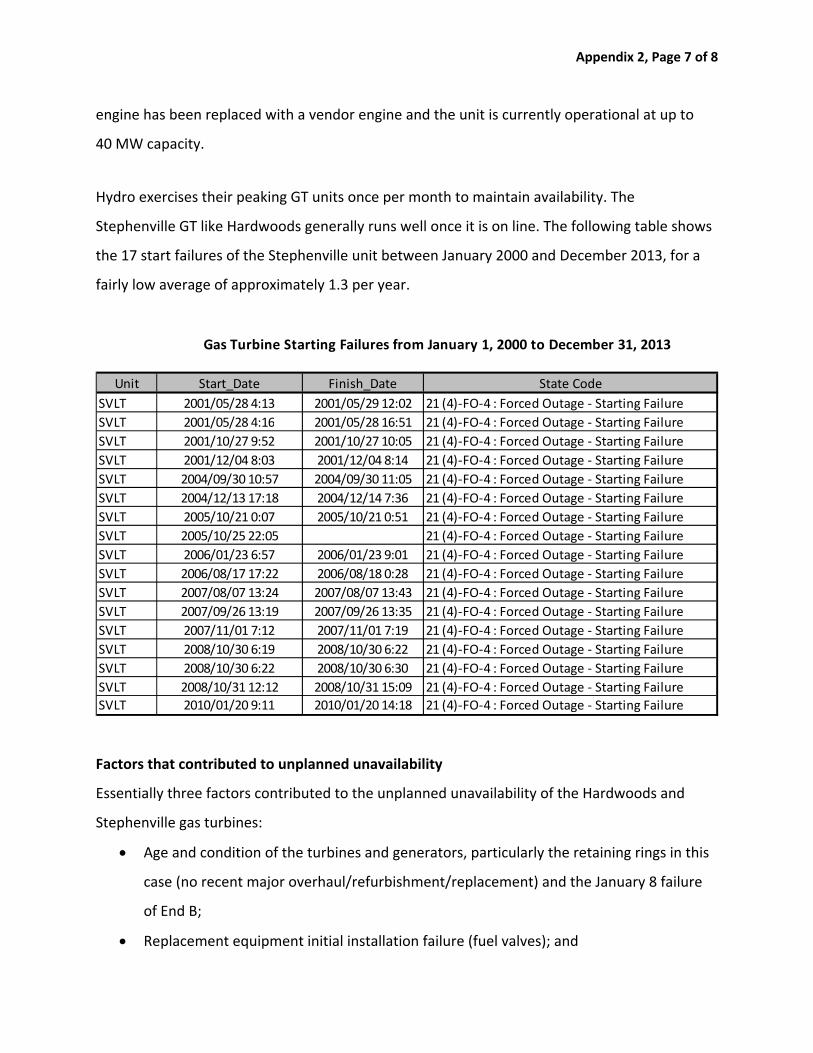
Hydro exercises their peaking GT units once per month to maintain availability. The
Stephenville GT like Hardwoods generally runs well once it is on line. The following table shows
the 17 start failures of the Stephenville unit between January 2000 and December 2013, for a
fairly low average of approximately 1.3 per year.
Factors that contributed to unplanned unavailability
Essentially three factors contributed to the unplanned unavailability of the Hardwoods and
Stephenville gas turbines:
Age and condition of the turbines and generators, particularly the retaining rings in this
case (no recent major overhaul/refurbishment/replacement) and the January 8 failure
of End B;
Replacement equipment initial installation failure (fuel valves); and
Unit Start_Date Finish_Date State Code
SVLT 2001/05/28 4:13 2001/05/29 12:02 21 (4)‐FO‐4 : Forced Outage ‐ Starting Failure
SVLT 2001/05/28 4:16 2001/05/28 16:51 21 (4)‐FO‐4 : Forced Outage ‐ Starting Failure
SVLT 2001/10/27 9:52 2001/10/27 10:05 21 (4)‐FO‐4 : Forced Outage ‐ Starting Failure
SVLT 2001/12/04 8:03 2001/12/04 8:14 21 (4)‐FO‐4 : Forced Outage ‐ Starting Failure
SVLT 2004/09/30 10:57 2004/09/30 11:05 21 (4)‐FO‐4 : Forced Outage ‐ Starting Failure
SVLT 2004/12/13 17:18 2004/12/14 7:36 21 (4)‐FO‐4 : Forced Outage ‐ Starting Failure
SVLT 2005/10/21 0:07 2005/10/21 0:51 21 (4)‐FO‐4 : Forced Outage ‐ Starting Failure
SVLT 2005/10/25 22:05 21 (4)‐FO‐4 : Forced Outage ‐ Starting Failure
SVLT 2006/01/23 6:57 2006/01/23 9:01 21 (4)‐FO‐4 : Forced Outage ‐ Starting Failure
SVLT 2006/08/17 17:22 2006/08/18 0:28 21 (4)‐FO‐4 : Forced Outage ‐ Starting Failure
SVLT 2007/08/07 13:24 2007/08/07 13:43 21 (4)‐FO‐4 : Forced Outage ‐ Starting Failure
SVLT 2007/09/26 13:19 2007/09/26 13:35 21 (4)‐FO‐4 : Forced Outage ‐ Starting Failure
SVLT 2007/11/01 7:12 2007/11/01 7:19 21 (4)‐FO‐4 : Forced Outage ‐ Starting Failure
SVLT 2008/10/30 6:19 2008/10/30 6:22 21 (4)‐FO‐4 : Forced Outage ‐ Starting Failure
SVLT 2008/10/30 6:22 2008/10/30 6:30 21 (4)‐FO‐4 : Forced Outage ‐ Starting Failure
SVLT 2008/10/31 12:12 2008/10/31 15:09 21 (4)‐FO‐4 : Forced Outage ‐ Starting Failure
SVLT 2010/01/20 9:11 2010/01/20 14:18 21 (4)‐FO‐4 : Forced Outage ‐ Starting Failure
Gas Turbine Starting Failures from January 1, 2000 to December 31, 2013

Appendix 2, Page 8 of 8
Timing of component deliveries, insulation blankets in this case, and expert availability
in critical periods.
The only aspect that could have been significantly different would have been the earlier
identification and procurement of the Stephenville insulation blankets. Special efforts were
made to expedite higher priority work (temporary removal of jacking oil pump from
Stephenville to Hardwoods and new alternator procurement for Hardwoods).
Scheduling of GT overhauls/outages
The generator end ring issue was unexpected, and was found during refurbishment of
Stephenville in 2012. As indicated, the scheduling of the repairs as originally planned, took into
account the extension into the normal winter readiness period, the priority requirements of
other outage requirements (Holyrood Units), and the expected generation/load match. The
equipment would have been ready for service for winter readiness purposes and the January
2014 system event had other issues not occurred. It is possible that some of the equipment
issues, particularly the insulation blanket, could have been recognized and addressed earlier.

Appendix 3, Page 1 of 2
Details – Holyrood Availability
Plant Information
Holyrood Thermal Generating station is a three unit 1969‐1979 vintage heavy oil fuelled power
plant. Units 1 and 2 are rated at 170 MW (originally 150 MW) commissioned in 1970‐71 and
uprated in 1988‐89. Unit 3 is a 150 MW unit that entered service in 1979 and was retrofitted
with additional equipment to enable it to run as a synchronous condenser.
The plant typically runs seasonally base loaded in winter with minimal cycling impacts due to
the modest band of operation from 70 to 150 MW most of the time. Unit 3 generator runs as a
synchronous generator in other parts of year, typically summer.
Factors that contributed to unplanned unavailability
Holyrood’s early life availability was strongly influenced by the high sulphur, high vanadium
heavy fuel oil that it consumed. Frequent winter shutdowns for boiler cleaning and tube leak
repairs were the norm. A switch to a higher quality oil in 2006 through 2009 greatly reduced
the winter unavailability due to fuel causes. In 2013, a new fuel contract resulted in a more
erosive ash, with a propensity to precipitate out heavier liquids/solids in storage and handling
systems. This has resulted in some equipment failures/repairs requiring short outages and
significant cost issues with the fuel storage and handling systems, particularly in early to mid‐
2013. Through additional maintenance and parts and fuel quality adjustments with the
supplier, Hydro has reduced the impacts for the 2013‐14 winter period.
Given that the plant typically runs winter seasonally base loaded with minimal cycling impacts
(due to the modest band of operation from 70 to 150 MW most of the time), the equipment is
largely in reasonable to good condition. The equipment that deteriorates with time, as opposed
to use, is approaching end of life and being replaced. Some of the major equipment, such as the
generators, are reaching a life stage where issues may arise. Advanced and more frequent
monitoring will help. Refurbishment may become desirable as condition assessments indicate
further deterioration, but the expected generation life of between 2017, and in a standby role
to 2021, also makes any significant investment more difficult to justify. This would include

Appendix 3, Page 2 of 2
significant investments in large, expensive major spares, such as large 4kV motor spares, that
would have a very limited useful life.
Hydro carried out extensive condition assessment on Holyrood in 2011 to 2013, and continues
to do so, particularly of the critical at‐risk systems. This includes the high pressure, high
temperature steam and water boiler components to reduce the risk of major steam system
failures that could have major facility and safety impacts. The ongoing assessments have
resulted in some in‐situ repairs, but generally have found conditions to be consistent with
operating to the expected end of generation operation. Major turbine and generator and
auxiliary testing and overhauls continue on their regular schedule for reliability and
maintainability purposes. Routine preventative maintenance and corrective work also
continues.
The unavailability of 100 MW from Holyrood Unit 3 due to the failure of a Unit 3 FD fan motor
on December 26, 2013 was the most significant generation capacity de‐rating during the period
of the rotating outages on January 2 to January 8, 2014. While its unavailability would not have
caused the larger transmission/terminal station failure events on January 4 and January 5,
2014, the 100 MW loss was a major factor in the rotating outages prior to and during the
restoration from those failure incidents. The motor was removed, shipped to a local supplier
and returned and reinstalled on January 12, 2014.
A spare 4 kV FD fan motor had been suggested for procurement consideration in the 2011
condition assessment. It was examined and costed and submitted as part of the 2012 capital
approval process, but was not pursued further based on Hydro’s capital prioritization process.
The subsequent year it was determined not to be a capital item and has not proceeded further
as yet. Given the quick turnaround in the significant repair, a prioritization decision to procure a
spare is a difficult one. One spare to address all the 4kV motors on Units 1 to 3 would be
difficult to implement due to different sizes. Unit 1 and 2 have larger motors than Unit 3 and
BFP motors are a different size from FD fan motors. Given the recent failures, the issues of
spares versus the timeliness and impacts of repairs should be revisited.
Appendix 4, Page 1 of 2
Details – Hydroelectric Generation Availability
Granite Canal – Turbine Generator Vibration
In mid‐December, 2013, the Granite Canal unit was de‐rated from 40 MW to 32 MW, as axial
vibration was being experienced when the unit was run past that limit. The cause of the
vibration was unknown. This unit experienced a similar vibration issue in February 2012.
Neither Hydro nor the OEM was able to determine a definite cause of the vibration. One
theory at the time was related to the cold temperature of the water.
Given the very high system demand through the end of December 2013, it was decided to leave
the unit operating on a de‐rated basis until the system load came back down and a
maintenance outage could be scheduled. At approximately 16:30 on January 2, 2014, the unit
tripped due to a suspected vibration issue.
On January 3, 2014, crews arrived on site and returned the unit to service at approximately 30
MW. Vibration issues with the unit remained at over 32 MW. The work crew stayed with the
unit through the weekend to ensure a timely response to any further issues given the pending
weather and the system generation issues.
On January 4, 2014, the unit tripped again. This time it was due to the system imbalance caused
by the issues at Sunnyside and elsewhere. The unit was brought back in service in less than one
hour to approximately 32 MW. The crew remained with the unit.
On January 5, 2014, due to system demand, the crew ran the unit to 40 MW, maximum
capacity, and the vibration issue was no longer present. It was suspected that there could have
been ice formations causing the vibration and that the ice had come off the unit. Crews stayed
with the unit through to January 8, 2014, and the system demand was reduced.

Appendix 4, Page 2 of 2
Exploits River – Frazil Ice Build‐Up
Exploits River generation was initially reduced to 38 MW below the typical 63 MW obtained in
winter due to frazil ice 1 buildup. There was a significant shift of a substantial amount of ice that
accumulated in the water channels leading into the Grand Falls generating station, ultimately
resulting in a reduction in available capacity of approximately 50 MW (from 88 MW at the
time). Crews quickly responded to try to clear out the ice to the extent possible. Crews
continued to work to remove the ice until January 14, 2014, when, through a combination of
milder temperatures and the efforts of ice removal, the plant was restored to normal.
1 Frazil ice is a collection of loose, randomly oriented needle‐shaped ice crystals, sometimes resembling slush that are formed in turbulent water. It sporadically forms in open, turbulent, supercooled water, which means that it usually forms in rivers, lakes and oceans, on clear nights when the weather is colder.
Appendix 5, Page 1 of 2
Details – Wind Generation Availability
Wind generation is provided from two sites. St Lawrence Wind Project (ENEL Green Energy
Power Canada Inc.) produces about 27 MW from nine Vestas V90 3.0 MW wind turbines. The
project has produced on average over the last four years about 104,000 MWh/Year and thus
operates at over 43% capacity factor. Fermeuse Wind is also a 27 MW wind project. The
average production over the last three years has been about 87,300 MWh/Year and thus
operates at about a 37% capacity factor. These are both excellent values and reflective of both
good wind sites and good turbine availability.
St Lawrence Wind Project in 2012 was available 8566.4 hours of 8784 hours or an availability of
about 97.5%. The facility experienced seven occurrences where it had to be restarted from
offline. It had a total of 138 hours due to forced outages from balance of plant (BOP)
equipment. There were no full day low wind days or no full day excessive wind days. Extreme
wind and icing caused one day off associated with its substation. There were visual
observations of thirteen lightning related days, and two freezing air/icing storms. There was
6.7 hours of outage due to extreme weather on one day attributable to Hurricane Leslie. All
told, there were six extreme weather days in 2012 affecting the turbines or their associated
substations, all in December through February.
Factors that contributed to unplanned unavailability
Extreme weather and system interruptions are the primary causes of unplanned unavailability.
Prior to the January 2014 event, extreme weather related specifically to the turbines and
auxiliaries was low. For example, it was just six days in 2012 for 50% of the installed capacity.
In the January 2014 system event, the St. Lawrence wind farm came off line at approximately
19:00 on January 3, 2014, due to weather conditions and high winds. On January 4, 2014, the
wind farm lost grid power early in the morning due to the system events. The farm was
subsequently unavailable until January 6, 2014. This was a result of icing conditions on the

Appendix 5, Page 2 of 2
turbines and the requirements to complete inspections on the turbines. The inspections
required climbing the towers which could not be done for periods due to high winds. The return
to service was also delayed by the inability of crews to get to the site due to road closures and
bad road conditions.
The Fermeuse wind farm came off line on January 3, 2014, related primarily to the weather
conditions and high winds. These turbines came back in service between January 5 to January 8,
2014, at various levels of production. Issues were similar to those at the St Lawrence wind farm.
A key issue is that the units have to be manually reset on site when tripped. In the January 2014
system event, extreme weather, as well as system issues on January 3, 2013, resulted in the
shutdown of the 54 MW of wind generation facilities. The weather and access closures limited
access to the facilities by the private developer’s staff to inspect and reset the units. This
extended the time to get to the units back in service ‐‐ between January 6 and January 8, 2014.
At noon on January 8, 2014, St. Lawrence wind was on at full capacity of 27 MW and Fermeuse
was at 23 MW.

Appendix 6, Page 1 of 2
Details – Under Frequency Event History 2004 to 2013
Details of Under‐Frequency Events 2004‐2013 as per Section 3.3 are presented below.

Appendix 6, Page 2 of 2


