
p r 11 hydro P.O. Box 12400. St. John's. NI Hydro Place ... · Newfoundland and Labrador Hydro...
23
Ai\p r I newfoundland labrador 11 hydro a nalcor energy company Hydro Place. 500 Columbus Drive. P.O. Box 12400. St. John's. NI Canada A1B 4K7 t. 709.737.1400 f. 709.737.1800 www.n1h.nl.ca December 17, 2014 The Board of Commissioners of Public Utilities Prince Charles Building 120 Torbay Road, P.O. Box 21040 St. John's, Newfoundland & Labrador A1A 5B2 Attention: Ms. Cheryl Blundon Director Corporate Services & Board Secretary Dear Ms. Blundon: Re: Newfoundland and Labrador Hydro - the Board's Investigation and Hearing into Supply Issues and Power Outages on the Island Interconnected System: Supplementary Response in Relation to PUB-NLH-457 and PUB-NLH-458 In its responses to the Board's RFIs PUB-NLH-457 and PUB-NLH-458, Hydro indicated that additional documentation would be supplied to the Board when the related work was completed. In this regard, please find enclosed the original and 12 copies of the following: a) Hydro's analysis of the impact of transmission line contingencies on system losses related to alternate generation dispatches (re: PUB-NLH-457); and, b) Two reports by Trans Grid Solutions Inc. related to the simulation of the Sunnyside Ti failure and an investigation of the Western Avalon T5 transformer failure concerning whether or not harmonics or system resonance were contributing factors to the system events of January, 2014 (re: PUB-NLH-458). We trust the foregoing is satisfactory. If you have any questions or comments, please contact the undersigned. Yours truly, NEWFOUNDLAND AND LABRADOR HYDRO Tracey UPennell Legal Counsel TLP/jc cc: Gerard Hayes — Newfoundland Power Thomas Johnson — Consumer Advocate Paul Coxworthy — Stewart McKelvey Stirling Scales Danny Dumaresque ecc: Roberta Frampton Benefiel — Grand Riverkeeper Labrador
Transcript of p r 11 hydro P.O. Box 12400. St. John's. NI Hydro Place ... · Newfoundland and Labrador Hydro...

Ai\p r I newfoundland labrador
11 hydro a nalcor energy company
Hydro Place. 500 Columbus Drive.
P.O. Box 12400. St. John's. NI
Canada A1B 4K7
t. 709.737.1400 f. 709.737.1800
www.n1h.nl.ca
December 17, 2014
The Board of Commissioners of Public Utilities
Prince Charles Building
120 Torbay Road, P.O. Box 21040
St. John's, Newfoundland & Labrador
A1A 5B2
Attention: Ms. Cheryl Blundon
Director Corporate Services & Board Secretary
Dear Ms. Blundon:
Re: Newfoundland and Labrador Hydro - the Board's Investigation and Hearing into Supply Issues and Power Outages on the Island Interconnected System: Supplementary Response in Relation to PUB-NLH-457 and PUB-NLH-458
In its responses to the Board's RFIs PUB-NLH-457 and PUB-NLH-458, Hydro indicated that additional
documentation would be supplied to the Board when the related work was completed. In this regard,
please find enclosed the original and 12 copies of the following:
a) Hydro's analysis of the impact of transmission line contingencies on system losses related to
alternate generation dispatches (re: PUB-NLH-457); and,
b) Two reports by Trans Grid Solutions Inc. related to the simulation of the Sunnyside Ti failure and
an investigation of the Western Avalon T5 transformer failure concerning whether or not
harmonics or system resonance were contributing factors to the system events of January, 2014
(re: PUB-NLH-458).
We trust the foregoing is satisfactory. If you have any questions or comments, please contact the
undersigned.
Yours truly,
NEWFOUNDLAND AND LABRADOR HYDRO
Tracey UPennell
Legal Counsel
TLP/jc
cc: Gerard Hayes — Newfoundland Power
Thomas Johnson — Consumer Advocate Paul Coxworthy — Stewart McKelvey Stirling Scales
Danny Dumaresque
ecc: Roberta Frampton Benefiel — Grand Riverkeeper Labrador

Engineering Support Services for:
Western Avalon Transformer T5 Tap Failure
Newfoundland and Labrador Hydro
Attention:
Mr. Peter Thomas
Report R1335.02.01
PSCAD Investigation of the Western Avalon T5 Transformer Failure
Prepared by:
TransGrid Solutions Inc. 200 – 150 Innovation Dr.
Winnipeg, MB R3T 2E1
CANADA
www.transgridsolutions.com
Nov.26th, 2014
Reference: PUB-NLH-458 Atth 1

Newfoundland and Labrador Hydro Western Avalon Transformer T5 Tap Failure
PSCAD Investigation of the Western Avalon T5 Transformer Failure
Disclaimer
This report was prepared by TransGrid Solutions Inc. (“TGS”), whose responsibility is limited to the scope of work
as shown herein. TGS disclaims responsibility for the work of others incorporated or referenced herein. This report
has been prepared exclusively for Newfoundland and Labrador Hydro and the project identified herein and must
not be reused or modified without the prior written authorization of TGS.
Revisions
Project Name: Western Avalon Transformer T5 Tap Failure
Document
Title:
PSCAD Investigation of the Western Avalon T5 Transformer Failure
Document
Type:
Draft report
Document No.: R1335.02.01
Last Action
Date:
Nov.26th, 2014
Rev.
No.
Status Prepared By Checked By Date Comments
00 IFC D. Kell 20/11/14
01 IFA D. Kell 26/11/14 Add harmonic analysis
02 ABC D. Kell 05/12/14
Legend of Document Status:
Approved by Client ABC
Draft for Comments DFC
Issued for Comments IFC
Issued for Approval IFA
Issued for Information IFI
Returned for Correction RFC
Approval not Required ANR
Reference: PUB-NLH-458 Atth 1
Newfoundland and Labrador Hydro Western Avalon Transformer T5 Tap Failure
PSCAD Investigation of the Western Avalon T5 Transformer Failure
R1335.02.01 2 Nov.26th, 2014
© TransGrid Solutions Inc, 2014
Table of Contents 1. Introduction .................................................................................................................................................. 3 2. PSCAD Model Development .......................................................................................................................... 5
2.1 AC System model ................................................................................................................................... 5
2.2 AC Transmission Lines ............................................................................................................................ 7
2.3 Power Transformers .............................................................................................................................. 9
2.4 T5 Transformer at Sunny Side and T1 Transformer at Western Avalon.................................................... 9
2.5 PSCAD Model Benchmarking Against PSS/E .......................................................................................... 11
3. Modeling of Fault Sequence ........................................................................................................................ 12 4. Results......................................................................................................................................................... 13
4.1 Time Domain Simulation ...................................................................................................................... 13
4.2 Harmonic Impedance Scan ................................................................................................................... 20
5. Conclusions and Recommendations ............................................................................................................ 21
List of Figures Figure 1-1 Example of Low resolution Waveforms ................................................................................................... 3
Figure 2-1 SLD of Newfoundland System ................................................................................................................. 6
Figure 2-2 Example Line representation .................................................................................................................. 8
Figure 2-3 Detailed Line Model ............................................................................................................................... 9
Figure 2-4 T1 - SSD T5 – WAV ................................................................................................................................ 10
Figure 4-1 PSCAD Simulation of remnant flux ........................................................................................................ 13
Figure 4-2 Energization of Western Avalon transformer T5 via line TL237 ............................................................. 14
Figure 4-3 SSD DFR traces for T5 Failure ................................................................................................................ 15
Figure 4-4 TL207 Values ........................................................................................................................................ 16
Figure 4-5 TL203 Values ........................................................................................................................................ 16
Figure 4-6 T5 Voltages .......................................................................................................................................... 17
Figure 4-7 T5 Currents and Flux ............................................................................................................................ 18
Figure 4-8 FFT of 230kV ac voltage ........................................................................................................................ 19
Figure 4-9 Harmonic Impedances as seen from WAV bus ...................................................................................... 20
List of Tables
Table 2-1 Frequency Dependent AC lines ................................................................................................................ 7
Table 2-2 SSD T5 - WAV ........................................................................................................................................ 10
Table 2-3 SCL Comparison .................................................................................................................................... 11
Table 2-4 Loadflow Comparison ............................................................................................................................ 11
Table 3-1 AC System Fault Sequence ..................................................................................................................... 12
Reference: PUB-NLH-458 Atth 1

Newfoundland and Labrador Hydro Western Avalon Transformer T5 Tap Failure
PSCAD Investigation of the Western Avalon T5 Transformer Failure
R1335.02.01 3 Nov.26th, 2014
© TransGrid Solutions Inc, 2014
1. Introduction
This report presents the findings of the PSCAD simulation to recreate the Newfoundland T5 transformer tap
changer fault that occurred at 12:22pm on January 4th, 2014.
The original scope of the project was to model the fault based on delivered Comtrade data which records the
pertinent waveforms. Upon receipt of the data, the following was noticed:
1. The Comtrade data delivered forthe events at :
04/01/2014,13:13:09.000260
04/01/2014,10:05:34.000260
Both of which did not match the time of the fault. The Comtrade data which had the same time stamp as the
fault was delivered as a pdf file, which is shown in Figure 4-3.
2. The Comtrade data had a very low resolution as shown in Figure 1-1, which made it very hard to match to the
PSCAD simulation.
Figure 1-1 Example of Low resolution Waveforms
A PSCAD model was created on the following information in order to recreate the fault based on the pdf Comtrade
file.
Jan 4 1200.sav
PSS/E data file which represents the Newfoundland System conditions prior to the fault
Peak Case.dyr
PSS/E dynamics file
WAVTS T5 transformer nameplate, test data and transformer data (delivered as pdf files)
- 1 0 0
- 5 0
0
5 0
1 0 0
1 0 1 5 2 0 2 5 3 0
S S T S C F 1 C > 1 _ A -2 3 0 K V T L 2 0 2 A P h a s e V o l t a g e (V )
E le c tr o te k C o n ce p ts ® T O P , T h e O u tp u t P r o c e sso r ®
Ma
gn
itu
de
(
Ma
g)
T im e ( m s )
Reference: PUB-NLH-458 Atth 1

Newfoundland and Labrador Hydro Western Avalon Transformer T5 Tap Failure
PSCAD Investigation of the Western Avalon T5 Transformer Failure
R1335.02.01 4 Nov.26th, 2014
© TransGrid Solutions Inc, 2014
AC Line geometric data based on past work performed by TGS. This included mutual coupling of
the lines that shared the same right-of-way.
AMEC report “Newfoundland and Labrador Hydro Transmission Availability” March 21, 2014.
This report gave the details of the sequence of events during the fault of January 4th.
Reference: PUB-NLH-458 Atth 1
Newfoundland and Labrador Hydro Western Avalon Transformer T5 Tap Failure
PSCAD Investigation of the Western Avalon T5 Transformer Failure
R1335.02.01 5 Nov.26th, 2014
© TransGrid Solutions Inc, 2014
2. PSCAD Model Development
2.1 AC System model
The following files provided by Newfoundland and Labrador Hydro (NLH) and were used as the base case to
develop the equivalent PSCAD model:
Jan 4 1200.sav
Jan 4 1200.dyr
The equivalent ac system in PSSE was converted to PSCAD. Since this study deals with a transient phenomenon as
a result of transformer failure at Sunnyside, the representation of the power system components with more
accuracy at higher frequencies than the fundamental frequency is crucial for a better analysis of the event.
Therefore the following changes were made to the converted case:
All the generators were represented with their associated dynamic data, with the exception of
the BDP G7 unit as there was some stability issues associated with this machine. Due to the short
duration of the simulation, this will not affect the accuracy of the simulation.
A majority of the transmission lines surrounding the Sunnyside and Western Avalon were
modeled with frequency dependent line models according to the tower geometries and
conductor configurations
T5 transformer at Western Avalon was represented based on the latest data provided by NLH
Figure 2-1 shows the single line diagram of the ac system used in this study. Please note that the complete case is
not shown in the diagram and only the main portion of the ac system surrounding Sunnyside and Western Avalon
is shown.
Reference: PUB-NLH-458 Atth 1

Newfoundland and Labrador Hydro Western Avalon Transformer T5 Tap Failure
PSCAD Investigation of the Western Avalon T5 Transformer Failure
R1335.02.01 6 Nov.26th, 2014
© TransGrid Solutions Inc, 2014
Figure 2-1 SLD of Newfoundland System
Reference: PUB-NLH-458 Atth 1

Newfoundland and Labrador Hydro Western Avalon Transformer T5 Tap Failure
PSCAD Investigation of the Western Avalon T5 Transformer Failure
R1335.02.01 7 Nov.26th, 2014
© TransGrid Solutions Inc, 2014
2.2 AC Transmission Lines
The major transmission line models in the PSCAD case which when originally converted from PSS/E, were
represented as pi-sections and Bergeron line models
The Bergeron and pi-section line representations are only adequate for studies that essentially require the correct
fundamental frequency impedance. However, in order to get a higher degree of accuracy, some of the lines near
the affected buses were replaced with frequency dependent line models.
Table 2-1 lists of the lines that were modeled as frequency dependent lines.
Table 2-1 Frequency Dependent AC lines
From Bus# To Bus# From Bus# To Bus#
195229 195230 195167 195169
195222 195227 195169 195171
195221 195216 195171 195173
195216 195215 195173 195175
195221 195220 195222 195229
195220 195218 195227 195229
195215 195208 195229 195236
195215 195205 195229 195234
195205 195536 195234 195236
195205 195208 195236 195238
195622 195625 195221 195222
195625 195627 195152 195153
195124 195122 195153 195154
195122 195120 195155 195157
195120 195115 195157 195159
195115 195112 195152 195159
195112 195111 195620 195620
195209 195210 195621 195622
195208 195209 195112 195113
195205 195206 195600 196500
195500 195620 - -
Reference: PUB-NLH-458 Atth 1

Newfoundland and Labrador Hydro Western Avalon Transformer T5 Tap Failure
PSCAD Investigation of the Western Avalon T5 Transformer Failure
R1335.02.01 8 Nov.26th, 2014
© TransGrid Solutions Inc, 2014
Figure 2-2 shows an example of one of the more detailed line representation, which includes the mutual coupling
of lines TL201, TL242 and TL218 and the mutual coupling of lines TL201 and TL217. Figure 2-3 shows the detailed
line model for the lines TL201, TL242 and TL218.
Figure 2-2 Example Line representation
N1
N2
N3
236
229
N4
234
238
SECT
ION
PI
2 C
IRCU
IT1.0
e-3
[ohm
]
TL_201_218_242_1
TL201
TL242
TL_201_218_242_1
1
TL218
TL201
TL242
TL_201_218_242_1
1
TL218
1.0
e-3
[ohm
]
1.0
e-3
[ohm
]T
L_2490_229_1_1
1.0
e-3
[ohm
]
1.0
e-3
[ohm
]
1.0
e-3
[ohm
]
1.0
e-3
[ohm
]
TL201/T
L217
CO
UPLED
PI
SECT
ION
CO
UPLED
PI
SECT
ION
CO
UPLED
PI
SECT
ION
1.0
e-3
[ohm
]
P =
260.6
Q =
12.7
9
V A
P =
166.1
Q =
-33.0
9
V A
P =
113.5
Q =
-59.9
8
V A
P =
-185.2
Q =
-61.5
1
V A
P =
-205.7
Q =
-68.4
5
V A
P =
111.8
Q =
-59.0
1
V A
P =
105.2
Q =
5.4
69
V A
P =
183.8
Q =
55.2
1
V A
==
=T
l218
==
=T
l242
==
=T
l217
P =
-162
Q =
43.2
8
V A
==
=SZ
==
=SZ
==
=SZ
Reference: PUB-NLH-458 Atth 1

Newfoundland and Labrador Hydro Western Avalon Transformer T5 Tap Failure
PSCAD Investigation of the Western Avalon T5 Transformer Failure
R1335.02.01 9 Nov.26th, 2014
© TransGrid Solutions Inc, 2014
Figure 2-3 Detailed Line Model
2.3 Power Transformers
The power transformer models T5 at Sunny Side are updated based on the following data files received from NLH:
“WAVTS T5 nameplate.pdf”
“WAVTS T5 Test Report.pdf”
“Western Avalon-T5.pdf”
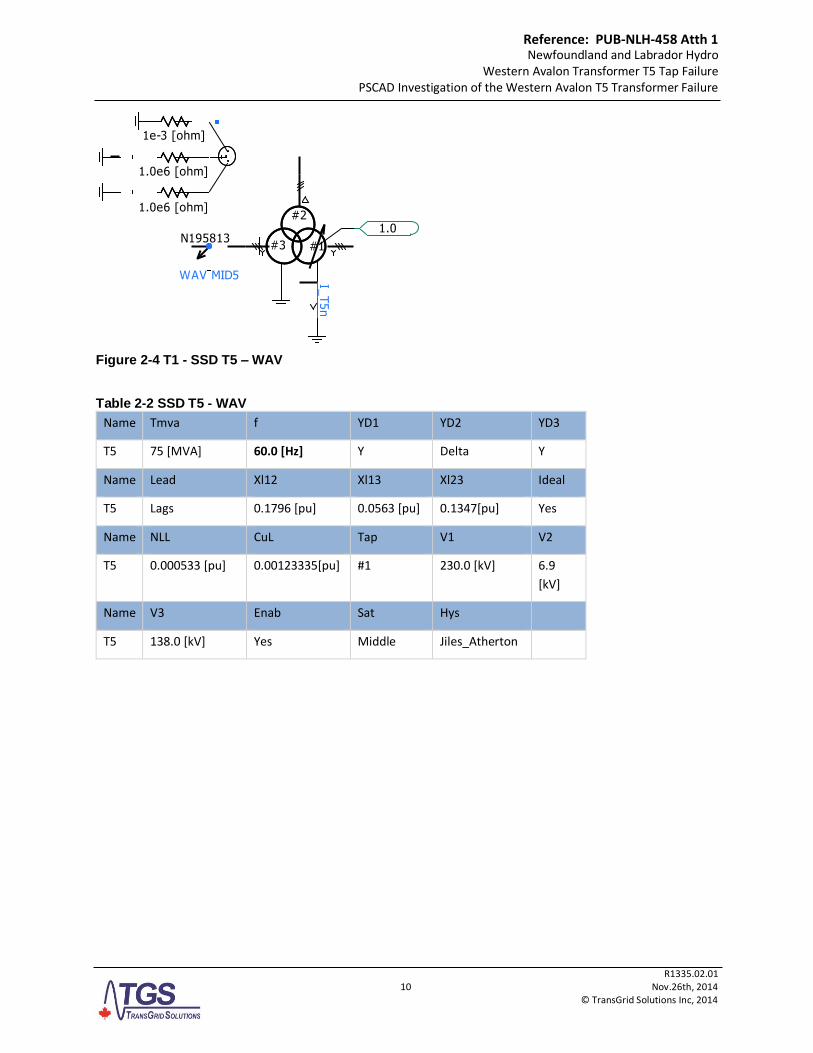
2.4 T5 Transformer at Sunny Side and T1 Transformer at Western Avalon
The T5 transformer at Sunnyside is modeled based on the data provided by NLH. Figure 2-4 shows the PSCAD
model and Table 2-2 shows the data used to model the transformers.
2000.0 [ohm*m]Resistivity:
Analytical Approximation (Wedepohl)Analytical Approximation (Deri-Semlyen)Aerial:
Underground:
Mutual: Analytical Approximation (LUCCA)
20Max. Order per Delay Grp. for Prop. Func.:
20Maximum Order of Fitting for Yc:
1.0E6 [Hz]Curve Fitting End Frequency:
Curve Fitting Starting Frequency: 0.5 [Hz]
Frequency Dependent (Phase) Model Options
Maximum Fitting Error for Yc: 1.0 [%]
1.0 [%]Maximum Fitting Error for Prop. Func.:
Travel Time Interpolation:
100Total Number of Frequency Increments:
On
DisabledDC Correction:
Passivity Checking: Disabled
12.57 [m]
6.7056 [m]
C1 C2 C3
Conductors: Grosbeak
Tower: TL201
0 [m]
G1
5 [m]
Ground_Wires: 1/2"HighStrengthSteel
21.6834 [m]
6.858 [m]
C4 C5 C6
Conductors: 804
Tower: TL242
-35.847 [m]
G1
5 [m]
Ground_Wires: 1/2"HighStrengthSteel 13.53 [m]
5.18 [m]
C7 C8 C9
Conductors: Plover
Tower: TL218
31.27 [m]
G1
5 [m]
Ground_Wires: 1/2"HighStrengthSteel
Reference: PUB-NLH-458 Atth 1
Newfoundland and Labrador Hydro Western Avalon Transformer T5 Tap Failure
PSCAD Investigation of the Western Avalon T5 Transformer Failure
R1335.02.01 10 Nov.26th, 2014
© TransGrid Solutions Inc, 2014
Figure 2-4 T1 - SSD T5 – WAV
Table 2-2 SSD T5 - WAV
Name Tmva f YD1 YD2 YD3
T5 75 [MVA] 60.0 [Hz] Y Delta Y
Name Lead Xl12 Xl13 Xl23 Ideal
T5 Lags 0.1796 [pu] 0.0563 [pu] 0.1347[pu] Yes
Name NLL CuL Tap V1 V2
T5 0.000533 [pu] 0.00123335[pu] #1 230.0 [kV] 6.9
[kV]
Name V3 Enab Sat Hys
T5 138.0 [kV] Yes Middle Jiles_Atherton
1.0
#1#3
#2
1e-3 [ohm]
1.0e6 [ohm]
1.0e6 [ohm]
N195813
WAV MID5 I_T5n
Reference: PUB-NLH-458 Atth 1
Newfoundland and Labrador Hydro Western Avalon Transformer T5 Tap Failure
PSCAD Investigation of the Western Avalon T5 Transformer Failure
R1335.02.01 11 Nov.26th, 2014
© TransGrid Solutions Inc, 2014
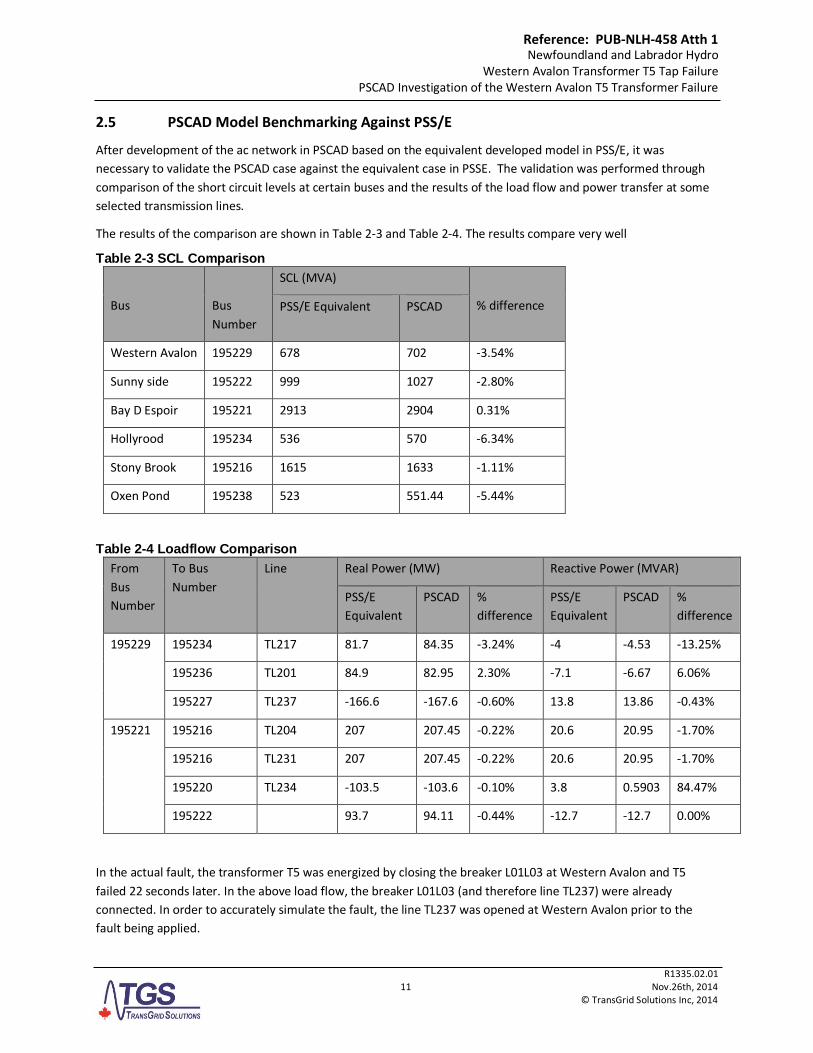
2.5 PSCAD Model Benchmarking Against PSS/E
After development of the ac network in PSCAD based on the equivalent developed model in PSS/E, it was
necessary to validate the PSCAD case against the equivalent case in PSSE. The validation was performed through
comparison of the short circuit levels at certain buses and the results of the load flow and power transfer at some
selected transmission lines.
The results of the comparison are shown in Table 2-3 and Table 2-4. The results compare very well
Table 2-3 SCL Comparison
Bus
Bus
Number
SCL (MVA)
% difference PSS/E Equivalent PSCAD
Western Avalon 195229 678 702 -3.54%
Sunny side 195222 999 1027 -2.80%
Bay D Espoir 195221 2913 2904 0.31%
Hollyrood 195234 536 570 -6.34%
Stony Brook 195216 1615 1633 -1.11%
Oxen Pond 195238 523 551.44 -5.44%
Table 2-4 Loadflow Comparison
From
Bus
Number
To Bus
Number
Line Real Power (MW) Reactive Power (MVAR)
PSS/E
Equivalent
PSCAD %
difference
PSS/E
Equivalent
PSCAD %
difference
195229 195234 TL217 81.7 84.35 -3.24% -4 -4.53 -13.25%
195236 TL201 84.9 82.95 2.30% -7.1 -6.67 6.06%
195227 TL237 -166.6 -167.6 -0.60% 13.8 13.86 -0.43%
195221 195216 TL204 207 207.45 -0.22% 20.6 20.95 -1.70%
195216 TL231 207 207.45 -0.22% 20.6 20.95 -1.70%
195220 TL234 -103.5 -103.6 -0.10% 3.8 0.5903 84.47%
195222 93.7 94.11 -0.44% -12.7 -12.7 0.00%
In the actual fault, the transformer T5 was energized by closing the breaker L01L03 at Western Avalon and T5
failed 22 seconds later. In the above load flow, the breaker L01L03 (and therefore line TL237) were already
connected. In order to accurately simulate the fault, the line TL237 was opened at Western Avalon prior to the
fault being applied.
Reference: PUB-NLH-458 Atth 1

Newfoundland and Labrador Hydro Western Avalon Transformer T5 Tap Failure
PSCAD Investigation of the Western Avalon T5 Transformer Failure
R1335.02.01 12 Nov.26th, 2014
© TransGrid Solutions Inc, 2014
3. Modeling of Fault Sequence
The modeling of the fault sequence was based on the AMEC report “Newfoundland and Labrador Hydro
Transmission Availability” March 21, 2014. The supplied load flow was configured to represent the ac system just
prior to the T5 transformer being energized. The detailed sequence of events is as shown Table 3-1 below:
Table 3-1 AC System Fault Sequence
Time event 2
Close Breaker L01L03 and energize T5 via TL237
5.07 Apply phase to phase fault
5.15333 Open ac breaker and trip transformer
Reference: PUB-NLH-458 Atth 1

Newfoundland and Labrador Hydro Western Avalon Transformer T5 Tap Failure
PSCAD Investigation of the Western Avalon T5 Transformer Failure
R1335.02.01 13 Nov.26th, 2014
© TransGrid Solutions Inc, 2014
4. Results
4.1 Time Domain Simulation
As described in the AMEC report, during the system restoration, one of the first steps taken was to try and
energize the Western Avalon B1 and B3 buses from Come-by-Chance via line TL237 using breaker B1L37, which
failed. During the subsequent incident investigation, it was found that only two phases of the breaker B1L37
closed, which means transformer T5 was energized via two phases. Figure 4-1 shows an example of energizing the
transformer 2 times, with only phases A and B closing. Assuming typical parameters for core characteristics, the
remnant flux density is approximately -0.064 on phase A , -1.335 on phase B and 1.131 on phase C. These flux
densities will be included in the transformer model.
Figure 4-1 PSCAD Simulation of remnant flux
Figure 4-2 shows the enenergization of transformer T5 via line TL237. There is a peak current of about 250A in the
neutral (I_T5n).
Reference: PUB-NLH-458 Atth 1

Newfoundland and Labrador Hydro Western Avalon Transformer T5 Tap Failure
PSCAD Investigation of the Western Avalon T5 Transformer Failure
R1335.02.01 14 Nov.26th, 2014
© TransGrid Solutions Inc, 2014
Figure 4-2 Energization of Western Avalon transformer T5 via line TL237
Reference: PUB-NLH-458 Atth 1

Newfoundland and Labrador Hydro Western Avalon Transformer T5 Tap Failure
PSCAD Investigation of the Western Avalon T5 Transformer Failure
R1335.02.01 15 Nov.26th, 2014
© TransGrid Solutions Inc, 2014
Figure 4-3 shows the actual measurements taken at Sunnyside for the T5 tapchanger failure
Figure 4-3 SSD DFR traces for T5 Failure
Reference: PUB-NLH-458 Atth 1

Newfoundland and Labrador Hydro Western Avalon Transformer T5 Tap Failure
PSCAD Investigation of the Western Avalon T5 Transformer Failure
R1335.02.01 16 Nov.26th, 2014
© TransGrid Solutions Inc, 2014
Figure 4-4 TL207 Values
Figure 4-5 TL203 Values
x 0.00 0.10 0.20 0.30 0.40 0.50 ...
...
...
-200
-150
-100
-50
0
50
100
150
200
kV
V_207:1
-200
-150
-100
-50
0
50
100
150
200
kV
V_207:2
-200
-150
-100
-50
0
50
100
150
200
kV
V_207:3
-3.0
-2.0
-1.0
0.0
1.0
2.0
3.0
kA
I_207:1
-2.00
-1.50
-1.00
-0.50
0.00
0.50
1.00
1.50
2.00
kA
I_207:2
-0.80
-0.60
-0.40
-0.20
0.00
0.20
0.40
0.60
kA
I_207:3
x 0.00 0.10 0.20 0.30 0.40 0.50 ...
...
...
-200
-150
-100
-50
0
50
100
150
200
kV
V_203:A
-200
-150
-100
-50
0
50
100
150
200
kV
V_203:B
-200
-150
-100
-50
0
50
100
150
200
kV
V_203:C
-1.00
-0.75
-0.50
-0.25
0.00
0.25
0.50
0.75
1.00
kA
I_203:A
-1.00
-0.75
-0.50
-0.25
0.00
0.25
0.50
0.75
1.00
kA
I_203:B
-1.00
-0.75
-0.50
-0.25
0.00
0.25
0.50
0.75
1.00
kA
I_203:C
Reference: PUB-NLH-458 Atth 1

Newfoundland and Labrador Hydro Western Avalon Transformer T5 Tap Failure
PSCAD Investigation of the Western Avalon T5 Transformer Failure
R1335.02.01 17 Nov.26th, 2014
© TransGrid Solutions Inc, 2014
Figure 4-6 T5 Voltages
x 0.00 0.10 0.20 0.30 0.40 0.50 ...
...
...
-200
-150 -100
-50 0
50 100
150 200
kV
V_230_A
-200
-150 -100
-50 0
50 100
150 200
kV
V_230_B
-200
-150 -100
-50 0
50 100
150 200
kV
V_230_C
-0.100 -0.075
-0.050 -0.025
0.000
0.025 0.050
0.075
kV
V_6.9_A
-10.0
-7.5 -5.0
-2.5 0.0
2.5 5.0
7.5 10.0
kV
V_6.9_B
-10.0
-7.5 -5.0
-2.5 0.0
2.5 5.0
7.5 10.0
kV
V_6.9_C
-150
-100
-50
0
50
100
150
kV
V_138_A
-150
-100
-50
0
50
100
150
kV
V_138_B
-150
-100
-50
0
50
100
150
kV
V_138_C
Reference: PUB-NLH-458 Atth 1

Newfoundland and Labrador Hydro Western Avalon Transformer T5 Tap Failure
PSCAD Investigation of the Western Avalon T5 Transformer Failure
R1335.02.01 18 Nov.26th, 2014
© TransGrid Solutions Inc, 2014
Figure 4-7 T5 Currents and Flux
Referring to the above figures, as the PSCAD model cannot represent a fault on the tap-changer, the fault was
applied externally to the transformer as a phase to phase fault. This did show that 2 KA fault current in a and b
phase windings.
Reference: PUB-NLH-458 Atth 1
Newfoundland and Labrador Hydro Western Avalon Transformer T5 Tap Failure
PSCAD Investigation of the Western Avalon T5 Transformer Failure
R1335.02.01 19 Nov.26th, 2014
© TransGrid Solutions Inc, 2014
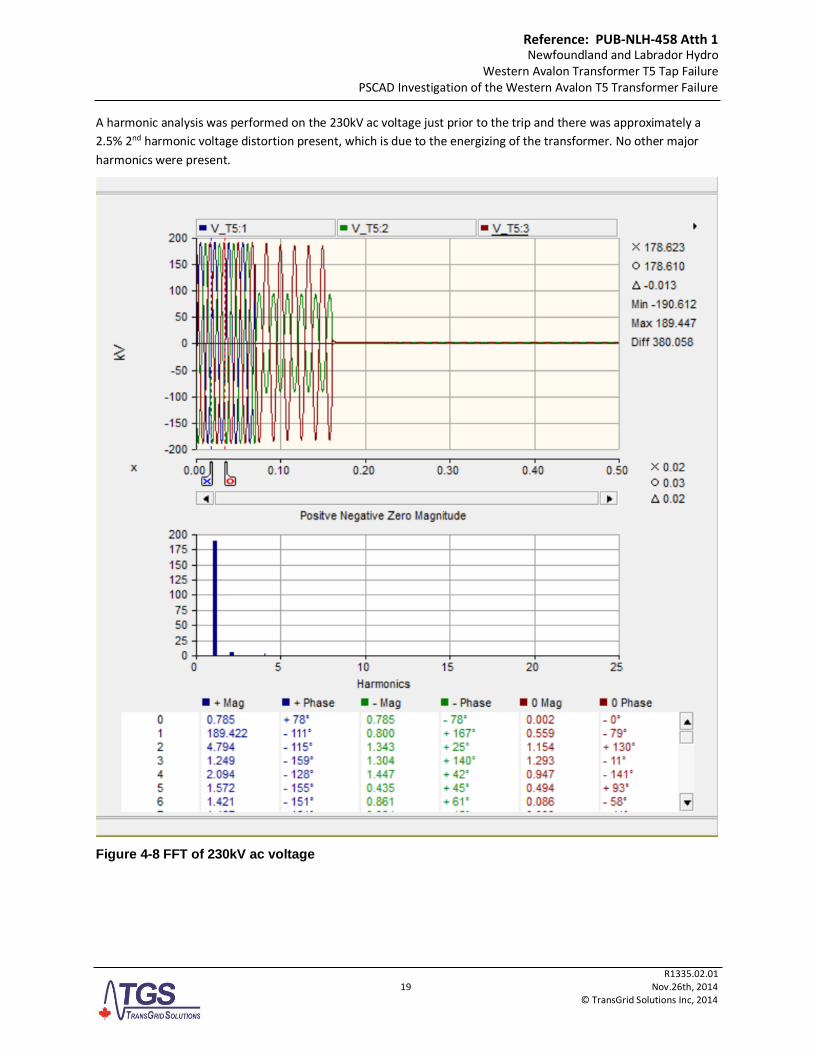
A harmonic analysis was performed on the 230kV ac voltage just prior to the trip and there was approximately a
2.5% 2nd harmonic voltage distortion present, which is due to the energizing of the transformer. No other major
harmonics were present.
Figure 4-8 FFT of 230kV ac voltage
Reference: PUB-NLH-458 Atth 1
Newfoundland and Labrador Hydro Western Avalon Transformer T5 Tap Failure
PSCAD Investigation of the Western Avalon T5 Transformer Failure
R1335.02.01 20 Nov.26th, 2014
© TransGrid Solutions Inc, 2014
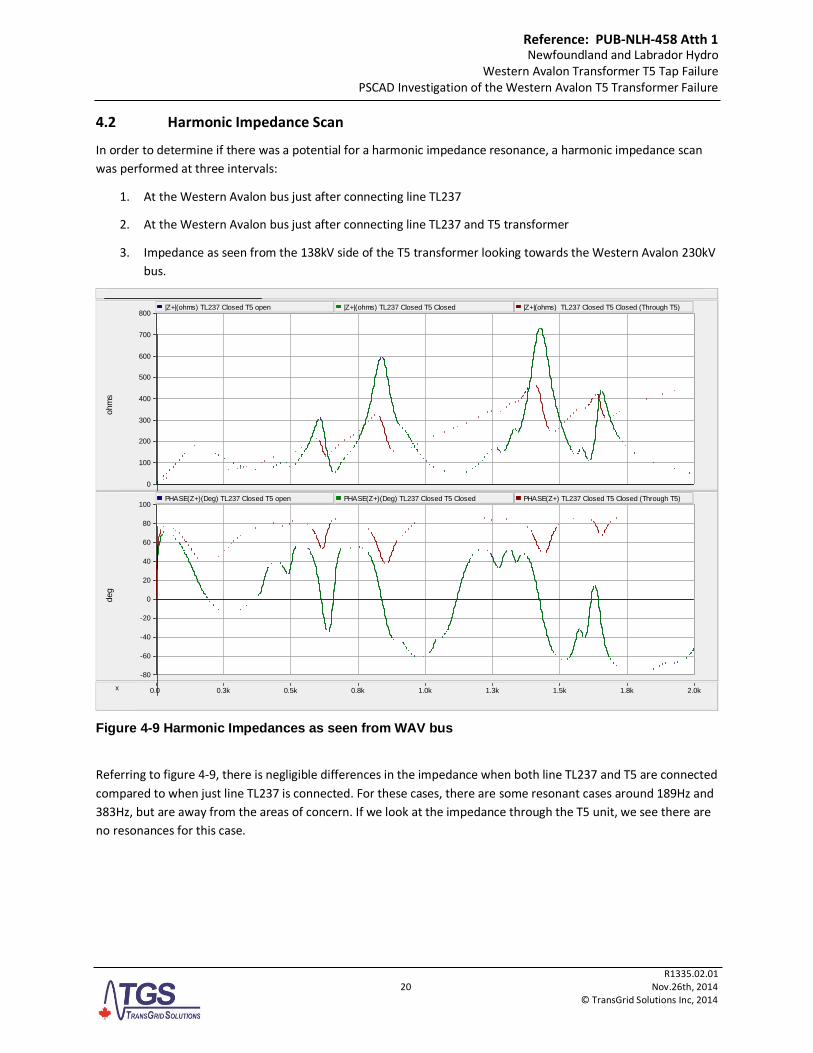
4.2 Harmonic Impedance Scan
In order to determine if there was a potential for a harmonic impedance resonance, a harmonic impedance scan
was performed at three intervals:
1. At the Western Avalon bus just after connecting line TL237
2. At the Western Avalon bus just after connecting line TL237 and T5 transformer
3. Impedance as seen from the 138kV side of the T5 transformer looking towards the Western Avalon 230kV
bus.
Figure 4-9 Harmonic Impedances as seen from WAV bus
Referring to figure 4-9, there is negligible differences in the impedance when both line TL237 and T5 are connected
compared to when just line TL237 is connected. For these cases, there are some resonant cases around 189Hz and
383Hz, but are away from the areas of concern. If we look at the impedance through the T5 unit, we see there are
no resonances for this case.
x 0.0 0.3k 0.5k 0.8k 1.0k 1.3k 1.5k 1.8k 2.0k ...
...
...
0
100
200
300
400
500
600
700
800
ohm
s
|Z+|(ohms) TL237 Closed T5 open |Z+|(ohms) TL237 Closed T5 Closed |Z+|(ohms) TL237 Closed T5 Closed (Through T5)
-80
-60
-40
-20
0
20
40
60
80
100
deg
PHASE(Z+)(Deg) TL237 Closed T5 open PHASE(Z+)(Deg) TL237 Closed T5 Closed PHASE(Z+) TL237 Closed T5 Closed (Through T5)
Reference: PUB-NLH-458 Atth 1

Newfoundland and Labrador Hydro Western Avalon Transformer T5 Tap Failure
PSCAD Investigation of the Western Avalon T5 Transformer Failure
R1335.02.01 21 Nov.26th, 2014
© TransGrid Solutions Inc, 2014
5. Conclusions and Recommendations
Although the simulation did not reproduce the exact fault, a comparable one was simulated. The simulations do
not point to an exact failure cause, but the simulations have shown that energizing 2 phases on the transformer
numerous times before energizing all three phases does produce some remnant flux and an unbalanced loading on
the transformer that could have contributed to the failure.
TGS recommended that once more details are available about the actual fault of the transformer, that the model
be updated and simulations rerun to recreate what happened. This new information will give further confidence in
the developed model and allow for future studies to be done either as a system strengthening exercise or for a
post-mortem on future faults.
Reference: PUB-NLH-458 Atth 1