Newcrest Mining Limited Annual Report 2015
148
Newcrest Mining Limited Annual Report 2015
Transcript of Newcrest Mining Limited Annual Report 2015

Newcrest Mining Limited Annual Report 2015

1 Key Achievements Financial Year 20152 Results at a Glance 4 Chairman’s Report 5 Managing Director’s Review 6 The Board 8 Forging a Stronger Newcrest9 Safety10 Operations/�Projects/�Exploration 22 Sustainability 24 Mineral Resources and Ore Reserves 32 Corporate Governance Statement33 Diversity and Inclusion34 Financial Report 35 Directors’ Report 38 Operating and Financial Review62 Letter from the Chairman and the Chairman of the
Human Resources and Remuneration Committee 63 Remuneration Report 90 Auditor’s Independence Declaration 91 Consolidated Income Statement 92 Consolidated Statement of Comprehensive Income 93 Consolidated Statement of Financial Position 94 Consolidated Statement of Cash Flows 95 Consolidated Statement of Changes in Equity 96 Notes to the Consolidated Financial Statements 139 Directors’ Declaration 140 Independent Auditor’s Report 142 Shareholder Information 144 Five Year SummaryIBC Corporate Directory

NEWCREST MINING ANNUAL REPORT 2015�1
Key Achievements Financial Year 2015
1 Cadia Valley 100% Newcrest
2 Telfer 100% Newcrest
3 Lihir 100% Newcrest
4 Gosowong 75% Newcrest
5 Wafi-Golpu 50% Newcrest
6 Hidden Valley 50% Newcrest
7 Bonikro 89.89% Newcrest
8 Namosi 69.94% Newcrest
7
1
28
3
56
4
Improved operational and financial performance ▶ 12% lower All-In Sustaining Cost (1) of USD 789/oz ▶ Gold production up 1% and copper production up 12% year-on-year ▶ Statutory profit (2) of AUD 546 million and Underlying profit (1) of AUD 515 million ▶ EBITDA margin (1) increased to 39%
Stronger cash flow and balance sheet ▶ Free cash flow (1) of AUD 1,086 million ▶ Net debt reduction of AUD 174 million
Future value identified ▶ Lihir pit optimisation study expected to be completed by the end of 2015 ▶ Retention of Telfer likely to provide better value than alternatives, initial cutbacks approved
▶ Revised approach to Golpu announced in December 2014, feasibility study for stage one nearing completion
Newcrest is one of the world’s largest gold mining companies, with operating assets in four countries, predominantly in Australia and the South-West Pacific region. The Company’s key priorities are safety, operating discipline, cash generation and profitable growth.
(1) For this reference and other references to non-IFRS financial measures throughout this annual report, refer to the information in the Operating and Financial Review in the Directors’ Report regarding non-IFRS financial measures.
(2) Statutory profit is profit after tax attributable to owners of the Company.

2�NEWCREST MINING ANNUAL REPORT 2015
Results at a Glance
Operational performance ▶ Gold production 2,423 thousand ounces; copper production 97 thousand tonnes
▶ All-in Sustaining Cost of AUD 941 per ounce (USD 789 per ounce) ▶ All-in Sustaining Cost margin of AUD 533 per ounce (on average realised gold price of AUD 1,474 per ounce)
Projects and studies ▶ Cadia East Panel Cave 1 propagated to surface Q2 2015 ▶ Golpu stage one feasibility study and stage two pre-feasibility study nearing completion
Profit and cash flow ▶ Statutory profit of AUD 546 million ▶ Underlying profit of AUD 515 million ▶ Free cash flow of AUD 1,086 million ▶ Cash flow from operations of AUD 1,589 million ▶ EBITDA margin of 39%; EBIT margin (1) of 23%
Balance sheet ▶ Cash and undrawn committed debt facilities at 30 June 2015 of approximately AUD 3,155 million (USD 2,423 million)
▶ Gearing of 29.3%
2015
2014
2013
2012
2011
2,110
2,396
2,423
2,286
2,527*
1% INCREASE
GROUP GOLD PRODUCTION
(thousand ounces)
2015
2014
2013
2012
2011
80
86
97
76
76
12% INCREASE
GROUP COPPER PRODUCTION
(thousand tonnes)
2015
2014
2013
2012
2011
446^
432
515
1,084
1,058
19% INCREASE
UNDERLYING PROFIT
(A$ million)
* Production from the former LGL operations included from the acquisition date of 30 August 2010^ Comparative 2013 information has been restated to reflect the adoption of Interpretation 20 – Stripping Costs in the Production Phase of a Surface Mine
(1) For this reference and other references to non-IFRS financial measures throughout this annual report, refer to the information in the Operating and Financial Review in the Directors’ Report regarding non-IFRS financial measures.

NEWCREST MINING ANNUAL REPORT 2015�3
12 months to 12 months to % 30 June 2015 30 June 2014 Change
Gold produced (ounces) 2,422,568 2,396,023 1
Copper produced (tonnes) 96,816 86,118 12
Gold price realised (AUD per ounce) 1,474 1,408 5
Sales revenue (AUD million) 4,344 4,040 8
EBITDA (1)(2) (AUD million) 1,673 1,514 11
EBIT (1)(2) (AUD million) 980 821 19
Statutory Profit/(loss) (3) (AUD million) 546 (2,221) –
Underlying Profit (2)(4) (AUD million) 515 432 19
Operating cash flow (AUD million) 1,589 1,037 53
Capital expenditure (AUD million) 564 843 33
Return on capital employed (ROCE) (2) (5) (percent) 8.0 6.4 25
Gearing (Net Debt/Net Equity and Equity) (2) (6) (percent) 29.3 33.8 (13)
Interim and Final Dividend AUD cents per share 0 0 0
(1) EBITDA is ‘Earnings before interest, tax, depreciation, amortisation and significant items’. EBIT is ‘Earnings before interest, tax and significant items’. EBITDA and EBIT are used to measure segment performance and have been extracted from Note 6 ’Segment Information’ on page 108.
(2) EBIT, EBITDA, Underlying profit, Return on capital employed and Gearing are non-IFRS financial information and have not been subject to audit by the Company’s external auditor. Refer to the Operating and Financial Review section of the Directors' Report for further information regarding Non-IFRS financial measures.
(3) Statutory profit/(loss) is profit/(loss) after tax attributable to owners of the parent.(4) Underlying profit is profit after tax before significant items attributable to owners of the parent. Refer to page 56 for further details.(5) Return on Capital Employed is calculated as EBIT divided by average capital employed.(6) Gearing is calculated as net debt to net debt and equity. Refer to page 55.
2015
2014
2013
2012
2011
745^
821
980
1,590
1,544
19% INCREASE
EBIT
(A$ million)
2015
2014
2013
2012
2011
1,147^
1,037
1,589
1,726
1,729
53% INCREASE
CASH FLOW FROM OPERATIONS
(A$ million)
1,086
717% INCREASE
2015
2014
2013
2012
2011
-1,147^
133
-1,029
-565
FREE CASH FLOW
(A$ million)

4�NEWCREST MINING ANNUAL REPORT 2015
The focus on cash is delivering results, with AUD 1,086 million of free cash flow generated in the year, AUD 953 million higher than the previous financial year.
Chairman’s Report
The past year has been characterised by improvements in our operational and financial performance, driven by our focus on operational discipline and cash flow generation.
This strengthened operational performance has been marred by our safety performance. We experienced two fatalities over the course of the financial year, and a further two fatalities in July and September 2015. This loss of life is of deep concern to the Newcrest Board and management – we are directly involved in reviewing the investigations of these incidents and are seeking to ensure that the learnings arising from these incidents are applied to the prevention of future fatalities. Entrenching a safe workplace culture through improved major hazard controls and safe behaviour is one of the pillars of our business improvement plan.
Newcrest’s business improvement program, which we call ‘Edge’, has been central to the Company’s improved operating and financial performance. Newcrest delivered a statutory profit of AUD 546 million in the current year, AUD 2,767 million higher than the previous financial year, which included asset impairments of AUD 2,353 million.
Underlying profit of AUD 515 million was AUD 83 million higher than the previous financial year, assisted by increased revenues from the ramp-up of higher margin production at Cadia East along with beneficial impacts from the weakening Australian dollar.
The focus on generating free cash flow is delivering results with AUD 1,086 million of free cash flow in the year, which was AUD 953 million higher than the previous financial year. This has enabled us to reduce net debt by USD 819 million in the 2015 financial year.
Newcrest’s financial objectives are to meet all financial obligations, maintain a strong balance sheet, so as to withstand cash flow volatility, be able to invest capital in value-creating opportunities, and be able to return excess cash generated to shareholders. As an unhedged gold producer, Newcrest looks to maintain a conservative level of balance sheet leverage.
The Board has determined that there will be no dividend for the 12 months ended 30 June 2015 as we prioritise the repayment of debt. The Board will consider returning to paying a dividend as debt is further reduced, taking market and operating conditions into consideration.
During the year, we made a number of changes to the Company’s Executive remuneration framework, following consultation with a number of shareholders. These changes are detailed in the remuneration report contained herein. We have also introduced minimum shareholding requirements for all Executives and Directors.
In July 2015, I announced changes to the Board. Following Tim Poole’s resignation, effective 30 July 2015, and Vince Gauci’s decision to retire following the Annual General Meeting on 29 October 2015, two new appointments were announced. Xiaoling Liu joined the Board on 1 September 2015 and Roger Higgins will join on 1 October 2015. The process of Board renewal will continue over the coming years to ensure an orderly transition and renewal of skills and experience. With their extensive operational and executive experience, I expect Xiaoling and Roger will make an excellent contribution to the Board and I would like to thank both Tim and Vince for their valued years of service.
In Sandeep’s first full year as Managing Director and Chief Executive Officer, he has overseen significant operational and financial improvement. This is the commencement of a phased transformational plan. The Edge program has been rolled out across the Company, and is delivering an unrelenting focus on safety, operational discipline, cash and profitable growth, underpinned by a culture of accountability and personal ownership.
I would like to take this opportunity to thank Newcrest’s employees and contractors for their commitment and contribution to our strong financial results over the past year. I would also like to acknowledge our host communities and governments for working with us for the benefit of all our stakeholders.
Newcrest’s return to financial health enables us to look ahead with confidence. The Board will continue to work with and support Sandeep and his team as they continue to improve the business and deliver on our commitments.
Peter HayChairman

NEWCREST MINING ANNUAL REPORT 2015�5
We have continued to meet our commitments on guidance and maintained our focus on sustainably lowering our costs, and lowered debt levels through free cash flow generation.
Managing Director’s Review
The year ended 30 June 2015 was my first full year as Managing Director and Chief Executive Officer of Newcrest. Four areas of focus have guided our actions over the past year: safety, operational discipline, cash generation and profitable growth, underpinned by a culture of personal ownership and accountability. With the critical exception of safety performance, this year’s results demonstrate significant positive change and progress across these areas.
Our achievements were sadly overshadowed by two fatalities during the financial year and a further two fatalities in July and September 2015. Two were at our joint venture operation Hidden Valley, one at Telfer and most recently one at Cadia. I can assure you that Newcrest has invested considerable time and energy into making safety our primary objective, ahead of financial performance. The fatalities have been a source of profound sadness to all of us at Newcrest. We have re-doubled our commitment to ensure our people go about their work in a safe manner and we are more determined than ever to eliminate fatalities and life-altering injuries from our business. To assist a step-change improvement in our safety performance, we launched our NewSafe program during the year to entrench safe workplace mindsets and behaviours.
Twelve months ago, I spoke about our three-phase improvement journey at Newcrest – first to assess our operations and launch our Edge transformation plan; second to execute our improvement plans and realise the benefits and third to profitably grow our business.
During our first full year of implementation of our Edge improvement program, we have delivered approximately AUD 390 million of cash benefits through the successful implementation of numerous improvement initiatives. This helped deliver AUD 1.1 billion of free cash flow for the year, allowing us to reduce net debt by USD 819 million.
The Edge program has driven an improvement in our operational performance, reduced costs, optimised the capital deployed and increased the free cash flow of the business. Central to the success of Edge is employee engagement, bottom-up innovation, personal ownership and operational discipline.
We have continued to meet or exceed production, capital and cost guidance. Gold production for the 2015 financial year of 2.4 million ounces was higher than the previous financial year and copper production of 97 thousand tonnes was also higher. Our All-In Sustaining Cost of USD 789 per ounce for the financial year, was 12 percent lower than the previous year, delivering an improved All-In Sustaining Cost margin of around 36 percent.
Cadia’s operational and financial performance was strong, with the continued ramp-up of ore mined from Cadia East Panel Cave 1 being supported by strong Ridgeway mine performance. We submitted an application to increase the Cadia processing plant permit from its current 27 million tonnes per annum (Mtpa) to 32 Mtpa which was approved in September 2015. A study has commenced to determine the most cost-effective way forward in relation to this plant expansion.
At Lihir we remain focused primarily on improving the availability and throughput of the plant whilst also lowering operating costs. During the 2015 financial year, we applied a new operating strategy which assisted us in achieving a 15 percent increase in plant throughput over the year with minimal reduction in recovery rates. We are on track to achieve our target of a sustained 12 Mtpa milling rate by the end of December 2015 and in August 2015 we announced a new milling throughput target rate of 13 Mtpa. We continue to progress the Pit Optimisation Study, which seeks to define the most cost-effective long term-mine development plan for Lihir.
After completing a future options review at Telfer, we made the decision to retain the asset. Improved performance, the Edge program, lower operating costs, an optimised mine plan and a lower Australian dollar all positively contributed to this decision.
While our primary focus remains on safely maximising the operating efficiency and cash generation of our existing assets, we are actively progressing the third phase of our improvement journey at Newcrest – to sustain and profitably grow our business.
Our near-term organic growth comes from the continued ramp-up of Cadia East and the turnaround of Lihir. We also expect to complete the feasibility study for stage one and pre-feasibility for stage two of the world-class Golpu orebody in Papua New Guinea over the coming year. We will continue to pursue value creation through participation in early stage projects and global greenfields exploration, all with a focus on delivering profitable growth.
During the year I refreshed our Executive leadership team to drive the next phase of our improvement journey. I am confident that this team has the capability and commitment necessary to continue the task of forging a stronger Newcrest.
In this annual report I am pleased to share Newcrest’s new mission and vision statement, which articulates where we are heading and how our vision will be achieved. I am pleased to advise you that a cross section of our workforce contributed to the formulation of this new mission and vision statement and their involvement has contributed to it resonating well with our people.
I would like to thank all our people at Newcrest for their efforts and dedication in delivering the improved performance of the past year. Their skills, knowledge and ideas have been instrumental to our progress, as they will be to our future success.
Sandeep BiswasManaging Director andChief Executive Officer

6�NEWCREST MINING ANNUAL REPORT 2015
1 Peter Hay LLB, FAICD, 65INDEPENDENT NON-EXECUTIVE CHAIRMAN
Mr Hay was appointed as Non-Executive Chairman of the Board on 1 January 2014, after being appointed as a Non-Executive Director on 8 August 2013. He is the Chairman of the Nominations Committee.Skills, experience and expertiseMr Hay has a strong background and breadth of experience in business, corporate law, finance and investment banking advisory work, with a particular expertise in relation to mergers and acquisitions. He has also had significant involvement in advising governments and government-owned enterprises. Mr Hay was Chief Executive Officer of the legal firm Freehills until 2005, where he had been a partner since 1977.Current Listed Directorships
– Chairman of Federation Limited and Federation Centres Limited (effectively a single board) (from 2015)
Other Directorships/appointments – Director of Australian Institute of Company Directors (AICD) – Member of AICD Corporate Governance Committee – Member of the Australian Government Takeovers Panel
Former Listed Directorships (last three years) – Director of GUD Holdings Limited (2009–2015) – Director of Novion Limited (2014–2015) – Director of Alumina Limited (2002–2013) – Director of the Australia and New Zealand Banking Group Limited (2008–2014)
– Director of Myer Holdings Limited (2010–2014)
2 Sandeep Biswas BEng (Chemical) (Hons), 53MANAGING DIRECTOR AND CHIEF EXECUTIVE OFFICER
Mr Biswas joined Newcrest on 1 January 2014, as an Executive Director and Chief Operating Officer and was appointed Managing Director and Chief Executive Officer effective 4 July 2014.Skills, experience and expertiseMr Biswas was previously Chief Executive Officer of Pacific Aluminium, a wholly owned subsidiary within the Rio Tinto group, which incorporated the bauxite, alumina, refining and smelting operations in Australia and New Zealand. He began his career with Mount Isa Mines, working in both Australia and Europe. Mr Biswas has also worked for Western Mining in Australia and Rio Tinto in Canada and Australia. He has experience in research, operations, business development and projects, across commodities including aluminium, copper, lead, zinc and nickel.Other Directorships/Appointments
– Director of the Minerals Council of Australia
3 Gerard BondBComm, Graduate Diploma Applied Finance and Investment, Chartered Accountant, F Fin, 47FINANCE DIRECTOR AND CHIEF FINANCIAL OFFICER
Mr Bond was appointed to the Board as an Executive Director in February 2012, after joining Newcrest as Finance Director and Chief Financial Officer in January 2012.Skills, experience and expertiseMr Bond has experience in the global financial and resources industry with Newcrest, BHP Billiton, Coopers & Lybrand and Price Waterhouse. Prior to joining Newcrest, Mr Bond was with BHP Billiton for over 14 years where he held a number of senior executive roles in Europe and Australia, including in Mergers and Acquisitions, Treasury, as Deputy CFO of the Aluminium business, CFO and then Acting President of the Nickel business, and as BHP Billiton’s Head of Group Human Resources.
4 Philip Aiken amBEng (Chemical), Advanced Management Program (HBS), 66INDEPENDENT NON-EXECUTIVE DIRECTOR
Mr Aiken was appointed to the Board in April 2013. He is a member of the Human Resources and Remuneration Committee, the Safety and Sustainability Committee and the Nominations Committee.Skills, experience and expertiseMr Aiken has extensive Australian and international business experience, principally in the engineering and resources sectors. He was Group President Energy BHP Billiton, President BHP Petroleum, Managing Director BOC/CIG, Chief Executive of BTR Nylex and Senior Advisor Macquarie Capital (Europe).Current Listed Directorships
– Chairman of Aveva Group plc (from 2012) – Chairman of Balfour Beatty plc (from 2015)
Former Listed Directorships (last three years) – Chairman of Robert Walters plc (2007–2012) – Director of Miclyn Express Offshore Ltd (2010–2012) – Senior Independent Director of Kazakhmys plc (2008–2013) – Senior Independent Director of Essar Energy plc (2010–2014) – Director of Essar Oil Limited (a listed subsidiary of Essar Energy plc) (2010–2014)
– Director of National Grid plc (2008–2015)
5 Vince Gauci BEng (Mining), 73INDEPENDENT NON-EXECUTIVE DIRECTOR
Mr Gauci was appointed to the Board in December 2008. He is a member of the Safety and Sustainability Committee and the Human Resources and Remuneration Committee.Skills, experience and expertiseMr Gauci has more than 40 years’ experience in the global mining industry, culminating in his role as Managing Director of MIM Ltd. He is a former Chairman of Runge Limited and was a Director of Liontown Resources Limited and of Coates Hire Limited.Other Directorships/appointments
– Chairman of the Broken Hill Community FoundationVince Gauci has announced that he will retire from the Board with effect from the end of the 2015 Annual General Meeting.
1 2 3 4 5
The Board

NEWCREST MINING ANNUAL REPORT 2015�7
6 Lady Winifred Kamit BA, LLB, 62INDEPENDENT NON-EXECUTIVE DIRECTOR
Lady Kamit was appointed to the Board in February 2011. She is a member of the Human Resources and Remuneration Committee and the Safety and Sustainability Committee.Skills, experience and expertiseLady Kamit has extensive business experience and broad community knowledge of Papua New Guinea. She is currently a consultant at Gadens Lawyers in Port Moresby and was formerly a senior partner at that firm. Lady Kamit was a Director of Lihir Gold Limited from 2004 until 2010.Current Listed Directorships
– Director of Steamships Trading Company Limited (from 2005)Other Directorships/appointments
– Councillor of the Papua New Guinea Institute of National Affairs and Chairperson of Coalition for Change PNG (an initiative against violence against women and children).
– Director of Nautilus Minerals Niugini Limited – Director of ANZ Banking Group (PNG) Limited – Director of Post Courier Limited – Director of South Pacific Post Limited
7 Richard KnightBSc (Mining Engineering), MSc (Mine Production Management), Chartered Engineer, FAICD, 74INDEPENDENT NON-EXECUTIVE DIRECTOR
Mr Knight was appointed to the Board in February 2008. He is Chairman of the Safety and Sustainability Committee. Skills, experience and expertiseMr Knight has over 40 years varied experience across all phases of the mining industry and in a wide spread of jurisdictions around the world. He is a former Executive Director of North Limited, President and Chief Executive Officer of Iron Ore Company of Canada and Chief Executive Officer of Energy Resources Australia Limited. He is a former Director of OZ Minerals Limited, Zinifex Limited, St. Barbara Limited, Portman Limited, Northern Orion Resources Inc. and Asia Pacific Resources Ltd.Other Directorships/appointments
– Chairman of the Mining Engineering Advisory Board, Monash University
– Director of Mining Education Australia
8 Roger HigginsBE (Civil Engineering) (Hons), MSc (Hydraulics), PhD (Water Resources), 64INDEPENDENT NON-EXECUTIVE DIRECTOR
Dr Higgins has been appointed as Non-Executive Director of the Board and a member of the Safety and Sustainability Committee effective from 1 October 2015.Skills, experience and expertiseDr Higgins brings extensive experience leading mining companies and operations, and has deep working knowledge of Papua New Guinea as a current Non-Executive Director and a former Managing Director of Ok Tedi Mining Limited in Papua New Guinea. In his most recent executive position, Dr Higgins served as Senior Vice President, Copper at Canadian metals and mining company, Teck Resources Limited. Prior to this role he was Vice President and Chief Operating Officer with BHP Billiton Base Metals Customer Sector Group working in Australia and also held senior positions with BHP Billiton in Chile. He holds the position of Adjunct Professor with the Sustainable Minerals Institute, University of Queensland.Current Listed DirectorshipsDirector of Metminco Limited (from 2013)Other Directorships/appointments
– Director of Ok Tedi Mining Limited – Chairman of the International River Foundation – Director of Institution of Engineers PNG – Director of PNG Professional Engineers Registration Board – Director of South Australia Museum Foundation
Former Listed Directorships (last 3 years) – Blackthorn Resources Limited (2014)
9 Rick Lee amBEng (Chemical) (Hons), MA (Econ) (Oxon), FAICD, 65INDEPENDENT NON-EXECUTIVE DIRECTOR
Mr Lee was appointed to the Board in August 2007. He is Chairman of the Human Resources and Remuneration Committee and a member of the Audit and Risk Committee.Skills, experience and expertiseMr Lee has extensive resource banking, finance and international commercial experience. His previous senior executive roles include 16 years with CSR Limited and nine years as Chief Executive Officer of NM Rothschild Australia Limited. He is a former Chairman of the Australian Institute of Company Directors and C. Czarnikow Limited and is a former Director of CSR Limited.Current Listed Directorships
– Chairman of Oil Search Limited (Director from 2012, Chairman from 2013)
Former Listed Directorships (last three years) – Deputy Chairman of Ridley Corporation Limited (2001–2013) – Chairman Salmat Limited (2002–2013)
10 Xiaoling LiuPhD (Extractive Metallurgy), BEng (Extractive Metallurgy), MAICD, FAusIMM, 58INDEPENDENT NON-EXECUTIVE DIRECTOR
Dr Liu was appointed to the Board with effect from September 2015. She is a member of the Human Resources and Remuneration Committee, the Safety and Sustainability Committee and the Audit and Risk Committee.Skills, experience and expertiseDr Liu has extensive executive experience in leading global mining and processing businesses. Her last executive role was as President and Chief Executive Officer of Rio Tinto Minerals, based in Denver, where she ran integrated mining, processing and supply chain operations in the United States, Europe and Asia. Prior to her last executive role, Dr Liu held senior management and operational roles at Rio Tinto throughout her career, including President – Primary Metal Pacific, Managing Director – Global Technical Services and General Manager Bell Bay Smelter.
11 John Spark BComm, FCA, MAICD 66INDEPENDENT NON-EXECUTIVE DIRECTOR
Mr Spark was appointed to the Board in September 2007. He is Chairman of the Audit and Risk Committee and a member of the Nominations Committee.Skills, experience and expertiseMr Spark has an extensive background in company reconstruction, accounting, profit improvement and financial analysis. He is a registered company auditor and former Managing Partner of Ferrier Hodgson, Melbourne. He is a former Director of ANL Limited, Baxter Group Limited, Macarthur Coal Limited and former Chairman of Ridley Corporation Limited.Former Listed Directorships (last three years)
– Chairman of Ridley Corporation Limited (2010–2015) (Director 2008–2015)
6 7 98 10 11

8�NEWCREST MINING ANNUAL REPORT 2015
Forging a stronger Newcrest
In August 2015, Newcrest released a new mission and vision statement, outlining our purpose, aspiration for the future and our roadmap for forging a stronger Newcrest.
It articulates a clear mission to deliver superior returns from finding, developing and operating gold/copper mines.
The statement also affirms our existing vision to be the Miner of Choice, and defines the four indicators that will make us the preferred partner for investors, communities, governments and employees: safety, responsibility, efficiency and profitability.
We are working to realise our vision through a high performance, no-nonsense culture focused on safety, operational discipline, cash and profitable growth, where we deliver on our commitments. Our values and practices shape who we are and guide the way we work.

NEWCREST MINING ANNUAL REPORT 2015�9
This pageExamples of safe behaviour at Newcrest
The health and safety of our workforce is a core value for Newcrest. Our clear focus remains on eliminating fatalities and life-altering injuries from our business, while striving to make continual progress on reducing all injuries and health impacts. We believe that a strong commitment to health and safety improvement will yield benefits for our workforce and for overall business performance.
Tragically we lost two of our workforce in separate incidents during the financial year. In December 2014 a Hidden Valley Joint Venture employee was killed while working in the processing plant in an incident involving mobile equipment. In May 2015, a contractor was fatally injured while operating an elevated work platform underground at the Telfer Mine. Since the end of the reporting period, in July 2015, an employee of the Hidden Valley Joint Venture was killed while operating a vehicle on a mine roadway, and most recently in September 2015 a technician was fatally injured while working underground at Cadia.
The pain of these losses has been felt throughout Newcrest, touching most heavily on those close to the deceased, and serving to strengthen the determination of everyone in the Company to eliminate fatalities and life-altering injuries from our business.
In November and December 2014 we reviewed, updated, and re-committed to our health and safety strategy. The strategy will help us eliminate fatalities and life-altering injuries, and is built on three key pillars – NewSafe, Critical Control Management, and Process Safety Management. The strategy builds on a strong foundation of group-wide systems and standards which have been implemented in recent years.
NewSafe is Newcrest’s next step in building our safety culture. There are three components to NewSafe – NewSafe Leadership which focusses on building safety leadership at all levels; NewSafe Coaching which specifically supports our frontline supervisors; and NewSafe Behaviours which takes our
employees and contractors through a process to identify the most important safety behaviours in their area, and uses a behavioural influencing model to formulate their own plan to enable and motivate these behaviours. During the year we commenced NewSafe implementation with the Telfer, Minerals and Executive teams. Implementation at the other operating sites is planned to commence in the coming year.
Building on a solid foundation of major hazard risk assessments which Newcrest has undertaken for many years, our critical control management approach will focus on verifying the operation of the controls we have identified as being critical to preventing fatalities and life-altering injuries. Assurance programs are being developed to monitor and report on critical control performance. The implementation of an expanded critical control management program will be a core activity for the coming year.
Completing our strategic approach is a continual improvement focus on Process Safety Management, an area of safety management which is primarily concerned with preventing high-consequence catastrophic events. Initially focused on Lihir processing operations, Process Safety Management systems and improvements will be embedded at Lihir before expanding to other major hazards around the Group.
To support the implementation of the health and safety strategy, a position of General Manager – Health, Safety, Environment and Security was created during the year, reporting directly to the Chief Executive Officer.
During the reporting period improvements were made to our systems for reporting, investigating and communicating incidents which we classify as ’Significant Potential Incidents’ (SPIs). SPIs are serious incidents which in slightly different circumstances could have resulted in a fatal outcome. SPIs provide the business with an opportunity to identify areas for improvement in leadership, culture, systems and procedures. We treat each of these incidents with a seriousness appropriate to their potential outcome, and each one is reviewed by the Executive Committee once investigations are completed. Learnings from these incident investigations are shared across all sites, and on-time completion of actions arising from the investigations are one of our key business performance measures.
‘ To me, safety is a key measure of success for a mining company’
CEO Sandeep Biswas at the launch of the NewSafe program aimed at eliminating fatalities and life-altering injuries.
Safety

10�NEWCREST MINING ANNUAL REPORT 2015
Operations
Projects
Exploration
Newcrest has a relatively concentrated portfolio of six operating assets, including the Cadia and Lihir mines, both of which have ore reserves exceeding 25 million ounces and expected mine lives of 30+ years. Realising the full value of significant recent investment in these assets is the key value driver for the Company. Through the Edge improvement program, Newcrest is instilling an owner’s mindset at all operations to improve performance, reduce costs and optimise capital use.
Whilst Newcrest’s near term focus remains on free cash flow and debt reduction, several growth options have been maintained. An updated pre-feasibility for the Golpu project, which splits the project into two stages, was announced during the year. This project represents Newcrest’s most exciting greenfields development option. Other projects include the Lihir Pit Optimisation Study, which seeks to optimise the mine plan and review seepage barrier options.
Newcrest has an excellent discovery record, with three of the Company’s six operations and two of its growth provinces directly resulting from Newcrest exploration activities, either through discovery or early-stage entry and resource drilling. The Company’s exploration strategy is to: extend the mine life and/or grow production or margin at each mine through brownfields exploration, resource definition and orebody knowledge work; support advancement of the Company’s development projects; and deliver the next generation of discoveries from the exploration portfolio.
Driven by a company-wide improvement program, called Edge, and a disciplined approach to operations, Newcrest focused on efficient, profitable production in FY15. Cadia East continued its ramp-up, plant reliability and performance steadily improved at Lihir and a revised, two-stage approach to Golpu was announced as the Company strives to realise the full potential of its assets.

NEWCREST MINING ANNUAL REPORT 2015�11

2015
2014
667,418
592,831
12�NEWCREST MINING ANNUAL REPORT 2015
Operations
CadiaNewcrest has invested approximately AUD 2.1 billion over five years constructingCadia East, the deepest panel cave in the world.
FY15 STATISTICS
Mining Method UndergroundResources† – Gold 44 million ounces – Copper 8.6 million tonnesReserves† – Gold 28 million ounces – Copper 4.9 million tonnesTotal Mine Production 23,576 thousand tonnesTotal Ore Milled 23,142 thousand tonnesProduction – Gold 667,418 ounces – Copper 73,697 tonnesAll-In Sustaining Cost 245 AUD per ounce of gold soldEBIT Margin 42.4 percent† Resources and Reserves are as at 31 December 2014.
667,418OUNCES
13% INCREASE
GOLD PRODUCTION
NEWCREST MINING ANNUAL REPORT 2015�13
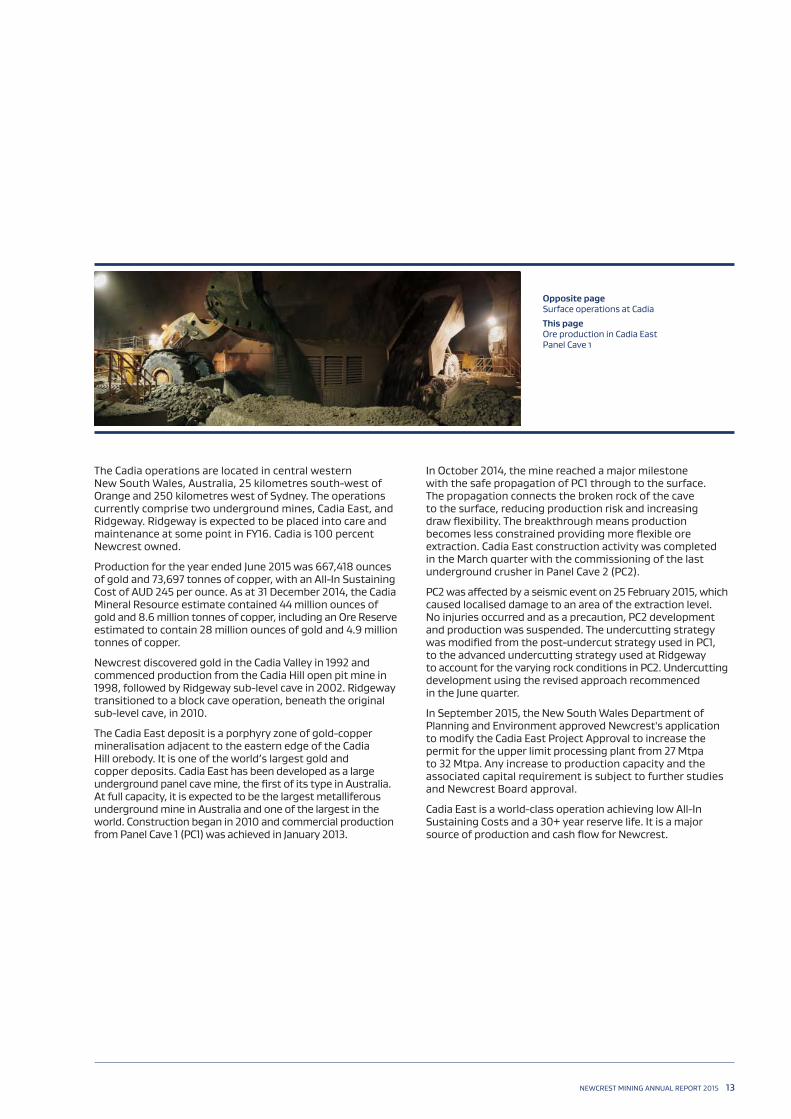
The Cadia operations are located in central western New South Wales, Australia, 25 kilometres south-west of Orange and 250 kilometres west of Sydney. The operations currently comprise two underground mines, Cadia East, and Ridgeway. Ridgeway is expected to be placed into care and maintenance at some point in FY16. Cadia is 100 percent Newcrest owned.
Production for the year ended June 2015 was 667,418 ounces of gold and 73,697 tonnes of copper, with an All-In Sustaining Cost of AUD 245 per ounce. As at 31 December 2014, the Cadia Mineral Resource estimate contained 44 million ounces of gold and 8.6 million tonnes of copper, including an Ore Reserve estimated to contain 28 million ounces of gold and 4.9 million tonnes of copper.
Newcrest discovered gold in the Cadia Valley in 1992 and commenced production from the Cadia Hill open pit mine in 1998, followed by Ridgeway sub-level cave in 2002. Ridgeway transitioned to a block cave operation, beneath the original sub-level cave, in 2010.
The Cadia East deposit is a porphyry zone of gold-copper mineralisation adjacent to the eastern edge of the Cadia Hill orebody. It is one of the world’s largest gold and copper deposits. Cadia East has been developed as a large underground panel cave mine, the first of its type in Australia. At full capacity, it is expected to be the largest metalliferous underground mine in Australia and one of the largest in the world. Construction began in 2010 and commercial production from Panel Cave 1 (PC1) was achieved in January 2013.
In October 2014, the mine reached a major milestone with the safe propagation of PC1 through to the surface. The propagation connects the broken rock of the cave to the surface, reducing production risk and increasing draw flexibility. The breakthrough means production becomes less constrained providing more flexible ore extraction. Cadia East construction activity was completed in the March quarter with the commissioning of the last underground crusher in Panel Cave 2 (PC2).
PC2 was affected by a seismic event on 25 February 2015, which caused localised damage to an area of the extraction level. No injuries occurred and as a precaution, PC2 development and production was suspended. The undercutting strategy was modified from the post-undercut strategy used in PC1, to the advanced undercutting strategy used at Ridgeway to account for the varying rock conditions in PC2. Undercutting development using the revised approach recommenced in the June quarter.
In September 2015, the New South Wales Department of Planning and Environment approved Newcrest's application to modify the Cadia East Project Approval to increase the permit for the upper limit processing plant from 27 Mtpa to 32 Mtpa. Any increase to production capacity and the associated capital requirement is subject to further studies and Newcrest Board approval.
Cadia East is a world-class operation achieving low All-In Sustaining Costs and a 30+ year reserve life. It is a major source of production and cash flow for Newcrest.
Opposite pageSurface operations at Cadia This pageOre production in Cadia East Panel Cave 1

2015
2014
688,714
721,264
14�NEWCREST MINING ANNUAL REPORT 2015
Operations
LihirLihir is one of the world’s largest gold deposits. Newcrest is focused on improving the reliability of the process plant and optimising the mine plan to achieve Lihir’s full potential for the benefit of all stakeholders.
FY15 STATISTICS
Mining Method Open PitResources† – Gold 59 million ouncesReserves† – Gold 29 million ouncesTotal Mine Production 13,096 thousand tonnesTotal Ore Milled 10,768 thousand tonnesProduction – Gold 688,714 ouncesAll-In Sustaining Cost 1,394 AUD per ounce of gold soldEBIT Margin (2.9) percent† Resources and Reserves are as at 31 December 2014.
688,714OUNCES
5% DECREASE
GOLD PRODUCTION

NEWCREST MINING ANNUAL REPORT 2015�15
The Lihir operation is 100 percent owned by Newcrest and located on the island of Niolam, 900 kilometres north-east of Port Moresby in the New Ireland Province of Papua New Guinea (PNG). It is located within the Luise Volcano Caldera on the east coast of Niolam Island. The Luise Caldera is an extinct volcanic crater that is geothermally active.
Production for the year ended June 2015 was 688,714 ounces of gold with an All-In Sustaining Cost of AUD 1,394 per ounce. As at 31 December 2014, the Lihir Mineral Resource estimate contained 59 million ounces of gold, including an Ore Reserve estimate of 29 million ounces of gold.
The Lihir deposit was discovered in 1982 and extensively drilled prior to mine construction in 1995 and the commencement of gold production in May 1997. The operation comprises a single orebody with three linked open pits, and employs a conventional open pit mining method comprising drill, blast, load and haul. Ore is predominantly refractory sulphide ore, which is treated using autoclaves and a pressure oxidisation process before the gold can be recovered by a conventional leach process.
A major expansion of the Lihir process plant and flotation circuit was completed in 2013, which substantially replicated the pre-existing process stream. The additional milling, flotation, oxygen production, autoclave and leaching capacity has provided greater flexibility in treating the different ores and stockpiles within the Lihir system.
In December 2014, Newcrest modified the operating strategy at Lihir to reduce the autoclave oxidation level for certain types of ore feed. This strategy has helped to increase throughput by reducing the autoclave residence time, which, in turn, has helped to de-constrain the milling circuit. Gold recoveries have not been significantly affected. The new strategy also helps to reduce the amount of ore blending required and increases operational flexibility during shutdowns.
Improving the uptime and intensity of the process plant is the key focus of the improvement program at Lihir. Newcrest is targeting a sustained 12 million tonnes per annum throughput rate by the end of December 2015 and a 13 million tonnes per annum rate(1) thereafter.
The majority of mill feed in FY2015 continued to be sourced from stockpiles, supplemented by direct feed ore mined from the Minifie open pit. Stockpiles will continue to provide a large percentage of mill feed as Newcrest looks to reduce stockpile relocation and maximise free cash flow.
Work continues on the Lihir Pit Optimisation Study, which seeks to optimise the mine plan and review seepage barrier options.
Opposite pageAerial view of mining operations at Lihir This pageLeft: Open pit activityRight: An employee of Lihir operations
(1) This should not be construed as production guidance from the company now or in the future. Potential production and throughput rates are subject to a range of contingencies which may affect performance.

16�NEWCREST MINING ANNUAL REPORT 2015
Operations
Telfer Gosowong
FY15 STATISTICS
Mining Method Open Pit and UndergroundResources† – Gold 12 million ounces – Copper 0.85 million tonnesReserves† – Gold 4.8 million ounces – Copper 0.36 million tonnesTotal Mine Production 27,676 thousand tonnesTotal Ore Milled 22,079 thousand tonnesProduction – Gold 520,309 ounces – Copper 23,119 tonnesAll-In Sustaining Cost 957 AUD per ounce of gold soldEBIT Margin 29.4 percent† Resources and Reserves are as at 31 December 2014.
FY15 STATISTICS*
Mining Method UndergroundResources† – Gold 1.9 million ounces – Silver 3.2 million ouncesReserves† – Gold 1.1 million ounces – Silver 1.9 million ouncesTotal Mine Production 878 thousand tonnesTotal Ore Milled 738 thousand tonnesProduction – Gold 331,555 ounces – Silver 410,970 ouncesAll-In Sustaining Cost 863 AUD per ounce of gold soldEBIT Margin 28.3 percent
* 100 percent share (Newcrest share 75%).† Resources and Reserves are as at 31 December 2014.
Telfer continued to focus on efficiency and cost reduction initiatives, as Newcrest undertook an asset options review ahead of investment in further open pit cutbacks.
The Telfer gold-copper mines are located in the Great Sandy Desert in Western Australia, approximately 400 kilometres south-east of Port Hedland and are 100 percent owned by Newcrest. Production for the year ended June 2015 was 520,309 ounces of gold and 23,119 tonnes of copper with an All-In Sustaining Cost of AUD 957 per ounce. As at 31 December 2014, the Telfer Province Mineral Resource contained an estimated 12 million ounces of gold and 0.85 million tonnes of copper, including an Ore Reserve estimated to contain 4.8 million ounces of gold and 0.36 million tonnes of copper.
The original Telfer mine reached full production in 1977. Ongoing exploration identified a large, low-grade oxide Mineral Resource in Main Dome and to the north-west in West Dome, resulting in a mill expansion in 1986 and a dump leach operation from 1988. Additional reefs on the eastern flank of Main Dome were identified in the 1990s and mined using narrow vein underground techniques. This operation was suspended in October 2000 due to escalating costs and a fall in the gold price to around AUD 300 per ounce.
Telfer now comprises an open pit and an underground mine. Open pit mining is currently focused on the Main Dome pit. The Telfer underground mine is a sub-level cave mine beneath the Main Dome open pit with a 6 million tonne per year shaft hoisting system. Ore is combined in a large, twin train, flotation treatment plant, which produces gold doré and a copper-gold concentrate.
Gosowong continues to provide good free cash flow for Newcrest. Near-mine exploration to extend the existing mine life is a focus area for the Company.
The Gosowong gold mine is located on Halmahera Island, Indonesia. It is operated by PT Nusa Halmahera Minerals, which is owned by Newcrest (75 percent interest) and PT Aneka Tambang (25 percent interest).
Gold mineralisation at Gosowong was discovered by Newcrest geologists in 1993 and comprises multiple high-grade epithermal deposits. Mining operations, which commenced in 1999, were initially open pit based, but now consist of two underground mines – Kencana and Toguraci. The processing plant at Gosowong has a capacity in excess of 800,000 tonnes per year.
Production for the year ended June 2015 was 331,555 ounces of gold at an All-In Sustaining Cost of AUD 863 per ounce. As at 31 December 2014, the Gosowong Mineral Resource estimate contained 1.9 million ounces of gold and 3.2 million ounces of silver, including an estimated Ore Reserve of 1.1 million ounces of gold and 1.9 million ounces of silver.
Improvement initiatives at Gosowong are primarily focused on managing the hot water associated with the ore at Toguraci and the challenging ground conditions at Kencana.
The province remains prospective, and exploration activity to identify further epithermal vein structures and link zones is ongoing in the greater Contract of Work area. Gosowong has a history of resources renewal.
2015
2014
331,555
344,747331,555*OUNCES OF GOLD
4% DECREASE
GOLD PRODUCTION
2015
2014
520,309
536,342520,309OUNCES OF GOLD
3% DECREASE
GOLD PRODUCTION

NEWCREST MINING ANNUAL REPORT 2015�17
Hidden Valley Bonikro
FY15 STATISTICS*
Mining Method Open PitResources† – Gold 2.7 million ounces – Silver 49 million ouncesReserves† – Gold 1.5 million ounces – Silver 28 million ouncesTotal Mine Production 8,783 thousand tonnesTotal Ore Milled 1,824 thousand tonnesProduction – Gold 94,601 ounces – Silver 892,838 ouncesAll-In Sustaining Cost 1,702 AUD per ounce of gold soldEBIT Margin (10.4) percent
* 50 percent share.† Resources and Reserves are as at 31 December 2014.
FY15 STATISTICS*
Mining Method Open PitResources† – Gold 1.8 million ouncesReserves† – Gold 1.0 million ouncesTotal Mine Production 10,631 thousand tonnesTotal Ore Milled 1,976 thousand tonnesProduction – Gold 119,970 ouncesAll-In Sustaining Cost 896 AUD per ounce of gold soldEBIT Margin 23.8 percent
* 100 percent share (Newcrest share 89.9%).† Resources and Reserves are as at 31 December 2014.
The Hidden Valley operation is located in the Morobe Province of Papua New Guinea and forms part of the Hidden Valley Joint Venture.
Hidden Valley is a gold and silver mine located approximately 90 kilometres south-west of Lae in the Morobe Province, PNG. Hidden Valley is part of the Hidden Valley Joint Venture, which is owned 50 percent by Newcrest and 50 percent by Harmony Gold Mining Company Limited.
Newcrest’s 50 percent share of production for the year ended June 2015 was 94,601 ounces of gold and 892,838 ounces of silver at an All-In Sustaining Cost of AUD 1,702 per ounce.
As at 31 December 2014, the Hidden Valley Mineral Resource estimate contained 2.7 million ounces of gold and 49 million ounces of silver (50 percent), including an Ore Reserve estimate of 1.5 million ounces of gold and 28 million ounces of silver (50 percent).
The Hidden Valley operation comprises the Hidden Valley Kaveroi and Hamata open pits, located approximately six kilometres apart, and an ore processing facility which was commissioned in August 2009. Both pits employ conventional load and haul mining techniques, with ore from the Hidden Valley Kaveroi pit then transported to the process plant via an overland conveyor.
Newcrest has developed near-mine alternative ore sources within economic distance from the Bonikro plant and is using the operation as a platform for regional exploration.
The Bonikro operation is located in the central-southern portion of the West African nation of Côte d’Ivoire, approximately 250 kilometres north-west of the commercial capital of Abidjan. It is 89.9 percent Newcrest owned.
Production for the year ended June 2015 was 119,970 ounces of gold with an All-In Sustaining Cost of AUD 896 per ounce. As at 31 December 2014, the Bonikro Mineral Resource was estimated to contain 1.8 million ounces of gold, including an Ore Reserve estimated to contain 1.0 million ounces of gold.
Construction of the Bonikro mine began in May 2007, with gold production commencing in October 2008. The operation employs a conventional open pit mining method comprising drill, blast, load and haul. The predominant method of gold recovery is via carbon in leach technology, with some gold recovered via a gravity circuit.
Newcrest accessed first ore from the nearby Hiré oxide pit in the second half of FY2015 and continues to develop near-mine alternative ore sources within economic distance from the Bonikro plant. The Bonikro operation is being used as a platform for exploration in Côte d’Ivoire and the region.
2015
2014
119,970
94,994119,970*OUNCES OF GOLD
26% INCREASE
GOLD PRODUCTION
2015
2014
94,601
105,84594,601*OUNCES OF GOLD
11% DECREASE
GOLD PRODUCTION

18�NEWCREST MINING ANNUAL REPORT 2015
Projects
Wafi-GolpuWafi-Golpu is a world-class deposit in a highly prospective mineralised belt. An updated Golpu pre-feasibility study has identified an improved business case for the project by splitting it into two stages.
FY15 STATISTICS*
Mining Method Potential Open Pit and UndergroundResources† – Gold 14 million ounces – Copper 4.7 million tonnesReserves† – Gold 6.2 million ounces – Copper 2.7 million tonnes
* 50 percent share.† Resources and Reserves are as at 31 December 2014.
14*OUNCES OF GOLD RESOURCE (MILLIONS)
GOLD RESOURCE

NEWCREST MINING ANNUAL REPORT 2015�19
Wafi-Golpu, located in the Morobe Province of Papua New Guinea (PNG) approximately 65 kilometres south-west of the town of Lae, is an advanced exploration project that forms part of the Wafi-Golpu Joint Venture (Newcrest 50 percent). The PNG Government retains the right to purchase, for its pro-rata share of historical costs, up to a 30 percent equity interest in any mineral discovery at Wafi-Golpu, at any time before the commencement of mining.
Wafi-Golpu comprises an extensive body of gold-only epithermal style mineralisation (Wafi) and deeper porphyry related copper-gold mineralisation (Golpu and Nambonga). The Golpu and Wafi deposits are located in close proximity to each other, with Golpu located below and immediately north of the Wafi deposit.
As at 31 December 2014, the Wafi-Golpu Mineral Resource was estimated to contain 14 million ounces of gold and 4.7 million tonnes of copper (50 percent), including an Ore Reserve estimated to contain 6.2 million ounces of gold and 2.7 million tonnes of copper (50 percent).
An update to the 2012 technical pre-feasibility study, released in December 2014, confirmed Golpu as a world-class deposit and identified an improved business case for the project by splitting it into two stages. Stage one targets the upper higher-value portion of the orebody and stage two will encompass the rest of the ore reserve. The Board of Newcrest has approved stage one progressing to feasibility study and for work to continue on updating the 2012 pre-feasibility study for stage two.
Stage one of the updated pre-feasibility study consists of two block cave mines, with the initial block cave operating at 3 Mtpa, which will be replaced by a deeper block cave operating at 6 Mtpa in steady state from 2024. Stage two of the updated 2012 pre-feasibility study will focus on a third block cave mine.
A total of 52,046 metres of new drill core samples were incorporated into this study significantly improving the understanding of the geological framework. This has redefined the boundaries of the high-grade porphyry event in the upper part of the orebody to be mined by block caving method. This has enabled a reduction in the size of the block caves’ footprint compared with the 2012 pre-feasibility study, thereby significantly reducing capital requirements. The updated understanding of the Mineral Resource formed the basis of the stage one optimisation.
In the updated pre-feasibility study (1) stage one has an approximate mine life of 27 years, with annual production expected to peak at 320,000 ounces of gold and 150,000 tonnes of copper in 2025. Maximum cumulative negative cash flow is forecast to be USD 1.6 billion (100 percent terms), cash costs are expected to be at the bottom of the industry curve and first ore is expected in 2020.
Central to the development of the project will be ongoing engagement with key stakeholders, including the Papua New Guinea and Morobe Province governments, landholders and community representatives to establish a suitable and sustainable framework for advancing the project.
The Golpu development option has the potential to underpin production growth at Newcrest in the next decade. Both the stage one feasibility study and the pre-feasibility study for stage two are targeted to be released by the end of calendar year 2015 at which time the mineral resource and ore reserve will be reviewed and the Boards of Newcrest and Harmony will give further consideration to the development options.
Opposite pageOrebody model for Wafi-GolpuThis pageWafi-Golpu site, Morobe Province, Papua New Guinea
(1) Estimates are from a pre-feasibility study and as such are subject to an accuracy range of ±25%

20�NEWCREST MINING ANNUAL REPORT 2015
Projects
Other
Newcrest is focused on maximising free cash flow and generating a return on recent investments; however, growth options and studies have also been retained for future potential development.
Lihir Pit Optimisation StudyDevelopment of the Kapit open pit is an important part of the long-term production profile at Lihir. It will provide access to the high-grade deposit in the northern section of the Lihir orebody, which is linked to the existing Minifie and Lienetz pits.
O’CallaghansO’Callaghans is a tungsten and base metal deposit, located within 10 kilometres of the Telfer process plant. It has a Mineral Resource of 260 thousand tonnes of tungsten trioxide, 390 thousand tonnes of zinc and 190 thousand tonnes of lead.
Namosi
Namosi is a porphyry copper system in the Pacific Islands, with a Mineral Resource containing 5.3 million ounces of gold and 5.3 million tonnes of copper (69.94 percent).
The Namosi project, which is located approximately 30 kilometres west of Fiji’s capital city, Suva, is centred on a district that has been periodically explored over the past 40 years and is highly prospective for copper-gold porphyry systems.
In late 2007, Newcrest signed a joint venture agreement with Nittetsu Mining Co. Ltd and Mitsubishi Materials Corporation to establish the Namosi Joint Venture to explore for porphyry copper-gold and epithermal style gold mineralisation in the Namosi region of Fiji. Newcrest has a 69.94 percent interest in the Namosi Joint Venture and is the manager of the exploration activities.
As at 31 December 2014, the Namosi Mineral Resource contained 5.3 million ounces of gold and 5.3 million tonnes of copper (69.94 percent), along with an Ore Reserve of 3.6 million ounces of gold and 3.5 million tonnes of copper (69.94 percent).
The Namosi project is centred on a large porphyry copper-gold complex that contains the Waisoi Deposits, Waivaka Corridor, Wainabama and a portfolio of early stage regional targets. The Namosi Joint Venture has explored the known deposits at Waisoi and the Waivaka Corridor, and has been successful in delivering Waisoi Reserves and the discovery of Wainaulo within the Waivaka Corridor. Wainabama remains a higher-grade historic prospect.
Additional exploration is planned to assess the potential of discovering new zones of mineralisation within regional targets, including the potential for near surface higher-grade mineralisation. Drilling is also planned to test for higher-grade mineralisation at depth at Wainabama.
FY15 STATISTICS*
Mining Method Potential Open PitResources† – Gold 5.3 million ounces – Copper 5.3 million tonnesReserves† – Gold 3.6 million ounces – Copper 3.5 million tonnes
* 69.94 percent share.† Resources and Reserves are as at 31 December 2014.
5.3*OUNCES OF GOLD RESOURCE (MILLIONS)
GOLD RESOURCE

NEWCREST MINING ANNUAL REPORT 2015�21
Newcrest has an excellent discovery record, with three of the Company’s six operations and two of its growth provinces a direct result of Newcrest exploration activities, either through discovery or early-stage entry and resource drilling.
Newcrest’s exploration strategy is to extend the mine life and/or grow production or margin at each mine through brownfields exploration, resource definition and orebody knowledge work; support advancement of the Company’s development projects; and deliver the next generation of discoveries from the exploration portfolio.
During the 2015 financial year, Newcrest exploration programs continued in and around the Company’s mining operations (brownfield exploration); however, the main focus was the commencement of the search for next generation of new discoveries, with the first step being the capture of high-quality exploration stage projects to improve the quality of the growth pipeline (greenfield exploration).
The brownfield exploration program continued at Telfer, Cadia, Bonikro and Gosowong. At Gosowong, the search for new discoveries was ongoing. Gosowong is prospective with significant potential for incremental growth adjacent to the existing underground operations at Toguraci and Kencana. In 2014, prior to depletion, the mineral resource increased by 0.4Moz Au due to incremental additions at both Kencana and Toguraci. The development of a new exploration model and application of new geophysical techniques was successful in defining a portfolio of exploration targets within the regional Contract of Work area. Drill testing of these targets is presently underway.
The greenfield exploration program focused on capturing high-quality exploration stage projects to increase the prospectivity of the exploration portfolio. A number of new projects were added to the pipeline, including the Wamum Project (PNG), Mungana Exploration Project (Australia) and the Southern Coromandel Exploration Project (New Zealand). The search for new projects is ongoing within Asia-Pacific, West Africa and a number of key global gold belts.
The Wamum Project, located 22 kilometres north-west of the Wafi-Golpu project, is an advanced exploration project that contains two known copper-gold porphyry systems – Wamum and Idzan Creek. The Wamum purchase is subject to satisfaction of conditions precedent.
The Mungana Exploration Project is a new project centred on the Red Dome and Mungana historic mining centre, west of Cairns, North Queensland. Newcrest has entered into an Expenditure Commitment Agreement with Atherton Resources Ltd pursuant to which Newcrest has the potential to earn a 70 percent interest in the Exploration Project. Newcrest is searching for underground porphyry related Gold-Copper deposits that would be amenable to bulk underground mining techniques. The Exploration Project has the potential for new discoveries within the main mine corridor and the Red Cap area.
The Southern Coromandel Exploration Project is a new project located in one of the world’s premier epithermal districts in the Southern Coromandel, New Zealand. The farm-in agreement is between Newcrest and Laneway Resources. Newcrest has the right to earn an 80 percent interest in the project by sole funding a two-stage work program associated within the tenement package. The Exploration Project lies within a gold corridor that contains the historic Golden Cross and Karangahake gold mines, and is in the same district as the operating Waihi mine. Historic mining has occurred within the project area along a number of veins in the Waitekauri Valley project area. Newcrest is searching for high-grade vein style mineralisation amenable to underground and/or open pit mining.
Exploration also continued on our existing greenfield projects at Wailevu West (Fiji), Morobe province (PNG) and Côte D’Ivoire regional tenement packages.
The Wailevu West project is located in southern central Vanua Levu, Fiji. The project comprises a single tenement encompassing the historic Mt Kasi gold mine and surrounding highly prospective ground. Newcrest’s initial exploration programs have demonstrated potential for discovery of porphyry related gold-copper mineralisation.
Exploration within the Morobe province focused on target generation work within the highly prospective Wafi-Golpu project area. Within Côte D’Ivoire the search for new discoveries was undertaken on the regional tenement packages at Bouafle and Dabakala, located to the north-west and north of the Bonikro mine. Newcrest is also looking for new projects within West Africa.
This pageExploration drillingOpposite pageCore samples
Exploration
22�NEWCREST MINING ANNUAL REPORT 2015
Sustainability
Newcrest is committed to supporting positive economic and social outcomes, as well as minimising environmental impacts in the regions where we operate.

NEWCREST MINING ANNUAL REPORT 2015�23
Opposite pageSoil sampling at TelferThis pageExamples of community engagement; involvement in civil projects; and environmental monitoring at Newcrest
We work closely with governments, communities, civil society organisations and other local stakeholders to ensure that Newcrest’s sustainability objectives and programs are aligned with local priorities and expectations. We know that sharing the benefits of mining with our host communities and managing the impacts from our mines is the right thing to do and this philosophy underpins Newcrest’s vision to be the Miner of Choice™.
Newcrest continues to make significant progress on key sustainability objectives. We also continue to implement a wide range of sustainability and community programs focusing on economic and social development, health and safety and environmental management.
The Safety and Sustainability Committee, a committee of the Board, provides oversight of strategic safety, health, environment, and community aspects to complement the management activities of the Executive Committee in relation to sustainability programs. In addition, during the reporting period, an Executive Health and Safety Leadership Team was established, comprised of the Executive Committee and site General Managers that meet monthly to focus exclusively on Group safety and health improvements.
Newcrest strengthened its commitment to protecting and respecting human rights by becoming a member of the Voluntary Principles on Security and Human Rights (VPSHR) in March 2015. We continue to be a member of the Extractive Industries Transparency Initiative (EITI), and support the EITI principles and reporting in the countries in which we operate.
The health and safety of our workforce and the wellbeing of our neighbouring communities continues to be a core priority, and critical measure of our business success. Tragically, during the 2015 financial year, we lost two of our workforce in workplace incidents. In December 2014, an employee of the Hidden Valley Joint Venture was fatally injured when he was hit by mobile equipment in the processing plant area. In May 2015, a contractor was fatally injured while operating an elevated work platform underground at Telfer Gold Mine. Subsequent to the reporting period, in July 2015, an employee of the Hidden Valley Joint Venture was fatally injured in a mobile equipment incident on-site, and most recently in September 2015 a technician was fatally injured while working underground at Cadia.
During the year, we refreshed and continued implementation of our health and safety strategy. The first core element of the strategy is our ‘NewSafe’ approach to safety culture and leadership improvement, which focuses on behavioural influencers to support our workforce in choosing more safe behaviours. The second core element is a continued focus on Major Hazard management, including Major Hazard risk assessments and thorough investigation of Significant Potential Incidents.
Programs aimed at reducing the incidence of malaria and other diseases continued across all sites, along with a focus on workforce health and wellbeing.
Community development programs of a wide-ranging nature continue to be rolled out across all of our operating sites, with a particular emphasis on fostering non-mine dependent economic activity and the development of community capacity for self-management.
Further information about sustainability at Newcrest, including our 2014 Sustainability Report, can be found on our website w�w�w�.�newcrest�.�com�.�au�/�sustainability.

24 NEWCREST MINING ANNUAL REPORT 2015
Mineral Resources and Ore Reserves
Other changes to the Group Mineral Resources, prior to depletion, include an increase at Gosowong of 0.4 million ounces of gold due to incremental additions at both Kencana and Toguraci, and decreases at the remnant Cadia Hill open pit of 2.1 million ounces of gold and 0.2 million tonnes of copper, and at Bonikro of 0.3 million ounces of gold, both due to the application of more conservative notional constraining pit-shells and increased cut-off grades.
As at 31 December 2014, Group Ore Reserves are estimated to contain 75 million ounces of gold, 11 million tonnes of copper and 74 million ounces of silver. This represents a decrease of approximately 3 million ounces of gold (~4 percent), 0.3 million tonnes of copper (~2 percent) and 3 million ounces of silver (~4 percent) compared with the estimate as at 31 December 2013. The change in Group Ore Reserves includes estimated depletion of approximately 3 million ounces of gold and 0.1 million tonnes of copper and 3 million ounces of silver. A summary comparison to the previous year’s Ore Reserve estimate is shown in the Comparison Table – Ore Reserves.
The Group Ore Reserves as at 31 December 2014 includes a material change for the Telfer Main Dome open pit estimates, as against the 31 December 2013 estimate, with a decrease of approximately 1 million ounces of gold and less than 0.1 million tonnes of copper, prior to depletion. This change is driven by proposed selective underground mining of deeper higher-grade M Reefs and a change to the long-term exchange rate assumption.
Other changes to Group Ore Reserves, prior to depletion, include a decrease at Bonikro of 0.3 million ounces of gold due to redesign of Push Back 5 and application of increased cut-off grades, partially offset by increases at Gosowong of 0.3 million ounces of gold due to incremental additions at both Kencana and Toguraci, and at Lihir of 0.5 million ounces of gold due to pit redesign.
Newcrest Mining Limited releases its Annual Statement of Mineral Resource and Ore Reserve estimates and Explanatory Notes as of 31 December each year. The Statement for the period ending 31 December 2014 was released on 13 February 2015, and can be found on Newcrest’s website at w w w . newcrest . com . au. This section of the Annual Report includes relevant information set out in that Statement. Changes that have occurred in the six months ending 30 June 2015 due to mining depletion and other adjustments are noted below. Newcrest is not aware of any new information or data that materially affects the information contained in the Annual Mineral Resource and Ore Reserve Statement for the period ending 31 December 2014.
For the purposes of the Annual Mineral Resources and Ore Reserves Statement as at 31 December 2014, Newcrest has completed a detailed review of all production sources. The review has taken into account updated long-term metal price, foreign exchange and cost assumptions, and mining and metallurgy performance to inform cut-off grades and physical mining parameters. This has resulted in the most marginal ounces being removed from the portfolio and these are reflected in changes to Mineral Resources and Ore Reserves.
As at 31 December 2014, Group Mineral Resources are estimated to contain 140 million ounces of gold, 20 million tonnes of copper and 130 million ounces of silver. This represents a decrease of approximately 8 million ounces of gold (~5 percent), 0.4 million tonnes of copper (~2 percent) and 1 million ounces of silver (~1 percent), compared with the estimate as at 31 December 2013. The change in Group Mineral Resources includes estimated mining depletion of approximately 3 million ounces of gold, 0.1 million tonnes of copper and 3 million ounces of silver. A summary comparison to the previous year’s Mineral Resource estimate is shown in the Comparison Table – Mineral Resources. In all circumstances Mineral Resources are reported inclusive of Ore Reserves.
The Group Mineral Resources as at 31 December 2014 includes a material change for the Telfer Main Dome open pit Mineral Resource estimate, as against the 31 December 2013 estimate, with a decrease of approximately 2.6 million ounces of gold and 0.1 million tonnes of copper, prior to depletion. This change is driven by proposed selective underground mining of deeper higher grade M Reefs and a change to the long-term exchange rate assumption.

NEWCREST MINING ANNUAL REPORT 2015 25
Comparison Tables – Mineral Resources*As at 31 December 2014 As at 31 December 2013
Mineral Resources Tonnes Grade Contained Metal Tonnes Grade Contained Metal
Gold Mt Au (g/t) Au (Moz) Mt Au (g/t) Au (Moz)Cadia Valley 3,300 0.41 44 3,600 0.41 47Telfer 400 0.93 12 560 0.83 15Lihir 790 2.3 59 880 2.1 60MMJV (50%) (Hidden Valley/ Wafi/ Golpu/ Nambonga)
680 0.77 17 640 0.83 17
Namosi (69.94%) 1,500 0.11 5.3 1,600 0.11 5.5Other (Gosowong/ Bonikro/ Marsden) 320 0.48 5.1 290 0.58 5.3
Total 7,000 0.63 140 7,600 0.62 150
Copper Mt Cu (%) Cu (Mt) Mt Cu (%) Cu (Mt)Cadia Valley 3,300 0.26 8.6 3,600 0.25 8.9Telfer (inc. O’Callaghans) 490 0.18 0.85 650 0.15 1.0MMJV (50%) (Golpu/ Nambonga) 560 0.85 4.7 520 0.88 4.5Namosi (69.94%) 1,500 0.35 5.3 1,600 0.34 5.5Marsden 280 0.29 0.83 230 0.34 0.78
Total 6,200 0.33 20 6,600 0.31 21
Silver# Mt Ag (g/t) Ag (Moz) Mt Ag (g/t) Ag (Moz)
Total 3,700 1.1 130 3,600 1.1 130
Tungsten trioxide (O’Callaghans) Mt WO3 (%) WO3 (Mt) Mt WO3 (%) WO3 (Mt)
Total 78 0.33 0.26 78 0.33 0.26
Zinc (O’Callaghans) Mt Zn (%) Zn (Mt) Mt Zn (%) Zn (Mt)
Total 78 0.50 0.39 78 0.50 0.39
Lead (O’Callaghans) Mt Pb (%) Pb (Mt) Mt Pb (%) Pb (Mt)
Total 78 0.25 0.19 78 0.25 0.19
* Data shown is reported to two significant figures to reflect appropriate precision in the estimate and this may cause some apparent discrepancies in totals. Refer to the footnote to the Mineral Resource Tables for ownership details.
# Includes Cadia Valley Operations, MMJV-Hidden Valley Operations/Wafi-Golpu (50 percent interest) and Gosowong.
Comparison Tables – Ore Reserves*As at 31 December 2014 As at 31 December 2013
Ore Reserves Tonnes Grade Contained Metal Tonnes Grade Contained Metal
Gold Mt Au (g/t) Au (Moz) Mt Au (g/t) Au (Moz)Cadia Valley 1,800 0.49 28 1,800 0.49 28Telfer 180 0.83 4.8 230 0.85 6.3Lihir 380 2.4 29 390 2.3 29MMJV (50%) (Hidden Valley/ Golpu) 250 0.95 7.7 260 0.96 7.9Namosi (69.94%) 930 0.12 3.6 940 0.12 3.6Other (Gosowong/ Bonikro) 27 2.5 2.2 36 2.3 2.7
Total 3,500 0.66 75 3,700 0.66 78
Copper Mt Cu (%) Cu (Mt) Mt Cu (%) Cu (Mt)
Cadia Valley 1,800 0.28 4.9 1,800 0.28 5.1Telfer (inc. O’Callaghans) 220 0.16 0.36 290 0.16 0.46MMJV (50%) (Golpu) 230 1.2 2.7 230 1.2 2.7Namosi (69.94%) 930 0.37 3.5 940 0.37 3.5
Total 3,100 0.37 11 3,200 0.36 12
Silver# Mt Ag (g/t) Ag (Moz) Mt Ag (g/t) Ag (Moz)
Total 1,900 1.2 74 2,000 1.2 77
Tungsten trioxide (O’Callaghans) Mt WO3 (%) WO3 (Mt) Mt WO3 (%) WO3 (Mt)
Total 49 0.35 0.17 59 0.34 0.20
Zinc (O’Callaghans) Mt Zn (%) Zn (Mt) Mt Zn (%) Zn (Mt)
Total 49 0.71 0.35 59 0.62 0.36
Lead (O’Callaghans) Mt Pb (%) Pb (Mt) Mt Pb (%) Pb (Mt)
Total 49 0.35 0.17 59 0.30 0.18
* Data shown is reported to two significant figures to reflect appropriate precision in the estimate and this may cause some apparent discrepancies in totals. Refer to the footnote to the Mineral Resource Tables for ownership details.
# Includes Cadia Valley Operations, MMJV-Hidden Valley Operations/Golpu (50 percent interest) and Gosowong.

26 NEWCREST MINING ANNUAL REPORT 2015
Updated mining, metallurgical and long-term cost assumptions were developed with reference to recent performance data. The revised long-term assumptions include performance improvements consistent with changing activity levels at each site over the life of the operation and the latest approved study for each deposit.
Long-term metal price and foreign exchange assumptions for Mineral Resources and Ore Reserves are set out below.
Long-term Metal Price Assumptions Newcrest Managed MMJV Managed
Mineral Resource Estimates
Gold – USD/oz 1,350.00 1,400.00
Copper – USD/lb 3.40 3.50
Silver – USD/oz 23.00 25.00
Ore Reserve Estimates
Gold – USD/oz 1,250.00 1,250.00
Copper – USD/lb 3.00 3.10
Silver – USD/oz 20.00 21.00
Long-term Exchange Rate USD: AUD 0.85 0.90
Changes from 31 December 2013 include an increase in copper metal price assumption for Mineral Resources (from USD 3.10/lb to USD 3.40/lb), increased copper metal price assumption for Ore Reserves (USD 2.70/lb to USD 3.00/lb), and increased USD:AUD exchange rate assumption (0.85) for Newcrest managed Mineral Resources and Ore Reserves. MMJV long-term metal price and exchange rate assumptions remain unchanged.
Where appropriate, Mineral Resources are also spatially constrained within notional mining volumes based on metal prices of USD 1,400/oz for gold and USD 4.00/lb for copper. This is the approach adopted to eliminate mineralisation that does not have reasonable prospects of eventual economic extraction from Mineral Resource estimates.
The Annual Statement, 31 December 2014, of Mineral Resources and Ore Reserves has been prepared in accordance with the 2012 Edition of the ‘Australasian Code for Reporting of Exploration Results, Mineral Resources and Ore Reserves’ (the JORC Code 2012). Information prepared and first disclosed under the JORC Code 2004 Edition and not related to a material mining project and which has not materially changed since last reported has not been updated.
Mineral Resource and Ore Reserve estimates reported for the MMJV are based on Competent Persons’ statements provided by the MMJV and are quoted as Newcrest’s 50 percent interest.
COMPETENT PERSON’S STATEMENT
The information in this Annual Report that relates to Mineral Resources and Ore Reserves has been approved by Mr K. Gleeson. Mr Gleeson is the Head of Mineral Resource Management and a full-time employee of Newcrest Mining Limited. He holds Newcrest shares and is entitled to participate in Newcrest’s executive equity long term incentive plan, details of which are included in Newcrest’s 2015 Remuneration Report. Ore Reserves growth is one of the performance measures under that plan. He is a Member of The Australasian Institute of Mining and Metallurgy. Mr Gleeson has sufficient experience which is relevant to the styles of mineralisation and types of deposits under consideration and to the activity which he is undertaking to qualify as a Competent Person as defined in the JORC Code 2012. Mr Gleeson consents to the inclusion in this Annual Report of the Mineral Resources and Ore Reserves Statement and other references to Mineral Resource and Ore Reserves in the form and context in which they appear.
The information in this report that relates to specific Mineral Resources and Ore Reserves is based on and accurately reflects reports prepared by the Competent Persons named in the footnotes to the Minerals Resources and Ore Reserves Tables. Each of these persons, other than Mr G. Job, is a full-time employee of Newcrest Mining Limited or its relevant subsidiaries, holds options (and in some cases, shares) in Newcrest Mining Limited and is entitled to participate in Newcrest’s executive equity long term incentive plan, details of which are included in Newcrest’s 2015 Remuneration Report. Ore Reserves growth is one of the performance measures under that plan. Mr Job is a full time employee of Harmony Gold Mining Company Limited, Newcrest’s joint venture partner in each of the MMJVs. All the Competent Persons named are Members of The Australasian Institute of Mining and Metallurgy and/or The Australian Institute of Geoscientists, and have sufficient experience which is relevant to the styles of mineralisation and types of deposits under consideration and to the activity which they are undertaking to qualify as a Competent Person as defined in the JORC Code 2012. Each Competent Person consents to the inclusion of material in the form and context in which it appears.
Mineral Resources and Ore Reserves

NEWCREST MINING ANNUAL REPORT 2015 27
GOVERNANCE
Newcrest has a policy for the Public Reporting of Exploration Results, Mineral Resources and Ore Reserves. This policy provides a clear framework for how Newcrest manages all public reporting of Exploration Results, Mineral Resources and Ore Reserves, ensuring compliance with the JORC Code 2012. This policy applies to all regulatory reporting, public presentations and other publicly released company information at both local (site) and corporate levels.
Newcrest has in place a Resource and Reserve Steering Committee (RRSC). The role of the Committee is to ensure the proper functioning of Newcrest’s Resource and Reserves development activity and reporting. The Committee’s control and assurance activities respond to a four-level compliance process:1. Provision of standards and guidelines, and approvals
consequent to these;2. Resources and Reserves reporting process, based on
well-founded assumptions and compliant with external standards (JORC Code 2012, ASX Listing Rules);
3. External review of process conformance and compliance;4. Internal assessment of compliance and data veracity.
Updates to the Mineral Resource and Ore Reserve estimates at 31 December 2014 were completed in accordance with the RRSC governance and review process. This included reporting in compliance with the JORC Code 2012, training and endorsement of suitably qualified Competent Persons, independent external review of Mineral Resources and Ore Reserves at least every three years or where there is a material change and endorsement by the RRSC prior to release to the market.
CHANGES SINCE 31 DECEMBER 2014
Mineral Resource and Ore Reserve Statement Newcrest is not aware of any new information or data that materially affects the information contained in the Annual Mineral Resource and Ore Reserve Statement 31 December 2014 other than changes due to normal mining depletion and other adjustments that occurred during the six months ended 30 June 2015. These changes are summarised by province below.
Newcrest’s Annual Statement of Mineral Resources and Ore Reserves is based upon a number of factors, including (without limitation) actual exploration and production results, economic assumptions (such as future commodity prices and exchange rates) and operating and other costs. No changes were made to those assumptions during the period to 30 June 2015. However, in preparing the Annual Statement of Mineral Resources and Ore Reserves for the period ended 31 December 2015, Newcrest proposes to review long-term foreign exchange rate, metal price and cost assumptions. There are also specific ongoing studies at Lihir, Telfer and the MMJV managed Hidden Valley Operation and Wafi Golpu Project. At this stage, the impact that the assumption changes or outcomes of the ongoing studies will have on Newcrest’s Mineral Resources and Ore Reserves estimates for the period ending 31 December 2015 has not been determined.
CADIA VALLEY (NSW)
Mineralisation recognised to date in the Cadia Province is porphyry related gold and copper, hosted in rocks of Ordovician age. Orebodies are typically large tonnage, lower-grade gold with strong copper by-product and minor base metal associations. Minor molybdenum and silver mineralisation is also present. Ore is sourced by bulk mining methods from open pit and underground operations. Exploration is ongoing within the Cadia Province, targeting large-scale alteration systems located within the regional tenement package.
Cadia Hill Open PitThe Cadia Hill Mineral Resource and Ore Reserve including stockpiles remain unchanged since 31 December 2014. Open pit mining at Cadia Hill was suspended in June 2012 at the completion of stage 3. Timing of the final pit stage has yet to be confirmed.
Cadia ExtendedThe Cadia Extended underground resource is located to the north-west of Cadia Hill beneath the backfilled Cadia Extended pit and is unchanged since 31 December 2014. An updated Mineral Resource estimate is scheduled for completion by the end of calendar year 2015. No Ore Reserve has been estimated for Cadia Extended.
Big CadiaBig Cadia mineralisation is skarn style and has been evaluated as a gold and copper bearing Mineral Resource for future development by open pit mining. The Big Cadia Mineral Resource is unchanged since 31 December 2014. An updated Mineral Resource estimate is scheduled for completion by the end of calendar year 2015. No Ore Reserve is currently estimated for Big Cadia.
Ridgeway UndergroundRidgeway Underground is a large-scale underground mine using sub-level cave (SLC) extraction and block caving (Ridgeway Deeps) below the sub-level cave. Since 31 December 2014, both the Mineral Resource and Ore Reserves have been depleted by 0.11 million ounces of gold and 0.02 million tonnes of copper. Ridgeway Lift 1 is currently in operation with the timing of the commencement of the Lift 2 mine yet to be confirmed.
Cadia East UndergroundCadia East is a lower-grade, porphyry related gold and copper deposit located immediately east of Cadia Hill, with mining based on bulk underground extraction by panel caving methods. Commercial production from initial Panel Cave 1 (PC1) commenced in January 2013. Development and undercutting activities continue in the second Panel Cave (PC2).
Since 31 December 2014, both the Mineral Resource and Ore Reserve have been depleted by 0.30 million ounces of gold and 0.02 million tonnes of copper.

28 NEWCREST MINING ANNUAL REPORT 2015
TELFER (WA)
Gold and copper mineralisation in the Telfer Province is intrusion related and occurs as higher-grade stratabound reefs, discordant veins and lower-grade bulk tonnage stockwork zones.
The Telfer operation is comprised of open pit mining at both Main Dome and West Dome and underground mining at Main Dome. Open pit mining is a conventional truck and hydraulic excavator operation. Selective mining techniques are used for excavation of the high-grade reefs, while stockwork ore and waste are mined using bulk methods. Underground mining utilises the SLC method for bulk extraction with ore hoisted to the surface via a shaft and selective long hole open stope mining of high-grade reefs.
The Telfer Future Options Review has led to a decision to retain Telfer. Initial open pit cutbacks of West Dome Stage 2 and Main Dome Stage 6/7 have been approved with future open pit cutbacks still subject to study.
Since December 2014, exploration has continued in the Telfer region. Exploration is focused on discovering and developing additional higher-grade underground resources at Main Dome and generation of new targets within regional tenements.
Main Dome Open PitOpen pit mining has been ongoing in Stage 4. Since 31 December 2014 both the Mineral Resource and Ore Reserve (including open pit stockpiles from West Dome and Main Dome) have been depleted by 0.18 million ounces of gold and 0.01 million tonnes of copper.
West Dome Open PitThe West Dome deposit is located two kilometres north-west of the Main Dome deposit. The West Mineral Resource and Ore Reserve are unchanged since 31 December 2014.
Telfer UndergroundThe Telfer Underground comprises the operating SLC mine and selective high-grade reef mining external to the SLC. Since 31 December 2014, the Mineral Resource and Ore Reserve have both been depleted by 0.09 million ounces of gold and 0.01 million tonnes of copper.
Vertical Stockwork Corridor (VSC)The VSC deposit lies directly below the existing Telfer Deeps Underground SLC. The VSC Mineral Resource and Ore Reserve are unchanged since 31 December 2014. Timing for the development of the VSC is yet to be determined.
O’CallaghansThe O’Callaghans poly-metallic deposit is located approximately 10 kilometres south of the Telfer Gold Mine. The mineralisation contains tungsten, copper, zinc and lead as a sub-horizontal layer of poly-metallic skarn (altered limestone). The O’Callaghans Mineral Resource and Ore Reserve are unchanged since 31 December 2014. Timing for the development of O’Callaghans is yet to be determined.
Telfer Satellite DepositsThe Telfer Satellite Deposits lie within a zone located approximately 30 kilometres from the Telfer Gold Mine. The ‘Satellites’ are a group of structurally controlled gold deposits, including Backdoor West, Dolphy, Big Tree and the Camp Dome copper deposit. The Telfer Satellite Mineral Resource is unchanged since 31 December 2014. An updated Mineral Resource estimate is scheduled for completion at the end of calendar year 2015. No Ore Reserve has been estimated for Telfer Satellite Deposits.
LIHIR (PNG)
The Lihir Gold Mine is located on Niolam Island, 900 kilometres north-east of Port Moresby in the New Ireland Province of Papua New Guinea (PNG). Lihir is a volcanic sea mount that rises steeply from sea level to approximately 600 metres above sea level. The Luise Caldera, in which all of the known ore deposits are located, is on the east coast of the island.
The Lihir Gold Mine consists of three linked open pits, Minifie, Lienetz and Kapit, that will be mined over the life of the project. Mining is by conventional open pit methods.
Since 31 December 2014, the insitu pit Mineral Resource and Ore Reserve have been depleted by 0.38 million ounces of gold. Both the Mineral Resource and Ore Reserve in Lihir stockpiles have decreased by 0.18 million ounces of gold through mining depletion and stockpile adjustments.
The Lihir Optimisation study, looking to optimise both mine plan sequence and seaward mining constraint, is targeted for completion by the end of December 2015.
GOSOWONG (INDONESIA)
Gosowong is located on Halmahera Island in North Maluku Province in the eastern part of the Republic of Indonesia. Gosowong is owned and operated by PT Nusa Halmahera Minerals, an incorporated joint venture between Newcrest (75 percent) and PT Aneka Tambang (25 percent). For the purpose of reporting Mineral Resources and Ore Reserves, Newcrest reports 100 percent of the assets. Economic mineralisation in the Gosowong province is low sulphidation epithermal veining containing high-grade gold and silver.
The Gosowong operation includes the Kencana and Toguraci mines. Newcrest has an active exploration program in place at Gosowong that is focused on defining additional resources within the vicinity of the current underground operations at Toguraci and Kencana and surrounding goldfields.
KencanaAt Kencana since 31 December 2014, both the Mineral Resource and Ore Reserve have been depleted by 0.09 million ounces of gold.
ToguraciAt Toguraci since 31 December 2014, the Mineral Resource has been depleted by 0.11 million ounces of gold and the Ore Reserve has been depleted by 0.10 million ounces of gold.
Mineral Resources and Ore Reserves

NEWCREST MINING ANNUAL REPORT 2015 29
Other Deposits (Gosowong UG, Tailings and Stockpiles)The Gosowong Mineral Resource is located beneath the existing completed Gosowong open pit and also includes reclaimed tailings and minor operational stockpiles. The Mineral Resource is unchanged since 31 December 2014. Underground Ore Reserve beneath the completed Gosowong open pit was incorporated into the Kencana Ore Reserve for reporting purposes at 31 December 2014 as it is intended to utilise Kencana infrastructure.
MOROBE MINING JOINT VENTURES (PNG)
The Morobe Mining Joint Ventures (MMJV) are three 50:50 unincorporated joint ventures between subsidiaries of Newcrest and Harmony Gold Mining Company. The joint venture interests are located in the Morobe Province of PNG and include the Hidden Valley and Wafi-Golpu deposits.
Hidden ValleyThe Hidden Valley Mine is located 90 kilometres south-west of Lae in the Morobe Province of PNG. Mineralisation is structurally controlled epithermal gold – silver stockwork veining hosted in granite and metasedimentary rocks.
The Hidden Valley Mine consists of the Hidden Valley Kaveroi and Hamata open pits located approximately six kilometres apart. Since 31 December 2014, the Mineral Resource has decreased due to the updating of the economic assumptions, spatial constraint and mining depletion. Mineral Resources have decreased by 0.45 million ounces of gold and 8.7 million ounces of silver (50 percent terms). Since 31 December 2014 the Ore Reserve has decreased due to the updating of the economic assumptions, final open pit design and mining depletion by 0.72 million ounces of gold and 13.2 million ounces of silver (50 percent terms). Hidden Valley is not a material mining project for Newcrest.
Wafi-GolpuWafi-Golpu comprises the Golpu porphyry deposit, the Wafi high sulphidation epithermal deposit and the Nambonga porphyry deposit. The deposits are situated 60 kilometres west-south-west of Lae, on the western flanks of the Timini Range, Morobe Province in PNG.
The Wafi, Golpu and Nambonga Mineral Resource are unchanged since 31 December 2014. No Ore Reserve has been estimated for Wafi and Nambonga deposits.
The Golpu Ore Reserve remains unchanged from 31 December 2014. On 15 December 2014 an update to the pre-feasibility study was announced that has split the Golpu project into two stages for optimisation of development. Stage one targets the upper higher value portion of the orebody and stage two will encompass the rest of the Ore Reserve. The Stage one Feasibility Study and Stage two Pre-Feasibility Study are both scheduled for completion by the end of calendar year 2015.
NAMOSI JOINT VENTURE (FIJI)
The Namosi tenement is located about 30 kilometres west of Fiji’s capital city, Suva. The Namosi project is a joint venture between Newcrest, Nittetsu and Mitsubishi Materials. Newcrest holds a 69.94 percent interest in the joint venture and is the manager of project activities.
WaisoiThe Waisoi deposit is characterised by copper-gold-molybdenum mineralisation hosted in and adjacent to porphyry intrusions. The deposit includes two broad overlapping mineralised zones: Waisoi East and Waisoi West. The Waisoi deposit is envisaged to be extracted via bulk open cut mining methods. The Waisoi Mineral Resource and Ore Reserve are unchanged since 31 December 2014.
WainauloThe Wainaulo deposit lies in the Waivaka Corridor, which is a five kilometres long, east-north-east trending zone of porphyry-related mineralisation. The deposit is located approximately six kilometres south of Waisoi. The Wainaulo Mineral Resource is unchanged since 31 December 2014 and no Ore Reserve has been estimated for the Wainaulo deposit.
OTHER REGIONS
Côte d’Ivoire (West Africa)The Côte d’Ivoire (CI) operations and projects include Bonikro, Hiré and Dougbafla-East deposits, as well as various exploration tenements. Gold mineralisation is hosted in Proterozoic greenstone volcanic belts and occurs primarily in two modes: as structurally controlled shear zones, and as stockwork veining.
The Bonikro open pit mine and the Dougbafla deposit are located within the Oume Project area. The Hiré deposit is located approximately 10 kilometres south-east of Bonikro and is comprised of three deposits – Chapelle, Akissi-So and Asondji-So. Open pit mining depletion since 31 December 2014 occurred at Bonikro and Hiré (Chapelle and Akissi-So). A small test pit has also been completed on the Dougbafla Mineral Resource.
Since 31 December 2014, the Côte d’Ivoire Mineral Resource (including stockpiles) has been depleted by 0.10 million ounces of gold and the Ore Reserve (including stockpiles) has been depleted by 0.08 million ounces of gold.
Newcrest has an active exploration program in place within Côte d’Ivoire, which is focused on defining extensions to the current resources and greenfields exploration outside the mine and project areas.
MarsdenThe Marsden copper-gold porphyry deposit is located between the NSW towns of Forbes and West Wyalong, approximately 150 kilometres south-west of the Cadia Valley Operations. The Marsden Mineral Resource is unchanged since 31 December 2014. An updated Mineral Resource estimate is scheduled for completion at end of calendar year 2015. No Ore Reserve has been estimated for Marsden.

30 NEWCREST MINING ANNUAL REPORT 2015
Mineral Resources and Ore Reserves
Measured Resource Indicated Resource Inferred Resource Total Resource Contained Metal
Gold and Copper Resources (# = material change at a material mining project)
DryTonnes
(million)
GoldGrade
(g/t Au)
CopperGrade(% Cu)
DryTonnes
(million)
GoldGrade
(g/t Au)
CopperGrade(% Cu)
DryTonnes
(million)
GoldGrade
(g/t Au)
CopperGrade(% Cu)
DryTonnes
(million)
GoldGrade
(g/t Au)
CopperGrade(% Cu)
Insitu Gold
(million ounces)
Insitu Copper(million tonnes)
Com- petent Person
Cadia East Underground 0.28 0.74 0.31 2,500 0.42 0.28 360 0.34 0.19 2,800 0.41 0.26 37 7.5 1
Ridgeway Underground 0.19 1.4 0.48 110 0.58 0.30 43 0.37 0.39 160 0.52 0.33 2.6 0.52 1
Other 140 0.47 0.13 170 0.38 0.23 30 0.28 0.16 350 0.41 0.18 4.5 0.63 1
Total Cadia Province – Gold and Copper 44 8.6
Main Dome Open Pit # 24 0.41 0.080 55 0.89 0.085 0.052 0.65 0.064 79 0.74 0.083 1.9 0.066 2
West Dome Open Pit – – – 170 0.65 0.062 2.5 0.57 0.056 180 0.64 0.062 3.6 0.11 2
Telfer Underground – – – 90 1.5 0.32 53 1.2 0.22 140 1.3 0.28 6.2 0.40 2
Other – – – 0.57 4.2 0.027 16 0.28 0.34 16 0.42 0.33 0.22 0.053 2
O’Callaghans – – – 69 – 0.29 9.0 – 0.24 78 – 0.29 – 0.22 2
Total Telfer Province – Gold and Copper 12 0.85
Lihir 90 2.2 – 550 2.3 – 140 2.4 – 790 2.3 – 59 – 3
Gosowong* – – – 4.0 14 – 0.66 7.2 – 4.6 13 – 1.9 – 4
Bonikro* 8.7 0.76 – 27 1.7 – 3.0 2.1 – 38 1.5 – 1.8 – 5
Namosi JV (69.94%) – – – 1,300 0.11 0.34 220 0.10 0.41 1,500 0.11 0.35 5.3 5.3 6
Marsden – – – 200 0.18 0.36 77 0.056 0.13 280 0.15 0.29 1.3 0.83 1
MMJV – Hidden Valley Operations (50%)
1.4 1.1 – 51 1.5 – 3.1 1.2 – 56 1.5 – 2.7 – 7
MMJV – Wafi/ Golpu/Nambonga (50%)
– – – 480 0.74 0.82 140 0.59 0.53 620 0.71 0.76 14 4.7 7
Total Other Provinces – Gold and Copper 86 11
Total Gold and Copper 140 20
Measured Resource Indicated Resource Inferred Resource Total Resource Contained Metal
Silver Resources(# = material change at a material mining project)
Dry Tonne
(million)
SilverGrade
(g/t Ag)
DryTonnes
(million)
SilverGrade
(g/t Ag)
DryTonnes
(million)
SilverGrade
(g/t Ag)
DryTonnes
(million)
SilverGrade
(g/t Ag)Insitu Silver
(million ounces)
Com- petent Person
Cadia Valley Operations 0.47 0.87 2,600 0.60 410 0.40 3,000 0.58 55 1
Gosowong* – – 4.0 24 0.66 10 4.6 22 3.2 4
MMJV – Hidden Valley Operations (50%)
1.4 19 51 27 3.1 26 56 27 49 7
MMJV – Wafi/ Golpu (50%) – – 480 1.4 120 1.0 610 1.3 26 7
Total Silver 130
Tonnes Grade Contained Metal
Polymetallic Resources(# = material change at a material mining project)
Dry Tonnes
(million)
Tungsten Trioxide
Grade (% WO3)
Zinc Grade (% Zn)
Lead Grade
(% Pb)
Insitu Tungsten
Trioxide (million tonnes)
Insitu Zinc (million tonnes)
Insitu Lead (million tonnes)
Com- petent Person
Measured – – – – – – –
2Indicated 69 0.34 0.55 0.27 0.24 0.38 0.18
Inferred 9.0 0.25 0.15 0.073 0.023 0.013 0.0066
Total Polymetallic 78 0.33 0.50 0.25 0.26 0.39 0.19
Note: Data is reported to two significant figures to reflect appropriate precision in the estimate and this may cause some apparent discrepancies in totals.Competent Persons1. Ann Winchester 2. James Biggam 3. Stephen Perkins 4. Colin McMillan 5. Craig Irvine 6. Vik Singh 7. Greg Job (Harmony)* The figures shown represent 100 percent of the Mineral Resource, except as noted below. Gosowong (inclusive of Toguraci and Kencana) is owned and operated by PT Nusa Halmahera Minerals, an incorporated joint venture company
(Newcrest, 75 percent). Bonikro is inclusive of mining and exploration interests in Côte d’Ivoire held by LGL Mines CI SA (Newcrest, 89.9 percent), LGL Exploration CI SA
(Newcrest, 100 percent) and LGL Resources CI SA (Newcrest, 99.89 percent). Namosi refers to the Namosi unincorporated joint venture, in which Newcrest has a 69.94 percent interest. The figures shown represent 69.94 percent
of the Mineral Resource. MMJV refers to projects owned by the Morobe Mining unincorporated joint ventures between subsidiaries of Newcrest (50 percent) and Harmony Gold Mining
Company Limited (50 percent). The figures shown represent 50 percent of the Mineral Resource.
2015 Mineral ResourcesAs at 31 December 2014

NEWCREST MINING ANNUAL REPORT 2015 31
Proved Reserve Probable Reserve Total Reserve Contained Metal
Gold and Copper Reserves(# = material change at a material mining project)
Dry Tonnes
(million)
Gold Grade
(g/t Au)
Copper Grade (% Cu)
Dry Tonnes
(million)
Gold Grade
(g/t Au)
Copper Grade (% Cu)
Dry Tonnes
(million)
Gold Grade
(g/t Au)
Copper Grade (% Cu)
Insitu Gold
(million ounces)
Insitu Copper (million tonnes)
Com- petent Person
Cadia East Underground – – – 1,600 0.48 0.29 1,600 0.48 0.29 25 4.6 1
Ridgeway Underground – – – 85 0.55 0.28 85 0.55 0.28 1.5 0.24 1
Other 23 0.30 0.14 67 0.59 0.15 90 0.52 0.14 1.5 0.13 1
Total Cadia Province – Gold and Copper 28 4.9
Main Dome Open Pit # 24 0.41 0.080 30 0.86 0.067 54 0.66 0.073 1.1 0.039 2
West Dome Open Pit – – – 82 0.67 0.059 82 0.67 0.059 1.8 0.048 2
Telfer Underground – – – 43 1.4 0.30 43 1.4 0.30 1.9 0.13 2
O’Callaghans – – – 49 – 0.28 49 – 0.28 – 0.14 2
Total Telfer Province – Gold and Copper 4.8 0.36
Lihir 90 2.2 – 290 2.4 – 380 2.4 – 29 – 3
Gosowong* – – – 3.0 12 – 3.0 12 – 1.1 – 4
Bonikro* 8.7 0.76 – 15 1.7 – 24 1.3 – 1.0 – 5
Namosi JV (69.94%) – – – 930 0.12 0.37 930 0.12 0.37 3.6 3.5 1
MMJV – Hidden Valley Operations (50%)
1.4 1.1 – 28 1.7 – 29 1.6 – 1.5 – 6
MMJV – Golpu (50%) – – – 230 0.86 1.2 230 0.86 1.2 6.2 2.7 6
Total Other Provinces – Gold and Copper 42 6.2
Total Gold and Copper 75 11
Proved Reserve Probable Reserve Total Reserve Contained Metal
Silver Reserves (# = material change at a material mining project)
Dry Tonnes
(million)
Silver Grade
(g/t Ag)
Dry Tonnes
(million)
Silver Grade
(g/t Ag)
Dry Tonnes
(million)Silver Grade
(g/t Ag)Insitu Silver
(million ounces)
Com- petent Person
Cadia Valley Operations – – 1,700 0.65 1,700 0.65 35 1
Gosowong* – – 3.0 20 3.0 20 1.9 4
MMJV – Hidden Valley Operations (50%)
1.4 19 28 30 29 29 28 6
MMJV – Golpu (50%) – – 230 1.4 230 1.4 9.9 6
Total Silver 74
Tonnes Grade Contained Metal
Polymetallic Reserves(# = material change at a material mining project)
Dry Tonnes (million)
Tungsten Trioxide Grade
(% WO3)
Zinc Grade (% Zn)
Lead Grade (% Pb)
Insitu Tungsten
Trioxide (million tonnes)
Insitu Zinc (million tonnes)
Insitu Lead (million tonnes)
Com- petent Person
Proved – – – – – – – 2
Probable 49 0.35 0.71 0.35 0.17 0.35 0.17
Total Polymetallic 49 0.35 0.71 0.35 0.17 0.35 0.17
Note: Data is reported to two significant figures to reflect appropriate precision in the estimate and this may cause some apparent discrepancies in totals.Competent Persons1. Geoff Newcombe 2. Ron Secis 3. Daniel Moss 4. Darryl Dyason 5. Craig Irvine 6. Greg Job (Harmony)* The figures shown represent 100 percent of the Ore Reserve, except as noted below. Gosowong (inclusive of Toguraci and Kencana) is owned and operated by PT Nusa Halmahera Minerals, an incorporated joint venture company
(Newcrest, 75 percent). Bonikro is inclusive of mining and exploration interests in Côte d’Ivoire held by LGL Mines CI SA (Newcrest, 89.9 percent), LGL Exploration CI SA
(Newcrest, 100 percent) and LGL Resources CI SA (Newcrest, 99.89 percent). Namosi refers to the Namosi unincorporated joint venture, in which Newcrest has a 69.94 percent interest. The figures shown represent 69.94 percent
of the Ore Reserve. MMJV refers to projects owned by the Morobe Mining unincorporated joint ventures between subsidiaries of Newcrest (50 percent) and Harmony Gold Mining
Company Limited (50 percent). The figures shown represent 50 percent of the Ore Reserve.
2015 Ore ReservesAs at 31 December 2014

32 NEWCREST MINING ANNUAL REPORT 2015
The Board believes that adherence by Newcrest and its people to the highest standards of corporate governance is critical in order to achieve its vision. Accordingly, Newcrest has a detailed governance framework, which is regularly reviewed and adapted to developments in market practice and regulation.
As at the date of lodgement of this Report, Newcrest’s governance framework complies with the Corporate Governance Principles and Recommendations (3rd edition) published by the ASX Corporate Governance Council. Further information in relation to Newcrest’s governance framework is provided in the Corporate Governance Statement, which was lodged with ASX on the date of lodgement of this Annual Report and is available in the corporate governance section of the Newcrest website at http://www.newcrest.com.au/about-us/corporate-governance. The corporate governance section of the Newcrest website also provides further information in relation to Newcrest’s governance framework, including Board and Board Committee Charters and key policies.
Corporate Governance Statement

NEWCREST MINING ANNUAL REPORT 2015 33
In its Workplace Gender Equity report for 2015, Newcrest reported that 14.25 percent of its Australian workforce comprised women, down slightly compared with 14.8 percent for the previous reporting period. Newcrest remains committed to significantly improving the representation of women within its workforce.
In accordance with the requirements of the Workplace Gender Equality Act 2012 (Act), Newcrest lodged its 2014–15 public report with the Workplace Gender Equality Agency (Agency). As required by the Agency, the report included the workplace profile and the reporting questionnaire. Employees are able to access the report via Newcrest’s portal or can request to receive a hard copy. Feedback and comments regarding the report content could be made via an email address and via phone to an internal contact and also directly to the Agency.
ASX External Measures – Gender DiversityThe Board approved Newcrest’s second generation of gender diversity measures in early 2014. The measures are intended to deliver a larger pool of women from which Newcrest can identify and develop future leaders.
Newcrest’s external measures are detailed and are accompanied with commentary regarding the progress made to date in the achievement of these measures.
Increase the representation of women in management Levels 2–4 to a minimum of 16 percent by 31 December 2016: as at 30 June 2015, women in management accounted for 13.7 percent (63 women) of Newcrest’s Australian workforce. The percentage of women has increased by 1.0 percent when compared with 30 June 2014. Newcrest will continue to identify innovative ways to attract, develop and progress women within the business and accelerate its performance under this measure.
Increase the proportion of women accessing programs aimed at accelerating development, by a minimum of 20 percent by 31 December 2016: accelerated development programs are put in place for high-potential employees to realise the employee’s potential with structured support in a compressed time frame. As at 31 December 2014, when Newcrest conducted its most recent review of high-potentials, approximately 17.9 percent of women were represented within the accelerated development pool. Over the coming 12 months, Newcrest will conduct a comprehensive review of its approach to development, with the intent of strengthening the accelerated development offering for employees who possess potential.
Increase the representation of women selected for the graduate program to a minimum of 40 percent by 31 December 2016: Newcrest has eight graduates employed on the Newcrest Graduate program. Female participation on the Newcrest Graduate Program stands at 62.5 percent. Newcrest continues to invest heavily in its Vacation and Scholarship programs. In FY2015, female vacation students accounted for 33 percent of the total number of vacation students.
Newcrest will continue to identify ways to strengthen its people programs to accelerate Newcrest’s progress on its ASX diversity measures, while simultaneously building the capability of people leaders to proactively lead and leverage the benefits of diverse teams. The Board is in the process of developing diversity measures to apply beyond calendar year 2016.
Diversity and inclusion are important elements of Newcrest’s organisational culture. Newcrest seeks to create a work environment in which people can come to work feeling safe, valued and supported to perform at their best. Newcrest also seeks to create a work environment that leverages the diverse thinking and perspectives of its people to significantly improve its safety, business performance and organisational health.
In early 2015, Newcrest refreshed its Diversity and Inclusion framework. The framework outlines the key areas of focus over the next 12–36 months. These include:Inclusive work environment: building a work environment where people feel included; that is, where people are treated fairly and respectfully, their unique value is known and appreciated, they feel they belong and are connected to their workgroup/site.Gender diversity: building a diverse workforce; with a particular focus on lifting the representation of women across the organisation. Growing the talents of women, enabling them to reach their full potential is a key priority for Newcrest.Nationalisation: growing, developing and creating opportunities for career advancement for the national employees at Newcrest’s operations in PNG, Indonesia and West Africa.
Newcrest’s Diversity and Inclusion framework is supported through: HR and Remuneration Board Committee: Newcrest’s HR and Remuneration Board Committee actively supports and leads Newcrest’s diversity and inclusion agenda.ExCo Diversity Sub-committee: the ExCo Diversity Sub-committee provides guidance and input regarding the implementation of Newcrest’s Diversity and Inclusion framework.Diversity Policy: the Diversity Policy outlines how Newcrest seeks to create a diverse workforce, including treating employees fairly, setting measurable targets, ensuring legislative compliance and supporting diversity in all its communities. Workplace behaviour standard: Newcrest’s workplace behaviour standard promotes a workplace that is inclusive and free from discrimination, harassment, bullying and victimisation. Ensuring employees understand what is appropriate workplace behaviour, and encouraging them to speak up if they see inappropriate behaviour, supports Newcrest in building a positive and productive workplace environment.Flexible work practices standard: enables employees to adopt flexible work practices to support a range of professional and personal circumstances.
DIVERSITY OF NEWCREST’S WORKFORCE
Newcrest continues to build the diversity of its workforce with a particular emphasis on gender and the ongoing nationalisation of workforces within Newcrest’s operations in PNG, Indonesia and West Africa.
Newcrest’s workforce consists of approximately 11.04 percent of female employees. Refer to Figure 1.
Figure 1: Proportion of women (all Newcrest sites) as at 30 June 2015
Newcrest Mining (all sites)
Total no. of females
30 June 2015
Proportion of females (%)
30 June 2015
Board 1 10.0
Senior Executives (defined as key management personnel)
2 28.6
Other employee groups 599 11.04
Diversity and Inclusion

34 NEWCREST MINING ANNUAL REPORT 2015
Financial ReportFor the year ended 30 June 2015
35 Directors’ Report38 Operating and Financial Review62 Letter from the Chairman and the Chairman of the
Human Resources and Remuneration Committee63 Remuneration Report90 Auditor’s Independence Declaration91 Consolidated Income Statement 92 Consolidated Statement of Comprehensive Income93 Consolidated Statement of Financial Position94 Consolidated Statement of Cash Flows95 Consolidated Statement of Changes in Equity96 Notes to the Consolidated Financial Statements139 Directors’ Declaration140 Independent Auditor’s Report

NEWCREST MINING ANNUAL REPORT 2015 35
The Directors present their report together with the consolidated financial report of the Newcrest Mining Limited Group, comprising the Company and its controlled entities, for the year ended 30 June 2015.
DIRECTORSThe Directors of the Company during the year ended 30 June 2015, and up to the date of this report are set out below. All Directors held their position as a Director throughout the entire year and up to the date of this report unless otherwise stated.
Peter Hay Non-Executive Director and Non-Executive Chairman
Sandeep Biswas Managing Director and Chief Executive Officer(1)
Gerard Bond Finance Director and Chief Financial Officer Philip Aiken AM Non-Executive DirectorVince Gauci Non-Executive DirectorWinifred Kamit Non-Executive Director Richard Knight Non-Executive DirectorRick Lee AM Non-Executive DirectorTim Poole Non-Executive Director(2)
John Spark Non-Executive Director Greg Robinson Former Managing Director
and Chief Executive Officer(3)
(1) Sandeep Biswas succeeded Greg Robinson as Managing Director and Chief Executive Officer on 4 July 2014.
(2) Resigned from the Board on 30 July 2015.(3) Retired from the Board on 4 July 2014.
Subsequent to year-end the following changes to the composition of the Board of Directors occurred or have been announced:
– Appointment of Xiaoling Liu as a Non-Executive Director, effective from 1 September 2015. – Appointment of Roger Higgins as a Non-Executive Director, effective from 1 October 2015. – Resignation of Tim Poole as a Non-Executive Director, effective 30 July 2015. – Retirement of Vince Gauci as a Non-Executive Director, immediately after the next Newcrest Annual General Meeting on 29 October 2015.
PRINCIPAL ACTIVITIESThe principal activities of the Group during the year were exploration, mine development, mine operations and the sale of gold and gold/copper concentrate. There were no significant changes in those activities during the year.
CONSOLIDATED RESULTThe profit after tax attributable to Newcrest shareholders (‘Statutory Profit’) for the year ended 30 June 2015 was A$546 million (2014: loss of A$2,221 million).
Refer to the Operating and Financial Review for further details. The Operating and Financial Review forms part of this Directors’ Report. The financial information in the Operating and Financial Review includes non-IFRS financial information. Explanations and reconciliations of non-IFRS financial information to the financial statements are included in Section 6 of the Operating and Financial Review.
DIVIDENDSThe Directors have determined that there will be no payment of a dividend for the year ended 30 June 2015.
SIGNIFICANT CHANGES IN THE STATE OF AFFAIRSRefer to the Operating and Financial Review for the significant changes in the state of affairs of the Group.
FUTURE DEVELOPMENTSRefer to the Operating and Financial Review for information on likely developments and future prospects of the Group.
SUBSEQUENT EVENTSThere have been no matters or events that have occurred subsequent to 30 June 2015 that have significantly affected or may significantly affect the operations of the Group, the results of those operations or the state of affairs of the Group in subsequent financial years.
SHARE RIGHTSDuring the year an aggregate of 78,439 rights were exercised, resulting in the issue of 78,439 ordinary shares of the Company for nil consideration. At the date of this report there were 4,081,206 unissued shares under rights.
AUDITOR INDEPENDENCE AND NON-AUDIT SERVICESA copy of the Auditor’s Independence Declaration as required under section 307C of the Corporations Act 2001 is attached. During the year, other assurance related services and advisory services were provided by Ernst & Young (auditor to the Company) – refer Note 29 to the financial statements. The Directors are satisfied that the provision of these services did not impair the Auditor’s Independence.
CURRENCYAll references to dollars in the Directors’ Report and the Financial Report are a reference to Australian dollars ($ or A$) unless otherwise specified.
ROUNDING OF AMOUNTSNewcrest Mining Limited is a company of the kind referred to in ASIC Class Order 98/100 and, in accordance with that Class Order, amounts in the Directors’ Report and the Financial Report are rounded to the nearest A$1 million (A$m) except where otherwise indicated.
ENVIRONMENTAL REGULATION AND PERFORMANCEThe Managing Director reports to the Board on all significant safety, health and environmental incidents. The Board also has a Safety and Sustainability Committee which has oversight of the safety, health and environmental performance of the Group which meets at least four times per year. The Directors are not aware of any environmental matters which would have a materially adverse impact on the overall business of the Group.
The operations of the Group are subject to environmental regulation under the jurisdiction of the countries in which those operations are conducted, including Australia, Indonesia, Papua New Guinea, Cote d’Ivoire and Fiji. Each mining operation is subject to particular environmental regulation specific to their activities as part of their operating licence or environmental approvals. Each of our sites are required to also manage their environmental aspects in accordance with our corporate environmental policies and standards.
The environmental laws and regulations that cover each of our sites, combined with our policies and standards, address the potential impact of the Group’s activities in relation to water and air quality, noise, land disturbance, waste and tailings management, and the potential impact upon flora and fauna. The Group releases an annual Sustainability Report in accordance with the Global Reporting Initiative that details our activities in relation to management of material environmental aspects.
Directors’ Report
36 NEWCREST MINING ANNUAL REPORT 2015
Directors’ Report
The Group has a uniform internal reporting system across all sites. All environmental events, including breaches of any regulation or law, are assessed according to their actual or potential environmental consequence. Five levels of environmental incidents are tracked based on factors such as spill volume, incident location (onsite or offsite) and potential or actual environmental impacts. These levels include: I (insignificant), II (minor), III (moderate), IV (major) and V (catastrophic). Data on Category I incidents are only collected at a site level and are not reported in aggregate for the Group.
The number of events reported in each category during the year is shown in the following table. In all cases, environmental authorities were notified of those events where required and remedial action undertaken.Category II III IV V
2015 – Number of incidents 16 4 0 0
2014 – Number of incidents 13 4 1 0
INDEMNIFICATION AND INSURANCE OF DIRECTORS AND OFFICERSNewcrest maintains a Directors’ and Officers’ insurance policy that, subject to some exceptions, provides insurance cover to past, present or future Directors, Secretaries and Executive Officers of the Group and its subsidiaries. The Company has paid an insurance premium for the policy.
INDEMNIFICATION OF AUDITORSTo the extent permitted by law, the Company has agreed to indemnify its auditors, Ernst & Young, as part of the terms of its audit engagement agreement against claims by third parties arising from the audit (for an unspecified amount). No payment has been made to indemnify Ernst & Young during or since the end of the financial year.
REMUNERATION REPORTThe Remuneration Report is set out on pages 63 to 88 and forms part of this Directors’ Report.
INFORMATION ON DIRECTORSDetails of the Directors’ qualifications, experience and special responsibilities are set out on pages 6 to 7.
INFORMATION ON FORMER DIRECTORS
Tim Poole BCOMM, CA, 46INDEPENDENT NON-EXECUTIVE DIRECTOR
Mr Poole was appointed to the Board in August 2007. He was a member of the Audit and Risk Committee, the Human Resources and Remuneration Committee and the Nominations Committee. Mr Poole resigned from the Board on 30 July 2015.
Skills, experience and expertiseMr Poole has more than 15 years’ experience as a director and chairman of ASX listed and unlisted companies across the financial services, infrastructure, aged care and resources industries. He was formerly Managing Director of Hastings Funds Management Limited, and Chairman of Asciano Limited.
Listed Directorships – Chairman of Lifestyle Communities Limited (from 2007) – Director of McMillan Shakespeare Limited (from 2013) – Director of Japara Healthcare Limited (from 2014) – Director of Aurizon Holdings Limited (from 2015)
Other Directorships/appointments – Chairman of Westbourne Credit Management Limited – Director of AustralianSuper Pty Ltd and chairman of its investment committee
Greg Robinson BSC (HONS), MBA (COLUMBIA UNIVERSITY), MAICD, 53MANAGING DIRECTOR AND CHIEF EXECUTIVE OFFICER
Mr Robinson was appointed to the Board as an Executive Director in November 2006.
Mr Robinson was appointed Managing Director and Chief Executive Officer of Newcrest in July 2011 after serving as Director Finance of Newcrest from 2006 to 2011. Prior to joining Newcrest, Mr Robinson was with the BHP Billiton Group from 2001 to 2006 in various executive roles, including Chief Finance and Chief Development Officer, Energy and Chief Financial Officer, Petroleum. Mr Robinson was also a member of the Group Executive Committee. Before joining BHP Billiton, he was the Director of Investment Banking at Merrill Lynch & Co. Mr Robinson was a Director of St Vincent’s Institute from 2005 until March 2015.
Mr Robinson resigned from the Board on 4 July 2014.
INFORMATION ON COMPANY SECRETARY
Francesca Lee BCOMM, LLB (HONS), LLM, GRAD. DIP. CSP, AGIA, 59GENERAL COUNSEL AND COMPANY SECRETARY
Ms Lee joined Newcrest as General Counsel and Company Secretary on 31 March 2014. She was General Counsel and Company Secretary of OZ Minerals Limited from 2008 until 2014, and its antecedent companies from 2003. Ms Lee has more than 26 years’ experience working across various senior legal and commercial roles within the mining industry including BHP Billiton, Rio Tinto Limited and Comalco Limited, including as General Manager Internal Audit and Risk at Rio Tinto Limited. She also spent several years as Vice President Structured Finance with Citibank Limited.
Ms Lee was a member of the Australian Government Takeovers Panel from 2009 until March 2015.

NEWCREST MINING ANNUAL REPORT 2015 37
DIRECTORS’ MEETINGSThe number of Directors’ meetings (including meetings of committees of Directors) and number of meetings attended by each of the Directors of the Company during the financial year were:
Committees of the Board
Directors’ Meetings Audit and RiskHuman Resources and Remuneration
Safety and Sustainability Nominations
Special Board Committees (1)
Director A B A B A B A B A B A B
Peter Hay 11 11 – – – – – – 3 3 7 7
Sandeep Biswas 11 11 – – – – – – – – 7 7
Gerard Bond 11 11 – – – – – – – – 6 N/A
Philip Aiken AM 11 11 – – 6 7 4 4 3 3 – –
Vince Gauci 10 11 – – 6 7 3 4 2 3 – –
Winifred Kamit 11 11 – – 7 7 4 4 3 3 – –
Richard Knight 11 11 4 4 – – 4 4 3 3 3 N/A
Rick Lee AM 10 11 5 5 7 7 – – 3 3 2 N/A
Tim Poole 11 11 4 5 7 7 – – 3 3 2 N/A
John Spark 11 11 5 5 – – – – 3 3 5 N/A
Column A – Indicates the number of meetings attended whilst a Director/Committee member.
Column B – Indicates the number of meetings held whilst a Director/Committee member.(1) These are out of session Committee meetings generally called at short notice to deal with specific matters delegated to the Committee by the Board.
The membership of such special Committees may vary – for example it may be the Chairman, Managing Director, and/or one or more unspecified Non-Executive Directors.
Details of the functions and memberships of the Committees of the Board are presented in Newcrest’s Corporate Governance Statement.
DIRECTORS’ INTERESTSAs at the date of this report, the interest of each Director in the shares and rights of Newcrest Mining Limited were:
DirectorNumber of
Ordinary SharesNature of
InterestNumber of Rights
Over Ordinary SharesNature of
Interest
Peter Hay 43,000 Direct and Indirect – –
Sandeep Biswas 57,502 Direct and Indirect 621,828(1) Direct
Gerard Bond 33,838 Direct 260,228(2) Direct
Philip Aiken AM 17,769 Indirect – –
Vince Gauci 18,400 Indirect – –
Winifred Kamit 326 Indirect – –
Richard Knight 40,000 Indirect – –
Rick Lee AM 28,447 Indirect – –
Tim Poole 4,235 Indirect – –
John Spark 32,695 Direct and Indirect – –
(1) Represents Sandeep Biswas’ unvested performance rights granted pursuant to the Company’s 2014 and 2015 financial year Long Term Incentive plan, and his entitlement under his Executive Service Agreement to a further grant of 54,990 shares (or cash equivalent) to be transferred in November 2015, subject to continuing employment and satisfactory employment.
(2) Represents Gerard Bond’s unvested performance rights granted pursuant to the Company’s 2013, 2014 and 2015 financial year Long Term Incentive plan.
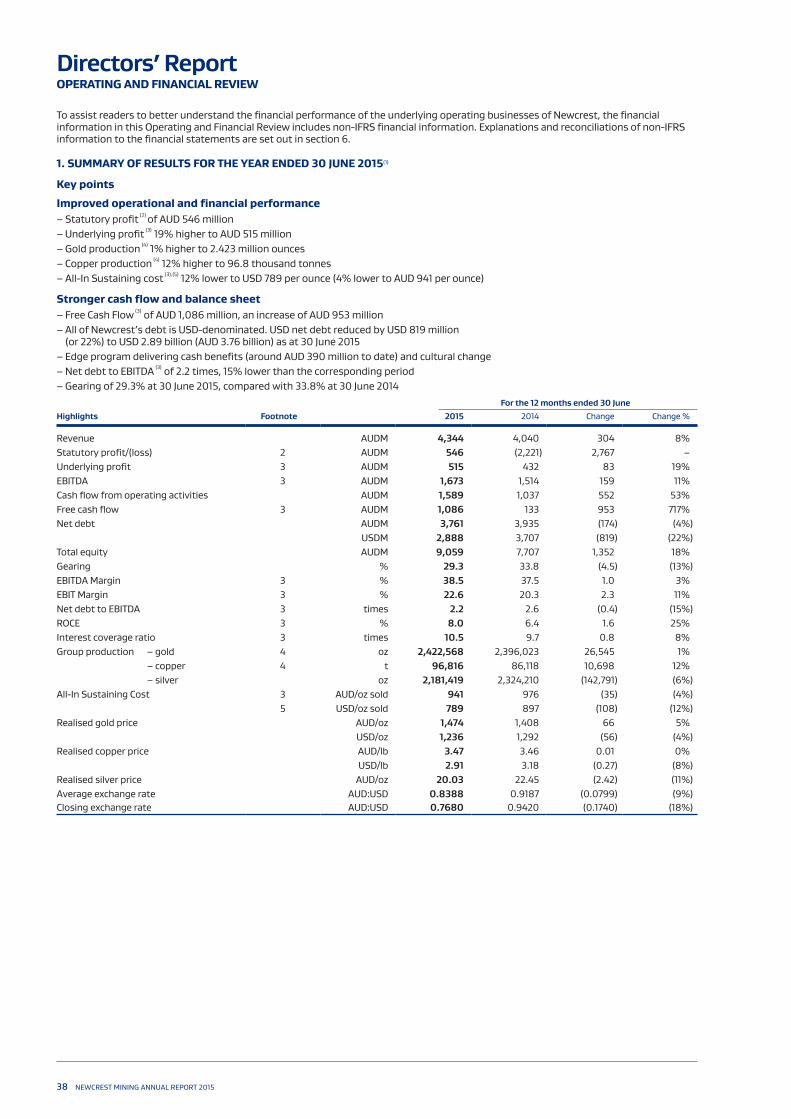
38 NEWCREST MINING ANNUAL REPORT 2015
To assist readers to better understand the financial performance of the underlying operating businesses of Newcrest, the financial information in this Operating and Financial Review includes non-IFRS financial information. Explanations and reconciliations of non-IFRS information to the financial statements are set out in section 6.
1. SUMMARY OF RESULTS FOR THE YEAR ENDED 30 JUNE 2015(1)
Key points
Improved operational and financial performance – Statutory profit (2) of AUD 546 million – Underlying profit (3) 19% higher to AUD 515 million – Gold production (4) 1% higher to 2.423 million ounces – Copper production (4) 12% higher to 96.8 thousand tonnes – All-In Sustaining cost (3),(5) 12% lower to USD 789 per ounce (4% lower to AUD 941 per ounce)
Stronger cash flow and balance sheet – Free Cash Flow (3) of AUD 1,086 million, an increase of AUD 953 million – All of Newcrest’s debt is USD-denominated. USD net debt reduced by USD 819 million (or 22%) to USD 2.89 billion (AUD 3.76 billion) as at 30 June 2015 – Edge program delivering cash benefits (around AUD 390 million to date) and cultural change – Net debt to EBITDA (3) of 2.2 times, 15% lower than the corresponding period – Gearing of 29.3% at 30 June 2015, compared with 33.8% at 30 June 2014
For the 12 months ended 30 JuneHighlights Footnote 2015 2014 Change Change %
Revenue AUDM 4,344 4,040 304 8%Statutory profit/(loss) 2 AUDM 546 (2,221) 2,767 –Underlying profit 3 AUDM 515 432 83 19%EBITDA 3 AUDM 1,673 1,514 159 11%Cash flow from operating activities AUDM 1,589 1,037 552 53%Free cash flow 3 AUDM 1,086 133 953 717%Net debt AUDM 3,761 3,935 (174) (4%)
USDM 2,888 3,707 (819) (22%)Total equity AUDM 9,059 7,707 1,352 18%Gearing % 29.3 33.8 (4.5) (13%)EBITDA Margin 3 % 38.5 37.5 1.0 3%EBIT Margin 3 % 22.6 20.3 2.3 11%Net debt to EBITDA 3 times 2.2 2.6 (0.4) (15%)ROCE 3 % 8.0 6.4 1.6 25%Interest coverage ratio 3 times 10.5 9.7 0.8 8%Group production – gold 4 oz 2,422,568 2,396,023 26,545 1% – copper 4 t 96,816 86,118 10,698 12% – silver oz 2,181,419 2,324,210 (142,791) (6%)All-In Sustaining Cost 3 AUD/oz sold 941 976 (35) (4%)
5 USD/oz sold 789 897 (108) (12%)Realised gold price AUD/oz 1,474 1,408 66 5%
USD/oz 1,236 1,292 (56) (4%)Realised copper price AUD/lb 3.47 3.46 0.01 0%
USD/lb 2.91 3.18 (0.27) (8%)Realised silver price AUD/oz 20.03 22.45 (2.42) (11%)Average exchange rate AUD:USD 0.8388 0.9187 (0.0799) (9%)Closing exchange rate AUD:USD 0.7680 0.9420 (0.1740) (18%)
Directors’ ReportOPERATING AND FINANCIAL REVIEW

NEWCREST MINING ANNUAL REPORT 2015 39
Full year resultsOver the 12 months ended 30 June 2015, Newcrest has been focused on reducing major hazards and significant injuries, improving operational discipline, cash maximisation and profitable growth.
Tragically, there were two fatalities in the current financial year and a further fatality since the end of the year. On 6 December 2014 an employee of the Hidden Valley Joint Venture was fatally injured after being struck by a reversing loader in the milling area. The second fatality occurred at Telfer on 15 May 2015 when a contractor working in the underground mine was fatally injured while operating an elevated work platform. A further fatality occurred at Hidden Valley on 18 July 2015 when a Hidden Valley employee died in an incident on the site road to the processing plant. Production activity was temporarily suspended following all incidents and comprehensive investigations initiated.
These fatalities sadly overshadow Newcrest’s otherwise strong operating and financial performance in the year. Newcrest’s Board and Management remain resolutely focused on and committed to the safety of Newcrest’s workforce and will relentlessly seek to eliminate fatalities and life-altering injuries from its operations.
Newcrest’s strong operating and financial performance for the 12 months ended 30 June 2015 was underpinned by Newcrest’s comprehensive, Group-wide improvement program (called ‘Edge’) which pursues improvements across all areas of the business and has delivered around AUD 390 million of cash benefits to date.
Statutory profit of AUD 546 million in the current period was AUD 2,767 million higher than the corresponding period. The current period Statutory profit includes significant items with a net benefit of AUD 31 million (comprising a net asset impairment reversal of AUD 55 million, and a gain of AUD 19 million on the partial sell-down of shares in Evolution Mining Limited, partially offset by AUD 43 million in inventory write-downs). The corresponding period’s Statutory loss included significant items totalling a net loss of AUD 2,653 million (primarily relating to asset impairments of AUD 2,353 million).
Underlying profit in the current period of AUD 515 million was AUD 83 million higher than the corresponding period and primarily reflects increased contribution from the ramp-up of higher margin production at Cadia East together with the positive net impact on AUD revenue of the weakening Australian Dollar against the US Dollar during the current period. The operating costs of Newcrest’s operations outside Australia with USD functional currencies were adversely impacted by the weaker Australian Dollar.
Newcrest’s 2015 financial year gold production of 2.423 million ounces was within the Group guidance range of 2.3-2.5 million ounces. Full year copper production of 96.8 thousand tonnes was also within the guidance range of 95-105 thousand tonnes.
Gold production of 2.423 million ounces was 1% higher than the corresponding period primarily due to the ramp-up of the Cadia East underground mine and higher ore feed grades at Gosowong and West Africa, with higher milling rates at Lihir partially offsetting the impact of lower ore feed grades at Lihir in the current period.
Copper production of 96.8 thousand tonnes was 12% higher than the corresponding period, primarily due to increased processing of higher copper grade ore from Cadia East.
All-in Sustaining Cost expenditure of AUD 2,270 million, total capital expenditure of AUD 564 million and exploration expenditure of AUD 46 million were all below their guidance range of AUD 2,300 to 2,500 million, AUD 585 to 625 million and AUD 50 to 60 million, respectively.
Newcrest’s All-in Sustaining Cost of AUD 941 per ounce sold in the current period was 4% lower than the corresponding period, reflecting lower levels of production stripping and sustaining capital expenditure, higher by-product revenue associated with higher copper sales volume, partially offset by the 9% deterioration in the average Australian Dollar against the corresponding period (which increased USD-denominated costs). All-In Sustaining Cost of USD 789 per ounce sold was 12% lower than the corresponding period.
(1) All figures in this report relate to businesses of the Newcrest Mining Limited Group (‘Newcrest’ or ‘the Group’) for the 12 months ended 30 June 2015 (‘current period’) compared with the 12 months ended 30 June 2014 (‘corresponding period’), except where otherwise stated. All references to ‘the Company’ are to Newcrest Mining Limited. All references to $ are a reference to Australian dollars unless otherwise stated.
(2) Statutory profit/(loss) is profit after tax attributable to owners of the Company.(3) Newcrest’s results are reported under International Financial Reporting Standards (IFRS). This report also includes certain non-IFRS financial information,
including the following: – ‘Underlying profit (loss)’ is profit or loss after tax before significant items attributable to owners of the Company. – ‘EBITDA’ is ‘Earnings before interest, tax, depreciation and amortisation, and significant items’. ‘EBIT’ is ‘Earnings before interest, tax and significant items’. – ‘EBITDA margin’ is EBITDA expressed as a percentage of revenue. ‘EBIT margin’ is EBIT expressed as a percentage of revenue. – ‘Operating unit cost’ is cost of sales less depreciation divided by gold sales. – ‘AISC’ is All-In Sustaining Cost and ‘AIC’ is All-In Cost as per World Gold Council Guidance Note on Non-GAAP Metrics released June 2013. AISC will vary from period to period as a result of various factors including production performance, timing of sales, and the level of sustaining capital and the relative contribution of each asset. – Net debt to EBITDA is calculated as net debt divided by EBITDA. – ‘ROCE’ is ‘Return on Capital Employed’ and is calculated as EBIT expressed as a percentage of average total capital employed (net debt and total equity). – ‘Interest Coverage Ratio’ is calculated as EBITDA divided by the interest payable for the relevant period. Interest payable is interest paid or payable, less any interest received or receivable and is inclusive of capitalised interest. – ‘Free Cash Flow’ is calculated as cash flow from operating activities less cash flow related to investing activities. – Underlying profit, EBIT, EBITDA, EBITDA Margin, Free Cash Flow, All-In Sustaining Cost, All-In Cost, Operating unit cost, Sustaining capital, Major projects (non-sustaining), ROCE and Interest Coverage Ratio are non-IFRS financial measures which Newcrest employs in managing the business. They are used by management to assess the performance of the business and make decisions on the allocation of resources and have been included in this report to provide greater understanding of the underlying financial performance of Newcrest’s operations. When reviewing business performance this non-IFRS information should be used in addition to, and not as a replacement of, measures prepared in accordance with IFRS. These measures have not been subject to audit by Newcrest’s external auditor.
These measures do not have any standard definition under IFRS and may be calculated differently by other companies. Refer to section six for a reconciliation of non-IFRS measures to the most appropriate IFRS measure.
(4) Production and sales for the 12 months ended 30 June 2015 includes 21,060 pre-commissioning and development gold ounces and 2,102 tonnes of copper for the Cadia East project. For the 12 months ended 30 June 2014 production and sales includes 18,675 gold ounces and 1,770 tonnes of copper related to the pre-commissioning and development of the Cadia East project. Expenditure associated with this production and revenue from the sales are capitalised and not included in the operating profit calculations.
(5) All-In Sustaining Costs in USD terms are converted to USD at an average AUD:USD exchange rate for the 12 months ended 30 June 2015 of $0.8388.

40 NEWCREST MINING ANNUAL REPORT 2015
Directors’ ReportOPERATING AND FINANCIAL REVIEW
From a financial policy perspective, Newcrest looks to:
– Target an investment grade credit rating throughout the cycle; – Maintain a leverage ratio (Net Debt to EBITDA) of less than 2.0 times; – Maintain a gearing ratio of below 25%; and – Maintain diverse funding sources, sizeable committed undrawn bank facilities and USD debt with an appropriate tenor having regard to the life of the Group’s assets.
Newcrest’s dividend policy continues to balance financial performance and capital commitments with a prudent leverage and gearing level for the Company. Newcrest looks to pay ordinary dividends that are sustainable over time having regard to its financial policy, profitability, balance sheet strength and reinvestment options in the business.
The Newcrest Board has determined that there will be no dividend for the 12 months ended 30 June 2015. The Board will consider returning to paying a dividend as debt is further reduced and taking market and operating conditions into consideration.
Guidance (7)
All sites achieved production guidance for the current period, with Cadia exceeding its production guidance range. Looking ahead, Newcrest remains firmly focused on realising the full potential of each of the Group’s assets, with an emphasis on the following:
– Operational discipline (including safety); – Cash; and – Profitable growth.
Subject to marketing and operating conditions, Newcrest provides the following guidance (7):
– Group gold production is expected to be in the range of 2.4 to 2.6 million ounces – Group copper production is expected to be in the range of 80 to 90 thousand tonnes – Group All-In-Sustaining Cost expenditure is expected to be in the range of AUD 2,650 to AUD 2,950 million – Total capital expenditure is expected to be in the range of AUD 700 to AUD 825 million – Total exploration expenditure is expected to be in the range of AUD 60 to AUD 70 million – Depreciation and amortisation is expected to be in the range of AUD 880 to AUD 950 million
1. SUMMARY OF RESULTS FOR THE YEAR ENDED 30 JUNE 2015(1) (continued)
Free cash flow, being cash from operating activities less cash from investing activities, was an inflow of AUD 1,086 million, which was AUD 953 million higher than the corresponding period. All operations (excluding Hidden Valley) improved free cash flow generation in the current period, and were free cash flow positive.
The strong free cash flow performance enabled USD 760 million of debt to be repaid and cash on hand to increase by USD 65 million in the current period. All of Newcrest’s debt is USD-denominated.
The Australian dollar weakened in the current period such that the reduction in Newcrest’s USD-denominated net debt of USD 819 million was, on translation to AUD at 30 June 2015, a reduction of AUD 174 million. The weaker Australian dollar also increased the AUD value of Newcrest’s USD-denominated assets, with the translation benefit of this combining with Newcrest’s profit after tax for the year to increase shareholders equity by AUD 1,352 million. The reduction in USD net debt, net profit for the year and the net effect of AUD translation combined to reduce Newcrest’s gearing ratio from 33.8% in the corresponding period to 29.3% at 30 June 2015.
Capital structureAs at 30 June 2015 Newcrest had net debt of USD 2,888 million (AUD 3,761 million) with USD 2,423 million of cash and committed undrawn bank facilities, comprising USD 198 million (AUD 258 million) in cash and USD 2,225 million(6) (AUD 2,897 million) in committed undrawn bank facilities with terms extending from September 2016 to January 2020.
Under current market and operating conditions, the Newcrest Board remains comfortable with this level of debt given the near term cash flow outlook of the Group and has no present intention to raise equity. Newcrest will continue to prioritise application of free cash flow to the reduction of debt.
Newcrest’s financial objectives are to meet all financial obligations, maintain a strong balance sheet so as to withstand cash flow volatility, be able to invest capital in value-creating opportunities, and be able to return excess cash generated to shareholders. As an unhedged gold producer, Newcrest looks to maintain a conservative level of balance sheet leverage.
Production guidance FY16 (7)
For the 12 months ended
30 June 2016
Cadia – gold koz 650 – 700– copper kt ~65
Telfer – gold koz 470 – 520– copper kt ~20
Lihir – gold koz 770 – 850Gosowong – gold koz 300 – 350Hidden Valley (50%) – gold koz 80 – 100West Africa – gold koz 110 – 130
Group production – gold moz 2.4 – 2.6– copper kt ~80 – 90
– silver moz 2.0 – 2.4
Cost and Capital Guidance FY16(7),(8) Cadia Telfer LihirGosowong
(100%)
Hidden Valley (50%)
West Africa (100%) Other Group
AUDM AUDM AUDM AUDM AUDM AUDM AUDM AUDMAll-In Sustaining Cost 240-290 680-730 1,050-1,150 290-330 120-140 190-210 90-100 2,650-2,950Capital expenditure– Production stripping – 30-40 30-40 – – 25-35 – 85-115– Sustaining capital 70-80 85-95 115-125 50-60 5-10 30-35 10-15 365-420– Major projects (non-sustaining) 160-190 – 20-25 – – – 65-75 245-290Total Capital expenditure 230-270 115-135 165-190 50-60 5-10 55-70 75-90 700-825Exploration expenditure 60-70Depreciation and amortisation (including production stripping) 880-950

NEWCREST MINING ANNUAL REPORT 2015 41
Review of operationsFor the 12 months ended 30 June 2015
Cadia(4) Telfer LihirGosowong
(100%)
Hidden Valley (50%)
West Africa (100%) Other Group
Gold sales koz 679 518 692 332 98 114 – 2,433Copper sales koz 75 24 – – – – – 99Silver sales koz 538 321 17 427 920 19 – 2,241Revenue AUDM 1,538 956 1,020 499 161 170 – 4,344EBITDA AUDM 884 334 163 258 15 78 (59) 1,673EBIT AUDM 652 281 (29) 141 (17) 41 (89) 980Free cash flow AUDM 606 271 154 192 (15) 53 (175) 1,086Capital expenditure AUDM 279 53 103 41 38 18 32 564AISC AUDM 161 496 964 287 167 102 93 2,270
AUD/oz 245 957 1,394 863 1,702 896 39 941AISC (5) USDM 135 416 809 241 140 86 77 1,904
USD/oz 206 803 1,169 724 1,428 752 33 789
For the 12 months ended 30 June 2014
Cadia (4) Telfer LihirGosowong
(100%)Hidden Valley
(50%)West Africa
(100%) Other Group
Gold sales koz 574 540 747 336 105 104 – 2,405Copper sales koz 59 25 – – – – – 84Silver sales koz 467 328 26 485 974 18 – 2,297Revenue AUDM 1,233 950 1,055 484 171 147 – 4,040EBITDA AUDM 665 303 353 259 28 37 (131) 1,514EBIT AUDM 491 228 132 149 (11) (8) (160) 821Free cash flow AUDM 259 170 51 100 (12) 29 (464) 133Capital expenditure AUDM 375 76 251 58 27 12 44 843AISC AUDM 181 542 943 277 147 124 115 2,329
AUD/oz 326 1,005 1,261 823 1,402 1,193 49 976AISC (5) USDM 166 498 866 254 135 114 107 2,140
USD/oz 300 924 1,159 756 1,288 1,096 45 897
(6) Comprises undrawn bilateral loan facilities of USD 2,175 million and an additional unutilised USD 50 million loan facility at a closing foreign exchange rate of AUD:USD$0.7680.
(7) Disclaimer: These materials include forward looking statements. Often, but not always, forward looking statements can generally be identified by the use of forward looking words such as ‘may’, ‘will’, ‘expect’, ‘intend’, ‘plan’, ‘estimate’, ‘anticipate’, ‘continue’, and ‘guidance’, or other similar words and may include, without limitation, statements regarding plans, strategies and objectives of management, anticipated production or construction commencement dates and expected costs or production outputs. Forward looking statements inherently involve known and unknown risks, uncertainties and other factors that may cause Newcrest’s actual results, performance and achievements to differ materially from any future results, performance or achievements. Relevant factors may include, but are not limited to, changes in commodity prices, foreign exchange fluctuations and general economic conditions, increased costs and demand for production inputs, the speculative nature of exploration and project development, including the risks of obtaining necessary licenses and permits and diminishing quantities or grades of reserves, political and social risks, changes to the regulatory framework within which Newcrest operates or may in the future operate, environmental conditions including extreme weather conditions, recruitment and retention of personnel, industrial relations issues and litigation.Forward looking statements are based on Newcrest and its management’s good faith assumptions relating to the financial, market, regulatory and other relevant environments that will exist and affect Newcrest’s business and operations in the future. Newcrest does not give any assurance that the assumptions on which forward looking statements are based will prove to be correct, or that Newcrest’s business or operations will not be affected in any material manner by these or other factors not foreseen or foreseeable by Newcrest or management or beyond Newcrest’s control.Although Newcrest attempts and has attempted to identify factors that would cause actual actions, events or results to differ materially from those disclosed in forward looking statements, there may be other factors that could cause actual results, performance, achievements or events not to be as anticipated, estimated or intended, and many events are beyond the reasonable control of Newcrest. Accordingly, readers are cautioned not to place undue reliance on forward looking statements. Forward looking statements in these materials speak only at the date of issue. Subject to any continuing obligations under applicable law or any relevant stock exchange listing rules, in providing this information Newcrest does not undertake any obligation to publicly update or revise any of the forward looking statements or to advise of any change in events, conditions or circumstances on which any such statement is based.
(8) Assumes weighted average gold price of USD 1,100 per ounce, copper price of USD 2.40 per pound, silver price of USD 15 per ounce and AUD/USD exchange rate of 0.74 for the 2016 financial year.

42 NEWCREST MINING ANNUAL REPORT 2015
Directors’ ReportOPERATING AND FINANCIAL REVIEW
2. DISCUSSIONS AND ANALYSIS OF OPERATIONS AND THE INCOME STATEMENT
2.1. Profit OverviewStatutory profit was AUD 546 million and Underlying profit was AUD 515 million in the current period. This represents an AUD 2,767 million improvement in Statutory profit and AUD 83 million improvement in Underlying profit compared with the corresponding period.
The current period profit reflects improved profitability at Cadia, Telfer and West Africa partly offset by lower profit at Lihir. Reduced current period profit at Lihir was due to lower sales volumes and higher unit operating costs compared with the corresponding period.
The improvement of AUD 83 million in Underlying profit was largely due to increased low cost production associated with the ramp-up of Cadia East, the weakening of the Australian Dollar against the US Dollar during the current period which increased revenue in AUD terms, and lower corporate expenditures. These drivers were partially offset by higher unit operating costs (which in part was due to the lower exchange rate) and higher income tax expense compared to the corresponding period. The weakening of the AUD against all key currencies resulted in a net profit improvement with the benefit on revenue significantly higher than the negative impact on costs.
The Statutory profit in the current period was impacted by significant items (after tax and non-controlling interests) totalling a net benefit of AUD 31 million after tax and non-controlling interests, comprising:
– Asset impairment reversal, being a benefit of AUD 376 million; – Asset impairments, being a loss of AUD 321 million; – Inventory write-down, being a loss of AUD 43 million; and – Gain on disposal of associate, being a benefit of AUD 19 million.
The Statutory loss in the corresponding period was impacted by significant items totalling a net loss of AUD 2,653 million, including asset impairments of AUD 2,353 million, restructuring costs, additional income tax expense relating to voluntary amendment of prior period Research and Development claims and write-downs of fixed assets and inventory.
Further information is provided in section 2.12.
2.2. Underlying ProfitThe differences between Underlying profit of AUD 515 million in the current period and Underlying profit of AUD 432 million in the corresponding period are quantified in the table below.
For the 12 months ended 30 JuneAUDM 2015 2014 Change Change %
Gold revenue 3,555 3,359 196 6%Copper revenue 744 629 115 18%Silver revenue 45 52 (7) (13%)
Total revenue 4,344 4,040 304 8%Operating costs (2,612) (2,395) (217) (9%)Depreciation (663) (664) 1 0%
Total cost of sales (3,275) (3,059) (216) (7%)Corporate administration costs (117) (134) 17 13%Exploration (35) (36) 1 3%Other income/(expense) 44 (12) 56 –Net finance costs (189) (174) (15) (9%)Share of profit of associates 19 22 (3) (14%)Income tax expense (252) (192) (60) (31%)Non-controlling interests (24) (23) (1) (4%)
Underlying profit 515 432 83 19%
2.3. RevenueTotal sales revenue for the 12 months ended 30 June 2015 of AUD 4,344 million was AUD 304 million or 8% higher than the corresponding period.
AUDM
Total sales revenue for 12 months ended 30 June 2014 4,040
Changes in revenues from volume:Gold 36Copper 114Silver (1)Total volume effect 149
Change in revenue from price:Gold 160Copper 1Silver (6)Total price effect 155
Total sales revenue for 12 months ended 30 June 2015 4,344
Gold revenue of AUD 3,555 million was 6% higher than the corresponding period largely due to a 5% higher average realised AUD gold price. Gold sales volumes increased by 1%, largely the result of higher production at Cadia with the ramp-up of higher grade ore from Cadia East offsetting the impact of declining ore grade at Ridgeway, and higher milling rates at Lihir partially offsetting lower grade ore at Lihir, when compared to the corresponding period.

NEWCREST MINING ANNUAL REPORT 2015 43
The average realised gold price of AUD 1,474 per ounce was 5% higher than the corresponding period, with a 4% lower US dollar gold price of USD 1,236 per ounce in the current period more than offset by a 9% decline in the average AUD/USD exchange rate to $0.8388 ($0.9187 in the corresponding period).
Copper revenue of AUD 744 million was 18% higher than the corresponding period, reflecting an 18% increase in copper sales volumes to 97,379 tonnes (post capitalisation) with the average realised copper price of AUD 3.47 per pound in line with the corresponding period. The increase in sales volume was primarily driven by higher ore tonnes and higher copper grade ore from Cadia East.
Silver revenue of AUD 45 million was 13% lower than the corresponding period, with 11% lower average realised prices and 2% lower sales volumes.
Newcrest’s sales revenue continues to be predominantly attributable to gold, being 82% of total sales revenue in the current period (83% in the corresponding period).
For the 12 months ended 30 June
2015 2014Production and sales Production Sales Production Sales
Gold production and sales (ounces)Cadia(9) 667,418 679,077 592,831 573,605Telfer 520,309 518,163 536,342 539,672Lihir 688,714 691,660 721,264 747,265Gosowong 331,555 332,007 344,747 336,059Hidden Valley 94,601 98,103 105,845 104,772West Africa 119,970 114,051 94,994 103,790Total gold production and sales (ounces) 2,422,568 2,433,060 2,396,023 2,405,163
Copper production and sales (tonnes)Cadia(9) 73,697 75,212 60,612 58,963Telfer 23,119 24,269 25,506 25,257Total copper production and sales (tonnes) 96,816 99,481 86,118 84,220
Silver production and sales (ounces)Cadia 521,085 537,849 486,789 466,997Telfer 321,076 321,076 327,740 327,740Lihir 16,581 16,581 26,305 26,305Gosowong 410,970 426,827 489,724 484,550Hidden Valley 892,838 919,995 974,846 973,687West Africa 18,870 19,013 18,806 18,044
Total silver production and sales (ounces) 2,181,419 2,241,339 2,324,210 2,297,323
2.4. Cost of salesFor the 12 months ended 30 June
AUDM 2015 2014 Change Change %
Site production costs 2,257 1,972 285 14%Inventory movements 26 137 (111) (81%)Royalties 124 113 11 10%Treatment and realisation 205 173 32 18%
Operating costs 2,612 2,395 217 9%
Depreciation 663 664 (1) (0%)
Cost of sales 3,275 3,059 216 7%
2.5. Operating costsOperating costs of AUD 2,612 million were 9% higher than the corresponding period.
The increase in site production costs mainly relates to a 22% increase in ore mined, which resulted in a lower drawdown of ore inventory compared to the corresponding period. The increase in site production costs was also attributed to the ramp-up of operating activity at Cadia East and higher operating costs at Lihir, including costs associated with the 7% increase in mill throughput. Movement in exchange rates between the comparative periods, including the weakening of the Australian dollar against the US dollar, resulted in a AUD 44 million increase in site production costs.
The AUD 32 million or 18% increase in treatment and realisation costs was due to higher copper production at Cadia and a 9% decline in the average AUD/USD exchange rate adversely impacting USD-denominated treatment and realisation charges.
Further information is provided in section 4.
2.6. DepreciationDepreciation expense included in cost of sales of AUD 663 million was consistent with the corresponding period.
Decreases in depreciation expense reflected the impact of the impairments to carrying values as at 30 June 2014 and lower gold production and sales volumes at Lihir in the current period. These were partially offset by higher depreciation at Cadia due to the ramp-up of Cadia East Panel Cave 1, the commencement of commercial production in Cadia East Panel Cave 2 on 1 October 2014 and the acceleration of depreciation at Ridgeway in line with its increased production and cave maturity. The weaker Australian dollar against the US dollar also increased the AUD-reported depreciation of non-Australian operations (a US dollar expense).
(9) Production and sales for the 12 months ended 30 June 2015 includes 21,060 pre-commissioning and development gold ounces and 2,102 tonnes of copper for the Cadia East project. Production and sales for the 12 months ended 30 June 2014 includes 18,675 pre-commissioning and development gold ounces and 1,770 tonnes of copper for the Cadia East project. Expenditure associated with this production and revenue from the sales are capitalised and not included in the operating profit calculations.

44 NEWCREST MINING ANNUAL REPORT 2015
Directors’ ReportOPERATING AND FINANCIAL REVIEW
2. DISCUSSIONS AND ANALYSIS OF OPERATIONS AND THE INCOME STATEMENT (continued)
2.7. Other costs2.7.1. Corporate administration costsCorporate administration costs of AUD 117 million were 13% lower than the corresponding period. Corporate cash costs of AUD 79 million in the current period represents a reduction of AUD 17 million or 18% compared with the corresponding period. Costs were reduced by 15% through a rationalisation of corporate office and support functions and the associated reductions in headcount, as well as other targeted cost reductions. Legal costs were favourably impacted by recoveries and were AUD 8 million lower than the corresponding period.
2.7.2. Exploration expenseExploration expenditure of AUD 46 million was 26% lower than the corresponding period. Exploration expense in the current period of AUD 35 million included AUD 10 million of previously carried forward expenditure written off in the current period.
Further information is provided in section 3.2.5.
2.7.3. Other income/expensesFor the 12 months
ended 30 JuneAUDM 2015 2014
Net foreign exchange gain/(loss) 62 (11)Net fair value gain/(loss) on gold and copper derivatives (6) 10Legacy community contractual settlements and negotiation costs (5) (10)Other (7) (1)
Other income/(expense) 44 (12)
The foreign exchange gain in the current period primarily related to the restatement of USD-denominated concentrate receivables resulting from a weakening of the Australian dollar against the US dollar.
The fair value loss on gold and copper derivatives in the current period primarily related to the movement in spot prices impacting the quotational period adjustments on sales. Newcrest seeks to lock in the gold and copper price for the quotational period for concentrate shipments at the time of sale using forward sales contracts to minimise this impact.
2.8. Finance costNotwithstanding the reduction in net debt in the current period, net finance cost of AUD 189 million was AUD 15 million higher than the corresponding period primarily due to the effect of the weakening Australian dollar against the US dollar on the Group’s USD-denominated interest costs and an increase in undrawn facility fees.
2.9. Share of profit of associatesShare of profit of associates of AUD 19 million was 14% lower than the corresponding period, reflecting the profit earned for the period in which Newcrest’s investment in Evolution Mining Limited was accounted for as an associate.
2.10. Income taxIncome tax expense on Underlying profit was AUD 252 million, resulting in an effective tax rate of 32%, which is marginally higher than the Australian Company tax rate of 30%. This is primarily due to an adjustment to tax expense in the current period of AUD 23 million which finalised the review of research and development allowances claimed in the prior periods. In the corresponding period, income tax expense on Underlying profit was AUD 192 million with an effective tax rate of 30%.
Income tax expense on Statutory profit in the current period was AUD 414 million, which includes AUD 162 million expense relating to significant items.
2.11. Non-controlling interestsNon-controlling interests on Underlying profit of AUD 24 million, being the profit after tax attributable to minority shareholders, was 4% higher than the corresponding period.
Non-controlling interests on Statutory profit was AUD 14 million, with the difference of AUD 10 million relating to the impairment of assets and write-down of inventory in West Africa.
2.12. Significant Items Significant items totalling a net benefit of AUD 31 million (after tax and non-controlling interests) were recognised for the 12 months ended 30 June 2015 comprising:
– Asset impairment reversal, being a benefit of AUD 376 million at Telfer, primarily reflecting the reduction in the short and long-term AUD/USD exchange rate assumptions which had a positive impact on the AUD revenue value, together with improved cost and production assumptions in the life of mine plan; – Asset impairments, being losses of AUD 321 million where the key drivers by operation were:
– AUD 245 million at Hidden Valley, primarily reflecting the lower short and long-term price USD gold price assumptions, lower expectations of improvements in future cost and production performance in life of mine plan and a reduced value attributable to exploration prospectivity; – AUD 76 million at West Africa, primarily reflecting the lower short and long-term USD gold price assumptions and reduced value attributed to exploration prospectivity;
– AUD 43 million write-down in the value of inventory at Hidden Valley and West Africa, primarily reflecting the lower long-term USD gold price assumption; and – AUD 19 million gain recognised following the reduction of Newcrest’s shareholding in Evolution Mining Limited (in February 2015). The remaining investment in Evolution was reclassified as a financial instrument and the accounting changed from equity accounting to fair value accounting.

NEWCREST MINING ANNUAL REPORT 2015 45
For the 12 months ended 30 June 2015
AUDMImpairment
(loss)/reversalWrite-down of inventory
Gain on disposal of
associateTotal before
tax Tax Expense Total after tax
Telfer 538 – – 538 (162) 376Hidden Valley (245) (33) – (278) – (278)West Africa (85) (11) – (96) – (96)Corporate – – 19 19 – 19
Total items by segment 208 (44) 19 183 (162) 21
Tax on significant items (162) – – (162)
Total after tax 46 (44) 19 21
Non-controlling interest 9 1 – 10
Total after tax and non-controlling interest 55 (43) 19 31
The following table provides a summary of significant items totalling AUD 2,653 million (after tax) for the corresponding period (12 months ended 30 June 2014).
For the 12 months ended 30 June 2014
AUDMImpairment
(loss)/reversal
Write-down non-current
assetsWrite-down of inventory Sub-total Restructure
Total before tax
Tax Expense/(Benefit) Total after tax
Cadia – (20) – (20) (8) (28) 8 (20)Telfer (204) – – (204) (1) (205) 62 (143)Lihir (2,647) (154) (35) (2,836) (17) (2,853) 727 (2,126)Gosowong – – – – (1) (1) – (1)Hidden Valley (79) – – (79) – (79) – (79)West Africa (198) – – (198) – (198) 20 (178)Corporate 11 – – 11 (19) (8) (115) (123)
Total items by segment (3,117) (174) (35) (3,326) (46) (3,372) 702 (2,670)
Tax on significant items 747 52 11 810 12 822
Tax amendments to R&D claims – (120) – (120) – (120)
Total after tax (2,370) (242) (24) (2,636) (34) (2,670)
Non-controlling interest 17 – – 17 – 17
Total after tax and non-controlling interest (2,353) (242) (24) (2,619) (34) (2,653)

46 NEWCREST MINING ANNUAL REPORT 2015
Directors’ ReportOPERATING AND FINANCIAL REVIEW
3. DISCUSSION AND ANALYSIS OF CASH FLOWFree cash flow for the current period of AUD 1,086 million was AUD 953 million higher than the corresponding period and enabled Newcrest to repay USD 760 million of debt and increase cash on hand by USD 65 million in the current period. The improvement reflects cash flows from operating activities being AUD 552 million higher, capital expenditure being AUD 279 million lower, and a cash inflow of AUD 105 million from the partial sell-down of shares in Evolution Mining Limited in the current period.
All operations (excluding Hidden Valley) improved free cash flow generation in the current period, and were free cash flow positive.
For the 12 months ended 30 JuneAUDM 2015 2014 Change Change %
Cash flow from operating activities 1,589 1,037 552 53%Cash flow related to investing activities (503) (904) 401 44%
Free cash flow 1,086 133 953 717%
Cash flow related to financing activities (986) (61) (925) (1,516%)
Net movement in cash 100 72 28 39%
Cash at the beginning of the period 141 69 72 104%Effects of exchange rate changes on cash held 17 – 17
Cash at the end of the period 258 141 117 83%
3.1. Cash flow from operating activitiesFor the 12 months ended 30 June
AUDM 2015 2014 Change Change %
Receipts from customers 4,319 3,967 352 9%Payments to suppliers and employees (2,532) (2,636) 104 4%Net interest paid (173) (161) (12) (7%)Income taxes paid (30) (138) 108 78%Dividends received 5 5 – –
Net cash inflow from operating activities 1,589 1,037 552 53%
Cash flow from operating activities of AUD 1,589 million was AUD 552 million higher than the corresponding period. This increase reflects Newcrest’s focus on cash generation through the delivery of cost and operating efficiencies at all operations, stronger working capital management, a higher average realised AUD gold price, increased copper sales volumes and increased gold ounces sold from the higher margin Cadia operation. The corresponding period was negatively impacted by the unwinding of favourable creditor and debtor balances from the previous year, as well as costs associated with redundancies across the business.
Tax payments were AUD 108 million lower in the current period, primarily relating to the AUD 70 million voluntary research and development tax payment made in the corresponding period, and tax receipts in the current period relating to prior period assessments.
3.2. Cash flow from investing activitiesFor the 12 months ended 30 June
AUDM 2015 2014 Change Change %
Capital expenditureProduction stripping 73 191 (118) (62%)Sustaining 245 298 (53) (18%)Major projects (non-sustaining) 246 354 (108) (31%)
Total capital expenditure 564 843 (279) (33%)
Exploration 46 62 (16) (26%)Interest capitalised 6 7 (1) (14%)Proceeds from sale of plant and equipment (2) (8) 6 75%Proceeds from partial sell down of investment in associate (105) – (105)Proceeds from non-participation in rights issue (6) – (6)
Total cash outflow from investing activities 503 904 (401) (44%)
Cash flow from investing activities of AUD 503 million was 44% lower than the corresponding period. The reduction is a result of lower expenditure in all investing categories – major projects, sustaining, production stripping and exploration expenditure – in the current period compared to the corresponding period.
Other investing activities include AUD 105 million received following the partial sell-down of Newcrest’s interests in Evolution Mining Limited, and an additional AUD 6 million received following the non-participation in a rights issue undertaken by Evolution Mining Limited.
3.2.1. Capital ExpenditureCapital expenditure of AUD 564 million was 33% lower than the corresponding period with reduced expenditure in all categories. The reduction was primarily the result of lower levels of production stripping, commencement of commercial production at Cadia East Panel Cave 2 reducing development expenditure, Newcrest’s increased focus on capital discipline, and completion of other projects in progress in the corresponding period.
3.2.2. Production strippingFor the 12 months ended 30 June
AUDM 2015 2014 Change Change %
Telfer 1 24 (23) (96%)Lihir 47 145 (98) (68%)West Africa – 9 (9) (100%)Hidden Valley 25 13 12 92%
Total production stripping 73 191 (118) (62%)
Production stripping of AUD 73 million was 62% lower than the corresponding period.
The reduction was primarily due to lower production stripping activity at Lihir, where the mine sequencing resulted in increased ore mined from the Minifie pit, thereby lowering the strip ratio in the current period, and completion of major stripping activities in the corresponding period at Telfer (Main Dome Stage 4 waste stripping) and West Africa (Stage 4 waste stripping).
3.2.3. Sustaining capitalFor the 12 months ended 30 June
AUDM 2015 2014 Change Change %
Cadia 70 60 10 17%Telfer 51 52 (1) (2%)Lihir 56 99 (43) (43%)Gosowong 41 57 (16) (28%)West Africa 8 4 4 100%Hidden Valley 13 14 (1) (7%)Other 6 12 (6) (50%)
Total sustaining capital 245 298 (53) (18%)

NEWCREST MINING ANNUAL REPORT 2015 47
Exploration at Gosowong focused on extensive detailed mapping and sampling to target new discoveries and extending the present mine life.
At Telfer, drilling targeted resource definition in the Telfer underground and near surface anomalies in the surrounding district.
At Cadia, expenditure related to the commencement of infill drilling, analysis and interpretation work of the Cadia East orebody, and drilling programs in nearby tenements.
In the West Africa district, exploration drilling was completed at Hiré and regional expenditure focused on target generation.
The Greenfields program saw expenditure in a number of regions. In Fiji, drilling of porphyry targets in the Wailevu West region commenced. In Papua New Guinea, agreements relating to tenements in the Wamum district were entered into and site establishment commenced, while activity in the Morobe Exploration Joint Venture focused on target generation. Farm-in arrangements were entered into in Australia (Mungana) and New Zealand (Laneway).
3.3. Cash flow from financing activitiesCash flow from financing activities for the current period was an outflow of AUD 986 million, an increase in cash outflow of AUD 925 million from the corresponding period.
For the 12 months ended 30 JuneAUDM 2015 2014 Change Change %
Cash flow from financing activitiesProceeds from borrowings 1,339 2,038 (699) (34%) USD bilateral bank debt 1,339 2,038 (699) (34%)Repayment of borrowings (2,292) (2,076) (216) (10%) USD bilateral bank debt (2,159) (2,076) (83) (4%) USD Private
placement notes (133) – (133)Repayment of finance lease principal – (1) 1 100%Payment for treasury shares (9) (6) 3 50%Dividend paid – to non-controlling interests (24) (16) (8) (50%)
Net cash from financing activities (986) (61) (925) (1,516%)
Key financing activities during the current period were: – A net repayment of AUD 820 million (USD 655 million) on US dollar bilateral bank debt; – A scheduled repayment of AUD 133 million (USD 105 million) on US dollar private placement notes; – A payment of AUD 9 million for treasury shares to satisfy future employee share scheme obligations; and – Dividend payments of AUD 24 million were paid to PT Antam (which holds a 25% non-controlling interest in PT Nusa Halmahera Minerals, the entity that owns the Gosowong asset).
No dividend was paid to Newcrest shareholders in the current period.
Sustaining capital expenditure of AUD 245 million was 18% lower than the corresponding period, reflecting Newcrest’s focus on efficiency improvements and capital discipline and completion of projects in progress in the corresponding period.
At Lihir, the reduction was primarily the result of the completion of major reliability projects which commenced in prior periods, and a focus on operating discipline rather than capital to increase plant reliability. Lower sustaining capital expenditure at Gosowong was due to completion of the lift of the tailings storage facility and installation of the refrigeration plant at the Toguraci underground mine in the corresponding period.
Increased expenditure at Cadia was a result of investment in high-return productivity-improvement projects, including increasing underground loader capacity and improving the gold room and gravity circuit operations.
3.2.4. Major projects (non-sustaining) capitalFor the 12 months ended 30 June
AUDM 2015 2014 Change Change %
Cadia 209 315 (106) (34%)Lihir 1 7 (6) (86%)Gosowong – 1 (1) (100%)West Africa 10 – 10Wafi-Golpu 25 27 (2) (7%)Other 1 4 (3) (75%)
Total major projects (non-sustaining capital) 246 354 (108) (31%)
Major project, or non-sustaining, capital expenditure of AUD 246 million was 31% lower than the corresponding period primarily as a result of commencement of commercial production at Cadia East. Current period expenditure primarily related to:
– Cadia East development – with Panel Cave 2 declared commercial on 1 October 2014, the final underground crusher was installed and commissioned in the March 2015 quarter, and the project team demobilised in April 2015. Development activity at Cadia East to expand the footprint will continue and will be performed by the operations team. Work commenced on the construction of an expanded concentrate dewatering facility in May 2015. – Updating the pre-feasibility study for the Wafi-Golpu project – which was completed in December 2014. The study identified an improved business case for the project resulting in approval to progress stage one to feasibility and for work to continue on updating the pre-feasibility study for stage two. Both studies are scheduled to be completed around the end of calendar year 2015. – Completion of the development of infrastructure to enable mining of oxide material at the Hiré open pits, near Bonikro, in West Africa.
3.2.5. ExplorationExploration expenditure of AUD 46 million was 26% lower than the corresponding period. Exploration activity in the current period focused on Gosowong, Telfer and Cadia.
For the 12 months ended 30 JuneAUDM 2015 2014 Change Change %
Expenditure by natureGreenfields 16 16 – –Brownfields 21 23 (2) (9%)Resource definition 9 23 (14) (61%)
46 62 (16) (26%)
Expenditure by regionAustralia 17 18 (1) (6%)Indonesia 13 17 (4) (24%)Papua New Guinea 7 15 (8) (53%)West Africa 4 7 (3) (43%)Fiji 4 5 (1) (20%)Other 1 – 1
46 62 (16) (26%)

48 NEWCREST MINING ANNUAL REPORT 2015
Directors’ ReportOPERATING AND FINANCIAL REVIEW
4. REVIEW OF OPERATIONS
4.1. CadiaFor the 12 months ended 30 June
Measure 2015 2014 Change Change %
OperatingTotal ore mined tonnes ‘000 23,576 16,893 6,683 40%Total material mined tonnes ‘000 23,576 16,893 6,683 40%Total material milled tonnes ‘000 23,142 20,024 3,118 16%Gold head grade grams/tonne 1.09 1.12 (0.03) (3%)Gold recovery % 82.0 81.9 0.1 0%Gold produced ounces 667,418 592,831 74,587 13%Copper produced tonnes 73,697 60,612 13,085 22%Silver produced ounces 521,085 486,789 34,296 7%Gold sales ounces 679,077 573,605 105,472 18%Copper sales tonnes 75,212 58,963 16,249 28%Silver sales ounces 537,849 466,997 70,852 15%
Financial Revenue AUDM 1,538 1,233 305 25%Cost of Sales (including depreciation) AUDM 886 742 144 19%Depreciation AUDM 232 174 58 33%EBITDA AUDM 884 665 219 33%EBIT AUDM 652 491 161 33%Free Cash Flow AUDM 606 259 347 134%All-In Sustaining Cost AUDM 161 181 (20) (11%)All-In Sustaining Cost AUD /oz sold 245 326 (81) (25%)All-In Sustaining Cost USDM 135 166 (31) (19%)All-In Sustaining Cost USD /oz sold 206 300 (94) (31%)
Cadia gold production and sales (inclusive of pre-commissioning volumes) of 667,418 ounces and 679,077 ounces respectively, were 13% and 18% higher than the corresponding period.
The increased gold production was primarily the result of the continued ramp-up and milling of ore mined from Cadia East Panel Cave 1 and the commencement of commercial production from Panel Cave 2 on 1 October 2014, partially offset by lower gold production from Ridgeway.
This change in feed mix resulted in lower average feed grades for both gold and copper with the expected Ridgeway grade decline being partially offset by higher grade from Cadia East. Recoveries were consistent with the corresponding period despite a reduction in gold head grade, with recovery improvements identified and implemented through the Edge process.
Panel Cave 2 was affected by a seismic event in February 2015, causing localised damage to an area of the extraction level. No injuries occurred but development work and production was suspended. Cave establishment work recommenced during the final quarter of the current year with a primary focus on ground support activities, undercut production drilling and developing the undercut level ahead of the extraction level. The change in development strategy from post undercut to advanced undercut transfers the stress away from the extraction level. To date, 80 of the 185 drawbells have been completed.
Revenue of AUD 1,538 million was 25% higher than the corresponding period. This was driven by higher gold and copper sales volumes, consistent with higher production. Revenue from gold sales was 24% higher than the corresponding period which was driven by a 19% increase in volumes (post capitalisation) and a 5% increase in the realised Australian dollar gold price. Revenue from copper sales was 27% higher than the corresponding period which was driven by a 28% increase in volume (post capitalisation).
Cost of sales of AUD 886 million was 19% higher than the corresponding period. This increase from the corresponding period was mainly due to the 40% increase in material mined and 16% increase in material milled.
Depreciation expense of AUD 232 million was 33% higher than the corresponding period. Higher depreciation was due to the ramp-up of Cadia East Panel Cave 1, the commencement of commercial production in Cadia East Panel Cave 2 on 1 October 2014, and the acceleration of depreciation at Ridgeway as the cave matures and reserves are depleted.
EBIT of AUD 652 million was 33% higher than the corresponding period as a result of higher margins.
All-in-Sustaining Cost per ounce sold of AUD 245 per ounce (USD 206 per ounce) was 25% lower than the corresponding period. The reduction was the result of lower unit operating costs as Cadia East ramps up, partially offset by higher realisation charges due to the higher copper production and the weakening of the Australian dollar during the period adversely impacting USD-denominated costs.
Free cash flow of AUD 606 million was 134% higher than the corresponding period, primarily as a result of higher margins, increased sales volumes and lower project capital expenditure with the ramp-up of Cadia East production compared with the corresponding period.

NEWCREST MINING ANNUAL REPORT 2015 49
4.2. TelferFor the 12 months ended 30 June
Measure 2015 2014 Change Change %
OperatingTotal ore mined tonnes ‘000 17,262 16,736 526 3%Total material mined tonnes ‘000 27,676 37,723 (10,047) (27%)Total material milled tonnes ‘000 22,079 21,294 785 4%Gold head grade grams/tonne 0.88 0.90 (0.02) (2%)Gold recovery % 81.5 81.2 0.3 0%Gold produced ounces 520,309 536,342 (16,033) (3%)Copper produced tonnes 23,119 25,506 (2,387) (9%)Silver produced ounces 321,076 327,740 (6,664) (2%)Gold sales ounces 518,163 539,672 (21,509) (4%)Copper sales tonnes 24,269 25,257 (988) (4%)Silver sales ounces 321,076 327,740 (6,664) (2%)
Financial Revenue AUDM 956 950 6 1%Cost of Sales (including depreciation) AUDM 675 722 (47) (7%)Depreciation AUDM 53 75 (22) (29%)EBITDA AUDM 334 303 31 10%EBIT AUDM 281 228 53 23%Free Cash Flow AUDM 271 170 101 59%All-In Sustaining Cost AUDM 496 542 (46) (8%)All-In Sustaining Cost AUD /oz sold 957 1,005 (48) (5%)All-In Sustaining Cost USDM 416 498 (82) (16%)All-In Sustaining Cost USD /oz sold 803 924 (121) (13%)
Telfer gold production and sales of 520,309 ounces and 518,163 ounces respectively, were 3% and 4% lower than the corresponding period.
Lower gold production was primarily the result of lower head grades from the underground operations coupled with lower ounces recovered from the dump leach pads, partially offset by higher mill throughput as a result of increased mill availability.
Copper production was 9% lower than the corresponding period due to lower head grade, partially offset by an improved copper recovery and the higher mill throughput.
Revenue of AUD 956 million was 1% higher than the corresponding period.
Revenue from gold sales was 1% higher than the corresponding period due to a 5% increase in the realised Australian dollar gold price, partially offset by the 4% reduction in sales volume. Revenue from copper sales was 2% lower than the corresponding period.
Cost of sales of AUD 675 million was 7% lower than the corresponding period, primarily due to cost reductions implemented in the current period, a lower depreciation charge and lower sales volume.
Depreciation expense of AUD 53 million was 29% lower than the corresponding period, mainly due to the impairment of Telfer assets at 30 June 2014.
EBIT of AUD 281 million was 23% higher than the corresponding period.
All-In Sustaining Cost per ounce sold of AUD 957 per ounce (USD 803 per ounce) was 5% lower than the corresponding period. The reduction was the result of lower sustaining capital expenditure (primarily reflecting the finalisation of Main Dome Stage 4 waste stripping in the corresponding period) and lower unit costs.
Free cash flow of AUD 271 million was 59% higher than the corresponding period, primarily as a result of lower production stripping with the completion of Main Dome Stage 4 waste stripping in the corresponding period.

50 NEWCREST MINING ANNUAL REPORT 2015
Directors’ ReportOPERATING AND FINANCIAL REVIEW
4. REVIEW OF OPERATIONS (continued)
4.3. LihirFor the 12 months ended 30 June
Measure 2015 2014 Change Change %
OperatingTotal ore mined tonnes ‘000 6,622 4,206 2,416 57%Total material mined tonnes ‘000 13,096 16,166 (3,070) (19%)Total material milled tonnes ‘000 10,768 10,057 711 7%Gold head grade grams/tonne 2.47 2.72 (0.25) (9%)Gold recovery % 80.6 81.9 (1.3) (2%)Gold produced ounces 688,714 721,264 (32,550) (5%)Silver produced ounces 16,581 26,305 (9,724) (37%)Gold sales ounces 691,660 747,265 (55,605) (7%)Silver sales ounces 16,581 26,305 (9,724) (37%)
Financial Revenue AUDM 1,020 1,055 (35) (3%)Cost of Sales (including depreciation) AUDM 1,049 923 126 14%Depreciation AUDM 192 221 (29) (13%)EBITDA AUDM 163 353 (190) (54%)EBIT AUDM (29) 132 (161) –Free Cash Flow AUDM 154 51 103 202%All-In Sustaining Cost AUDM 964 943 21 2%All-In Sustaining Cost AUD /oz sold 1,394 1,261 133 11%All-In Sustaining Cost USDM 809 866 (57) (7%)All-In Sustaining Cost USD /oz sold 1,169 1,159 10 1%
Lihir gold production and sales of 688,714 ounces and 691,660 ounces respectively, were 5% and 7% lower than the corresponding period. Lower gold production was primarily driven by a 9% reduction in average feed grade, a result of planned access to ex-pit and stockpile feed. Mill throughput increased by 7% in the current period, including negative impacts of unplanned maintenance issues in the December 2014 quarter and a disruption to the plant for 36 hours in the June 2015 quarter. Newcrest continues to target a sustainable grinding throughput rate of 12 Mtpa by the end of calendar year 2015.
Revenue of AUD 1,020 million was 3% lower than the corresponding period, reflecting lower sales volume partially offset by a 5% increase in the average realised Australian dollar gold price.
Cost of sales of AUD 1,049 million was 14% higher than the corresponding period. This increase was partly due to the weaker Australian dollar against the US dollar. In USD terms, cost of sales was 2% higher than the corresponding period reflecting higher volumes of ore feed and the higher mill throughput rate, as well as higher energy costs and maintenance costs, partially offset by a lower depreciation expense.
Depreciation expense of AUD 192 million was 13% lower than the corresponding period, primarily the result of the prior year impairment and asset write-down reducing the fixed asset base, as well as 5% lower production reducing the units of use depreciation charge, partially offset by the weaker Australian dollar.
The lower sales volumes and increased costs resulted in an EBIT loss of AUD 29 million for the current period.
All-In Sustaining Cost per ounce sold of AUD 1,394 per ounce was 11% higher than the corresponding period. The increase was primarily driven by the weaker Australian dollar against the US dollar. All-In Sustaining Cost per ounce sold of USD 1,169 per ounce was 1% higher than the corresponding period, primarily due to lower sustaining capital and exploration expenditure, offset by higher operating costs.
Free cash flow of AUD 154 million was significantly higher than the AUD 51 million generated in the corresponding period, primarily as a result of lower production stripping and capital expenditure in the current period and a higher level of working capital outflow in the corresponding period.
Lihir remains focused on safely reducing the site cost base and further debottlenecking the plant, with cost improvement projects during the current period directed towards the consolidation of contractors, renegotiation of supplier terms, and reduced oxygen plant usage. Work is continuing on these and other key value drivers across the operation.

NEWCREST MINING ANNUAL REPORT 2015 51
4.4. GosowongFor the 12 months ended 30 June
Measure 2015 2014 Change Change %
OperatingTotal ore mined tonnes ‘000 716 762 (46) (6%)Total material mined tonnes ‘000 878 1,042 (164) (16%)Total material milled tonnes ‘000 738 826 (88) (11%)Gold head grade grams/tonne 14.49 13.50 0.99 7%Gold recovery % 96.3 96.4 (0.1) (0%)Gold produced ounces 331,555 344,747 (13,192) (4%)Silver produced ounces 410,970 489,724 (78,754) (16%)Gold sales ounces 332,007 336,059 (4,052) (1%)Silver sales ounces 426,827 484,550 (57,723) (12%)
Financial Revenue AUDM 499 484 15 3%Cost of Sales (including depreciation) AUDM 358 335 23 7%Depreciation AUDM 117 110 7 6%EBITDA AUDM 258 259 (1) (0%)EBIT AUDM 141 149 (8) (5%)Free Cash Flow AUDM 192 100 92 92%All-In Sustaining Cost AUDM 287 277 10 4%All-In Sustaining Cost AUD /oz sold 863 823 40 5%All-In Sustaining Cost USDM 241 254 (13) (5%)All-In Sustaining Cost USD /oz sold 724 756 (32) (4%)
Gosowong gold production and sales of 331,555 ounces and 332,007 ounces respectively, were 4% and 1% lower than the corresponding period.
The lower gold production was primarily the result of 11% lower tonnes milled due to lower mine production, driven by hot water issues at Toguraci and challenging ground conditions at Kencana changing the mine sequencing.
Revenue of AUD 499 million was 3% higher than the corresponding period, due to the 5% increase in the average realised Australian dollar gold price partially offset by the 1% decrease in gold sales volume.
Cost of sales of AUD 358 million was 7% higher than the corresponding period. This increase was primarily due to the impact of a weaker Australian dollar against the US dollar. In USD terms, cost of sales was 3% lower than the corresponding period reflecting the lower sales volumes and lower depreciation charge.
Depreciation expense of AUD 117 million was 6% higher than the corresponding period, primarily driven by the weakening of the Australian dollar against the US dollar. In USD terms, depreciation was 3% lower than the corresponding period, reflecting the lower gold sales volumes and a lower unit depreciation rate due to the increase of Ore Reserve announced on 13 February 2015 as part of the Annual Statement of Mineral Resource and Ore Reserve estimates.
EBIT of AUD 141 million was 5% lower than the corresponding period.
All-In Sustaining Cost per ounce sold of AUD 863 per ounce was 5% higher than the corresponding period, primarily due to the weakening of Australian dollar against the US dollar. In USD terms, All-In Sustaining Cost per ounce decreased by 4%, mainly due to lower sustaining capital in the current period with the completion of the lift of the tailings storage facility and installation of the refrigeration plant at Toguraci in the corresponding period. In addition, reclamation expenditure was lower in the current period due to the completion of Gosowong pit rehabilitation activity in the corresponding period, partially offset by higher brownfield exploration.
Free cash flow of AUD 192 million was 92% higher than the corresponding period due to a tax receipt for prior period assessments, and lower capital expenditure with the completion of major sustaining projects in the corresponding period, partially offset by a higher level of working capital outflow in the current period.

52 NEWCREST MINING ANNUAL REPORT 2015
Directors’ ReportOPERATING AND FINANCIAL REVIEW
4. REVIEW OF OPERATIONS (continued)
4.5. Hidden Valley(10)
For the 12 months ended 30 JuneMeasure 2015 2014 Change Change %
OperatingTotal ore mined tonnes ‘000 2,277 2,512 (235) (9%)Total material mined tonnes ‘000 8,783 10,754 (1,971) (18%)Total material milled tonnes ‘000 1,824 2,001 (177) (9%)Gold head grade grams/tonne 1.84 1.87 (0.03) (2%)Gold recovery % 86.6 88.2 (1.6) (2%)Gold produced ounces 94,601 105,845 (11,244) (11%)Silver produced ounces 892,838 974,846 (82,008) (8%)Gold sales ounces 98,103 104,772 (6,669) (6%)Silver sales ounces 919,995 973,687 (53,692) (6%)
Financial Revenue AUDM 161 171 (10) (6%)Cost of Sales (including depreciation) AUDM 178 182 (4) (2%)Depreciation AUDM 32 39 (7) (18%)EBITDA AUDM 15 28 (13) (46)EBIT AUDM (17) (11) (6) (55%)Free Cash Flow AUDM (15) (12) (3) (25%)All-In Sustaining Cost AUDM 167 147 20 14%All-In Sustaining Cost AUD /oz sold 1,702 1,402 300 21%All-In Sustaining Cost USDM 140 135 5 4%All-In Sustaining Cost USD /oz sold 1,428 1,288 140 11%
Hidden Valley gold production and sales of 94,601 ounces and 98,103 ounces respectively, were 11% and 6% lower than the corresponding period.
Lower gold production reflected a combination of lower throughput, lower head grade, and lower recovery. Lower mill throughput primarily reflects a 17-day suspension of milling following the fatality which occurred in the milling area on 6 December 2014.
Revenue of AUD 161 million was 6% lower than the corresponding period, reflecting lower sales volumes partially offset by a 5% increase in the average realised Australian dollar gold price.
Cost of sales of AUD 178 million was 2% lower than the corresponding period. Lower costs reflect benefits from operational improvement initiatives, including rationalisation of contractor services and strategic sourcing projects, partially offset by higher mobile fleet maintenance costs following a period of relatively low maintenance investment in the corresponding period. Additionally, cost of sales was adversely impacted by repairs to the overland conveyor completed during January 2015. In USD terms, cost of sales were 10% lower than the corresponding period.
Depreciation expense of AUD 32 million was 18% lower than the corresponding period, primarily reflecting the impact of an impairment to the carrying value of Hidden Valley assets at 30 June 2014.
The lower sales volumes and increased unit costs resulted in an EBIT loss of AUD 17 million for the current period.
All-In Sustaining Cost per ounce sold of AUD 1,702 per ounce was 21% higher than the corresponding period, reflecting lower sales volumes, increased investment in production stripping, and lower silver prices. In USD terms, All-In Sustaining Cost per ounce increased by 11%.
Free cash flow was an outflow of AUD 15 million, AUD 3 million higher than the corresponding period.
(10) Newcrest 50 percent share in Hidden Valley shown.

NEWCREST MINING ANNUAL REPORT 2015 53
4.6. West AfricaFor the 12 months ended 30 June
Measure 2015 2014 Change Change %
OperatingTotal ore mined tonnes ‘000 4,990 4,248 742 17%Total material mined tonnes ‘000 10,631 12,059 (1,428) (12%)Total material milled tonnes ‘000 1,976 1,974 2 0%Gold head grade grams/tonne 1.99 1.62 0.37 23%Gold recovery % 95.1 89.5 5.6 6%Gold produced ounces 119,970 94,994 24,976 26%Silver produced ounces 18,870 18,806 64 0%Gold sales ounces 114,051 103,790 10,261 10%Silver sales ounces 19,013 18,044 969 5%
Financial Revenue AUDM 170 147 23 16%Cost of Sales (including depreciation) AUDM 129 154 (24) (16%)Depreciation AUDM 37 45 (8) (18%)EBITDA AUDM 78 37 41 111%EBIT AUDM 41 (8) 49 –Free Cash Flow AUDM 53 29 24 83%All-In Sustaining Cost AUDM 102 124 (22) (18%)All-In Sustaining Cost AUD /oz sold 896 1,193 (297) (25%)All-In Sustaining Cost USDM 86 114 (28) (25%)All-In Sustaining Cost USD /oz sold 752 1,096 (344) (31%)
West Africa gold production and sales of 119,970 ounces and 114,051 ounces respectively, were 26% and 10% higher than the corresponding period.
Increased gold production was primarily due to availability of higher grade ore from the Hiré open pits which commenced in January 2015, combined with higher recoveries when compared with the corresponding period.
Revenue of AUD 170 million was 16% higher than the corresponding period, primarily due to the 10% increase in gold sales volume and the 5% increase in the average realised Australian dollar gold price.
Cost of sales of AUD 129 million was 16% lower than the corresponding period. This decrease was primarily due to access to lower cost higher grade ore sources at Hiré and lower depreciation expense. In USD terms, cost of sales were 25% lower than the corresponding period.
Depreciation expense of AUD 37 million was 18% lower than the corresponding period, primarily due to an asset impairment recognised as at 30 June 2014.
EBIT of AUD 41 million was AUD 49 million higher than the corresponding period as a result of higher margins.
All-In Sustaining Cost per ounce sold of AUD 896 per ounce was 25% lower than the corresponding period and is mainly the result of the increase in gold grade and recovery. In USD terms, All-In Sustaining Cost per ounce decreased by 31%.
Free cash flow of AUD 53 million was 83% higher than the corresponding period, primarily as a result of lower production stripping with the completion of Stage 4 of the Bonikro pit waste stripping in the corresponding period.

54 NEWCREST MINING ANNUAL REPORT 2015
Directors’ ReportOPERATING AND FINANCIAL REVIEW
5. DISCUSSION AND ANALYSIS OF THE BALANCE SHEET
5.1. Net assets and total equityNewcrest’s net assets and total equity increased by AUD 1,352 million or 18% during the year ended 30 June 2015 to AUD 9,059 million. This increase is primarily due to the AUD 546 million Statutory profit in the current period and the AUD 768 million retranslation of USD denominated net assets (at the 30 June 2015 closing AUD:USD rate of $0.7680 compared to a 30 June 2014 closing AUD:USD rate of $0.9420).
As at 30 JuneAUDM 2015 2014 Change Change %
AssetsCash and cash equivalent 258 141 117 83%Receivables 206 169 37 22%Inventories 2,258 1,958 300 15%Other financial assets 142 24 118 492%Current tax asset 19 65 (46) (71%)Property, plant and equipment 5,296 4,683 613 13%Exploration, evaluation and development 6,719 5,879 840 14%Other intangible assets 79 88 (9) (10%)Deferred tax assets 182 286 (104) (36%)Investments in associates – 162 (162) (100%)Other assets 209 132 77 58%
Total assets 15,368 13,587 1,781 13%
LiabilitiesPayables (426) (319) (107) (34%)Current tax liability (4) – (4)Borrowings (4,019) (4,076) 57 1%Other financial liabilities (15) (10) (5) (50%)Provisions (678) (574) (104) (18%)Deferred tax liabilities (1,167) (901) (266) (30%)
Total liabilities (6,309) (5,880) (429) 7%
Net assets 9,059 7,707 1,352 18%
EquityEquity – Newcrest interest (8,918) (7,581) (1,337) (18%)Non-controlling interests (141) (126) (15) (12%)
Total equity (9,059) (7,707) (1,352) (18%)

NEWCREST MINING ANNUAL REPORT 2015 55
5.2. Net debt, gearing and leverageNet debt (comprising total borrowings less cash) of AUD 3,761 million at 30 June 2015 was AUD 174 million lower than the corresponding period. All of Newcrest’s debt is USD-denominated. In USD terms, net debt at 30 June 2015 of USD 2,888 million was USD 819 million lower than the corresponding period.
Changes in net debt for the 2015 financial year were: – Net repayment of bi-lateral bank debt of AUD 820 million (USD 655 million); – A scheduled repayment of the private placement notes of AUD 133 million (USD 105 million); and – Cash increased by USD 65 million. The AUD 117 million increase in cash includes a translation impact of a lower AUD:USD exchange rate at 30 June 2015.
Offsetting these repayments was the AUD 892 million impact of the retranslation of US dollar-denominated debt resulting from a 30 June 2015 closing foreign exchange rate of $0.7680 compared to the 30 June 2014 closing foreign exchange rate of $0.9420 (18% lower). Components of the movement in net debt are outlined in the table below in both AUD and USD.
AUDM USDM
Net debt at 30 June 2014 3,935 3,707Net repayment of USD bilateral bank debt (820) (655)Net repayment of private placement notes (133) (105)Retranslation of USD-denominated debt 892 –Net decrease/(increase) in cash balances (117) (65)Other items 4 6
Net debt at 30 June 2015 3,761 2,888
Movement $ 174 819
Movement % (4%) (22%)
The gearing ratio (net debt to net debt and total equity) as at 30 June 2015 was 29.3% compared to 33.8% as at 30 June 2014. The application of cash flow generated in the current period to repay USD 760 million of USD-denominated debt and a higher cash balance was partly offset by the retranslation impact of the weaker of the AUD/USD exchange rate during the current period.
As at 30 JuneAUDM 2015 2014 Change Change %
Total debt 4,019 4,076 (57) (1%)Less cash and cash equivalents (258) (141) (117) (83%)
Net debt 3,761 3,935 (174) (4%)
Total equity 9,059 7,707 1,352 18%
Net debt and total equity 12,820 11,642 1,178 10%
Gearing (net debt/net debt and total equity) 29.3% 33.8% (4.5) (13%)
5.2.1. USD Bilateral bank debtAs at 30 June 2015 Newcrest had bilateral bank debt facilities of USD 3,150 million. Of the available amount, USD 975 million was drawn as at 30 June 2015 compared to USD 1,630 million drawn as at 30 June 2014. USD 2,175 million remains undrawn as at 30 June 2015.
During the period, Newcrest extended the tenor of several of its existing bilateral loan facilities so that the first bilateral loan facility maturity now falls in September 2016 and the last facility maturity falls in January 2020. The extension provided a longer average maturity profile for Newcrest’s bilateral loan facilities, with no material change to terms and conditions, no increase in the total level of debt facilities and no increase in interest cost. Newcrest will continue to actively manage and renew its bilateral bank debt facilities to ensure an optimal tenor availability and cost is maintained.
5.2.2. USD Corporate bondsThe outstanding USD Senior Unsecured Notes issued under Rule 144A and Regulation S of the Securities Act of the United States, are as follows:Notes value Due date Coupon rate Issue date
USD 750 million 15 November 2021 4.45% November 2011USD 250 million 15 November 2041 5.75% November 2011USD 750 million 1 October 2022 4.20% October 2012USD 250 million 15 November 2041 5.75% October 2012
5.2.3. USD Private Placement notesNewcrest has the following Senior Unsecured Notes issued into the North American Private Placement market:Notes value Due date Coupon rate Issue date
USD 100 million 11 May 2017 5.71% May 2005USD 25 million 11 May 2020 5.92% May 2005
5.2.4. USD Facility agreementIn January 2014, PT Nusa Halmahera Minerals entered into USD 50 million loan facility with one bank. In January 2015, this facility was extended by a further 12 months. This is an unsecured revolving facility maturing in January 2016. As at 30 June 2015 this facility had not been utilised.
5.3. Fixed and Floating debt ratioAs at 30 June 2015, 69% of the total debt facilities utilised were at fixed interest rates and 31% at floating rates (30 June 2014: 58% fixed rates and 42% floating rates).

56 NEWCREST MINING ANNUAL REPORT 2015
Directors’ ReportOPERATING AND FINANCIAL REVIEW
For the 12 months ended 30 June 2014
AUDMBefore
Tax Tax
Non-controlling
interest
After tax and
Non-controlling
interest
Profit after tax attributable to Newcrest shareholders
Statutory profit (2,725) 510 (6) (2,221)
Research and development tax claim amendment – 120 – 120Impairment loss 3,128 (747) (17) 2,364Asset write-downs 174 (52) – 122Inventory write-downs 35 (11) – 24Investment in Evolution – investment impairment reversal (11) – – (11)Restructure costs 46 (12) – 34Total of significant items 3,372 (702) (17) 2,653
Underlying profit 647 (192) (23) 432
6.2. Reconciliation of Underlying profit to EBITDAFor the 12 months
ended 30 JuneAUDM 2015 2014
Underlying profit 515 432
less non-controlling interest in controlled entities (24) (23)less income tax expense (252) (192)less net finance costs (189) (174)
EBIT 980 821less depreciation and amortisation (693) (693)
EBITDA 1,673 1,514
6.3. Reconciliation of All-In Sustaining Cost and All-In Cost to cost of sales‘All-In Sustaining Cost’ and ‘All-In Cost’ are non-IFRS measures which Newcrest has adopted from 2013. These non-IFRS measures follow the guidance released by the World Gold Council in June 2013.
For the 12 months ended 30 June
2015 2014
AUDMAUD/oz
sold AUDMAUD/oz
sold
Gold sales (koz) (11) 2,412 – 2,386 –
Cost of sales 3,275 1,358 3,059 1,282
less Depreciation (663) (275) (664) (278)plus By-product revenue (789) (327) (681) (285)plus Corporate costs 87 36 105 44plus Sustaining exploration 21 9 7 3plus Capitalised stripping and underground mine development 77 32 197 82plus Sustaining capital expenditure 245 101 298 125plus other(12) 17 7 8 3
All-In Sustaining Costs 2,270 941 2,329 976
plus non-sustaining capital expenditure 246 102 354 148plus non-sustaining exploration and other 25 11 55 23
All-In Cost 2,541 1,054 2,738 1,147
(11) Production and sales for the 12 months ended 30 June 2015 includes 21,060 pre-commissioning and development gold ounces and 2,102 tonnes of copper for the Cadia East project. For the 12 months ended 30 June 2014 production and sales includes 18,675 gold ounces and 1,770 tonnes of copper related to the pre-commissioning and development of the Cadia East project. Expenditure associated with this production and revenue from the sales are capitalised and not included in the operating profit calculations.
(12) Other includes rehabilitation accretion and amortisation and other costs categorised as sustaining.
6. NON-IFRS FINANCIAL INFORMATIONNewcrest results are reported under International Financial Reporting Standards (IFRS). This report also includes certain non-IFRS financial information, including EBIT (earnings before interest, tax and significant items), EBITDA (earnings before interest, tax, depreciation and amortisation and significant items), Underlying profit (profit after tax before significant items attributable to owners of the Company), All-In Sustaining Cost and All-In Cost (both determined in accordance with the World Gold Council Guidance Note on Non-GAAP Metrics released June 2013), Free cash flow (cash flow from operating activities less cash flow related to investing activities), Interest coverage ratio, ROCE, Operating unit cost, Sustaining capital and Major projects.
These measures are used internally by Management to assess the performance of the business and make decisions on the allocation of resources, and are included in this report to provide greater understanding of the underlying financial performance of the Group’s operations. When reviewing business performance, this non-IFRS information should be used in addition to, and not as a replacement of, measures prepared in accordance with IFRS. The non-IFRS information has not been subject to audit or review by Newcrest’s external auditor.
The non-IFRS measures do not have any standard definition under IFRS and may be calculated differently by other companies. The tables below reconcile these non-IFRS measures to the most appropriate IFRS measure, noting that:
– Sustaining and non-sustaining capital are reconciled to investing cash flow in section 3.2; and – Free cash flow is reconciled to the cash flow statement in section 3.
6.1. Reconciliation of Statutory profit to Underlying profitUnderlying profit, EBIT and EBITDA is reported by Newcrest to provide greater understanding of the underlying business performance of its operations. These measures exclude significant items of income or expense which are, either individually or in aggregate, material to Newcrest or to the relevant business segment and are either outside the ordinary course of business or are part of the ordinary activities of the business but unusual due to their size and nature. Examples include gains/losses and other costs incurred for acquisitions and disposals of mining interests and asset impairment and write-down charges. Underlying profit and Statutory profit both represent profit after tax amounts attributable to Newcrest shareholders.
For the 12 months ended 30 June 2015
AUDMBefore
Tax Tax
Non-controlling
interest
After tax and
Non-controlling
interest
Profit after tax attributable to Newcrest shareholders
Statutory profit 974 (414) (14) 546Asset impairment reversal (538) 162 – (376)Asset impairment loss 330 – (9) 321Inventory write-down 44 – (1) 43Gain on disposal of associate (19) – – (19)
Total significant items (benefit)/loss (183) 162 (10) (31)
Underlying profit 791 (252) (24) 515

NEWCREST MINING ANNUAL REPORT 2015 57
6.4. Reconciliation of Return on Capital Employed (ROCE)ROCE is ‘Return on Capital Employed’ and is reported by Newcrest to provide greater understanding of the underlying business performance of its operations. ROCE is calculated as EBIT before significant items expressed as a percentage of average total capital employed (net debt and total equity).
As at 30 JuneAUDM 2015 2014
EBIT 980 821
Total capital (net debt and total equity) – as at 30 June 2013 14,144Total capital (net debt and total equity) – as at 30 June 2014 11,642 11,642Total capital (net debt and total equity) – as at 30 June 2015 12,820
Average total capital employed 12,231 12,893
Return on Capital Employed (EBIT/average total capital employed) 8.0% 6.4%
6.5. Reconciliation of Interest Coverage Ratio Interest Coverage Ratio is reported by Newcrest to provide greater understanding of the underlying business performance of its operations. Interest Coverage Ratio is calculated as EBITDA adjusted for facility fees and discount unwind on provisions, divided by net interest payable (interest expense adjusted for facility fees, discount unwind on provisions and interest capitalised).
As at 30 JuneAUDM 2015 2014
EBITDA 1,673 1,514
Less facility fees and other costs (27) (18)Less discount unwind on provisions (12) (10)
Adjusted EBITDA 1,634 1,486
Net interest expense 189 174Less facility fees and other costs (27) (18)Less discount unwind on provisions (12) (10)Add interest capitalised 6 7
Net interest payable 156 153
Interest Coverage Ratio 10.5 9.7
7. RISKSNewcrest’s business, operating and financial results and performance are subject to various risks and uncertainties, many of which are beyond Newcrest’s reasonable control. Set out below are matters which Newcrest has assessed as having the potential to have a material adverse effect on the business, operating and/ or financial results and performance of the Group. These matters may arise individually, simultaneously or in combination.
The matters identified below are not necessarily listed in order of importance and are not intended as an exhaustive list of all of the risks and uncertainties associated with Newcrest’s business. Additional risks and uncertainties not presently known to Management, or that Management currently believes to be immaterial or manageable, may adversely affect Newcrest’s business.
Market price of gold, copper and silverMetal prices are volatile and may be subject to short term changes, which may be severe, and to price adjustments of a longer term nature. For example, during the 2015 financial year the gold price ranged from USD 1,142 per ounce to USD 1,340 per ounce. Newcrest’s average realised price of gold in the 2015 financial year was USD 1,236 per ounce, a 4% decrease compared to the 2014 financial year average realised price of USD 1,292 per ounce. Newcrest’s 2014 financial year average realised price of gold was 18% lower than the 2013 financial year average realised price of USD 1,585 per ounce.
Metal prices are affected by numerous factors beyond Newcrest’s control, including macroeconomic conditions (such as financial and banking stability, global and regional political and economic events, inflation, changes in interest rates and the relative strength of the US dollar), speculative positions taken by investors or traders, actual or expected gold purchases and/or sales by central banks, changes in supply or demand for gold, gold hedging and de-hedging by producers, and production and cost levels in major gold producing regions.
Examples of the potential impact of changes in the metal prices on Newcrest’s total revenue from operations in the 2016 financial year include (but are not limited to):
– a USD 10 dollars per ounce change in the average realised gold price is estimated to have an impact of approximately USD 26 million. – a USD 0.05 per pound change in the average realised copper price is estimated to have an impact of approximately USD 10 million.
Material changes in metal prices may change the economic viability of mining operations, particularly higher cost mining operations, which may result in decisions to alter production plans or the suspension or closure of mining operations.
Reductions in the revenue realised by Newcrest from mining operations may result in Newcrest curtailing or suspending its exploration activities, with the result that depleted reserves may not be replaced, and the market value of Newcrest’s gold, copper or other by-product inventory may be reduced.
In addition, historical and current metal price performance may impact upon Newcrest’s assumptions regarding future metal prices which, in turn, may affect Newcrest’s current and future operating, business and financial performance and results. Examples of the potential impact of changes to assumptions regarding future metal prices, alone or in combination with other factors such as foreign exchange rates, include (but are not limited to):
– changes to assumptions regarding future metal prices may result in changes to proposed project developments or the deferral or abandonment of current or future project development; – a decline in the assumptions regarding future metal prices (alone, or in combination with other material assumptions) may result in a reduction of Newcrest’s estimates of Mineral Resources and Ore Reserves; and – changes in assumptions regarding future metal prices may impact upon the estimation of recoverable amount of Newcrest’s assets when assessing potential accounting impairment of those assets.

58 NEWCREST MINING ANNUAL REPORT 2015
Directors’ ReportOPERATING AND FINANCIAL REVIEW
7. RISKS (continued)
Foreign exchange ratesThe majority of Newcrest’s revenue is realised in, or linked to, the US dollar on the basis that metals are sold globally based on US dollar prices. Newcrest’s operating costs are reported in Australian dollars but are exposed to multiple currencies, including a portion of costs at each operation being denominated in the local currency. The relative performance of the exposed currencies (particularly the Australian dollar) against the US dollar will impact upon Newcrest’s revenue, cost and financial performance and results. An example of the potential impact of foreign exchange rate changes on Newcrest’s EBIT in the 2016 financial year is (but not limited to):
– an AUD 0.01 decrease in the AUD/USD exchange rate is estimated to have a favourable impact of approximately AUD 35 million.
As with assumptions regarding future metal prices, assumptions regarding future foreign exchange rates, alone or in combination with other factors, may impact upon continuing operations, project development decisions, exploration investment decisions, Mineral Resource and Ore Reserves estimates and the assessment of the recoverable amount of Newcrest’s assets.
Increased costs and production inputsOperating costs are frequently subject to variations from one year to the next due to a number of factors, including changing ore grade, characteristics and metallurgy, the mine plan as it follows the sequence of extracting the ore body, the impact of changes in external economic conditions, and decisions made in respect of the level of sustaining capital invested to maintain operations.
Operating costs and capital expenditure are, to a significant extent, driven by the cost of commodity inputs consumed in extracting and processing ore (including fuel, chemical reagents, explosives, tyres, electricity and steel), and labour costs associated with those activities. Increases in costs may have a material adverse effect upon the profitability of existing mining operations, Newcrest’s ability to lower its cost profile and meet projected operating cost targets at its existing mines and new mining projects, could make certain mines or projects uneconomic, and could impact the assessment of the recoverable amount of Newcrest’s assets.
Operating risks and hazardsNewcrest’s mining operations are subject to operating risks and hazards including (without limitation) unanticipated ground conditions, industrial incidents, infrastructure and equipment under-performance or failure, shortage of principal supplies, transportation and logistics issues in relation to the Group’s workforce and equipment, environmental incidents, safety related incidents, interruptions and delays due to community issues, and natural events such as seismic activity and severe weather conditions (including floods and drought).
A key operational risk for Newcrest is the availability of power and water to support mining and mineral processing activities, particularly at Newcrest’s remotely located assets. Even a temporary interruption of power or water supply could adversely affect an operation.
Newcrest’s operations in Indonesia and Papua New Guinea are in areas known to be seismically active and are subject to the risks of earthquakes and related risks of tidal surges and tsunamis, which are difficult to predict. Some of Newcrest’s operations may also experience other specific operating challenges relating to ground conditions and temperature, such as at Gosowong and Lihir.
Newcrest faces particular geotechnical, geothermal and hydrological challenges, in particular due to the trend toward more complex deposits, deeper large pits, and the use of deep, bulk underground mining techniques. This leads to higher pit walls, more complex underground environments and increased exposure to geotechnical hydrological impacts.
There are a number of risks and uncertainties associated with the block and panel caving mining methods being applied by Newcrest at its Cadia operations. Risks include that a cave may not propagate as anticipated, unplanned air pockets may form during the cave propagation, the caving spans needed give rise to a risk of unplanned ground movement due to changes in stresses release in the surrounding rock and unplanned release of material and/or water through drawbells and ventilation shafts.
In addition, the success of Newcrest at some of its operations, including the Lihir operation, depends, in part, upon the implementation of Newcrest’s engineering solutions to particular hydrological and geothermal conditions. At Lihir, for example, significant removal of both groundwater and sea water inflow and geothermal control is required before and during mining.
A failure to resolve any unexpected problems relating to these conditions at a commercially reasonable cost could adversely affect the safety, economics or feasibility of Newcrest’s operations.
Future operating and capital cost requirementsNewcrest’s operating, business and financial performance and results may be impacted by the extent to which Newcrest’s operating cash flows are able to fund its operating and capital expenditure requirements. To the extent that these are insufficient, Newcrest may need to draw on available debt facilities or seek additional funding through asset divestitures, further equity or debt issue, or additional bank debt (or some combination of these), or may need to defer operating or capital expenditure.
Newcrest’s ability to service current funding arrangements and to raise and service any additional funding or to meet conditions applicable to current or future funding arrangements, will be a function of a number of factors, including (without limitation) macroeconomic conditions, future gold and copper prices, Newcrest’s credit rating, operational cash flow and production performance. If Newcrest is unable to obtain any required additional funding on acceptable terms then its business, operating and financial performance and results may be impacted.
Exploration, project evaluation and project developmentNewcrest’s current and future business, operating and financial performance and results are impacted by the discovery of new mineral prospects and actual performance of developing and operating mines, which may differ significantly from estimates determined at the time the relevant project was approved for development. Newcrest’s current or future development activities may not result in expansion or replacement of current production, or one or more new production sites or facilities may be less profitable than anticipated or may not be profitable at all.
Newcrest’s ability to sustain or increase its current level of production in the future is in part dependent on the success of its exploration activities in replacing gold and copper reserves depleted by production, the development of new projects and the expansion of existing operations. In the last decade the time from discovery to production has increased significantly as a result of a variety of factors, including increases in capital requirements, environmental considerations, economic conditions and the complexity and depth of ore bodies.
In the absence of exploration success, or additions to Newcrest’s mineral inventory to support future operations through development activities, expansions or acquisitions, Newcrest will be unable to replace Ore Reserves and Resources depleted by operations.
Exploration activities are speculative in nature and often require substantial expenditure on exploration drilling and sampling as a basis on which to establish the presence, extent and estimated grade (metal content) of mineralised material.
Once mineralisation is discovered it may take several years to determine whether adequate Ore Reserves and/or Resources exist to support a development decision and to obtain necessary orebody knowledge to assess the technical and economic viability of mining projects. During that time the economic viability of the project may change due to fluctuations in factors that affect both revenue and costs, including commodity prices, currency exchange rates, the required return on capital and future cost of development and mining operations.

NEWCREST MINING ANNUAL REPORT 2015 59
Maintaining titleNewcrest’s production, development and exploration activities are subject to obtaining and maintaining the necessary titles, authorisations, permits and licences, and associated land access arrangements with the local community, which authorise those activities under the relevant law (Authorisations). There can be no guarantee that Newcrest will be able to successfully obtain and maintain relevant Authorisations, or obtain and maintain relevant Authorisations on terms acceptable to Newcrest, to support its activities, or that renewal of existing Authorisations will be granted in a timely manner or on terms acceptable to Newcrest.
Authorisations held by or granted to Newcrest may also be subject to challenge by third parties which, if successful, could impact on Newcrest’s exploration, development and/or mining activities.
Law and regulationNewcrest’s current and future mining operations, development projects and exploration activities are subject to various national and local laws, policies and regulations governing the prospecting, development and mining of mineral deposits, taxation and royalties, import and export duties and restrictions, exchange controls, foreign investment approvals, employee and community relations, health and safety, environmental and other matters, and the manner in which these laws are applied or interpreted. A failure to comply with legal requirements may result in enforcement action being taken against Newcrest with potentially material consequences, including financial penalties, suspension of operations and forfeiture.
In a number of jurisdictions where Newcrest has existing interests, the legal framework is increasingly complex, subject to change and becoming more onerous. Changes in laws may result in material additional expenditure, taxes or costs or interruption to Newcrest’s activities in order to comply with changing requirements. There can also be disputes in relation to the application or interpretation of laws, policies or regulations in the countries where we operate which could have an adverse impact on our operations and financial performance.
Political, economic, social and security risksNewcrest has production, development and exploration activities that are subject to political, economic, social, security and other risks and uncertainties.
These risks and uncertainties are unpredictable, vary from country to country and include but are not limited to civil unrest, armed conflict, political instability, expropriation and/or nationalisation, changes in government ownership levels in projects, fraud, bribery and corruption, land ownership disputes and tenement access issues. These risks have become more prevalent in recent years, and in particular there has been an increasing social and political focus on:
– the revenue derived by governments and other stakeholders from mining activities, which has resulted in announced reviews of the fiscal regimes applicable to mining in a number of the jurisdictions in which Newcrest has interests (including Australia, Papua New Guinea and Indonesia); and – national control of and benefit from natural resources, with the announcement of proposed reforms regarding government or landowner participation in mining activities, greater limits on foreign ownership of mining or exploration interests and/or forced divestiture (with or without adequate compensation), and broad reform agenda in relation to mining legislation, environmental stewardship and local business opportunities and employment.
Recent examples of reviews announced in jurisdictions in which Newcrest has mining and/or exploration interests include (without limitation):
– In Indonesia (where Newcrest’s 75% owned Gosowong operations are located), in the context of the review of the Gosowong Contract of Work, the Government may seek to reduce the size of the tenement holding, impose requirements for additional local equity participation, and make changes to the fiscal regime that applies to the project. – In Papua New Guinea, the Government is undertaking a broad review of mining laws and its taxation regime. In addition to the risk of an increased tax cost to the Group’s operations, potential reforms from these reviews may extend to the level of local equity participation in projects, additional requirements for local participation in mining-related businesses, new local mineral smelting and processing requirements, and broader changes to the regulatory and tax regimes for mining and related activities. – In Australia, the Western Australian Department of State Development completed a review of the Western Australian mineral royalty regime in December 2014. Following the review a report was released by the Government in March 2015 which recommended that the royalty rate applicable to gold increase from 2.5% to 3.75%. On release of the report the Government stated that there would be no increase in the 2016 financial year and that any increase in the royalty of any commodity would be undertaken in consultation with the industry.
– There can be no certainty as to what changes, if any, will be made to relevant laws in the jurisdictions where the Group has current interests, or other jurisdictions where the Group may have interests in the future, or the impact that relevant changes may have on Newcrest’s ability to own and operate its mining and related interests and to otherwise conduct its business in those jurisdictions.
Community relationsNewcrest’s relationship with the communities in which it operates is an essential part of ensuring success of its existing operations and the development of its projects. A failure to manage relationships with the communities in which Newcrest operates may lead to local dissatisfaction, which, in turn, may lead to interruptions to Newcrest’s production, development and exploration activities. Particular challenges in community relations include increasing expectations regarding the level of benefits that communities receive and the level of transparency regarding the payment of compensation and the provision of other benefits to affected landowners and the wider community.
Typically, where Newcrest has exploration activities, development projects or operations, it enters into agreements with local landowners. These agreements include compensation and other benefits and may be subject to periodic review. The negotiation and/or review of community agreements, including compensation and other benefits, involves complicated and sensitive issues, associated expectations and often competing interests, which Newcrest seeks to manage respectfully. The nature and subject matter of these negotiations may result in community unrest which, in some instances, results in interruptions to Newcrest’s activities.
For example, the community agreements in place with customary landowners in relation to Newcrest’s Lihir operation in Papua New Guinea are the subject of a regular review process. The duration of the review process is a result of the important and complex issues covered by the agreements and the competing interests of different landowner groups. During the ongoing review process, and in the context of the previous review (FY2000-FY2007), the Lihir operations experienced periodic disruptions as a result of community unrest regarding the progress of the review negotiations and intra-community issues. Although community issues are generally resolved within a short period, there can be no assurance that further disputes with the customary landowners will not arise from time to time which, if prolonged, could lead to disruptions to Newcrest’s projects and operations.
60 NEWCREST MINING ANNUAL REPORT 2015
Directors’ ReportOPERATING AND FINANCIAL REVIEW
7. RISKS (continued)
In addition, there is a level of community concern relating to the perceived effect of mining activities on the environment and on the communities located near such activities. Certain non-government-organisations are vocal critics of the mining industry and its practices, including in relation to the use of hazardous substances in processing activities and the use of deep sea tailings placement. Adverse publicity generated by non-government-organisations or others relating to extractive industries generally, or Newcrest specifically, could have an adverse impact on Newcrest’s reputation or financial condition and may impact on Newcrest’s relationships with the communities in which it operates. No assurance can be given that incidents will not arise that generate community concerns associated with Newcrest’s operations and potentially cause disruptions until resolved.
Environment and closureMining operations and development activities have inherent risks and liabilities associated with potential harm to the environment and the management of waste products. Newcrest’s operations are therefore subject to extensive environmental law and regulation in the various jurisdictions in which it operates. Compliance with these laws require significant expenditure.
Newcrest’s operations may create a risk of exposure to hazardous materials. Newcrest uses hazardous material (for example, cyanide) and generates waste products that must be disposed of. Appropriate management of waste is a key consideration in Newcrest’s operations. Mining operations can also impact flows and water quality in surface and ground water bodies and remedial measures may be required to prevent or minimise such impacts.
Newcrest is required to close its operations and rehabilitate the lands that it disturbs during the exploration and operating phases in accordance with applicable environmental laws and regulations. A closure plan and estimate of closure and rehabilitation liabilities are prepared for each of Newcrest’s operations. These estimates of closure and rehabilitation liabilities are based on current knowledge and assumptions, however actual costs at the time of closure and rehabilitation may vary materially. In addition, adverse or deteriorating external economic conditions may bring forward mine closure and associated closure and rehabilitation costs.
Resources and reservesMineral Resources and Ore Reserves estimates are necessarily imprecise and involve subjective judgements regarding a number of factors including (but not limited to) grade distribution and/or mineralisation, the ability to economically extract and process mineralisation, and future commodity prices, exchange rates and operating costs. Such estimates relate to matters outside Newcrest’s reasonable control and involve statistical analysis which may subsequently prove to be unreliable or flawed.
Newcrest’s annual Mineral Resources and Ore Reserves statement is based upon a number of factors, including (without limitation) exploration drilling and production results, economic assumptions (such as future commodity prices and exchange rates) and operating and other costs. These factors may result in reductions in Newcrest’s Mineral Resources and Ore Reserves estimates, which could adversely affect the life-of-mine plans and may impact upon the value attributable to Newcrest’s mineral inventory and/or the assessment of realisable value of one or more of Newcrest’s assets.
Reliance on contractorsSome aspects of Newcrest’s production, development and exploration activities are conducted by contractors. As a result, Newcrest’s business, operating and financial performance and results are impacted upon by the availability and performance of contractors and the associated risks.
MarketingNewcrest produces mineral concentrates which are exported by ocean vessels to smelters, located predominantly in Asia, with associated risks including (without limitation) fluctuating smelter charges, marine transportation charges and inland freight charges. Transportation of the concentrate is also subject to numerous risks including (without limitation) delays in delivery of shipments, terrorism, loss of or reduced access to export ports, weather conditions and environmental liabilities in the event of an accident or spill. Sales of concentrate may also be adversely impacted by disruption at the operations of one or more of the receiving smelters and consequent declarations of force majeure at such smelters. Additionally, the quality of mineral concentrates, including the presence of impurities and deleterious substances, is subject to restrictions on import which vary across jurisdictions and may impact upon the saleability or price realised for the mineral concentrate.
Human resources and industrial relationsNewcrest competes with mining and other companies to attract and retain key employees and third party contractors with appropriate technical skills and managerial experience necessary to continue to operate its business. There can be no assurance that Newcrest will be able to attract and retain skilled and experienced personnel and, should Newcrest lose any of its key personnel or fail to attract personnel, its business may be harmed and its operations and financial condition could be adversely affected.
Newcrest may be impacted by industrial relations issues in connection with its employees and the employees of Newcrest’s contractors and suppliers. Any such activity could cause production delays, increased labour costs and adversely impact Newcrest’s ability to meet its production forecasts.
In a number of jurisdictions where Newcrest has mining and related interests, there are also local requirements or expectations regarding the extent to which local and national persons are directly engaged in the mining and related activities which may result in disruptions to Newcrest’s activities where relevant requirements and/or expectations are not met. There can be no assurance that disruptions will not occur in the future which may have an adverse effect on Newcrest’s business. Similarly, there can be no assurance that Newcrest will be able to attract and retain suitably qualified and experienced local or national personnel, or that unskilled persons trained by Newcrest will be retained, in the future.
Competition for projects to replace Ore ReservesSignificant gold deposits are becoming more difficult to find, are deeper and often in remote and challenging jurisdictions. The declining rate of discovery of new gold deposits has, in recent years, increased the challenge of replacing the mining depletion of existing resources and reserves throughout the global gold sector. Newcrest faces intense competition for acquisition of attractive exploration and mining properties to replace reserves depleted by mining. As a result of this competition, exploration and acquisitions may not result in Newcrest being able to maintain or increase its Ore Reserves which could negatively impact its future business, operating and financial performance and results.
Newcrest evaluates potential acquisition and development opportunities for mineral deposits, exploration or development properties and operating mines. Newcrest’s decision to acquire or develop these properties is based on a variety of factors, including historical operating results, estimates and assumptions regarding the extent and quality of mineralisation, resources and reserves, assessment of the potential for further discoveries or growth in resources and reserves, development and capital costs, cash and other operating costs, expected future commodity prices, projected economic returns and evaluations of existing or potential liabilities associated with the relevant assets and how these factors may change in future. Other than historical operating results (if applicable), these factors are uncertain and could have an impact on revenue, cash and other operating results, as well as the process used to estimate Mineral Resources and Ore Reserves.

NEWCREST MINING ANNUAL REPORT 2015 61
Joint venture arrangements Newcrest has joint venture interests, including its interests in the Morobe Mining Joint Ventures in Papua New Guinea, the Gosowong mine in Indonesia, the Bonikro mine in Côte d’Ivoire and the Namosi project in Fiji. These operations are subject to the risks normally associated with the conduct of Joint Ventures which include (but are not limited to) disagreement with joint venture partners on how to develop and operate the mines or projects efficiently, inability of joint venture partners to meet their financial and other joint venture commitments and particular risks associated with entities where a sovereign State holds an interest, including the extent to which the State intends to engage in project decision making and the ability of the State to fund its share of project costs. The existence or occurrence of one or more of these circumstances or events may have a material adverse impact on Newcrest’s future cash flows, earnings, operating results, financial conditions and prospects.
New acquisitionsNewcrest’s ability to make successful acquisitions and any difficulties or time delays in achieving successful integration of any such acquisitions could have a material adverse effect on its business, operating results and financial condition. Business combinations and acquisitions entail a number of risks including the effective integration of acquisitions to realise synergies, significant one-time write-offs or restructuring charges, and unanticipated costs and liabilities, including unforeseen plant and equipment reliability issues. Newcrest may also be liable for the acts or omissions of predecessors or otherwise exposed to liabilities that were unforeseen or greater than anticipated.
Macro-economic conditionsNewcrest’s operating performance and financial performance is influenced by a variety of macro-economic and business conditions including the level of inflation, interest rates, exchange rates and government fiscal, monetary and regulatory policies. Prolonged deterioration in general economic conditions, change or deterioration in the rate of economic growth including changes to interest rates or decrease in consumer and business demand, could be expected to ultimately have an impact on Newcrest’s business, results of operations or financial condition and performance.
Information technologyNewcrest’s operations are supported by information technology (IT) systems, consisting of infrastructure, networks, applications, and service providers. Newcrest could be subject to network and systems disruptions from a number of sources, including (without limitation) security breaches, cyber-attacks, natural disasters and system defects. The impact of IT systems disruption could include production downtime, operational delays, and destruction or corruption of data, any of which could have a material impact on Newcrest’s business, operations or financial condition and performance.
Uninsured risksIn addition to maintaining insurances required by law, Newcrest maintains an insurance program for property damage and business interruption designed to protect it against events which could have a significant adverse effect on its operations and profitability. Newcrest’s insurances do not cover all potential risks associated with its business. Newcrest may elect not to insure, or to self-insure against certain risks, where the premiums associated with insuring against those risks are considered to be excessive or for various other reasons, including an assessment that the risks are remote. Further, Newcrest’s insurance policies carry deductibles and limits which apply in the event of a claim which may lead to Newcrest not recovering the full monetary impact of an insured event, and are subject to policy terms and conditions (including exclusions) which may impact on the extent to which a relevant policy responds to the circumstances of a claim. The occurrence of events for which Newcrest is not insured, or in respect of which relevant insurances do not respond fully, may adversely affect Newcrest’s cash flows and overall profitability.
Liquidity and indebtednessIn addition to cash flows from operating activities, Newcrest has a range of debt facilities with external financiers – including unsecured bilateral loan facilities, corporate unsecured senior notes (or ‘bonds’) and private placement unsecured notes. Newcrest has sought to structure these debt facilities to have varying maturities so that its refinancing obligations are staggered. Although Newcrest currently generates sufficient funds to service its debt requirements, no assurance can be given that Newcrest will be able to meet its financial covenants, its debt repayment obligations, or be able to refinance the debt prior to its expiry on acceptable terms to Newcrest. If Newcrest is unable to meet its financial covenants or debt repayment obligations when required or refinance its external debt on acceptable terms, its financial condition and ability to continue operating may be adversely affected.
LitigationLitigation has the potential to materially impact upon Newcrest’s business, operating and financial performance and results. Regardless of the ultimate outcome of litigation (which may be subject to appeal), and whether involving regulatory action or civil claims, litigation may have a material impact on Newcrest as a result of the costs associated with litigation (some of which may not be recoverable) and the management time associated with defending litigation.
The notes to Newcrest’s Financial Statements provide details regarding certain current and potential litigation involving Newcrest.
Forward looking statementsNewcrest provides guidance on aspects of its business including production, cost and capital expenditure which relate to matters in the future (forward looking statements). Forward looking statements inherently involve known and unknown risks, uncertainties and other factors that may cause the Group’s actual results, performance and achievements to differ materially from those indicated in the forward looking statements.
Forward looking statements are based on Newcrest and its Management’s assessment of the financial, market, regulatory and other relevant environments that will exist and affect the Group’s business and operations in the future. There can be no assurance that the assumptions on which forward looking statements are based will prove to be correct, or that the Group’s business or operations will not be affected in any material manner by these or other factors not foreseen or foreseeable by Newcrest or management or beyond the Group’s control.
Although Newcrest attempts and has attempted to identify factors that would cause actual actions, events or results to differ materially from those disclosed in forward looking statements, there may be other factors that could cause actual results, performance, achievements or events not to be as anticipated, estimated or intended, and many events are beyond the reasonable control of the Group.

62 NEWCREST MINING ANNUAL REPORT 2015
Dear Shareholder,
On behalf of the Board, we are pleased to provide Newcrest’s Remuneration Report for the year ended 30 June 2015, for which we seek your support at our Annual General Meeting (AGM) in October 2015.
Year in reviewIn the past year the Company has seen a renewal of its executive team with Jane Thomas joining as Executive General Manager – People and Community, Michael Nossal joining as Chief Development Officer, Philip Stephenson being promoted to Executive General Manager – Gosowong and Telfer and Craig Jones changing role to be Executive General Manager – Cadia and MMJV. Four Executive General Managers left or will be leaving the Company during or shortly after the 2015 financial year.
The second half of calendar year 2015 will also see further Board renewal, with Tim Poole and Vince Gauci retiring and Xiaoling Liu and Roger Higgins joining the Board.
The past year has also seen significant operational change and financial improvement by Newcrest. In comparison with the previous financial year, the 2015 financial year has seen a:
– 19% increase in underlying profit; – 1% increase in gold production and 12% increase in copper production; – 12% reduction in All-in Sustaining Cost to US$789 per ounce sold; – 717% increase in free cash flow; – 22% (or US$819 million) reduction in USD net debt; and – 24% increase in the Newcrest share price (against an AUD gold price increase of 9%).
It has been a successful first year for our new Managing Director and Chief Executive Officer, Sandeep Biswas, and his executive team with respect to financial performance.
Unfortunately Newcrest’s financial performance in the 2015 financial year has been overshadowed by a fatality at Telfer in May 2015, and two fatalities at the Hidden Valley Joint Venture (in which the Company has a 50% interest) in December 2014 and July 2015. The Board and Management remain resolutely focused on eliminating fatalities and life-altering injuries from our operations and will continue to apply considerable effort to achieve this outcome by having the safety of our workforce the number one priority, reducing major hazards in the workplace and increasing safety awareness and behaviours at all levels of the organisation.
Newcrest Remuneration ReviewDuring the 2015 financial year we conducted a complete review of our remuneration arrangements, having received a ‘first strike’ vote at last year’s AGM. The Board, with the assistance of its Human Resources and Remuneration Committee and external remuneration consultants, has made a number of changes to the Company’s executive remuneration framework following extensive consultation with a number of shareholders and proxy advisers. These changes build on improvements that were already being implemented following the Company’s 2014 financial year remuneration review process. The Board believes these improvements address the main concerns raised by shareholders and proxy advisers.
The key changes (which are described in more detail in this Report) include: – 50% of any Short Term Incentive (STI) payment being deferred into shares for a period of up to 2 years. – A change in the way the Long Term Incentive (LTI) measure for Reserves and Resources is calculated, to be on a ‘per share’ basis. – Senior executives’ remuneration mix shifting to a greater proportion of at risk remuneration. – Introduction of a minimum shareholding requirement for all senior executives and Non-Executive Directors (NEDs). – Increased ability for the Company to clawback amounts for a period of two years in certain circumstances including fraud, misconduct and material misstatement of accounts.
Senior executives received no increase in total fixed remuneration during the 2015 financial year where they remained in existing roles (except for a 0.25% increase in statutory superannuation in some cases). NEDs received no fee increases during the 2015 financial year.
ConclusionNewcrest remains committed to ensuring that, consistent with the Board’s strategy and policy, the Company’s executive remuneration framework and outcomes attract and retain high calibre people and drive strong individual and Group performance in the interests of both the Company and its shareholders.
We have made significant changes to the executive remuneration framework in response to the feedback provided to us. We are committed to a continuing dialogue with our shareholders and look forward to welcoming you at the 2015 AGM.
Peter Hay Richard Lee AM
Chairman, Board of Directors Chairman, Human Resources and Remuneration Committee
17 August 2015
LETTER FROM THE CHAIRMAN AND THE CHAIRMAN OF THE HUMAN RESOURCES AND REMUNERATION COMMITTEE

NEWCREST MINING ANNUAL REPORT 2015 63
Directors’ ReportREMUNERATION REPORT
The Directors of Newcrest Mining Limited (the Company) present the Remuneration Report for the Company for the financial year ended 30 June 2015, prepared in accordance with the Corporations Act 2001 and its regulations.
The Report details the remuneration arrangements in place for the Key Management Personnel (KMP) of the Company which comprises all Directors (Executive and Non-Executive) and those Executives who have authority for planning, directing and controlling the activities of the Company. In this Report, ‘Executives’ refers to members of the Executive Committee identified as KMP (including the Chief Executive Officer (CEO) and Chief Financial Officer (CFO) of Newcrest who are also Directors of the Company). ‘NEDs’ refers to Non-Executive Directors of the Company.
Contents
We have structured the Report into the following sections:
Section 1 Remuneration Snapshot 63
Section 2 Key Management Personnel 66
Section 3 Remuneration Governance 67
Section 4 Our Remuneration Framework 69
Section 5 Remuneration Outcomes 77
Section 6 Executive Service Agreements and Termination Arrangements 81
Section 7 Non-Executive Directors’ Remuneration 81
Section 8 Statutory Tables 82
Section 9 Other Tables 88
This Report has been audited under section 308(3C) of the Corporations Act 2001.
1. REMUNERATION SNAPSHOT
1.1. Key pointsThe past year has seen significant change, more reliable operating performance and financial improvement for Newcrest. During the year, gold production of 2.423 million ounces was within the guidance range and was delivered at a Group All-In Sustaining Cost (AISC) of US$789 per ounce sold (12% lower than the prior year). The objective to maximise free cash flow was also met reflecting the focus on cash generation. Free cash flow of A$1,086 million was A$953 million more than the prior year, and Newcrest’s USD-denominated net debt was reduced by US$819 million. The Company’s share price rose by 24% in the financial year, outperforming the Australian dollar gold price (up 9%).
Key remuneration outcomes for the financial year are summarised in the table below.
New CEO The 2015 financial year marked our new CEO’s first year in the role. As can be seen from the financial results, there has been a significant improvement in the Company’s operating and financial performance since Sandeep Biswas commenced as CEO.
As disclosed in our 2014 Remuneration Report, Sandeep’s total fixed remuneration is benchmarked against a comparator group of ASX 11-40 (including Industrials, Energy and Materials) companies and global gold companies. His salary package is pitched to be competitive within the 50th to 75th percentile of this comparator group of companies and was necessary in order to attract a person with the skills and experience that the Board believed were needed to take the Company forward in fulfilling its strategic objectives in the interests of the shareholders.
STI Outcomes The average STI outcome for Executives was 69.32% of the maximum opportunity based on the assessment of business and personal measures.
This reflects the Company’s strong financial performance, but disappointing safety performance during the year.
LTI Outcomes 22.4% of the 2011 LTI Plan (under which grants of LTIs were made in the 2012 financial year) vested during the 2015 financial year, reflecting the difficult challenges facing the Company during the relevant performance period. The portion that vested recognises Management’s efforts in cost management and reduction relative to their peers whilst achieving production guidance during a particularly challenging period.
The 2012 LTI Plan (under which grants of LTIs were made in the 2013 financial year) is expected to vest in September 2015 and it is anticipated that the vesting levels will be low (in the order of 20%). Two of the three measures (ROCE and Reserves Growth) are likely to deliver a low outcome with only the Comparative Cost measure delivering reward to the participants.
NED Remuneration NEDs received no fee increases during the 2015 financial year.

64 NEWCREST MINING ANNUAL REPORT 2015
Directors’ ReportREMUNERATION REPORT
1. REMUNERATION SNAPSHOT (continued)
1.2. What has changed during the 2015 financial year?During the 2015 financial year we conducted a complete review of our remuneration arrangements following extensive consultation with some shareholders and proxy advisers, having received a ‘first strike’ vote in relation to the 2014 Remuneration Report at last year’s AGM. Prior to the 2014 AGM, the Company had already begun to implement a number of changes to its remuneration framework. The table below summarises the key changes implemented during the 2015 financial year as a result of both review processes.
Total Fixed Remuneration (TFR)
Salary Review Salary benchmarking was undertaken and the Board determined that no Executives would receive a salary increase during the 2015 financial year salary review process for their existing roles, except for a 0.25% increase in mandatory superannuation guarantee contributions (where applicable).
The CEO was awarded his remuneration package as set out in section 4.5 upon his appointment as CEO.
STI
Remuneration Mix Whilst no adjustments were made to fixed remuneration, some changes to target and maximum STI and LTI opportunities were made to ensure the total remuneration packages of Executives were competitive with comparable roles in Newcrest’s benchmarking comparator groups.
Changes to the target and maximum STI opportunities were implemented with effect from 1 July 2014. The STI ‘at target’ performance is set at 100% of TFR for the CEO. The STI ‘at target’ performance was increased from 60% to 80% of TFR for the CFO and operational Executive General Managers (EGMs). The STI ‘at target’ performance for non-operational EGMs (being EGMs who are not responsible for Operations, such as the EGM – General Counsel and Company Secretary and the EGM – People and Community) remained unchanged and is set at 60% of TFR. Maximum STI opportunities are double the ‘at target’ performance. Further details are provided in section 4.3.
CEO STI Deferral Introduced
The CEO has volunteered to receive 50% of his STI payment for the 2015 financial year from the date of his appointment as CEO on 4 July 2014 in the form of restricted shares, to be held in trust for a maximum period of two years. 50% of the deferred shares will be released after 12 months, with the remainder released after two years.
Deferred shares will be forfeited in the event of the CEO resigning before the shares are released. Shares will be granted on the basis of VWAP over the five trading days prior to the date on which the cash payment is made.
There has been no change to the CEO’s STI ‘target’ and ‘maximum’ opportunity as a percentage of total fixed remuneration.
Relative Weighting of Business and Personal Performance
The relative weighting of business and personal performance conditions and the formula used to calculate the STI outcome have changed with effect from 1 July 2014, as previously reported. For Executives, business performance was increased to 60% (previously 44%) of the final STI outcome on the basis of the ability of Executives to influence Company outcomes through their collective actions. Further details are provided in section 4.3.
Removal of ‘Discretionary’ Business and Personal STI Elements
The ‘discretionary’ business measure has been replaced by a measure to be defined by the Board at the commencement of each performance year, to increase the objectivity of the determination of the business measure. For the 2015 financial year the Board decided that the measure would be free cash flow (FCF).
In addition, the inclusion of a ‘discretionary’ personal measure was eliminated. For KMP, all personal measures in the 2015 financial year were more robust, business-focused, and represented specific objectives directly relevant to each Executive.
LTI
Changes in ‘Target’ LTI Opportunities
Changes to the target LTI opportunities were applied to the 2014 LTI offer (under which grants of LTIs were made in the 2015 financial year). The CEO received rights to the value of 150% of TFR. The target LTI for the CFO remained at 100% of TFR. The target LTI for the operational EGMs was increased from 60% to 100% of TFR, and for the non-operational EGMs from 60% to 80% of TFR having regard to the fact that there had been no increase to the TFR for Executives remaining in their existing roles, apart from the minor compulsory superannuation adjustment referred to above. Further details are provided in section 4.4.
Holding Lock The 2014 LTI Plan includes a 12 month holding lock on the shares vesting on completion of the three year vesting period.
General
Clawback Clawback provisions were included in the STI Plan for the 2015 financial year and the 2014 LTI Plan to allow the Board to recoup or reduce awards of equity within 12 months of, in the case of STIs, the end of the performance period, and in the case of LTIs, the later of the vesting date and the end of any holding lock period, should these subsequently be found to be excessive or inappropriate due to circumstances including: a participant’s fraud or misconduct, a material misstatement or other event or error in the financial statements of Newcrest or other circumstances which the Board determines in good faith have resulted in an inappropriate benefit.
Overriding Discretion The Board’s overriding discretion to adjust STI and LTI outcomes (which could be used, for example, to properly reflect performance, to adjust for anomalous outcomes and to ensure alignment of awards of ‘at risk’ remuneration with Company strategy and long-term shareholder value creation) has been formalised.

NEWCREST MINING ANNUAL REPORT 2015 65
1.3. What changes are planned for the 2016 financial year? In addition to the above, the Board, with the assistance of its Human Resources and Remuneration Committee (HRR Committee) and external remuneration consultants, has committed to a number of further changes to the Company’s executive remuneration framework that will be implemented during the course of the 2016 financial year.
STI Deferral Introduced for all Executives
For the STI Plan for the 2016 financial year and subsequent years, 50% of any STI award for all Executives (including the CEO) will be deferred into restricted shares. 50% of the deferred shares will be released after 12 months, with the remainder released after two years.
STI deferral will act as a retention mechanism as deferred shares will be forfeited in the event of the Executive resigning before the shares are released. They will also serve to further align the remuneration structure with the interests of shareholders by locking in the price at which the shares will be allocated on the basis of VWAP over the five trading days prior to the date on which the cash payment is made.
Changes in LTI Measures All future Reserves and Resources measures will be stated and calculated on a ‘per share’ basis. The Board has an overarching discretion and would consider exercising it to adjust the calculation if there was a change in capital, such as an equity raising that unfairly impacted LTI participants.
Clawback For the 2016 financial year, an overarching General Clawback Policy has been introduced to allow the Board to make recoveries from any unpaid, unvested, restricted or future LTI or STI award for a period of two years from vesting or the award date. Further details are provided in section 3.6.
Minimum Shareholding Requirements
In order to further align the interests of Management and the Board with the interests of shareholders, minimum shareholding requirements have been introduced for all Executives and NEDs from 1 July 2015. The minimum shareholding requirement for the CEO is 100% of TFR and 50% of TFR for all other Executives, to be achieved within five years from the later of the date of appointment and the introduction of the policy. For all NEDs, a holding which is equivalent to 100% of total annual fees is to be achieved within three years (or as agreed with the Chairman for newly appointed Directors) from the later of the date of appointment and the introduction of the policy.
1.4. KMP – high level summary of changesSandeep Biswas succeeded Greg Robinson as Newcrest’s new CEO on 4 July 2014.
Following his appointment, Sandeep made a number of changes to the structure and composition of the Executive team during the 2015 financial year resulting in a reduction in the size of the Executive Committee team from eight to seven. Further changes to the Executive Committee were announced on 27 April 2015 and 3 June 2015 which take effect during the 2016 financial year and will be reported in the 2016 Remuneration Report.
The restructured Executive team is an experienced and highly capable senior leadership team which will lead the organisation in the next phase of its improvement program to pursue profitable growth.
Full details are set out in section 2.
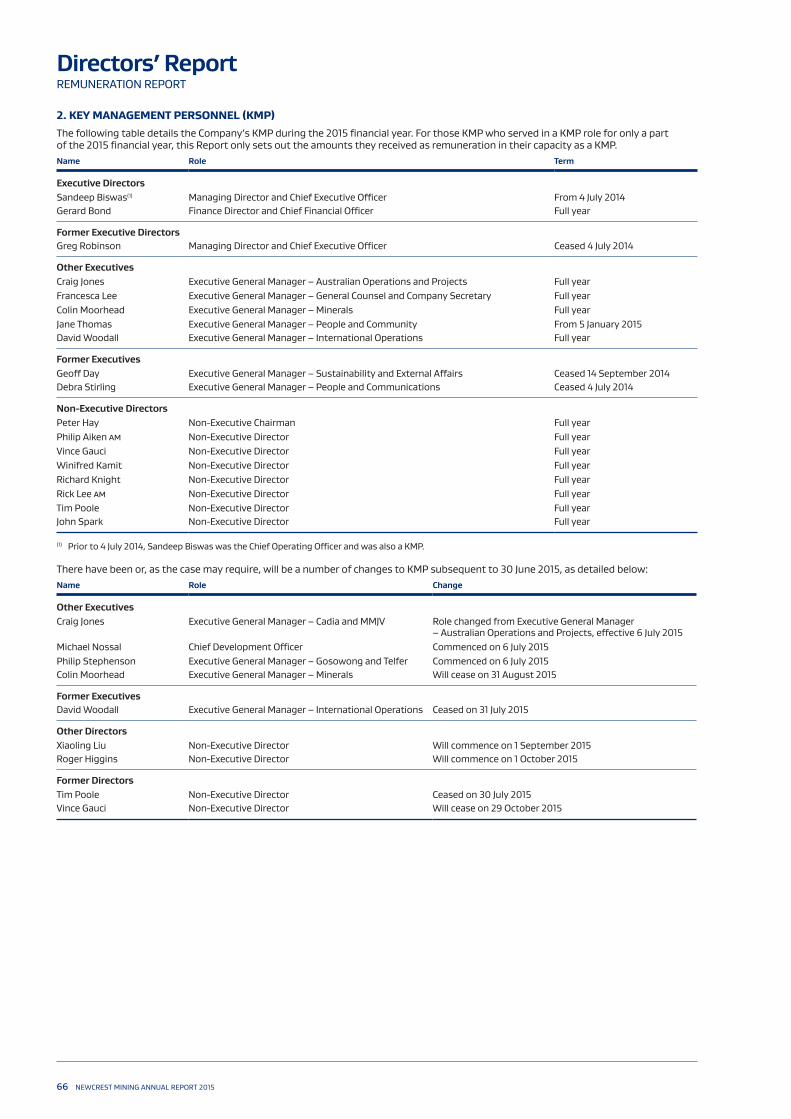
66 NEWCREST MINING ANNUAL REPORT 2015
Directors’ ReportREMUNERATION REPORT
2. KEY MANAGEMENT PERSONNEL (KMP)The following table details the Company’s KMP during the 2015 financial year. For those KMP who served in a KMP role for only a part of the 2015 financial year, this Report only sets out the amounts they received as remuneration in their capacity as a KMP.Name Role Term
Executive DirectorsSandeep Biswas(1) Managing Director and Chief Executive Officer From 4 July 2014Gerard Bond Finance Director and Chief Financial Officer Full year
Former Executive DirectorsGreg Robinson Managing Director and Chief Executive Officer Ceased 4 July 2014
Other ExecutivesCraig Jones Executive General Manager – Australian Operations and Projects Full yearFrancesca Lee Executive General Manager – General Counsel and Company Secretary Full yearColin Moorhead Executive General Manager – Minerals Full yearJane Thomas Executive General Manager – People and Community From 5 January 2015David Woodall Executive General Manager – International Operations Full year
Former ExecutivesGeoff Day Executive General Manager – Sustainability and External Affairs Ceased 14 September 2014 Debra Stirling Executive General Manager – People and Communications Ceased 4 July 2014
Non-Executive DirectorsPeter Hay Non-Executive Chairman Full yearPhilip Aiken AM Non-Executive Director Full yearVince Gauci Non-Executive Director Full yearWinifred Kamit Non-Executive Director Full yearRichard Knight Non-Executive Director Full yearRick Lee AM Non-Executive Director Full yearTim Poole Non-Executive Director Full yearJohn Spark Non-Executive Director Full year
(1) Prior to 4 July 2014, Sandeep Biswas was the Chief Operating Officer and was also a KMP.
There have been or, as the case may require, will be a number of changes to KMP subsequent to 30 June 2015, as detailed below: Name Role Change
Other ExecutivesCraig Jones Executive General Manager – Cadia and MMJV Role changed from Executive General Manager
– Australian Operations and Projects, effective 6 July 2015Michael Nossal Chief Development Officer Commenced on 6 July 2015Philip Stephenson Executive General Manager – Gosowong and Telfer Commenced on 6 July 2015Colin Moorhead Executive General Manager – Minerals Will cease on 31 August 2015
Former ExecutivesDavid Woodall Executive General Manager – International Operations Ceased on 31 July 2015
Other DirectorsXiaoling Liu Non-Executive Director Will commence on 1 September 2015Roger Higgins Non-Executive Director Will commence on 1 October 2015
Former DirectorsTim Poole Non-Executive Director Ceased on 30 July 2015Vince Gauci Non-Executive Director Will cease on 29 October 2015

NEWCREST MINING ANNUAL REPORT 2015 67
3. REMUNERATION GOVERNANCE
3.1. Remuneration StrategyOur remuneration strategy is to provide market-competitive levels of remuneration, having regard to the size and complexity of the Company, the scope and work of each role, and the impact the Executive can have on Company performance.
Our policy is to offer a competitive total remuneration package for Executives, benchmarked against comparable roles in ASX 11-40 companies, including a subset of industrial, materials, energy and utilities companies, and global gold mining companies.
Executive packages target fixed remuneration at around the 50th percentile of the comparator groups, with total remuneration (fixed plus ‘at risk’ variable) up to the 75th percentile for equivalent or comparable roles, adjusted as appropriate to reflect the skills and experience of the individual in each role, and the scope of each role.
The key elements of the remuneration strategy and in determining the remuneration mix are: – market competitive levels of remuneration having regard to both the level of work and the impact employees can potentially have on Company performance; – appropriate levels of ‘at risk’ performance pay to encourage, recognise and reward high performance; – group performance measures that align performance incentives with the long term interests of shareholders; – attraction and retention of talented, high performing Executives; and – a remuneration structure that provides an appropriate balance of risk and reward sharing between each participant and the Company.
3.2. Key issues raised regarding 2014 Remuneration ReportThe Board has taken feedback from shareholders and proxy advisers seriously. Set out below is a summary of the Board’s responses to the key issues raised by some shareholders and proxy advisers in relation to the 2014 Remuneration Report.Issues raised Response
TFR
The CEO TFR is excessive. The quantum of TFR should be seen as part of the entire remuneration package. The benchmarking undertaken showed that, for the 2015 financial year, the total remuneration packages for the CEO and other Executives, were within the 50th to 75th percentile target range of the comparator groups, which is line with Company policy and strategy.
STI
The STI opportunity for the CEO is excessive.
STI deferral and clawback have now been introduced. The ratios of STI and LTI have been changed to ensure the overall package remains market competitive and contain a greater proportion of ‘at risk’ pay.
Appropriateness of STI hurdles questioned and relative measures preferred to absolute measures.
More detail has been provided in this Report in relation to the STI hurdles and adjustments. The Board believes that the STI measures are comprehensive and rigorous and capable of objective assessment.
The previous ‘discretionary’ business measure has been replaced by a measure to be defined by the Board at the commencement of each performance year. For the 2015 financial year this measure was FCF. In addition, the previous ‘discretionary’ personal measure has been replaced by a more robust, business focused objective, being delivery of cost savings as a result of initiatives developed through the Company’s project titled ‘EDGE’ (EDGE Delivery) for the majority of Executives. The remaining three personal measures are also generally linked directly to the objectives of the relevant Business Unit, focusing on safety, financial performance, production and development, and key business drivers.
There is a lack of transparency in relation to the STI personal measures.
More detail has been provided in this Report in relation to the personal STI measures, in particular in relation to the CEO and CFO.
There is no STI deferral. STI deferral has been introduced. See sections 1.2 and 1.3.
LTI
Appropriateness of LTI hurdles questioned and relative measures occasionally preferred to absolute measures.
More detail has been provided in this Report in relation to the LTI hurdles and adjustments and, in particular, the impact of asset impairments on the ROCE measure.
All future Reserves and Resources elements of the LTI measure will be stated and calculated on a ‘per share’ basis.
The Board considered whether relative Total Shareholder Return (TSR) should be included as a measure either in replacement of, or in addition to some or all of the current LTI measures. Having considered the pros and cons of adopting TSR as a measure, the Board believes that the selected LTI measures are comprehensive, rigorous, capable of objective assessment and well aligned with shareholders’ long term interests. See section 4.4.2 for further details.
Other
The incentives do not reflect long term shareholder interests.
The introduction of the 12 month holding lock on LTI Plans, 50% STI deferral into equity for up to two years, general clawback for both the STI and LTI Plans, and minimum shareholding requirements are major steps towards ensuring all Executives and NEDs hold significant equity in the Company on a long term basis.
There is a lack of equity holding requirements for Directors and Executives.
A Minimum Shareholding Requirements Policy has been introduced for the NEDs and all Executives.
Sign-on bonuses for Executives are generally inappropriate.
An Executive Remuneration Policy has been introduced which limits the circumstances in which sign-on bonuses will be considered appropriate.

68 NEWCREST MINING ANNUAL REPORT 2015
Directors’ ReportREMUNERATION REPORT
3. REMUNERATION GOVERNANCE (continued)3.3. Role of the Human Resources and Remuneration Committee (HRR Committee)The Board takes an active role in the governance and oversight of Newcrest’s remuneration policies and is responsible for ensuring that the Company’s remuneration strategy aligns with Newcrest’s short and long term business objectives. The HRR Committee reviews, formulates and makes recommendations to the Board in relation to matters within its Charter, including the remuneration arrangements of the CEO, all other Executives and the NEDs, and oversees the implementation and administration of the major components of the Board’s approved remuneration strategy.
The Charter for the HRR Committee is available on the Company’s website: www.newcrest.com.au/about-us/corporate-governance.
Members of the Committee are: – Rick Lee AM (Chairman); – Philip Aiken AM; – Vince Gauci; and – Winifred Kamit.
3.4. External Remuneration ConsultantsTo assist in performing its duties, and in making recommendations to the Board, the HRR Committee from time to time seeks independent advice from external remuneration consultants on various remuneration related matters.
KPMG provided remuneration recommendations to the HRR Committee as part of its advice which summarised and addressed major shareholder and proxy adviser feedback in relation to the 2014 Remuneration Report.
The engagement of KPMG was initiated by the HRR Committee, based on agreed protocols governing the engagement and processes to be followed regarding recommendations. The protocols are detailed in the Company’s External Remuneration Consultants Policy. In accordance with those protocols, KPMG provides its remuneration recommendations directly to the HRR Committee.
The Board and the HRR Committee are satisfied that remuneration recommendations by KPMG were made free from any ‘undue influence’ for those Executives to whom any recommendations related. The Board and the HRR Committee have reached this conclusion based on the stringency of the protocols and processes outlined above and based on KPMG’s formal declaration.
During 2015, the HRR Committee also obtained other advice as part of the review of the Company’s remuneration arrangements, including: – providing benchmarking data for CEO, Executive and NED remuneration; – providing information and insights with respect to market practices and trends in remuneration within ASX listed and global gold companies, including STI deferral practices, use of TSR as an LTI metric and general overarching clawback provisions; and – providing advice on the tax implications of STI deferral.
KPMG also provided internal audit and taxation advice during the year ended 30 June 2015.
Details of fees paid to KPMG as remuneration consultants and for other services during the year ended 30 June 2015 are set out below.
Fees paid to KPMG
Services2015
(A$’000)
Advice containing remuneration recommendations 26Other (tax, internal audit, advisory) 559
Total 585
No other remuneration consultants were engaged during the year ended 30 June 2015.
3.5. Securities Dealing PolicyThe Company has a Securities Dealing Policy which prohibits the use by Executives and employees of hedging and derivatives such as caps, collars, warrants or similar products in relation to Newcrest securities, including shares acquired under the Company’s equity incentive schemes, whether or not they are vested. The Policy also prohibits entry into transactions in associated products that operate to limit the economic risk of their security or interest holdings in the Company. Employees are not permitted to enter into margin loans in relation to Newcrest securities at any time without prior approval from the Chairman or Company Secretary. The Securities Dealing Policy forms part of each employee’s terms of employment.
The Securities Dealing Policy is available on the Company’s website at: www.newcrest.com.au/about-us/corporate-governance.
3.6. Clawback PolicyThe STI and LTI Plans form significant components of each Executive’s total remuneration package. Both Plans are performance based and, in part, are determined by the Company’s financial performance. The Board included formal clawback provisions within the STI Plan for the 2015 financial year and the 2014 LTI Plan. These provisions allow the Board discretion to recoup or reduce awards of cash or equity should these subsequently be found to be excessive or inappropriate due to circumstances including a participant’s fraud or misconduct, a material misstatement or other event or error in the financial statements of Newcrest, or other circumstances which the Board determines in good faith have resulted in an inappropriate benefit.
As mentioned in section 1.2, the Company has also recently adopted an overarching General Clawback Policy, which extends the scope of the clawback provisions previously included in the STI and LTI Plans and applies for two years from vesting or the award date.
3.7. Overriding Board DiscretionThe Board has an overriding discretion to adjust any STI or LTI outcomes. The Board may, for example, use such discretion to properly reflect performance, to adjust for anomalous outcomes and to ensure alignment of awards of ‘at risk’ remuneration with Company strategy and long term value creation.
In considering the 2015 financial year STI outcome the Board exercised its discretion to adjust the score for the Safety performance measure in the Business Measures to zero, notwithstanding the achievement of some part of the measure. The Business STI outcome of 150% reflects the company’s strong financial performance, but disappointing safety performance.

NEWCREST MINING ANNUAL REPORT 2015 69
3.8. Minimum Shareholding RequirementsAs mentioned in section 1.3, minimum shareholding requirements have been introduced for all Executives and NEDs with effect from 1 July 2015. The minimum shareholding requirement for the CEO is 100% of TFR and 50% of TFR for all other Executives, to be achieved within five years from the later of the date of appointment and the introduction of the policy. For NEDs, a holding which is equivalent to 100% of total annual fees is to be achieved within three years (or as agreed with the Chairman for newly appointed Directors) from the later of the date of appointment and the introduction of the policy.
4. OUR REMUNERATION FRAMEWORK
4.1. Remuneration FrameworkOur Executive remuneration framework comprises both ‘fixed’ and ‘at-risk’ pay elements which are designed to provide for predictable base levels of remuneration through the TFR component, and competitive performance based remuneration through the STI and LTI components.
The diagram below outlines the remuneration components for the 2016 financial year for all Executives and the 2015 financial year for the CEO, how they are assessed and how they are designed to achieve Newcrest’s strategic objectives. Further details regarding each of the remuneration components are provided in sections 4.2 to 4.4. A description of how the remuneration mix translates into practical terms for Executives in the 2015 financial year is provided in section 4.5.
Remuneration Type Fixed Remuneration Variable/At-Risk RemunerationComponent Total Fixed Remuneration (TFR) Short-term Incentive (STI) Long-term Incentive (LTI)
Delivery Delivered in cash Delivered in shares
Composition – Base salary plus superannuation
– Set by reference to ASX 11-40 companies, including a subset of ASX 11-40 industrial, materials, energy and utilities companies and global gold companies
– Targeted at 50th percentile for comparable roles and experience/ skills
– 50% of STI outcomes paid in cash after financial year
– Outcomes based on a combination of business performance and personal objectives measures
– Subject to clawback and overarching Board discretion
– 50% of STI outcomes deferred as restricted shares
– Outcomes based on a combination of business performance and personal objectives measures
– Half of shares are restricted for one year and the other half for 2 years
– Subject to clawback and overarching Board discretion
– Rights with a 3 year vesting period and one year holding lock
– Outcomes based on ROCE, comparative cost position and strategic performance
– Subject to clawback and overarching Board discretion
Link with strategic objectives
Set to attract, retain and motivate high quality executive talent to deliver on the Company’s strategy.
Designed to: – align interests of shareholders and Executives through an appropriate level of ‘at risk’ pay
– reward for increasing shareholder value by meeting or exceeding Company and individual objectives; and
– support the financial and strategic direction of the business through performance measures.
Large proportion subject to Group and business unit financial targets. Non-financial targets aligned to core values, including safety and key strategic and growth objectives.
Designed to encourage Executives to focus on the key performance drivers which underpin the Company’s strategy to deliver long-term growth in shareholder value.
The total remuneration package is designed to: – attract, retain and motivate appropriately qualified and experienced executives; – provide an appropriate balance between risk and reward; – encourage a strong focus on performance and support the delivery of strong returns to Newcrest shareholders over the short and long-term; and
– align executive and shareholder interests through share ownership.
It is targeted at up to the 75th percentile for total remuneration package for comparable roles and experience/skills.
4.2. Total Fixed Remuneration
Feature Description
Composition TFR comprises base salary, superannuation contributions in line with statutory obligations, and any salary packaged amounts (for example, novated lease vehicles).
Relevant Considerations
TFR is determined on an individual basis, considering the scope of the role, the individual’s skills and expertise, individual and group performance, market movements and competitiveness. For the 2015 financial year, the total remuneration packages for all Executives, including the CEO, were within the 50 – 75% target range of the benchmarked comparator groups.
Review TFR is reviewed annually, with any increases taking effect on 1 October each year. There were no increases to TFR for existing roles in the October 2014 salary review, except for a 0.25% increase in TFR for incumbent Executives at 1 July 2014 to reflect the increase in mandatory Superannuation Guarantee Contributions.

70 NEWCREST MINING ANNUAL REPORT 2015
Directors’ ReportREMUNERATION REPORT
4. OUR REMUNERATION FRAMEWORK (continued)
4.3. Short Term Incentive Executives participate in a STI Plan which represents the ‘at risk’ short term incentive component of their remuneration package. Section 4.3.1 outlines the key features of the STI Plan for the 2015 financial year. Section 4.3.2 provides further details of the performance measures chosen for the STI Plan, how they are assessed and the reasons why they were chosen.
Key features of the STI Plan for the 2015 financial year
Feature Description
Participation All Executives participate in the STI Plan. All employees from Supervisor level and above are also invited to participate in the STI Plan.
Opportunity Target percentages awarded differ by level. In general, for ‘at target’ performance, the CEO has the opportunity to receive 100% of TFR, the CFO and operational Executives 80% of TFR, and non-operational Executives 60% of TFR. They have the opportunity to receive double the ‘at target’ percentage for ‘maximum’ performance. The value of the target and maximum STI opportunity expressed as a percentage of TFR for all Executives for the 2015 financial year is provided in section 4.5.
TFR is set in the context that, for achieving target Business performance and meeting personal STI objectives, participants will receive the target STI award, and hence, a competitively positioned total remuneration package. Failure to deliver target will result in a significantly reduced earning opportunity, while out-performing target and achieving maximum targets will be well rewarded. Targets are set with a level of ‘stretch’ built in, and as such, maximum STI targets are designed to only be achieved in respect of exceptional performance.
Delivery and Deferral For the 2015 financial year, the STI is delivered 50% in cash and 50% in deferred shares for the CEO and 100% in cash for other Executives. For the 2015 financial year, the CEO has volunteered that 50% of his 2015 STI award will be deferred and granted in the form of Newcrest shares with 50% of the deferred shares (i.e. 25% of his total STI award) to be released after 12 months (in the 2017 financial year, in October 2016) and the remainder after two years (in the 2018 financial year, in October 2017). The CEO will be entitled to dividends and voting rights attaching to his deferred shares.
STI deferral will apply to all Executives from the 2016 financial year.
Performance Period The assessment period is the financial year preceding the payment date of the STI (i.e. 1 July 2014 – 30 June 2015).
Performance Conditions
Performance conditions are a mix of personal and business measures. Robust threshold, target and maximum targets are established for all measures to drive high levels of business and individual performance. The diagram below illustrates the weighting of the two performance conditions and the further weightings of the specific measures contemplated by the two performance conditions.
Safety 25%
Earnings 25%
Costs 25%
FCF 25%
Sustainability 25%
Operations 25%
Cost savings 25%
Strategy/Growth 25%
Personalmeasures
40%
Businessmeasures
60%
The diagram represents the personal measures for the CEO. Each of the CEO, CFO and other Executives have different personal measures. The same business measures apply to all Executives. For further details in relation to the personal and business measures, including their composition, how they are set and assessed, refer to section 4.3.2.
Calculation of STI Award
STI Amount ($) = ((60% x business outcome) + (40% x personal outcome)) x ‘At Target’ STI% x TFR
Business and personal outcomes are scored out of 200%, with 50% for threshold performance, 100% for target performance and 200% for maximum performance. Business or personal measures that fail to meet the threshold target score 0%. If the overall average of the four personal measures is below 50%, the CEO and/or Board has the discretion to not make an STI award to that participant.
Payment of STI The cash component of the STI will be paid in mid-October 2015 following finalisation and approval of the audited annual Company results and the approval of all personal outcomes. For deferral purposes, the payment date will also serve as the allocation date for the deferred shares.
Cessation of Employment
If an Executive ceases to be an employee prior to the end of a performance period as a result of the Executive resigning or being dismissed, unless the Board decides otherwise, the STI is forfeited.
If an Executive ceases to be an employee in circumstances other than as a result of their resignation or dismissal, then (unless the Board decides otherwise):
– their unvested bonus will be reduced on a pro-rata basis, but will remain payable; and – any deferred shares will remain on foot for the balance of the relevant restriction period and then be released.
Clawback In general, the Board has the discretion to reduce or forfeit an STI award, or to seek recovery from a participant, for fraudulent or dishonest conduct, if the outcomes are the result of material error or misstatement of the financial accounts, or any other circumstance which the Board, in good faith, believes to have resulted in an inappropriate benefit. See section 3.6 for further details relating to clawback.

NEWCREST MINING ANNUAL REPORT 2015 71
4.3.1. STI performance conditions in detail The tables below provide further details on the individual components and weightings of the performance conditions that apply under the STI Plan for the 2015 financial year.
Performance Conditions for the 2015 financial year
Feature Personal Measures Business Measures
Setting performance measures
The personal STI measures for the 2015 financial year were set against KPIs established to encourage exceptional performance in areas that will help drive the Company’s short term performance and realisation of its long term strategy. It is focused on individual contributions to the achievement of strategic corporate cost and efficiency outcomes with the former ‘discretionary’ fourth personal measure set on the same principles.
Business measures and targets are set by the Board on approval of the annual budget which generally forms the basis for setting the ‘target’ performance.
Components Four personal measures are set for each Executive which are specific to each Executive’s role and relevant Business Unit activities. If there is a fatality within an Executive’s area of accountability, the Board may exercise discretion to adjust the assessment of the personal safety measure, including a zero award, where appropriate.
The Board believes that safety should be the first of four STI elements as it is a core value and priority of the Company. The remaining three components of an Executive’s STI award should be determined by the Company’s financial performance. For the 2015 financial year, business measures for Executives are set out in the table below.
Assessment The performance of the CEO against the agreed personal measures is determined by the Chairman. The assessment of all other Executives against their agreed personal measures is determined by the CEO after consultation with and approval by the Board. If the minimum threshold of personal performance is not met, no payment is made in respect of that measure.
For the 2015 financial year, the overall personal outcome is assessed out of a maximum score of 200% for achieving maximum performance (with 100% awarded for achieving target performance). The personal outcome contributes 40% towards each Executive’s final STI outcome.
The assessment of business performance is determined by the Board following finalisation of the annual results. The Board retains overriding discretion to adjust the final outcome to ensure any STI award is appropriate to the level of business performance. If the minimum threshold of business performance is not met, no payment is made in respect of that measure.
Outcomes For a summary of the personal outcomes for Executives refer to sections 5.2.2 and 5.2.3.
For a summary of the business outcomes for Executives refer to section 5.2.1.

72 NEWCREST MINING ANNUAL REPORT 2015
Directors’ ReportREMUNERATION REPORT
4. OUR REMUNERATION FRAMEWORK (continued)
4.3.1. STI performance conditions in detail (continued)Business Measures for the 2015 financial yearThe following table provides a more detailed overview of the Group Business measures applicable to all STI participants for the 2015 financial year:
Executive Business Measure Weighting Reason the Performance Measure Was Adopted
All Executives Safety
Total Recordable Injury Frequency Rate (TRIFR(1)) (50%)
Major Hazard Audit(2) and SPI Action Close Out on Time (50%)
25% The Company takes safety very seriously as it is core to its operations and its ‘licence to operate’. The Company is committed to reinforcing a strong safety culture and improving safety leadership. The combined measures maintain a focus on safety performance as measured by TRIFR and drive critical actions to prevent future potential fatalities and/or serious injuries.
Earnings
Adjusted Net Profit/(Loss) After Tax and Before Significant Items
25% The earnings target is a direct financial measurement of the Company’s performance, providing a strong alignment to the interests of shareholders. The results are based on the statutory profit of the Group adjusted for the effect of commodity prices, foreign exchange rates and other significant items determined by the Board which are considered to be outside the control of management. It provides a strong reflection of cost management, production growth and operational efficiency.
Costs
AISC per ounce (3) 25% Highly relevant short and long term measure which is consistent with the Company’s strategy of driving profitability and sustainability. It is the pervasive cost measure in the industry, and is visible and readily understood. It is based on publicly disclosed and reconciled results and is therefore a reliable measure for use by the Company. It encourages Executives to focus on the importance of reducing costs. The use of the AISC cost measurement more fully defines the cost of producing gold from the operations.
Free Cash Flow
FCF(4) 25% Replacement for previous discretionary measure to provide focus on a clearly defined objective contributing to earnings, corporate strategy and growth.
FCF was selected for the 2015 financial year as a highly relevant short and long-term measure. It is complementary to underlying earnings, providing an insight into cost and capital management and production efficiencies, and is necessary to fund further development opportunities, pay down debt and ultimately pay dividends to shareholders. It is based on publicly disclosed and reconciled results and is therefore a sound basis for the Company to use.
(1) TRIFR is the total number of recordable injuries per million hours worked. It is a lagging indicator of safety performance.(2) Major Hazard Audit action closure, and Significant Potential Incident (SPI) closure, ensures a stronger focus on addressing hazards which may lead
to serious potential incidents in the future, including the potential for a fatality. The measure in the 2015 financial year was strengthened to be closure of actions by their due date.
(3) All-In Sustaining Cost metrics as per World Gold Council Guidance Note on Non-GAAP metric released 27 June 2013.(4) The fourth business measure is determined by the Board on a year by year basis to ensure appropriate focus on a key objective identified by the Board.
Personal measures for the 2015 financial yearFor the 2015 financial year, the key elements to the personal performance measures for Sandeep Biswas were set by the Board to align with the Company’s strategic goals and were as follows:
– sustainability performance – including achievement of safety targets and improvement in organisational health; – operational performance – achievement of Lihir and Cadia related production targets; – cost saving and operational efficiency – based on EDGE related targets and Free Cash Flow targets; and – progress on growth initiatives, exploration projects and M&A activities.
As with the business outcomes, these performance measures were selected to recognise the important role that the CEO plays in personally advancing the Company’s strategic objectives of improving the safety and sustainability performance of the Company, its operational performance, reducing costs and progressing its growth initiatives.
The key elements to the personal performance measures for Gerard Bond for the 2015 financial year were as follows: – capital management; – business planning and, reporting improvements; – growth and portfolio management; and – cost saving and operational efficiency– based on EDGE related targets and FCF outcomes.
The four personal performance measures for other Executives for the 2015 financial year focused on their areas of responsibility which, in the case of the operational Executives, included safety, production, cost saving and operational efficiency.

NEWCREST MINING ANNUAL REPORT 2015 73
4.4. Long Term Incentive Executives participate in a LTI Plan which represents the ‘at risk’ long term incentive component of their remuneration package. Section 4.4.1 outlines the key features of the 2014 LTI Plan which was granted in the 2015 financial year. Sections 4.4.2 and 4.4.3 provide further details of the performance measures chosen for the 2014 LTI Plan, how they are assessed, the reasons why they were chosen and an outlook for the performance conditions for the 2015 LTI Plan.
4.4.1. Key features of the 2014 LTI Plan
Feature Description
Equity type Awards are delivered in the form of Rights. Upon vesting, each Right is automatically exercised and vests as one fully paid ordinary share. As the Rights represent an Executive’s ‘at risk’ long-term incentive component of their remuneration package, the Rights are granted at no cost to the Executive.
Maximum LTI Opportunity
In general, the CEO opportunity is 150% of TFR, the opportunity for the CFO and operational Executives is 100% of TFR, and the opportunity for non-operational Executives is 80% of TFR. Section 4.5 indicates the value of the grants expressed as a percentage of TFR.
Grant Date The allocation date was 7 November 2014, and Rights under the plan will vest, subject to the application of the performance conditions, on 7 November 2017. The total number of Rights held by each Executive, including under the 2014 LTI Plan, are summarised in section 8.4.
LTI Value For these purposes, the value of each Right is calculated based on the face value of the underlying security, using the five day VWAP immediately preceding the allocation date.
Performance period The assessment period is the three financial years commencing on 1 July in the year the grant is issued.
Performance conditions
Rights issued under the 2014 LTI Plan are subject to three equally weighted performance conditions: – Comparative Cost Position; – Return on Capital Employed; and – Strategic Performance.
40% Replacement of Reserves
20% Organisational Health
20% Diversity
20% Growth
Comparative cost position
33%
ROCE 33%
Strategicperformance
33%
The Performance Conditions have been set to align with the long-term goals and performance of Newcrest and the generation of shareholder returns. Further details in regards to the Performance Conditions are detailed in section 4.4.2.
Vesting Rights vest three years from the Grant Date subject to the performance conditions being met. Rights are automatically exercised on vesting.
Holding lock For Executives, shares received on the vesting and automatic exercise of their Rights are subject to a 12 month holding lock.
Dividends No dividends are paid on unvested Rights. Dividends, when applicable, will be paid for vested shares held under the holding lock.
Clawback In general, the Board has the discretion to reduce or forfeit an LTI award for a participant engaged in fraudulent or dishonest conduct or material breach, or if the outcomes are the result of material error or misstatement of the financial accounts. The discretion may be exercised for a period of two years from the vesting or award date. See section 3.6 for details of the Company’s Clawback policy.
Cessation of employment
For ‘good leavers’ on cessation of employment (who cease in circumstances other than as a result of the Participant resigning or being dismissed) pro-rata unvested Rights will remain on foot and vest subject to the application of the performance conditions and any holding lock in the terms of grant.
For other leavers, who cease due to the Participant resigning or being dismissed, unvested Rights will lapse on cessation of employment. For any leavers, shares subject to a holding lock will be released after expiration of the holding lock period.
Change of control The Board may exercise its discretion to allow all or some unvested rights to vest if a change of control event occurs.
RetestingThere is no retesting. Rights that do not vest based on performance over the three year performance period will lapse on the third anniversary of the grant date.
Outcomes For a summary of the outcomes for all Executives refer to section 5.3.

74 NEWCREST MINING ANNUAL REPORT 2015
Directors’ ReportREMUNERATION REPORT
4. OUR REMUNERATION FRAMEWORK (continued)
4.4. Long Term Incentive (continued)
4.4.2. 2014 LTI performance conditions in detail 2014 LTI Performance Conditions
Component Assessment Reason the Performance Measure Was Adopted
Comparative Cost Position
The Company’s measure for the Comparative Cost Position performance condition is the AISC, as determined and reported in accordance with the World Gold Council Guidance Note on Non-GAAP Metrics: All-in Sustaining Costs and All-in Costs, adopted by the Company in relation to costs reporting.
The AISC incorporates costs related to sustaining production.
The comparison is made by ranking the Company’s performance over the three year performance period against other producers included in independently managed and sourced data.
The vesting scale for this measure is as follows: – 0% vests if Comparative Costs are at or above the 50th percentile;
– 50% vests if Comparative Costs are less than the 50th percentile, but at or above the 25th percentile;
– 80% vests if Comparative Costs are below the 25th percentile but at or above the 10th percentile;
– 100% vests if Comparative Costs are below the 10th percentile.
Straight line vesting occurs between each of these thresholds.
An independent data service which offers access to broad-based industry cost and production data is used for performance measurement over the LTI three-year performance period.
Closely aligned to Newcrest’s strategic objective to be a low cost producer and aligned to our relative value proposition for gold equity investors.
Using AISC as the comparative measure is consistent with Newcrest’s public quarterly AISC performance reporting.
The AISC result is a sound basis for the Company to use in assessing comparative cost as it is based on publicly disclosed results.
ROCE
ROCE is an absolute measure, defined as underlying earnings before interest and tax (EBIT), divided by average capital employed, being shareholders’ equity plus net debt.
ROCE for each of the three years of the performance period is averaged to determine the number of Rights that may be exercised in relation to this performance measure.
Average capital employed is calculated as a simple average of opening and closing balances. If material equity transactions (for example, significant equity issuances or asset impairments) occur such that the simple average is not representative of actual performance, the average capital employed for the year is adjusted for the effect of these transactions.
The vesting scale for this measure is as follows:
– 0% vests if ROCE is less than 7%; – 20% vests if ROCE is 7%; – 50% vests if ROCE is 9%; – an additional 6.25% vests for each 1% increase in ROCE above 9% to 17%.
Straight line vesting occurs between each of these thresholds.
ROCE is a fundamental value measure that aligns management action and company outcomes closely with long term shareholder value. ROCE provides a balance to the other LTI metrics as it serves as a counter to ‘buying’ success.
ROCE is also based on publicly disclosed and reconciled results and is therefore a sound basis for the Company to use in assessing value.
The vesting scale was revised for the 2014 LTI Plan to incentivise the acceleration of a lift in ROCE by rewarding the achievement of the threshold level of performance. Inflation has been low since the measure was first introduced in 2009.
Impairments are excluded from the capital base in the year in which they occur, such that the return is on a pre-impairment basis and LTI participants do not benefit from the impairment. However, the post impairment capital base is used in the calculation of returns in future years so as to not de-incentivise current or new management with the burden of goodwill and previous management decisions that could otherwise make the metric unachievable. An impairment ultimately impacts the vesting outcome of the three LTI Plans on foot at the time the impairment is incurred given the ROCE is a three year average.
Strategic Performance
This measure is based on a combination of the following four strategic performance elements over the 2014 LTI three year performance period.
Replacement of Reserves and Resources depletion accounts for 40% of the Strategic Performance measure score. The remaining three measures are equally weighted at 20% each and account for the balance of the 2014 LTI.

NEWCREST MINING ANNUAL REPORT 2015 75
Component Assessment Reason the Performance Measure Was Adopted
1. Replacement of Reserves and Resources Depletion (40%)
– Assessed over the period 1 July 2014 to 30 June 2017.
– Reserves replacement and Resources replacement are each weighted 50% in assessing performance against this measure.
– Excess replacement of one can be applied to offset the shortfall of another, provided the total reward for one does not exceed 150%.
Newcrest has a substantial long life reserves base. Replacing depletion is critical to the long-term future of the Company.
Calculation of reserves and resources is undertaken in compliance with the Australian Code for Reporting of Exploration Results, Mineral Resources and Ore Reserves 2012 Edition (JORC Code), which provides a measure of integrity to the calculations.
2. Organisational Health (20%) – Improvement on the scores achieved in the Organisation Health Index Scores survey results.
– Survey results from a survey in Q1 or Q2 in the 2017 calendar year compared against the Baseline (Q1, 2014 calendar year survey = lowest Quartile Measurement period).
– Threshold = 50th percentile. – Target = 60th percentile. – Maximum = 70th percentile. – Percentile outcome in the 2017 calendar year to be a linear interpolation of above scale.
Organisational Health is how an organisation aligns itself, executes with excellence, and renews itself to sustainably achieve performance aspirations.
The Organisational Health Index is a validated survey instrument prepared by external providers and designed to measure organisational outcomes and the practices used to drive those outcomes. The focus during the three year period is on improving the four practice areas of: Employee Involvement, Bottom Up Innovation, Personal Ownership and Operationally Disciplined.
3. Diversity (20%) Achievement of three targets set by the Board as follows:
– increase the representation of women in management Levels 2 – 4 to a minimum of 16% by 31 December 2016;
– increase the proportion of women accessing programs aimed at accelerating development, by a minimum of 20% by 31 December 2016; and
– increase the representation of women selected for the graduate program to a minimum of 40% by 31 December 2016.
These measures are intended to deliver a larger pool of women from which Newcrest can identify and develop future leaders.
Key priorities will be strengthening the capability of people leaders to create a motivating work environment for their people, which is characterised by an inclusive leadership style, whilst continuing to strengthen Newcrest’s tools, resources and systems to promote work flexibility.
4. Growth (20%) Board assessment of progress made by Management in progressing and/or realising organic and new growth options.
Introduced to ensure a broader focus on a number of other key strategic growth initiatives to drive long term business performance and sustainability.
4.4.3. Outlook for 2015 LTI Performance Conditions (2016 financial year)The LTI Performance Conditions to be adopted in the 2015 LTI offer will be the same as those which apply to the 2014 LTI offer, except that:
– the Reserves and Resources measure will be stated and calculated on a ‘per share basis’; and – the Comparative Costs measure will be assessed using data for the period from 1 July 2015 until 31 March 2018 (i.e. 2 years and 9 months, given the lag in access to such data and a desire to define the LTI outcome at the time of the release of the Remuneration Report for that year).
4.5. Executive Remuneration Mix This section outlines how the remuneration mix looks in practical terms.
The diagram below illustrates how the different components of the remuneration are delivered over a three year cycle to the CEO, and the method by which the components are delivered to achieve the strategic objectives of Newcrest.
TFR
STI
LTI
2015 financial year 2017 financial year 2018 financial year2016 financial year
STI award measured, 50% provided in cash LTI measured, vested rights deferred into restricted shares
Salary (paid during year)
Performance Period
Performance Period Restricted Shares
Deferred Shares (25%) Deferred Shares (25%)

76 NEWCREST MINING ANNUAL REPORT 2015
Directors’ ReportREMUNERATION REPORT
4. OUR REMUNERATION FRAMEWORK (continued)
4.5. Executive remuneration mix (continued)The following diagrams show the remuneration mix for the CEO and other Executives for the 2015 and 2016 financial years. Although the components of TFR, STI and LTI are described separately, they should be viewed as part of an integrated package.
22.2%
22.2%
22.2%
27.8%33.3%
22.2%
22.2%20.0%
20.0%
33.3% 27.8% 26.7%
TFR STI (Cash) STI (Def) LTI
EGM – Gosowong & Telfer, EGM – People & Community, EGM – General Counsel & Company Secretary
CFO, CDO & EGM – Cadia & MMJV
CEO
100%
80%
60%
40%
20%
0%
Remuneration Mix as a Percentage of Maximum FY16
22.2%
22.2%
22.2%
27.8%33.3%
44.4%
33.3% 27.8%
27.8%
44.4% 40.0%
27.8% 26.7%
TFR STI (Cash) STI (Def) LTI
EGM – Ops
EGM – Non-Ops
CFOCEO
100%
80%
60%
40%
20%
0%
Remuneration Mix as a Percentage of Maximum FY15
As a result of the changes effective from 1 July 2015, Newcrest’s mix of remuneration components, expressed as a percentage of ‘maximum’ earning opportunity for each of the current Executives, for the 2016 financial year, is illustrated in the graph below.
The table below outlines the remuneration package for the 2015 financial year for all Executives, broken down into the remuneration components. A higher proportion of the CEO’s total package is at risk relative to other Executives because the CEO has the greatest scope to personally influence the Company’s performance.
Executives Total Remuneration Package for the 2015 financial year
STI(2)
NameTFR A$
TFRUS$(1)
Target Performance
Maximum Performance LTI
Current Executive DirectorsSandeep Biswas 2,300,000 1,929,240 100% 200% 150%Gerard Bond 918,494 770,433 80% 160% 100%
Former Executive DirectorsGreg Robinson 2,000,000 1,677,600 60% 120% 100%
Other Current ExecutivesCraig Jones 770,494 646,290 80% 160% 100%Francesca Lee 700,494 587,574 60% 120% 80%Colin Moorhead 801,602 672,384 60% 120% 80%Jane Thomas 690,000 578,772 60% 120% 80%David Woodall 800,494 671,454 80% 160% 100%
Other Former ExecutivesGeoff Day 728,774 611,296 60% 120% 60%
Debra Stirling 780,300 654,516 60% 120% 60%
(1) USD value for TFR determined on the basis of an average AUD/USD exchange rate of 0.8388 for the 2015 financial year.(2) STI and LTI (face value) are expressed as a percentage of TFR.
Newcrest’s mix of remuneration components, expressed as a percentage of ‘maximum’ earning opportunity, for each grouping of current Executives disclosed in this Report, for the 2015 financial year is illustrated in the following graph.
For the 2016 financial year, and subject to satisfaction of applicable performance conditions, the structure of the LTI and STI deferral plans will result in between 46% to 56% of an Executive’s total maximum earning opportunity being provided as equity. Equity issued as LTI and STI awards is subject to relevant holding locks and restriction periods, and Executives are subject to minimum shareholding requirements, thereby serving to further align Executive and shareholder interests.

NEWCREST MINING ANNUAL REPORT 2015 77
5. REMUNERATION OUTCOMES
5.1. Relationship between STI and LTI Outcomes for the 2015 financial year and Newcrest’s Financial PerformanceNewcrest’s strong operating and financial performance for the 12 months ended 30 June 2015 reflects the Company’s focus on improving operational discipline and maximising cash flow generation across the business. Newcrest’s comprehensive, company-wide improvement program (called ‘EDGE’) pursues improvements across all areas of the business and has contributed to the strong performance in the current period.
Increased gold and copper production and free cash flow generation in the 2015 financial year follows major expansion investments at Cadia Valley and Lihir, improved operating performance across all operations, and a reduction in AISC expenditure.
Newcrest’s 2015 financial year gold production of 2.423 million ounces was within the Group guidance range of 2.3–2.5 million ounces. Full year copper production of 96.8 thousand tonnes was also within the guidance range of 95–105 thousand tonnes.
AISC expenditure of A$2,270 million, total capital expenditure of A$564 million and exploration expenditure of A$46 million were all below their guidance range of A$2,300 to A$2,500 million, A$585 to A$625 million and A$50 to A$60 million, respectively.
FCF, being cash from operating activities less cash from investing activities, was an inflow of A$1,086 million, which was A$953 million higher than the corresponding period. All operations except for Hidden Valley improved FCF generation in the current year, and all were FCF positive.
The strong free cash flow performance enabled US$760 million of the Group’s USD-denominated debt to be repaid and cash on hand to increase by US$65 million in the current period.
This strong operating and financial performance was overshadowed by the safety performance of the Company with two fatalities in the current financial year and a further fatality since the end of the year. On 6 December 2014 an employee of the Hidden Valley Joint Venture was fatally injured after being struck by a reversing loader in the milling area. The second fatality occurred at Telfer on 15 May 2015 when a contractor working in the underground mine was fatally injured while operating an elevated work platform. A further fatality occurred at Hidden Valley on 18 July 2015 when a Hidden Valley employee died in an incident on the site road to the processing plant.
The following table provides a summary of the key financial results for Newcrest over the past five financial years.
Newcrest’s Financial Performance for the 2015 financial year
Year Ended 30 June Measure 2015 2014 2013 2012 2011
Statutory profit/(loss) A$ million 546 (2,221) (5,783) 1,117 908Underlying profit(1) A$ million 515 432 446 1,084 1,058Cash flows from operating activities A$ million 1,589 1,037 1,147 1,726 1,729Free cash flow(2) A$ million 1,086 133 (1,417) (1,029) (565)All-in-sustaining cost (AISC)(3) A$/oz sold 941 976 1,283 n/a n/aAll-in sustaining cost (US$) US$/oz sold 789 897 1,318 n/a n/aCash costs A$/oz produced 760 707 750 603 493EBITDA Margin % 38.5 37.5 39.0 48.7 50.2EBIT Margin % 22.6 20.3 19.7 36.0 37.6ROCE % 8.0 6.4 4.8 10.1 12.4Share price at 30 June(6) A$ 13.02 10.52 9.87 22.61 37.71Earnings/(loss) per share(4)
Basic Cents/share 71.2 (289.8) (755.1) 146.0 126.4 Underlying Cents/share 67.2 56.4 58.2 141.7 147.3Dividends(5) Cents/share – – 12.0 35.0 50.0Gold produced ‘000s ounces 2,423 2,396 2,110 2,286 2,527Average realised gold price A$/oz 1,474 1,408 1,550 1,609 1,378Average realised gold price US$/oz 1,236 1,292 1,585 1,655 1,360
This table includes non-IFRS financial information. Refer to section 6 of the Operating and Financial Review for an explanation and reconciliation of non-IFRS terms.(1) Underlying profit is profit after tax before significant items attributable to owners of the parent. (2) Free cash flow is calculated as cash flow from operating activities less cash flow related to investing activities.(3) AISC metrics as per World Gold Council Guidance Note on Non-GAAP Metrics, released in June 2013. Newcrest’s AISC will vary from period to period as
a result of various factors including production performance, timing of sales, the level of sustaining capital and the relative contribution of each asset. Newcrest commenced reporting AISC from the 2013 financial year.
(4) Basic EPS is calculated as net profit after tax and non-controlling interests (statutory profit) divided by the weighted average number of ordinary shares. Underling earnings per share is calculated as net profit after tax and non-controlling interests and before significant items (underlying profit) divided by the weighted average number of ordinary shares.
(5) Dividends include special dividends of $0.20 in the 2011 financial year.(6) Opening share price on 1 July 2010 was $35.10.

78 NEWCREST MINING ANNUAL REPORT 2015
Directors’ ReportREMUNERATION REPORT
5. REMUNERATION OUTCOMES (continued)
5.1. Relationship between STI and LTI Outcomes for the 2015 financial year and Newcrest’s Financial Performance (continued)
The graphs below show Newcrest’s performance over the last three to five years for metrics used to determine the Business component of any STI award.
2015 2014 2013 2012 2011
102%
100%
98%
96%
94%
92%
90%
Safety and Risk Action Close Out (%)
2015 2014 2013 2012 2011
3.8
3.6
3.4
3.2
3.0
2.8
TRIFR
2015 2014 2013 2012 2011
1,086
133
-1,417
-1,029
-565
1,500
1,000
500
0
-1,000
-500
-1,500
-2,000
Free Cash Flow (A$m)
2015 2014 2013
941 976
1,283
1,500
1,000
500
0
ASIC (A$ per oz sold)
2015 2014 2013 2012 2011
515432 446
1,084 1,058
1,200
1,000
800
600
400
200
0
Underlying Profit (A$m)
2015 2014 2013 2012 2011
546
-2,221
-5,783
1,177 908
2,000
0
-2,000
-4,000
-6,000
-8,000
Statutory Profit/Loss (A$m)
The final Assessment of 150% for the STI Business measures, as detailed in the following section, reflects these financial outcomes and the ongoing improvements in performance of targeted STI metrics.

NEWCREST MINING ANNUAL REPORT 2015 79
5.2. STI Outcomes for 2015 financial year5.2.1. Outcomes for Business MeasuresThe table below details outcomes for the STI Business Measures for the 2015 financial year.
Business element Target OutcomeRelative
WeightingScore
(/200)Weighted
Score
Final Performance Assessment
Safety TRIFR 3.0 3.6 12.5% 0 0% 0%Major Hazard Audits and SPI action close out on time 95% 94% 12.5% 94.4 12% 0%Earnings NPAT before significant items (A$m) (1) 236 374 25.0% 200 50% 50%CostsAISC/oz (A$) 1,021 941 25.0% 200 50% 50%Cash Flow FCF (A$m) 222 852 25.0% 200 50% 50%
Overall Performance 100.0% 162% 150%
Earnings are reconciled to the statutory profit/loss as detailed below.2015 A$m
2014 A$m
Statutory profit/loss after tax 546 (2,221)Add back/(deduct): Significant items after tax(1) (31) 2,653
Underlying profit 515 432Adjust: Board agreed adjustments(2) (141) 32
Earnings 374 464
(1) Refer to section 2.12 of the Operational and Financial Review for details of significant items.(2) Represents adjustments for the effect of commodity prices, foreign exchange rates and other significant items determined by the Board which are
considered to be outside the control of management.
The FCF outcome is subject to adjustments for the same uncontrollable items as earnings with the ‘outcome’ for the measure for STI purposes of A$852 million being below the reported FCF of the Company of A$1,086 million.
For the 2015 financial year, the overall STI Business outcome is assessed out of a maximum score of 200% and contributes 60% towards each Executive’s final STI outcome. Performance at target scores 100% and any performance below the threshold scores 0% for that measure. In determining the overall score for the 2015 financial year STI Business measures, the Board took into consideration the fatalities at Telfer (May 2015) and Hidden Valley (December 2014 and July 2015) and exercised their discretion to reduce the assessment of Safety performance to 0%. As a consequence, the overall STI Business performance was reduced from 162% to 150%. The STI outcome reflects the disappointing safety performance whilst continuing to recognise the excellent financial performance during the year.
5.2.2. Outcomes for 2015 financial year STI Personal Measures – CEO and CFODetailed Personal STI measures and the outcomes for the Executive Directors for the 2015 financial year are set out below.
Sandeep Biswas, Managing Director and Chief Executive Officer
STI Personal ElementsRelative
Weighting (%)Score
(/200)Weighted
Score Performance assessment
Sustainability Performance
25% 70 17.5 – 0% awarded for Safety performance due to fatalities in Telfer and Hidden Valley.
– Significant improvement in Organisational Health Index score.
Operational Performance
25% 122 30.5 – Cadia East ramp up achieved significantly above target. – New operating strategy implemented at Lihir resulting in more plant flexibility and improvements made which increased annualised grinding throughput rate in the fourth Quarter to 11.6Mtpa.
Cost Saving and Operational Efficiency
25% 200 50.0 – Significantly exceeded stretch target for FCF with $1,086 million outcome (adjusted to $852 million for uncontrollable factors such as price and exchange rate).
Strategy and Growth 25% 150 37.5 – Significant progress in Golpu pre-feasibility study. – Excellent progress in development of Lihir pit optimisation pre-feasibility study.
– New exploration targets and Laneway and Mungana farm ins. – Wamum purchase, Evolution partial sale.
Overall Performance 135.5

80 NEWCREST MINING ANNUAL REPORT 2015
Directors’ ReportREMUNERATION REPORT
5. REMUNERATION OUTCOMES (continued)
5.2. STI Outcomes for 2015 financial year (continued)5.2.2. Outcomes for 2015 financial year STI Personal Measures – CEO and CFO (continued)Gerard Bond, Finance Director and Chief Financial Officer
STI Personal ElementsRelative
Weighting (%)Score
(/200)Weighted
Score Performance assessment
Capital Management 25% 100 25.0 – Capital management plan well executed. – Extension of tenor of bi-lateral facilities well executed.
Business Planning and Reporting
25% 150 37.5 – Significant improvement in 5 year planning and annual budgeting processes. – Improved internal monthly reporting. – Simplified processes and improvements for quarterly, six monthly and annual results reporting.
Growth and Portfolio Management
25% 100 25.0 – Good review and due diligence undertaken of potential growth projects. – Portfolio management options progressed. – Partial sale of Evolution shares well executed.
Cost Saving and Operational Efficiency
25% 200 50.0 – Significantly exceeded stretch target for FCF with A$1,086 million outcome (adjusted to A$852 million for uncontrollable factors such as price and exchange rate). Exceeded FCF stretch targets and EDGE stretch targets for Supply working capital and Corporate costs.
Overall Performance 137.5
For the 2015 financial year, the overall personal outcome is assessed out of a maximum score of 200% for achieving maximum performance (with 100% awarded for achieving target performance). The personal outcome contributes 40% towards the CEO’s and each other Executive’s final STI outcome.
5.2.3. STI Outcomes for all Executives for the 2015 financial yearThe table below summarises performance against Personal Measures and final STI outcomes for all Executives(1) for the 2015 financial year. The maximum value of the award for future years (i.e. October 2015) is the actual STI awarded. The minimum value of the award is nil if the performance conditions are not met.
NamePersonal STI Assessment
% of STI Target Awarded
Actual STI % Awarded(5)
Actual STI Awarded (A$’000)
STI Amount Deferred (A$’000)
% of Max STI Opportunity
Awarded
% of Max STI Opportunity
Foregone
Sandeep Biswas(2) 135.5% 144.2% 144.2% 3,317 1,658 72.1% 27.9%Gerard Bond 137.5% 145.0% 116.0% 1,065 – 72.5% 27.5%Craig Jones(2) 116.5% 136.6% 109.3% 842 – 68.3% 31.7%Francesca Lee 125.0% 140.0% 84.0% 588 – 70.0% 30.0%Colin Moorhead(2) 81.3% 122.5% 73.5% 589 – 61.3% 38.7%Jane Thomas(3) 134.0% 143.6% 86.2% 288 – 71.8% 28.2%
David Woodall(4) – – – – – – 100.0%
(1) Greg Robinson, Geoff Day and Debra Stirling were not eligible to receive a reward under the STI Plan for the 2015 financial year as they ceased employment early during the performance period.
(2) Sandeep Biswas, Craig Jones and Colin Moorhead all received a score of 0% for the Safety component of their Personal STI assessments.(3) Jane Thomas commenced on 5 January 2015. The STI amount awarded has been pro-rated for the proportion of the performance period worked.(4) As part of his termination arrangements it was agreed that David Woodall would not receive any STI payments.(5) Calculated using the percentages for Target Performance disclosed in the table in section 4.5.
The CEO will receive A$1,658,300 of his STI payment for the 2015 financial year in cash in mid October 2015 and the remainder will be provided in the form of deferred Newcrest shares. All other Executives will receive their STI payment for the 2015 financial year in cash in mid-October 2015.
5.3. Vesting Outcomes for 2011 LTI PlanFollowing the completion of the performance period from 1 July 2011 to 30 June 2014, the 2011 LTI Plan vested on 23 September 2014 at 22.4% of target based on the assessment of performance against the applicable measures.
The following table compares Newcrest’s 2011 LTI Plan vesting results with the results for the past two LTI plans.Performance Achieved
Financial Year Name of Plan Grant Date(1) Vesting Date Cost Reserves ROCEPercentage
VestedPercentage
Lapsed
FY2010 2009 LTI Plan 10 Nov 2009 10 Nov 2012(2) 73.6% 100.0% 60.4% 78.0% 22.0%
FY2011 2010 LTI Plan 10 Nov 2010 10 Nov 2013(3)(4) 56.7% 91.0% 12.9% 26.8%(4) 73.2%
FY2012 2011 LTI Plan 23 Sep 2011 23 Sep 2014(5) 53.8% 13.3% 0% 22.4% 77.6%
(1) The strike price for all Plans for all years is nil. (2) All vested Rights for the 2009 LTI Plan have been exercised.(3) The expiry date for all vested Rights yet to be exercised for the 2010 LTI Plan is 10 November 2015. All eligible Executives have exercised their vested
LTI Rights under this Plan.(4) Under the 2010 LTI Plan the LTI vested at 53.6% of target. The Board exercised its discretion, with the agreement of Executives, to reduce the LTI
vesting outcome under this Plan by half to 26.8%.(5) Under the 2011 LTI Plan all Rights were automatically exercised on vesting.

NEWCREST MINING ANNUAL REPORT 2015 81
This reduction in vesting over the last three years reflects the Company’s poor performance against the ROCE measure in recent years and the change in the Company’s strategy away from Reserves Growth to one of Reserves and Resources Depletion Replacement. However, the vesting outcomes do provide management an appropriate level of reward for their effort in containing and reducing costs, relative to their peers, whilst maintaining production guidance, during a particularly challenging period.
5.4. Estimated Vesting of LTI Rights in the 2016 financial year (2012 LTI Plan)The 2012 LTI Plan will vest on 17 September 2015. The vesting outcome is not yet known as the data required to determine the Comparative Cost measure is not yet available. However, it is anticipated that the vesting will be low (in the order of 20%), noting on present indications that ROCE will deliver a zero outcome and the Reserves Growth measure is likely to deliver a low or nil outcome.
The vesting outcomes of the 2010 LTI Plan, 2011 LTI Plan and likely outcome for the 2012 LTI Plan are reflective of the Company’s performance over the last three years, particularly the poor performance in regards to ROCE. However, the low vesting outcomes do recognise the concerted and on-going efforts to reduce costs throughout the performance period, whilst maintaining or exceeding production guidance for the last two years of the period.
6. EXECUTIVE SERVICE AGREEMENTS AND TERMINATION ARRANGEMENTSRemuneration and other terms of employment for the Executives are formalised in Executive Service Agreements (ESA). Each of these Agreements provides for the payment of fixed and performance based at risk remuneration, employer superannuation contributions, and other benefits such as a death and disablement insurance cover via the Newcrest Superannuation Plan, and salary continuance cover. All contracts with Executives are open ended (i.e. they do not have a fixed end date). The terms of remuneration for each Executive during the year ended 30 June 2015 are detailed in section 4.5, and positions held are detailed in section 2.
Each Executive’s Service Agreement for Executives for the year ended 30 June 2015 provides that the Executive may terminate their employment by giving the Company 3 months’ notice. The Company may terminate the Executive’s employment by giving 12 months’ notice and the Company may, at its discretion, elect to pay the Executive an amount in lieu of notice for any portion of the 12 months not worked.
The Company may terminate an Executive’s employment without notice at any time for cause. No payment in lieu of notice, or any payment in respect of STI or LTI is payable under the ESA in this circumstance.
On cessation of employment, STI or LTI awards vest in accordance with the relevant Plan Rules. Refer to sections 4.3 and 4.4 for further details.
7. NON-EXECUTIVE DIRECTORS’ REMUNERATION
7.1. Remuneration PolicyThe NED fees and other terms are set by the Board. NEDs are paid by way of a fixed Director’s fee and Committee fees commensurate with their respective time commitments and responsibilities. The level and structure of the fees is based upon:
– the need for the Company to attract and retain NEDs of suitable calibre; – the demands of the role; and – prevailing market conditions.
In order to maintain impartiality and independence, NEDs do not receive any performance-related remuneration and are not entitled to participate in the Company’s short and long-term incentive schemes. NEDs are not provided with any retirement benefits, other than statutory superannuation contributions.
All Directors are required to hold shares in the Company. As detailed in section 3.8, the Company has introduced a Minimum Shareholding Requirement Policy applicable to all Executives and NEDs from 1 July 2015. This policy requires that all NEDs acquire and then maintain a minimum of one year’s total annual fees in shares, to be acquired within three years (or as agreed with the Chairman for newly appointed Directors) of the later of appointment or introduction of the policy.
7.2. Fee PoolThe maximum amount of fees (including superannuation contributions) that can be paid to NEDs is capped by a pool approved by shareholders. At the Annual General Meeting held on 28 October 2010, shareholders approved the current fee pool of A$2,700,000 per annum.
In June 2015, the Board resolved that the aggregate maximum amount of NEDs’ fees should remain at the level approved by shareholders in 2010.
7.3. Fee StructureIn reviewing the level of fees, the Board obtained independent market data from KPMG. The fees were compared to the ASX 11-40 comparator group. The benchmarking review showed that the current NED fees were competitively positioned, and as a result, the Board decided that there would be no change to existing fee levels.
The following table outlines the main Board and Committee fees as at 30 June 2015:Per Annum (A$’000)
Board Fees Chairperson 600Members 200
Committee Fees Audit & Risk CommitteeChairperson 50Members 25
Safety & Sustainability CommitteeChairperson 40Members 20
HRR CommitteeChairperson 40
Members 20
Under the Company’s Constitution, NEDs may be remunerated for additional services, for example, if they undertake specialist or consulting work on behalf of the Company outside the scope of their normal Director’s duties. No fees for additional services were paid to NEDs for the current or prior financial year.

82 NEWCREST MINING ANNUAL REPORT 2015
Directors’ ReportREMUNERATION REPORT
8. STATUTORY TABLES
8.1. Executive Remuneration
Short TermLong-term
Post-Employ-
mentShare-Based
Payments
Salary (A)
A$’000
Separation Payments
(B) A$’000
Salary at Risk
(C) A$’000
Other Cash
Benefits (D)
A$’000
Other Benefits
(E) A$’000
Other Benefits
(F) A$’000
Super-annuation
(G)A$’000
Rights (H)
A$’000
Shares (I)
A$’000
Total
A$’000
Perfor-mance related
(J) %
ExecutivesSandeep Biswas 2015 2,275 – 1,658 17 26 139 19 423 1,096 5,653 40.4
2014 741 – 800 9 4 69 9 521 – 2,153 37.2Gerard Bond 2015 900 – 1,065 – 12 18 19 188 – 2,202 48.4
2014 900 – 531 – 12 15 18 183 – 1,659 32.0Craig Jones 2015 751 – 842 – 9 13 19 124 – 1,758 47.9
2014 751 – 527 239 6 28 18 24 – 1,593 33.1Francesca Lee 2015 682 – 588 – 7 29 19 55 – 1,380 42.6
2014 172 – 139 – 2 16 4 – – 333 41.7Colin Moorhead 2015 783 601 589 – 9 13 19 125 – 2,139 27.5
2014 783 – 604 – 9 13 18 (70) – 1,357 44.5Jane Thomas 2015 328 – 288 236 32 24 9 51 – 968 29.8
2014 – – – – – – – – – – n/aDavid Woodall 2015 782 704 – 47 55 29 19 – – 1,636 n/a
2014 283 – 212 23 2 7 9 – – 536 39.6
Former ExecutivesGreg Robinson 2015 22 – – – – – – – – 22 n/a
2014 1,982 1,600 1,026 – 9 125 18 (303) – 4,457 23.0Debra Stirling 2015 8 – – – – – – – – 8 n/a
2014 763 773 589 – 9 28 18 (186) – 1,994 29.5Geoff Day 2015 146 – – – 3 – 9 (27) – 131 n/a
2014 711 – 511 22 2 21 18 27 – 1,312 38.9Lawrie Conway 2015 – – 130 – – – – – – 130 n/a
2014 528 642 405 – 11 6 18 (34) – 1,576 25.7Stephen Creese 2015 – – – – – – – – – – n/a
2014 2 – – – – – – (404) – (402) n/aBrett Fletcher 2015 – – – – – – – – – – n/a
2014 482 783 259 – 7 – 12 (138) – 1,405 18.4Scott Langford 2015 – – – – – – – – – – n/a
2014 278 500 203 – 5 22 9 (5) – 1,012 20.1Andrew Logan 2015 – – – – – – – – – – n/a
2014 467 – 374 – 9 8 12 3 – 873 42.8Peter Smith 2015 – – – – – – – – – – n/a
2014 57 758 – – – 6 18 (197) – 642 n/a
Total 2015 6,677 1,305 5,160 300 153 265 132 939 1,096 16,027
2014 8,900 5,056 6,180 293 87 364 199 (579) – 20,500
The table above details the statutory remuneration disclosures as calculated with reference to the Corporations Act 2001 and relevant accounting standards. Where applicable, remuneration data is pro-rated for the time periods during the financial year 1 July 2014 to 30 June 2015 that the Executive was a KMP. An explanation of the relevant remuneration items included in the tables is provided in the associated footnotes. The figures provided in relation to share based payments (columns H and I) are calculated in accordance with accounting standards and represent the amortised fair value of equity instruments that have been granted to Executives.
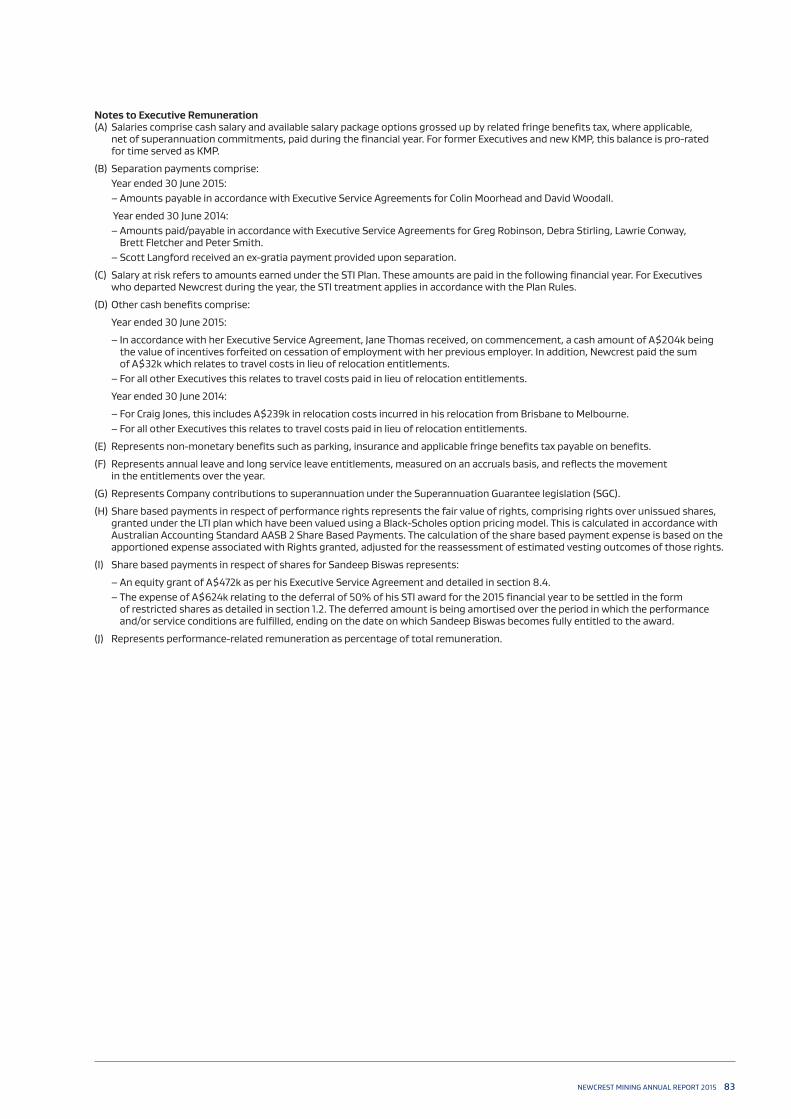
NEWCREST MINING ANNUAL REPORT 2015 83
Notes to Executive Remuneration(A) Salaries comprise cash salary and available salary package options grossed up by related fringe benefits tax, where applicable,
net of superannuation commitments, paid during the financial year. For former Executives and new KMP, this balance is pro-rated for time served as KMP.
(B) Separation payments comprise: Year ended 30 June 2015:
– Amounts payable in accordance with Executive Service Agreements for Colin Moorhead and David Woodall.
Year ended 30 June 2014: – Amounts paid/payable in accordance with Executive Service Agreements for Greg Robinson, Debra Stirling, Lawrie Conway, Brett Fletcher and Peter Smith. – Scott Langford received an ex-gratia payment provided upon separation.
(C) Salary at risk refers to amounts earned under the STI Plan. These amounts are paid in the following financial year. For Executives who departed Newcrest during the year, the STI treatment applies in accordance with the Plan Rules.
(D) Other cash benefits comprise:
Year ended 30 June 2015:
– In accordance with her Executive Service Agreement, Jane Thomas received, on commencement, a cash amount of A$204k being the value of incentives forfeited on cessation of employment with her previous employer. In addition, Newcrest paid the sum of A$32k which relates to travel costs in lieu of relocation entitlements. – For all other Executives this relates to travel costs paid in lieu of relocation entitlements.
Year ended 30 June 2014:
– For Craig Jones, this includes A$239k in relocation costs incurred in his relocation from Brisbane to Melbourne. – For all other Executives this relates to travel costs paid in lieu of relocation entitlements.
(E) Represents non-monetary benefits such as parking, insurance and applicable fringe benefits tax payable on benefits.
(F) Represents annual leave and long service leave entitlements, measured on an accruals basis, and reflects the movement in the entitlements over the year.
(G) Represents Company contributions to superannuation under the Superannuation Guarantee legislation (SGC).
(H) Share based payments in respect of performance rights represents the fair value of rights, comprising rights over unissued shares, granted under the LTI plan which have been valued using a Black-Scholes option pricing model. This is calculated in accordance with Australian Accounting Standard AASB 2 Share Based Payments. The calculation of the share based payment expense is based on the apportioned expense associated with Rights granted, adjusted for the reassessment of estimated vesting outcomes of those rights.
(I) Share based payments in respect of shares for Sandeep Biswas represents:
– An equity grant of A$472k as per his Executive Service Agreement and detailed in section 8.4. – The expense of A$624k relating to the deferral of 50% of his STI award for the 2015 financial year to be settled in the form of restricted shares as detailed in section 1.2. The deferred amount is being amortised over the period in which the performance and/or service conditions are fulfilled, ending on the date on which Sandeep Biswas becomes fully entitled to the award.
(J) Represents performance-related remuneration as percentage of total remuneration.

84 NEWCREST MINING ANNUAL REPORT 2015
Directors’ ReportREMUNERATION REPORT
8. STATUTORY TABLES (continued)
8.2. Executives – Changes in LTI Rights Holdings during the 2015 financial yearClosing Balance
ExecutiveOpening balance
at 1 July 2014 GrantedRights Lapsed/
Forfeited(1)Vested and/or
ExercisedClosing balance
30 June 2015(2)Vested and Exercisable Non-vested(3)
Current ExecutivesSandeep Biswas 176,769 390,069 – – 566,838 – 566,838Gerard Bond(4) 180,264 103,848 (18,534) (5,350) 260,228 – 260,228Craig Jones(5) 82,082 87,115 (2,846) (1,530) 164,821 – 164,821Francesca Lee – 63,360 – – 63,360 – 63,360Colin Moorhead(6) 107,795 72,505 (85,572) (15,234) 79,494 – 79,494Jane Thomas(7) – 59,051 – – 59,051 – 59,051David Woodall(8) – 90,507 (90,507) – – – –
Former ExecutivesGreg Robinson(9) 171,362 – – – 171,362 – 171,362Geoff Day(10) 57,066 – (57,066) – – – –
Debra Stirling(9) 42,683 – – – 42,683 2,817 39,866
(1) Rights which lapsed or were forfeited were granted in the following financial years: Gerard Bond – 2012 financial year; Craig Jones – 2012 financial year; David Woodall – 2015 financial year; Geoff Day – 2014 financial year. The rights held by Colin Moorhead, which lapsed or were forfeited, were granted in the following financial years: 10,680 – 2012 financial year; 279 – 2013 financial year; 21,822 – 2014 financial year; 52,791 – 2015 financial year.
(2) For former Executives, the closing balance represents the balance at the date of their departure.(3) These Rights are ‘at risk’ and will lapse or be forfeited, in the event that the minimum prescribed conditions are not met by the Company or individual
Executive, as applicable.(4) Rights vested and/or exercised, comprises of 5,350 Rights vested from the 2011 LTI Plan.(5) Rights vested and/or exercised, comprises of 821 Rights vested from the 2011 LTI Plan and 709 vested and unexercised Rights from the 2010 LTI Plan.
In addition, Craig Jones exercised 2,263 Rights from the 2009 LTI Plan which were awarded prior to being an Executive.(6) Rights vested and/or exercised, comprises of 3,082 Rights vested from the 2011 LTI Plan 2,898 vested and unexercised Rights from the 2010 LTI Plan
and 9,254 vested and unexercised rights from the 2009 LTI Plan. Rights lapsed includes rights forfeited in line with his separation agreement entered into during the year.
(7) Jane Thomas commenced in the position on 5 January 2015 and received a pro-rata invitation to participate in the 2014 LTI Plan.(8) Rights lapsed includes rights forfeited in line with his separation agreement entered into during the year.(9) For Greg Robinson and Debra Stirling the opening balance is net of forfeitures as per the Deeds of Separation entered into by them with the Company
in the 2014 financial year.(10) Geoff Day ceased in the position on 14 September 2014 due to resignation. All Rights held were forfeited on cessation.

NEWCREST MINING ANNUAL REPORT 2015 85
8.3. Executives – Total Value of LTI Rights Granted and Exercised in the year ended 30 June 2015
Executive
Accounting Fair Value of Rights
Granted (A)
A$’000
Face Value of Rights Granted
(B) A$’000
Value of Rights Exercised
(C) A$’000
Sandeep Biswas 4,182 3,450 533Gerard Bond 1,113 918 46Craig Jones 934 770 42Francesca Lee 679 560 –Colin Moorhead 777 641 160Jane Thomas 633 552 –David Woodall 970 800 –
The following assumptions have been applied to this table:
(A) The accounting value of the Rights reflects the fair value of the Right at 12 December 2014 (A$10.72) multiplied by the number of Rights granted during the year. The fair value has been determined using a Black-Scholes option pricing model prepared by an independent third party. The number of Rights awarded at grant date was based on the Volume Weighted Average Price (VWAP) of Newcrest’s share price over the period 31 October – 6 November 2014 inclusive (A$8.8446).
(B) The face value of the Rights at grant date reflects the face value of the Rights at 7 November 2014. The face value of the Rights is determined by multiplying the number of Rights granted during the year by the Volume Weighted Average price (VWAP) of Newcrest’s share price over the period 31 October – 6 November 2014 inclusive (A$8.8446), the five trading days immediately prior to the offer date.
(C) The value at exercise date has been determined by the Company’s share price at the close of business on the exercise date multiplied by the number of rights exercised during the year ended (nil exercise price). For Sandeep Biswas the amount represents the shares transferred in November 2014.
8.4. Executives – Source of LTI Rights Holdings at 30 June 2015
Financial Year FY2013 FY2014 FY2015Balance at
30 June 2015Allocation Date VWAP for Grant(1)
23 Sep 12 $25.16
16 Sep 13 $7.66
7 Nov 14 $8.84
Sandeep Biswas(2) – 176,769 390,069 566,838Gerard Bond 36,493 119,887 103,848 260,228Craig Jones 17,371 60,335 87,115 164,821Francesca Lee – – 63,360 63,360Colin Moorhead(3) 18,829 40,951 19,714 79,494Jane Thomas – – 59,051 59,051David Woodall(3) – – – –
(1) Five day VWAP price used to determine the number of Rights offered.(2) In addition, Sandeep Biswas is entitled under the Executive Service Agreement for his former role of Chief Operating Officer to a tranche of 54,990 ordinary
shares in the Company valued at $500,000 based on the January 2014 VWAP (or cash equivalent), subject to continuing employment and satisfactory performance. Such shares were provided as ‘sign-on’ incentives and were carried forward when Sandeep Biswas became MD and CEO.
(3) Holdings are net of forfeitures in line with separation agreements entered into in the year ended 30 June 2015.
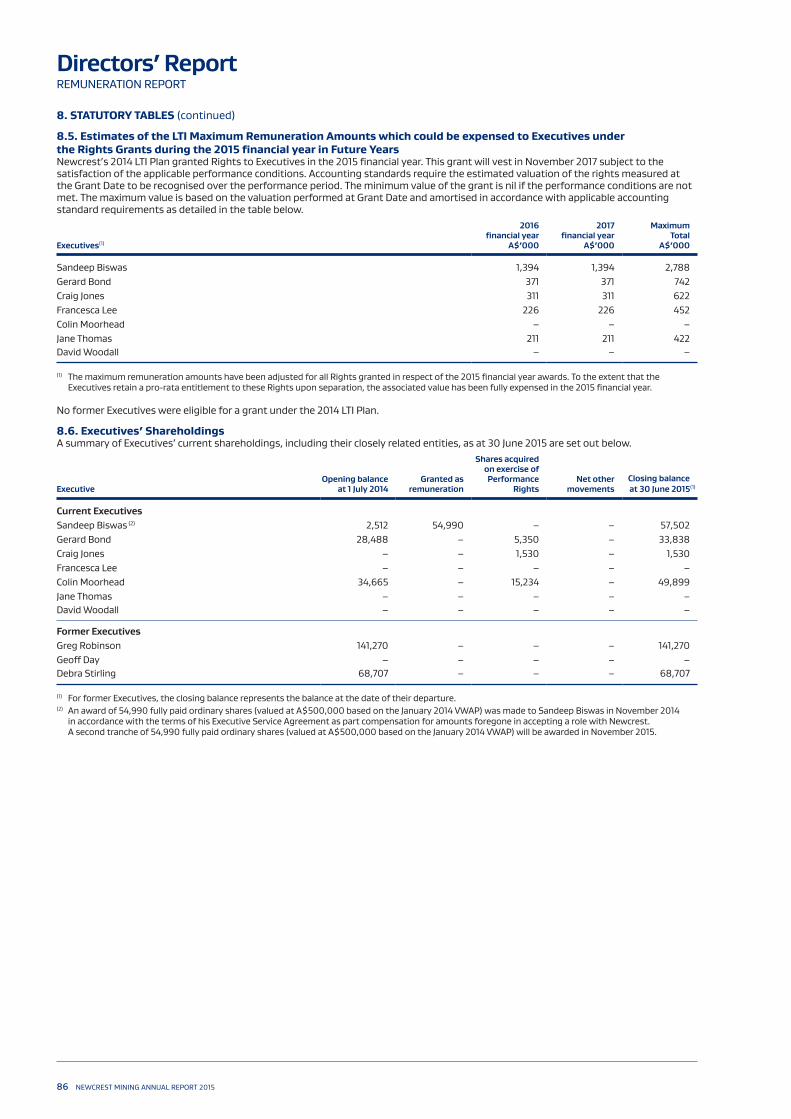
86 NEWCREST MINING ANNUAL REPORT 2015
Directors’ ReportREMUNERATION REPORT
8. STATUTORY TABLES (continued)
8.5. Estimates of the LTI Maximum Remuneration Amounts which could be expensed to Executives under the Rights Grants during the 2015 financial year in Future YearsNewcrest’s 2014 LTI Plan granted Rights to Executives in the 2015 financial year. This grant will vest in November 2017 subject to the satisfaction of the applicable performance conditions. Accounting standards require the estimated valuation of the rights measured at the Grant Date to be recognised over the performance period. The minimum value of the grant is nil if the performance conditions are not met. The maximum value is based on the valuation performed at Grant Date and amortised in accordance with applicable accounting standard requirements as detailed in the table below.
Executives(1)
2016 financial year
A$’000
2017 financial year
A$’000
Maximum Total
A$’000
Sandeep Biswas 1,394 1,394 2,788Gerard Bond 371 371 742Craig Jones 311 311 622Francesca Lee 226 226 452Colin Moorhead – – –Jane Thomas 211 211 422David Woodall – – –
(1) The maximum remuneration amounts have been adjusted for all Rights granted in respect of the 2015 financial year awards. To the extent that the Executives retain a pro-rata entitlement to these Rights upon separation, the associated value has been fully expensed in the 2015 financial year.
No former Executives were eligible for a grant under the 2014 LTI Plan.
8.6. Executives’ ShareholdingsA summary of Executives’ current shareholdings, including their closely related entities, as at 30 June 2015 are set out below.
ExecutiveOpening balance
at 1 July 2014Granted as
remuneration
Shares acquired on exercise of Performance
RightsNet other
movementsClosing balanceat 30 June 2015(1)
Current ExecutivesSandeep Biswas (2) 2,512 54,990 – – 57,502Gerard Bond 28,488 – 5,350 – 33,838Craig Jones – – 1,530 – 1,530Francesca Lee – – – – –Colin Moorhead 34,665 – 15,234 – 49,899Jane Thomas – – – – –David Woodall – – – – –
Former ExecutivesGreg Robinson 141,270 – – – 141,270Geoff Day – – – – –Debra Stirling 68,707 – – – 68,707
(1) For former Executives, the closing balance represents the balance at the date of their departure.(2) An award of 54,990 fully paid ordinary shares (valued at A$500,000 based on the January 2014 VWAP) was made to Sandeep Biswas in November 2014
in accordance with the terms of his Executive Service Agreement as part compensation for amounts foregone in accepting a role with Newcrest. A second tranche of 54,990 fully paid ordinary shares (valued at A$500,000 based on the January 2014 VWAP) will be awarded in November 2015.

NEWCREST MINING ANNUAL REPORT 2015 87
8.7. Non-Executive Directors’ Remuneration Short-Term Post-Employment
Board Fees (A$’000)
Committee Fees (A$’000)
Superannuation(1)
(A$’000)Total
(A$’000)
Non-Executive DirectorsPeter Hay(2) 2015 582 – 19 601
2014 366 – 18 384Philip Aiken AM 2015 194 40 7 241
2014 182 40 18 240Vince Gauci 2015 182 40 19 241
2014 182 40 18 240Winifred Kamit 2015 182 40 19 241
2014 182 40 18 240Richard Knight(3) 2015 182 55 19 256
2014 182 65 18 265Rick Lee AM 2015 182 65 19 266
2014 182 65 18 265Tim Poole 2015 182 45 20 247
2014 182 45 18 245John Spark 2015 182 50 19 251
2014 182 60 18 260
Former Non-Executive DirectorDon Mercer(4) 2015 – – – –
2014 291 – 9 300
Total 2015 1,868 335 141 2,3442014 1,931 355 153 2,439
(1) Represents Company contributions to superannuation under the Superannuation Guarantee legislation (SGC) and insurance payments.(2) Peter Hay was appointed as a Non-Executive Director on 8 August 2013 and as Chairman of the Board on 1 January 2014.(3) Richard Knight resigned as a member of the Audit and Risk Committee on 11 February 2015. As a result, his committee fee for the year has been pro-rated.(4) Don Mercer retired as Chairman and as a NED on 31 December 2013.
8.8. Non-Executive Directors’ Shareholdings as at 30 June 2015
Non-Executive DirectorsOpening balance at
1 July 2014 Net other movements Closing balance at
30 June 2015(1)
Peter Hay 5,000 38,000 43,000Philip Aiken AM 7,769 10,000 17,769Vince Gauci 18,400 – 18,400Winifred Kamit 326 – 326Richard Knight 40,000 – 40,000Rick Lee AM 28,447 – 28,447John Spark 32,105 590 32,695Tim Poole 4,235 – 4,235
(1) Includes shareholdings of their closely related entities.

88 NEWCREST MINING ANNUAL REPORT 2015
Directors’ ReportREMUNERATION REPORT
9. OTHER TABLESThe table below details the cash and value of other benefits actually received by each Executive in the 2015 financial year. An explanation of the relevant remuneration items included in the tables is provided in the associated footnotes.
The Board believes that presenting information in this way provides shareholders with increased clarity and transparency. Unless otherwise noted, the remuneration component is calculated on the same basis as the statutory remuneration table in section 8.1. Some of the figures in the table below have not been prepared in accordance with the Australian Accounting Standards. Those figures have been indicated by an asterisk (*).
The figures provided in respect of ‘Rights Vested’ reflect the market value of the shares that have vested during the year.
See section 8.1 for the statutory remuneration table that has been prepared in accordance with Australian Accounting Standards.
Non-Statutory Executive Remuneration
30 June 2015
Salary
A$’000
Salary at RiskPaid*
(A) A$’000
Other Cash Benefits
A$’000
Super-annuation
A$’000
Shares Granted*
(B) A$’000
Rights Vested*
(C) A$’000
Total*
A$’000
Total(1)*
US$’000
ExecutivesSandeep Biswas 2,275 800 17 19 500 – 3,611 3,029Gerard Bond 900 531 – 19 – 55 1,505 1,262Craig Jones 751 527 – 19 – 9 1,306 1,095Francesca Lee 682 139 – 19 – – 840 705Colin Moorhead 783 604 – 19 – 32 1,438 1,206Jane Thomas 328 – 236 9 – – 573 481David Woodall 782 212 47 19 – – 1,060 889
6,501 2,813 300 123 500 96 10,333 8,667
(1) USD value for Non-Statutory Executive Remuneration determined on the basis of an AUD/USD exchange rate of 0.8388.
Notes to Non Statutory Executive Remuneration(A) Amounts paid under the STI Plan during the year ended 30 June 2015 relating to performance for the 2014 financial year. For Francesca
Lee, the STI payment was pro-rated for her period of employment in the 2014 financial year.
(B) An award of 54,990 fully paid ordinary shares (valued at A$500,000 based on the January 2014 VWAP) was made to Sandeep Biswas in November 2014 in accordance with the terms of his Executive Service Agreement as part compensation for amounts foregone in accepting a role with Newcrest.
(C) The rights vested represent the 2011 LTI Plan that vested during the year ended 30 June 2015, measured at the share price at the close of business on the vesting date.

NEWCREST MINING ANNUAL REPORT 2015 89
This report is signed in accordance with a resolution of the Directors.
Peter Hay Sandeep Biswas Chairman Managing Director and Chief Executive Officer
17 August 2015 Melbourne

90�NEWCREST MINING ANNUAL REPORT 2015
Auditor’s Independence Declaration
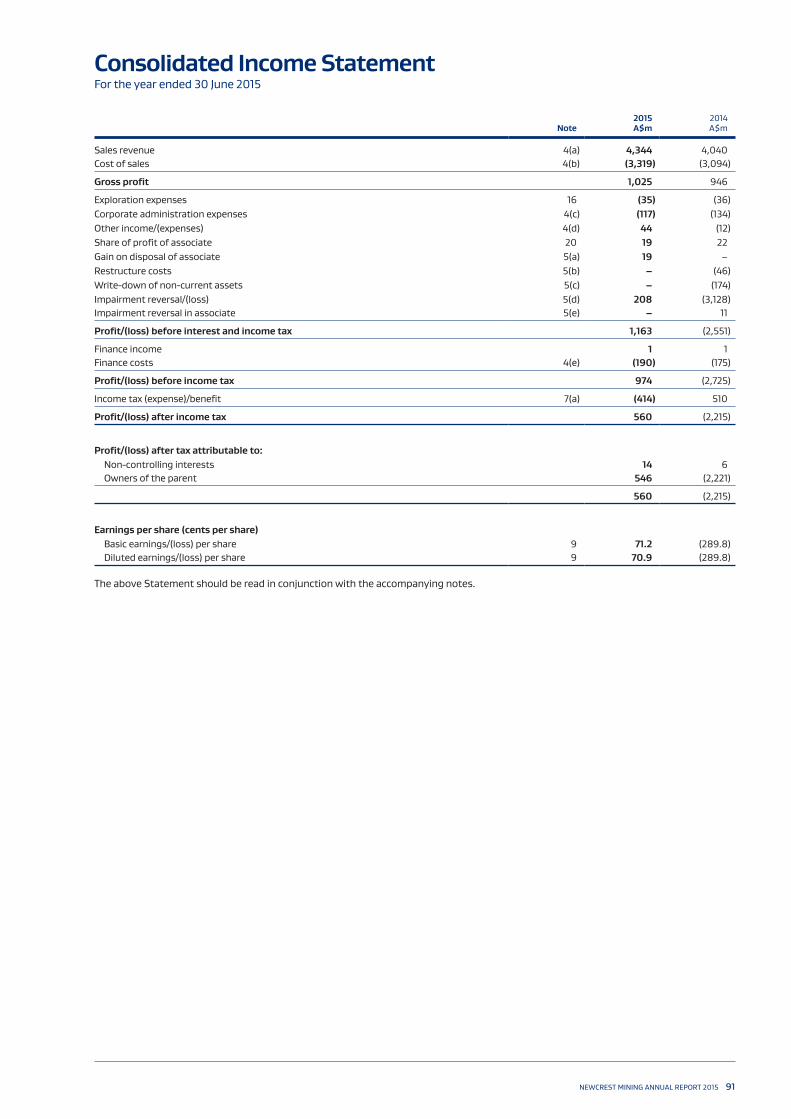
NEWCREST MINING ANNUAL REPORT 2015 91
Note2015 A$m
2014 A$m
Sales revenue 4(a) 4,344 4,040Cost of sales 4(b) (3,319) (3,094)
Gross profit 1,025 946
Exploration expenses 16 (35) (36)Corporate administration expenses 4(c) (117) (134)Other income/(expenses) 4(d) 44 (12)Share of profit of associate 20 19 22Gain on disposal of associate 5(a) 19 –Restructure costs 5(b) – (46)Write-down of non-current assets 5(c) – (174)Impairment reversal/(loss) 5(d) 208 (3,128)Impairment reversal in associate 5(e) – 11
Profit/(loss) before interest and income tax 1,163 (2,551)
Finance income 1 1Finance costs 4(e) (190) (175)
Profit/(loss) before income tax 974 (2,725)
Income tax (expense)/benefit 7(a) (414) 510
Profit/(loss) after income tax 560 (2,215)
Profit/(loss) after tax attributable to: Non-controlling interests 14 6 Owners of the parent 546 (2,221)
560 (2,215)
Earnings per share (cents per share) Basic earnings/(loss) per share 9 71.2 (289.8) Diluted earnings/(loss) per share 9 70.9 (289.8)
The above Statement should be read in conjunction with the accompanying notes.
Consolidated Income StatementFor the year ended 30 June 2015

92 NEWCREST MINING ANNUAL REPORT 2015
Consolidated Statement of Comprehensive IncomeFor the year ended 30 June 2015
Note2015 A$m
2014 A$m
Profit/(loss) after income tax 560 (2,215)
Other comprehensive income/(loss)Items that may be reclassified subsequently to the Income Statement
Cash flow hedgesForeign exchange gains on US dollar borrowings transferred to the Income Statement 26(c) (9) –Other cash flow hedges deferred in equity (2) 5Income tax expense/(benefit) 3 (1)
(8) 4
InvestmentsNet loss on available-for-sale financial assets transferred to the Income Statement – 1Net gain on available-for-sale financial assets deferred in equity 32 –Share of other comprehensive income of associate – 2
32 3
Foreign currency translationExchange differences on translation of foreign operations, net of hedges of foreign investments 793 (81)
793 (81)
Other comprehensive income/(loss) for the year, net of tax 817 (74)
Total comprehensive income/(loss) for the year 1,377 (2,289)
Total comprehensive income/(loss) attributable to: Non-controlling interests 39 3 Owners of the parent 1,338 (2,292)
1,377 (2,289)
The above Statement should be read in conjunction with the accompanying notes.
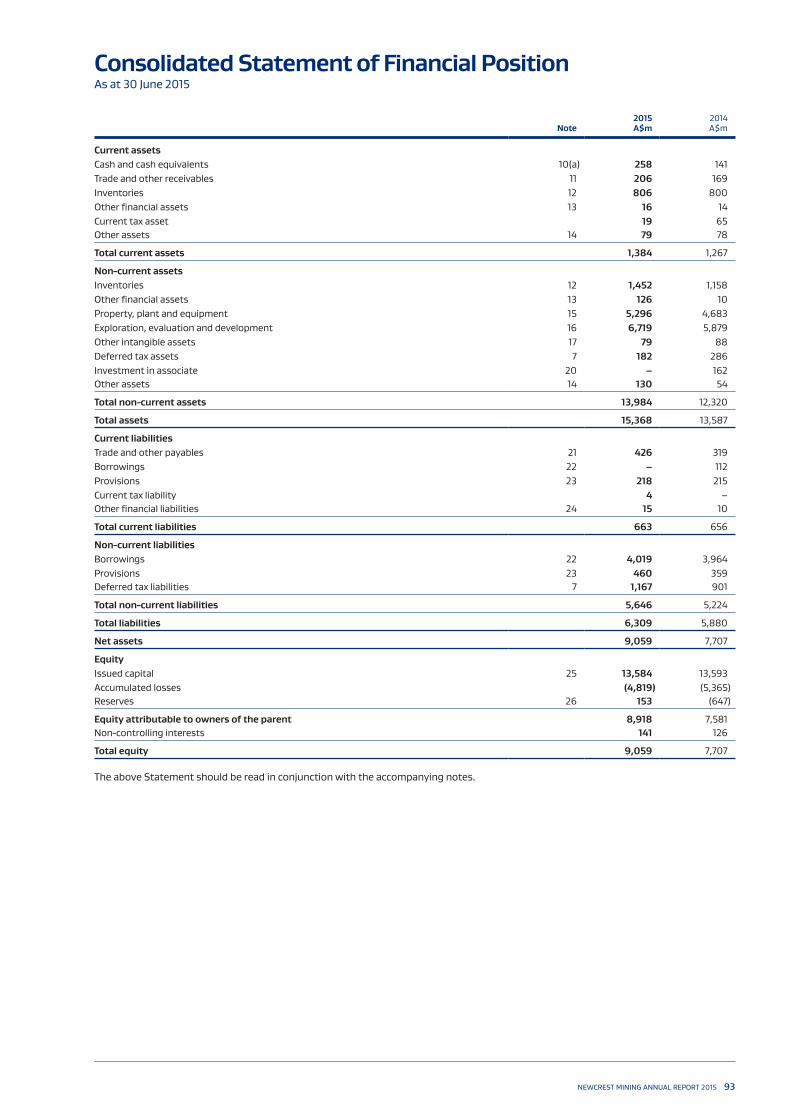
NEWCREST MINING ANNUAL REPORT 2015 93
Consolidated Statement of Financial PositionAs at 30 June 2015
Note2015 A$m
2014 A$m
Current assets Cash and cash equivalents 10(a) 258 141Trade and other receivables 11 206 169Inventories 12 806 800Other financial assets 13 16 14Current tax asset 19 65Other assets 14 79 78
Total current assets 1,384 1,267
Non-current assetsInventories 12 1,452 1,158Other financial assets 13 126 10Property, plant and equipment 15 5,296 4,683Exploration, evaluation and development 16 6,719 5,879Other intangible assets 17 79 88Deferred tax assets 7 182 286Investment in associate 20 – 162Other assets 14 130 54
Total non-current assets 13,984 12,320
Total assets 15,368 13,587
Current liabilitiesTrade and other payables 21 426 319Borrowings 22 – 112Provisions 23 218 215Current tax liability 4 –Other financial liabilities 24 15 10
Total current liabilities 663 656
Non-current liabilitiesBorrowings 22 4,019 3,964Provisions 23 460 359Deferred tax liabilities 7 1,167 901
Total non-current liabilities 5,646 5,224
Total liabilities 6,309 5,880
Net assets 9,059 7,707
EquityIssued capital 25 13,584 13,593Accumulated losses (4,819) (5,365)Reserves 26 153 (647)
Equity attributable to owners of the parent 8,918 7,581Non-controlling interests 141 126
Total equity 9,059 7,707
The above Statement should be read in conjunction with the accompanying notes.

94 NEWCREST MINING ANNUAL REPORT 2015
Note2015 A$m
2014 A$m
Cash flows from operating activities Receipts from customers 4,319 3,967Payments to suppliers and employees (2,532) (2,636)Interest received 1 1Interest paid (174) (162)Income taxes paid (30) (138)Dividends received 5 5
Net cash provided by operating activities 10(b) 1,589 1,037
Cash flows from investing activitiesPayments for property, plant and equipment (221) (205)Production stripping expenditure (73) (191)Mine under construction, development and feasibility expenditure (268) (439)Exploration and evaluation expenditure (46) (62)Information systems development (2) (8)Interest capitalised to development projects (6) (7)Proceeds from sell down of investment in associate 105 –Proceeds from non-participation in rights issue 6 –Proceeds from sale of plant and equipment 2 8
Net cash used in investing activities (503) (904)
Cash flows from financing activitiesProceeds from borrowings:
– US dollar bilateral bank debt 1,339 2,038Repayment of borrowings:
– US dollar bilateral bank debt (2,159) (2,076) – US dollar private placement notes (133) –
Repayment of finance lease principal – (1)Payment for treasury shares (9) (6)Dividends paid:
– Non-controlling interests (24) (16)
Net cash used in financing activities (986) (61)
Net increase in cash and cash equivalents 100 72
Cash and cash equivalents at the beginning of the year 141 69Effects of exchange rate changes on cash held 17 –
Cash and cash equivalents at the end of the year 10(a) 258 141
The above Statement should be read in conjunction with the accompanying notes.
Consolidated Statement of Cash FlowsFor the year ended 30 June 2015

NEWCREST MINING ANNUAL REPORT 2015 95
Consolidated Statement of Changes in EquityFor the year ended 30 June 2015
Attributable to Owners of the Parent
2015
Issued Capital
A$m
FXTranslation
Reserve(1)
A$m
HedgeReserve(1)
A$m
Equity Settlements
Reserve(1)
A$m
Fair ValueReserve(1)
A$m
Accu-mulated
Losses A$m
Total A$m
Non-controlling
Interests A$m
Total A$m
Balance at 1 July 2014 13,593 (735) 17 71 – (5,365) 7,581 126 7,707
Profit for the year – – – – – 546 546 14 560Other comprehensive income for the year – 768 (8) – 32 – 792 25 817
Total comprehensive income for the year – 768 (8) – 32 546 1,338 39 1,377
Transactions with owners in their capacity as ownersShare-based payments – – – 8 – – 8 – 8Share buy-back (9) – – – – – (9) – (9)Dividends paid – – – – – – – (24) (24)
Balance at 30 June 2015 13,584 33 9 79 32 (4,819) 8,918 141 9,059
The above Statement should be read in conjunction with the accompanying notes.(1) Refer Note 26 for description of reserves.
Attributable to Owners of the Parent
2014
Issued Capital
A$m
FXTranslation
Reserve(1)
A$m
HedgeReserve(1)
A$m
Equity Settlements
Reserve(1)
A$m
Fair ValueReserve(1)
A$m
Accu-mulated
Losses A$m
Total A$m
Non-controlling
Interests A$m
Total A$m
Balance at 1 July 2013 13,592 (657) 13 62 (3) (3,144) 9,863 139 10,002
Loss for the year – – – – – (2,221) (2,221) 6 (2,215)Other comprehensive loss for the year – (78) 4 – 3 – (71) (3) (74)
Total comprehensive loss for the year – (78) 4 – 3 (2,221) (2,292) 3 (2,289)
Transactions with owners in their capacity as ownersShare-based payments – – – 9 – – 9 – 9Treasury shares 1 – – – – – 1 – 1Dividends paid – – – – – – – (16) (16)
Balance at 30 June 2014 13,593 (735) 17 71 – (5,365) 7,581 126 7,707
The above Statement should be read in conjunction with the accompanying notes.(1) Refer Note 26 for description of reserves.

96 NEWCREST MINING ANNUAL REPORT 2015
1. CORPORATE INFORMATIONNewcrest Mining Limited is a company limited by shares, domiciled and incorporated in Australia whose shares are publicly traded on the Australian Securities Exchange (ASX) and the Port Moresby Stock Exchange (PoMSOX). The registered office of Newcrest Mining Limited is Level 9, 600 St Kilda Road, Melbourne, Victoria, 3004, Australia.
The nature of operations and principal activities of Newcrest Mining Limited and its controlled entities are exploration, mine development, mine operations and the sale of gold and gold/copper concentrate.
The financial report of Newcrest Mining Limited for the year ended 30 June 2015 was authorised for issue in accordance with a resolution of the Directors on 17 August 2015.
2. SUMMARY OF SIGNIFICANT ACCOUNTING POLICIESThe significant accounting policies adopted in the preparation of this financial report are:
(a) Basis of Preparation and Statement of ComplianceThe financial report is a general purpose financial report, prepared by a for-profit entity, in accordance with the requirements of the Corporations Act 2001, Australian Accounting Standards and other authoritative pronouncements of the Australian Accounting Standards Board (AASB). The financial report has been prepared on a historical cost basis, except for derivative financial instruments and available-for-sale assets which have been measured at fair value.
The financial report also complies with International Financial Reporting Standards (IFRS) including interpretations as issued by the International Accounting Standards Board.
The financial report has been presented in Australian dollars and all values are rounded to the nearest $1,000,000 unless otherwise stated.
The accounting policies have been consistently applied by all entities included in the Group and are consistent with those applied in the prior year, except as disclosed in Note 2(ae).
(b) Basis of ConsolidationThe consolidated financial statements include the financial statements of the parent entity, Newcrest Mining Limited, and its controlled entities (referred to as ‘the Consolidated Entity’ or ‘the Group’ in these financial statements). A list of significant controlled entities is presented in Note 34.
Control is achieved when the Group is exposed, or has the rights, to variable returns from its involvement with the investee and has the ability to affect those returns through its power over the investee. Specifically, the Group controls an investee if and only if the Group has:
– Power over the investee; – Exposure, or rights, to variable returns from its involvement with the investee; and – The ability to use its power over the investee to affect its returns.
When the Group has less than a majority of the voting or similar rights of an investee, the Group considers all relevant facts and circumstances in assessing whether it has power over the investee, including:
– The contractual arrangement with the other vote holders of the investee; – Rights arising from other contractual arrangements; – The Group’s voting rights and potential voting rights.
The Group re-assesses whether or not it controls an investee if facts and circumstances indicate that there are changes to one or more of the three elements of control.
Controlled entities are consolidated from the date on which control commences until the date that control ceases. All intercompany balances and transactions, including unrealised gains and losses arising from intra-group transactions, have been eliminated in preparing the consolidated financial statements.
Non-controlling interest in the results and equity of the entities that are controlled by the Group is shown separately in the Income Statement, Statement of Comprehensive Income, Statement of Financial Position and Statement of Changes in Equity respectively.
A change in the ownership interest of a subsidiary that does not result in a loss of control, is accounted for as an equity transaction.
(c) Interest in Joint OperationsA joint operation is a joint arrangement whereby the parties that have joint control of the arrangement have rights to the assets, and obligations for the liabilities, relating to the arrangement. Joint control is the contractually agreed sharing of control of an arrangement, which exists only when decisions about the relevant activities require unanimous consent of the parties sharing control.
When a Group entity undertakes its activities under joint operations, the Group as a joint operator recognises in relation to its interest in a joint operation, its:
– assets, including its share of any assets held jointly; – liabilities, including its share of any liabilities incurred jointly; – revenue from the sale of its share of the output arising from the joint operation; – share of the revenue from the sale of the output by the joint operation; and – expenses, including its share of any expenses incurred jointly.
The Group accounts for the assets, liabilities, revenues and expenses relating to its interest in a joint operation in accordance with the standards applicable to the particular assets, liabilities, revenues and expenses.
When a Group entity transacts with a joint operation in which a group entity is a joint operator (such as a sale or contribution of assets), the Group is considered to be conducting the transaction with the other parties to the joint operation, and gains and losses resulting from the transactions are recognised in the Group’s consolidated financial statements only to the extent of other parties’ interests in the joint operation.
When a Group entity transacts with a joint operation in which a group entity is a joint operator (such as a purchase of assets), the Group does not recognise its share of the gains and losses until it resells those assets to a third party.
Details of the Group’s interests in joint operations are shown in Note 37.
(d) Investment in AssociatesAn associate is an entity that is neither a subsidiary nor joint arrangement, over which the Group has significant influence. Significant influence is the power to participate in the financial and operating policy decisions of the investee, but is not control or joint control over those policies.
Significant influence is presumed to exist where the Group has a holding of 20 per cent of more of the voting power in the investee, unless it can be clearly demonstrated that this is not the case. Conversely a holding of less than 20 per cent is presumed not to give rise to significant influence, unless it can be clearly demonstrated that there is in fact significant influence.
The Group’s investment in an associate is accounted for using the equity method. Under the equity method, the investment in the associate is carried on the Statement of Financial Position at cost plus post acquisition changes in the Group’s share of net assets of the associate.
Notes to the Consolidated Financial StatementsFor the year ended 30 June 2015

NEWCREST MINING ANNUAL REPORT 2015 97
The Income Statement reflects the Group’s share of the results of operations of the associate. When there has been a change recognised directly in the equity of the associate, the Group recognises its share of any changes and discloses this, when applicable, in the Statement of Changes in Equity. Unrealised gains and losses resulting from transactions between the Group and the associate are eliminated to the extent of the interest in the associate.
The Group’s share of profit of an associate is included in the Income Statement. This is the profit attributable to equity holders of the associate and, therefore, is profit after tax and non-controlling interests in the subsidiaries of the associate.
After application of the equity method, the Group determines whether it is necessary to recognise an additional impairment loss on its investment in its associate. The Group determines at each reporting date whether there is any objective evidence that the investment in the associate is impaired, or if a previously recognised impairment should be reversed. If this is the case, the Group calculates the amount of impairment (or reversal) as the difference between the recoverable amount of the associate and its carrying value and recognises the amount in the Income Statement.
Upon loss of significant influence over the associate, the Group measures and recognises any retained investment at its fair value. Any difference between the carrying amount of the associate upon loss of significant influence and the fair value of the retained investment and proceeds from disposal is recognised in profit or loss.
(e) Foreign CurrencyFunctional and Presentation CurrencyBoth the functional and presentation currency of Newcrest Mining Limited and its Australian controlled entities is Australian dollars ($ or A$). Each entity in the Group determines its own functional currency and items included in the financial statements of each entity are measured using that functional currency. The functional currency of the Group’s foreign operations is US dollars (US$).
Transactions and BalancesTransactions in foreign currencies are initially recorded in the functional currency at the exchange rates ruling at the date of the transaction. The subsequent payment or receipt of funds related to a transaction is translated at the rate applicable on the date of payment or receipt. Monetary assets and liabilities denominated in foreign currencies are retranslated at the rate of exchange ruling at the reporting date. Non-monetary items that are measured in terms of historical cost in a foreign currency are translated using the exchange rate as at the date of the initial transaction.
All exchange differences in the consolidated financial statements are taken to the Income Statement with the exception of differences on certain US dollar denominated borrowings where the foreign currency components are designated as either cash flow hedges of future US dollar denominated sales or hedges of a net investment in a foreign operation. These are recognised in other comprehensive income and accumulated in a reserve until the forecast sales used to repay the debt occur (for cash flow hedges) or the foreign operation is disposed (for net investment hedges), at which time they are recognised in the Income Statement.
Translation of Foreign OperationsThe assets and liabilities of controlled entities incorporated overseas with functional currencies other than Australian dollars are translated into the presentation currency of Newcrest Mining Limited (Australian dollars) at the rates of exchange ruling at the reporting date and the Income Statements are translated at the weighted average exchange rates for the period. Exchange differences arising on translation are recognised in other comprehensive income and accumulated in the foreign currency translation reserve.
On consolidation, exchange differences arising from the translation of net investments in foreign operations and of the borrowings designated as hedges of the net investment are taken to the foreign currency translation reserve (refer Note 2(w)). On disposal of a foreign operation, the component of other comprehensive income relating to that particular foreign operation is recognised in the Income Statement.
(f) Cash and Cash EquivalentsCash and cash equivalents in the Statement of Financial Position comprise cash at bank and in hand and short-term deposits.
For the purpose of the Statement of Cash Flows, cash and cash equivalents consist of cash and cash equivalents as defined above, net of outstanding bank overdrafts.
(g) Trade and Other ReceivablesTrade receivables comprising Metal in Concentrate receivables and Bullion Awaiting Settlement are initially recorded at the fair value of contracted sale proceeds expected to be received only when there has been a passing of significant risks and rewards of ownership to the customer. Collectability of debtors is reviewed on an ongoing basis. Receivables which are known to be uncollectible are written off and an allowance for doubtful debts is raised where objective evidence exists that the debt will not be collected.
Other receivables are initially measured at fair value then subsequently at amortised cost, less an allowance for impairment.
(h) InventoriesGold in solution form, ore and work in progress is physically measured or estimated and valued at the lower of cost and net realisable value. Cost represents the weighted average cost and includes direct costs and an appropriate portion of fixed and variable production overhead expenditure, including depreciation and amortisation, incurred in converting materials into finished goods.
Materials and supplies are valued at the lower of cost and net realisable value. Any allowance for obsolescence is determined by reference to specific stock items identified. A regular and ongoing review is undertaken to establish the extent of surplus items and an allowance is made for any potential loss on their disposal.
Net realisable value is the estimated selling price in the ordinary course of business, less estimated costs of completion and estimated costs necessary to make the sale.
Ore stockpiles which are not scheduled to be processed in the twelve months after the reporting date are classified as non-current inventory. The Group believes the processing of these stockpiles will have a future economic benefit to the Group and accordingly values these stockpiles at the lower of cost and net realisable value.

98 NEWCREST MINING ANNUAL REPORT 2015
Notes to the Consolidated Financial StatementsFor the year ended 30 June 2015
2. SUMMARY OF SIGNIFICANT ACCOUNTING POLICIES (continued)
(i) Production Stripping ExpenditureAs part of its mining operations, the Group incurs stripping (waste removal) costs both during the development phase and production phase of its operations.
Stripping costs incurred during the production phase are generally considered to create two benefits, being either the production of inventory in the period or improved access to the ore to be mined in the future. Where the benefits are realised in the form of inventory produced in the period, the production stripping costs are accounted for as part of the cost of producing those inventories. Where production stripping costs are incurred and the benefit is improved access to the ore to be mined in the future, the costs are recognised as a non-current asset, referred to as a ‘production stripping asset’, if the following criteria are met;
– Future economic benefits (being improved access to the ore body) associated with the stripping activity are probable; – The component of the ore body for which access has been improved can be accurately identified; and – The costs associated with the stripping activity associated with that component can be reliably measured.
The amount of stripping costs deferred is based on the ratio obtained by dividing the amount of waste tonnes mined by the quantity of gold ounces contained in the ore for each component of the mine. Stripping costs incurred in the period are deferred to the extent that the actual current period waste to contained gold ounce ratio exceeds the life of component expected waste to contained gold ounce ratio (‘life of component’) ratio.
A component is defined as a specific volume of the ore body that is made more accessible by the stripping activity. An identified component of the ore body is typically a subset of the total ore body of the mine. It is considered that each mine may have several components, which are identified based on the mine plan. The mine plans and therefore the identification of specific components will vary between mines as a result of both the geological characteristics and location of the ore body. The financial considerations of the mining operations may also impact the identification and designation of a component.
The identification of components is necessary for both the measurement of costs at the initial recognition of the production stripping asset, and the subsequent depreciation of the production stripping asset.
The life of component ratio is a function of an individual mine’s design and therefore changes to that design will generally result in changes to the ratio. Changes in other technical or economic parameters that impact reserves will also have an impact on the life of component ratio even if they do not affect the mine’s design. Changes to the life of component ratio are accounted for prospectively from the date of change.
The production stripping asset is initially measured at cost, which is the accumulation of costs directly incurred to perform the stripping activity that improves access to the identified component of ore, plus an allocation of directly attributable overhead costs. If incidental operations are occurring at the same time as the production stripping activity, but are not necessary for the production stripping activity to continue as planned, these costs are not included in the cost of the stripping activity asset.
The production stripping asset is depreciated over the expected useful life of the identified component of the ore body that is made more accessible by the activity, on a units of production basis. Economically recoverable reserves are used to determine the expected useful life of the identified component of the ore body. The production stripping asset is then carried at cost less depreciation and any impairment losses.
The production stripping asset is included in ‘Exploration, Evaluation and Development’. These costs form part of the total investment in the relevant cash generating unit to which they relate, which is reviewed for impairment in accordance with the Group’s impairment accounting policy (refer Note 2 (q)).
(j) Property, Plant and EquipmentCostProperty, plant and equipment is carried at cost less accumulated depreciation and any accumulated impairment losses. Borrowing costs incurred directly in relation to major capital works are capitalised up to the time of commissioning the asset. Freehold land is held for extractive industry operations and its value is wholly dependent upon those operations. These assets form part of the total investment in the relevant cash generating unit to which they relate, which is reviewed for impairment in accordance with the Group’s impairment accounting policy (refer Note 2 (q)).
Depreciation and AmortisationItems of property, plant and equipment, including buildings but excluding freehold land, are depreciated over their estimated useful lives.
The Group uses the unit-of-production basis when depreciating mine specific assets which results in a depreciation/amortisation charge proportional to the depletion of the anticipated remaining life of mine production. Each item’s economic life has due regard to both its physical life limitations and to present assessments of economically recoverable reserves of the mine property at which it is located.
For the remainder of assets the straight line method is used, resulting in estimated useful lives between 3–20 years, the duration of which reflects the useful life depending on the nature of the asset. Estimates of remaining useful lives and depreciation methods are reviewed annually for all major items of plant and equipment. Any changes are accounted for prospectively.
Major spares purchased specifically for particular plant are capitalised and depreciated on the same basis as the plant to which they relate. Assets are depreciated or amortised from the date they are installed and are ready for use, or in respect of internally constructed assets, from the time the asset is completed and deemed ready for use.
When an asset is surplus to requirements or no longer has an economic value, the carrying amount of the asset is reviewed and is written down to its recoverable amount or derecognised.
The cost of improvements to leasehold properties is amortised over the unexpired period of the lease or the estimated useful life of the improvement, whichever is the shorter.
LeasesThe determination of whether an arrangement is or contains a lease is based on the substance of the arrangement and requires an assessment of whether the fulfilment of the arrangement is dependent on the use of a specific asset or assets and the arrangement conveys a right to use the asset.
Leases of plant and equipment under which the Group assumes substantially all the risks and benefits incidental to ownership are classified as finance leases. Other leases are classified as operating leases.
Finance leases are capitalised, with a lease asset and a lease liability equal to the fair value of the leased asset or, if lower, at the present value of the minimum lease payments determined at the inception of the lease. Lease payments are apportioned between the finance charges and reduction of the lease liability. The finance charge component within the lease payments is expensed. Capitalised leased assets are depreciated over the shorter of the estimated useful life of the asset and the lease term if there is no reasonable certainty that the Group will obtain ownership by the end of the lease term.
Payments made under operating leases are expensed on a straight-line basis over the lease term, except where an alternative basis is more representative of the pattern of benefits to be derived from the leased property.

NEWCREST MINING ANNUAL REPORT 2015 99
(k) Exploration, Evaluation and Feasibility ExpenditureExploration and EvaluationExploration and evaluation expenditure related to areas of interest is capitalised and carried forward to the extent that:
– Rights to tenure of the area of interest are current; and – (a) Costs are expected to be recouped through successful
development and exploitation of the area of interest or alternatively by sale; or
(b) Where activities in the area of interest have not yet reached a stage which permits a reasonable assessment of the existence or otherwise of economically recoverable reserves, and active and significant operations in, or in relation to, the area of interest are continuing.
Such expenditure consists of an accumulation of acquisition costs and direct exploration and evaluation costs incurred by or on behalf of the Group, together with an appropriate portion of directly related overhead expenditure.
Deferred FeasibilityFeasibility expenditure represents costs related to the preparation and completion of a feasibility study to enable a development decision to be made in relation to an area of interest and are capitalised as incurred.
At the commencement of construction, all past exploration, evaluation and feasibility expenditure in respect of an area of interest that has been capitalised is transferred to mines under construction. When the mine has been commissioned, it is transferred to mine development where it is amortised over the life of the area of interest to which it relates to, on a unit-of-production basis.
When an area of interest is abandoned or the Directors decide it is not commercial, any accumulated costs in respect of that area are written off in the year the decision is made. Each area of interest is reviewed at the end of each reporting period and accumulated costs written off to the extent they are not expected to be recoverable in the future.
(l) Mine Construction and DevelopmentMines Under ConstructionExpenditure incurred in constructing a mine by, or on behalf of, the Group is accumulated separately for each area of interest in which economically recoverable reserves have been identified. This expenditure includes net direct costs of construction, borrowing costs capitalised during construction and an appropriate allocation of attributable overheads. Once a development decision has been taken, all aggregated costs of construction are transferred to non-current assets as mine development or buildings, plant and equipment as appropriate.
Mine DevelopmentMine development represents expenditure in respect of exploration, evaluation, feasibility and development incurred by or on behalf of the Group, including overburden removal and construction costs, previously accumulated and carried forward in relation to areas of interest in which mining has now commenced. Such expenditure comprises net direct costs and an appropriate allocation of directly related overhead expenditure.
All expenditure incurred prior to commencement of production from each development property is carried forward to the extent to which recoupment out of future revenue from the sale of production, or from the sale of the property, is probable.
When further development expenditure is incurred in respect of a mine property after commencement of production, such expenditure is carried forward as part of the cost of the mine property only when future economic benefits are probable, otherwise the expenditure is classified as part of the cost of production and expensed as incurred. Such capitalised development expenditure is added to the total carrying value of mine development being amortised.
Depreciation and AmortisationAmortisation of costs is provided using the unit-of-production method over the economically recoverable reserves to which the asset relates.
These assets form part of the total investment in the relevant Cash Generating Unit to which they relate, which is reviewed for impairment in accordance with the Group’s impairment accounting policy (refer Note 2 (q)).
(m) Mineral RightsMineral rights comprise identifiable exploration and evaluation assets, mineral resources and ore reserves, which are acquired as part of a business combination or a joint arrangement acquisition and are recognised at fair value at date of acquisition. Mineral rights are attributable to specific areas of interest and are classified within Exploration, Evaluation and Development.
Mineral rights attributable to each area of interest are amortised when commercial production commences on a unit-of-production basis over the estimated economic reserve of the mine to which the rights relate. These assets form part of the total investment in the relevant cash generating unit to which they relate, which is reviewed for impairment in accordance with the Group’s impairment accounting policy (refer Note 2 (q)).
(n) GoodwillGoodwill acquired in a business combination is initially measured at cost being the excess of the consideration transferred over the fair value of the Group’s net identifiable assets acquired and liabilities assumed. If this consideration transferred is lower than the fair value of the net identifiable assets of the subsidiary acquired, the difference is recognised in profit or loss.
After initial recognition, goodwill is measured at cost less any accumulated impairment losses.
For the purpose of impairment testing, goodwill acquired in a business combination is, from the acquisition date, allocated to each of the Group’s Cash-Generating Units (CGU), or groups of CGUs, that are expected to benefit from the synergies of the combination, irrespective of whether other assets or liabilities of the Group are assigned to those units or groups of units. Each unit or group of units to which the goodwill is allocated represents the lowest level within the entity at which the goodwill is monitored for internal management purposes, and is not larger than an operating segment determined in accordance with AASB 8 Operating Segments.
The Group assesses goodwill half-yearly to determine whether there is an indication of impairment. Where an indicator of impairment exists, a formal estimate of the recoverable amount is made. In addition, regardless of the existence of indicators of impairment, goodwill is tested for impairment at least annually.
Impairment is determined by assessing the recoverable amount of the CGU (group of CGUs), to which the goodwill relates. The recoverable amount is the higher of the CGUs:
– Fair value less costs of disposal; and – Value in use. In assessing value in use, the estimated future cash flows are discounted to their present value using a pre-tax discount rate that reflects current market assessments of the time value of money and the risks specific to the CGU.
When the recoverable amount of the CGU (group of CGUs) is less than the carrying amount, an impairment loss is recognised. When goodwill forms part of a CGU (group of CGUs) and an operation within that unit is disposed of, the goodwill associated with the operation disposed of is included in the carrying amount of the operation when determining the gain or loss on disposal of the operation. Goodwill disposed of in this manner is measured based on the relative values of the operation disposed of and the portion of the CGU retained.
Impairment losses recognised for goodwill are not subsequently reversed.

100 NEWCREST MINING ANNUAL REPORT 2015
Notes to the Consolidated Financial StatementsFor the year ended 30 June 2015
2. SUMMARY OF SIGNIFICANT ACCOUNTING POLICIES (continued)
(o) Other Intangible AssetsCosts incurred in developing information technology systems and acquiring software are capitalised as intangible assets. Costs capitalised include external costs of materials and services and the cost of employee benefits. Amortisation is calculated on a straight line basis over the useful life, ranging from three to seven years.
(p) Available-for-Sale Financial AssetsThe Group’s investment in listed equity securities are classified as available-for-sale financial assets. Subsequent to initial recognition, available-for-sale financial assets are measured at fair value with gains or losses being recognised as a separate component of equity until the investment is derecognised or until the investment is determined to be impaired, at which time the cumulative gain or loss previously reported in equity is recognised in the Income Statement.
The fair values of equity securities are determined by reference to quoted market price.
(q) Impairment of Non-Financial AssetsThe carrying amounts of all non-financial assets (excluding goodwill) are reviewed half-yearly to determine whether there is an indication of impairment. Where an indicator of impairment exists, a formal estimate of the recoverable amount is made. Recoverable amount is the higher of fair value less costs of disposal and value in use.
If the carrying amount of an asset exceeds its estimated recoverable amount, the asset is written down to its recoverable amount and an impairment loss is recognised in the Income Statement. Individual assets are grouped for impairment purposes at the lowest level for which there are separately identifiable cash inflows that are largely independent of the cash inflows from other assets or groups of assets (CGUs). Generally, this results in the Group evaluating its CGUs on an individual mine basis.
Non-current assets other than goodwill that have recognised impairment are tested for possible reversal of the impairment whenever events or changes in circumstances indicate that the impairment may have been reversed.
(r) Non-Current Assets and Disposal Groups Held for SaleNon-current assets and disposal groups are classified as held for sale and measured at the lower of their carrying amount and fair value less costs to sell if their carrying amount will be recovered principally through a sale transaction instead of use. They are not depreciated or amortised. For an asset or disposal group to be classified as held for sale, it must be available for immediate sale in its present condition and its sale must be highly probable.
An impairment loss is recognised for any initial or subsequent write-down of the asset (or disposal group) to fair value less costs to sell. A gain is recognised for any subsequent increases in fair value less costs to sell of an asset (or disposal group), but not in excess of any cumulative impairment loss previously recognised. A gain or loss not previously recognised by the date of the sale of the non-current asset (or disposal group) is recognised at the date of derecognition.
(s) Trade and Other PayablesLiabilities for trade and other payables are initially recorded at the fair value of the consideration to be paid in the future for goods and services received, whether or not billed to the Group, and then subsequently at amortised cost.
(t) Borrowings and Borrowing CostsBorrowings are initially recognised at fair value and subsequently at amortised cost.
Borrowing costs directly attributable to the acquisition, construction or production of qualifying assets, which are assets that necessarily take a substantial period of time to get ready for their intended use, are added to the cost of those assets, until such time as the assets are substantially ready for their intended use. The capitalisation rate used to determine the amount of borrowing costs to be capitalised is the weighted average interest rate applicable to the Group’s outstanding borrowings during the year used to develop the qualifying asset.
All other borrowing costs are recognised as expenses in the period in which they are incurred.
(u) Employee BenefitsShort-Term BenefitsLiabilities arising in respect of wages and salaries, salary at risk, annual leave and any other employee benefits expected to be settled within twelve months of the reporting date are measured at their nominal amounts based on remuneration rates which are expected to be paid when the liabilities are settled. These amounts are recognised in ‘Trade and Other Payables’ (for amounts other than annual leave and salary at risk) and ‘Current Provisions’ (for annual leave and salary at risk) in respect of employees’ services up to the reporting date. Costs incurred in relation to non-accumulating sick leave are recognised when leave is taken and are measured at the rates paid or payable.
Long-Term BenefitsThe liability for long service leave and other long term benefits is measured at the present value of the estimated future cash outflows to be made by the Group resulting from employees’ services provided up to the reporting date.
Long-term benefits not expected to be settled within twelve months are discounted using the rates attaching to high quality corporate bonds at the reporting date, which most closely match the terms of maturity of the related liability. In determining the liability for these long term employee benefits, consideration has been given to expected future increases in wage and salary rates, the Group’s experience with staff departures and periods of service. Related on-costs are also included in the liability.
Defined Contribution Superannuation PlanContributions to defined contribution superannuation plans are expensed when incurred.
Share-Based PaymentsThe Group provides benefits to employees (including Executive Directors) in the form of share based compensation, whereby employees render services in exchange for shares or rights over shares (equity-settled transactions).
The cost of these equity-settled transactions with employees is measured by reference to the fair value of the equity instruments at the date at which they are granted. The fair value is determined using an option pricing model, further details of which are given in Note 27.
The fair value of the rights granted is adjusted to reflect market vesting conditions, but excludes the impact of non-market vesting conditions, such as performance conditions. Non-market conditions are included in the assumptions about the number of rights that are expected to become exercisable. At each reporting date the Group revises its estimate of the number of rights that are expected to become exercisable. The cumulative expense recognised for equity-settled transactions at each reporting date until vesting date reflects the extent to which the vesting period has expired and the Group’s best estimate of the number of equity instruments that will ultimately vest. The Income Statement charge or credit for a period represents the movement in cumulative expense recognised at the beginning and end of that period. The cost of equity-settled transactions is recognised, together with a corresponding increase in equity, over the period in which the performance and/or service conditions are fulfilled, ending on the date on which the relevant employees become fully entitled to the award (vesting period).
Upon the exercise of rights, the balance of the equity settlements reserve relating to those rights remains in the Equity Settlements Reserve and the proceeds received, net of any directly attributable transaction costs, are credited to Share Capital.

NEWCREST MINING ANNUAL REPORT 2015 101
(v) ProvisionsProvisions are recognised when the Group has a present obligation (legal or constructive) as a result of a past event, it is probable that an outflow of resources embodying economic benefits will be required to settle the obligation and a reliable estimate can be made of the amount of the obligation.
Provision for RehabilitationThe Group records the present value of the estimated cost of legal and constructive obligations (such as those under the Group’s Environmental Policy) to rehabilitate locations where activities have occurred which have led to a future obligation to make good. The nature of rehabilitation activities includes dismantling and removing structures, rehabilitating mines, dismantling operating facilities, closure of plant and waste sites and restoration, reclamation and revegetation of affected areas.
Typically the obligation arises when the asset is installed or the ground/environment is disturbed at the production location. When the liability is initially recorded, the present value of the estimated cost is capitalised by increasing the carrying amount of the related mining assets. Over time, the discounted liability is increased for the change in the present value based on a discount rate that reflects current market assessments. Additional disturbances or changes in rehabilitation costs will be recognised as additions or changes to the corresponding asset and rehabilitation liability when incurred.
The unwinding of the effect of discounting the provision is recorded as a finance cost in the Income Statement. The carrying amount capitalised as a part of mining assets is depreciated/amortised over the life of the related asset.
Costs incurred that relate to an existing condition caused by past operations but do not have a future economic benefit are expensed as incurred.
(w) Derivative Financial Instruments and HedgingThe Group uses derivative financial instruments to manage certain market risks. The instruments used by the Group include forward sale contracts, diesel forward contracts and foreign currency forward contracts.
Derivatives are initially recognised at fair value on the date a derivative contract is entered into and are subsequently remeasured to their fair value at each reporting date. The resulting gain or loss is recognised in the Income Statement immediately unless the derivative is designated and effective as a hedging instrument, in which event, the timing of recognition in the Income Statement depends on the nature of the hedge relationship.
The fair value of forward sale contracts, diesel forward contracts and foreign currency forward contracts are calculated by reference to current forward commodity prices.
At the inception of the transaction, the Group formally designates and documents the relationship between hedging instruments and hedged items, as well as its risk management objective and strategy for undertaking various hedge transactions. The Group also documents its assessment, both at hedge inception and on an ongoing basis, of whether the derivatives that are used in hedging transactions have been and will continue to be highly effective in offsetting changes in fair values or cash flows of hedged items.
For the purposes of hedge accounting, hedges are classified as: – Fair value hedges, when they hedge the exposure to changes in the fair value of a recognised asset or liability; – Cash flow hedges, when they hedge exposure to variability in cash flows that are either attributable to a particular risk associated with a recognised asset or liability or a highly probable forecast transaction; or – Hedges of a net investment in a foreign operation.
Cash Flow HedgesThe effective portion of changes in the fair value of derivatives that are designated and qualify as cash flow hedges are recognised in other Comprehensive Income through the Hedge Reserve. The gain or loss relating to the ineffective portion is recognised immediately in the Income Statement. Amounts accumulated in the Hedge Reserve in equity are transferred to the Income Statement in the periods when the hedged item affects the Income Statement, for instance when the forecast sale that is hedged takes place.
Hedge accounting is discontinued when the hedging instrument expires or is sold, terminated or exercised, or no longer qualifies for hedge accounting. At that point in time, any cumulative gain or loss on the hedging instrument recognised via other comprehensive income remains deferred in the Hedge Reserve until the original forecasted transaction occurs. When the forecasted transaction is no longer expected to occur, the cumulative gain or loss that was deferred in the Hedge Reserve is recognised immediately in the Income Statement.
If a hedging instrument being used to hedge a commitment for the purchase or sale of gold or copper is redesignated as a hedge of another specific commitment and the original transaction is still expected to occur, the gains and losses that arise on the hedging instrument prior to its redesignation are deferred and included in the measurement of the original purchase or sale when it takes place. If the hedging instrument is redesignated as a hedge of another commitment because the original purchase or sale transaction is no longer expected to occur, the gains and losses that arise on the hedge prior to its redesignation are recognised in the Income Statement at the date of the redesignation.
(x) Issued CapitalIssued ordinary share capital is classified as equity and is recognised at the fair value of the consideration received by the Group. Any transaction costs arising on the issue of ordinary shares and the associated tax are recognised directly in equity as a reduction of the share proceeds received.
Treasury SharesThe Group’s own equity instruments, which are reacquired on market for later use in employee share-based payment arrangements (treasury shares), are deducted from equity. No gain or loss is recognised in profit or loss on the purchase, sale, issue or cancellation of the Group’s own equity instruments.
(y) Revenue RecognitionRevenue from the sale of goods is recognised when there has been a transfer of risks and rewards to the customer and no further processing is required by the Group, the quality and quantity of the goods has been determined with reasonable accuracy, the price is fixed or determinable, and collectability is probable. The point at which risk and title passes for the majority of the Group’s commodity sales is upon receipt of the bill of lading when the commodity is delivered for shipment. Revenue is measured at the fair value of the consideration received or receivable.
Gold and Silver Bullion SalesRevenue from gold and silver bullion sales is brought to account when the significant risks and rewards of ownership have transferred to the buyer and selling prices are known or can be reasonably estimated.

102 NEWCREST MINING ANNUAL REPORT 2015
Notes to the Consolidated Financial StatementsFor the year ended 30 June 2015
2. SUMMARY OF SIGNIFICANT ACCOUNTING POLICIES (continued)
(y) Revenue Recognition (continued)Gold, Copper and Silver in Concentrate SalesThe terms of metal in concentrate sales contracts with third parties contain provisional pricing arrangements whereby the selling price for metal in concentrate is based on prevailing spot prices on a specified future date after shipment to the customer (quotation period). Adjustments to the sales price occur based on movements in quoted market prices up to the date of final settlement The period between provisional invoicing and final settlement is typically between one and six months.
The provisionally priced sales of metal in concentrate contain an embedded derivative that is required to be separated from the host contract for accounting purposes. Accordingly the embedded derivative, which does not qualify for hedge accounting, is recognised at fair value, with subsequent changes in fair value recognised in the Income Statement each period until final settlement, and presented as ‘Other Income/Expense’. Changes in fair value over the quotation period and up until final settlement are estimated by reference to forward market prices.
Interest RevenueInterest revenue is recognised as it accrues using the effective interest rate method.
(z) Earnings Per Share (EPS)Basic EPS is calculated as net profit attributable to members, adjusted to exclude costs of servicing equity (other than dividends) and preference share dividends, divided by the weighted average number of ordinary shares, adjusted for any bonus element.
Diluted EPS is calculated as net profit attributable to members, adjusted for:
– costs of servicing equity (other than dividends) and preference share dividends; – the after tax effect of dividends and interest associated with dilutive potential ordinary shares that have been recognised as expenses; – other non-discretionary changes in revenues or expenses during the period that would result from the dilution of potential ordinary shares;
divided by the weighted average number of ordinary shares and dilutive potential ordinary shares, adjusted for any bonus element.
(aa) Government RoyaltiesRoyalties under existing royalty regimes are payable on sales and are therefore recognised in cost of sales as the sale occurs.
(ab) Income TaxesCurrent Income TaxCurrent tax assets and liabilities for the current and prior year are measured at the amount expected to be recovered from or paid to the taxation authorities based on the current year’s taxable income. The tax rates and tax laws used to compute the amount are those that are enacted or substantively enacted by the reporting date.
Deferred Income TaxDeferred income tax is provided on all temporary differences (except as noted below) at the reporting date between the tax bases of assets and liabilities and their carrying amounts for financial reporting purposes.
Deferred tax assets and liabilities are not recognised if the temporary differences giving rise to them:
– Arise from the initial recognition of an asset or liability in a transaction that is not a business combination and that, at the time of the transaction, affects neither the accounting profit nor taxable profit or loss. – Are associated with investments in subsidiaries, associates or interests in joint ventures, and the timing of the reversal of the temporary difference can be controlled and it is probable that the temporary difference will not reverse in the foreseeable future.
Deferred tax assets are recognised for deductible temporary differences, carry-forward of unused tax credits and unused tax losses to the extent that it is probable that taxable profit will be available against which the deductible temporary differences and the carry-forward of unused tax credits and unused tax losses can be utilised.
The carrying amount of deferred tax assets is reviewed at each reporting date and reduced to the extent that it is no longer probable that sufficient taxable profit will be available to allow all or part of the deferred income tax asset to be utilised. Unrecognised deferred tax assets are reassessed at each reporting date and are recognised to the extent that it has become probable that future taxable profit will allow the deferred tax asset to be recovered.
Deferred tax assets and liabilities are measured at the tax rates that are expected to apply to the year when the asset is realised or the liability is settled, based on tax rates (and tax laws) that have been enacted or substantively enacted at the reporting date.
Current and deferred taxes attributable to amounts recognised directly in equity are also recognised directly in equity.
(ac) Goods and Services Tax (GST)Revenues, expenses and assets are recognised net of the amount of GST except:
– where the GST incurred on a purchase of goods and services is not recoverable from the taxation authority, in which case the GST is recognised as part of the cost of acquisition of the asset or as part of the expense item as applicable; and – receivables and payables are stated with the amount of GST included.
The net amount of GST recoverable from, or payable to, the taxation authority is included as part of receivables or payables in the Statement of Financial Position.
Cash flows are included in the Statement of Cash Flows on a gross basis and the GST component of cash flows arising from investing and financing activities, which is recoverable from, or payable to, the taxation authority is classified as part of operating cash flows.
Commitments and contingencies are disclosed net of the amount of GST recoverable from, or payable to, the taxation authority.
(ad) Business CombinationsBusiness combinations are accounted for using the acquisition method. The consideration transferred in a business combination is measured at fair value, which is calculated as the sum of the acquisition date fair values of the:
– assets transferred by the Group; – liabilities incurred by the acquirer to former owners of the acquiree; – equity issued by the Group;
and the amount of any non-controlling interest in the acquiree. For each business combination, the Group measures the non-controlling interest in the acquiree either at fair value or at the proportionate share of the acquiree’s identifiable net assets.
Acquisition-related costs are expensed as incurred.
When the Group acquires a business, it assesses the financial assets acquired and liabilities assumed for appropriate classification and designation in accordance with the contractual terms, economic conditions, the Group’s operating or accounting policies and other pertinent conditions as at the acquisition date. This includes the separation of embedded derivatives in host contracts of the acquiree.
If the business combination is achieved in stages, the acquisition date fair value of the acquirer’s previously held equity interest in the acquiree is remeasured at fair value as at the acquisition date through profit or loss.
Any contingent consideration to be transferred by the Group will be recognised at fair value at the acquisition date. Subsequent changes to the fair value of the contingent consideration which is deemed to be an asset or liability will be recognised in accordance with AASB 139 Financial Instruments: Recognition and Measurement either in profit or loss or in other comprehensive income. If the contingent consideration is classified as equity, it is not remeasured.

NEWCREST MINING ANNUAL REPORT 2015 103
(ae) New Accounting Standards and Interpretations Adoption of New Standards and InterpretationsThe Group has adopted the following new and revised accounting standards, amendments and interpretations as of 1 July 2014:
– AASB 132 – Financial Instruments Presentation – Offsetting Financial Assets and Liabilities – AASB 136 – Impairment of Assets – Recoverable Amount Disclosures for Non-Financial Assets – Interpretation 21 – Levies
The adoption of these new and revised standards did not have a material impact on the Group’s financial statements.
New Accounting Standards and Interpretations Issued But Not Yet Effective and Not Yet AdoptedThe following standards, amendments to standards and interpretations have been identified as those which may impact the Group in the period of initial application. They have been issued but are not yet effective and are available for early adoption at 30 June 2015, but have not been applied in preparing this financial report.
Reference & Title Details of New Standard/Amendment/Interpretation Impact on GroupApplication Date for the Group
AASB 15 Revenue from contracts with customers
AASB 15 establishes principles for reporting the nature, amount, timing and uncertainty of revenue and cash flows arising from an entity’s contracts with customers.
(i) (ii)
1 July 2017
AASB 9 Financial Instruments
AASB 2010-7 and AASB 2012-6
Amendments to AAS’s arising from AASB 9
The revised AASB 9 will eventually replace AASB 139 and all previous versions of AASB 9. The revised standard includes changes to the:
– classification and measurement of financial assets and financial liabilities; – impairment model; – hedge accounting.
Financial assets are measured at amortised cost, fair value through profit or loss, or fair value through other comprehensive income, based on both the entity’s business model for managing the financial assets and the financial asset’s contractual cash flow characteristics.
Apart from the ‘own credit risk’ requirements, classification and measurement of financial liabilities is unchanged from existing requirements.
(i) 1 July 2018
(i) The Group has not yet determined the extent of the impact, if any.(ii) The International Accounting Standards Board (IASB) has confirmed a deferral of the effective date of IFRS 15 (the international equivalent of AASB 15) from
1 January 2017 to 1 January 2018. The amendment to give effect to this is expected to be issued in the 2016 financial year. At this time, it is expected that the AASB is also likely to defer the effective date of AASB 15 which will mean that the application date of this standard for the Group will move from 1 July 2017 to 1 July 2018.
Apart from the above, other accounting standards, amendments and interpretations that have been issued and will be applicable in future periods have been considered, however their impact is not considered material to the Group.

104 NEWCREST MINING ANNUAL REPORT 2015
Notes to the Consolidated Financial StatementsFor the year ended 30 June 2015
3. CRITICAL ACCOUNTING JUDGEMENTS, ESTIMATES AND ASSUMPTIONSJudgements, estimates and assumptions are continually evaluated and are based on historical experience and other factors, including expectations of future events that are believed to be reasonable under the circumstances. The Group makes assumptions concerning the future. All judgements, estimates and assumptions made are believed to be reasonable based on the most current set of circumstances available to management. The resulting accounting estimates will, by definition, seldom equal the related actual results. The judgements, estimates and assumptions that have a significant risk of causing a material adjustment to the carrying amounts of assets and liabilities within the next financial year are discussed below.
(a) Mine Rehabilitation ProvisionThe Group assesses its mine rehabilitation provision annually in accordance with the accounting policy Note 2(v). Significant estimates and assumptions are required in determining the provision for mine rehabilitation as there are many transactions and other factors that will affect the ultimate liability payable to rehabilitate the mine sites. Factors that will affect this liability include future disturbances caused by further development, changes in technology, changes in regulations, price increases, changes in timing of cash flows which are based on life of mine plans and changes in discount rates. When these factors change or become known in the future, such differences will impact the mine rehabilitation provision in the period in which they change or become known.
(b) Unit-of-Production Method of Depreciation/AmortisationThe Group uses the unit-of-production basis when depreciating/amortising specific assets which results in a depreciation/amortisation charge proportional to the depletion of the anticipated remaining life of mine production. Each item’s economic life, which is assessed annually, has due regard to both its physical life limitations and to present assessments of economically recoverable reserves of the mine property at which it is located. These calculations require the use of estimates and assumptions.
(c) Impairment of AssetsThe Group assesses each Cash-Generating Unit (CGU), half-yearly to determine whether there is any indication of impairment or reversal. Where an indicator of impairment or reversal exists, a formal estimate of the recoverable amount is made, which is deemed as being the higher of the fair value less costs of disposal and value in use calculated in accordance with accounting policy Note 2(q). These assessments require the use of estimates and assumptions such as discount rates, exchange rates, commodity prices, gold multiple values, future operating development and sustaining capital requirements and operating performance (including the magnitude and timing of related cash flows). Refer Note 19.
(d) Production StrippingThe Group defers mining costs incurred during the production stage of its operations which are calculated in accordance with accounting policy Note 2(i). Changes in an individual mine’s design will generally result in changes to the life of component waste to contained gold ounce (life of component) ratio. Changes in other technical or economic parameters that impact reserves will also have an impact on the life of component ratio even if they do not affect the mine’s design. Changes to deferred mining resulting from a change in life of component ratios are accounted for prospectively.
(e) Ore Reserve EstimatesThe Group estimates its ore reserves and mineral resources annually in December each year, and reports in the following February, based on information compiled by Competent Persons as defined in accordance with the Australasian code for reporting Exploration Results, Mineral Resources and Ore Resources (JORC code 2012). The estimated quantities of economically recoverable reserves are based upon interpretations of geological models and require assumptions to be made regarding factors such as estimates of short and long-term exchange rates, estimates of short and long-term commodity prices, future capital requirements and future operating performance. Changes in reported reserves estimates can impact the carrying value of property, plant and equipment, mine development, production stripping assets, provision for rehabilitation obligations, the recognition of deferred tax assets, as well as the amount of depreciation and amortisation charged to the Income Statement.
(f) Capitalisation of Exploration and Evaluation CostsThe Group’s accounting policy for exploration and evaluation expenditure is set out in Note 2(k). The application of this policy requires management to apply judgement to determine whether future economic benefits are likely, from either exploitation or sale, or whether activities have not reached a stage that permits a reasonable assessment of the existence of reserves. In addition to these adjustments, the Group has to make certain estimates and assumptions. The determination of a JORC resource is itself an estimation process that involves varying degrees of uncertainty depending on how the resources are classified (i.e. measured, indicated or inferred). The estimates directly impact when the Group capitalises exploration and evaluation expenditure. The capitalisation policy requires management to make certain estimates and assumptions as to future events and circumstances, in particular, the assessment of whether economic quantities of reserves will be found. Any such estimates and assumptions may change as new information becomes available.
(g) Recovery of Deferred Tax AssetsDeferred tax assets, including those arising from un-utilised tax losses, require management to assess the likelihood that the Group will comply with the relevant tax legislation and will generate sufficient taxable earnings in future periods in order to recognise and utilise those deferred tax assets. Estimates of future taxable income are based on forecast cash flows from operations and existing tax laws in each jurisdiction. These assessments require the use of estimates and assumptions such as exchange rates, commodity prices and operating performance over the life of the assets. To the extent that cash flows and taxable income differ significantly from estimates, the ability of the Group to realise the net deferred tax assets reported at the reporting date could be impacted.
Additionally, future changes in tax laws in the jurisdictions in which the Group operates could limit the ability of the Group to obtain tax deductions in future periods.
(h) Share-Based PaymentsThe Group measures the cost of equity settled transactions with employees by reference to the fair value of equity instruments at the date at which they are granted. The fair value is determined by an external valuer using an option pricing model, using the assumptions detailed in Note 27.

NEWCREST MINING ANNUAL REPORT 2015 105
4. REVENUE AND EXPENSES 2015 A$m
2014 A$m
Specific itemsProfit before income tax includes the following revenues, income and expenses whose disclosure is relevant in explaining the performance of the Group:
(a) Sales RevenueGold 3,555 3,359Copper 744 629Silver 45 52
Total sales revenue 4,344 4,040
Total revenue 4,344 4,040
(b) Cost of SalesSite production costs 2,257 1,972Royalty 124 113Concentrate treatment and realisation 205 173Inventory movements 26 137
2,612 2,395Write-down of inventory (Note 5(f)) 44 35Depreciation 663 664
Total cost of sales 3,319 3,094
(c) Corporate Administration ExpensesCorporate costs 79 96Corporate depreciation 30 29Equity settled share-based payments 8 9
Total corporate administration expenses 117 134
(d) Other Income/(Expenses)Net foreign exchange gain/(loss) 62 (11)Net fair value gain/(loss) on gold and copper derivatives (6) 10Legacy community contractual settlements and negotiation costs (5) (10)Other (7) (1)
Total other income/(expenses) 44 (12)
(e) Finance CostsInterest Costs: Interest on loans 157 154Other: Facility fees and other costs 27 18 Discount unwind on provisions 12 10
196 182Less: Capitalised borrowing costs (6) (7)
Total finance costs 190 175
(f) Depreciation and AmortisationProperty, plant and equipment 368 388Mine development and production stripping 370 339Intangible assets 25 24
763 751Less: Capitalised to inventory on hand or assets under construction (70) (58)
Total depreciation and amortisation expense 693 693
Included in:Cost of sales depreciation 663 664Corporate depreciation 30 29
Total depreciation and amortisation expense 693 693
(g) Employee Benefits ExpenseDefined contribution plan expense 42 45Equity settled share-based payments 8 9Redundancy expense 8 26Salaries, wages and other employment benefits 491 531
Total employee benefits expense 549 611

106 NEWCREST MINING ANNUAL REPORT 2015
Notes to the Consolidated Financial StatementsFor the year ended 30 June 2015
5. SIGNIFICANT ITEMS
Items by NatureGross A$m
Tax A$m
Net A$m
(a) Gain on Disposal of Associate2015Consideration received 105 – 105Carrying value of equity accounted investment (176) – (176)Fair value of retained investment 90 – 90
Gain on disposal of associate(1) 19 – 19
(b) Restructure Costs2014(5)
Redundancy costs (26) 8 (18)Office closure and other costs (20) 4 (16)
Total restructure costs (46) 12 (34)
(c) Write-Down of Non-Current Assets2014Property, plant and equipment(6) (73) 22 (51)Exploration, evaluation and mine development(6) (101) 30 (71)Deferred tax asset in relation to research and development claims(7) – (120) (120)
Total write-down of non-current assets (174) (68) (242)
(d) Impairment Reversal/(Loss)2015(2)
Property, plant and equipment 94 (88) 6Exploration, evaluation and mine development 112 (73) 39Intangibles 2 (1) 1
Total impairment reversal/(loss) 208 (162) 46
2014(8)
Property, plant and equipment (884) 232 (652)Exploration, evaluation and mine development (1,815) 515 (1,300)Goodwill(9) (429) – (429)
Total impairment reversal/(loss) (3,128) 747 (2,381)
(e) Impairment Reversal of Associate 2014(10)
Investment in associate 11 – 11
Total impairment reversal of associate 11 – 11
(f) Write-Down of Inventory2015(3)
Write-down of inventory (44) – (44)
(44) – (44)
2014 Write-down of inventory (35) 11 (24)
(35) 11 (24)

NEWCREST MINING ANNUAL REPORT 2015 107
(g) Items by Segment
Impairment reversal/(loss)
A$m
Write-down of non-current
assets A$m
Write-down of inventory
A$m
Gain on disposal /(restructure
costs) A$m
Total A$m
2015Telfer(2) 538 – – – 538Hidden Valley(2)(3) (245) – (33) – (278)West Africa(2)(3)(4) (85) – (11) – (96)Corporate(1) – – – 19 19
Total items by segment 208 – (44) 19 183
Tax (162) – – – (162)
Total items by segment (after tax) 46 – (44) 19 21
Attributable to:Non-controlling interest(4) (10)Owners of the parent 31
21
2014Cadia Valley – (20) – (8) (28)Telfer (204) – – (1) (205)Gosowong – – – (1) (1)Lihir (2,647) (154) (35) (17) (2,853)Hidden Valley (79) – – – (79)West Africa(8) (198) – – – (198)Corporate(5)(10) 11 – – (19) (8)
Total items by segment (3,117) (174) (35) (46) (3,372)
Tax 747 52 11 12 822Research and development claims(7) – (120) – – (120)
Total items by segment (after tax) (2,370) (242) (24) (34) (2,670)
Attributable to:Non-controlling interest(11) (17)Owners of the parent (2,653)
(2,670)
Year Ended 30 June 2015(1) On 27 February 2015, the Group sold part of its interest in Evolution Mining Limited (‘Evolution’). Refer to Note 20 for further details. (2) The Group has recognised a net impairment reversal as a result of its annual impairment testing. This comprised of:
– An impairment reversal of A$538 million in relation to Telfer; – Impairment losses of A$330 million which relates to Hidden Valley (A$245 million) and West Africa (A$85 million).
Refer to Note 19 for further details.(3) The Group recognised a write-down of inventories arising from the Group’s revised metal price and exchange rate estimates. This write-down has been
recognised in the Income Statement as part of Cost of Sales.(4) A total of A$10 million is attributable to non-controlling interest in West Africa. Year Ended 30 June 2014(5) This represented the rationalisation of corporate and support functions and additional costs following the Brisbane office closure in June 2013 and other
restructuring costs.(6) As a result of the continued review and refinement of the operational plans, the Group recognised a write-down in assets that were surplus to the Group’s
requirements. Write-downs are not subject to reversals in subsequent periods.(7) As a result of a review of the Group’s material Australian deferred tax asset in relation to research and development claims, the Group voluntarily amended
its research and development claims in respect of the 2009 to 2011 financial years. As a result of this voluntary amendment, there was an increase to income tax expense of A$120 million in the 2014 financial year.
(8) The Group has recognised impairments of goodwill and other assets as a result of its annual impairment testing. These impairments have resulted from operating in a lower gold price environment and after taking into account recent operating cost performances. The Group has also recognised an impairment in respect of exploration assets in West Africa.
(9) Goodwill impairment of A$429 million in respect of Lihir.(10) As a result of the Group’s impairment review as at 30 June 2014, A$11 million of the previously recognised impairment charge was reversed.(11) A total of A$17 million is attributable to non-controlling interest in West Africa.

108 NEWCREST MINING ANNUAL REPORT 2015
Notes to the Consolidated Financial StatementsFor the year ended 30 June 2015
6. SEGMENT INFORMATIONThe Group’s operating segments are based on the internal management reports that are reviewed and used by the Group’s Executive Committee (the chief operating decision-maker) in assessing performance. The operating segments represent the Group’s operating mines and projects which are organised and managed according to their location.
The Group’s reportable operating segments are: – Cadia Valley, Australia – Telfer, Australia – Lihir, Papua New Guinea – Gosowong, Indonesia – Hidden Valley JV (50% interest), Papua New Guinea – West Africa (includes Bonikro operations and exploration and evaluation activities in Côte d’Ivoire) – Exploration and Other
Exploration and Other mainly comprises projects in the exploration, evaluation and feasibility phase and includes Wafi-Golpu and Morobe Exploration in PNG, Marsden and O’Callaghans in Australia and Namosi in Fiji.
(a) Segment Results, Segment Assets and Segment LiabilitiesThe measurement of segment results is in line with the basis of information presented to management for internal management reporting purposes. The performance of each segment is measured based on their Revenues, Costs, EBITDA and EBIT (Segment Result).
Segment Revenues represent gold, copper and silver sales at unhedged prices.
EBITDA is earnings before interest, tax, depreciation, amortisation and significant items. EBIT is earnings before interest, tax and significant items. The reconciliation of EBIT to profit/(loss) before tax is shown in Note 6(b).
Capital Expenditure comprises payments for property, plant and equipment, production stripping expenditure, mine under construction, development and feasibility expenditure and information systems development. The definition of this measure has changed from the prior year and accordingly comparative figures have been restated to align with this revision.
Segment assets exclude tax losses and intercompany receivables. Segment liabilities exclude intercompany payables.
Cadia Valley
A$mTelfer A$m
Lihir A$m
Gosowong A$m
Hidden Valley
A$m
West Africa
A$m
Total Operations
A$m
Exploration & Other
A$mCorporate(1)
A$m
Total Group
A$m
2015External sales revenue 1,538 956 1,020 499 161 170 4,344 – – 4,344
EBITDA 884 334 163 258 15 78 1,732 (35) (24) 1,673Depreciation and amortisation (232) (53) (192) (117) (32) (37) (663) – (30) (693)
EBIT (Segment result)(2) 652 281 (29) 141 (17) 41 1,069 (35) (54) 980
2014 External sales revenue 1,233 950 1,055 484 171 147 4,040 – – 4,040
EBITDA 665 303 353 259 28 37 1,645 (36) (95) 1,514Depreciation and amortisation (174) (75) (221) (110) (39) (45) (664) – (29) (693)
EBIT (Segment result)(2) 491 228 132 149 (11) (8) 981 (36) (124) 821
Capital Expenditure(3) for the year ended:30 June 2015 279 53 103 41 38 18 532 26 6 564
30 June 2014 375 76 251 58 27 12 799 31 13 843
(1) Includes investment in associates and eliminations.(2) Refer to Note 6(b) for the reconciliation of segment result to profit before tax.(3) Represents payments for property, plant and equipment, production stripping expenditure, mine under construction, development and feasibility
expenditure and information systems development.
Cadia Valley
A$mTelfer A$m
Lihir A$m
Gosowong A$m
Hidden Valley
A$m
West Africa
A$m
Total Operations
A$m
Exploration & Other
A$mCorporate(1)
A$m
Total Group
A$m
2015Segment assets(2) 4,564 1,158 7,559 738 92 260 14,371 671 326 15,368Segment liabilities 769 250 1,112 203 68 49 2,451 11 3,847 6,309
Net assets 3,795 908 6,447 535 24 211 11,920 660 (3,521) 9,059
2014 Segment assets(2) 4,484 743 6,319 594 325 298 12,763 526 298 13,587Segment liabilities 687 200 928 135 65 36 2,051 11 3,818 5,880
Net assets 3,797 543 5,391 459 260 262 10,712 515 (3,520) 7,707
(1) Includes investment in associates and eliminations.(2) Segment assets are net of write-downs and impairments.

NEWCREST MINING ANNUAL REPORT 2015 109
Note 2015 A$m
2014 A$m
(b) Reconciliation of EBIT (Segment Result) to Profit/(Loss) Before TaxSegment Result 6(a) 980 821
Finance costs: Finance income 1 1Finance costs (190) (175)
(189) (174)Significant items: Gain on disposal of associate 5(a) 19 –Restructure costs 5(b) – (46)Write-down of non-current assets 5(c) – (174)Impairment reversal/(loss) 5(d) 208 (3,128)Reversal of impairment of associate 5(e) – 11Write-down of inventory 5(f) (44) (35)
183 (3,372)
Profit/(loss) before tax 974 (2,725)
(c) Geographical Segments Sales Revenue from External Customers(1) Bullion Australia 2,239 2,238Concentrate Japan 998 893Korea 171 244China (including Hong Kong) 161 116Philippines 152 194Singapore 98 –India 116 –Europe(2) 409 302USA(2) – 53
Total sales revenue 4,344 4,040
(1) Revenue is attributable to geographic location based on the location of customers.(2) The majority of concentrate sales to customers in Europe and the USA are shipped to smelters in Japan, Korea and China.
Non-Current Assets(3) Australia 5,457 4,905Indonesia 430 351Papua New Guinea 7,643 6,254West Africa 148 213Other 124 311
Total non-current assets 13,802 12,034
(3) Non-current assets for this purpose excludes deferred tax assets.
(d) Major Customer InformationMajor customers to whom the Group provides goods that are more than 10% of external revenue are as follows:
Revenue % of external revenue2015 A$m
2014 A$m
2015 %
2014 %
Customer A(1) 2,167 2,044 50 51Customer B(2) 836 623 19 15
(1) Represents bullion sales by Cadia, Telfer, Lihir, Gosowong, Hidden Valley and West Africa.(2) Represents concentrate sales by Cadia and Telfer.

110 NEWCREST MINING ANNUAL REPORT 2015
Notes to the Consolidated Financial StatementsFor the year ended 30 June 2015
7. INCOME TAX2015 A$m
2014 A$m
(a) Reconciliation of Prima Facie Income Tax Expense to Income Tax Expense per the Income StatementAccounting profit/(loss) before tax 974 (2,725)
Income tax expense/(benefit) calculated at 30% (2014: 30%) 292 (818)Under/(over) provided in prior years(1) 21 3Other (6) (4)
15 (1)Adjustments on Significant items:Impairment – Goodwill – 128Impairment reversal – Associate – (3)Gain on disposal of associate (6) –Write-down and impairments – Other assets 113 64Research and development allowance voluntary amendment – 120
107 309
Income tax expense/(benefit) per the Income Statement 414 (510)
(1) This includes an adjustment of A$23 million which finalises the review of Australian Research and Development claims made during the 2005 to 2011 period (as disclosed in Note 33 ‘Contingent Liabilities’ in the 30 June 2014 financial report). After use of carry forward losses, a net tax payment of A$13 million was made in January 2015.
(b) Income Tax Expense Comprises:Current income taxCurrent income tax expense 153 19Under provision in respect of prior years – 120
153 139Deferred taxRelating to origination and reversal of temporary differences 240 (652)Under provision in respect of prior years 21 3
261 (649)
Income tax expense/(benefit) per the Income Statement 414 (510)
Opening Balance at 1 July
A$m
(Charged)/credited to
income A$m
(Charged)/credited to
equity A$m
Translation A$m
Closing Balance at 30 June
A$m
(c) Movement in Deferred Taxes2015Deferred tax assetsCarry forward revenue losses recognised:
– Australian entities 286 (104) – – 182
286 (104) – – 182
Deferred tax liabilitiesTemporary differences:
– Fixed assets(1) (929) (209) – (165) (1,303) – Provisions 73 (5) – 2 70 – Other (45) (47) 164 (6) 66
(901) (261) 164 (169) (1,167)
Net deferred taxes (615) (365) 164 (169) (985)
2014Deferred tax assetsCarry forward revenue losses recognised:
– Australian entities 326 (40) – – 286
326 (40) – – 286
Deferred tax liabilitiesTemporary differences:
– Fixed assets(1) (1,600) 648 – 23 (929) – Provisions 71 2 – – 73 – Other (46) (1) 1 1 (45)
(1,575) 649 1 24 (901)
Net deferred taxes (1,249) 609 1 24 (615)
(1) Comprises property, plant and equipment; exploration, evaluation and development; and other intangible assets.

NEWCREST MINING ANNUAL REPORT 2015 111
(d) Unrecognised Deferred Tax Assets Deferred tax assets have not been recognised in respect of:
– capital losses of A$117 million tax effected (2014: A$84 million tax effected) – revenue losses and temporary differences of A$393 million tax effected (2014: A$293 million tax effected)
because it is not probable that the Group will have sufficient future assessable income and/or capital gains available against which the deferred tax asset could be utilised. This is partly due to restrictions that limit the extent to which the losses can be applied to future taxable income in future periods.
(e) Tax ConsolidationThe Company and its wholly-owned Australian subsidiaries are part of a tax consolidated group. Newcrest Mining Limited is the head entity of the tax consolidated group. The tax losses attributable to the Australian entities are available for offsetting against future profits of the tax consolidated group. Some of these tax losses are subject to restrictions that limit the extent to which the losses can be applied against future taxable income. Notwithstanding these restrictions, these losses do not have an expiry date.
8. DIVIDENDS
(a) Dividend determined and paid2015 Financial YearNo dividends were determined or paid in 2015.
2014 Financial YearNo dividends were determined or paid in 2014.
(b) Dividend franking account balanceFranking credits at 30% as at 30 June 2015 available for the subsequent financial year is A$62 million (2014: A$70 million).
9. EARNINGS PER SHARE (EPS)2015
A¢2014
A¢
EPS (cents per share)Basic EPS 71.2 (289.8)Diluted EPS(2) 70.9 (289.8)
2015 A$m
2014 A$m
Earnings used in calculating EPSEarnings used in the calculation of basic and diluted EPS:
Profit/(loss) after income tax attributable to owners of the parent 546 (2,221)
2015 No. of shares
2014 No. of shares
Weighted average number of sharesShare data used in the calculation of basic and diluted EPS:
Weighted average number of ordinary shares used in calculating basic EPS 766,510,971 766,510,971Effect of dilutive securities: share rights(1)(2) 4,081,206 3,138,890
Adjusted weighted average number of ordinary shares used in calculating diluted EPS 770,592,177 769,649,861
(1) Rights granted to employees (including KMP) as described in Note 28 are considered to be potential ordinary shares and have been included in the determination of diluted earnings per share to the extent they are dilutive. These rights have not been included in the determination of basic earnings per share.
(2) In accordance with AASB 133 Earnings per Share, the effects of anti-dilutive potential have not been included when calculating diluted loss per share for the year ended 30 June 2014.
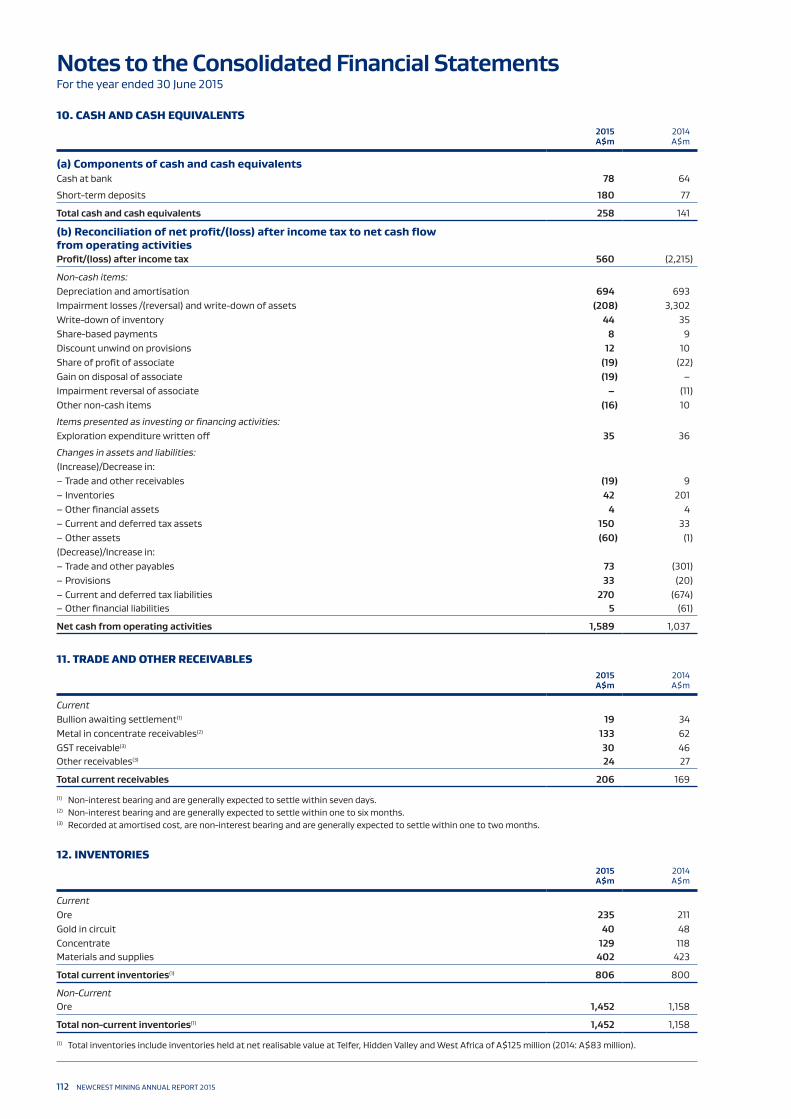
112 NEWCREST MINING ANNUAL REPORT 2015
Notes to the Consolidated Financial StatementsFor the year ended 30 June 2015
10. CASH AND CASH EQUIVALENTS2015 A$m
2014 A$m
(a) Components of cash and cash equivalentsCash at bank 78 64
Short-term deposits 180 77
Total cash and cash equivalents 258 141
(b) Reconciliation of net profit/(loss) after income tax to net cash flow from operating activitiesProfit/(loss) after income tax 560 (2,215)
Non-cash items:Depreciation and amortisation 694 693Impairment losses /(reversal) and write-down of assets (208) 3,302Write-down of inventory 44 35Share-based payments 8 9Discount unwind on provisions 12 10Share of profit of associate (19) (22)Gain on disposal of associate (19) –Impairment reversal of associate – (11)Other non-cash items (16) 10
Items presented as investing or financing activities:Exploration expenditure written off 35 36
Changes in assets and liabilities:(Increase)/Decrease in:
– Trade and other receivables (19) 9 – Inventories 42 201 – Other financial assets 4 4 – Current and deferred tax assets 150 33 – Other assets (60) (1)
(Decrease)/Increase in: – Trade and other payables 73 (301) – Provisions 33 (20) – Current and deferred tax liabilities 270 (674) – Other financial liabilities 5 (61)
Net cash from operating activities 1,589 1,037
11. TRADE AND OTHER RECEIVABLES2015 A$m
2014 A$m
CurrentBullion awaiting settlement(1) 19 34Metal in concentrate receivables(2) 133 62GST receivable(3) 30 46Other receivables(3) 24 27
Total current receivables 206 169
(1) Non-interest bearing and are generally expected to settle within seven days.(2) Non-interest bearing and are generally expected to settle within one to six months.(3) Recorded at amortised cost, are non-interest bearing and are generally expected to settle within one to two months.
12. INVENTORIES2015 A$m
2014 A$m
CurrentOre 235 211Gold in circuit 40 48Concentrate 129 118Materials and supplies 402 423
Total current inventories(1) 806 800
Non-CurrentOre 1,452 1,158
Total non-current inventories(1) 1,452 1,158
(1) Total inventories include inventories held at net realisable value at Telfer, Hidden Valley and West Africa of A$125 million (2014: A$83 million).

NEWCREST MINING ANNUAL REPORT 2015 113
13. OTHER FINANCIAL ASSETS2015 A$m
2014 A$m
CurrentCopper forward sales contracts 10 –Gold forward sales contracts 4 –Diesel/fuel forward sales contracts 2 4Quotational period derivatives(1) – 10
Total current other financial assets 16 14
Non-CurrentOther financial asset(2) 4 10Available-for-sale financial assets(3) 122 –
Total non-current other financial assets 126 10
(1) Represents the embedded derivatives relating to quotational period movements on commodity sales. Refer Note 2(y).(2) Represents the contingent consideration receivable on the partial sale of a subsidiary. (3) Represents the Group’s investment in Evolution, an Australian gold mining company listed on the ASX, which was previously an associate of the Group
and was equity accounted. The Group held 106,482,631 shares (10.7% interest) in Evolution at 30 June 2015. Refer Note 20 for more information. While the number of Newcrest’s shares remained unchanged from the date Evolution ceased being an associate to year end, additional shares were issued under a Rights Issue to other shareholders which Newcrest did not participate in and diluted Newcrest’s ownership interest from 14.9% to 10.7%.
14. OTHER ASSETS2015 A$m
2014 A$m
CurrentPrepayments and other 79 78
Total current other assets 79 78
Non-CurrentPrepayments and other 46 19Non-current tax assets(1) 84 35
Total non-current other assets 130 54
(1) Includes A$59 million (2014: A$8 million) in respect to PT NHM’s prior year tax assessments. Refer Note 33(d).
15. PROPERTY, PLANT AND EQUIPMENT2015 A$m
2014 A$m
At 30 JuneCost 10,652 9,291Accumulated depreciation and impairment (5,356) (4,608)
5,296 4,683
Year ended 30 JuneCarrying amount at 1 July 4,683 5,544Expenditure during the year 223 205Depreciation for the year (368) (388)Disposals and write-down of assets (7) (83)Foreign currency translation 611 (54)Reclassifications/transfers(1) 60 343Impairment losses for the year (Note 5) (199) (884)Impairment reversals for the year (Note 5) 293 –
Carrying amount at 30 June 5,296 4,683
(1) Represents reclassification/transfer from Exploration, Evaluation and Development upon commissioning of the asset.

114 NEWCREST MINING ANNUAL REPORT 2015
Notes to the Consolidated Financial StatementsFor the year ended 30 June 2015
16. CAPITALISED EXPLORATION, EVALUATION AND DEVELOPMENT EXPENDITURESExploration &
Evaluation Expenditure
A$m
Deferred Feasibility
Expenditure A$m
Mines Under Construction
A$m
Production Stripping
A$m
MineDevelopment(1)
A$mTotal A$m
At 30 June 2015Cost 973 341 54 991 10,726 13,085Accumulated depreciation and impairment (452) – – (741) (5,173) (6,366)
521 341 54 250 5,553 6,719
Year ended 30 June 2015Carrying amount at 1 July 2014 470 252 235 233 4,689 5,879Expenditure during the year(2) 46 32 242 73 71 464Expenditure written-off during the year (35) – – – – (35)Depreciation for the year – – – (101) (269) (370)Foreign currency translation 93 66 10 49 516 734Reclassifications/transfers(3) (15) (9) (433) – 392 (65)Impairment losses for the year (Note 5) (46) – – (34) (51) (131)Impairment reversals for the year (Note 5) 8 – – 30 205 243
Carrying amount at 30 June 2015 521 341 54 250 5,553 6,719
(1) Includes Mineral Rights with a carrying value of A$1,733 million.(2) Borrowing costs were capitalised on qualifying assets at a weighted average interest rate of 4%.(3) Expenditure included in mines under construction has been reclassified to mine development or property, plant and equipment upon commissioning
of the asset. Expenditure included in exploration and evaluation has been reclassified to mine development upon commencement of development and construction activities.
Exploration & Evaluation
Expenditure A$m
Deferred Feasibility
Expenditure A$m
Mines Under Construction
A$m
Production Stripping
A$m
MineDevelopment(1)
A$mTotal A$m
At 30 June 2014Cost 854 252 235 796 9,411 11,548Accumulated depreciation and impairment (384) – – (563) (4,722) (5,669)
470 252 235 233 4,689 5,879
Year ended 30 June 2014Carrying amount at 1 July 2013 673 323 218 297 6,352 7,863Expenditure during the year(2) 62 21 369 191 77 720Expenditure written-off during the year (36) – – – – (36)Depreciation for the year – – – (77) (262) (339)Disposals and write-down of assets – – – – (100) (100)Foreign currency translation (8) (5) (3) (9) (56) (81)Reclassifications/transfers(3) (61) (87) (349) – 164 (333)Impairment losses for the year (Note 5) (160) – – (169) (1,486) (1,815)
Carrying amount at 30 June 2014 470 252 235 233 4,689 5,879
(1) Includes Mineral Rights with a carrying value of A$1,442 million.(2) Borrowing costs were capitalised on qualifying assets at a weighted average interest rate of 3%.(3) Expenditure included in mines under construction has been reclassified to mine development or property, plant and equipment upon commissioning of the
asset. Expenditure included in exploration and evaluation has been reclassified to mine development upon commencement of development and construction activities.
2015 A$m
2014 A$m
Areas of Interest in the exploration phase at cost:Cadia Valley, NSW 4 3Telfer, WA 48 37Marsden, NSW 5 5Gosowong, Indonesia 10 12Namosi, Fiji 32 26Wafi-Golpu, PNG 232 189Morobe Province, PNG 12 7Lihir, PNG 158 128West Africa 20 63
521 470
Recoverability of the carrying amount of the exploration and evaluation assets is dependent upon the successful development and continuing commercial exploitation, or alternatively, sale of the respective area of interest.
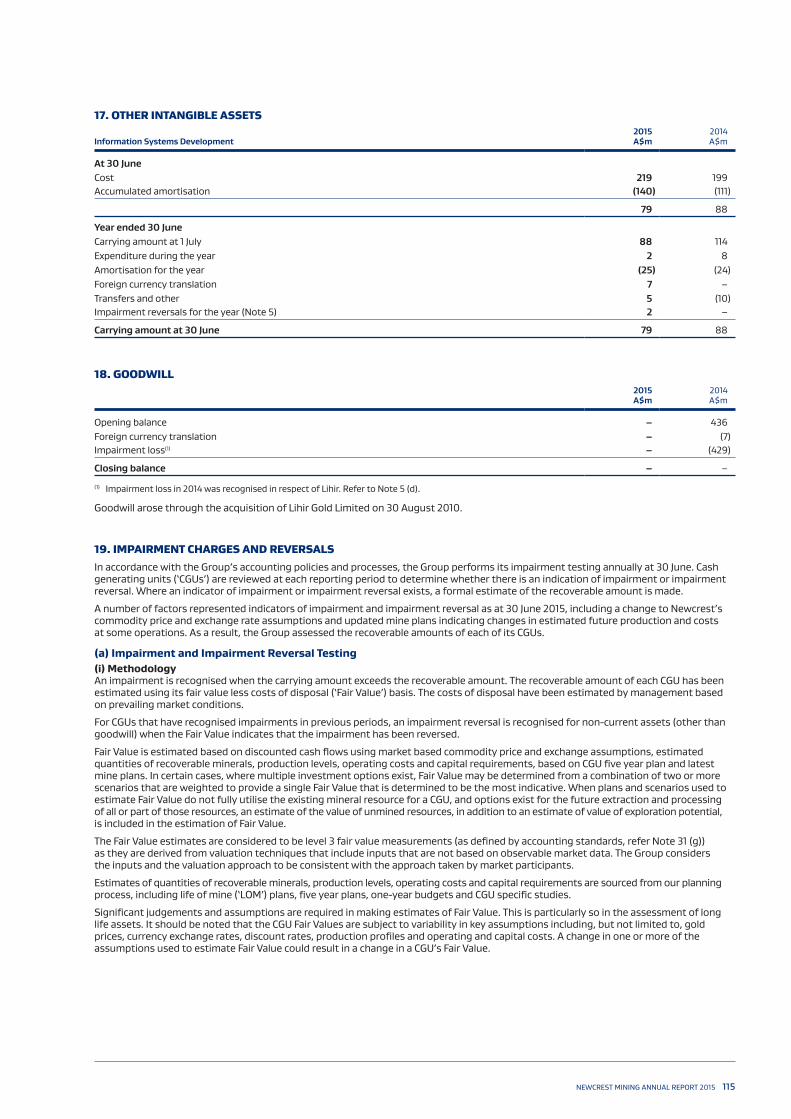
NEWCREST MINING ANNUAL REPORT 2015 115
17. OTHER INTANGIBLE ASSETS
Information Systems Development2015 A$m
2014 A$m
At 30 JuneCost 219 199Accumulated amortisation (140) (111)
79 88
Year ended 30 JuneCarrying amount at 1 July 88 114Expenditure during the year 2 8Amortisation for the year (25) (24)Foreign currency translation 7 –Transfers and other 5 (10)Impairment reversals for the year (Note 5) 2 –
Carrying amount at 30 June 79 88
18. GOODWILL2015 A$m
2014 A$m
Opening balance – 436Foreign currency translation – (7)Impairment loss(1) – (429)
Closing balance – –
(1) Impairment loss in 2014 was recognised in respect of Lihir. Refer to Note 5 (d).
Goodwill arose through the acquisition of Lihir Gold Limited on 30 August 2010.
19. IMPAIRMENT CHARGES AND REVERSALSIn accordance with the Group’s accounting policies and processes, the Group performs its impairment testing annually at 30 June. Cash generating units (‛CGUs’) are reviewed at each reporting period to determine whether there is an indication of impairment or impairment reversal. Where an indicator of impairment or impairment reversal exists, a formal estimate of the recoverable amount is made.
A number of factors represented indicators of impairment and impairment reversal as at 30 June 2015, including a change to Newcrest’s commodity price and exchange rate assumptions and updated mine plans indicating changes in estimated future production and costs at some operations. As a result, the Group assessed the recoverable amounts of each of its CGUs.
(a) Impairment and Impairment Reversal Testing(i) MethodologyAn impairment is recognised when the carrying amount exceeds the recoverable amount. The recoverable amount of each CGU has been estimated using its fair value less costs of disposal (‛Fair Value’) basis. The costs of disposal have been estimated by management based on prevailing market conditions.
For CGUs that have recognised impairments in previous periods, an impairment reversal is recognised for non-current assets (other than goodwill) when the Fair Value indicates that the impairment has been reversed.
Fair Value is estimated based on discounted cash flows using market based commodity price and exchange assumptions, estimated quantities of recoverable minerals, production levels, operating costs and capital requirements, based on CGU five year plan and latest mine plans. In certain cases, where multiple investment options exist, Fair Value may be determined from a combination of two or more scenarios that are weighted to provide a single Fair Value that is determined to be the most indicative. When plans and scenarios used to estimate Fair Value do not fully utilise the existing mineral resource for a CGU, and options exist for the future extraction and processing of all or part of those resources, an estimate of the value of unmined resources, in addition to an estimate of value of exploration potential, is included in the estimation of Fair Value.
The Fair Value estimates are considered to be level 3 fair value measurements (as defined by accounting standards, refer Note 31 (g)) as they are derived from valuation techniques that include inputs that are not based on observable market data. The Group considers the inputs and the valuation approach to be consistent with the approach taken by market participants.
Estimates of quantities of recoverable minerals, production levels, operating costs and capital requirements are sourced from our planning process, including life of mine (‛LOM’) plans, five year plans, one-year budgets and CGU specific studies.
Significant judgements and assumptions are required in making estimates of Fair Value. This is particularly so in the assessment of long life assets. It should be noted that the CGU Fair Values are subject to variability in key assumptions including, but not limited to, gold prices, currency exchange rates, discount rates, production profiles and operating and capital costs. A change in one or more of the assumptions used to estimate Fair Value could result in a change in a CGU’s Fair Value.

116 NEWCREST MINING ANNUAL REPORT 2015
Notes to the Consolidated Financial StatementsFor the year ended 30 June 2015
19. IMPAIRMENT CHARGES AND REVERSALS (continued)
(a) Impairment and Impairment Reversal Testing (continued)(ii) Key AssumptionsThe table below summarises the key assumptions used in the 2015 end of year carrying value assessments, and for comparison also provides the equivalent assumptions used in 2014:
2015 2014
Assumptions 2016 2017Long term
(2018+) 2015 – 2020Long term
(2021+)
Gold (US$ per ounce) $1,100 $1,200 $1,250 $1,300 $1,300
Copper (US$ per pound) $2.40 $2.70 $3.00 $3.00 $3.00
AUD:USD exchange rate $0.74 $0.77 $0.80
$0.93 declining to $0.85 $0.85
USD:PGK exchange rate $2.77 $2.80 $2.85
$2.42 increasing to $2.65 $2.65
Discount rate (%)USD Assets 5.25 to 5.75%
AUD Assets 5.5%USD Assets 5.25 to 5.75%
AUD Assets 5.5%
Commodity prices and exchange rates estimation approachCommodity price and foreign exchange rates are estimated with reference to external market forecasts and reviewed at least annually. The rates applied have regard to observable market data including spot and forward values, and to market analysis including bank analyst estimates.
Metal pricesNewcrest has reduced its US dollar gold price estimates for both the short term (2016 and 2017) and long-term (2018+) compared to 2014, reflecting a sustained reduction in the US dollar gold price during the 2015 calendar year and Newcrest’s analysis of observable market data for future periods.
The reduced gold price assumptions has primarily impacted the Fair Values of Newcrest’s non-Australian CGUs which all have a US dollar functional currency, contributing to the impairments recognised at 30 June 2015 at Hidden Valley and West Africa. The impact of the reduced gold price assumptions on the valuation of Lihir was offset by lower AUD:USD and USD:PGK rates (detailed further below). Newcrest’s Australian assets all have an Australian dollar functional currency, with the impact of the lower US dollar gold price estimates mitigated by lower AUD:USD exchange rate estimates (detailed further below).
AUD:USD exchange rateNewcrest has also reduced its AUD:USD exchange rate estimates for both the short term (2016 and 2017) and long-term (2018+) compared to 2014. This takes into account a sustained reduction in the value of the Australian dollar compared to the US dollar during the past twelve months.
This change had a positive impact on the Fair Value of Newcrest’s Australian assets as it resulted in higher Australian dollar gold prices and higher Australian dollar revenues, more than offsetting the reduction in US dollar gold price assumptions noted above. This change was a significant factor in the recognition of an impairment reversal at Telfer as at 30 June 2015.
The reduction in the AUD:USD exchange rate estimates also had a positive impact on other CGUs which have exposure to Australian dollars in the operating and capital cost base, including Lihir and Hidden Valley.
USD:PGK exchange rateChanges made in 2015 to the USD:PGK exchange rate estimates reflected the sustained weakening of the PNG Kina against the US dollar over the past 12 months. Lihir and Hidden Valley both have a material proportion of operating and capital costs denominated in PNG Kina, resulting in this change having a positive impact on the Fair Value of both CGUs.
Discount rateIn determining the Fair Value of CGUs, the future cash flows were discounted using rates based on the Group’s estimated real after tax weighted average cost of capital, pursuant to the Capital Asset Pricing Model, for each functional currency used in the Group, with an additional premium applied having regard to the geographic location of the CGU. The discount rates applied to individual CGUs that recognised impairments and/or impairment reversals were unchanged from the previous year as follows:CGU Functional Currency 2015 2014
Lihir USD 5.25% 5.25%Hidden Valley USD 5.25% 5.25%West Africa USD 5.75% 5.75%Telfer AUD 5.50% 5.50%

NEWCREST MINING ANNUAL REPORT 2015 117
Production activity and operating and capital costsLOM production activity and operating and capital cost assumptions are based on the Group’s latest budget, five year plan and/or longer term LOM plans. These projections include expected operating performance improvements reflecting the Group’s objectives to maximise free cash flow, optimise and reduce operational activity, apply technology, improve capital and labour productivity and remove high cost gold ounces from the production profile.
The LOM plan for Hidden Valley used in the 2015 impairment review reflects updated operating cost, capital cost and development timing assumptions. The operating and financial performance at Hidden Valley has remained disappointing. Key assumption changes in the calculation of the Fair Value of Hidden Valley estimated at 30 June 2015 include the removal or reduced scale of future developments and a reduction in the timing and extent of future estimated cost improvements.
Lihir’s LOM plan used in the estimation of Fair Value at June 2015 remained unchanged from the prior year and continued to include improving production and cost efficiency assumptions reflecting expectations of ongoing improvement initiatives. Lihir’s operating performance and free cash flow generation in the year ended June 2015, met or exceeded the Company’s expectations. The success of improvement initiatives during 2015, including the implementation of an enhanced operating strategy, together with further planned initiatives, provides support for the inclusion of improvements in the assumptions used in the calculation of Fair Value.
During the second half of the 2015 financial year, Newcrest progressed a review of the future operating options for Telfer, assessing several further development opportunities, particularly relating to further open pit cutbacks. Findings from this review, together with Telfer’s strong operating and financial performance during 2015, and improved market outlook for Telfer’s costs, have supported updated assumptions in the Telfer 2015 LOM plan relating to operating and capital costs, and optimisation of production levels and timing. In combination, these updated assumptions have resulted in an increase in Fair Value and an impairment reversal has been recognised.
Exploration values and unmined resourceExploration values have been estimated by the Group based on estimates of total mineral endowments by CGU. A per unit valuation of expected resource growth is applied on a CGU specific basis, determined by the expected realisable value of the estimated additional mineral inventory.
Unmined resources may not be included in a CGU’s particular LOM plan for a number of reasons, including the need to constantly re-assess the economic returns on and timing of specific production options in the current economic environment. The Group has estimated unmined resources values on a dollar margin per gold equivalent ounce basis individually for each CGU, taking into account a range of factors including the physical specifications of the ore, probability of conversion, estimated capital and operating costs, and length of mine life.
The value of exploration and unmined resources as a % of the assessed Fair Value in the current period and prior period for each CGU subject to impairment is as follows:
Lihir Telfer Hidden Valley West Africa
2015Exploration 8% 5% 0% 9%Unmined resource 1% 0% 0% 0%
2014Exploration 8% 13% 11% 22%Unmined resource 1% 0% 0% 3%
The reduction in the relative value contribution of exploration for both Hidden Valley and West Africa is a result of reduced expectations of prospectivity of current tenement holdings, and in both cases contributed to the impairments recognised as at 30 June 2015.
The reduction in the relative value contribution of exploration for Telfer is a combination of reduced expectations of prospectivity and the increased overall value of Telfer resulting from the impairment reversal as at 30 June 2015.
(iii) ImpactsAfter reflecting the write down of inventories arising from the Group’s revised metal price and exchange rate estimates, the Group has conducted carrying value analysis and recognised a net impairment reversal of A$46 million after tax, as summarised in the table below:
Impairment – reversal/ (loss)
CGUPre-tax
A$mTax
A$mPost-tax
A$m
Telfer 538 (162) 376Hidden Valley (245) – (245)West Africa (85) – (85)
Total items by CGU 208 (162) 46
Attributable to:Non-controlling interest (9)Owners of the parent 55
46
The drivers of the impairment reversal at Telfer primarily relate to the reduction in the Group’s short and long term AUD: USD exchange rate estimates which had a positive impact on A$ revenue, together with improved cost and production assumptions in the LOM plan. Cumulative impairments previously recognised in 2013 and 2014 for Telfer amount to A$1,315 million after-tax.
The drivers of the impairments for the respective CGU’s are:
– At Hidden Valley, primarily relating to the lower short and long term US dollar gold price assumptions, lower expectations of improvements in future cost and production performance included in LOM plans and a reduced value attributable to exploration prospectivity. The magnitude of these negative impacts on Fair Value was only partly offset by the benefit of an assumed weaker PNG Kina compared to the US dollar. – At West Africa primarily relating to the lower short and long term US dollar gold price assumptions and a reduced value attributable to exploration prospectivity.

118 NEWCREST MINING ANNUAL REPORT 2015
Notes to the Consolidated Financial StatementsFor the year ended 30 June 2015
19. IMPAIRMENT CHARGES AND REVERSALS (continued)
(b) Sensitivity AnalysisAfter effecting the impairments for the West Africa and Hidden Valley CGUs and the impairment reversal for Telfer, the Fair Value of these assets is assessed as being equal to their carrying amount as at 30 June 2015. Although Lihir was not subject to an impairment or an impairment reversal as at 30 June 2015, its carrying amount at that date is still considered to approximate its Fair Value.
No impairment or impairment reversal has been recognised in relation to Lihir at 30 June 2015. Impairment charges in relation to Lihir were recognised in each of the years ended June 2013 and June 2014 totalling A$5,474 million. In light of observed operating performance in the year ended June 2015, and the impact of revised gold price and exchange rate assumptions, the carrying amount at 30 June 2015 of the Lihir CGU continues to reflect its Fair Value.
Any variation in the key assumptions used to determine Fair Value would result in a change of the estimated Fair Value. If the variation in assumption had a negative impact on Fair Value it could indicate a requirement for additional impairment of non-current assets. If the variation in assumption had a positive impact on Fair Value it could indicate a requirement for a reversal of non-current assets.
It is estimated that the following reasonably possible changes in the key assumptions would have the following approximate impact on the Fair Value of each CGU in its functional currency as at 30 June 2015 that has been subject to impairment or impairment reversal in the 2015 statutory accounts:
$ million in functional currencyLihir USD
Telfer AUD
Hidden Valley USD
West Africa USD
US$100 per ounce change in gold price 1,225 290 60 500.25% increase/decrease in discount rate 170 10 5 5$0.05 increase/decrease in AUD:USD rate 115 270 minor minor$0.10 increase/decrease in USD:PGK rate 215 n/a minor n/a5% increase/decrease in operating costs from that assumed 430 140 40 20
As identified above, the level of production activity is also a key assumption in the determination of Fair Value, most notably in relation to Lihir, for which further increases in processing throughput are assumed. Should increases in processing capacity not be achieved, changes in Fair Value estimates may arise. Due to the number of factors that could impact production activity, such as processing throughput, changing ore grade and/or metallurgy and revisions to mine plans in response to physical or economic conditions, no quantified sensitivity has been determined.
It must be noted that each of the sensitivities above assumes that the specific assumption moves in isolation, whilst all other assumptions are held constant. In reality, a change in one of the aforementioned assumptions may accompany a change in another assumption which may have an offsetting impact (for example, a decline in the US dollar gold price accompanied with a decline in the Australian dollar compared to the US dollar). Action is also usually taken to respond to adverse changes in economic assumptions that may mitigate the impact of any such change.
In addition to the impairment testing performed at 30 June 2015, the Group also undertook a sensitivity analysis on the Cadia Valley and Gosowong CGUs. Both of these CGUs have a Fair Value that significantly exceeds their carrying value. None of the sensitivities in the table above, applied either in isolation or in aggregate (as improbable as this scenario may be) to the Cadia Valley and Gosowong CGUs would cause an impairment in either CGU as at 30 June 2015. The gold price assumptions required in order for the estimated Fair Values to equal the carrying amounts for these two CGUs are:
– Cadia Valley – less than approximately US$612 per ounce; and – Gosowong – less than approximately US$705 per ounce.
20. INVESTMENT IN ASSOCIATE2015 A$m
2014 A$m
(a) Investment in Evolution Mining Ltd Carrying amount at 1 July 162 132Share of profit 19 22Share of comprehensive income – 2Dividends received (5) (5)Reversal of impairment loss recognised – 11Derecognition of equity accounted investment (176) –
Carrying amount at 30 June – 162
The Group accounted for its investment in Evolution Mining Limited (‘Evolution’) using the equity method until 27 February 2015. On 27 February 2015, the Group sold 124,600,000 shares in Evolution for net proceeds of A$105 million. This reduced the Group’s shareholding from 231,082,631 shares (32.3% interest) to 106,482,631 shares (14.9% interest) on 27 February 2015.
Following the sale, the Group determined that it no longer had significant influence over its investment and discontinued the equity method of accounting. The Group’s retained interest in Evolution was remeasured to fair value of A$90 million as at 27 February 2015 and was reclassified as an available-for-sale financial asset. Refer Note 5(a) for details of the profit or loss impact of this transaction and Note 13 for details of the available-for-sale investment.
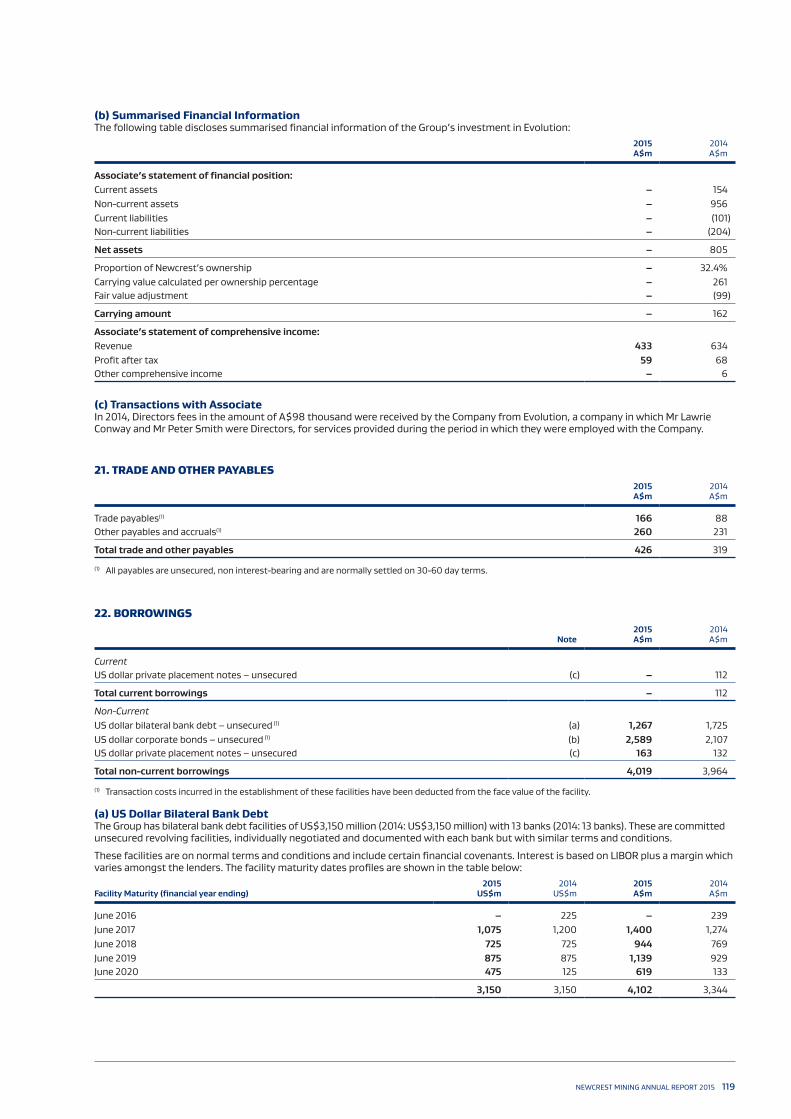
NEWCREST MINING ANNUAL REPORT 2015 119
(b) Summarised Financial InformationThe following table discloses summarised financial information of the Group’s investment in Evolution:
2015 A$m
2014 A$m
Associate’s statement of financial position:Current assets – 154Non-current assets – 956Current liabilities – (101)Non-current liabilities – (204)
Net assets – 805
Proportion of Newcrest’s ownership – 32.4%Carrying value calculated per ownership percentage – 261Fair value adjustment – (99)
Carrying amount – 162
Associate’s statement of comprehensive income:Revenue 433 634Profit after tax 59 68Other comprehensive income – 6
(c) Transactions with AssociateIn 2014, Directors fees in the amount of A$98 thousand were received by the Company from Evolution, a company in which Mr Lawrie Conway and Mr Peter Smith were Directors, for services provided during the period in which they were employed with the Company.
21. TRADE AND OTHER PAYABLES2015 A$m
2014 A$m
Trade payables(1) 166 88Other payables and accruals(1) 260 231
Total trade and other payables 426 319
(1) All payables are unsecured, non interest-bearing and are normally settled on 30-60 day terms.
22. BORROWINGS
Note2015 A$m
2014 A$m
CurrentUS dollar private placement notes – unsecured (c) – 112
Total current borrowings – 112
Non-CurrentUS dollar bilateral bank debt – unsecured (1) (a) 1,267 1,725US dollar corporate bonds – unsecured (1) (b) 2,589 2,107US dollar private placement notes – unsecured (c) 163 132
Total non-current borrowings 4,019 3,964
(1) Transaction costs incurred in the establishment of these facilities have been deducted from the face value of the facility.
(a) US Dollar Bilateral Bank DebtThe Group has bilateral bank debt facilities of US$3,150 million (2014: US$3,150 million) with 13 banks (2014: 13 banks). These are committed unsecured revolving facilities, individually negotiated and documented with each bank but with similar terms and conditions.
These facilities are on normal terms and conditions and include certain financial covenants. Interest is based on LIBOR plus a margin which varies amongst the lenders. The facility maturity dates profiles are shown in the table below:
Facility Maturity (financial year ending) 2015
US$m2014
US$m2015 A$m
2014 A$m
June 2016 – 225 – 239June 2017 1,075 1,200 1,400 1,274June 2018 725 725 944 769June 2019 875 875 1,139 929June 2020 475 125 619 133
3,150 3,150 4,102 3,344

120 NEWCREST MINING ANNUAL REPORT 2015
Notes to the Consolidated Financial StatementsFor the year ended 30 June 2015
22. BORROWINGS (continued)
(b) US Dollar Corporate BondsIn each of November 2011 and October 2012, Newcrest issued US$1,000 million in US dollar corporate bonds (notes). The notes were sold in accordance with Rule 144A and Regulation S of the Securities Act of the United States. The notes consist of:
Maturity Coupon Rate2015
US$m2014
US$m2015 A$m
2014 A$m
November 2021 4.45% 750 750 977 796October 2022 4.20% 750 750 977 796November 2041 5.75% 500 500 650 531
2,000 2,000 2,604 2,123
(c) US Dollar Private Placement NotesDuring the year ended 30 June 2005, the Group issued US$350 million of long term senior unsecured notes into the North American private placement market. The tranches remaining are shown in the table below:
Maturity Coupon Rate2015
US$m2014
US$m2015 A$m
2014 A$m
May 2015 5.66% – 105 – 112May 2017 5.71% 100 100 130 106May 2020 5.92% 25 25 33 26
125 230 163 244
These notes are on normal terms and conditions and include certain financial covenants. These notes were fully drawn as at 30 June 2015.
(d) US Dollar Facility AgreementDuring the year ended 30 June 2014, PT Nusa Halmahera Minerals entered into a US$50 million loan facility with one bank. In January 2015, this facility was extended by a further 12 months. This is an unsecured revolving facility maturing in January 2016 (2014: January 2015). The facility is on normal terms and conditions and includes certain financial covenants. Interest is based on LIBOR plus a margin.
As at 30 June 2015 this facility has not been utilised.
(e) Hedging: US Dollar Denominated DebtWhere considered appropriate the foreign currency component of US dollar denominated debt is designated either as a cash flow hedge of future US dollar denominated commodity sales or a net investment in foreign operations with a US dollar functional currency. Refer Note 31(d) for further details.
(f) Financial ArrangementsThe Group has access to the following unsecured financing arrangements at the end of the financial year.
2015 US$m
2014 US$m
2015 A$m
2014 A$m
Facilities utilised at reporting date(1)
USD Bilateral bank debt facilities 975 1,630 1,270 1,730USD Private placement notes 125 230 163 244USD Corporate bonds 2,000 2,000 2,604 2,123
3,100 3,860 4,037 4,097Facilities unutilisedUSD Bilateral bank debt facilities 2,175 1,520 2,832 1,614USD Facility agreement 50 50 65 53
2,225 1,570 2,897 1,667Total facilitiesUSD Bilateral bank debt facilities 3,150 3,150 4,102 3,344USD Private placement notes 125 230 163 244USD Corporate bonds 2,000 2,000 2,604 2,123USD Facility agreement 50 50 65 53
5,325 5,430 6,934 5,764
(1) As at 30 June 2015, 69% of the facilities utilised were at fixed interest rates and 31% at floating rates. (30 June 2014: 58% fixed rates and 42% floating rates).
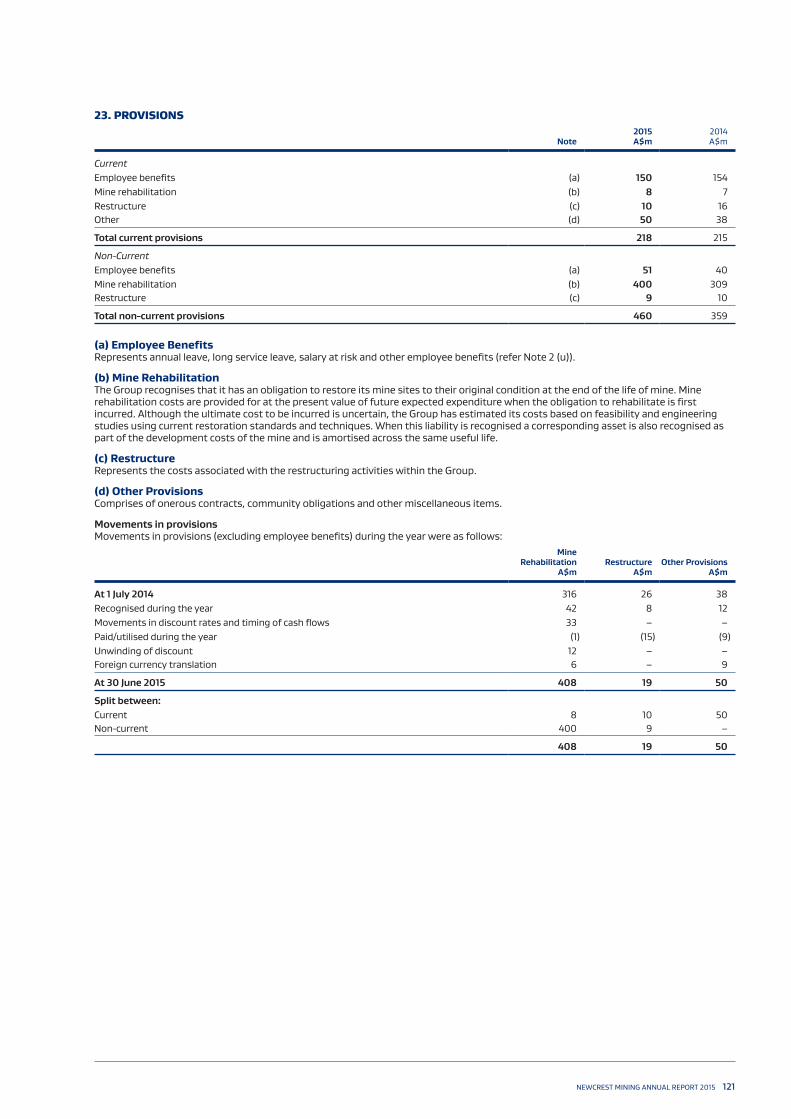
NEWCREST MINING ANNUAL REPORT 2015 121
23. PROVISIONS
Note2015 A$m
2014 A$m
CurrentEmployee benefits (a) 150 154Mine rehabilitation (b) 8 7Restructure (c) 10 16Other (d) 50 38
Total current provisions 218 215
Non-CurrentEmployee benefits (a) 51 40Mine rehabilitation (b) 400 309Restructure (c) 9 10
Total non-current provisions 460 359
(a) Employee BenefitsRepresents annual leave, long service leave, salary at risk and other employee benefits (refer Note 2 (u)).
(b) Mine Rehabilitation The Group recognises that it has an obligation to restore its mine sites to their original condition at the end of the life of mine. Mine rehabilitation costs are provided for at the present value of future expected expenditure when the obligation to rehabilitate is first incurred. Although the ultimate cost to be incurred is uncertain, the Group has estimated its costs based on feasibility and engineering studies using current restoration standards and techniques. When this liability is recognised a corresponding asset is also recognised as part of the development costs of the mine and is amortised across the same useful life.
(c) RestructureRepresents the costs associated with the restructuring activities within the Group.
(d) Other ProvisionsComprises of onerous contracts, community obligations and other miscellaneous items.
Movements in provisionsMovements in provisions (excluding employee benefits) during the year were as follows:
Mine Rehabilitation
A$mRestructure
A$mOther Provisions
A$m
At 1 July 2014 316 26 38Recognised during the year 42 8 12Movements in discount rates and timing of cash flows 33 – –Paid/utilised during the year (1) (15) (9)Unwinding of discount 12 – –Foreign currency translation 6 – 9
At 30 June 2015 408 19 50
Split between:Current 8 10 50Non-current 400 9 –
408 19 50

122 NEWCREST MINING ANNUAL REPORT 2015
Notes to the Consolidated Financial StatementsFor the year ended 30 June 2015
24. OTHER FINANCIAL LIABILITIES2015 A$m
2014 A$m
CurrentQuotational period derivatives (1) 15 –Copper forward sales contracts – 7Gold forward sales contracts – 3
Total current financial derivative liabilities 15 10
(1) Represents the embedded derivatives relating to quotational period movements on commodity sales. Refer note 2(y).
25. ISSUED CAPITAL2015 A$m
2014 A$m
(a) Movements in Issued CapitalOpening balance 13,593 13,592Shares issued during the year:
– Share plans(1) – 1 – Shares repurchased and held in treasury(2) (9) –
Total issued capital 13,584 13,593
2015 No.
2014 No.
(b) Number of Issued Ordinary SharesComprises:
– Shares held by the public 765,753,346 766,165,794 – Treasury shares 757,625 345,177
Total issued capital 766,510,971 766,510,971
Movement in issued ordinary shares for the year Opening number of shares 766,165,794 765,607,049Shares issued under:
– Share plans(1) 247,552 558,745 – Shares repurchased and held in treasury(2) (660,000) –
Closing number of shares 765,753,346 766,165,794
Movement in treasury shares for the year Opening number of shares 345,177 903,922
– Purchases 660,000 – – Issued pursuant to share plans (247,552) (558,745)
Closing number of shares 757,625 345,177
(1) Represents rights exercised under the Company’s share-based payments plans and executive service agreements. Refer to Note 27 for share-based payments.(2) During the year, the Newcrest Employee Share Plan Trust (‘Trust’) purchased a total of 660,000 ordinary fully paid Newcrest shares at an average price
of A$12.95 per share. The shares were purchased on-market to be held by the Trustee on behalf of the Trust to satisfy the future entitlements of the holders of performance rights (and any other rights to acquire shares) under Newcrest’s current and future employee incentive schemes.

NEWCREST MINING ANNUAL REPORT 2015 123
26. RESERVES
Note2015 A$m
2014 A$m
Equity settlements reserve (a) 79 71Foreign currency translation reserve (b) 33 (735)Hedge reserve (c) 9 17Fair value reserve (d) 32 –
Total reserves 153 (647)
(a) Equity Settlements ReserveThe equity settlements reserve is used to recognise the fair value of rights and options issued to employees, including Key Management Personnel in relation to equity-settled share based payments.
(b) Foreign Currency Translation ReserveThe foreign currency translation reserve is used to record exchange differences arising from the translation of the financial statements of foreign subsidiaries. The reserve is also used to record gains and losses on hedges of the net investment in foreign operations (refer Note 2(w)).
In prior years, the Group issued US$2,000 million in US denominated corporate bonds. This debt was designated as a hedge of the net investment in a foreign operation (Lihir Gold Limited). The exchange gains or losses upon subsequent revaluation of this US dollar denominated debt, in an effective hedge relationship, from the historical drawdown rate to the period-end spot exchange rate are recognised through other comprehensive income and deferred in the foreign currency translation reserve. These cumulative gains or losses will remain deferred in the foreign currency translation reserve and will only be transferred to the Income Statement in the event of the disposal of the foreign operation.
(c) Hedge ReserveThe hedge reserve is used to record the effective portion of changes in the fair value of cash flow hedges (refer Note 2(w)). The components of the hedge reserve at year end were as follows:
Component2015 A$m
2014 A$m
FX gains on US dollar denominated borrowings (i) 11 20Other cash flow hedges 2 4
13 24Tax effect (4) (7)
Total hedge reserve 9 17
(i) FX Gains on USD Private Placement NotesThe foreign currency component of this US dollar denominated debt was designated as a cash flow hedge of future US dollar denominated commodity sales. During the 2010 financial year, this hedge was de-designated. As a result of this de-designation, foreign exchange differences on the retranslation of this debt, from the date of de-designation are recorded in the Income Statement.
During the year A$9 million pre-tax (A$6 million post-tax) was transferred to the Income Statement (2014: A$nil).
The remaining balance of this cash flow hedge, in the hedge reserve is A$8 million net of tax (2014: A$14 million). This balance will continue to remain in the hedge reserve and will be released to the Income Statement, in the same period as the anticipated hedged US dollar denominated commodity sales.
(d) Fair Value ReserveThe Fair Value Reserve records movements in the fair value of available-for-sale financial assets. Where a revalued financial asset is sold or is determined to be impaired, the cumulative gain or loss included in the reserve is recognised in the Income Statement. The movement during the current year relates to the movement in the fair value of the investment in Evolution from A$90 million (being the fair value of the retained interest in Evolution at the date the Group sold down its interest) to A$122 million as at 30 June 2015 (refer Note 13).

124 NEWCREST MINING ANNUAL REPORT 2015
Notes to the Consolidated Financial StatementsFor the year ended 30 June 2015
27. SHARE-BASED PAYMENTS
(a) Newcrest Employee Share Acquisition PlanUnder the Newcrest Employee Share Acquisition Plan (‘ESAP’ or the plan), eligible employees are granted shares in Newcrest Mining Limited (‘the Company’) for no cash consideration. All Australian resident permanent employees who have been continuously employed by the Group for a period of at least one year, and are not eligible for the Executive Performance Share Plan, are able to participate in the plan.
Under the plan, eligible employees may be granted up to A$1,000 worth of fully paid ordinary shares in the Company for no consideration. The market value of shares issued under the plan is measured at the weighted average market price of the shares on the ASX over a period of a week prior to the grant date. The fair value of shares issued under the plan during the year was A$1.5 million (2014: A$1.6 million).
Members of the plan receive all the rights of ordinary shareholders. Unrestricted possession of these shares occurs at the earliest of, three years from the date of issue or the date employment ceases. During 2015, 1,544 employees participated in the plan (2014: 1,571 employees).
(b) Share Match PlanThe Share Match Plan commenced during the 2013 financial year. Employees may contribute up to A$4,950 to acquire shares in the plan year. On the third anniversary of the start of the plan year, the Company will match the number of acquired shares held by the employee at that time with matched shares.
During the year, 192,148 rights were granted for nil consideration under the Share Match Plan (2014: 263,161). Of these rights 4,363 were exercised (2014: 1,914) and 30,481 were forfeited upon resignation of the employee (2014: 28,354).
As at 30 June 2015, there are a total of 490,463 unissued shares under rights (2014: 333,159).
(c) Executive Performance Share Plan (LTI Plan) The Executive Performance Share Plan (also referred to as the Long Term Incentive (LTI) plan) entitles participants to receive rights to ordinary fully paid shares in the Company (Performance Rights). The Executive Directors, Executive General Managers, General Managers and Managers participate in this plan.
The performance measures for the Performance Rights granted in the 2015 and 2014 financial years comprised of three equally weighted measures, being:
– Comparative Cost Position; – Return on Capital Employed (ROCE); and – Strategic Performance.
Each LTI measure was chosen by the Board as it is a key driver of group performance: – Comparative Cost Position and Strategic Performance being key drivers of shareholder value in a gold mining company; and – ROCE being a direct measure of returns per unit of capital.
Performance against each of these measures over the three year vesting period accounts for 1/3rd of any grant made to participants. There is no ability to re-test performance under the Plan after the performance period.
The assessed fair value at grant date of the Performance Rights granted under the plan during the 2015 year was A$10.72 (2014: A$7.16) per right.
The fair value is independently determined using a Black-Scholes option pricing model. The model inputs for Performance Rights granted included:
– Share price at grant date: A$10.72 (2014: A$7.16) – Expected life of right (years): 3 years (2014: 3 years) – Exercise price: Nil (2014: Nil) – Risk-free interest rate: 2.28% (2014: 3.08%) – Expected dividend yield: 0.0% (2014: 0.0%)

NEWCREST MINING ANNUAL REPORT 2015 125
(d) Movements in the Number of Rights issued under the LTI PlanDetailed information of Performance Rights over unissued ordinary shares is set out below:
Movement in Number of Rights During the Year
Grant dateExercise date
on or after Expiry Date
Number at beginning
of year Granted Exercised ForfeitedNumber at
end of year
Number Exercisable
at end of year
201510 Nov 09 10 Nov 12 10 Nov 14 23,097 – (23,097) – – –10 Nov 10 10 Nov 13 10 Nov 15 22,408 – (16,685) (1,291) 4,432 4,43223 Sep 11 23 Sep 14 23 Sep 14 407,444 – (34,294) (373,150) – –17 Sep 12 17 Sep 15 17 Sep 15 525,985 – – (73,931) 452,054 –4 Dec 13 16 Sep 16 16 Sep 16 1,826,837 – – (455,262) 1,371,575 –12 Dec 14 7 Nov 17 7 Nov 17 – 1,802,258 – (39,576) 1,762,682 –
Total 2,805,771 1,802,258 (74,076) (943,210) 3,590,743 4,432
201411 Nov 08 11 Nov 10 11 Nov 12 31,175 – (31,175) – – –11 Nov 08 11 Nov 11 11 Nov 13 110,967 – (110,967) – – –10 Nov 09 10 Nov 12 10 Nov 14 90,284 – (64,542) (2,645) 23,097 23,09710 Nov 10 10 Nov 13 10 Nov 15 178,590 – (33,048) (123,134) 22,408 22,40823 Sep 11 23 Sep 14 23 Sep 14 480,584 – – (73,140) 407,444 –17 Sep 12 17 Sep 15 17 Sep 15 704,641 – – (178,656) 525,985 –4 Dec 13 16 Sep 16 16 Sep 16 – 2,048,677 – (221,840) 1,826,837 –
Total 1,596,241 2,048,677 (239,732) (599,415) 2,805,771 45,505
All Performance Rights have a nil exercise price.
28. KEY MANAGEMENT PERSONNEL
(a) Details of Directors and Key Management PersonnelKey Management Personnel (KMP) comprises the Company Directors (including Executive Directors) and Executive General Managers. The Managing Director, Finance Director and the Executive General Managers (EGM) are members of the Group’s Executive Committee (Exco). The members of the Exco exercise the greatest control over the management and strategic direction of the Group and are also the highest paid individuals in the Group.Name Position
DirectorsPeter Hay Non-Executive Chairman Sandeep Biswas(1) Executive Director and Chief Executive OfficerGerard Bond Finance Director and Chief Financial Officer Philip Aiken AM Non-Executive DirectorVince Gauci Non-Executive DirectorWinifred Kamit Non-Executive Director Richard Knight Non-Executive DirectorRick Lee AM Non-Executive DirectorTim Poole Non-Executive DirectorJohn Spark Non-Executive Director
Executive General Managers Craig JonesFrancesca LeeColin MoorheadJane Thomas(2)
David Woodall
Former Executive Directors and General ManagersGreg Robinson(3)
Geoff Day(4)
Debra Stirling(5)
(1) Sandeep Biswas was appointed to the position on 4 July 2014.(2) Jane Thomas was appointed to the position on 5 January 2015.(3) Greg Robinson ceased in the position of Managing Director and Chief Executive Officer on 4 July 2014.(4) Geoff Day ceased in the position on 14 September 2014 upon resignation.(5) Debra Stirling left the Company on 4 July 2014.

126 NEWCREST MINING ANNUAL REPORT 2015
Notes to the Consolidated Financial StatementsFor the year ended 30 June 2015
28. KEY MANAGEMENT PERSONNEL (continued)
(b) Remuneration of Key Management Personnel and Directors2015
A$’0002014
A$’000
Short-term 14,493 17,746Long-term 265 364Post-employment 273 352Termination benefits 1,305 5,056Share-based payments expense 2,035 (579)
18,371 22,939
(c) Shareholdings and Rights of Key Management PersonnelDetails of shareholdings and rights of KMP are outlined in the Remuneration Report.
(d) Loans and other transactions with Key Management PersonnelThere are no loans made to KMP, or their related entities, by the Group.
29. AUDITORS REMUNERATION2015
A$’0002014
A$’000
(a) Amounts received or due and receivable by Ernst & Young (Australia) for:Audit or review of financial reports of the company and subsidiaries 1,924 2,372Other services:
– Tax advisory and assurance services 390 502 – Accounting advice and other assurance-related services 516 149
2,830 3,023
(b) Amounts received or due and receivable by related practices of Ernst & Young (Australia) for:Audit or review of financial reports of subsidiaries 224 224
(c) Amounts received or due and receivable by other auditors for:Audit or review of the financial report of subsidiaries 107 87
107 87
30. CAPITAL MANAGEMENT AND FINANCIAL OBJECTIVESThe capital structure of Newcrest consists of debt, which includes borrowings as disclosed in Note 22, cash, cash equivalents and equity. The Group is not subject to any externally imposed capital requirements.
Financial ObjectivesNewcrest’s financial objectives are to:
– Meet all financial obligations, – Maintain a strong balance sheet so as to withstand cash flow volatility, – Be able to invest capital in value-creating opportunities, and; – Be able to return excess cash generated to shareholders.
As an unhedged gold producer, Newcrest looks to maintain a conservative level of balance sheet leverage.
The Group’s management of financial risk is based on continual monitoring and review of its forecast financial position against this criteria. The Group has a detailed planning process that forms the basis of all cash flow forecasting, and updates these forecasts on a regular basis. The cash flow forecast is used to analyse sensitivities that stress-test financial risks and forms the basis for the annual Capital Management Plan which is reviewed by the Board.
Newcrest aims to maintain an optimal capital structure that reduces the cost of capital and maximises shareholder returns, withstands price volatility and allows completion of approved major capital projects through periods of price volatility.
From a financial policy perspective, Newcrest looks to: – Target an investment grade credit rating throughout the cycle; – Maintain a leverage ratio (Net Debt to EBITDA) of less than 2.0 times; – Maintain a gearing ratio of below 25%; and – Maintain diverse funding sources, sizeable committed undrawn bank facilities and USD debt with an appropriate tenor having regard to the life of the Company’s assets.
Newcrest’s dividend policy continues to balance financial performance and capital commitments with a prudent leverage and gearing level for the Company. Newcrest looks to pay ordinary dividends that are sustainable over time having regard to its financial policy, profitability, balance sheet strength and reinvestment options in the business.

NEWCREST MINING ANNUAL REPORT 2015 127
(a) Gearing RatioThe gearing ratio at year-end was as follows:
2015 A$m
2014 A$m
Total debt 4,019 4,076Less: Cash and cash equivalents (258) (141)Net debt 3,761 3,935Equity 9,059 7,707
Total capital (Net debt and equity) 12,820 11,642
Gearing ratio 29.3% 33.8%
(b) Leverage RatioThe leverage ratio for the year was as follows:
2015 A$m
2014 A$m
Net debt 3,761 3,935EBITDA(1) 1,673 1,514Leverage ratio 2.2 times 2.6 times
(1) EBITDA is used as a segment measure. Refer to Note 6 for definition.
Under current market and operating conditions, the Newcrest Board remains comfortable with this level of debt given the near term cash flow outlook of the Group and will continue to apply free cash flow to the reduction of debt.
31. FINANCIAL RISK MANAGEMENTCredit, liquidity and market risk (including foreign exchange risk, commodity and other price risk and interest rate risk) arise in the normal course of the Group’s business. These are managed under Board approved directives which underpin Group Treasury policies and processes. The Group’s principal financial instruments, other than derivatives, comprise interest-bearing debt, cash and short term deposits. Other financial instruments include trade receivables and trade payables which arise directly from operations.
(a) Financial Assets and Financial LiabilitiesThe following table discloses the carrying amounts of each class of financial assets and financial liabilities at year end.
Financial Assets and Financial Liabilities2015 A$m
2014 A$m
Financial AssetsCash and cash equivalents 258 141Receivables 206 169Derivatives at fair value through profit or loss 18 20Derivatives in designated hedge accounting relationship 2 4Available-for-sale financial assets 122 –
606 334
Financial LiabilitiesTrade and other payables 426 319Borrowings 4,019 4,076Derivatives at fair value through profit or loss 15 10
4,460 4,405

128 NEWCREST MINING ANNUAL REPORT 2015
Notes to the Consolidated Financial StatementsFor the year ended 30 June 2015
31. FINANCIAL RISK MANAGEMENT (continued)
(b) Credit RiskCredit risk arises from the financial assets of the Group, which comprise cash and cash equivalents, trade and other receivables and derivative financial instruments. The Group’s exposure to credit risk arises from the potential default of the counterparty with a maximum exposure equal to the carrying amount of these financial assets as recorded in the financial statements.
It is the Group’s policy that all customers who wish to trade on credit terms and providers of capital or financial counterparties are subject to a credit risk analysis including assessment of credit rating, short term liquidity and financial position. The Group obtains sufficient collateral (such as a letter of credit) where appropriate from customers, as a means of mitigating the risk of financial loss from defaults. At the reporting date the value of collateral held was A$56 million (2014: A$36 million).
Receivables balances are monitored on an ongoing basis with the result that the Group’s exposure to bad debts is not significant. There were no material impairments of receivables as at 30 June 2015 or 30 June 2014.
The majority of the Group’s receivables are due from concentrate customers in Japan, China, Europe and Korea. There have been no credit defaults with these customers in recent history. Newcrest’s Treasury department evaluates credit risk on a continual basis. At the reporting date there were no other significant concentrations of credit risk.
The Group limits its counterparty credit risk on liquid funds and derivative financial instruments by dealing only with banks or financial institutions with credit ratings of at least BBB equivalent.
The ageing of trade and other receivables at the reporting date was as follows:Past due but not impaired
Trade and other receivablesNot Past Due
A$m
Less than 30 days
A$m
Greater than 30 days
A$mTotal A$m
2015Bullion awaiting settlement 19 – – 19Metal in concentrate receivables 133 – – 133GST receivable 30 – – 30Other receivables 24 – – 24
206 – – 206
2014Bullion awaiting settlement 34 – – 34Metal in concentrate receivables 62 – – 62GST receivable 46 – – 46Other receivables 25 1 1 27
167 1 1 169
(c) Liquidity Risk The liquidity position of the Group is managed to ensure sufficient liquid funds are available to meet the Group’s financial commitments in a timely and cost-effective manner. The Group undertakes stress testing of operational cash flows which are matched with capital commitments to assess liquidity requirements. The Capital Management Plan is the formal record of the analysis and actions required in detail for the next 12 months and longer term to five years.
The Group maintains a balance between continuity of funding and flexibility through the use of loans and committed available credit lines. Included in Note 22 is a list of undrawn facilities that the Group has at its disposal to manage liquidity risk.
The following table reflects all contractually fixed repayments and interest resulting from recognised financial liabilities at the reporting date, including derivative financial instruments. For derivative financial instruments the market value is presented, whereas for the other obligations the respective undiscounted cash flows for the respective upcoming financial years are presented.
Less than 6 months
A$m
Between 6-12 months
A$m
Between 1-2 years
A$m
Between 2-5 years
A$m
Greater than 5 years
A$mTotal A$m
2015Payables 426 – – – – 426Borrowings 76 76 893 1,061 3,577 5,683Derivatives 15 – – – – 15
517 76 893 1,061 3,577 6,124
2014Payables 319 – – – – 319Borrowings 52 183 372 1,923 3,044 5,574Derivatives 10 – – – – 10
381 183 372 1,923 3,044 5,903

NEWCREST MINING ANNUAL REPORT 2015 129
(d) Foreign Currency RiskThe Group undertakes transactions denominated in foreign currencies, hence exposures to exchange rate fluctuations arise. The Group’s revenue is denominated in US dollars whereas the majority of costs (including capital expenditure) are in Australian dollars and US dollars. The Group’s Statement of Financial Position can be affected significantly by movements in the AUD:USD exchange rate. The Group also has exposure to other foreign currencies such as the Indonesian Rupiah, Papua New Guinea Kina, Central African Franc and Fiji Dollar however these exposures are less significant.
Newcrest hedges certain non-functional-currency capital commitment exposures to provide some budget certainty in the functional currency.
Measuring the exposure to foreign exchange risk is achieved by regularly monitoring and performing sensitivity analysis on the Group’s financial position.
The carrying amounts of the Group’s US Dollar denominated financial assets and liabilities in entities which do not have a US Dollar functional currency at the reporting date are as follows:
US Dollar Denominated Balances 2015 A$m
2014 A$m
Financial Assets Cash and cash equivalents 5 2Trade and other receivables 133 62Related party receivables 1,498 1,304Derivatives 16 14
1,652 1,382
Financial Liabilities Payables 26 22Borrowings 4,037 4,097Derivatives 15 10
4,078 4,129
Net Exposure (2,426) (2,747)
Net investment in foreign operations (i) 2,604 2,787
Net Exposure (inclusive of net investment in foreign operations) 178 40
(i) The Group seeks to mitigate the effect of its foreign currency exposure by borrowing in US Dollars. Where considered appropriate the foreign currency component of the US Dollar denominated debt is designated either as a:
– Net investment in foreign operations. Exchange gains or losses upon subsequent revaluation of US Dollar denominated borrowings from the historical draw down rate to the period end spot exchange rate are recognised through other comprehensive income and deferred in equity in the Foreign Currency Translation Reserve and will be released to the Income Statement if the foreign operation is sold. As at 30 June 2015 US Dollar borrowings of A$2,604 million were designated as a net investment in foreign operations (2014: A$2,787 million); or – Cash flow hedge of future US Dollar denominated commodity sales. Exchange gains or losses upon subsequent revaluation of US Dollar denominated borrowings from the historical draw-down rate to the period-end spot exchange rate are recognised in other comprehensive income and deferred in equity in the Hedge Reserve and will be released to the Income Statement as the anticipated hedged US Dollar denominated commodity sales to which the deferred gains/(losses) are designated, occur.
Sensitivity analysisThe following table details the Group’s sensitivity arising in respect of translation of financial assets and financial liabilities to a 10% movement (2014: 10%) (i.e. increase and decrease) in the Australian Dollar against the US Dollar at the reporting date, with all other variables held constant. The 10% sensitivity is based on reasonably possible changes, over a financial year, using the observed range of actual historical rates for the preceding five-year period.
Impact on Profit After Tax Higher/(Lower)
Impact on Equity Higher/(Lower)
2015 A$m
2014 A$m
2015 A$m
2014 A$m
AUD/USD +10% (2014: +10%) (12) (3) 166 177AUD/USD -10% (2014: -10%) 14 3 (203) (217)
Significant assumptions used in the foreign currency exposure sensitivity analysis above include:
– Reasonably possible movements in foreign exchange rates;The reasonably possible movement of 10% (2014: 10%) was calculated by taking the USD spot rate as at the reporting date, moving this spot rate by 10% (2014:10%) and then re-converting the USD into AUD with the ‛new spot-rate’. This methodology reflects the translation methodology undertaken by the Group; and
– The translation of the net assets in subsidiaries with a functional currency other than AUD has not been included in the sensitivity analysis as part of the equity movement.
Forward Foreign Exchange ContractsThe Group does not have any material exposure to foreign currency contracts as at reporting date.

130 NEWCREST MINING ANNUAL REPORT 2015
Notes to the Consolidated Financial StatementsFor the year ended 30 June 2015
31. FINANCIAL RISK MANAGEMENT (continued)
(e) Commodity and Other Price RisksThe Group’s revenue is exposed to commodity price fluctuations, in particular to gold and copper prices. The Group’s input costs are exposed to price fluctuations, in particular to diesel and fuel prices.
The Group has entered into gold and copper forward sales contracts and diesel forward contracts to manage its exposure to movements in commodity and input prices. The carrying amounts of the Group’s derivative financial instruments as at the reporting date are disclosed in Notes 13 and 24.
Quotational Period DerivativesThe terms of metal in concentrate sales contracts with third parties contain provisional pricing arrangements whereby the selling price for metal in concentrate is based on prevailing spot prices on a specified future date after shipment to the customer (quotation period).
Gold ounces subject to quotational period adjustment at the reporting date are 150 thousand (2014: 204 thousand). Copper tonnes subject to quotational period adjustment at the reporting date are 28 thousand (2014: 34 thousand).
The quotational period is usually one month for gold and three or four months for copper.
In order to minimise the impact of quotational period adjustments, the Group takes out forward sales contracts at the time of concentrate shipments to lock in the price.
Gold and Copper Forward Sales ContractsThe Group enters into gold and copper forward sales contracts to effectively fix the US dollar cash flows receivable on the sale of certain gold and copper concentrate. Gold and copper forward sales contracts are not designated into hedge relationships and therefore fair value adjustments on these contracts are recognised in the Income Statement as ‛Other Income/Expense’.
The following table details the gold and copper forward sale contracts outstanding as at the reporting date:2015 2014
Gold and Copper forward sale contractsQuantity
(‘000s)
Weighted Average Price
US$Fair Value
A$mQuantity
(‘000s)
Weighted Average Price
US$Fair Value
A$m
Gold (ounces) Maturing less than 6 months 147 1,194 4 181 1,289 (3)Copper (tonnes) Maturing less than 6 months 26 6,077 10 32 6,754 (7)
Diesel/Fuel Forward ContractsThe Group’s input costs are exposed to price fluctuations, in particular to diesel and fuel prices. The Group has entered into diesel/fuel swaps to manage its exposure to movements in diesel/fuel prices.
The Group undertakes short-term diesel/fuel hedging in line with budget to fix certain diesel and heavy fuel oil costs.2015 2014
Maturing in less than 12 monthsQuantity
(‘000s)
Weighted Average Price
US$Fair Value
A$mQuantity
(‘000s)
Weighted Average Price
US$Fair Value
A$m
Diesel contracts (barrels) 414 76 – 471 118 2Heavy fuel oil contracts (tonnes) 102 356 2 197 602 2

NEWCREST MINING ANNUAL REPORT 2015 131
Sensitivity AnalysisThe following table summarises the sensitivity of financial assets and financial liabilities held at the reporting date to movement in gold, copper, diesel and heavy fuel oil commodity prices, with all other variables held constant. The 15% movement for gold, copper, diesel and heavy fuel oil prices (2014: 15%) are based on reasonably possible changes, over a financial year, using an observed range of actual historical rates for the preceding five year period.
Impact on Profit(1) Higher/(Lower)
Impact on Equity(3) Higher/(Lower)
Post-tax gain/(loss)2015 A$m
2014 A$m
2015 A$m
2014 A$m
Gold(2)
Gold +15% (2014: +15%) 1 2 1 2Gold -15% (2014: -15%) (1) (2) (1) (2)
CopperCopper +15% (2014: +15%) 2 2 2 2Copper -15% (2014: -15%) (2) (2) (2) (2)
Diesel Diesel +15% (2014: +15%) 4 6 4 6Diesel -15% (2014: -15%) (4) (6) (4) (6)
Heavy fuel oil HFO +15% (2014: +15%) 5 14 5 14HFO -15% (2014: -15%) (5) (14) (5) (14)
(1) Represents the impact of the movement in commodity prices on the balance of the financial assets and financial liabilities at year end.(2) The impact on profit predominantly relates to the change in value of the embedded derivative relating to quotational period movements on gold sales
(refer note 2(y)).(3) As the majority of these derivatives are not in hedging relationships, all fair value movements are recognised in the Income Statement and therefore
the impact on equity only represents retained earnings impacts.
(f) Interest Rate RiskThe Group is exposed to interest rate risk as entities in the Group borrow funds at both fixed and floating interest rates. The risk is managed by the Group by maintaining an appropriate mix between fixed and floating rate borrowings which is evaluated regularly to align with interest rate views and risk profile. Details of the Group’s types and levels of debt are included in Note 22.
Interest rate exposureThe Group’s interest rate exposure together with the effective interest rate for each class of financial assets and financial liabilities at the reporting date is summarised as follows:
2015 2014
Consolidated
Floating Interest
A$m
Fixed Interest
A$m
Effective Interest Rate
%
Floating Interest
A$m
Fixed Interest
A$m
Effective Interest Rate
%
Financial AssetsCash and cash equivalents 258 – 0.3 141 – 0.4
258 141 –Financial LiabilitiesBilateral debt 1,270 – 1.6 1,730 – 1.7Corporate bonds – 2,604 4.7 – 2,123 4.7Private placement – 163 5.8 – 244 5.7
1,270 2,767 1,730 2,367
(1,012) (2,767) (1,589) (2,367)
The other financial instruments of the Group not included in the above table are non-interest bearing and not subject to interest rate risk.
Sensitivity analysisThe sensitivity analysis below has been determined based on the exposure to interest rates for non-derivative instruments at the reporting date and the stipulated change taking place at the beginning of the financial year and held constant throughout the reporting period. A 100 basis point increase or decrease is used and represents management’s assessment of the reasonably possible change in interest rates over a financial year.
Impact on Profit Higher/(Lower)
Impact on Equity Higher/(Lower)
Post-tax gain/(loss)2015 A$m
2014 A$m
2015 A$m
2014 A$m
+1% (100 basis points) (7) (11) (7) (11)- 1% (100 basis points) 7 11 7 11

132 NEWCREST MINING ANNUAL REPORT 2015
Notes to the Consolidated Financial StatementsFor the year ended 30 June 2015
31. FINANCIAL RISK MANAGEMENT (continued)
(g) Fair ValueFair value of financial instruments carried at amortised costExcept as detailed in the following table, the carrying amounts of financial assets and financial liabilities recognised at amortised cost in the financial statements approximate their fair value.
Carrying amount Fair value
Financial Assets/(Liabilities)2015 A$m
2014 A$m
2015 A$m
2014 A$m
Borrowings:Fixed rate debt:(1)
– Corporate Bonds (2,589) (2,107) (2,390) (1,970) – Private placement (163) (244) (169) (254)
(2,752) (2,351) (2,559) (2,224)
(1) Amount recorded at amortised cost and the movements in the fair valuation are not recorded on the Statement of Financial Position. The fair value is a level 2 valuation. Fair values of the Group’s fixed rate borrowings are determined by using discounted cash flow models that use discount rates that reflect the issuer’s borrowing rate as at the end of the reporting period.
Fair value measurements recognised in the Statement of Financial PositionThe following table provides an analysis of financial instruments that are measured subsequent to initial recognition at fair value, grouped into Levels 1 to 3 based on the degree to which the fair value is observable.
– Level 1 fair value measurements are those derived from quoted prices (unadjusted) in active markets for identical assets or liabilities. – Level 2 fair value measurements are those derived from inputs other than quoted prices included within Level 1 that are observable for the asset or liability, either directly (as prices) or indirectly (derived from prices). Valuation inputs include forward curves, discount curves and underlying spot and futures prices. – Level 3 fair value measurements are those derived from valuation techniques that include inputs for the asset or liability that are not based on observable market data (unobservable inputs).
Financial Assets/(Liabilities)Level 1
A$mLevel 2
A$mLevel 3
A$mTotal A$m
2015Financial AssetsCopper forward sales contracts – 10 – 10Gold forward sales contracts – 4 – 4Other financial derivatives – 2 – 2Other financial assets – – 4 4Available-for-sale financial assets 122 – – 122Financial LiabilitiesQuotational period derivatives – (15) – (15)
122 1 4 127
2014Financial AssetsQuotational period derivatives – 10 – 10Other financial derivatives – 4 – 4Other financial assets – – 10 10Financial LiabilitiesCopper forward sales contracts – (7) – (7)Gold forward sales contracts – (3) – (3)
– 4 10 14
32. COMMITMENTS2015 A$m
2014 A$m
(a) Operating Lease CommitmentsFuture minimum rentals payable on non-cancellable operating leases due:Within one year 3 3Later than one year but not later than five years 11 10Later than five years – 3
Total 14 16
The Group leases assets for operations including plant and office premises. The leases have an average life ranging from 1 to 10 years. There are no restrictions placed upon the lessee by entering into these leases.
(b) Capital Expenditure CommitmentsCapital expenditure commitments 80 143
This represents contracted capital expenditure.

NEWCREST MINING ANNUAL REPORT 2015 133
33. CONTINGENT LIABILITIES
(a) Hidden ValleyLegal proceedings were commenced in December 2010 against the Hidden Valley mine unincorporated joint venture (in which Newcrest holds a 50% interest) in Papua New Guinea over alleged damage to the Watut River (which runs adjacent to the Hidden Valley gold mine) alleged to have been caused by waste rock and overburden run-off from the mine. The damages sought by the plaintiffs are not specified. The defendants intend to defend the claims. No active steps have been taken by the plaintiffs in this proceeding since late 2012. It is not practicable to make any reasonable assessment of the prospects of the plaintiffs succeeding if they proceed with these claims, nor the potential liability of the defendants if the plaintiffs were to succeed. Accordingly, no provision has been recognised in the financial statements for this matter.
(b) Cadia ValleySince 2011 a private exploration company, Gold & Copper Resources Pty Ltd (‘GCR’), has brought nine legal actions, including two appeals, against Newcrest, each relating directly or indirectly to Newcrest’s exploration and mining interests and activities in the Cadia Valley. The NSW Minister responsible for mining (the ‘Minister’) is also a defendant in six of the proceedings.
Of the nine legal actions commenced by GCR, eight have now been determined by the Court with no material impact on Newcrest.
Subsequent to year-end, the remaining proceeding was discontinued by GCR effective 30 July 2015.
(c) Newcrest Mining LimitedOn 21 July 2014, Slater & Gordon Lawyers commenced a shareholder class action in the Federal Court of Australia against Newcrest in relation to Newcrest’s market disclosure prior to its 7 June 2013 market release. The proceeding is brought on behalf of persons who acquired Newcrest shares between 13 August 2012 and 6 June 2013. Newcrest has commenced cross claim proceedings joining relevant insurers to the class action. The trial of the class action has been ordered to commence on 29 February 2016. Newcrest has announced that it intends to vigorously defend the proceeding.
The Court documents do not quantify the damages that the claimants will seek in the proceeding for all or any part of the claim period. Newcrest does not consider that there is a reasonable basis on which to assess or estimate any potential liability, and, therefore, no provision has been recognised in the financial statements.
(d) Income Tax Matters – Indonesia During the current financial year the Indonesian Tax Office (‘ITO’) completed tax audits of PT Nusa Halmahera Minerals (‘PT NHM’) for the 30 June 2011 and 30 June 2013 financial years. PT NHM is 75% owned by Newcrest. The principal issue raised was the income tax rate applicable under the Gosowong Contract of Work (‘COW’).
The assessment issued by the ITO to PT NHM applied a higher tax rate in accordance with the ITO interpretation. This resulted in an additional tax assessment of US$30 million in relation to 30 June 2011 and US$8 million in relation to 30 June 2013. PT NHM disagrees with these assessments but paid the tax payable under the assessment to mitigate future penalties. PT NHM has objected to these assessments and is seeking recovery of this US$38 million payment.
The ITO is also conducting tax audits of the 30 June 2012 and 30 June 2014 financial years. PT NHM has applied its interpretation of the income tax rate applicable under the COW. If, following the audit, the ITO issues an assessment maintaining its alternative interpretation of the applicable tax rate, the additional tax assessed is estimated to be approximately US$33 million (inclusive of interest) for 30 June 2012 and US$7 million in relation to 30 June 2014 on a 100% basis.
PT NHM has also applied its interpretation of the income tax rate applicable under the COW for its provisional tax calculation for the 30 June 2015 financial year. If the ITO maintains its alternative interpretation of the applicable tax rate, the additional tax provision is estimated to be approximately US$7 million in relation to 30 June 2015 on a 100% basis.
The Group considers that PT NHM has made adequate provision for its taxation liabilities and is taking appropriate steps to address issues raised by the ITO. If PT NHM is ultimately unsuccessful in obtaining recovery of the paid amounts (US$46 million to date, which includes a payment of US$8 million in 2014 in relation to the 2010 financial year), income tax expense would be adversely impacted by any shortfall in recovery of the tax paid together with the re-measurement of deferred tax liabilities.
(e) Other MattersIn addition to the above matters, companies in the Group are recipients of, or defendants in, certain claims, proceedings and/or complaints made, commenced or threatened. In the opinion of the Directors, all such matters are of such a kind, or involve such amounts, that they are not anticipated to have a material effect on the financial position of the Group if disposed of unfavourably, or are at a stage which does not support a reasonable evaluation of the likely outcome of the matter.
(f) Bank GuaranteesThe Group has negotiated a number of bank guarantees in favour of various government authorities and service providers. The total nominal amount of these guarantees at the reporting date is A$137 million (30 June 2014: A$183 million).

134 NEWCREST MINING ANNUAL REPORT 2015
Notes to the Consolidated Financial StatementsFor the year ended 30 June 2015
34. CONTROLLED ENTITIESThe Group comprises the following significant entities:
Percentage HoldingEntity Notes Country of Incorporation 2015 % 2014 %
Parent EntityNewcrest Mining Limited Australia
SubsidiariesCadia Holdings Pty Ltd (a) Australia 100 100Contango Agricultural Co. Pty Ltd (a) Australia 100 100Newcrest Exploration Holdings Pty Ltd (a) Australia 100 100Newcrest Finance Pty Ltd (a) Australia 100 100Newcrest Holdings (Investments) Pty Ltd Australia 100 100Newcrest International Pty Ltd (a) Australia 100 100Newcrest New Zealand Exploration Pty Ltd (formerly Horskar Pty Ltd) Australia 100 100Newcrest Operations Ltd (a) Australia 100 100Newgen Pty Ltd Australia 100 100Sulawesi Investments Pty Ltd (a) Australia 100 100LGL Australian Holdings Pty Ltd Australia 100 100LGL Mount Rawdon Operations Pty Ltd Australia 100 100Newcrest Singapore Holdings Pte Ltd (b) Singapore 100 100Newcrest Singapore (Tandai) Pte Ltd (b) Singapore – 100Newcrest Insurance Pte Ltd (b) Singapore 100 100Newcrest Hire Holdings Pte Ltd (b) Singapore 100 –Newcrest Dougbafla Holdings Pte Ltd (b) Singapore 100 –PT Nusa Halmahera Minerals (b) Indonesia 75 75PT Puncakbaru Jayatama (b) Indonesia 100 100Newcrest (Fiji) Ltd (b) Fiji 100 100Newcrest Exploration (Fiji) Ltd (b) Fiji 100 100Lihir Gold Ltd (b) Papua New Guinea 100 100Newcrest PNG 1 Ltd (b) Papua New Guinea 100 100Newcrest PNG 2 Ltd (b) Papua New Guinea 100 100Newcrest PNG 3 Ltd (b) Papua New Guinea 100 100Newcrest PNG Exploration Ltd (b) Papua New Guinea 100 100Newcrest Resources Inc USA 100 100Newroyal Resources Inc USA 100 100LGL Holdings CI SA (b) Côte d’Ivoire 100 100LGL Mines CI SA (b) Côte d’Ivoire 89.89 89.89LGL Resources CI SA (b) Côte d’Ivoire 99.89 99.89Newcrest Hire CI SA (b) Côte d’Ivoire 89.89 –Newcrest Dougbafla CI SA (b) Côte d’Ivoire 89.89 –
Notes:(a) These controlled entities have been granted relief from the necessity to prepare financial reports in accordance with Class Order 98/1418 issued
by the Australian Securities & Investments Commission. (Refer Note 36 for further information).(b) Audited by affiliates of the Parent entity auditors.

NEWCREST MINING ANNUAL REPORT 2015 135
35. PARENT ENTITY INFORMATIONThe summarised Income Statement and Statement of Financial Position in respect to the parent entity (‘Company’) is set out below.
Company2015 A$m
2014 A$m
(a) Income StatementProfit/(loss) after income tax 939 (2,551)
Total comprehensive income/(loss) for the year 939 (2,551)
(b) Statement of Financial PositionCurrent assets 167 127Non-current assets 7,774 6,838
Total assets 7,941 6,965Current liabilities 135 110Non-current liabilities 111 98
Total liabilities 246 208
Net assets 7,695 6,757
Issued capital 13,584 13,593Equity settlements reserve 79 71Accumulated losses:
– Opening balance (6,907) (4,356) – Profit/(loss) after tax 939 (2,551)
– Closing balance (5,968) (6,907)
Total equity 7,695 6,757
(c) CommitmentsCapital expenditure commitments 4 9
(d) Guarantees and Contingent LiabilitiesThe Company and certain Australian controlled entities have entered into a Deed of Cross Guarantee. The effect of the Deed is that the Company guarantees to each creditor payment in full of any debt in the event of winding up of any of the controlled entities under certain provisions of the Corporations Act 2001. Further details are included in Note 36. At the reporting date, no amounts have been recognised in the financial information of the Company in respect of this Deed on the basis that the possibility of default is remote.
36. DEED OF CROSS GUARANTEEPursuant to ASIC Class Order 98/1418 (as amended) dated 13 August 1998, the wholly-owned controlled entities detailed in Note 34 are relieved from the Corporations Act 2001 requirements for preparation, audit, and lodgement of financial reports, and Directors’ Report.
It is a condition of the Class Order that the Company and each of the controlled entities enter into a Deed of Cross Guarantee. The effect of the Deed is that the Company guarantees to each creditor payment in full of any debt in the event of winding up of any of the controlled entities under certain provisions of the Corporations Act 2001. If a winding up occurs under other provisions of the Act, the Company will only be liable in the event that after six months any creditor has not been paid in full. The controlled entities have also given similar guarantees in the event that the Company is wound up.
A consolidated Income Statement and consolidated Statement of Financial Position, comprising the Company and controlled entities which are a party to the Deed, after eliminating all transactions between parties to the Deed of Cross Guarantee is set out below.
Consolidated
Income Statement2015 A$m
2014 A$m
Operating sales revenue 2,494 2,184Cost of sales (1,560) (1,465)
Gross profit 934 719
Exploration costs (14) (12)Corporate administration costs (116) (132)Other revenue 103 34Other income/(expenses) (566) 44Restructure costs – (25)Write-down of non-current assets – (20)Impairment reversal/(losses) 1,114 (2,854)
Profit/(loss) before interest and income tax 1,455 (2,246)
Finance income 53 57Finance costs (183) (170)
Profit/(loss) before income tax 1,325 (2,359)
Income tax (expense)/benefit (200) (204)
Profit/(loss) after income tax 1,125 (2,563)

136 NEWCREST MINING ANNUAL REPORT 2015
Notes to the Consolidated Financial StatementsFor the year ended 30 June 2015
36 DEED OF CROSS GUARANTEE (continued)Consolidated
Statement of Financial Position2015 A$m
2014 A$m
Current assetsCash and cash equivalents 21 15Trade and other receivables 143 235Inventories 205 216Other financial assets 16 14Other assets 38 33
Total current assets 423 513
Non-current assetsOther receivables 1,856 1,449Inventories 8 12Investment in subsidiaries 5,613 5,102Property, plant and equipment 2,192 1,910Exploration, evaluation and development 3,032 2,763Other intangible assets 41 49Deferred tax assets 182 286Other assets 9 9
Total non-current assets 12,933 11,580
Total assets 13,356 12,093
Current liabilitiesTrade and other payables 227 176Borrowings – 112Provisions 108 117Other financial liabilities 15 10
Total current liabilities 350 415
Non-current liabilitiesBorrowings 4,019 3,964Provisions 219 190Deferred tax liabilities 252 124
Total non-current liabilities 4,490 4,278
Total liabilities 4,840 4,693
Net assets 8,516 7,400
EquityIssued capital 13,584 13,593Accumulated losses (5,051) (6,176)Reserves (17) (17)
Total equity 8,516 7,400
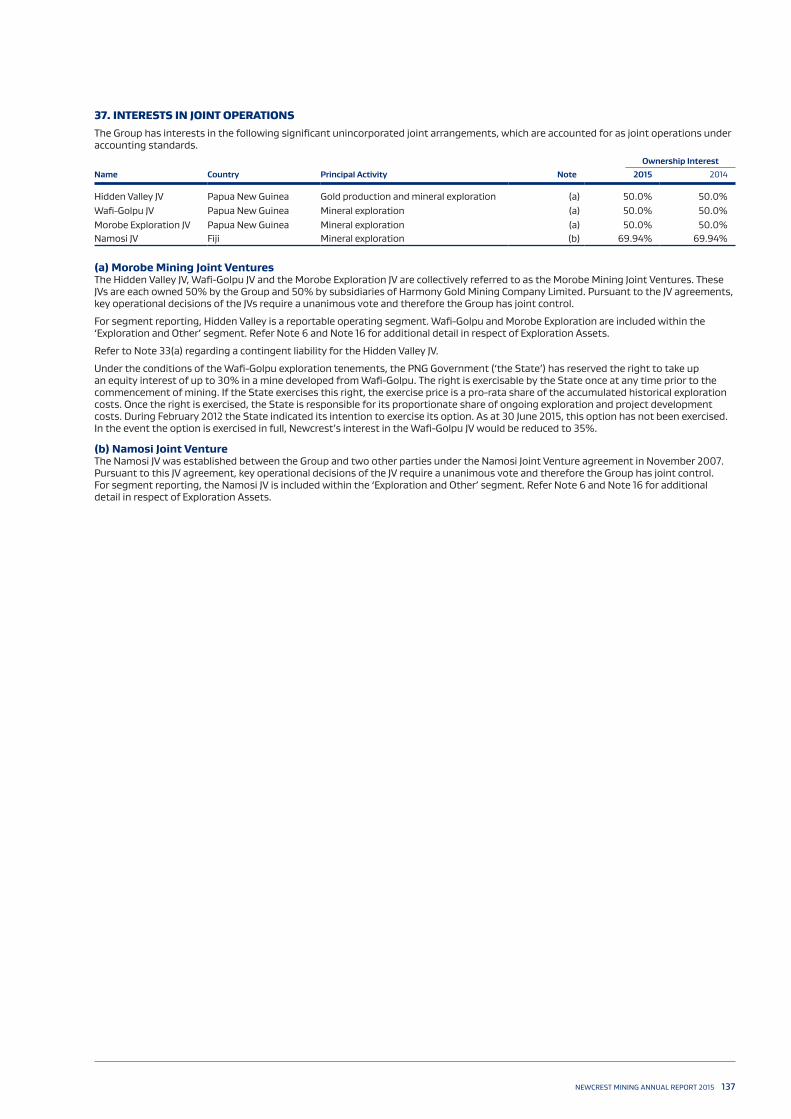
NEWCREST MINING ANNUAL REPORT 2015 137
37. INTERESTS IN JOINT OPERATIONSThe Group has interests in the following significant unincorporated joint arrangements, which are accounted for as joint operations under accounting standards.
Ownership InterestName Country Principal Activity Note 2015 2014
Hidden Valley JV Papua New Guinea Gold production and mineral exploration (a) 50.0% 50.0%Wafi-Golpu JV Papua New Guinea Mineral exploration (a) 50.0% 50.0%Morobe Exploration JV Papua New Guinea Mineral exploration (a) 50.0% 50.0%Namosi JV Fiji Mineral exploration (b) 69.94% 69.94%
(a) Morobe Mining Joint VenturesThe Hidden Valley JV, Wafi-Golpu JV and the Morobe Exploration JV are collectively referred to as the Morobe Mining Joint Ventures. These JVs are each owned 50% by the Group and 50% by subsidiaries of Harmony Gold Mining Company Limited. Pursuant to the JV agreements, key operational decisions of the JVs require a unanimous vote and therefore the Group has joint control.
For segment reporting, Hidden Valley is a reportable operating segment. Wafi-Golpu and Morobe Exploration are included within the ‘Exploration and Other’ segment. Refer Note 6 and Note 16 for additional detail in respect of Exploration Assets.
Refer to Note 33(a) regarding a contingent liability for the Hidden Valley JV.
Under the conditions of the Wafi-Golpu exploration tenements, the PNG Government (‘the State’) has reserved the right to take up an equity interest of up to 30% in a mine developed from Wafi-Golpu. The right is exercisable by the State once at any time prior to the commencement of mining. If the State exercises this right, the exercise price is a pro-rata share of the accumulated historical exploration costs. Once the right is exercised, the State is responsible for its proportionate share of ongoing exploration and project development costs. During February 2012 the State indicated its intention to exercise its option. As at 30 June 2015, this option has not been exercised. In the event the option is exercised in full, Newcrest’s interest in the Wafi-Golpu JV would be reduced to 35%.
(b) Namosi Joint VentureThe Namosi JV was established between the Group and two other parties under the Namosi Joint Venture agreement in November 2007. Pursuant to this JV agreement, key operational decisions of the JV require a unanimous vote and therefore the Group has joint control. For segment reporting, the Namosi JV is included within the ‘Exploration and Other’ segment. Refer Note 6 and Note 16 for additional detail in respect of Exploration Assets.

138 NEWCREST MINING ANNUAL REPORT 2015
Notes to the Consolidated Financial StatementsFor the year ended 30 June 2015
38. INTERESTS IN SUBSIDIARIES WITH MATERIAL NON-CONTROLLING INTERESTSThe Group has a number of subsidiaries with non-controlling interests with the largest non-controlling interest being in PT Nusa Halmahera Minerals (‘PT NHM’). PT NHM is the owner and operator of the Gosowong mine in Indonesia. Summarised financial information in respect of PT NHM is set out below. The summarised financial information below represents amounts before intragroup eliminations.
PT NHM 2015 A$m
PT NHM 2014 A$m
Balance SheetCurrent assets(1) 308 243 Non-current assets 430 351 Current liabilities (48) (31)Non-current liabilities (155) (104)
Net assets 535 459
Non-controlling interests (25% interest) 141 115Equity attributable to owners of the Company 394 344
Total equity 535 459
Income StatementSales revenue 499 484Profit for the year 82 90
Profit attributable to:Non-controlling interests 20 23Owners of the Company 62 67
82 90
Dividends paid to non-controlling interests 24 16
Cash flowsCash flow from/(used in): Operating activities 245 169Investing activities (53) (75)Financing activities (91) (64)
Net increase in cash and cash equivalents 101 30
(1) Includes cash and cash equivalents of A$181 million (2014: A$63 million).
39. EVENTS SUBSEQUENT TO REPORTING DATEThere are no other matters or circumstances which have arisen since 30 June 2015 that have significantly affected or may significantly affect the operations of the Group, the results of those operations or the state of affairs of the Group in subsequent financial years.

NEWCREST MINING ANNUAL REPORT 2015 139
In accordance with a resolution of the Directors of Newcrest Mining Limited, we state that:
1. In the opinion of the Directors:
(a) The financial statements, notes and additional disclosures included in the Directors’ Report designated as audited, of the Group is in accordance with the Corporations Act 2001, including:
(i) Giving a true and fair view of the Group’s financial position as at 30 June 2015 and of its performance for the year ended on that date; and
(ii) Complying with Australian Accounting Standards and Corporations Regulations 2001.
(b) There are reasonable grounds to believe that the Company will be able to pay its debts as and when they become due and payable.
(c) The financial statements and notes thereto are in accordance with International Financial Reporting Standards issued by the International Accounting Standards Board.
2. This declaration has been made after receiving the declarations required to be made to the Directors in accordance with section 295A of the Corporations Act 2001 for the financial year ended 30 June 2015.
3. In the opinion of the Directors, as at the date of this declaration, there are reasonable grounds to believe that the members of the Closed Group identified in Note 34 will be able to meet any obligations or liabilities to which they are, or may become, subject by virtue of the Deed of Cross Guarantee.
On behalf of the Board
Peter Hay Sandeep Biswas Chairman Managing Director and Chief Executive Officer
17 August 2015 Melbourne, Victoria
Directors’ Declaration

140�NEWCREST MINING ANNUAL REPORT 2015
Independent Auditor’s Report
NEWCREST MINING ANNUAL REPORT 2015�141

142 NEWCREST MINING ANNUAL REPORT 2015
CAPITAL (ON 31 AUGUST 2015)
Share Capital 766,510,971Ordinary shareholders 73,806Shareholdings with less than a marketable parcel of $500 worth of ordinary shares 6,267Market price $11.20
NEWCREST TOP 20 INVESTORS AT 31 AUGUST 2015
Name Current BalanceIssued
Capital %
1 HSBC Custody Nominees (Australia) Limited 301,094,196 39.312 National Nominees Limited 148,360,811 19.373 J P Morgan Nominees Australia Limited 106,262,357 13.874 Citicorp Nominees Pty Limited 72,337,732 9.445 BNP Paribas Nominees Pty Ltd 11,252,796 1.476 Citicorp Nominees Pty Limited 6,886,267 0.907 HSBC Custody Nominees (Australia) Limited – A/C 2 5,882,286 0.778 National Nominees Limited 4,705,251 0.619 HSBC Custody Nominees (Australia) Limited 4,517,971 0.5910 AMP Life Limited 2,322,431 0.3011 HSBC Custody Nominees (Australia) Limited 1,536,222 0.2012 SBN Nominees Pty Limited 1,500,000 0.2013 UBS Nominees Pty Ltd 881,250 0.1214 Pacific Custodians Pty Limited 861,920 0.1115 ABN Amro Clearing Sydney Nominees Pty Ltd 861,514 0.1116 Pacific Custodians Pty Limited 764,105 0.1017 Bond Street Custodians Limited 702,926 0.0918 National Nominees Limited 662,321 0.0919 HSBC Custody Nominees (Australia) Limited – GSCO ECA 653,236 0.0920 BNP Paribas Nominees Pty Ltd 603,058 0.08
Total 672,648,650 87.82
SUBSTANTIAL SHAREHOLDERS AT 31 AUGUST 2015
Commonwealth Bank of Australia 9.69First Eagle Investment Management 9.33Blackrock 9.18Orbis Group 5.43
INVESTOR CATEGORIES AT 31 AUGUST 2015
Ranges Investors SecuritiesIssued
Capital %
1 – 1,000 54,453 18,293,523 2.391,001 – 5,000 16,750 36,342,049 4.745,001 – 10,000 1,721 12,368,399 1.6110,001 – 100,000 823 17,610,729 2.30100,001 and Over 59 681,896,271 88.96
Total 73,806 766,510,971 100.0
Shareholder Information

NEWCREST MINING ANNUAL REPORT 2015 143
VOTING RIGHTSEach ordinary shareholder present at a general meeting (whether in person, by proxy or by representative) is entitled to one vote on a show of hands or, on a poll, one vote for each fully paid ordinary share held.
The Company encourages shareholders to express their views on the conduct of business by speaking at shareholder meetings or by writing to the Chairman of the Board of Directors.
DIVIDENDSThe Board has determined that there will be no final dividend for the year ended 30 June 2015. No interim dividend was paid. The Dividend Reinvestment Plan (DRP) remains in place and will be offered to shareholders according to the terms of the DRP. A copy of the DRP is on the Company’s website at www.newcrest.com.au.
ON MARKET BUY-BACKNewcrest has a current on-market buy-back program. There has been no activity under the program since April 2012.
US INVESTOR INFORMATIONNewcrest may also be traded in the form of American Depositary Receipts (ADRs). Each ADR represents one Newcrest ordinary share. The program is administered on behalf of the Company by The Bank of New York, and enquiries should be directed in writing to: The Bank of New York Mellon Shareholder Services, PO Box 358516 Pittsburgh, PA 15252-8516.
ADR holders are not members of the Company, but may instruct The Bank of New York as to the exercise of voting rights pertaining to the underlying shareholding.
During the year, the net movement for ADRs was negative 712,393 and at year-end a net 3,905,887 ADRs were outstanding.
INVESTORSThe Company’s website at www.newcrest.com.au/investors has a section where investors have access to market releases, reports, presentations, dividend history, shareholder information, key dates and other information.
SHARE REGISTRY INFORMATION
Accessing and updating information onlineVisit the Company’s Share Registry, Link Market Services, at www.linkmarketservices.com.au to access a wide variety of your holding information, make the following changes online or download forms. You can:
– check your current holding and balances; – update your electronic communication instructions; – update your address and bank details; – confirm whether you have lodged your Tax File Number (TFN), Australian Business Number (ABN) or exemption; – check transaction and dividend history; – enter your email address; – download a variety of instruction forms; – add or update DRP instructions; – lodge your proxy online for the Annual General Meeting (AGM); and – subscribe to email announcements.
You can access your holding via a secure login using your Securityholder Reference Number (SRN) or Holder Identification Number (HIN), which you will find on your holding record. You will also need the postcode recorded on your holding record.
ANNUAL REPORTYou can access a full copy of the Annual Report online at www.newcrest.com.au. If you no longer wish to receive a hard copy of the Annual Report, log into your shareholding or contact our share registry to update your shareholder communication instructions.
CONTACT INFORMATIONYou can also contact the Company’s Share Registry by calling 1300 554 474 or from outside Australia +61 1300 554 474. More Share Registry contact details are set out in the Corporate Directory section of this Report, which is inside the back cover.

144 NEWCREST MINING ANNUAL REPORT 2015
Five Year SummaryFor the year ended 30 June 2015
For the 12 months ended 30 June 2015 2014 2013(1) 2012 2011
Gold Production – Newcrest Share(2)(3) (ounces)Cadia Hill – 21,141 119,372 241,430 364,196 Ridgeway 223,381 345,364 262,228 223,314 147,904 Cadia East(4) 444,038 226,326 65,279 8,451 3,320 Telfer 520,309 536,342 525,500 540,114 621,291 Gosowong 331,555 344,747 312,711 439,384 463,218 Hidden Valley 94,601 105,845 85,004 88,801 100,232 Lihir(2) 688,714 721,264 649,340 604,336 639,256 West Africa(2) 119,970 94,994 90,350 92,102 41,235 Cracow(3) – – – 23,787 71,206 Mt Rawdon(2)(3) – – – 24,198 75,494
Total 2,422,568 2,396,023 2,109,784 2,285,917 2,527,352
Copper Production (tonnes) 96,816 86,118 80,366 76,015 75,631
Silver Production (ounces) 2,181,419 2,324,210 1,931,816 1,997,247 1,895,610
Costs per ounce (after by-product credits)Cash costs (A$ per ounce) 760 707 750 603 493 All-In Sustaining Cost (A$ per ounce) 941 976 1,283 N/A N/A All-In Sustaining Cost (US$ per ounce) 789 897 1,318 N/A N/A
Cash Flow (A$m)Cash flow from operations 1,589 1,037 1,147 1,726 1,729 Exploration expenditure 46 62 152 158 126 Capital expenditure 564 843 2,386 2,556 1,890 Free cash flow (5) 1,086 133 (1,417) (1,029) (565)
Profit and Loss (A$m)Sales revenue 4,344 4,040 3,775 4,416 4,102 Depreciation and amortisation (693) (693) (728) (561) (515)Income tax expense/(benefit) 414 (510) (419) (402) (334)Net profit after tax:
– Statutory profit(6) 546 (2,221) (5,783) 1,117 908 – Underlying profit(7) 515 432 446 1,084 1,058
Earnings per share (EPS): – Basic EPS on statutory profit/(loss) (cents per share) 71.2 (289.8) (755.1) 146.0 126.4 – Basic EPS on underlying profit (cents per share) 67.2 56.4 58.2 141.7 147.3
Dividend (cents per share)(8) – – 12.0 35.0 50.0
Financial Position (A$m)Total assets 15,368 13,587 17,073 20,509 17,282 Total liabilities 6,309 5,880 7,071 5,415 3,407 Total equity 9,059 7,707 10,002 15,094 13,875
Ratios (percent)Gearing(9) (percent) 29.3 33.8 29.3 12.5 4.2 Return on Capital Employed(10) (percent) 8.0 6.4 4.8 10.1 12.4
Issued Capital (million shares) at year end 767 767 767 765 765
Gold Inventory (million ounces)(11)
Reserves 75 78 87 79 80 Resources 140 150 161 150 148
(1) Financial information for 2013 has been restated to reflect the adoption of interpretation 20 – Stripping Costs in the Production Phase of a Surface Mine.(2) Production from the former LGL operations included from the acquisition date of 30 August 2010.(3) Production from Cracow and Mt Rawdon in 2012 includes four months of production, up to the date of divestment of 2 November 2011.(4) Includes pre-commissioning production.(5) Free cash flow is calculated as cash flow from operating activities less cash flow related to investing activities.(6) Statutory Profit is profit/(loss) after tax attributable to owners of the parent.(7) Underlying Profit is profit after tax before significant items attributable to owners of the parent.(8) Dividends in 2011 include a special dividend of 20 cents per share.(9) Calculated as Net Debt to Capital (Capital comprises Total Equity plus Net Debt). (10) Calculated as EBIT to Average Capital Employed (Total Equity plus Net Debt).(11) Reserves and Resources are as at 31 December 2014 for 2015, 31 December 2013 for 2014, 31 December 2012 for 2013 and 31 December 2011 for 2012.
2011 Reserves and Resources are at 30 June 2011.
Corporate Directory
INVESTOR INFORMATION
Registered and Principal Offi ceNewcrest Mining LimitedLevel 9600 St Kilda RoadMelbourne, Victoria 3004AustraliaT: +61 (0)3 9522 5333F: +61 (0)3 9525 2996E: [email protected]
Company Secretaries Francesca Lee and Claire Hannon Newcrest Mining Limited Level 9600 St Kilda RoadMelbourne, Victoria 3004AustraliaT: +61 3 9522 5333F: +61 3 9521 3564E: [email protected]
Investor RelationsChris MaitlandHead of Investor RelationsLevel 9600 St Kilda RoadMelbourne, Victoria 3004AustraliaT: +61 3 9522 5717E: [email protected]
STOCK EXCHANGE LISTINGS
Australian Stock Exchange(Ticker NCM)Port Moresby Exchange(Ticker NCM)New York ADRs(Ticker NCMGY)
Share RegistryLink Market Services LimitedLevel 1333 Collins StreetMelbourne, Victoria 3000AustraliaLocked Bag A14Sydney South, New South Wales 1235AustraliaT: +61 1300 554 474 (toll free within Australia)F: +61 (0)2 9287 0303+61 (0)2 9287 0309**For faxing of Proxy Forms only.E: [email protected] www.linkmarketservices.com.au
PNG Registries Limited Level 2, AON Haus McGregor StreetPort Moresby NCD121PO Box 1265 Port Moresby, NCD, PNG T: (675) 321 6377/ 78F: (675) 321 6379 E: [email protected]
American Depositary Receipts (ADRs) The Bank of New York Mellon Shareholder ServicesPO Box 358516Pittsburgh, PA 15252-8516 USAT: Toll Free for US domestic callers: 1-888-269-2377International Callers: +1 201-680-6825E: [email protected]/shareowner
OTHER OFFICES
Perth and Telfer Offi ce234 Railway ParadeWest Leederville WA 6007T: +61 (0)8 9270 7070
Port Morseby Offi ceLevel 4Port Tower Building Hunter StreetPort Moresby, Papua New GuineaT: + 675 321 7711F: + 675 321 4705
COMPANY EVENTS
Annual General Meeting29 October 2015 at 10.30amClarendon AuditoriumMelbourne Convention and Exhibition Centre2 Clarendon StreetSouth Wharf Melbourne, Victoria 3006
Visit our website at www.newcrest.com.au to view our key dates; current share price; market releases; annual, quarterly and financial reports; operations, project and exploration information; corporate, shareholder, employment and sustainability information.

New
crest Mining Lim
ited ABN
20 005 683 625 A
nnual Report 20
15