
New trends in China energy consumption · Coal consumption: Outlook changed completely in a few...
13
New trends in China energy consumption
Transcript of New trends in China energy consumption · Coal consumption: Outlook changed completely in a few...

New trends in China energy
consumption

Coal consumption: Outlook changed completely in
a few short years
0
500
1000
1500
2000
2500
2000 2002 2004 2006 2008 2010 2012 2014 2016 2018
Mto
e
China coal use vs. IEA forecast (Dec 2014)
Data IEA forecast NEA forecast (Apr 2016)
0
50
100
150
200
250
300
350
400
450
500
20
08
20
09
20
10
20
11
20
12
20
13
20
14
20
15
20
16
Mt
China coal imports vs. Peabody projection (2012)
Data Peabody: low Peabody: high

-0.50
0.00
0.50
1.00
1.50
2.00
2.50
3.00
3.50
4.00
4.50
5.00
2005 2006 2007 2008 2009 2010 2011 2012 2013 2014 2015 2016 2017 2018 2019 2020
bill
ion
to
nn
es
China's implied coal consumption vs. IEA 450ppm scenario
(12-month sum)
Net Imports Production
Stock changes Consumption (Implied)
Consumption, IEA 450ppm scenario

-121
47
2511
3628
-66
57
13 4 1927
-140
-120
-100
-80
-60
-40
-20
0
20
40
60
80
Thermal power Hydropower Wind Solar Nuclear Demand
tera
wat
t-h
ou
rs
Growth in electricity generation by source
2015
2016H1

What does consumption-driven growth mean for energy use?
0
100
200
300
400
500
600
700
800
900
1000
Light industry Chemicals Cement&Glass Iron&Steel Non-ferrous metals Other heavyindustry
Services ResidentialConsumption
gce
/ yu
an v
alu
e ad
ded
Direct energy use intensity by sector
Coal and coke Petroleum Electricity Other energy
Calculated from China Energy Statistical Yearbook 2015
Heavy industry sectors will have to adjust to lower levels of investment in real estate, industrial capacity and infrastructure, and to saturated export markets industrial coal consumption will continue to fall

Lots of room to strengthen targets

Implications for air pollution:Industrial clusters still dominate emissions (SO2,
2014-2015 average)
DU

>50% of oil consumption tied
to heavy industry,
<20% to passenger transport
Legend
Linked to overcapacity sectors
Linked to consumer demand
Oil use declines with energy system modernization
Others
Oil refining11%
Chemicals12%
Construction materials
4%
Other industry11%
Construction7%Agriculture
4%
Transport: Gasoline10%
Transport: Diesel23%
Transport: Kerosene5%
Buildings3%
Others10%
Breakdown of China's oil consumption by sector (2014)
Outlook for oil
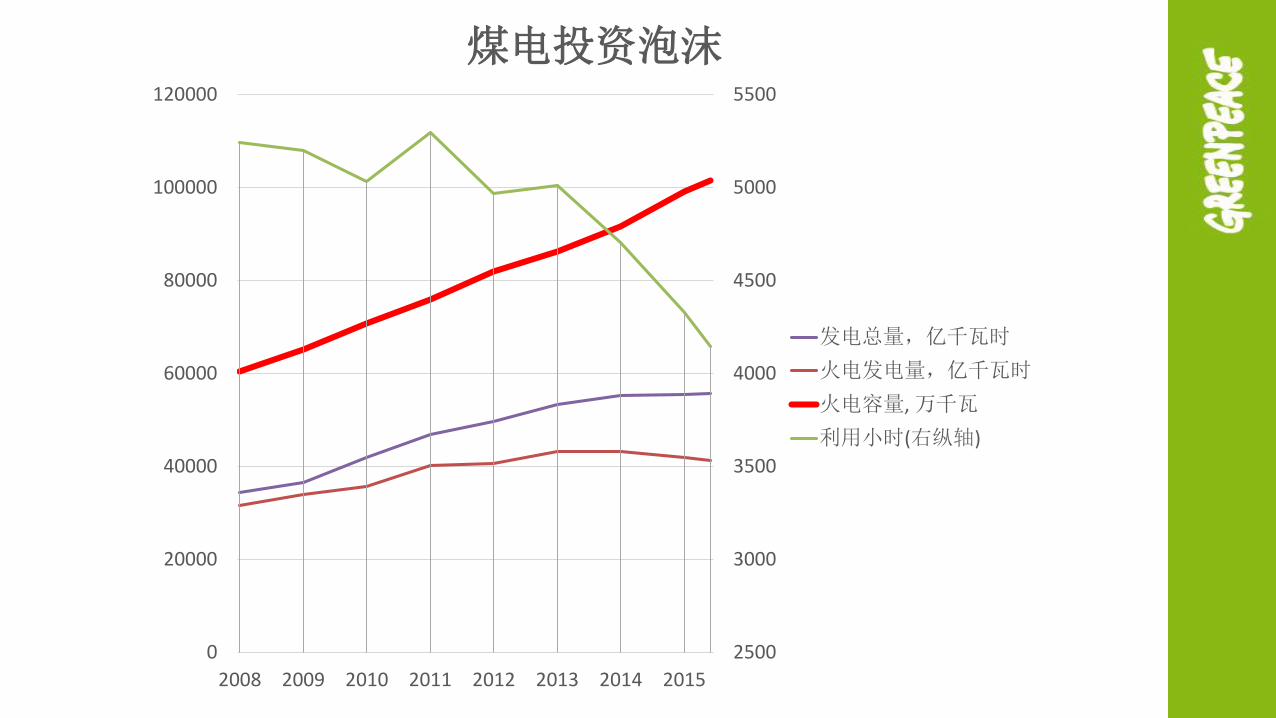
2500
3000
3500
4000
4500
5000
5500
0
20000
40000
60000
80000
100000
120000
2008 2009 2010 2011 2012 2013 2014 2015
煤电投资泡沫
发电总量,亿千瓦时
火电发电量,亿千瓦时
火电容量, 万千瓦
利用小时(右纵轴)

合理的容量水平*
*基于5000小时利用率


Key messages
• Coal is in structural decline
• Era of fast CO2 growth is over; timing of CO2 peak depends
on success in clean energy growth and transitioning to
economic “new normal”
• Economic restructuring is an enormous opportunity for
climate, environment and improving living standards
• But: overcapacity and downscaling of the heavy industry
complex present enormous institutional challenges
• Incredibly and unexpectedly fast progress in reducing
emissions gives China a once-in-a-lifetime opportunity to
play a key positive role in international climate policy

Thank you!