NEW SOUTH WALES DRUG COURT EVALUATION: COST-EFFECTIVENESS · 2014-12-11 · New South Wales Drug...
81
NEW SOUTH WALES DRUG COURT EVALUATION: COST-EFFECTIVENESS Bronwyn Lind Don Weatherburn Shuling Chen NSW BUREAU OF CRIME STATISTICS AND RESEARCH & Marian Shanahan Emily Lancsar Marion Haas Richard De Abreu Lourenco CENTRE FOR HEALTH ECONOMICS RESEARCH AND EVALUATION
Transcript of NEW SOUTH WALES DRUG COURT EVALUATION: COST-EFFECTIVENESS · 2014-12-11 · New South Wales Drug...
i
New South Wales Drug Court Evaluation: Cost-effectiveness
NEW SOUTH WALESDRUG COURT EVALUATION:
COST-EFFECTIVENESS
Bronwyn LindDon Weatherburn
Shuling Chen
NSW BUREAU OF CRIME STATISTICS AND RESEARCH
&
Marian ShanahanEmily LancsarMarion Haas
Richard De Abreu Lourenco
CENTRE FOR HEALTH ECONOMICS RESEARCH AND EVALUATION
ii
New South Wales Drug Court Evaluation: Cost-effectiveness
2002
Published by the NSW Bureau of Crime Statistics and Research
Attorney General’s Department
Level 8
St James Centre
111 Elizabeth Street
Sydney
Phone: (02) 9231 9190
Fax: (02) 9231 9187
Email: [email protected]
ISBN 0 7313 2643 1
Website: www.lawlink.nsw.gov.au/bocsar
iii
New South Wales Drug Court Evaluation: Cost-effectiveness
PREFACE
The present report is one of a series of studies conducted by the NSW Bureau of CrimeStatistics and Research evaluating the NSW Drug Court trial. Other reports in this seriesmonitor key aspects of the Court’s operation and investigate changes in the health andsocial functioning of Drug Court participants.
In this report we examine an issue central to the creation of the NSW Drug Court: namelyits cost-effectiveness, compared with conventional sanctions, in reducing drug-relatedcrime. We were particularly fortunate in undertaking this evaluation, to receive the supportand cooperation of the Drug Court and the Attorney General in evaluating the DrugCourt using a randomised controlled trial. Randomised controlled trials, in whichindividuals are randomly allocated to ‘treatment’ and ‘control’ groups are recognised asbeing the ‘gold standard’ when it comes to outcome evaluation. They provide moreassurance of control over extraneous factors which might otherwise bias an evaluationthan any other form of research design. To our knowledge, this is the first occasion onwhich a criminal justice program in Australia has been evaluated using a randomisedcontrol design.
The evaluation is a first in one other way as well. Very few evaluations of criminal justiceor crime prevention programs (either in Australia or overseas) pay much heed to the costof the program. This greatly hampers the capacity of Government to make rationaldecisions about the allocation of scarce resources across competing programs. Of course,decisions on programs which affect the liberty of citizens cannot, and should not, bemade on the grounds of cost-effectiveness alone. Nevertheless it is to be hoped that ourefforts will convince others of the feasibility and value of introducing cost-effectivenessanalyses into criminal justice evaluation.
Dr Don WeatherburnDirector
February 2002
iv
New South Wales Drug Court Evaluation: Cost-effectiveness
ACKNOWLEDGEMENTS
The authors would like to acknowledge the staff of the following departments andorganisations for their assistance in collecting and understanding data on resource useand expenditures:
The Drug Court team
NSW Health
Wentworth Area Health Service
Western Sydney Area Health Service
South Western Sydney Area Health Service
Corrections Health Service
NSW Department of Corrective Services, including Probation and Parole
NSW Attorney General’s Department
Legal Aid Commission of NSW
Parramatta Court Registry
Office of the Director of Public Prosecutions.
The NSW Department of Corrective Services also provided data on imprisonment episodesfor the subjects included in the study.
Thanks are also due to Karen Freeman and Marilyn Chilvers, our colleagues in the Bureauof Crime Statistics and Research, for valuable critical feedback on the draft report.
v
New South Wales Drug Court Evaluation: Cost-effectiveness
CONTENTS
PREFACE . . . . . . . . . . . . . . iii
ACKNOWLEDGEMENTS . . . . . . . . . . . iv
EXECUTIVE SUMMARY . . . . . . . . . . . vii
ABBREVIATIONS . . . . . . . . . . . . . ix
INTRODUCTION . . . . . . . . . . . . . 1
PREVIOUS RESEARCH . . . . . . . . . . . . 1
Effectiveness . . . . . . . . . . . . 1
Cost . . . . . . . . . . . . . . 6
THE NSW DRUG COURT . . . . . . . . . . . 7
Court referrals and the conventional judicial process . . . . . . 8
Participant classification in the trial . . . . . . . . . 8
Resource and service flows . . . . . . . . . . 11
METHOD . . . . . . . . . . . . . . 13
ECONOMIC EVALUATION . . . . . . . . . . . 13
EFFECTIVENESS . . . . . . . . . . . . . 14
Subjects included in the study . . . . . . . . . . 14
Measures of effectiveness . . . . . . . . . . 16
Sources of data . . . . . . . . . . . . 16
COSTS AND COST-EFFECTIVENESS . . . . . . . . . . 17
The evaluation process . . . . . . . . . . . 17
Data collection . . . . . . . . . . . . 20
Estimating costs for the treatment group . . . . . . . . 22
Drug Court expenditures . . . . . . . . . . 23
Treatment costs . . . . . . . . . . . 25
Urine screens . . . . . . . . . . . . 26
Detoxification/treatment planning costs . . . . . . . . 26
Department of Corrective Services (DCS) costs . . . . . . . 27
Sanctions . . . . . . . . . . . . 28
Probation and Parole services . . . . . . . . . 29
vi
New South Wales Drug Court Evaluation: Cost-effectiveness
Estimating costs for the control group . . . . . . . . . 29
General methodology . . . . . . . . . . . 29
Assessment costs . . . . . . . . . . . 30
Sentencing costs . . . . . . . . . . . 30
Penalty costs . . . . . . . . . . . . 32
Total cost and average cost per day for the Drug Court control group . . . 33
Key issues in the cost of the control group . . . . . . . 33
Summary of cost components used for treatment and control groups . . . . 34
RESULTS . . . . . . . . . . . . . . 35
EFFECTIVENESS . . . . . . . . . . . . . 35
Description of the sample . . . . . . . . . . 35
The follow-up period . . . . . . . . . . . 36
Time to first offence . . . . . . . . . . . 37
Offending frequency . . . . . . . . . . . 44
The ‘termination’ effect . . . . . . . . . . . 45
Free time to first offence . . . . . . . . . . 47
Elapsed time to first offence . . . . . . . . . . 49
Offending frequency based on free time . . . . . . . . 50
Offending frequency based on elapsed time . . . . . . . 53
ECONOMIC EVALUATION . . . . . . . . . . . 55
Costs . . . . . . . . . . . . . . 55
What if the Drug Court did not exist? . . . . . . . . . 57
Cost-effectiveness analyses . . . . . . . . . . 57
Sensitivity analysis . . . . . . . . . . . 59
Start-up costs . . . . . . . . . . . . 60
DISCUSSION . . . . . . . . . . . . . 62
CONCLUSION . . . . . . . . . . . . . 66
NOTES . . . . . . . . . . . . . . . 67
REFERENCES . . . . . . . . . . . . . 68
APPENDIX: DATA COLLECTION FORMS . . . . . . . . 71
vii
New South Wales Drug Court Evaluation: Cost-effectiveness
EXECUTIVE SUMMARY
A group of 309 participants in the NSW Drug Court program (i.e. treated subjects) werecompared with a randomised control group of 191 offenders deemed eligible for theprogram but sanctioned in the usual way (which, for the most part, meant imprisonment).The object of the comparison was to assess both the effectiveness and cost-effectiveness ofthe Drug Court in reducing recidivism.
Recidivism was measured in terms of the time to the first drug-related offence (which wasdealt with in court), and the frequency of such offences, after referral to the Drug Courtprogram.
The average lengths of the follow-up periods for the two groups were 369 days for thetreated subjects and 294 days for the control subjects. The recidivism measures werecalculated both in terms of ‘free time’ (time spent out of custody) and ‘elapsed time’ (timefrom referral to the end of the observation period).
The offence categories examined included break, enter and steal; fraud; larceny by shopstealing; other larceny; unlawful possession (of stolen goods); possess/use opiates;possess/use cannabis; possess/use other drug; and deal/traffic opiates. Combinationsof these offence groups were also examined. Robbery was not included because personscharged with violent offences are not eligible to enter the Drug Court program.
In the ‘free time’ analysis treated subjects were found to take significantly longer than thecontrol group to their first shop stealing and their first drug offence. Treated subjects alsooutperformed the control group in having lower rates of offending for most catgegories ofoffence. It should be noted, however, that the differences between the groups for theseoffences were only significant for drug offences.
In the ‘elapsed time’ analysis the treatment and control groups performed equally wellfor all offences but, as with the ‘free time’ analysis, the treated subjects were found to havelonger elapsed times for their first drug offence. Treated subjects, on the other hand, werefound to have significantly higher rates of fraud offences than the control group.
A second set of analyses was conducted, comparing time to the first offence (dealt with incourt) and frequency of offending, among those retained on the Drug Court program,those rejected from the program (after placement on it), and those placed in the controlgroup. These analyses controlled for factors which might have biased the outcome of thecomparisons (e.g. differences between the groups in terms of age, gender, prior criminalrecord and prior imprisonment).
In this second set of analyses, non-terminated Drug Court participants performed betterthan treated subjects whose program had been terminated, and better than control groupsubjects, in terms of both free time to the first offence and offending frequency (per unit offree time) for shop stealing, other larceny, and unlawful possession. Non-terminatedDrug Court participants also performed better than terminated treated subjects on both ofthe free time recidivism measures for break, enter and steal.
Similar results to those described above were obtained for elapsed time. Non-terminatedtreated subjects took longer than terminated treated subjects to the first theft or drugoffence dealt with in court. They also had lower overall rates of theft and drug offences.
viii
New South Wales Drug Court Evaluation: Cost-effectiveness
The estimated total cost of the Drug Court program for the 309 participants who formedpart of the cost-effectiveness analysis was $13,495,727. More than half of this amount($8,805,146) was expended on individuals who were terminated from the Drug Courtprogram.
Although health care treatment ($3,352,341) and court attendances ($2,846,362) were thesingle most important contributors to the overall cost of the Drug Court program, the costof sanctioning those placed on the program ($1,417,677) was also significant.
The cost per day for an individual placed on the Drug Court program ($143.87) wasslightly less than the cost per day for offenders placed in the control group and sanctionedby conventional means ($151.72).
There was little difference between the Drug Court and conventional sanctions in termsof their cost-effectiveness in increasing the time to the first offence. There was a largerdifference between the alternatives in terms of the cost-effectiveness of reducing the rate ofoffending. It cost nearly $5,000 more for each shop stealing offence averted usingconventional sanctions, and additional $19,000 for each possess/use opiates offenceaverted, than it cost using the Drug Court program.
Future efforts to improve the cost-effectiveness of the NSW Drug Court should seek to (a)improve its ability to identify offenders who will benefit from the program (b) terminatethe Drug Court involvement of those unsuited to the program at an earlier point in time (c)improve the match between offenders and treatment programs (d) develop more realisticgraduation criteria and (e) improve the level of coordination between agencies involvedin the program.
ix
New South Wales Drug Court Evaluation: Cost-effectiveness
ABBREVIATIONS
AGD NSW Attorney General’s Department
AHS Area Health Service
CHS Corrections Health Service
CSO Community Service Order
DCS NSW Department of Corrective Services
DPP Office of the (NSW) Director of Public Prosecutions
MRRC Metropolitan Reception and Remand Centre
NSW New South Wales
P&P Probation and Parole
SWAHS South Western Sydney Area Health Service
US United States of America
WAHS Wentworth Area Health Service
WSAHS Western Sydney Area Health Service
1
New South Wales Drug Court Evaluation: Cost-effectiveness
INTRODUCTION
This is the final report in a series of six evaluating the NSW Drug Court (hereafter ‘DrugCourt’) program. The first report (Freeman, Karski & Doak 2000) provided summary dataon the operation of the Court during its first twelve months of operation. The secondreport (Briscoe & Coumarelos 2000) extended the analysis of program flows andparticipant characteristics into the first 17 months of the Court’s operation. The thirdreport (Freeman 2001) provided interim findings from a study into changes in the healthand social functioning of Drug Court participants. The fourth report (Freeman 2002)completes the analysis of changes in health and social functioning. The fifth report (Taplin2002) presents a process evaluation of the Drug Court. The present report examines thecost-effectiveness of the Drug Court.
The stated aim of the NSW Drug Court is to ‘reduce the level of criminal activity thatresults from drug dependency’ (NSW Drug Court Act 1998, s.3). The effectiveness of theDrug Court program in reducing crime is therefore clearly central to any assessment ofwhether the Act is achieving its stated purpose. The Drug Court program is specificallydesigned to provide a new sentencing alternative for those whose crime is drug-related.For this reason it makes sense to judge the success of the Drug Court by comparing it, interms of cost-effectiveness, with conventional sentencing alternatives. The present studydoes this by comparing the cost-effectiveness of the Drug Court in reducing re-offendingwith that of a randomised control group deemed eligible for the Drug Court program but,due to a shortage of places on the program, sanctioned in the conventional way.
The report is divided into four main sections. In the remainder of this chapter we reviewthe literature on the effectiveness and cost of drug courts in reducing crime and describethe structure and operation of the NSW Drug Court program. In the chapter which followswe provide a detailed account of the methods used to evaluate the cost and effectivenessof the NSW Drug Court in comparison with traditional sanctions. In the third chapter wepresent the results of our evaluation, first in terms of effectiveness and then in terms ofcost-effectiveness. In the final chapter we summarise our findings and discuss their policyimplications.
PREVIOUS RESEARCH
EffectivenessDrug courts emerged in the United States (US) in response to the rapid growth in arrestsand build up in court backlogs which followed the US ‘War on Drugs’. Between 1984 and1999, the number of defendants charged with a drug offence in US Federal courts rosefrom 11,854 to 29,306. This growth in the number of people prosecuted and imprisonedfor a drug offence might have been enough on its own to force a rethink of the cost-effectiveness of conventional sanctions in managing drug-related crime. As it happened,the rapid growth in prisoner numbers coincided with rising bureaucratic and politicalscepticism about the effectiveness of prison in dealing with drug offenders (US Departmentof Justice 1997, p. 6).
Drug courts proved to be an extremely popular solution to this problem. The first drugcourt was established in Dade County in Florida in 1989. By 1994 there were 41 drugcourts operating in the US. By the end of 1995 that figure had doubled. By the end of 1997it had doubled again (General Accounting Office 1997). Estimates vary but by 1998 there
2
New South Wales Drug Court Evaluation: Cost-effectiveness
were somewhere between 200 and 420 drug courts operating in the United States (Inciardi,McBride & Rivers 1996; General Accounting Office 1997) and several other countrieshave since followed the US lead. The United Kingdom passed the Crime and Disorder Actin 1998, creating scope for the introduction of a drug court program in that country. Drugcourts are also being established in Ireland and Canada (Freiberg 2000). At the time ofwriting, New South Wales, Victoria, Queensland, Western Australia and South Australiahave all either introduced or are introducing some form of drug court (Freiberg 2000;Makkai 1998).
Drug court programs are a form of ‘coerced treatment’. Coerced treatment is not a newdevelopment (see Hall 1997). Courts in the US (and elsewhere) have been referring offenderswith alcohol and drug problems to treatment for decades, whether as a condition of bailor on the promise of less severe punishment. Drug court programs differ from other formsof coerced treatment in that participants in such programs are typically supervised by ateam of people (usually the defendant’s legal representative as well as representativesfrom the prosecution, probation and treatment services), led by the sentencing judge.They are subjected to very intensive supervision, often including frequent and/or randomurine checks. Non-compliance with program rules is usually attended by some form ofimmediate sanction. Progress in achieving program goals is also often explicitly rewarded.
There are good reasons for expecting drug courts to be effective in reducing drug-relatedcrime. Research has shown strong direct and indirect links between drug use andfrequency of offending (Blumstein, Cohen, Roth & Visher 1986). Treatment has been shownto be effective in reducing drug consumption and crime (Hall 1996; Hall 1997). Retentionrates appear to be higher in coerced than in voluntary treatment (Belenko 1998, p. 19) Theintensive supervision, clear rules and sanctions and rewards which characterise drugcourts would seem to maximise the likelihood of retention in treatment. Research hasshown that treatment outcomes are generally better, the longer drug users are retained intreatment (Anglin 1988 cited in Belenko 1998). It seems reasonable to suppose, then, thatcoercing drug users into treatment should reduce their drug use and thereby reduce theirlevels of criminal activity.
The proliferation of drug courts has been accompanied by a burgeoning research literatureon their effectiveness. Before reviewing this literature it should be pointed out that thepolitical impetus for the creation of drug courts in Australia has had far more to do withwidespread public concern over drug-related crime than with public, political or judicialconcern over the effect of drug arrests or drug laws on court congestion. Thus while manyUS evaluations of drug courts have examined their impact on court efficiency, in whatfollows, we deal solely with research into the effectiveness or cost-effectiveness of drugcourts in reducing drug use and drug-related crime.
A number of reviews of the drug courts have been conducted (e.g. Prendergast & Maugh1995; Bean 1996; Brown 1997), however the leading reviews have been conducted byBelenko (1998; 2001). In his first review Belenko (1998) examined some 30 evaluationscovering 24 drug courts. On the basis of this review Belenko (1998, p. 27) concluded thatdrug courts are effective in reducing drug use and criminal behaviour while participantsremain on the program (Belenko 1998, p. 33). In his follow-up report (Belenko 2001)Belenko reviewed evaluations published between June 1999 (the cut-off date for his firstreport) and April 2001, and reached essentially similar conclusions. As he himself pointsout, however, many evaluations of drug courts are marred by serious methodologicalweaknesses. Those which do suffer from these weaknesses, do not uniformly produceencouraging findings. In what follows we restrict ourselves to evaluations published inrefereed journal articles.

3
New South Wales Drug Court Evaluation: Cost-effectiveness
Goldkamp (1994), for example, found that participants in Miami’s drug court had lowerrecidivism rates than individuals prosecuted for non-drug felony offences and individualsprosecuted for felony drug offences not dealt with by the drug court. That study, however,made no allowance for differences between the groups in time over which they werefollowed up. Nor was there any report of efforts to control for pre-existing differencesbetween the groups in risk of re-offending.
Gottfredson, Coblentz & Harmon (1997) reported lower recidivism rates amongparticipants in the Baltimore Drug Court program than among a group of defendantswhose offences were known to have drug or alcohol problems and who were matchedwith the Drug Court group in terms of offence, age, gender and follow-up period. However,although Gottfredson et al. acknowledge the existence of numerous other differencesbetween participants in the Drug Court program and regular probationers (Gottfredsonet al., 1997, p. 35) no attempt was made to control for these differences in analysing therecidivism data.
Vito and Tewksbury (1999) reported lower recidivism rates among participants inKentucky’s drug court program than among those deemed eligible for the program butwho elected not to participate in it. But the lower recidivism rate among Drug Courtparticipants may simply reflect the fact that those who elected to participate in the programwere more motivated to reduce their drug use and criminal activity than those who electednot to participate in it.
Applegate and Santana (2000) evaluated the effect of Orange County’s Juvenile DrugCourt program by comparing recidivism rates among those who participated in theprogram and were not breached with those who were placed on the program but laterexpelled from it. Re-offending rates were lower among Drug Court participants thanamong those who were rejected from the program. Drug Court participants also tooklonger, on average to re-offend. Given that re-offending may be one of the reasons forexpulsion from the program, however, these results are hardly surprising.
The better conducted studies have produced more mixed results, but many of these studiesalso have design problems.
Granfield, Eby & Brewster (1998) evaluated the Denver Drug Court program. This programinvolved seven different treatment levels, each representing progressively stricter treatmentregimes. Level 1 involved no treatment other than ‘normal’ supervision. The seventh levelwas reserved for offenders who are judged to be at extremely high risk of offending andwho showed evidence of psychopathology. Standardised tests were employed on entry toallocate offenders to appropriate treatment levels. For the purposes of the evaluationparticipants in the Denver Drug Court program were treated as one group although noparticipants were included who had been placed on treatment level seven. For reasonsnot explained by Granfield et al. these individuals are not monitored by the Denver DrugCourt after their treatment assignment.
To evaluate the program Granfield et al. compared parole revocations and rearrest ratesamong a random sample of drug court defendants and two random samples of defendantscharged with narcotic offences in Denver prior to the establishment of the drug court. Thetwo comparison samples differed only in that one was drawn from court filings during1992-93 and the other was drawn from court filings during 1993-94. No significantdifferences between the treatment group and the comparison groups were found in relationto gender, age or previous criminal history. Offenders were followed up for a period oftwelve months.
4
New South Wales Drug Court Evaluation: Cost-effectiveness
The results of this evaluation revealed no significant differences between the treatmentgroup and either of the two comparison groups in terms of the frequency of parolerevocation, time to first revocation, proportion rearrested or frequency of rearrest. Howeverthe authors of the evaluation claim that the Denver drug court produced monetary savingsof between $360.00 and $840.00 per offender because of the relatively shorter periods ofpre-sentence custody experienced by those placed on the drug court program (incomparison with those in either of the two control groups).
Miethe, Lu and Reese (2000) evaluated the Las Vegas Drug Court. To conduct theirevaluation they examined court re-appearance rates during 1997 for a group of 301individuals placed on the Drug Court program during 1995 and a control group of‘equivalent’ size drawn from persons charged with drug offences during that year anddealt with in the ‘general district’ courts. Court re-appearance rates were not examinedduring 1996 because some of the comparison group were imprisoned in that year. Tocontrol for this differential exposure to risk of re-offending, court re-appearance ratesduring 1996 were employed as a control variable, along with other factors likely to biasthe outcome of the comparison (e.g. gender, race, age, prior convictions and number andnature of charges).
A subsequent regression analysis of differences between the two groups in the proportionswho had had one or more court appearances during 1997 revealed that Drug Courtparticipants were significantly and substantially more likely to re-appear in court thanmembers of the comparison group. Superficially, such a result suggests that some form ofselection bias may have been operating in which those more likely to re-offend were morelikely to obtain a placement on the Drug Court program. Miethe, Lu and Reese dismissthis explanation on the grounds that their analysis ‘controlled’ for pre-existing differencesbetween experimental and control groups in risk of re-offending. Instead, they ascribetheir findings to the ‘stigmatic’ nature of the Drug Court program, invoking Braithwaite’s(1988) theory of reintegrative shaming in defence of this explanation.
Whatever the merits of this explanation it remains possible that some form of selectionbias is the explanation for their surprising findings. The variable they employed to controlfor prior criminal record was a dichotomous one, simply indicating whether or not thedefendant had a prior criminal record. This measure may not have been adequate tocontrol for differences in the length or seriousness of prior criminal history among treatmentand control subjects. Their somewhat curious decision to control for differences in re-offending during 1996 (i.e. when some of the control group were imprisoned) may alsohave resulted in those with a higher risk of re-offending being mistakenly treated as atlower risk. This would have distorted the between-group comparison for 1997.
Brewster (2001) examined the Chester County Drug Court program in South EasternPennsylvania comparing 184 Drug Court participants with a sample of 84 similar offenders‘who would have been participants had the program been in existence when they wereprosecuted’ (Brewster 2001, p. 181). This study is noteworthy for the detail provided bythe author on characteristics of the treatment and control groups. Unfortunately importantdemographic data were missing for many subjects. The demographic data they were ableto collect suggested that both groups were fairly comparable. However the Drug Courtsample had a lower unemployment rate at intake than the control group and also includeda larger proportion of defendants with prior convictions for non-violent crimes.
The study results showed that the Drug Court sample had lower annualised arrest ratesand spent a smaller proportion of the follow-up time in prison compared with the controlgroup. Rates of positive drug tests were also lower for the Drug Court sample than for thecontrol group although, as Brewster herself notes (p. 188), this could be because members
5
New South Wales Drug Court Evaluation: Cost-effectiveness
of the control group were only tested when they were suspected of using illegal drugs.Overall, the results are consistent with the hypothesis that Drug Courts are a more effectivemeans of reducing drug use and drug-related offending than regular probation. Onceagain, however, the possibility remains that pre-existing differences between treatmentand control groups were responsible for the findings.
Deschenes, Turner and Greenwood (1995) conducted one of the first genuinelyexperimental evaluations of a drug court. They evaluated the Maricopa County First TimeDrug Offender (FTDO) program for defendants recording their first conviction forpossession of drugs or drug paraphernalia. The program lasted between six and twelvemonths and featured social skills training, drug education, training in relapse preventionand group therapy. Participants were subjected to random (urine) drug testing and couldearn points for clean urine and completion of particular program components. Based onthe point total, participants could receive rewards, including a reduction in their probationsentence, deferred ‘gaol’ time and graduation to the next phase of the program. Failure toaccumulate sufficient points could result in participants having to repeat a treatmentphase or receive sanctions, including a custodial sanction.
Eligibility for the program was determined by the sentencing judge on the basis of referralsand advice from the Maricopa County Probation Service. To evaluate the programDeschenes et al. randomly allocated 639 defendants deemed eligible by the sentencingjudge for the program to one of four ‘tracks’ (groups). The first three tracks were standardtwelve-month probation sentences varying only in the intensity of the drug testingschedule. The fourth track was the FTDO program. In their analysis of the data Descheneset al. only report the comparison between the 176 individuals placed on the FTDO programand the 454 placed on probation. Their primary outcome measures were the percentage ofsubjects testing positive for drug use and the proportion rearrested for a new offence inthe first twelve months.
Almost half of all probationers in both the FTDO program and those on regular probation,tested positive to at least one substance during the twelve-month follow-up. Members ofthe FTDO group were less likely than the probation group to test positive for heroin orcocaine but were more likely to test positive for cannabis. There were no significantdifferences between the FTDO group and the probation group in terms of arrest rates, butmembers of the FTDO group had committed fewer technical violations of their sentencingorders than those in the probation group. They were also found to be less likely to bereimprisoned for a further offence.
Breckenridge, Winfree, Maupin and Clason (2000) also conducted an experimentalevaluation of a Drug Court program. They examined the effectiveness of a single municipalcourt program in New Mexico designed to reduce recidivism among first-time drink-drivers. Specially trained court personnel screened convicted offenders for symptoms ofalcoholism. Those designated as alcoholics on the basis of this screening were placed atrandom into a treatment (n=39) or control group (n=36). A third comparison group wasalso created by taking a random sample of those deemed non-alcoholic (n=77). Thereconviction rates of all three groups were then determined over a minimum of 15 and amaximum of 24 months. The study findings indicated that alcoholics placed in thetreatment group were less likely than those placed in the control group to be reconvictedfor an alcohol-related or serious offence.
Peters and Murrin (2000) evaluated the Escambia and Okaloosa County Drug Courtprograms in Florida. Separate groups of 168 Drug Court participants from the Escambiaprogram and 58 participants from the Okaloosa program were identified for inclusion inthe outcome study. Untreated comparison groups were formed from persons sentenced to
6
New South Wales Drug Court Evaluation: Cost-effectiveness
probation and placed in the community because of drug-related charges. Each DrugCourt participant from the two programs was matched to a non Drug Court probationeron the basis of county of residence, gender, race/ethnicity and type of offence. Althoughthe samples were quite similar on the major demographic variables, the Drug Court groupsgenerally had more arrests than the comparison groups over the preceding twelve months.
The results of the Peters and Murrin study indicated that, controlling for differences inprior criminal history, the two Drug Court groups were significantly less likely to be re-arrested and had fewer arrests than the control group in equivalent follow-up periods.Survival analysis also indicated that those arrested generally took longer to be arrestedthan members of the control group. Those who remained on the program also took longerto be re-arrested than those who failed and were removed from the program. While Petersand Murrin speculate that the results may have come about because Drug Court groupmembers were more motivated to reduce their drug use and crime, the results of theirstudy (and that of Deschenes, Turner and Greenwood discussed above) provide some ofthe clearest evidence, to date, that Drug Court programs can be effective in reducing drug-related crime.
Spohn, Piper, Martin and Frenzel (2001) conducted an equally rigorous evaluation of theNebraksa Drug Court program but obtained somewhat different results. They compareda group of Drug Court program participants with a group of felony drug offenders assignedto a different Pre-Trial Drug Diversion program (involving less intensive supervisionthan the Drug Court) and a group of traditionally adjudicated individuals convicted ofdrug offences. Offenders in all three groups were matched on most serious offence, genderand race/ethnicity, but it proved impossible to match them on prior criminal record.Traditionally adjudicated offenders had more serious prior criminal records and diversiongroup offenders had less serious prior criminal records than participants on theNebraska Drug Court program. The proportion re-arrested, the frequency of rearrest andthe time to first arrest were examined for all three groups over a follow-up period of twelvemonths.
Spohn et al. found that Drug Court participants were significantly less likely thantraditionally adjudicated offenders to be arrested during the follow-up period, even afterthe offender’s age, race/ethnicity and prior criminal record were taken into consideration.The same analysis, however, revealed that members of the Drug Diversion programperformed better than members of the Drug Court group although, when a special measureof prior risk of offending was included as a covariate in the analysis, this differencedisappeared. This measure of prior risk was not available for traditionally adjudicatedoffenders. However, when the analysis was restricted to non-felony drug offenders, DrugCourt participants still performed better than traditionally adjudicated offenders on allthree recidivism measures. Overall, Spohn et al.’s analysis suggests that the NebraskaDrug Court may have been more effective in reducing drug-related crime than traditionalsanctions but was not demonstrably more effective than the other Drug Diversion programthey examined.
CostTo date, there has been no reported cost-effectiveness analysis of a drug court, either inAustralia or overseas. Some evaluations have obtained cost information but all of themwere conducted in the US. Belenko (2001) provides the most thorough review of thismaterial and, since the material he reviewed is not contained in published reports, wedraw heavily on his work in what follows. It should be noted, however, that US estimates
7
New South Wales Drug Court Evaluation: Cost-effectiveness
of the cost of a drug court relative to conventional sanctions are of limited value in theAustralian context for two reasons. Firstly, Australian courts are generally far less punitivethan US courts in their response to people arrested for drug and drug-related offences.Secondly, whereas most drug court treatment regimes in the US are abstinence-based, theNSW Drug Court makes substantial use of pharmacotherapies such as methadonemaintenance treatment, which have been shown to be successful in reducing recidivismby drug-dependent offenders (Hall 1996). These kinds of treatment are generally moreexpensive than abstinence-based therapies.
Belenko lists five evaluations providing information on the cost of processing offendersthrough a drug court (see Belenko 2001, pp. 41-43). The first estimated the cost of drugcourt processing at $21.55 per case but obtained this figure simply by dividing the totaldrug court budget by the number of clients admitted. As Belenko (2001, p. 41) points out,this would have greatly underestimated the cost of drug court processing because itexcluded the cost of gaol sanctions and may also have excluded the cost of treatment. Thesecond evaluation estimated the cost of a processing a drug court defendant at $3,900compared with $6,950 in gaol costs alone for similar offenders who had been imprisoned.The third estimated the total criminal justice and treatment cost per case of drug courtprocessing at $4,352, compared with $8,358 for traditional adjudication and $808 fordiversion. The fourth estimated the cost of drug court processing (including both criminaljustice and treatment costs) at $30,423 compared with $40, 678 for a group of offenderstraditionally adjudicated. The last attempted a cost benefit analysis of drug courtprocessing and concluded that each drug court defendant processed by the drug courtresulted a net saving of $5,557.
While these results might seem to suggest that (at least in the US) it may be less expensiveto deal with offenders though a drug court regime than through conventional sanctions,no confidence can be placed in this conclusion. According to Belenko (2001) existingstudies providing cost information generally do not provide much detail about the sourcesof cost information. It is therefore difficult to judge which cost components have beenincluded and which excluded. Yet the relative costs of drug court processing andconventional sanctions clearly depend upon the level and type of treatment andsupervision provided by the drug court and the severity of the conventional sanctions.They also depend upon the relative effectiveness of drug courts and conventionalsanctions in reducing recidivism. These can vary widely from court to court.
THE NSW DRUG COURTThe NSW Drug Court commenced in February 1999 as a pilot program with a randomisedcontrol study design. The first participant commenced on 8 February. Although theprogram is continuing, for the purposes of this evaluation the last participant included inthe trial was accepted on 30 June 2000. The Drug Court operates in western Sydney andis fed by referrals from western Sydney’s 11 Local and 4 District Courts. The NSW DrugCourt Act 1998 and accompanying regulations govern conditions of entry, conduct andtermination from the program.
The trial was established to address the question of whether the Drug Court is moreeffective and cost-effective in reducing crime among drug-dependent criminal offendersthan the conventional sanctions.
Under section 5 of the Drug Court Act, in order to participate in the Drug Court trial anindividual must:
8
New South Wales Drug Court Evaluation: Cost-effectiveness
• be charged with an offence under the jurisdictions of the Local and District courts,excluding charges of physical violence, sexual assault or drug trafficking;
• be dependent on illicit drugs;
• be willing to plead guilty to the offence with which they have been charged;
• be highly likely to be sentenced to full time imprisonment;
• be willing to participate in the Drug Court;
• be a resident of the area in which the Drug Court operates; and
• not be suffering from any mental condition that could prevent or restrict the person’sactive participation in the program.
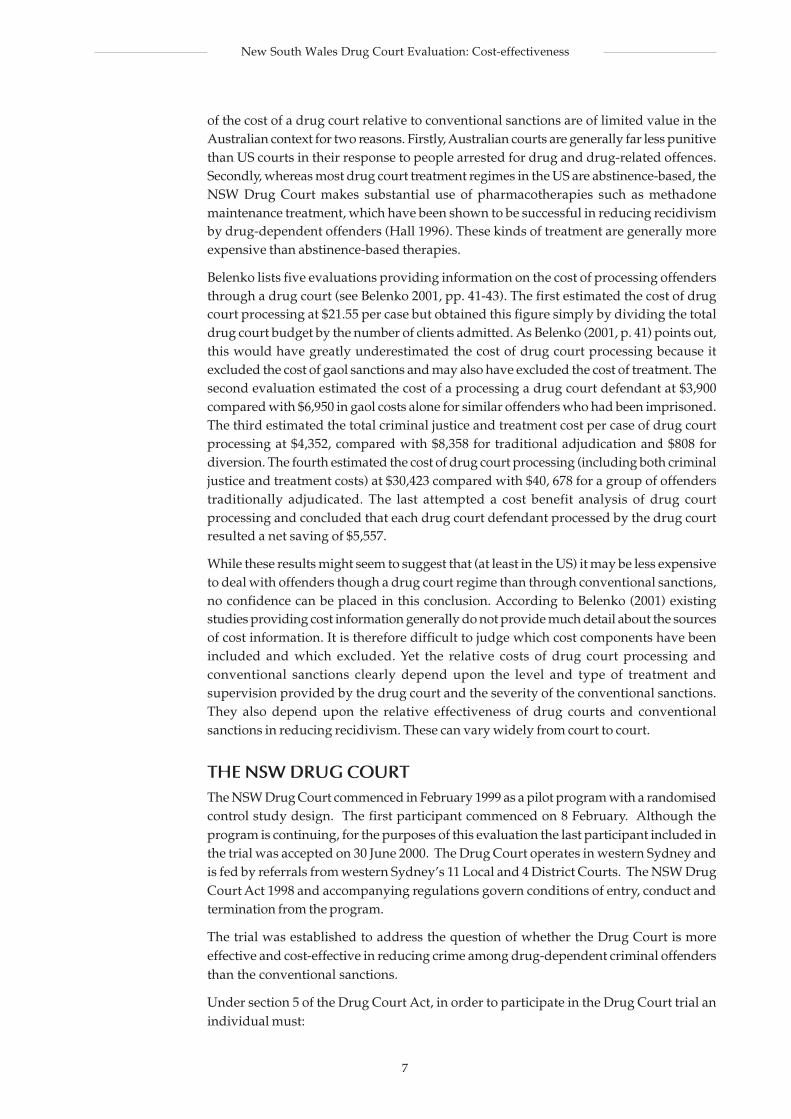
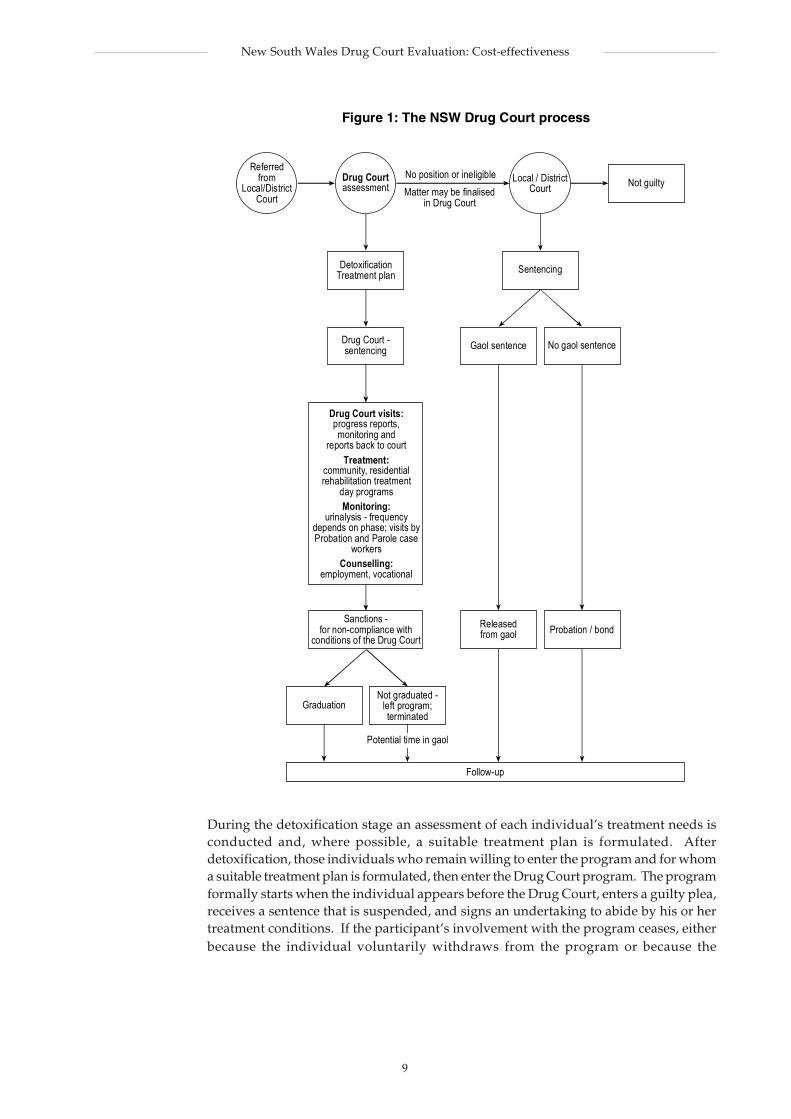
Overall, the process a participant goes through in the Drug Court is a complex one,depicted in Figure 1. This process is discussed in more detail in the remainder of thissection.
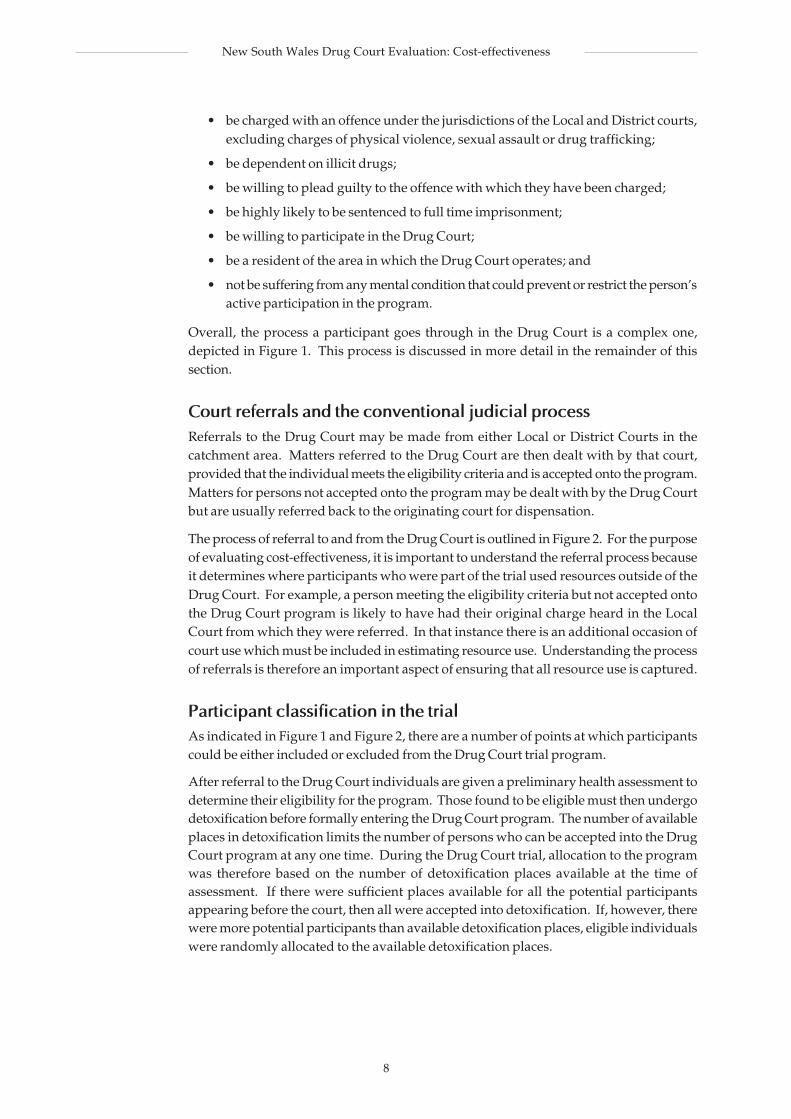
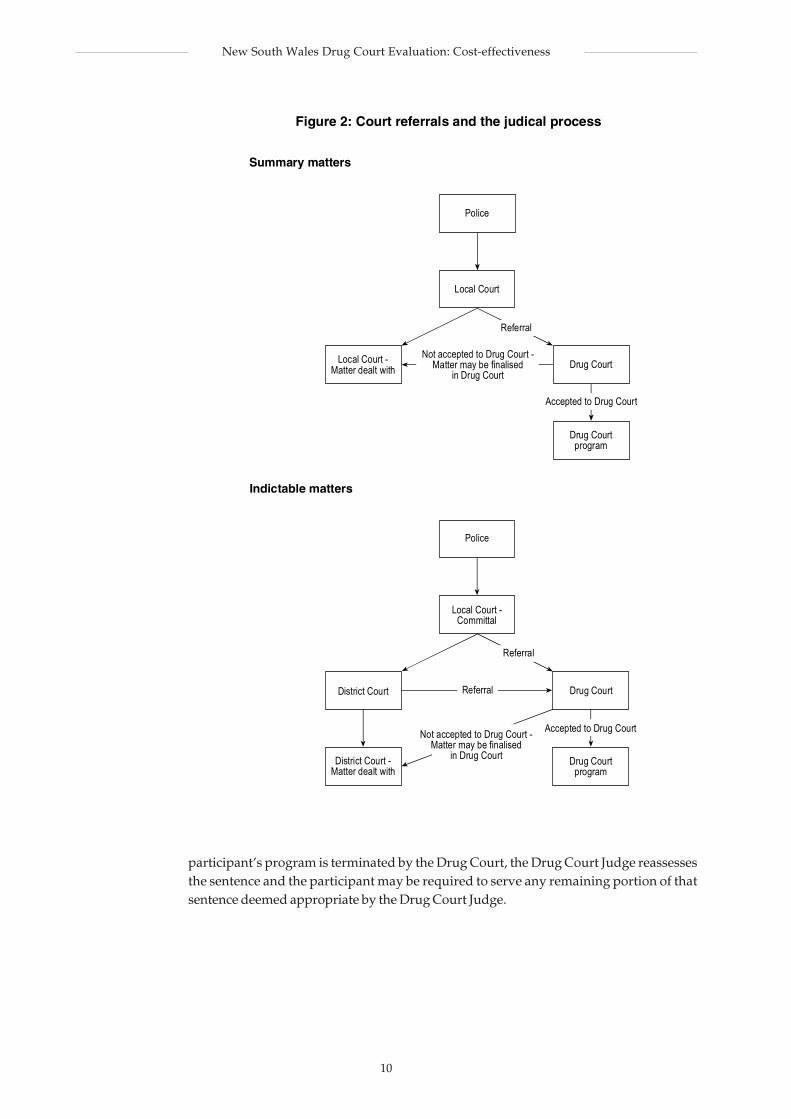
Court referrals and the conventional judicial processReferrals to the Drug Court may be made from either Local or District Courts in thecatchment area. Matters referred to the Drug Court are then dealt with by that court,provided that the individual meets the eligibility criteria and is accepted onto the program.Matters for persons not accepted onto the program may be dealt with by the Drug Courtbut are usually referred back to the originating court for dispensation.
The process of referral to and from the Drug Court is outlined in Figure 2. For the purposeof evaluating cost-effectiveness, it is important to understand the referral process becauseit determines where participants who were part of the trial used resources outside of theDrug Court. For example, a person meeting the eligibility criteria but not accepted ontothe Drug Court program is likely to have had their original charge heard in the LocalCourt from which they were referred. In that instance there is an additional occasion ofcourt use which must be included in estimating resource use. Understanding the processof referrals is therefore an important aspect of ensuring that all resource use is captured.
Participant classification in the trialAs indicated in Figure 1 and Figure 2, there are a number of points at which participantscould be either included or excluded from the Drug Court trial program.
After referral to the Drug Court individuals are given a preliminary health assessment todetermine their eligibility for the program. Those found to be eligible must then undergodetoxification before formally entering the Drug Court program. The number of availableplaces in detoxification limits the number of persons who can be accepted into the DrugCourt program at any one time. During the Drug Court trial, allocation to the programwas therefore based on the number of detoxification places available at the time ofassessment. If there were sufficient places available for all the potential participantsappearing before the court, then all were accepted into detoxification. If, however, therewere more potential participants than available detoxification places, eligible individualswere randomly allocated to the available detoxification places.
9
New South Wales Drug Court Evaluation: Cost-effectiveness
During the detoxification stage an assessment of each individual’s treatment needs isconducted and, where possible, a suitable treatment plan is formulated. Afterdetoxification, those individuals who remain willing to enter the program and for whoma suitable treatment plan is formulated, then enter the Drug Court program. The programformally starts when the individual appears before the Drug Court, enters a guilty plea,receives a sentence that is suspended, and signs an undertaking to abide by his or hertreatment conditions. If the participant’s involvement with the program ceases, eitherbecause the individual voluntarily withdraws from the program or because the
Figure 1: The NSW Drug Court process
Referredfrom
Local/DistrictCourt
Drug Courtassessment
Local / DistrictCourt Not guilty
SentencingDetoxificationTreatment plan
Gaol sentenceDrug Court -sentencing No gaol sentence
Drug Court visits:progress reports,monitoring and
reports back to court
Treatment:community, residentialrehabilitation treatment
day programsMonitoring:
urinalysis - frequencydepends on phase; visits byProbation and Parole case
workersCounselling:
employment, vocational
Releasedfrom gaol Probation / bond
GraduationNot graduated -
left program;terminated
Sanctions -for non-compliance with
conditions of the Drug Court
Follow-up
No position or ineligible
Potential time in gaol
Matter may be finalisedin Drug Court
10
New South Wales Drug Court Evaluation: Cost-effectiveness
participant’s program is terminated by the Drug Court, the Drug Court Judge reassessesthe sentence and the participant may be required to serve any remaining portion of thatsentence deemed appropriate by the Drug Court Judge.
Figure 2: Court referrals and the judical process
Indictable matters
Drug Court
Drug Courtprogram
Police
Local Court -Committal
District Court -Matter dealt with
District Court
Summary matters
Drug Court
Drug Courtprogram
Police
Local Court
Local Court -Matter dealt with
Not accepted to Drug Court -Matter may be finalised
in Drug Court
Accepted to Drug Court
Referral
Referral
Not accepted to Drug Court -Matter may be finalised
in Drug Court
Referral
Accepted to Drug Court
11
New South Wales Drug Court Evaluation: Cost-effectiveness
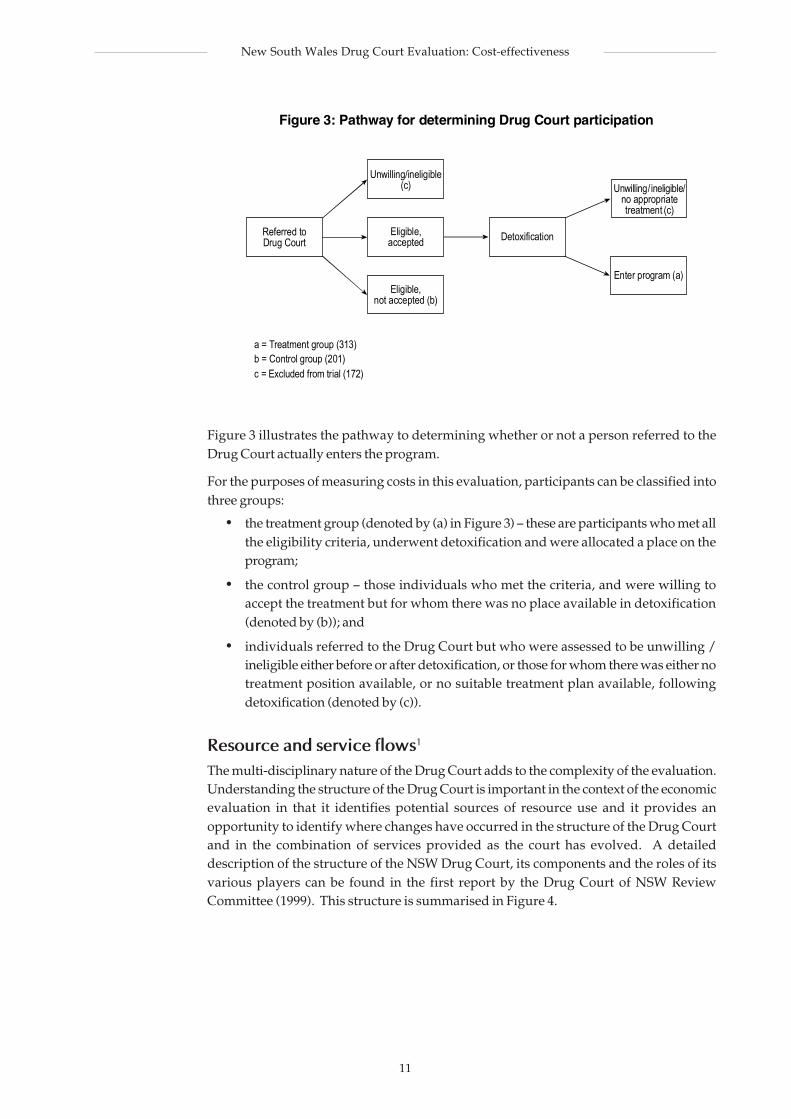
Figure 3 illustrates the pathway to determining whether or not a person referred to theDrug Court actually enters the program.
For the purposes of measuring costs in this evaluation, participants can be classified intothree groups:
• the treatment group (denoted by (a) in Figure 3) – these are participants who met allthe eligibility criteria, underwent detoxification and were allocated a place on theprogram;
• the control group – those individuals who met the criteria, and were willing toaccept the treatment but for whom there was no place available in detoxification(denoted by (b)); and
• individuals referred to the Drug Court but who were assessed to be unwilling /ineligible either before or after detoxification, or those for whom there was either notreatment position available, or no suitable treatment plan available, followingdetoxification (denoted by (c)).
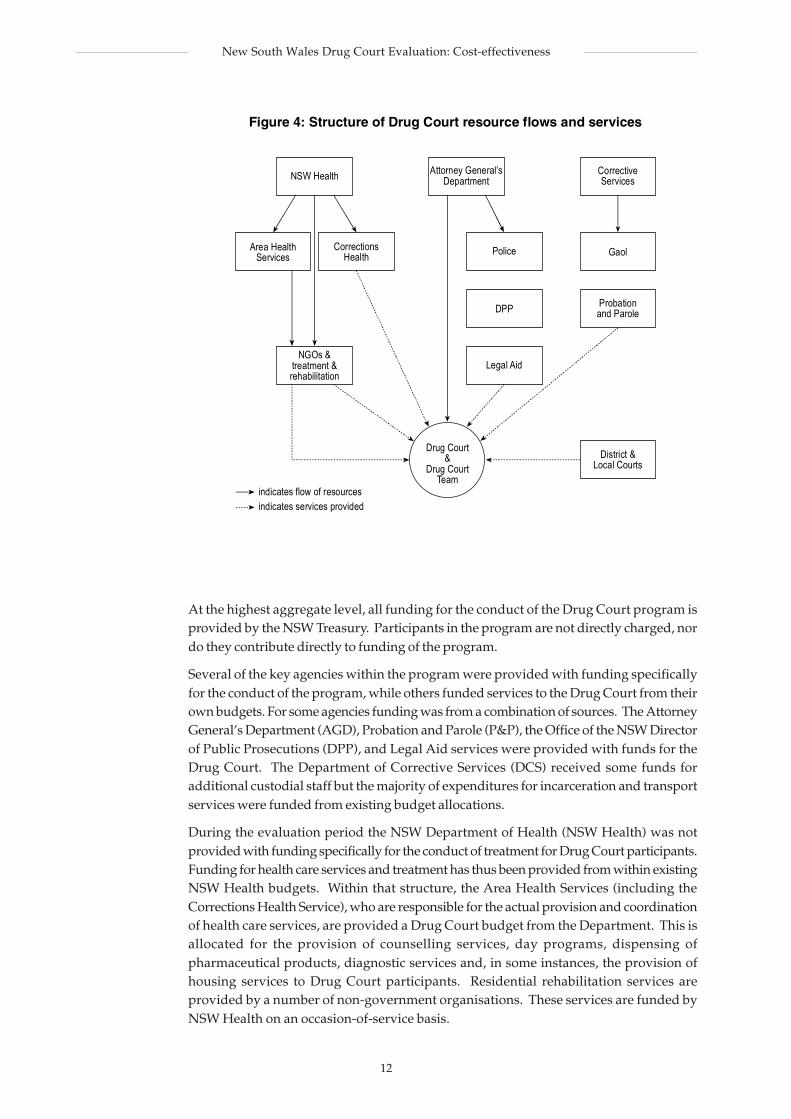
Resource and service flows1
The multi-disciplinary nature of the Drug Court adds to the complexity of the evaluation.Understanding the structure of the Drug Court is important in the context of the economicevaluation in that it identifies potential sources of resource use and it provides anopportunity to identify where changes have occurred in the structure of the Drug Courtand in the combination of services provided as the court has evolved. A detaileddescription of the structure of the NSW Drug Court, its components and the roles of itsvarious players can be found in the first report by the Drug Court of NSW ReviewCommittee (1999). This structure is summarised in Figure 4.
Figure 3: Pathway for determining Drug Court participation
Unwilling / ineligible/no appropriatetreatment (c)
Enter program (a)
Referred toDrug Court
Unwilling/ineligible(c)
Eligible,accepted
Eligible,not accepted (b)
Detoxification
a = Treatment group (313)b = Control group (201)c = Excluded from trial (172)
12
New South Wales Drug Court Evaluation: Cost-effectiveness
At the highest aggregate level, all funding for the conduct of the Drug Court program isprovided by the NSW Treasury. Participants in the program are not directly charged, nordo they contribute directly to funding of the program.
Several of the key agencies within the program were provided with funding specificallyfor the conduct of the program, while others funded services to the Drug Court from theirown budgets. For some agencies funding was from a combination of sources. The AttorneyGeneral’s Department (AGD), Probation and Parole (P&P), the Office of the NSW Directorof Public Prosecutions (DPP), and Legal Aid services were provided with funds for theDrug Court. The Department of Corrective Services (DCS) received some funds foradditional custodial staff but the majority of expenditures for incarceration and transportservices were funded from existing budget allocations.
During the evaluation period the NSW Department of Health (NSW Health) was notprovided with funding specifically for the conduct of treatment for Drug Court participants.Funding for health care services and treatment has thus been provided from within existingNSW Health budgets. Within that structure, the Area Health Services (including theCorrections Health Service), who are responsible for the actual provision and coordinationof health care services, are provided a Drug Court budget from the Department. This isallocated for the provision of counselling services, day programs, dispensing ofpharmaceutical products, diagnostic services and, in some instances, the provision ofhousing services to Drug Court participants. Residential rehabilitation services areprovided by a number of non-government organisations. These services are funded byNSW Health on an occasion-of-service basis.
Figure 4: Structure of Drug Court resource flows and services
Gaol
Attorney General’sDepartment
Police
DPP
Legal Aid
NSW Health CorrectiveServices
Area HealthServices
CorrectionsHealth
NGOs &treatment &rehabilitation
Probationand Parole
District &Local Courts
Drug Court&
Drug CourtTeam
indicates flow of resourcesindicates services provided
13
New South Wales Drug Court Evaluation: Cost-effectiveness
METHOD
ECONOMIC EVALUATIONEconomic evaluation can be defined as the systematic comparison of both the costs (i.e.resource inputs) and the consequences (i.e. outputs or benefits) of alternative courses ofaction (Drummond, O’Brien, Stoddart & Torrance 1997). One form of economic evaluation,cost-effectiveness analysis, is frequently used to evaluate health and other services. Unlikecost-benefit analysis – in which the consequences are valued in monetary terms – in cost-effectiveness analysis the consequences of health programs are measured in the mostappropriate natural or physical units (such as ‘years of life gained’, ‘deaths prevented’,or ‘cases detected’). Although cost-effectiveness analyses traditionally consider a singlemeasure of output, increasingly they use a range of output measures. It is then left to thedecision-maker to form their own view about the relative importance of the differentoutcome measures.
An important implication of this is that a single program or treatment cannot be judged as‘cost-effective’ in its own right. Instead, the results of cost-effectiveness analyses allowexplicit statements to be made about the relative cost-effectiveness of specified alternatives:at the simplest level for example, that they are more or less costly than each other, and thatthey are more or less effective. Also, in those situations where a particular health programis shown to be both more costly and more effective (than a particular alternative), it ispossible to calculate how much more it costs per additional unit of effectiveness in choosingthe more effective program. (This is what health economists call an ‘incremental analysis’.)
It should be stressed that cost-effectiveness analyses, on their own, rarely produce ‘ananswer’ in terms of indicating the most cost-effective course of action. Their results areintended to be decision-informing, rather than decision-making (Russell, Gold, Siegel,Daniels & Weinstein 1996). Ultimately the choice between alternatives requires somedecision rule based on either maximising effectiveness for a known fixed budget, orminimising the costs of achieving a certain target level of effectiveness. For example, in aparticular health or legal system, interventions which cost under $50,000 per life-yearsaved or per further offence avoided might be regarded as ‘worth paying for’, whereasinterventions which cost more than $100,000 per life-year saved or further offence avoidedmight be regarded as not worth paying for. Another very good reason for viewing cost-effectiveness analysis as a decision-informing rather than decision-making policy tool, isthat the method only generates data about the average efficiency of alternatives. It thereforesays nothing about the alternative programs in terms of their impact on equity, feasibility,and other criteria which policy makers need to consider.
In this project, the costs of both treatment and control groups are calculated and therelative cost-effectiveness of the Drug Court (i.e. the differences between treatment andcontrol groups in terms of costs and rate of recidivism) are estimated. Two measures ofrecidivism are used: the average number of offences per unit of time and the average timeto first offence. Each measure is calculated for two selected offence types, shop stealingand possess/use opiates. These offence types were selected as marker offences for thedrug-related offences targeted by the Drug Court program.
It is important to make the perspective taken in an economic evaluation explicit. Thechoice of perspective determines what costs and effects to count and how to value them.
14
New South Wales Drug Court Evaluation: Cost-effectiveness
The broadest perspective is a social perspective, which includes all costs and effectsregardless of who incurs the costs and who obtains the effect (Gold, Siegel, Russell &Weinstein 1996). In terms of the Drug Court program, this might include all costs incurredby the participant in health, justice, police, social services and all the costs of crime. Intheory, given the impact of drug addiction on partners, parents, children and victims ofcrime, it might also include health and social services costs incurred by these groups. Atthe other end of the spectrum, the perspective of a single provider of services might bechosen, where, for example, only the costs directly incurred by the Drug Court itself werecaptured.
A ‘provider’ perspective was adopted for this study where the ‘provider’ is that ofGovernment and the service being provided is that of ‘treatment’ (the Drug Court programbeing the ‘treatment’). A societal perspective was not taken in this study for severalreasons. The first was that, in a cost-effectiveness analysis, it is difficult to select anoutcome measure that captures all benefits to society. Second, the objectives of thecommissioning organisation and the resource use data available to conduct the studymeant that costs pertaining to the use of police resources, crimes committed and othersocietal costs were not available.
EFFECTIVENESS
Subjects included in the studyThe subjects included in the effectiveness part of this study2 include all persons who wereadmitted to the Drug Court program in the period 8 February 1999 to 30 June 2000 and allpersons randomly allocated to a control group during this same time period. All personsreferred to the Drug Court were assessed for eligibility to enter the treatment program.Allocation to the treatment or control group occurred after this assessment was completedand only for those found to meet the eligibility criteria.
Random allocation to the treatment and control groups was feasible because the numberof treatment places available at any one time was limited by the number of available bedsin the detoxification units. (Detoxification was required as an initial stage before formalentry to the Drug Court program.) Whenever more persons were found eligible to enterthe program than there were available detoxification places, the available places werefilled by random selection. The random selection was conducted in the court usingcalculator-generated random numbers.
It should be noted that one potential source of bias in this allocation process was thatthere was another opportunity to exclude people from the Drug Court program after therandom allocation. A more comprehensive assessment of eligibility for the program wasundertaken during the detoxification stage which occurred before formal entry to theprogram. About 10 per cent of those who went through detoxification did not enter theprogram for one of the following reasons: (1) they were found ineligible, or (2) they wereno longer willing to participate, or (3) no highly suitable treatment program was available.This last group, in some cases, included those for whom no suitable accommodationcould be found.
The aim was to recruit at least 300 subjects to the treatment group and at least 200 to thecontrol group. It was originally anticipated that these targets would be achieved in thefirst twelve months of the Drug Court’s operation but recruitment to both groups provedto be slower than anticipated. The period of recruitment of subjects for evaluation wastherefore extended to 30 June 2000.
15
New South Wales Drug Court Evaluation: Cost-effectiveness
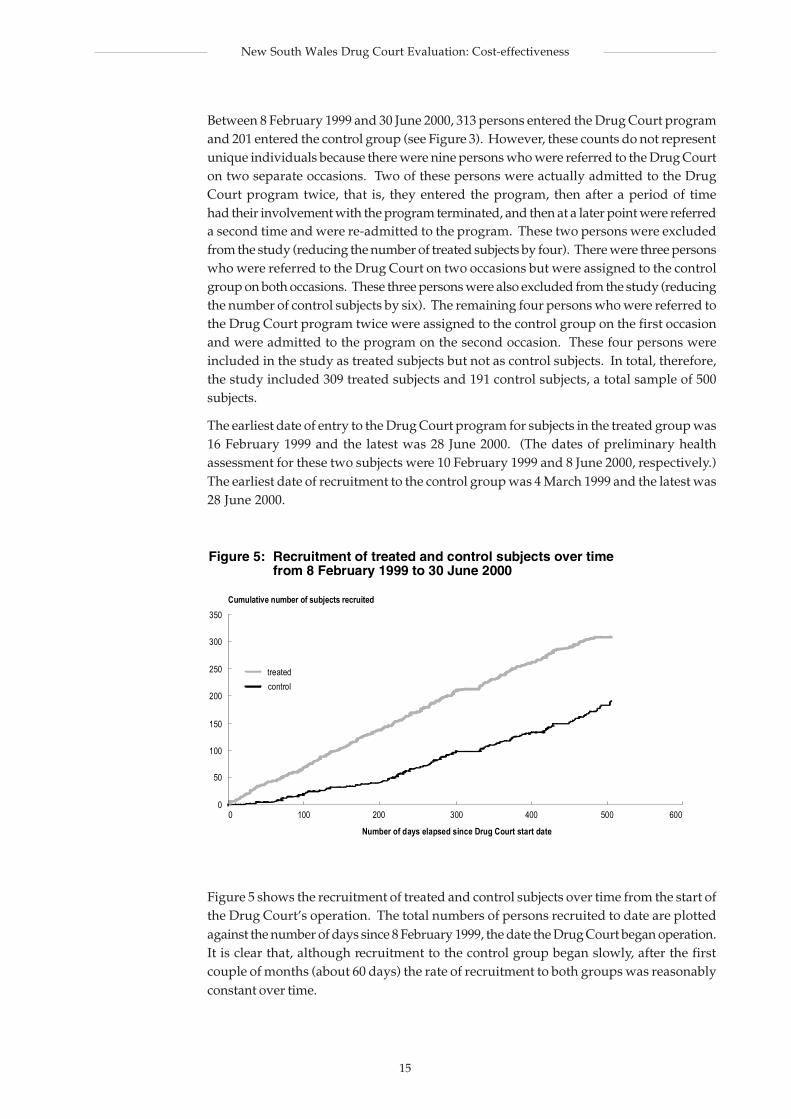
Between 8 February 1999 and 30 June 2000, 313 persons entered the Drug Court programand 201 entered the control group (see Figure 3). However, these counts do not representunique individuals because there were nine persons who were referred to the Drug Courton two separate occasions. Two of these persons were actually admitted to the DrugCourt program twice, that is, they entered the program, then after a period of timehad their involvement with the program terminated, and then at a later point were referreda second time and were re-admitted to the program. These two persons were excludedfrom the study (reducing the number of treated subjects by four). There were three personswho were referred to the Drug Court on two occasions but were assigned to the controlgroup on both occasions. These three persons were also excluded from the study (reducingthe number of control subjects by six). The remaining four persons who were referred tothe Drug Court program twice were assigned to the control group on the first occasionand were admitted to the program on the second occasion. These four persons wereincluded in the study as treated subjects but not as control subjects. In total, therefore,the study included 309 treated subjects and 191 control subjects, a total sample of 500subjects.
The earliest date of entry to the Drug Court program for subjects in the treated group was16 February 1999 and the latest was 28 June 2000. (The dates of preliminary healthassessment for these two subjects were 10 February 1999 and 8 June 2000, respectively.)The earliest date of recruitment to the control group was 4 March 1999 and the latest was28 June 2000.
Figure 5 shows the recruitment of treated and control subjects over time from the start ofthe Drug Court’s operation. The total numbers of persons recruited to date are plottedagainst the number of days since 8 February 1999, the date the Drug Court began operation.It is clear that, although recruitment to the control group began slowly, after the firstcouple of months (about 60 days) the rate of recruitment to both groups was reasonablyconstant over time.
Cumulative number of subjects recruited
350
Number of days elapsed since Drug Court start date
100 200 300 400 500
Figure 5: Recruitment of treated and control subjects over timefrom 8 February 1999 to 30 June 2000
600
300
250
200
150
100
50
00
control
treated
16
New South Wales Drug Court Evaluation: Cost-effectiveness
Measures of effectivenessAs earlier noted, two measures of effectiveness were examined, both relating to offenceswhich were committed during the follow-up period and which were dealt with at a courtappearance. These measures were the time to the first offence and offending frequencyper unit time. These measures of offending, while fairly standard in Drug Court evaluations(see Introduction), cannot be regarded as ideal. In essence the measures assume that anydifferences between treatment and control groups in actual offending will manifestthemselves in terms of differences in offences for which the subjects are prosecuted incourt. The variation in numbers of offences brought to court may be substantially lessthan the variation in the number of offences actually committed. To some extent, therefore,our measures of recidivism provide a fairly conservative test of the effectiveness of theDrug Court in reducing crime by Drug Court participants.
The follow-up period for each subject started at the time of the subject’s referral to theDrug Court and ended on 30 September 2000. Each person referred to the Drug Courtunderwent a preliminary health assessment as part of the procedure for assessingeligibility to enter the program. The date of this preliminary health assessment was usedas the start date for each person’s follow-up period.
Most subjects spent some time in custody during the follow-up period. Indeed, becausedetoxification was carried out in prison, all of the treated subjects spent at least some timein custody. Because there is no opportunity for a person to offend while incarcerated weconsidered both total elapsed time and what we call ‘free’ time (that is, time out of custody)in the follow-up period. The analysis based on total elapsed time takes into account theincapacitation effect of prison, whereas the analysis based on free time provides a directcomparison of the treatment and control groups assuming that they have equalopportunities to offend.
Both measures of effectiveness were calculated for each type of offence considered. Becausethe aim of the Drug Court is to reduce drug-related crime, theft offences and drug offenceswere the only offence types examined in this study. The specific theft offences examinedwere break, enter and steal; fraud; larceny by shop stealing; other larceny; unlawfulpossession; and motor vehicle theft. Robbery was not included as one of the theft offencesbecause persons charged with violent offences were not eligible to enter the Drug Courtprogram. The specific drug offences examined were possess/use opiates; possess/usecannabis; possess/use other drug; and deal/traffic opiates.
Sources of dataThere were three sources of data used for this study. The primary source of data was theDrug Court database, a database maintained by Drug Court staff. This database was thesource of information on gender, date of birth, previous imprisonment and prior convictionepisodes. All of this information was recorded by Drug Court staff for each person referredto the Court.
Time spent in custody was determined from data provided by staff from the NSWDepartment of Corrective Services, who used the personal identifying details from theDrug Court database to match with their own records. They provided the dates of entryand exit from gaol for every episode of imprisonment for the matched individuals.
Data on offences committed during the follow-up period were drawn from the databaseof criminal matters dealt with by the NSW Local Court, a database maintained by the
17
New South Wales Drug Court Evaluation: Cost-effectiveness
Bureau of Crime Statistics and Research. An offence was counted for each Drug Courtparticipant and each control subject if:
• the person was a defendant in the Local Court, charged with the offence (regardlessof whether the outcome was a conviction or not), and the matter was finalised on orbefore 31 December 2000;
• the date of offence fell in the follow-up period, that is, it occurred between the dateof preliminary health assessment and 30 September 2000; and
• the offence type was a theft or drug offence.
If more than one offence of the same type occurred on the same day it was counted onlyonce. This rule was adopted because police can charge persons with more than oneoffence relating to the same incident.
The Drug Court database was also used as a source of information on offences during thefollow-up period because the Drug Court dealt with some of the offences committed byparticipants during their program.
Some offences may have been dealt with in the NSW District Court rather than the LocalCourt. However, it was not feasible to use this data source, firstly because many monthscan elapse before a matter is finalised in the District Court and, secondly, because date ofoffence is not recorded in the District Court database. At least 95 per cent of criminalprosecutions in NSW are dealt with in the Local Court. Hence the impact of excludingoffences dealt with in the District Court is likely to be negligible.
COSTS AND COST-EFFECTIVENESS
The evaluation processThe purpose of the evaluation of the costs and consequences of the NSW Drug Court is toanswer the question of whether it is more cost-effective in terms of reducing recidivismamong drug-dependent offenders than the conventional system.
In this project, the costs of both treatment and control groups were calculated and therelative cost-effectiveness of the Drug Court (i.e. the differences between treatment andcontrol groups in terms of costs and rate of recidivism) was estimated. In addition, thecosts of treatment were compared with the judicial and incarceration costs that wouldhave been incurred by the treatment group had they served their original sentence ratherthan enter the Drug Court program.
While it is recognised that the cost of recidivism is important (and may be substantial), ithas not been included in the costs for the cost-effectiveness measure because recidivism isthe outcome measure. Including the costs of recidivism in the numerator would be doublecounting (Gold et al. 1996, p. 306).
As discussed earlier, the evaluation is conducted from a provider perspective. Costsincluded were those incurred by the NSW Attorney General’s Department (AGD), theWestern Sydney Area Health Service (WSAHS), the Wentworth Area Health Service(WAHS), the South Western Sydney Area Health Service (SWAHS), the Corrections HealthService (CHS), the Office of the NSW Director of Public Prosecutions (DPP), Legal Aid,Police (direct contribution to Drug Court), and the NSW Department of Corrective Services(DCS) including Probation and Parole (P&P). Cost savings, such as reduced lawenforcement costs due to lower recidivism rates, productivity changes, or downstreamchanges in court costs were not included. In addition, this evaluation did not attempt toestimate the cost of crime itself (property, welfare transfers and insurance costs).
18
New South Wales Drug Court Evaluation: Cost-effectiveness
Costs for both the treatment and control groups were estimated from the time a participantwas first assessed for inclusion in the Drug Court program to the time they completed theprogram or until 31 December 2000 (if a participant was still in the program). It should benoted that the completion of the program was defined as the end of any sentence for theoffence(s) for which the participant was assessed for the Drug Court program. For thetreatment group this was the final sentence following termination or graduation from theDrug Court, and for the control group it was the original sentence. Out of pocket costs toprogram participants – including transport costs, time off work, child care expenses,medical expenditures and other expenditures as a result of meeting program requirementswere not estimated for the purposes of this evaluation.
Within economic evaluations, the appropriate notion of cost is opportunity cost, that is,the value of the alternatives forgone. Identifying real resources used is therefore important.Simply using budget and accounting information may not capture true opportunity costs.Different methods of allocating fixed and overhead costs may further complicate theprocess of estimating costs.
The approach used in this evaluation follows standard costing techniques used foreconomic evaluations: identify the activities to be costed; identify the types of resourcesused in those activities; measure in physical units the volume of resources used and,finally, apply a standard unit cost to those resources to estimate a value for resource use.In each of these steps there is a trade-off between precision, generalisability and cost ofdata acquisition.
There are a number of methods by which costs can be calculated. They range from microcosting (in which resource use is costed at the level at which resource use occurs) tomacro costing (in which budget allocations are divided amongst the use of resources).The former is potentially time consuming and costly to undertake, while the latter mayonly provide an estimate of the average cost per case and may not provide any indicationof the fixed and variable costs of service provision. This can result in inaccurate estimatesof the costs of expanding or contracting a service.
A combination of micro and macro costing methods were used to estimate costs for theDrug Court. Where possible, resource use per participant on specific activities, such asthe conduct of urinalysis was collected. Where individual based information was notavailable, global expenditures were allocated to the individual level using an algorithmof time on the program and frequency of contact. At each level, cost estimation was basedon an understanding of the activities of the program and how they relate to individual
19
New South Wales Drug Court Evaluation: Cost-effectiveness
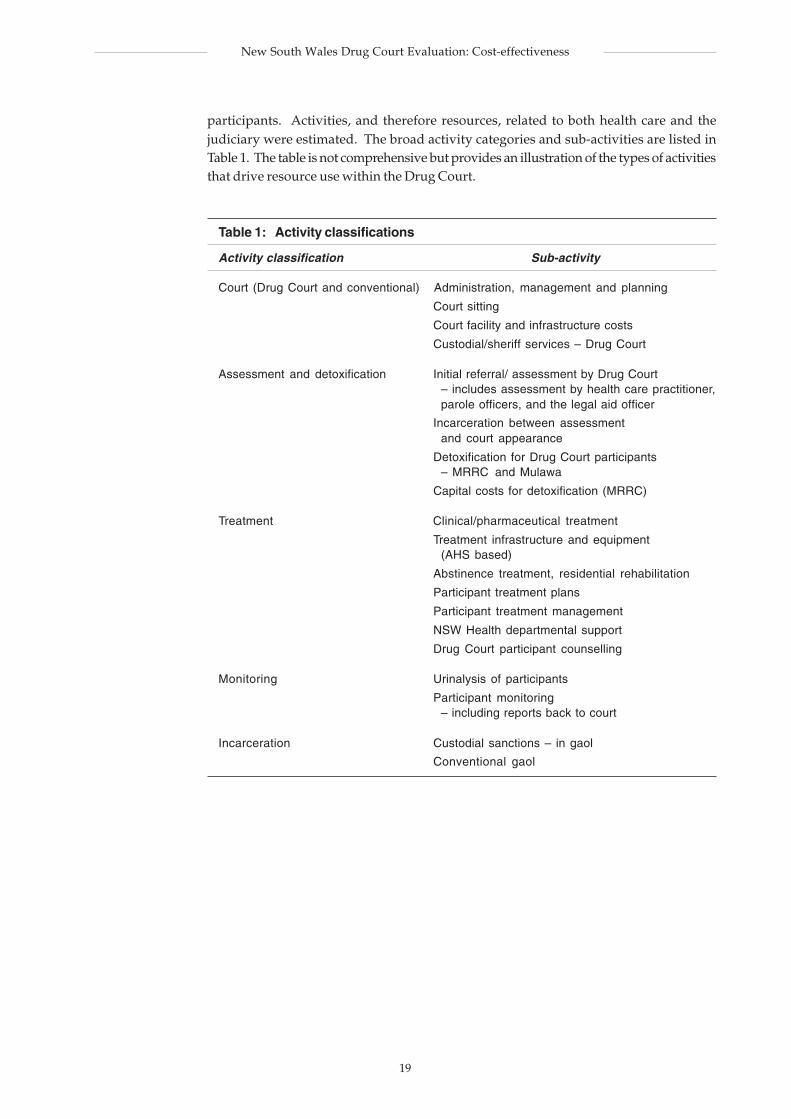
participants. Activities, and therefore resources, related to both health care and thejudiciary were estimated. The broad activity categories and sub-activities are listed inTable 1. The table is not comprehensive but provides an illustration of the types of activitiesthat drive resource use within the Drug Court.
Table 1: Activity classifications
Activity classification Sub-activity
Court (Drug Court and conventional) Administration, management and planning
Court sitting
Court facility and infrastructure costs
Custodial/sheriff services – Drug Court
Assessment and detoxification Initial referral/ assessment by Drug Court– includes assessment by health care practitioner,parole officers, and the legal aid officer
Incarceration between assessmentand court appearance
Detoxification for Drug Court participants– MRRC and Mulawa
Capital costs for detoxification (MRRC)
Treatment Clinical/pharmaceutical treatment
Treatment infrastructure and equipment(AHS based)
Abstinence treatment, residential rehabilitation
Participant treatment plans
Participant treatment management
NSW Health departmental support
Drug Court participant counselling
Monitoring Urinalysis of participants
Participant monitoring– including reports back to court
Incarceration Custodial sanctions – in gaol
Conventional gaol
20
New South Wales Drug Court Evaluation: Cost-effectiveness
A cost per participant in treatment on the trial was calculated by summing the resourcesused in each of these activities for each participant over their period in the trial. Thus,data collected on frequency of participant activity were combined with expenditure datato arrive at a cost per participant.
Costs for the control group were estimated using a similar method with a smaller set ofactivities. These include the cost of initial Drug Court assessment, subsequent court costsand the cost of incarceration (based on the sentence served and a per diem cost).
For both treatment and control groups, law enforcement and police costs (other thanthose incurred by the police officer assigned to the Drug Court team) were not included. Itshould also be noted that the costs of gaol were estimated as though members of bothgroups served their sentences in full.
Underlying these analyses is the knowledge that program activities have not been staticthroughout the period of the Drug Court trial. Numerous changes have been made to theconduct of the program, including the way sanctions are enforced, the taking of urinesamples for testing and how the key providers interact. For this analysis, costs wereestimated on the basis of actual program expenditures. Where data were available on theimpact on expenditure of any particular program change, sensitivity analysis wasconducted to investigate the impact on total expenditure of those changes.
Finally, the cost and effectiveness measure were combined to arrive at a cost-effectivenessratio (Equation 1).
Equation 1
( )( )EffEff
CCICERCT
CT−
−=
where ICER is the incremental cost-effectiveness ratio; C is cost; Eff is the time to firstoffence (or frequency of offending); subscript ‘T’ denotes the treatment arm of the DrugCourt trial, and subscript ‘C’ denotes the control arm of the Drug Court trial. This ratioexpresses the additional cost of the Drug Court over the conventional system for a givenchange in recidivism.
Data collectionAs part of the data collection process, key stakeholders from agencies and departmentsinvolved in the Drug Court (see Figure 4), including representative members of the DrugCourt team, were interviewed. The aim of the interviews was two-fold: to develop anunderstanding of the functions of the Drug Court program, changes to date and issues;and to identify key data needs and potential sources for those data.
Broadly speaking, in order to fully capture resource use, information was requested onDrug Court activities and related expenditures, both for staff employed by the Drug Courtand for staff not employed by or charged to the Drug Court. Agencies were also asked tooutline where staff employed by the Drug Court were being used to carry out non DrugCourt related activities for which the Drug Court is not being reimbursed (giving someidea of cross subsidies from the Drug Court to other programs/areas of expenditure andvice versa).
21
New South Wales Drug Court Evaluation: Cost-effectiveness
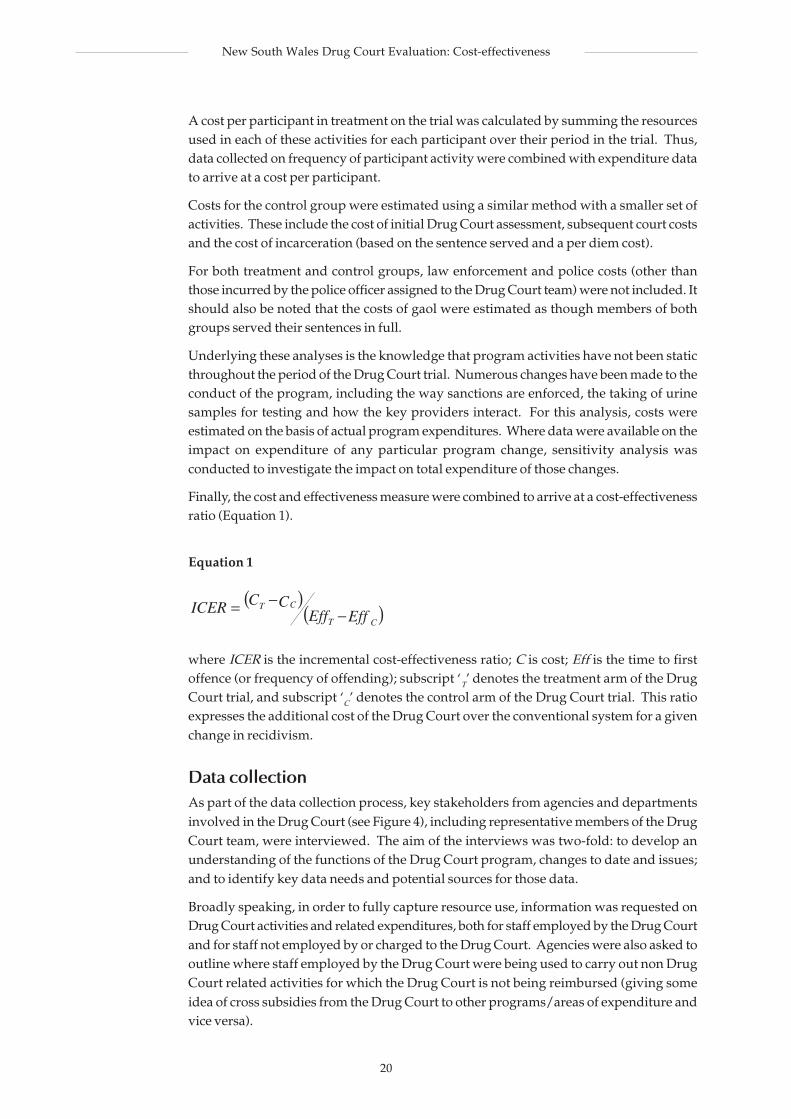
Collection of resource data for the analysis has incorporated a three-pronged approach –primary data collection, key informant estimation of time spent on different activities andthe use of published data. Data types, sources and issues are summarised in Table 2.
Table 2: Data types and sources for treatment and control groups
Category Data on activity Sources
As for the evaluation of effectiveness, a key source of information for the evaluation of thecost-effectiveness of the Drug Court was the Drug Court database. Information containedin this database included dates of assessment, detoxification, start date on Drug Courtprogram, court appearances and urine drug screens. Other variables, such as transitiondates between stages of the Drug Court, were not able to be used for the purposes of thisevaluation. Thus, administrative data on which services were provided were used indetermining actual resource use.
For the purposes of the evaluation, Drug Court team staff time was apportioned broadlyto the activities described above. Information was obtained from a survey of staff activitywhich Drug Court team members were asked to complete. The survey requestedinformation spent on activity for a period of five consecutive working days. Copies of thesurvey forms are in Appendix 1.
In addition, members of the research team observed the court proceedings on a number ofoccasions to measure the time taken to deal with report back sessions, termination hearingsand sentencing matters. The purpose of this activity was to arrive at an average time permatter. These averages have been used to allocate Drug Court staff and court costs toindividual participants per appearance in court for report back or sentencing.
AGD; DPP; Legal Aid; CHS, DCS; P&PDrug Court team staff – data formsDrug Court databaseObservation of Court activity
Drug Court team staff – data formsDrug Court databaseCHSDCS; Legal Aid; P&P
SWSAHS, WAHS and WSAHS;NSW HealthCHSBureau of Crime Statistics
and Research database
Drug Court databaseAGD financial dataDrug Court team - data formsDCS
Drug Court databaseDCSLocal Court dataDistrict Court data
Parramatta Court Registry;Legal Aid, AGD
Administration, management and planningCourt – team meetings, reports back to court,
sentencing, termination hearingsand graduations
Referral/assessment by Drug CourtDetoxification
Clinical treatmentAbstinence treatmentResidential rehabilitationTreatment plans and management
UrinalysisReports back to courtProbation and parole
Custodial/sheriffsSanctionsGaol
Activity, timing and salaries
NSW Drug Court
Assessment anddetoxification
Treatment
Monitoring
Incarceration
Sentencing

22
New South Wales Drug Court Evaluation: Cost-effectiveness
In any study where data collected for administrative purposes are subsequently used ineconomic analyses, a process of cleaning and/or manipulation is necessary. The processof data cleaning undertaken for this evaluation revealed a number of important issuesand, in order to use these data a number of assumptions were made. Many of these issuesand assumptions are detailed in the following sections that discuss the methods ofdetermining resource use and apportioning costs across the treatment and control groups.
Estimating costs for the treatment groupThe two key objectives of the costing activity were to document the resource use (costs) ofthe Drug Court and to conduct a cost-effectiveness analysis. To meet the first objective, allresources used in running the Drug Court were identified, whether these resources wereused by the treatment group, the control group or by those who were unwilling or ineligibleor by those for whom there was no place available in treatment following detoxification.For the purpose of the cost-effectiveness analysis resources used by members of thetreatment and control groups needs to be estimated and, as for the analysis of effectiveness,resource use was only identified for those individuals who were allocated to either thetreatment or control group on or before 30 June 2000.
Unless otherwise noted, expenditures considered in this evaluation included all DrugCourt resources for the financial years 1998/99, 1999/2000 and the first six months of2000/01. With respect to resource use in 2000/01, only that incurred by individualsentering the program prior to 30 June 2000 was included in the cost-effectiveness analysis.
The unit of analysis for the economic evaluation is the average cost per day. For thetreatment group this includes resource use incurred while in the Drug Court programand any incarceration following the Drug Court program that is related to the offence(s)which initiated involvement in the Drug Court. The following formula illustrates howthe average cost per day was calculated.
Equation 2
Average cost per person =(average assessment costs)
+ (average cost per day in detoxification * days in detoxification)+ (average cost of sentencing)+ (average costs per report back to court* number of reports back to court)+ (urine cost * number of urine samples)+ (probation and parole costs * number of days available)+ (cost of sanction * days in sanction)+ (average treatment costs * days available for treatment)+ (average court cost for termination and graduation appearances)+ (incarceration costs * days incarcerated)
Average cost per day = Total cost/total days
The following sections provide descriptions of how resource use and costs were capturedfor each of the types. The assumptions made about and the limitations of some of the dataused in the evaluation are also discussed.
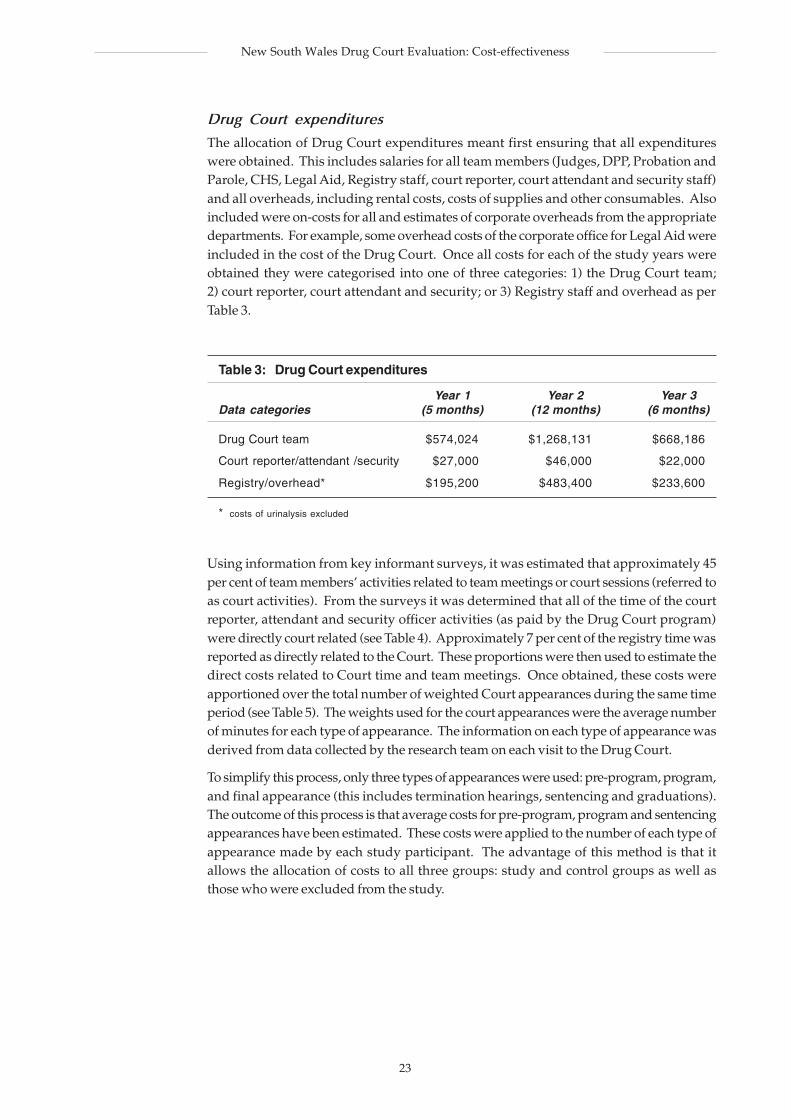
23
New South Wales Drug Court Evaluation: Cost-effectiveness
Drug Court expenditures
The allocation of Drug Court expenditures meant first ensuring that all expenditureswere obtained. This includes salaries for all team members (Judges, DPP, Probation andParole, CHS, Legal Aid, Registry staff, court reporter, court attendant and security staff)and all overheads, including rental costs, costs of supplies and other consumables. Alsoincluded were on-costs for all and estimates of corporate overheads from the appropriatedepartments. For example, some overhead costs of the corporate office for Legal Aid wereincluded in the cost of the Drug Court. Once all costs for each of the study years wereobtained they were categorised into one of three categories: 1) the Drug Court team;2) court reporter, court attendant and security; or 3) Registry staff and overhead as perTable 3.
Table 3: Drug Court expenditures
Year 1 Year 2 Year 3Data categories (5 months) (12 months) (6 months)
Drug Court team $574,024 $1,268,131 $668,186
Court reporter/attendant /security $27,000 $46,000 $22,000
Registry/overhead* $195,200 $483,400 $233,600
* costs of urinalysis excluded
Using information from key informant surveys, it was estimated that approximately 45per cent of team members’ activities related to team meetings or court sessions (referred toas court activities). From the surveys it was determined that all of the time of the courtreporter, attendant and security officer activities (as paid by the Drug Court program)were directly court related (see Table 4). Approximately 7 per cent of the registry time wasreported as directly related to the Court. These proportions were then used to estimate thedirect costs related to Court time and team meetings. Once obtained, these costs wereapportioned over the total number of weighted Court appearances during the same timeperiod (see Table 5). The weights used for the court appearances were the average numberof minutes for each type of appearance. The information on each type of appearance wasderived from data collected by the research team on each visit to the Drug Court.
To simplify this process, only three types of appearances were used: pre-program, program,and final appearance (this includes termination hearings, sentencing and graduations).The outcome of this process is that average costs for pre-program, program and sentencingappearances have been estimated. These costs were applied to the number of each type ofappearance made by each study participant. The advantage of this method is that itallows the allocation of costs to all three groups: study and control groups as well asthose who were excluded from the study.
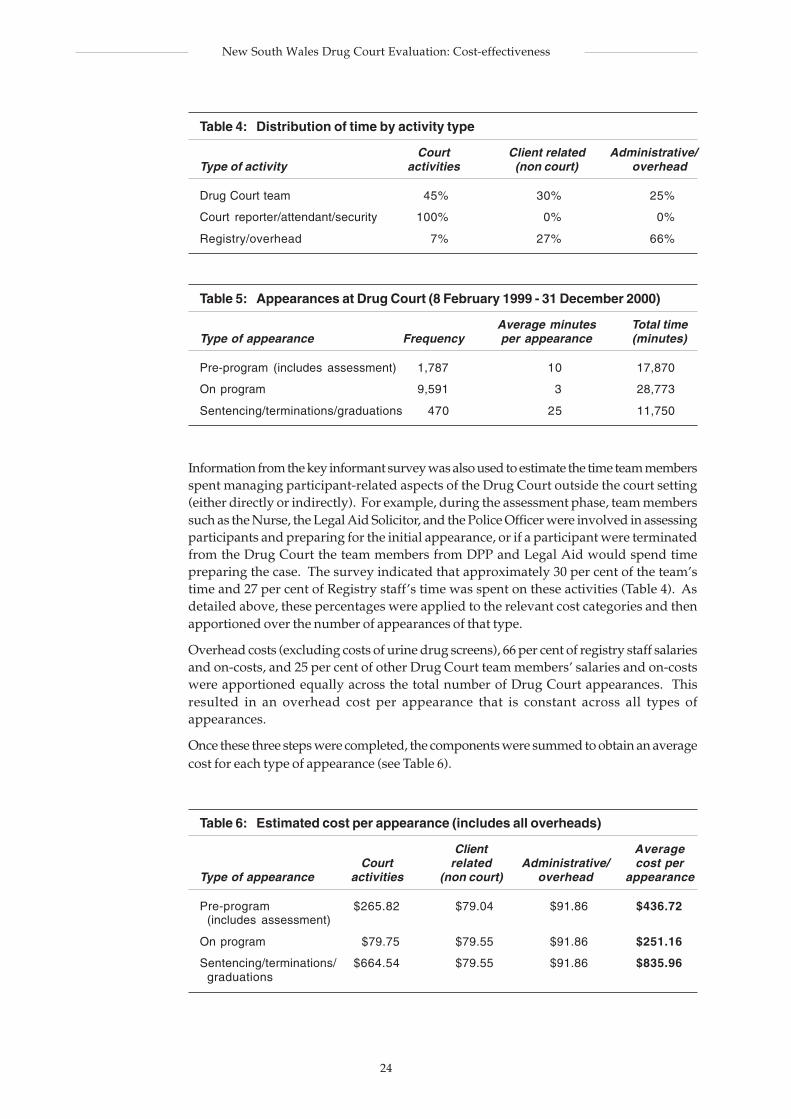
24
New South Wales Drug Court Evaluation: Cost-effectiveness
Table 4: Distribution of time by activity type
Court Client related Administrative/Type of activity activities (non court) overhead
Drug Court team 45% 30% 25%
Court reporter/attendant/security 100% 0% 0%
Registry/overhead 7% 27% 66%
Table 5: Appearances at Drug Court (8 February 1999 - 31 December 2000)
Average minutes Total timeType of appearance Frequency per appearance (minutes)
Pre-program (includes assessment) 1,787 10 17,870
On program 9,591 3 28,773
Sentencing/terminations/graduations 470 25 11,750
Information from the key informant survey was also used to estimate the time team membersspent managing participant-related aspects of the Drug Court outside the court setting(either directly or indirectly). For example, during the assessment phase, team memberssuch as the Nurse, the Legal Aid Solicitor, and the Police Officer were involved in assessingparticipants and preparing for the initial appearance, or if a participant were terminatedfrom the Drug Court the team members from DPP and Legal Aid would spend timepreparing the case. The survey indicated that approximately 30 per cent of the team’stime and 27 per cent of Registry staff’s time was spent on these activities (Table 4). Asdetailed above, these percentages were applied to the relevant cost categories and thenapportioned over the number of appearances of that type.
Overhead costs (excluding costs of urine drug screens), 66 per cent of registry staff salariesand on-costs, and 25 per cent of other Drug Court team members’ salaries and on-costswere apportioned equally across the total number of Drug Court appearances. Thisresulted in an overhead cost per appearance that is constant across all types ofappearances.
Once these three steps were completed, the components were summed to obtain an averagecost for each type of appearance (see Table 6).
Table 6: Estimated cost per appearance (includes all overheads)
Client AverageCourt related Administrative/ cost per
Type of appearance activities (non court) overhead appearance
Pre-program $265.82 $79.04 $91.86 $436.72(includes assessment)
On program $79.75 $79.55 $91.86 $251.16
Sentencing/terminations/ $664.54 $79.55 $91.86 $835.96graduations
25
New South Wales Drug Court Evaluation: Cost-effectiveness
Treatment costs
As discussed elsewhere, treatment for heroin addiction is a major part of the Drug Courtprogram. In this program, treatment was primarily provided by units in each of the threeArea Health Services included in the study area (Western Sydney, South Western Sydneyand Wentworth Area Health Services), and by residential rehabilitation programs. Initialdetoxification and treatment in gaol was managed by Corrections Health Service and thecosts of this are discussed in the section below on detoxification/treatment planningcosts.
As in other key areas, financial data on the provision of the Drug Court program wereobtained. Each of the Area Health Services provided expenditure information on salaries,operating expenses and overhead costs incurred by staff employed on the Drug Courtprogram, as well as any expenditure incurred by non Drug Court staff. Corporate overheadexpenditures for NSW Health were also included. Adjustments were made for over- orunder-expenditure of budgets. The financial data from each of the Area Health Servicesappeared to be complete and, although provided in a slightly different format, the categorieswere comparable and did not impede the analysis. In addition to the expendituresprovided, estimates of rental costs were included, based on reported use of space at eachof the Area Health Services.
Residential rehabilitation to Drug Court participants was provided by a number oftreatment centres with each facility being paid directly by NSW Health. The daily fee forresidential rehabilitation was $100 (this project did not undertake a costing of the treatmentprovided at the residential rehabilitation centres). NSW Health provided information onthe total number of days in each year for which they paid for residential rehabilitation butwere not able to provide information at an individual level (e.g. according to Drug Courtidentification number). Thus we were unable to apportion the cost of rehabilitation tothose individuals who received treatment in residential rehabilitation facilities.
In a program such as the Drug Court where resource use is expected to be higher in theearly phases of treatment, it is important for planning purposes to apportion resource usewhere or when it actually occurs. Potentially, this could be undertaken using the phasesof the program. However, when data from the Drug Court and treatment providersregarding phases of treatment were compared, they were neither complete nor compatible.In addition, as mentioned above, information that would have enabled the costs ofresidential rehabilitation to be attributed on an individual basis was not available. Inaddition, it was not possible to obtain information regarding resource use by participantsmoving between Area Health Services as data collected about this occurrence wereinconsistent.
Therefore, a pragmatic approach to apportioning expenditure was used. First, allexpenditures for the three years involved were obtained. This included NSW Healthoverhead costs, Area Health Services expenditures and the costs of residentialrehabilitation. Second, all possible days available for treatment were counted and usedto generate a cost per treatment day available. Third, this cost was applied to eachindividual based on the number of days available for treatment. An assumption wasmade that a person who was available for treatment actually received it. This assumptionmeans that for some individuals the cost of treatment is over-estimated and for others it isunder-estimated.
26
New South Wales Drug Court Evaluation: Cost-effectiveness
This method does not account for differences in resource use between participants receivingmethadone, naltrexone or abstinence treatments although we did (unsuccessfully) attemptto count the numbers of participants receiving these treatments. The costs of maintaininga person on methadone might be expected to be lower than residential rehabilitation ortreatment using naltrexone. However, the available data indicate that many participantsused different types of treatment. The cost per available day in treatment for each fiscalyear of the study are $127.50 in 1998/99; $39.93 for 1999/00 and $23.85 for the first sixmonths of 2000/01. It is of note that there is a considerable difference between the costs inthe first year and the remaining two years. There are a number of probable reasons forthis. One reason is the cost of start-up, that is, the setting up of the program and thedevelopment of protocols and procedures, most of which would have been incurred duringthe first year of the program. In addition, the program would not have had a full caseloadfrom the beginning. While an attempt was made to set aside costs designated as ‘start-upcosts’ the first year costs still remained considerably higher.
Urine screens
Counts, by participant, of urine drug screens sent to a laboratory for testing were availablefrom the Drug Court database but the number of urine tests done at the Drug Court wasnot available. The cost for each urine sample tested at a laboratory is also unknown, asthe cost per screen varies depending upon the specific tests undertaken. An average costof $18.36 per urine test was estimated using total reported expenditure on urine drugscreens, costs of gloves for handling urine samples and urine containers divided by thetotal number of urine tests sent to the laboratories. This average was then applied to eachidentified urine screen. No information was available on the number or costs of urinetests done on-site (i.e. at the court). Thus, these costs are included in the Drug Courtoverhead costs and were apportioned with other Court overheads. It should be notedthat the cost of $18.36 is somewhat lower than the average cost of $20 per unit for urinalysisand the $175 to $320 per toxicity print out. This is one area where sensitivity analysis hasbeen used to provide some additional information.
Detoxification/treatment planning costs
As part of the treatment process each participant was involved in an assessment andtreatment and detoxification program if necessary at either Metropolitan Remand andReception Centre (MRRC) for men or Mulawa (for women). Data obtained fromCorrections Health Service (CHS) included financial data, the number of inmates andaverage length of stay for both Drug Court and non Drug Court individuals at MRRC. Itappears that most CHS-type expenditures allocated to CHS are actually consumed atMRRC, with Mulawa ‘getting visits when the staff have the opportunity’. Although thismay overestimate the costs of detoxification for men and underestimate the costs forwomen, all the Drug Court expenditures were apportioned to MRRC, and, using theoverall occupancy of the detoxification unit, a cost per day in detoxification was estimated.The marginal costs of being in gaol were added to this to generate a cost per day indetoxification in MRRC. The cost for Mulawa was the cost of a day in Mulawa, plus thegeneric cost of CHS for the overall facility. The costs obtained were $243 for men and $235for women. These figures were then multiplied by the number of days per individual indetoxification (as obtained from the Drug Court database). The average length of stay inthe detoxification units was 16.8 days.
27
New South Wales Drug Court Evaluation: Cost-effectiveness
Department of Corrective Services (DCS) costs
Information on resource use from DCS was included in the analysis of total costs. Keyresource use occasions include: sanctions, detoxification (provided in part by CHS) if theparticipant was in a Corrections facility, time in gaol when the Drug Court programterminated or concluded, time in the cells at the initial point of assessment, home detentioncosts and costs of time on probation and parole. Probation and parole costs are discussedseparately below.
Time in Parramatta Court cells prior to assessment has not been included in the cost-effectiveness analysis. This is because the analysis begins at a point when the participantwas being assessed for inclusion in the Drug Court program and before she or he wasselected into the Drug Court program, placed in the control group or determined to beineligible. Thus, expenditures incurred by either group would be equal. However, theintroduction of the Drug Court appears to have had a significant impact on resource useat Parramatta Court cells. For example, it has been necessary to expand the hours of thefacility and provide additional security due to the movement of one of the ParramattaCourts to another location (to facilitate the placement of the Drug Court in the ParramattaCourthouse) and because, initially, Drug Court sanctions were served at Parramatta Courtcells.
Resources from DCS used by Drug Court participants were not captured by the datacollection established for the evaluation of this project and unit costs for many of theactivities were not available. Following discussion with senior staff and key individualsin DCS, requests were made for specific financial information. Although much of theinformation requested was not available some useful data were obtained. For the purposesof this study we have used a cost per day as provided by DCS for three facilities: ParramattaCorrectional Centre, Mulawa and MRRC (see Table 7) we were also provided with anestimate of the cost of court security at Parramatta Court, motor vehicle running costs perkilometre (for transporting inmates) and the cost per day for CHS. Costs and throughputfor the Parramatta Court cells were not made available. As the costs per inmate per dayfor the various facilities are fully absorbed costs, a decision was made to use these dailycosts alone, to avoid double counting expenditures and then to add the relevantexpenditures by the CHS. Specific expenditures not measured include additional costs ofassessment by staff of DCS and the CHS each time a participant was sanctioned. Thiswas mentioned as a key area where resource use increased with the inception of the DrugCourt, especially early in the Drug Court program when sanctions were short and frequent.We understand that practice has changed with respect to assessments but we have noway of quantifying these changes.
On entering the Drug Court program, each participant is sentenced and these sentencesare then suspended for the duration of the time the participant spends in the program.When a participant either graduates or is terminated from the program, his or her progressand sentence are reviewed and a final sentence, which may involve gaol time, communityservice, or recognisance (with or without supervision), is handed down. As data wereavailable from the Drug Court database on the sentence given to Drug Court participants,this information was used to determine possible days in gaol. To convert this to expendituredata the cost per day in gaol for an appropriate gaol was used (MRRC for men andMulawa for women). This may have overestimated costs if an individual was subsequentlytransferred to a lower security facility or if he or she was released from gaol earlier.
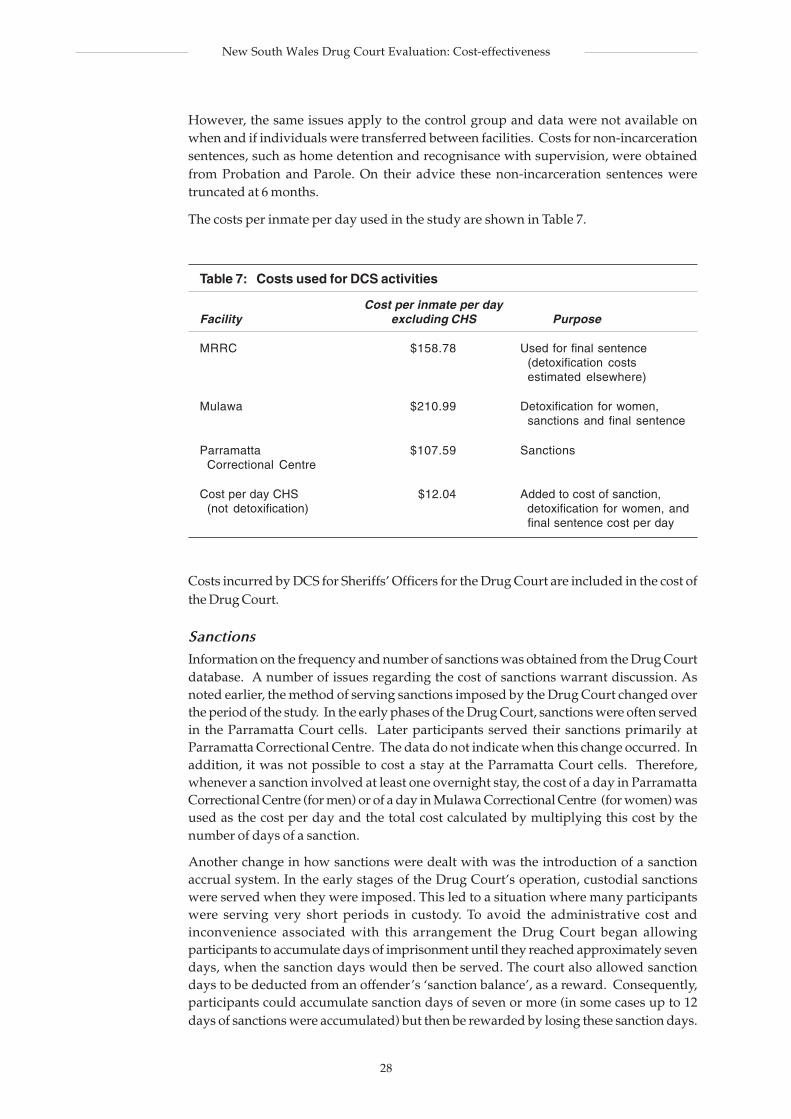
28
New South Wales Drug Court Evaluation: Cost-effectiveness
However, the same issues apply to the control group and data were not available onwhen and if individuals were transferred between facilities. Costs for non-incarcerationsentences, such as home detention and recognisance with supervision, were obtainedfrom Probation and Parole. On their advice these non-incarceration sentences weretruncated at 6 months.
The costs per inmate per day used in the study are shown in Table 7.
Table 7: Costs used for DCS activities
Cost per inmate per dayFacility excluding CHS Purpose
MRRC $158.78 Used for final sentence(detoxification costsestimated elsewhere)
Mulawa $210.99 Detoxification for women,sanctions and final sentence
Parramatta $107.59 SanctionsCorrectional Centre
Cost per day CHS $12.04 Added to cost of sanction,(not detoxification) detoxification for women, and
final sentence cost per day
Costs incurred by DCS for Sheriffs’ Officers for the Drug Court are included in the cost ofthe Drug Court.
SanctionsInformation on the frequency and number of sanctions was obtained from the Drug Courtdatabase. A number of issues regarding the cost of sanctions warrant discussion. Asnoted earlier, the method of serving sanctions imposed by the Drug Court changed overthe period of the study. In the early phases of the Drug Court, sanctions were often servedin the Parramatta Court cells. Later participants served their sanctions primarily atParramatta Correctional Centre. The data do not indicate when this change occurred. Inaddition, it was not possible to cost a stay at the Parramatta Court cells. Therefore,whenever a sanction involved at least one overnight stay, the cost of a day in ParramattaCorrectional Centre (for men) or of a day in Mulawa Correctional Centre (for women) wasused as the cost per day and the total cost calculated by multiplying this cost by thenumber of days of a sanction.
Another change in how sanctions were dealt with was the introduction of a sanctionaccrual system. In the early stages of the Drug Court’s operation, custodial sanctionswere served when they were imposed. This led to a situation where many participantswere serving very short periods in custody. To avoid the administrative cost andinconvenience associated with this arrangement the Drug Court began allowingparticipants to accumulate days of imprisonment until they reached approximately sevendays, when the sanction days would then be served. The court also allowed sanctiondays to be deducted from an offender’s ‘sanction balance’, as a reward. Consequently,participants could accumulate sanction days of seven or more (in some cases up to 12days of sanctions were accumulated) but then be rewarded by losing these sanction days.
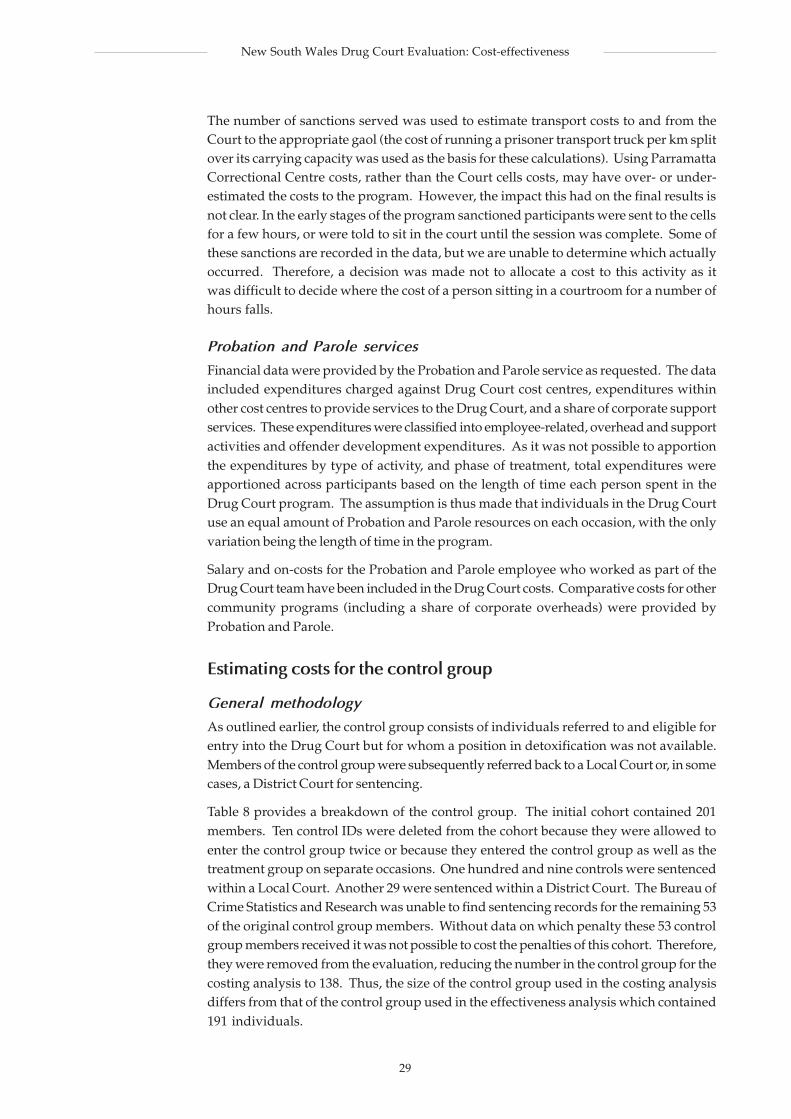
29
New South Wales Drug Court Evaluation: Cost-effectiveness
The number of sanctions served was used to estimate transport costs to and from theCourt to the appropriate gaol (the cost of running a prisoner transport truck per km splitover its carrying capacity was used as the basis for these calculations). Using ParramattaCorrectional Centre costs, rather than the Court cells costs, may have over- or under-estimated the costs to the program. However, the impact this had on the final results isnot clear. In the early stages of the program sanctioned participants were sent to the cellsfor a few hours, or were told to sit in the court until the session was complete. Some ofthese sanctions are recorded in the data, but we are unable to determine which actuallyoccurred. Therefore, a decision was made not to allocate a cost to this activity as itwas difficult to decide where the cost of a person sitting in a courtroom for a number ofhours falls.
Probation and Parole services
Financial data were provided by the Probation and Parole service as requested. The dataincluded expenditures charged against Drug Court cost centres, expenditures withinother cost centres to provide services to the Drug Court, and a share of corporate supportservices. These expenditures were classified into employee-related, overhead and supportactivities and offender development expenditures. As it was not possible to apportionthe expenditures by type of activity, and phase of treatment, total expenditures wereapportioned across participants based on the length of time each person spent in theDrug Court program. The assumption is thus made that individuals in the Drug Courtuse an equal amount of Probation and Parole resources on each occasion, with the onlyvariation being the length of time in the program.
Salary and on-costs for the Probation and Parole employee who worked as part of theDrug Court team have been included in the Drug Court costs. Comparative costs for othercommunity programs (including a share of corporate overheads) were provided byProbation and Parole.
Estimating costs for the control group
General methodology
As outlined earlier, the control group consists of individuals referred to and eligible forentry into the Drug Court but for whom a position in detoxification was not available.Members of the control group were subsequently referred back to a Local Court or, in somecases, a District Court for sentencing.
Table 8 provides a breakdown of the control group. The initial cohort contained 201members. Ten control IDs were deleted from the cohort because they were allowed toenter the control group twice or because they entered the control group as well as thetreatment group on separate occasions. One hundred and nine controls were sentencedwithin a Local Court. Another 29 were sentenced within a District Court. The Bureau ofCrime Statistics and Research was unable to find sentencing records for the remaining 53of the original control group members. Without data on which penalty these 53 controlgroup members received it was not possible to cost the penalties of this cohort. Therefore,they were removed from the evaluation, reducing the number in the control group for thecosting analysis to 138. Thus, the size of the control group used in the costing analysisdiffers from that of the control group used in the effectiveness analysis which contained191 individuals.
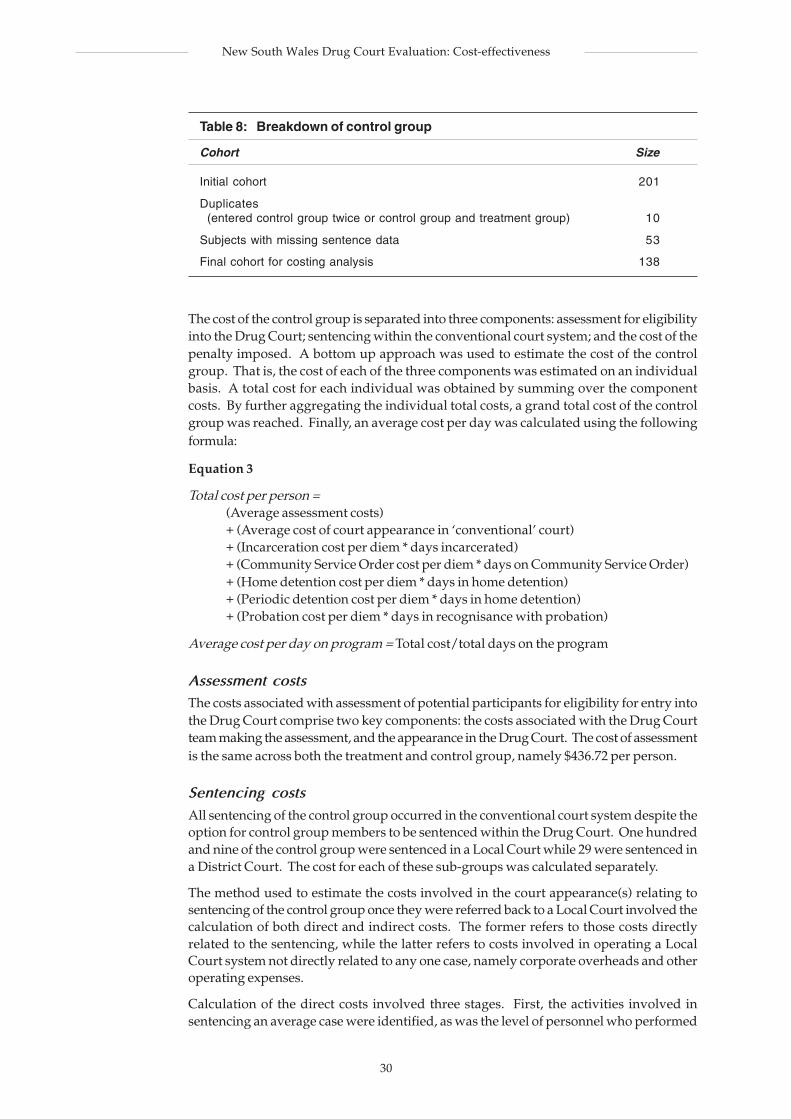
30
New South Wales Drug Court Evaluation: Cost-effectiveness
Table 8: Breakdown of control group
Cohort Size
Initial cohort 201
Duplicates(entered control group twice or control group and treatment group) 10
Subjects with missing sentence data 53
Final cohort for costing analysis 138
The cost of the control group is separated into three components: assessment for eligibilityinto the Drug Court; sentencing within the conventional court system; and the cost of thepenalty imposed. A bottom up approach was used to estimate the cost of the controlgroup. That is, the cost of each of the three components was estimated on an individualbasis. A total cost for each individual was obtained by summing over the componentcosts. By further aggregating the individual total costs, a grand total cost of the controlgroup was reached. Finally, an average cost per day was calculated using the followingformula:
Equation 3
Total cost per person =(Average assessment costs)+ (Average cost of court appearance in ‘conventional’ court)+ (Incarceration cost per diem * days incarcerated)+ (Community Service Order cost per diem * days on Community Service Order)+ (Home detention cost per diem * days in home detention)+ (Periodic detention cost per diem * days in home detention)+ (Probation cost per diem * days in recognisance with probation)
Average cost per day on program = Total cost/total days on the program
Assessment costsThe costs associated with assessment of potential participants for eligibility for entry intothe Drug Court comprise two key components: the costs associated with the Drug Courtteam making the assessment, and the appearance in the Drug Court. The cost of assessmentis the same across both the treatment and control group, namely $436.72 per person.
Sentencing costsAll sentencing of the control group occurred in the conventional court system despite theoption for control group members to be sentenced within the Drug Court. One hundredand nine of the control group were sentenced in a Local Court while 29 were sentenced ina District Court. The cost for each of these sub-groups was calculated separately.
The method used to estimate the costs involved in the court appearance(s) relating tosentencing of the control group once they were referred back to a Local Court involved thecalculation of both direct and indirect costs. The former refers to those costs directlyrelated to the sentencing, while the latter refers to costs involved in operating a LocalCourt system not directly related to any one case, namely corporate overheads and otheroperating expenses.
Calculation of the direct costs involved three stages. First, the activities involved insentencing an average case were identified, as was the level of personnel who performed
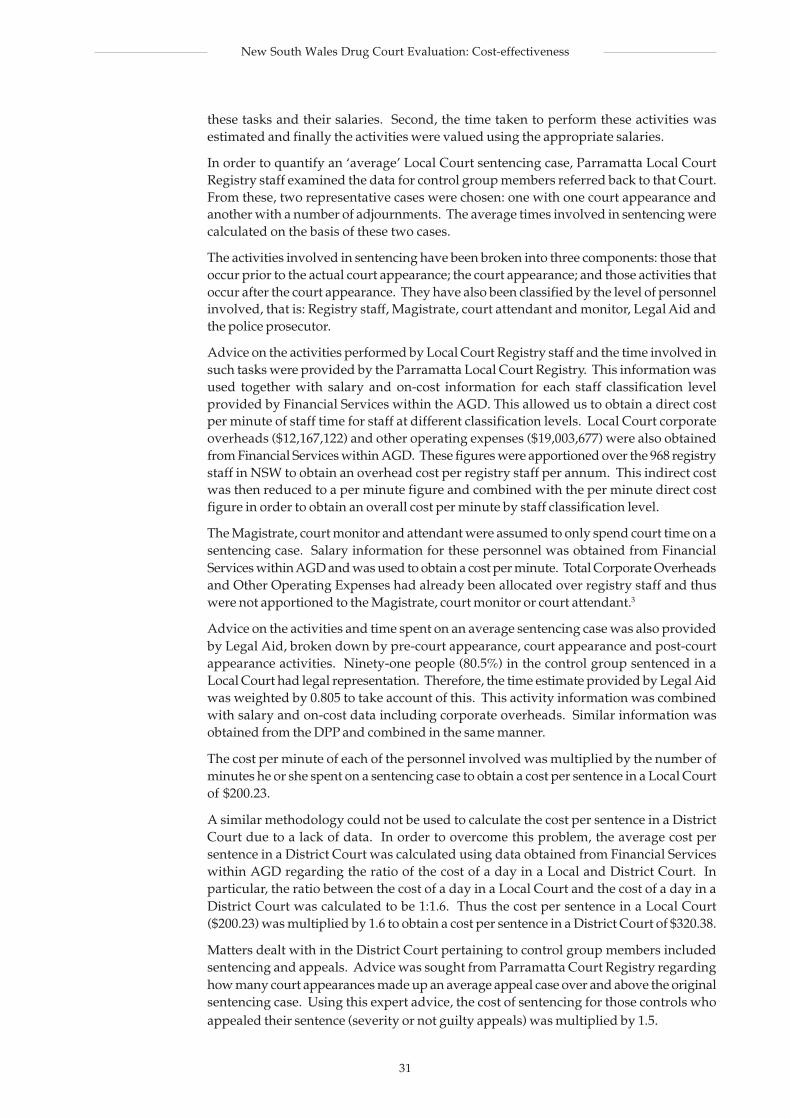
31
New South Wales Drug Court Evaluation: Cost-effectiveness
these tasks and their salaries. Second, the time taken to perform these activities wasestimated and finally the activities were valued using the appropriate salaries.
In order to quantify an ‘average’ Local Court sentencing case, Parramatta Local CourtRegistry staff examined the data for control group members referred back to that Court.From these, two representative cases were chosen: one with one court appearance andanother with a number of adjournments. The average times involved in sentencing werecalculated on the basis of these two cases.
The activities involved in sentencing have been broken into three components: those thatoccur prior to the actual court appearance; the court appearance; and those activities thatoccur after the court appearance. They have also been classified by the level of personnelinvolved, that is: Registry staff, Magistrate, court attendant and monitor, Legal Aid andthe police prosecutor.
Advice on the activities performed by Local Court Registry staff and the time involved insuch tasks were provided by the Parramatta Local Court Registry. This information wasused together with salary and on-cost information for each staff classification levelprovided by Financial Services within the AGD. This allowed us to obtain a direct costper minute of staff time for staff at different classification levels. Local Court corporateoverheads ($12,167,122) and other operating expenses ($19,003,677) were also obtainedfrom Financial Services within AGD. These figures were apportioned over the 968 registrystaff in NSW to obtain an overhead cost per registry staff per annum. This indirect costwas then reduced to a per minute figure and combined with the per minute direct costfigure in order to obtain an overall cost per minute by staff classification level.
The Magistrate, court monitor and attendant were assumed to only spend court time on asentencing case. Salary information for these personnel was obtained from FinancialServices within AGD and was used to obtain a cost per minute. Total Corporate Overheadsand Other Operating Expenses had already been allocated over registry staff and thuswere not apportioned to the Magistrate, court monitor or court attendant.3
Advice on the activities and time spent on an average sentencing case was also providedby Legal Aid, broken down by pre-court appearance, court appearance and post-courtappearance activities. Ninety-one people (80.5%) in the control group sentenced in aLocal Court had legal representation. Therefore, the time estimate provided by Legal Aidwas weighted by 0.805 to take account of this. This activity information was combinedwith salary and on-cost data including corporate overheads. Similar information wasobtained from the DPP and combined in the same manner.
The cost per minute of each of the personnel involved was multiplied by the number ofminutes he or she spent on a sentencing case to obtain a cost per sentence in a Local Courtof $200.23.
A similar methodology could not be used to calculate the cost per sentence in a DistrictCourt due to a lack of data. In order to overcome this problem, the average cost persentence in a District Court was calculated using data obtained from Financial Serviceswithin AGD regarding the ratio of the cost of a day in a Local and District Court. Inparticular, the ratio between the cost of a day in a Local Court and the cost of a day in aDistrict Court was calculated to be 1:1.6. Thus the cost per sentence in a Local Court($200.23) was multiplied by 1.6 to obtain a cost per sentence in a District Court of $320.38.
Matters dealt with in the District Court pertaining to control group members includedsentencing and appeals. Advice was sought from Parramatta Court Registry regardinghow many court appearances made up an average appeal case over and above the originalsentencing case. Using this expert advice, the cost of sentencing for those controls whoappealed their sentence (severity or not guilty appeals) was multiplied by 1.5.
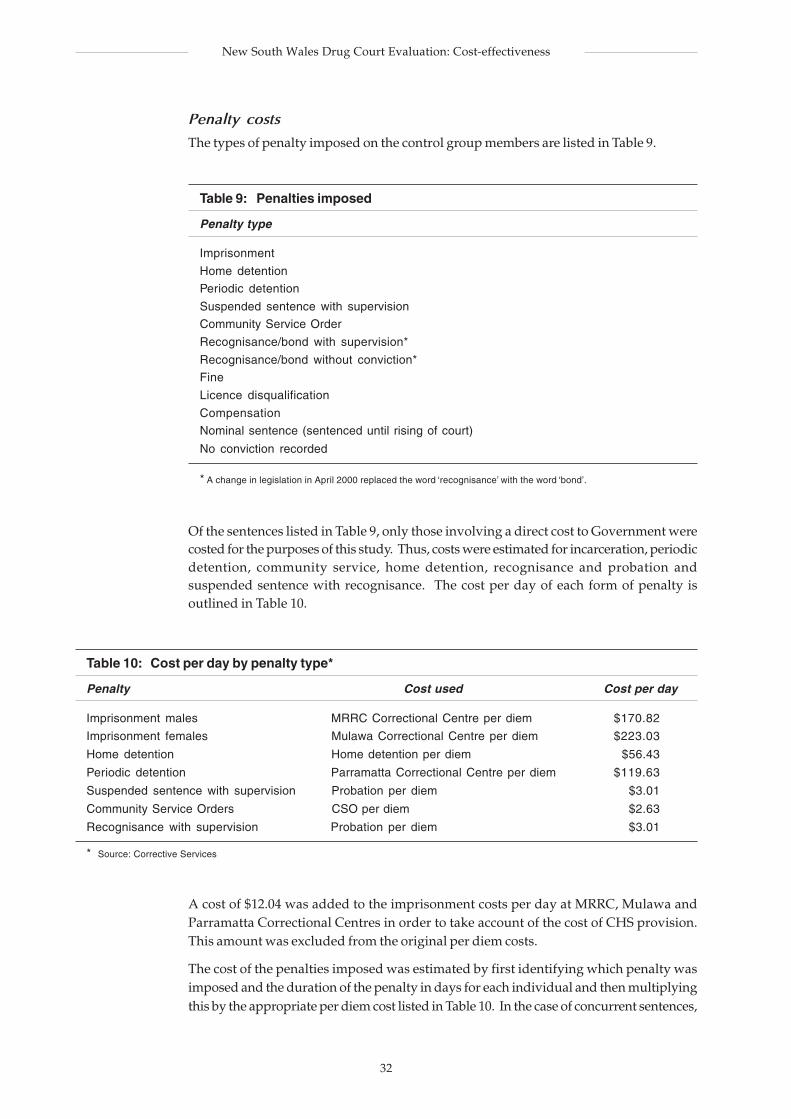
32
New South Wales Drug Court Evaluation: Cost-effectiveness
Penalty costs
The types of penalty imposed on the control group members are listed in Table 9.
Table 9: Penalties imposed
Penalty type
Imprisonment
Home detention
Periodic detention
Suspended sentence with supervision
Community Service Order
Recognisance/bond with supervision*
Recognisance/bond without conviction*
Fine
Licence disqualification
Compensation
Nominal sentence (sentenced until rising of court)
No conviction recorded
* A change in legislation in April 2000 replaced the word ‘recognisance’ with the word ‘bond’.
Of the sentences listed in Table 9, only those involving a direct cost to Government werecosted for the purposes of this study. Thus, costs were estimated for incarceration, periodicdetention, community service, home detention, recognisance and probation andsuspended sentence with recognisance. The cost per day of each form of penalty isoutlined in Table 10.
Table 10: Cost per day by penalty type*
Penalty Cost used Cost per day
Imprisonment males MRRC Correctional Centre per diem $170.82
Imprisonment females Mulawa Correctional Centre per diem $223.03
Home detention Home detention per diem $56.43
Periodic detention Parramatta Correctional Centre per diem $119.63
Suspended sentence with supervision Probation per diem $3.01
Community Service Orders CSO per diem $2.63
Recognisance with supervision Probation per diem $3.01
* Source: Corrective Services
A cost of $12.04 was added to the imprisonment costs per day at MRRC, Mulawa andParramatta Correctional Centres in order to take account of the cost of CHS provision.This amount was excluded from the original per diem costs.
The cost of the penalties imposed was estimated by first identifying which penalty wasimposed and the duration of the penalty in days for each individual and then multiplyingthis by the appropriate per diem cost listed in Table 10. In the case of concurrent sentences,
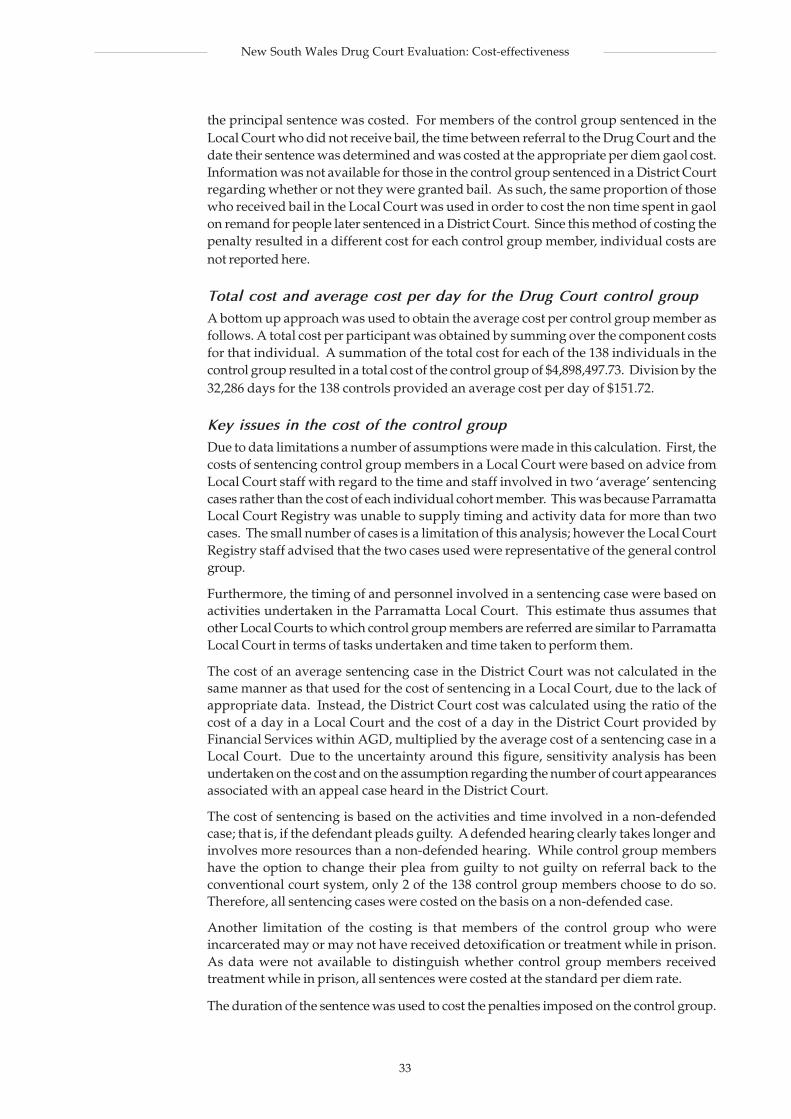
33
New South Wales Drug Court Evaluation: Cost-effectiveness
the principal sentence was costed. For members of the control group sentenced in theLocal Court who did not receive bail, the time between referral to the Drug Court and thedate their sentence was determined and was costed at the appropriate per diem gaol cost.Information was not available for those in the control group sentenced in a District Courtregarding whether or not they were granted bail. As such, the same proportion of thosewho received bail in the Local Court was used in order to cost the non time spent in gaolon remand for people later sentenced in a District Court. Since this method of costing thepenalty resulted in a different cost for each control group member, individual costs arenot reported here.
Total cost and average cost per day for the Drug Court control groupA bottom up approach was used to obtain the average cost per control group member asfollows. A total cost per participant was obtained by summing over the component costsfor that individual. A summation of the total cost for each of the 138 individuals in thecontrol group resulted in a total cost of the control group of $4,898,497.73. Division by the32,286 days for the 138 controls provided an average cost per day of $151.72.
Key issues in the cost of the control groupDue to data limitations a number of assumptions were made in this calculation. First, thecosts of sentencing control group members in a Local Court were based on advice fromLocal Court staff with regard to the time and staff involved in two ‘average’ sentencingcases rather than the cost of each individual cohort member. This was because ParramattaLocal Court Registry was unable to supply timing and activity data for more than twocases. The small number of cases is a limitation of this analysis; however the Local CourtRegistry staff advised that the two cases used were representative of the general controlgroup.
Furthermore, the timing of and personnel involved in a sentencing case were based onactivities undertaken in the Parramatta Local Court. This estimate thus assumes thatother Local Courts to which control group members are referred are similar to ParramattaLocal Court in terms of tasks undertaken and time taken to perform them.
The cost of an average sentencing case in the District Court was not calculated in thesame manner as that used for the cost of sentencing in a Local Court, due to the lack ofappropriate data. Instead, the District Court cost was calculated using the ratio of thecost of a day in a Local Court and the cost of a day in the District Court provided byFinancial Services within AGD, multiplied by the average cost of a sentencing case in aLocal Court. Due to the uncertainty around this figure, sensitivity analysis has beenundertaken on the cost and on the assumption regarding the number of court appearancesassociated with an appeal case heard in the District Court.
The cost of sentencing is based on the activities and time involved in a non-defendedcase; that is, if the defendant pleads guilty. A defended hearing clearly takes longer andinvolves more resources than a non-defended hearing. While control group membershave the option to change their plea from guilty to not guilty on referral back to theconventional court system, only 2 of the 138 control group members choose to do so.Therefore, all sentencing cases were costed on the basis on a non-defended case.
Another limitation of the costing is that members of the control group who wereincarcerated may or may not have received detoxification or treatment while in prison.As data were not available to distinguish whether control group members receivedtreatment while in prison, all sentences were costed at the standard per diem rate.
The duration of the sentence was used to cost the penalties imposed on the control group.
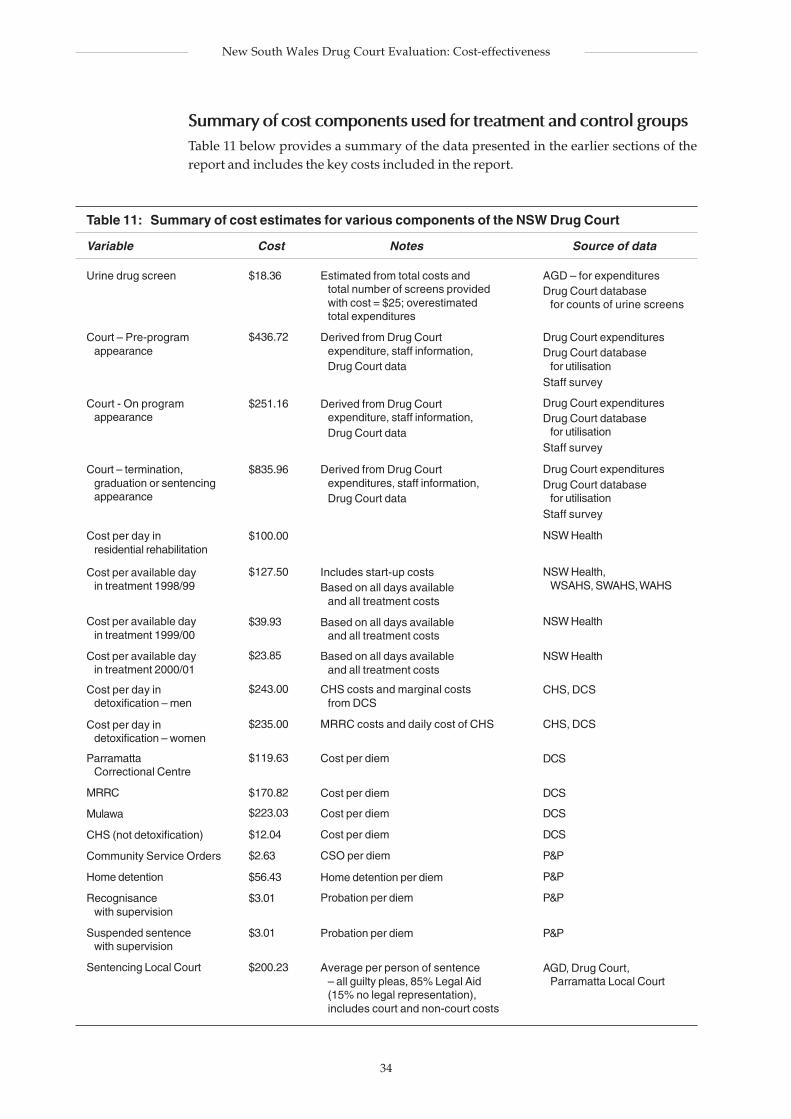
34
New South Wales Drug Court Evaluation: Cost-effectiveness
Summary of cost components used for treatment and control groupsTable 11 below provides a summary of the data presented in the earlier sections of thereport and includes the key costs included in the report.
Table 11: Summary of cost estimates for various components of the NSW Drug Court
Variable Cost Notes Source of data
Urine drug screen
Court – Pre-programappearance
Court - On programappearance
Court – termination,graduation or sentencingappearance
Cost per day inresidential rehabilitation
Cost per available dayin treatment 1998/99
Cost per available dayin treatment 1999/00
Cost per available dayin treatment 2000/01
Cost per day indetoxification – men
Cost per day indetoxification – women
ParramattaCorrectional Centre
MRRC
Mulawa
CHS (not detoxification)
Community Service Orders
Home detention
Recognisancewith supervision
Suspended sentencewith supervision
Sentencing Local Court
$18.36
$436.72
$251.16
$835.96
$100.00
$127.50
$39.93
$23.85
$243.00
$235.00
$119.63
$170.82
$223.03
$12.04
$2.63
$56.43
$3.01
$3.01
$200.23
AGD – for expendituresDrug Court database
for counts of urine screens
Drug Court expendituresDrug Court database
for utilisationStaff survey
Drug Court expendituresDrug Court database
for utilisationStaff survey
Drug Court expendituresDrug Court database
for utilisationStaff survey
NSW Health
NSW Health,WSAHS, SWAHS, WAHS
NSW Health
NSW Health
CHS, DCS
CHS, DCS
DCS
DCS
DCS
DCS
P&P
P&P
P&P
P&P
AGD, Drug Court,Parramatta Local Court
Estimated from total costs andtotal number of screens providedwith cost = $25; overestimatedtotal expenditures
Derived from Drug Courtexpenditure, staff information,Drug Court data
Derived from Drug Courtexpenditure, staff information,Drug Court data
Derived from Drug Courtexpenditures, staff information,Drug Court data
Includes start-up costsBased on all days available
and all treatment costs
Based on all days availableand all treatment costs
Based on all days availableand all treatment costs
CHS costs and marginal costsfrom DCS
MRRC costs and daily cost of CHS
Cost per diem
Cost per diem
Cost per diem
Cost per diem
CSO per diem
Home detention per diem
Probation per diem
Probation per diem
Average per person of sentence– all guilty pleas, 85% Legal Aid(15% no legal representation),includes court and non-court costs
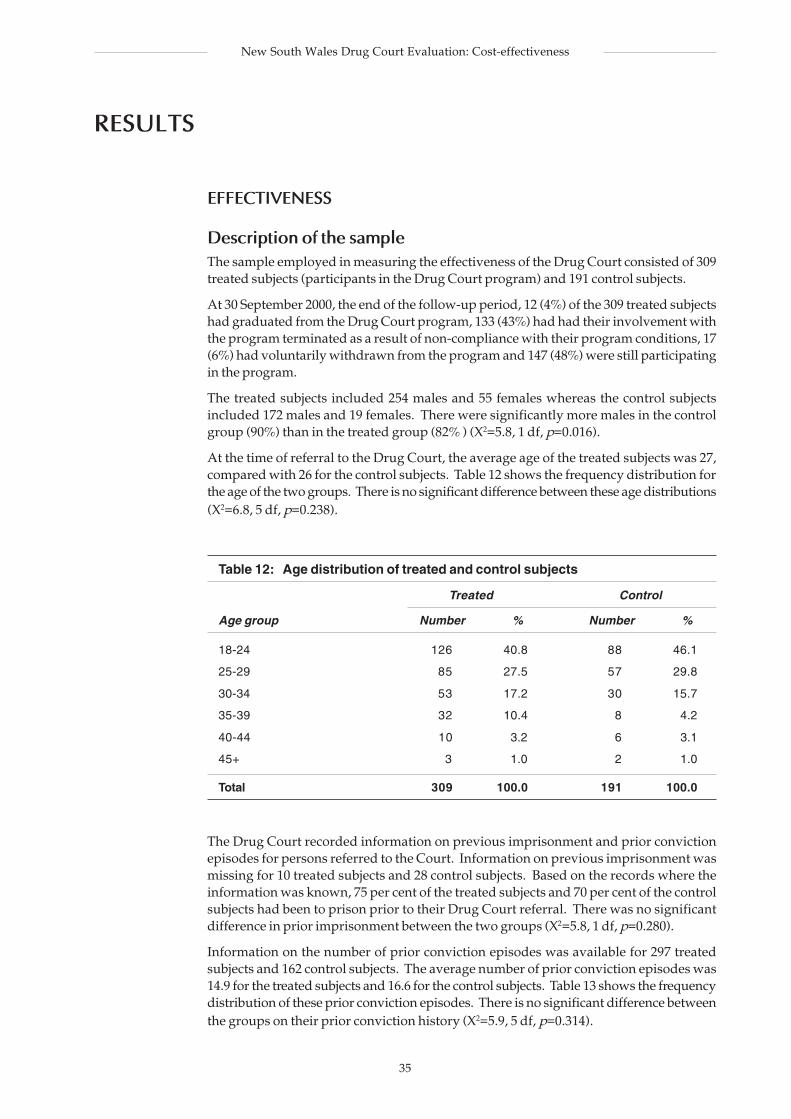
35
New South Wales Drug Court Evaluation: Cost-effectiveness
RESULTS
EFFECTIVENESS
Description of the sampleThe sample employed in measuring the effectiveness of the Drug Court consisted of 309treated subjects (participants in the Drug Court program) and 191 control subjects.
At 30 September 2000, the end of the follow-up period, 12 (4%) of the 309 treated subjectshad graduated from the Drug Court program, 133 (43%) had had their involvement withthe program terminated as a result of non-compliance with their program conditions, 17(6%) had voluntarily withdrawn from the program and 147 (48%) were still participatingin the program.
The treated subjects included 254 males and 55 females whereas the control subjectsincluded 172 males and 19 females. There were significantly more males in the controlgroup (90%) than in the treated group (82% ) (X2=5.8, 1 df, p=0.016).
At the time of referral to the Drug Court, the average age of the treated subjects was 27,compared with 26 for the control subjects. Table 12 shows the frequency distribution forthe age of the two groups. There is no significant difference between these age distributions(X2=6.8, 5 df, p=0.238).
Table 12: Age distribution of treated and control subjects
Treated Control
Age group Number % Number %
18-24 126 40.8 88 46.1
25-29 85 27.5 57 29.8
30-34 53 17.2 30 15.7
35-39 32 10.4 8 4.2
40-44 10 3.2 6 3.1
45+ 3 1.0 2 1.0
Total 309 100.0 191 100.0
The Drug Court recorded information on previous imprisonment and prior convictionepisodes for persons referred to the Court. Information on previous imprisonment wasmissing for 10 treated subjects and 28 control subjects. Based on the records where theinformation was known, 75 per cent of the treated subjects and 70 per cent of the controlsubjects had been to prison prior to their Drug Court referral. There was no significantdifference in prior imprisonment between the two groups (X2=5.8, 1 df, p=0.280).
Information on the number of prior conviction episodes was available for 297 treatedsubjects and 162 control subjects. The average number of prior conviction episodes was14.9 for the treated subjects and 16.6 for the control subjects. Table 13 shows the frequencydistribution of these prior conviction episodes. There is no significant difference betweenthe groups on their prior conviction history (X2=5.9, 5 df, p=0.314).
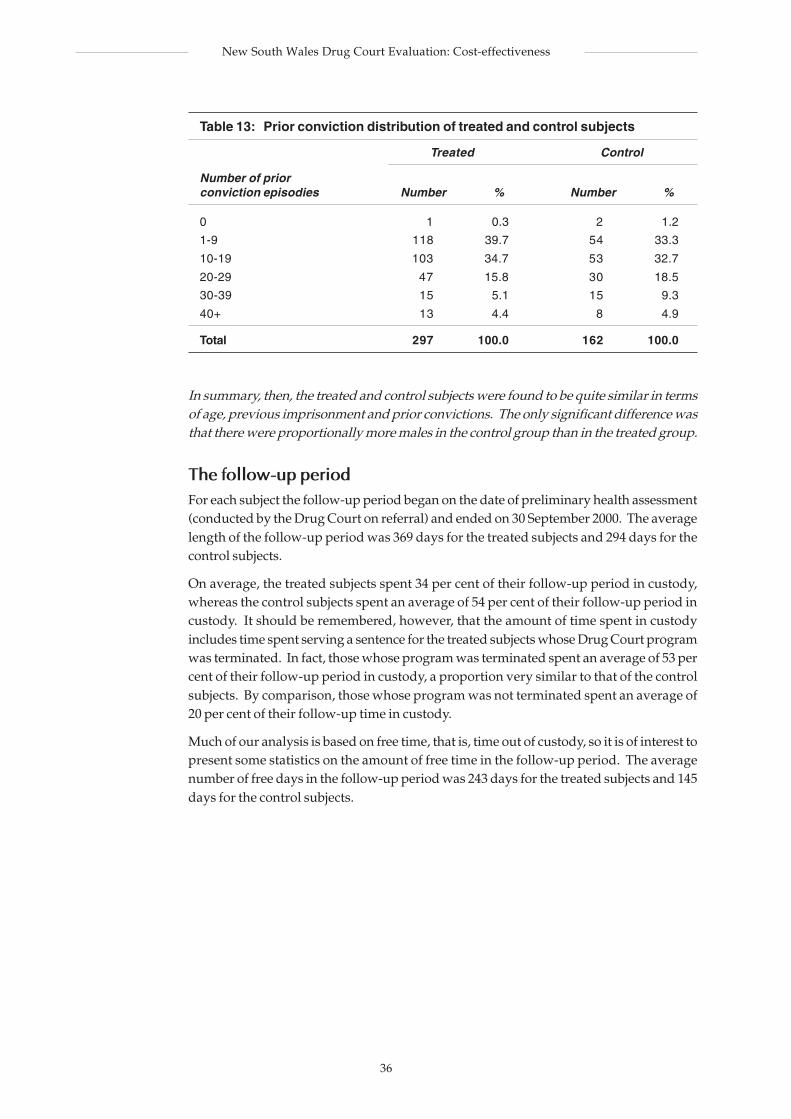
36
New South Wales Drug Court Evaluation: Cost-effectiveness
Table 13: Prior conviction distribution of treated and control subjects
Treated Control
Number of priorconviction episodies Number % Number %
0 1 0.3 2 1.2
1-9 118 39.7 54 33.3
10-19 103 34.7 53 32.7
20-29 47 15.8 30 18.5
30-39 15 5.1 15 9.3
40+ 13 4.4 8 4.9
Total 297 100.0 162 100.0
In summary, then, the treated and control subjects were found to be quite similar in termsof age, previous imprisonment and prior convictions. The only significant difference wasthat there were proportionally more males in the control group than in the treated group.
The follow-up periodFor each subject the follow-up period began on the date of preliminary health assessment(conducted by the Drug Court on referral) and ended on 30 September 2000. The averagelength of the follow-up period was 369 days for the treated subjects and 294 days for thecontrol subjects.
On average, the treated subjects spent 34 per cent of their follow-up period in custody,whereas the control subjects spent an average of 54 per cent of their follow-up period incustody. It should be remembered, however, that the amount of time spent in custodyincludes time spent serving a sentence for the treated subjects whose Drug Court programwas terminated. In fact, those whose program was terminated spent an average of 53 percent of their follow-up period in custody, a proportion very similar to that of the controlsubjects. By comparison, those whose program was not terminated spent an average of20 per cent of their follow-up time in custody.
Much of our analysis is based on free time, that is, time out of custody, so it is of interest topresent some statistics on the amount of free time in the follow-up period. The averagenumber of free days in the follow-up period was 243 days for the treated subjects and 145days for the control subjects.
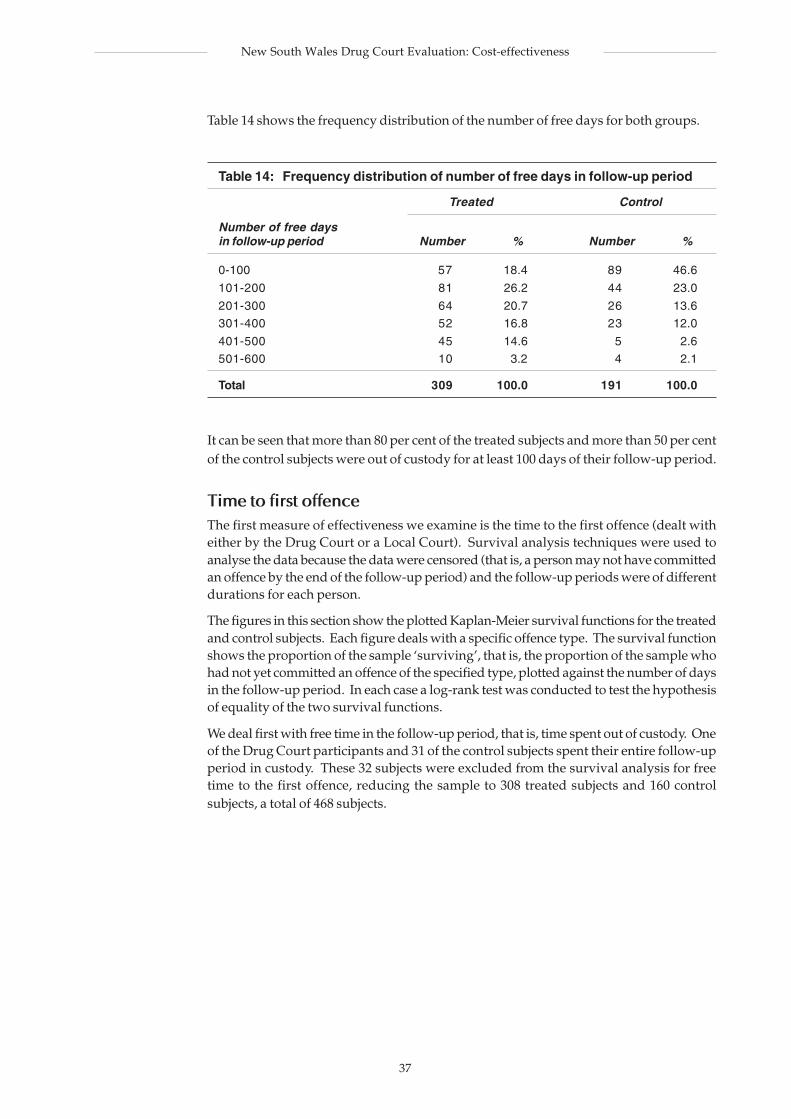
37
New South Wales Drug Court Evaluation: Cost-effectiveness
Table 14 shows the frequency distribution of the number of free days for both groups.
Table 14: Frequency distribution of number of free days in follow-up period
Treated Control
Number of free daysin follow-up period Number % Number %
0-100 57 18.4 89 46.6
101-200 81 26.2 44 23.0
201-300 64 20.7 26 13.6
301-400 52 16.8 23 12.0
401-500 45 14.6 5 2.6
501-600 10 3.2 4 2.1
Total 309 100.0 191 100.0
It can be seen that more than 80 per cent of the treated subjects and more than 50 per centof the control subjects were out of custody for at least 100 days of their follow-up period.
Time to first offenceThe first measure of effectiveness we examine is the time to the first offence (dealt witheither by the Drug Court or a Local Court). Survival analysis techniques were used toanalyse the data because the data were censored (that is, a person may not have committedan offence by the end of the follow-up period) and the follow-up periods were of differentdurations for each person.
The figures in this section show the plotted Kaplan-Meier survival functions for the treatedand control subjects. Each figure deals with a specific offence type. The survival functionshows the proportion of the sample ‘surviving’, that is, the proportion of the sample whohad not yet committed an offence of the specified type, plotted against the number of daysin the follow-up period. In each case a log-rank test was conducted to test the hypothesisof equality of the two survival functions.
We deal first with free time in the follow-up period, that is, time spent out of custody. Oneof the Drug Court participants and 31 of the control subjects spent their entire follow-upperiod in custody. These 32 subjects were excluded from the survival analysis for freetime to the first offence, reducing the sample to 308 treated subjects and 160 controlsubjects, a total of 468 subjects.
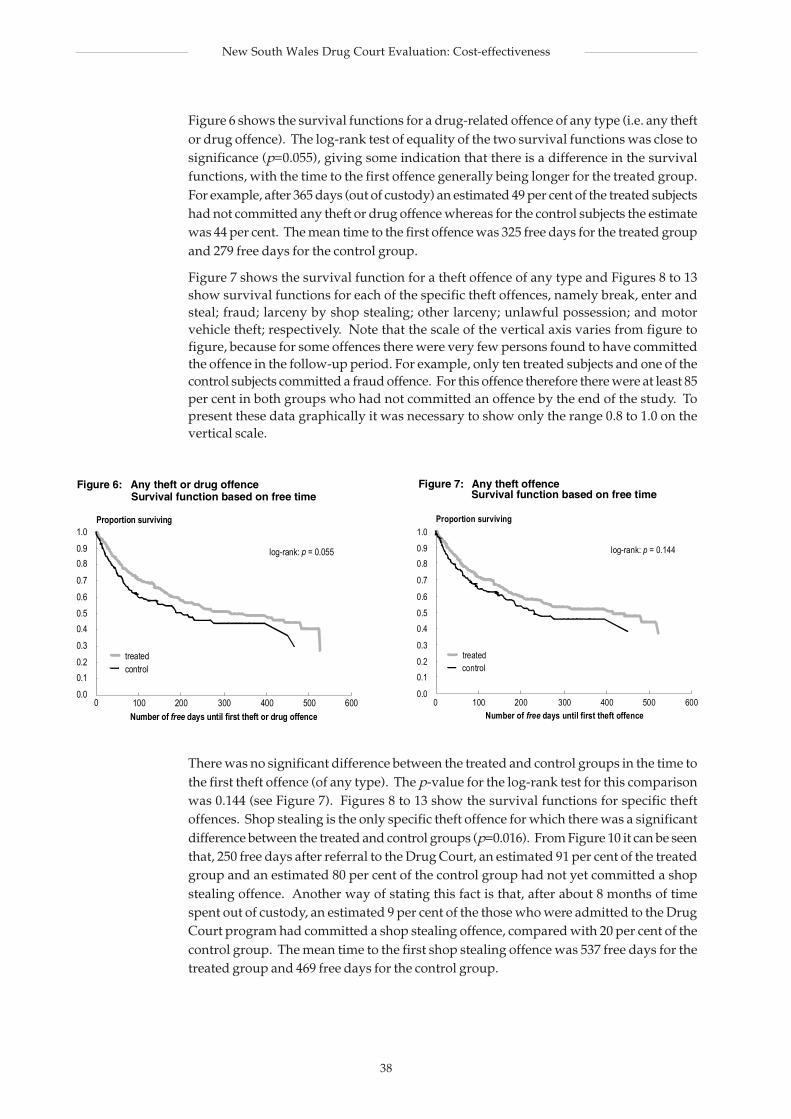
38
New South Wales Drug Court Evaluation: Cost-effectiveness
Figure 6 shows the survival functions for a drug-related offence of any type (i.e. any theftor drug offence). The log-rank test of equality of the two survival functions was close tosignificance (p=0.055), giving some indication that there is a difference in the survivalfunctions, with the time to the first offence generally being longer for the treated group.For example, after 365 days (out of custody) an estimated 49 per cent of the treated subjectshad not committed any theft or drug offence whereas for the control subjects the estimatewas 44 per cent. The mean time to the first offence was 325 free days for the treated groupand 279 free days for the control group.
Figure 7 shows the survival function for a theft offence of any type and Figures 8 to 13show survival functions for each of the specific theft offences, namely break, enter andsteal; fraud; larceny by shop stealing; other larceny; unlawful possession; and motorvehicle theft; respectively. Note that the scale of the vertical axis varies from figure tofigure, because for some offences there were very few persons found to have committedthe offence in the follow-up period. For example, only ten treated subjects and one of thecontrol subjects committed a fraud offence. For this offence therefore there were at least 85per cent in both groups who had not committed an offence by the end of the study. Topresent these data graphically it was necessary to show only the range 0.8 to 1.0 on thevertical scale.
There was no significant difference between the treated and control groups in the time tothe first theft offence (of any type). The p-value for the log-rank test for this comparisonwas 0.144 (see Figure 7). Figures 8 to 13 show the survival functions for specific theftoffences. Shop stealing is the only specific theft offence for which there was a significantdifference between the treated and control groups (p=0.016). From Figure 10 it can be seenthat, 250 free days after referral to the Drug Court, an estimated 91 per cent of the treatedgroup and an estimated 80 per cent of the control group had not yet committed a shopstealing offence. Another way of stating this fact is that, after about 8 months of timespent out of custody, an estimated 9 per cent of the those who were admitted to the DrugCourt program had committed a shop stealing offence, compared with 20 per cent of thecontrol group. The mean time to the first shop stealing offence was 537 free days for thetreated group and 469 free days for the control group.
Proportion surviving1.0
Number of free days until first theft or drug offence
100 200 300 400 500
Figure 6: Any theft or drug offenceSurvival function based on free time
600
0.9
0.8
0.7
0.6
0.5
0.4
0.00
0.1
0.2
0.3
controltreated
log-rank: p = 0.055
Figure 7: Any theft offenceSurvival function based on free time
Proportion surviving1.0
Number of free days until first theft offence100 200 300 400 500 600
0.9
0.8
0.7
0.6
0.5
0.4
0.00
0.1
0.2
0.3
controltreated
log-rank: p = 0.144
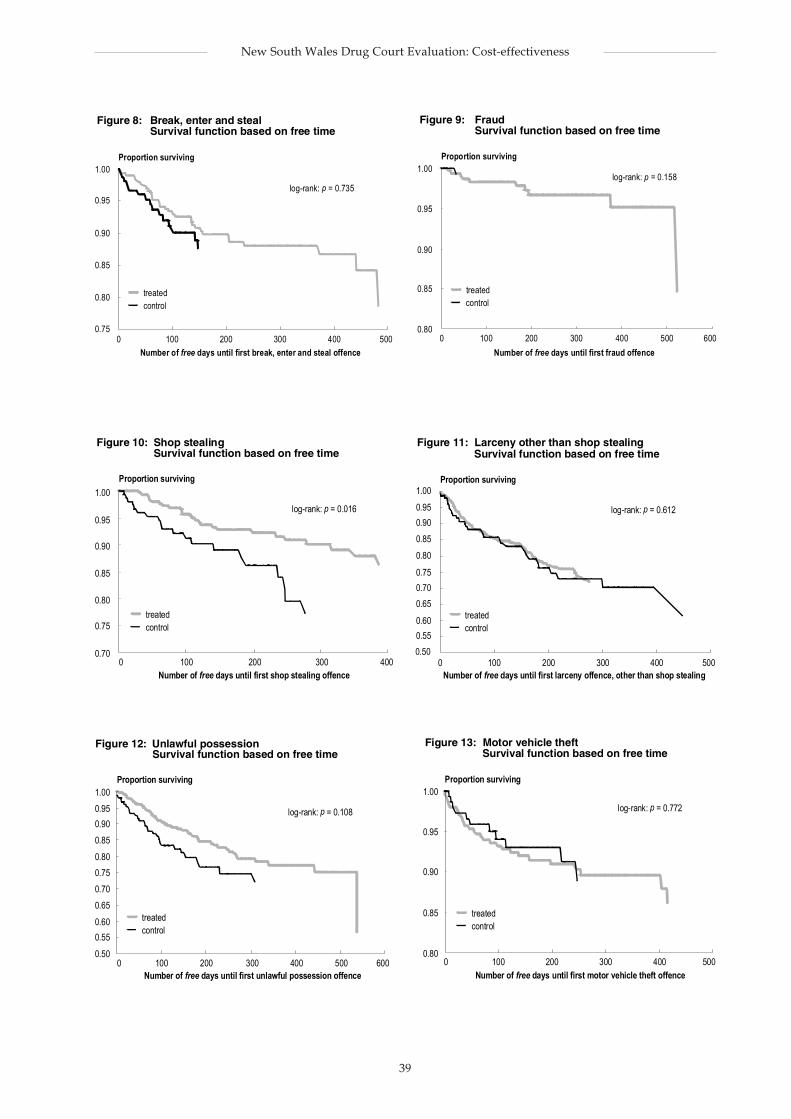
39
New South Wales Drug Court Evaluation: Cost-effectiveness
controltreated
log-rank: p = 0.735
Proportion surviving1.00
Number of free days until first break, enter and steal offence
100 200 300 400 500
Figure 8: Break, enter and stealSurvival function based on free time
0.95
0.90
0.85
0.750
0.80
Proportion surviving1.00
Number of free days until first fraud offence
100 200 300 400 500
Figure 9: FraudSurvival function based on free time
0.95
0.90
0.85
00.80
600
controltreated
log-rank: p = 0.158
Proportion surviving
1.00
Number of free days until first shop stealing offence100 200 300 400
Figure 10: Shop stealingSurvival function based on free time
0.95
0.90
0.85
0.700
0.75
0.80
controltreated
log-rank: p = 0.016
controltreated
log-rank: p = 0.612
Proportion surviving1.00
Number of free days until first larceny offence, other than shop stealing100 200 300 400 500
0.95
0.90
0.85
0.80
0.75
0.70
0.500
0.55
0.60
0.65
Figure 11: Larceny other than shop stealingSurvival function based on free time
Proportion surviving1.00
Number of free days until first unlawful possession offence
Figure 12: Unlawful possessionSurvival function based on free time
0.95
0.90
0.85
0.80
0.75
0.70
0.500
0.55
0.60
0.65
100 200 300 400 500 600
controltreated
log-rank: p = 0.108 log-rank: p = 0.772
controltreated
Proportion surviving1.00
Number of free days until first motor vehicle theft offence100 200 300 400 500
0.95
0.90
0.85
0.800
Figure 13: Motor vehicle theftSurvival function based on free time
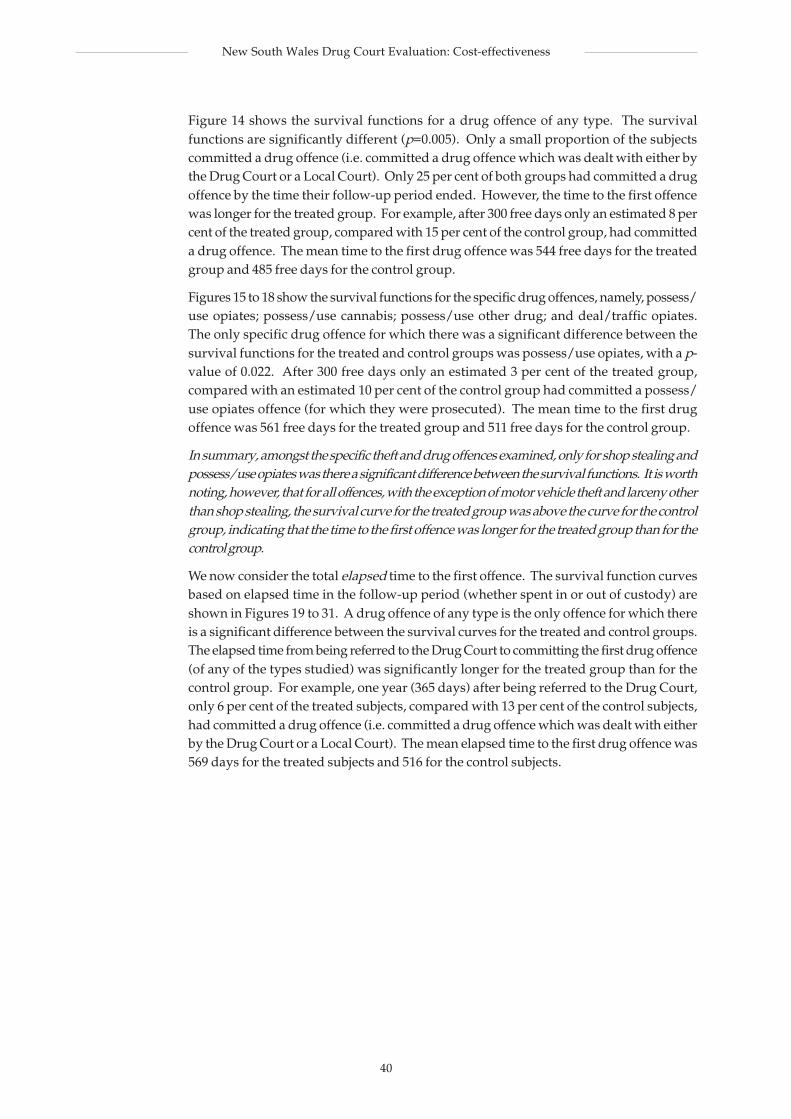
40
New South Wales Drug Court Evaluation: Cost-effectiveness
Figure 14 shows the survival functions for a drug offence of any type. The survivalfunctions are significantly different (p=0.005). Only a small proportion of the subjectscommitted a drug offence (i.e. committed a drug offence which was dealt with either bythe Drug Court or a Local Court). Only 25 per cent of both groups had committed a drugoffence by the time their follow-up period ended. However, the time to the first offencewas longer for the treated group. For example, after 300 free days only an estimated 8 percent of the treated group, compared with 15 per cent of the control group, had committeda drug offence. The mean time to the first drug offence was 544 free days for the treatedgroup and 485 free days for the control group.
Figures 15 to 18 show the survival functions for the specific drug offences, namely, possess/use opiates; possess/use cannabis; possess/use other drug; and deal/traffic opiates.The only specific drug offence for which there was a significant difference between thesurvival functions for the treated and control groups was possess/use opiates, with a p-value of 0.022. After 300 free days only an estimated 3 per cent of the treated group,compared with an estimated 10 per cent of the control group had committed a possess/use opiates offence (for which they were prosecuted). The mean time to the first drugoffence was 561 free days for the treated group and 511 free days for the control group.
In summary, amongst the specific theft and drug offences examined, only for shop stealing andpossess/use opiates was there a significant difference between the survival functions. It is worthnoting, however, that for all offences, with the exception of motor vehicle theft and larceny otherthan shop stealing, the survival curve for the treated group was above the curve for the controlgroup, indicating that the time to the first offence was longer for the treated group than for thecontrol group.
We now consider the total elapsed time to the first offence. The survival function curvesbased on elapsed time in the follow-up period (whether spent in or out of custody) areshown in Figures 19 to 31. A drug offence of any type is the only offence for which thereis a significant difference between the survival curves for the treated and control groups.The elapsed time from being referred to the Drug Court to committing the first drug offence(of any of the types studied) was significantly longer for the treated group than for thecontrol group. For example, one year (365 days) after being referred to the Drug Court,only 6 per cent of the treated subjects, compared with 13 per cent of the control subjects,had committed a drug offence (i.e. committed a drug offence which was dealt with eitherby the Drug Court or a Local Court). The mean elapsed time to the first drug offence was569 days for the treated subjects and 516 for the control subjects.
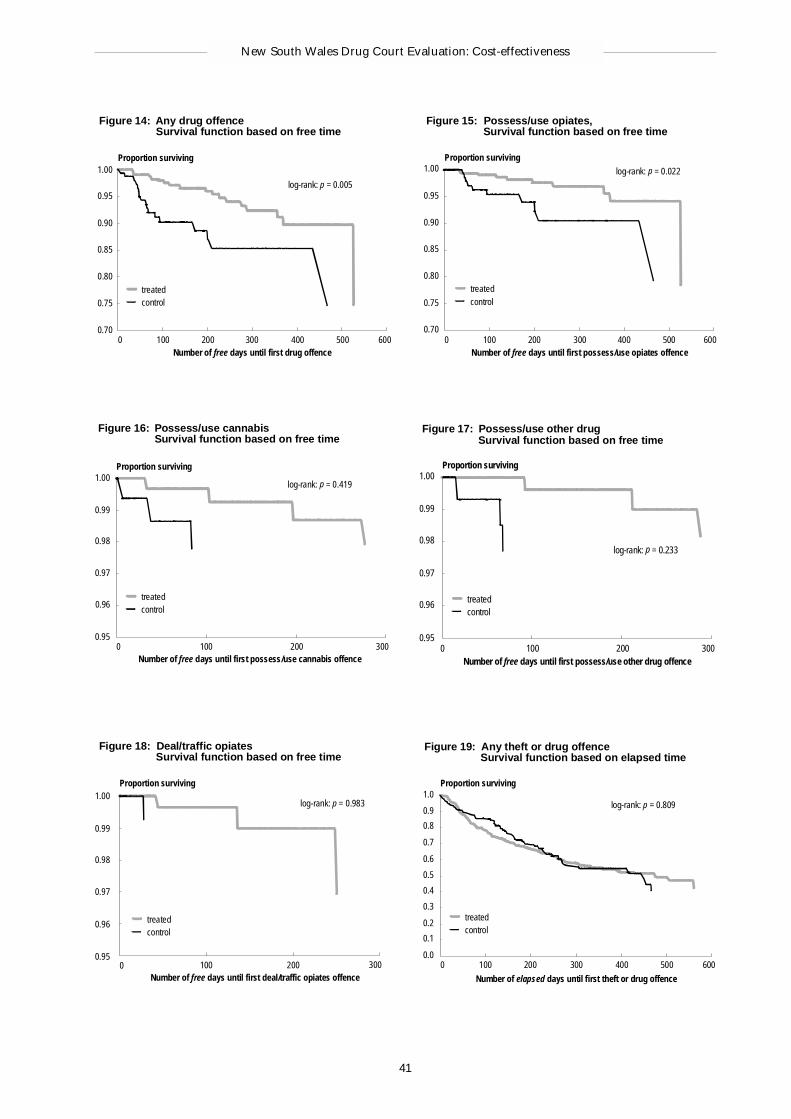
41
New South Wales Drug Court Evaluation: Cost-effectiveness
Proportion surviving1.00
Number of free days until first drug offence100 200 300 400 500
0.90
0.85
0.75
00.70
600
Figure 14: Any drug offenceSurvival function based on free time
0.80
0.95log-rank: p = 0.005
controltreated
Proportion surviving1.00
Number of free days until first possess/use opiates offence100 200 300 400 500
0.90
0.85
0.75
00.70
600
Figure 15: Possess/use opiates,Survival function based on free time
0.80
0.95
log-rank: p = 0.022
controltreated
Proportion surviving1.00
Number of free days until first possess/use cannabis offence100 200 300
Figure 16: Possess/use cannabisSurvival function based on free time
0.99
0.98
0.97
0.950
0.96
log-rank: p = 0.419
controltreated
Proportion surviving1.00
Number of free days until first possess/use other drug offence100 200 300
Figure 17: Possess/use other drugSurvival function based on free time
0.99
0.98
0.97
0.950
0.96
log-rank: p = 0.233
controltreated
Proportion surviving1.00
Number of free days until first deal/traffic opiates offence100 200 300
Figure 18: Deal/traffic opiatesSurvival function based on free time
0.99
0.98
0.97
0.950
0.96
log-rank: p = 0.983
controltreated
Proportion surviving1.0
Number of elapsed days until first theft or drug offence
0.9
0.8
0.7
0.6
0.5
0.4
0.0
0.1
0.2
0.3
Figure 19: Any theft or drug offenceSurvival function based on elapsed time
log-rank: p = 0.809
controltreated
100 200 300 400 500 6000
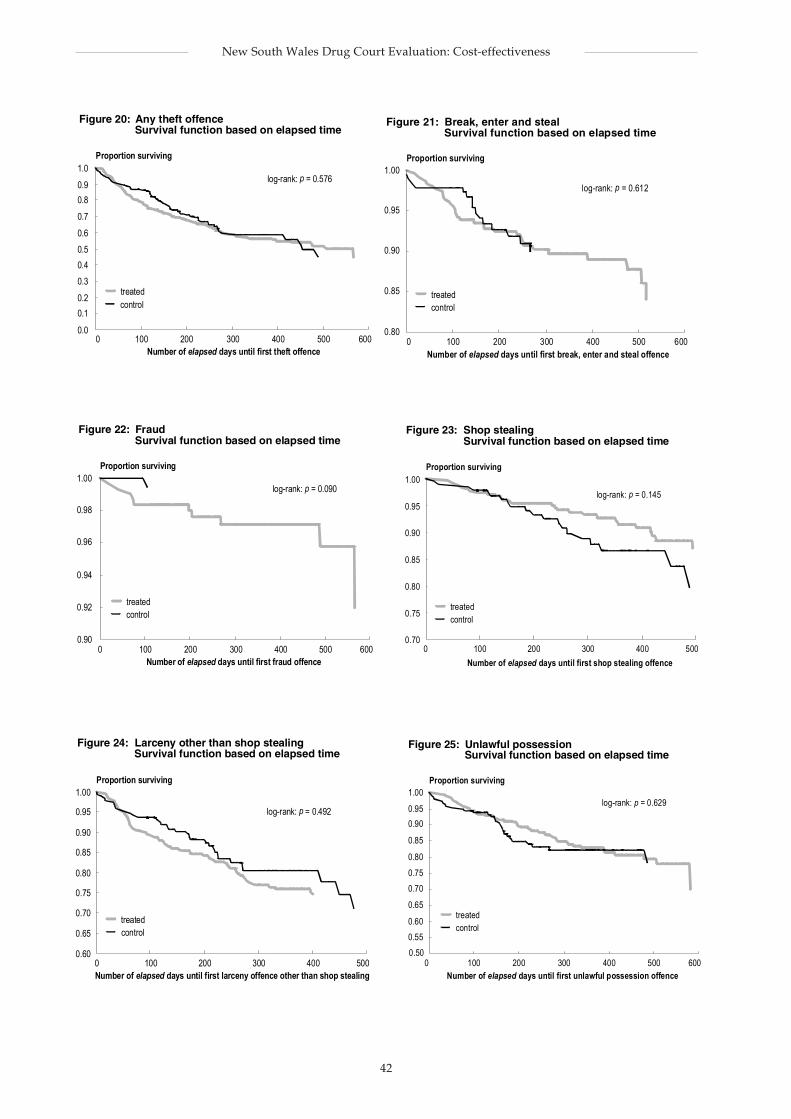
42
New South Wales Drug Court Evaluation: Cost-effectiveness
Proportion surviving1.0
Number of elapsed days until first theft offence100 200 300 400 500 600
0.9
0.8
0.7
0.6
0.5
0.4
0.00
0.1
0.2
0.3
Figure 20: Any theft offenceSurvival function based on elapsed time
log-rank: p = 0.576
controltreated
Proportion surviving1.00
Number of elapsed days until first break, enter and steal offence100 200 300 400 500 600
0.95
0.90
0.800
0.85
Figure 21: Break, enter and stealSurvival function based on elapsed time
log-rank: p = 0.612
controltreated
log-rank: p = 0.090
controltreated
Proportion surviving1.00
Number of elapsed days until first fraud offence100 200 300 400 500 600
0.98
0.96
0.900
Figure 22: FraudSurvival function based on elapsed time
0.94
0.92
Proportion surviving1.00
Number of elapsed days until first shop stealing offence
100 200 300 400 500
0.95
0.90
0.85
0.80
0
Figure 23: Shop stealingSurvival function based on elapsed time
0.70
0.75
log-rank: p = 0.145
controltreated
log-rank: p = 0.492
controltreated
Proportion surviving1.00
Number of elapsed days until first larceny offence other than shop stealing100 200 300 400 500
0.95
0.90
0.85
0.80
0
Figure 24: Larceny other than shop stealingSurvival function based on elapsed time
0.70
0.75
0.65
0.60
Proportion surviving1.00
Number of elapsed days until first unlawful possession offence100 200 300 400 500 600
0.95
0.90
0.85
0.80
0.75
0.70
0.500
0.55
0.60
0.65
Figure 25: Unlawful possessionSurvival function based on elapsed time
log-rank: p = 0.629
controltreated
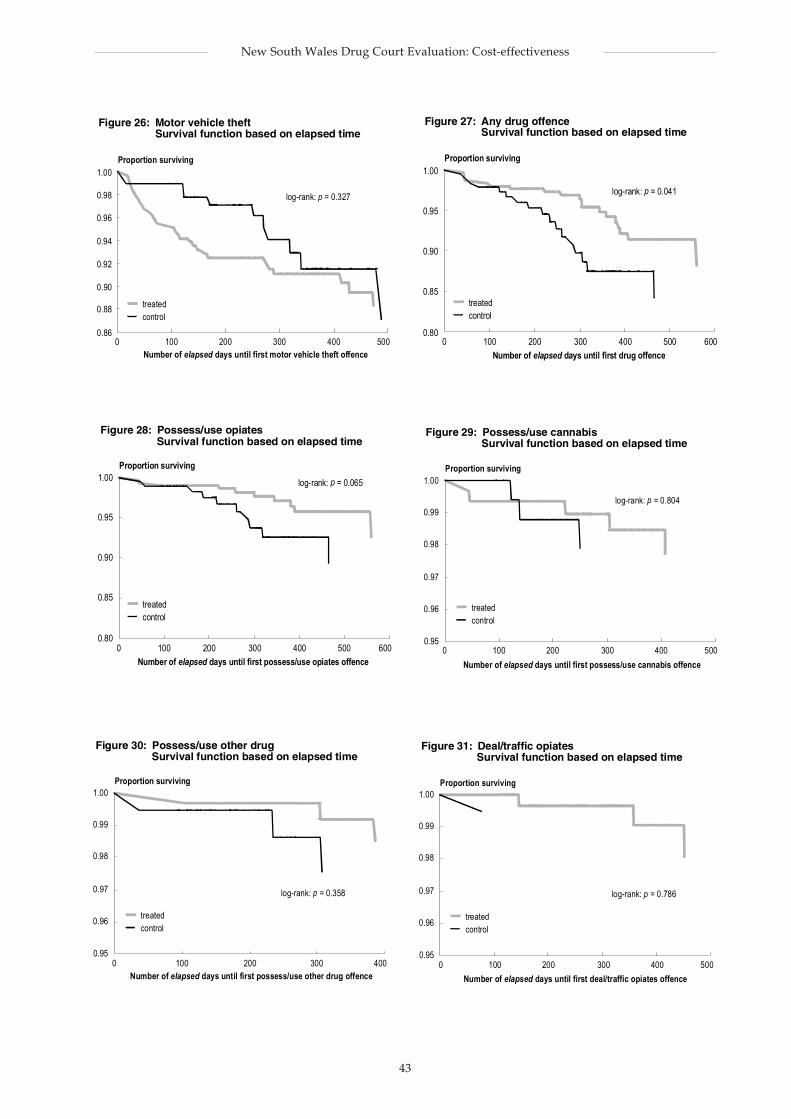
43
New South Wales Drug Court Evaluation: Cost-effectiveness
Proportion surviving1.00
Number of elapsed days until first motor vehicle theft offence100 200 300 400 500
0.98
0.96
0.94
0.92
0
Figure 26: Motor vehicle theftSurvival function based on elapsed time
0.88
0.90
0.86
log-rank: p = 0.327
controltreated
log-rank: p = 0.041
controltreated
Proportion surviving1.00
Number of elapsed days until first drug offence
100 200 300 400 500 600
0.95
0.90
0.800
0.85
Figure 27: Any drug offenceSurvival function based on elapsed time
Proportion surviving1.00
Number of elapsed days until first possess/use opiates offence
100 200 300 400 500 600
0.95
0.90
0.800
0.85
Figure 28: Possess/use opiatesSurvival function based on elapsed time
log-rank: p = 0.065
controltreated
log-rank: p = 0.804
controltreated
Proportion surviving1.00
Number of elapsed days until first possess/use cannabis offence
100 200 300 400 500
0.99
0.98
0.950
Figure 29: Possess/use cannabisSurvival function based on elapsed time
0.97
0.96
log-rank: p = 0.358
controltreated
Proportion surviving1.00
Number of elapsed days until first possess/use other drug offence100 200 300 400
0.99
0.98
0.950
Figure 30: Possess/use other drugSurvival function based on elapsed time
0.97
0.96
Proportion surviving1.00
Number of elapsed days until first deal/traffic opiates offence
100 200 300 400 500
0.99
0.98
0.950
Figure 31: Deal/traffic opiatesSurvival function based on elapsed time
0.97
0.96
log-rank: p = 0.786
controltreated
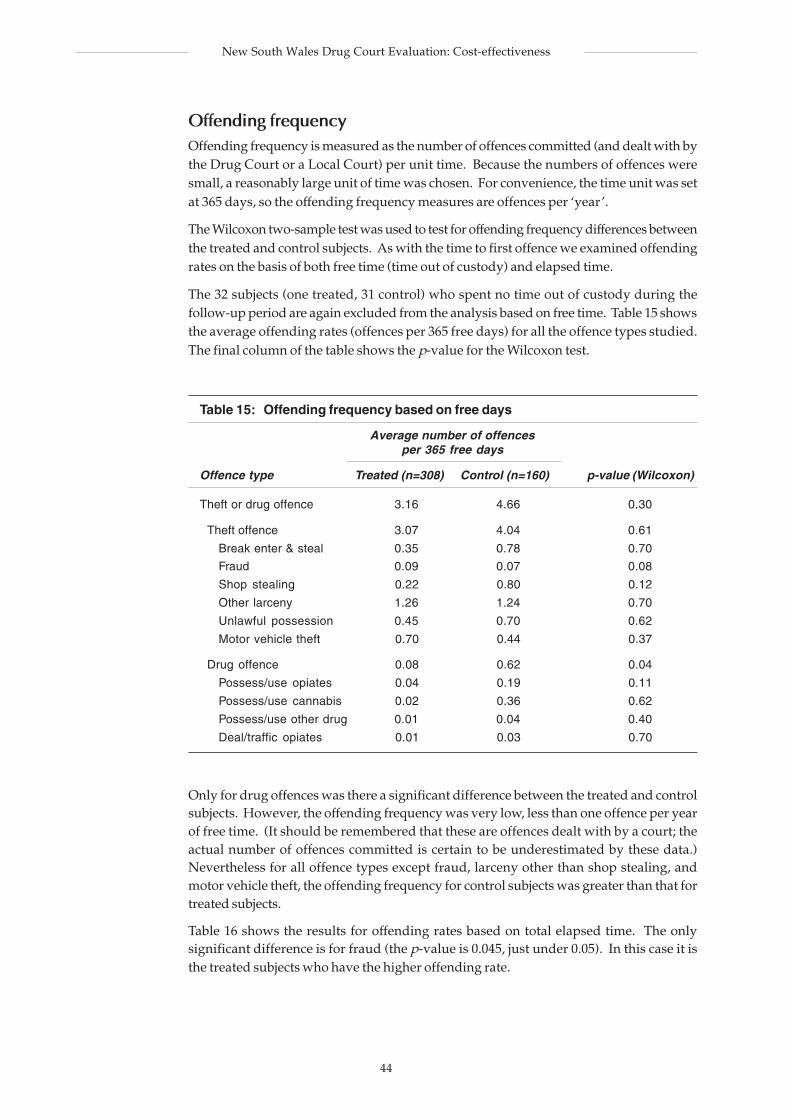
44
New South Wales Drug Court Evaluation: Cost-effectiveness
Offending frequencyOffending frequency is measured as the number of offences committed (and dealt with bythe Drug Court or a Local Court) per unit time. Because the numbers of offences weresmall, a reasonably large unit of time was chosen. For convenience, the time unit was setat 365 days, so the offending frequency measures are offences per ‘year’.
The Wilcoxon two-sample test was used to test for offending frequency differences betweenthe treated and control subjects. As with the time to first offence we examined offendingrates on the basis of both free time (time out of custody) and elapsed time.
The 32 subjects (one treated, 31 control) who spent no time out of custody during thefollow-up period are again excluded from the analysis based on free time. Table 15 showsthe average offending rates (offences per 365 free days) for all the offence types studied.The final column of the table shows the p-value for the Wilcoxon test.
Table 15: Offending frequency based on free days
Average number of offencesper 365 free days
Offence type Treated (n=308) Control (n=160) p-value (Wilcoxon)
Theft or drug offence 3.16 4.66 0.30
Theft offence 3.07 4.04 0.61
Break enter & steal 0.35 0.78 0.70
Fraud 0.09 0.07 0.08
Shop stealing 0.22 0.80 0.12
Other larceny 1.26 1.24 0.70
Unlawful possession 0.45 0.70 0.62
Motor vehicle theft 0.70 0.44 0.37
Drug offence 0.08 0.62 0.04
Possess/use opiates 0.04 0.19 0.11
Possess/use cannabis 0.02 0.36 0.62
Possess/use other drug 0.01 0.04 0.40
Deal/traffic opiates 0.01 0.03 0.70
Only for drug offences was there a significant difference between the treated and controlsubjects. However, the offending frequency was very low, less than one offence per yearof free time. (It should be remembered that these are offences dealt with by a court; theactual number of offences committed is certain to be underestimated by these data.)Nevertheless for all offence types except fraud, larceny other than shop stealing, andmotor vehicle theft, the offending frequency for control subjects was greater than that fortreated subjects.
Table 16 shows the results for offending rates based on total elapsed time. The onlysignificant difference is for fraud (the p-value is 0.045, just under 0.05). In this case it isthe treated subjects who have the higher offending rate.
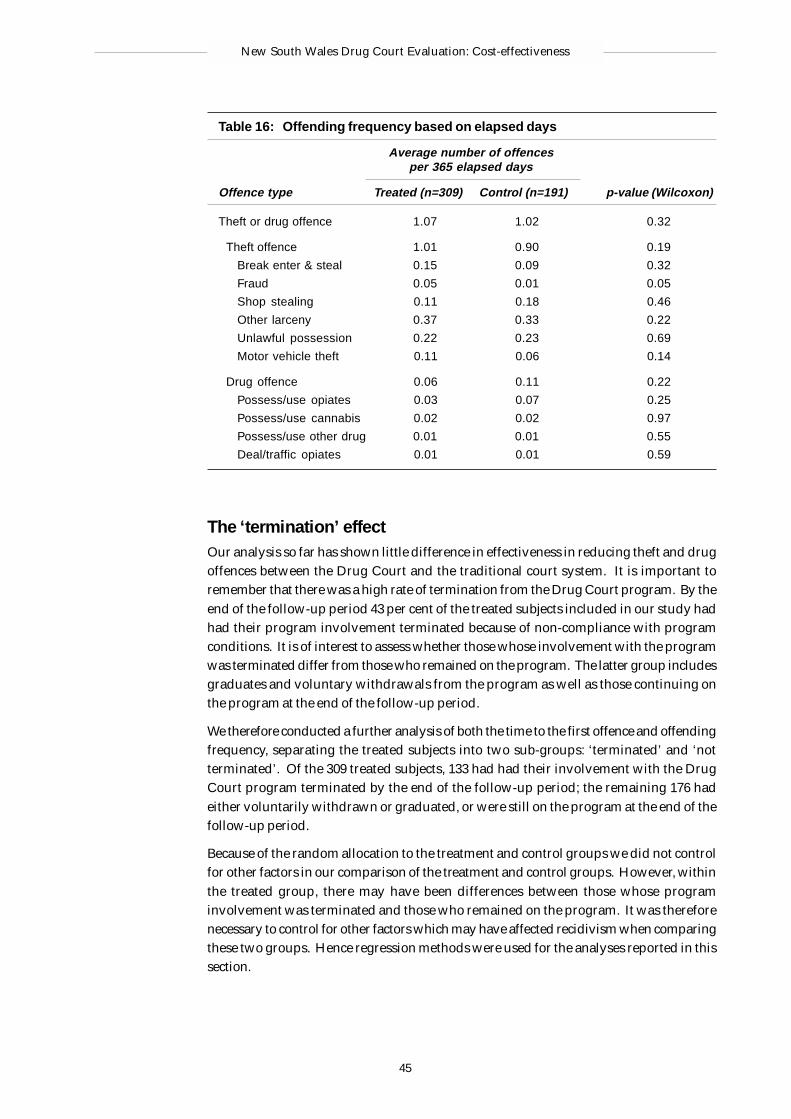
45
New South Wales Drug Court Evaluation: Cost-effectiveness
Table 16: Offending frequency based on elapsed days
Average number of offencesper 365 elapsed days
Offence type Treated (n=309) Control (n=191) p-value (Wilcoxon)
Theft or drug offence 1.07 1.02 0.32
Theft offence 1.01 0.90 0.19
Break enter & steal 0.15 0.09 0.32
Fraud 0.05 0.01 0.05
Shop stealing 0.11 0.18 0.46
Other larceny 0.37 0.33 0.22
Unlawful possession 0.22 0.23 0.69
Motor vehicle theft 0.11 0.06 0.14
Drug offence 0.06 0.11 0.22
Possess/use opiates 0.03 0.07 0.25
Possess/use cannabis 0.02 0.02 0.97
Possess/use other drug 0.01 0.01 0.55
Deal/traffic opiates 0.01 0.01 0.59
The ‘termination’ effectOur analysis so far has shown little difference in effectiveness in reducing theft and drugoffences between the Drug Court and the traditional court system. It is important toremember that there was a high rate of termination from the Drug Court program. By theend of the follow-up period 43 per cent of the treated subjects included in our study hadhad their program involvement terminated because of non-compliance with programconditions. It is of interest to assess whether those whose involvement with the programwas terminated differ from those who remained on the program. The latter group includesgraduates and voluntary withdrawals from the program as well as those continuing onthe program at the end of the follow-up period.
We therefore conducted a further analysis of both the time to the first offence and offendingfrequency, separating the treated subjects into two sub-groups: ‘terminated’ and ‘notterminated’. Of the 309 treated subjects, 133 had had their involvement with the DrugCourt program terminated by the end of the follow-up period; the remaining 176 hadeither voluntarily withdrawn or graduated, or were still on the program at the end of thefollow-up period.
Because of the random allocation to the treatment and control groups we did not controlfor other factors in our comparison of the treatment and control groups. However, withinthe treated group, there may have been differences between those whose programinvolvement was terminated and those who remained on the program. It was thereforenecessary to control for other factors which may have affected recidivism when comparingthese two groups. Hence regression methods were used for the analyses reported in thissection.
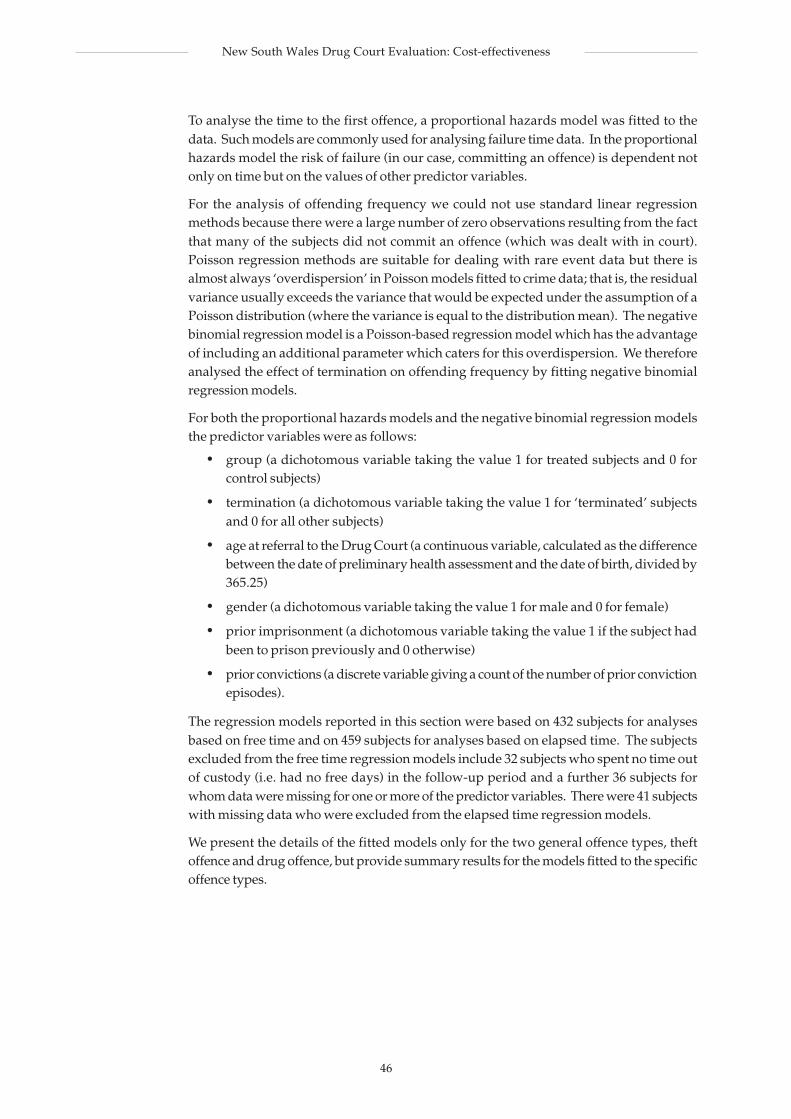
46
New South Wales Drug Court Evaluation: Cost-effectiveness
To analyse the time to the first offence, a proportional hazards model was fitted to thedata. Such models are commonly used for analysing failure time data. In the proportionalhazards model the risk of failure (in our case, committing an offence) is dependent notonly on time but on the values of other predictor variables.
For the analysis of offending frequency we could not use standard linear regressionmethods because there were a large number of zero observations resulting from the factthat many of the subjects did not commit an offence (which was dealt with in court).Poisson regression methods are suitable for dealing with rare event data but there isalmost always ‘overdispersion’ in Poisson models fitted to crime data; that is, the residualvariance usually exceeds the variance that would be expected under the assumption of aPoisson distribution (where the variance is equal to the distribution mean). The negativebinomial regression model is a Poisson-based regression model which has the advantageof including an additional parameter which caters for this overdispersion. We thereforeanalysed the effect of termination on offending frequency by fitting negative binomialregression models.
For both the proportional hazards models and the negative binomial regression modelsthe predictor variables were as follows:
• group (a dichotomous variable taking the value 1 for treated subjects and 0 forcontrol subjects)
• termination (a dichotomous variable taking the value 1 for ‘terminated’ subjectsand 0 for all other subjects)
• age at referral to the Drug Court (a continuous variable, calculated as the differencebetween the date of preliminary health assessment and the date of birth, divided by365.25)
• gender (a dichotomous variable taking the value 1 for male and 0 for female)
• prior imprisonment (a dichotomous variable taking the value 1 if the subject hadbeen to prison previously and 0 otherwise)
• prior convictions (a discrete variable giving a count of the number of prior convictionepisodes).
The regression models reported in this section were based on 432 subjects for analysesbased on free time and on 459 subjects for analyses based on elapsed time. The subjectsexcluded from the free time regression models include 32 subjects who spent no time outof custody (i.e. had no free days) in the follow-up period and a further 36 subjects forwhom data were missing for one or more of the predictor variables. There were 41 subjectswith missing data who were excluded from the elapsed time regression models.
We present the details of the fitted models only for the two general offence types, theftoffence and drug offence, but provide summary results for the models fitted to the specificoffence types.
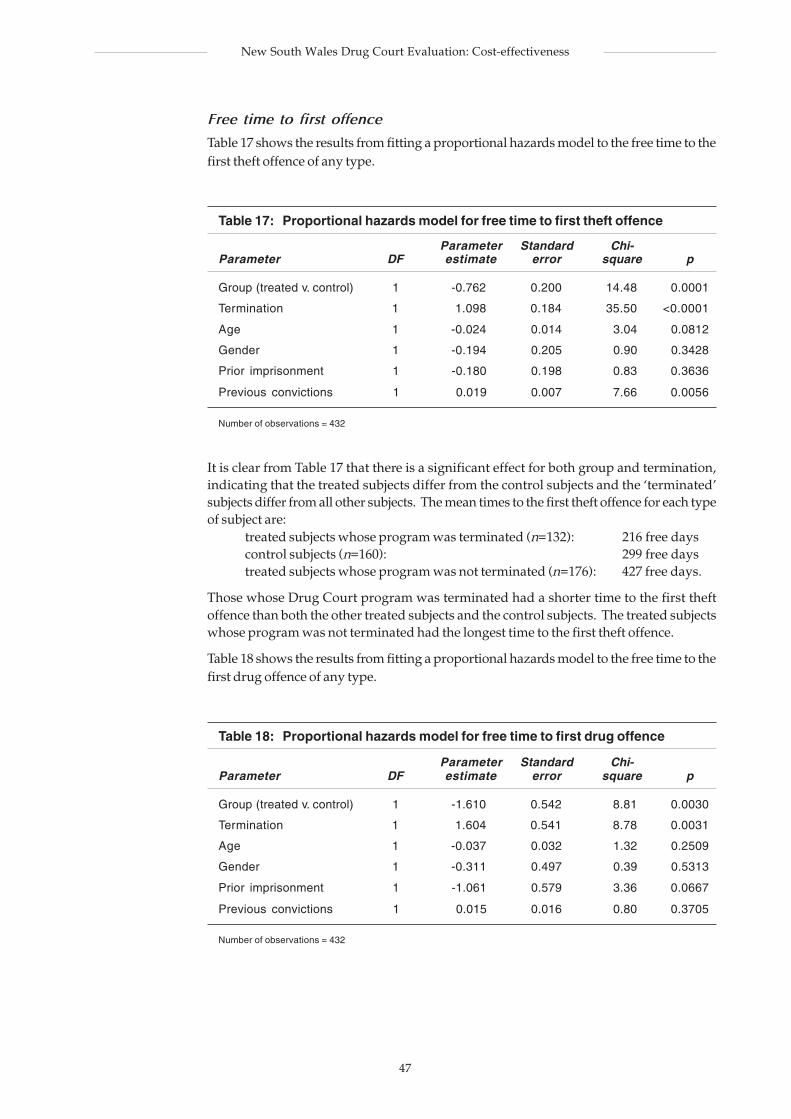
47
New South Wales Drug Court Evaluation: Cost-effectiveness
Free time to first offence
Table 17 shows the results from fitting a proportional hazards model to the free time to thefirst theft offence of any type.
Table 17: Proportional hazards model for free time to first theft offence
Parameter Standard Chi-Parameter DF estimate error square p
Group (treated v. control) 1 -0.762 0.200 14.48 0.0001
Termination 1 1.098 0.184 35.50 <0.0001
Age 1 -0.024 0.014 3.04 0.0812
Gender 1 -0.194 0.205 0.90 0.3428
Prior imprisonment 1 -0.180 0.198 0.83 0.3636
Previous convictions 1 0.019 0.007 7.66 0.0056
Number of observations = 432
It is clear from Table 17 that there is a significant effect for both group and termination,indicating that the treated subjects differ from the control subjects and the ‘terminated’subjects differ from all other subjects. The mean times to the first theft offence for each typeof subject are:
treated subjects whose program was terminated (n=132): 216 free dayscontrol subjects (n=160): 299 free daystreated subjects whose program was not terminated (n=176): 427 free days.
Those whose Drug Court program was terminated had a shorter time to the first theftoffence than both the other treated subjects and the control subjects. The treated subjectswhose program was not terminated had the longest time to the first theft offence.
Table 18 shows the results from fitting a proportional hazards model to the free time to thefirst drug offence of any type.
Table 18: Proportional hazards model for free time to first drug offence
Parameter Standard Chi-Parameter DF estimate error square p
Group (treated v. control) 1 -1.610 0.542 8.81 0.0030
Termination 1 1.604 0.541 8.78 0.0031
Age 1 -0.037 0.032 1.32 0.2509
Gender 1 -0.311 0.497 0.39 0.5313
Prior imprisonment 1 -1.061 0.579 3.36 0.0667
Previous convictions 1 0.015 0.016 0.80 0.3705
Number of observations = 432
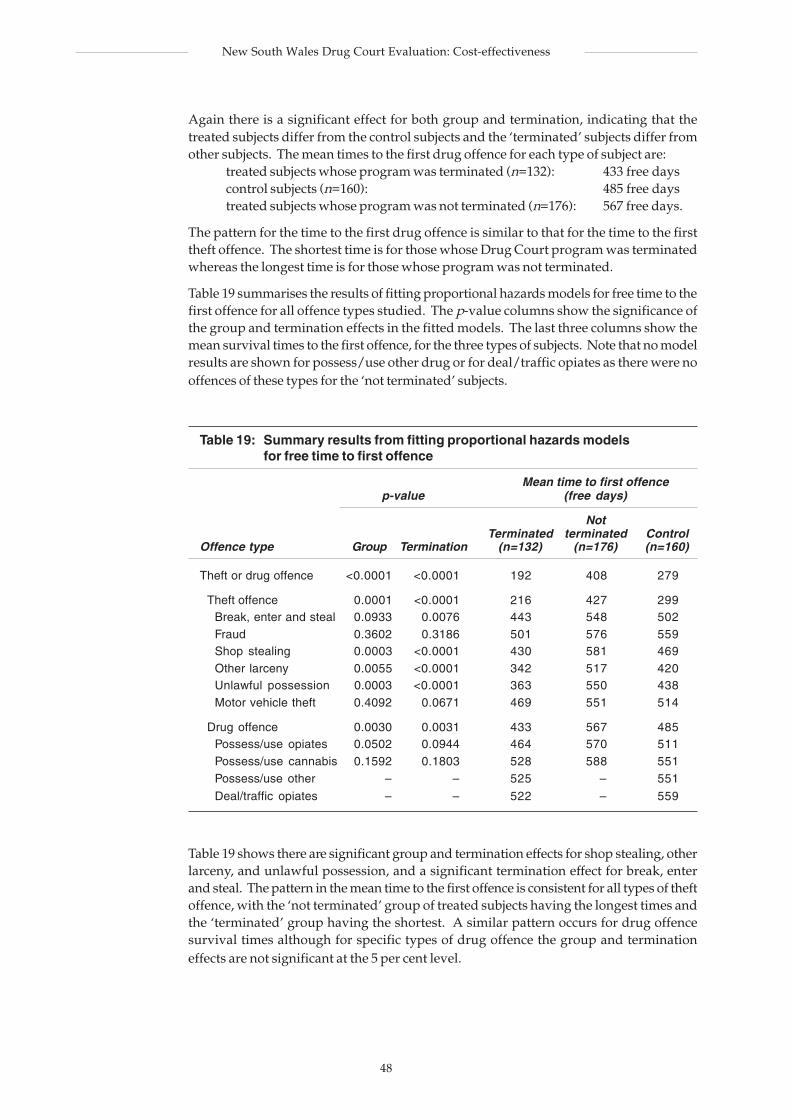
48
New South Wales Drug Court Evaluation: Cost-effectiveness
Again there is a significant effect for both group and termination, indicating that thetreated subjects differ from the control subjects and the ‘terminated’ subjects differ fromother subjects. The mean times to the first drug offence for each type of subject are:
treated subjects whose program was terminated (n=132): 433 free dayscontrol subjects (n=160): 485 free daystreated subjects whose program was not terminated (n=176): 567 free days.
The pattern for the time to the first drug offence is similar to that for the time to the firsttheft offence. The shortest time is for those whose Drug Court program was terminatedwhereas the longest time is for those whose program was not terminated.
Table 19 summarises the results of fitting proportional hazards models for free time to thefirst offence for all offence types studied. The p-value columns show the significance ofthe group and termination effects in the fitted models. The last three columns show themean survival times to the first offence, for the three types of subjects. Note that no modelresults are shown for possess/use other drug or for deal/traffic opiates as there were nooffences of these types for the ‘not terminated’ subjects.
Table 19: Summary results from fitting proportional hazards modelsfor free time to first offence
Mean time to first offencep-value (free days)
NotTerminated terminated Control
Offence type Group Termination (n=132) (n=176) (n=160)
Theft or drug offence <0.0001 <0.0001 192 408 279
Theft offence 0.0001 <0.0001 216 427 299Break, enter and steal 0.0933 0.0076 443 548 502Fraud 0.3602 0.3186 501 576 559Shop stealing 0.0003 <0.0001 430 581 469Other larceny 0.0055 <0.0001 342 517 420Unlawful possession 0.0003 <0.0001 363 550 438Motor vehicle theft 0.4092 0.0671 469 551 514
Drug offence 0.0030 0.0031 433 567 485Possess/use opiates 0.0502 0.0944 464 570 511Possess/use cannabis 0.1592 0.1803 528 588 551Possess/use other – – 525 – 551
Deal/traffic opiates – – 522 – 559
Table 19 shows there are significant group and termination effects for shop stealing, otherlarceny, and unlawful possession, and a significant termination effect for break, enterand steal. The pattern in the mean time to the first offence is consistent for all types of theftoffence, with the ‘not terminated’ group of treated subjects having the longest times andthe ‘terminated’ group having the shortest. A similar pattern occurs for drug offencesurvival times although for specific types of drug offence the group and terminationeffects are not significant at the 5 per cent level.
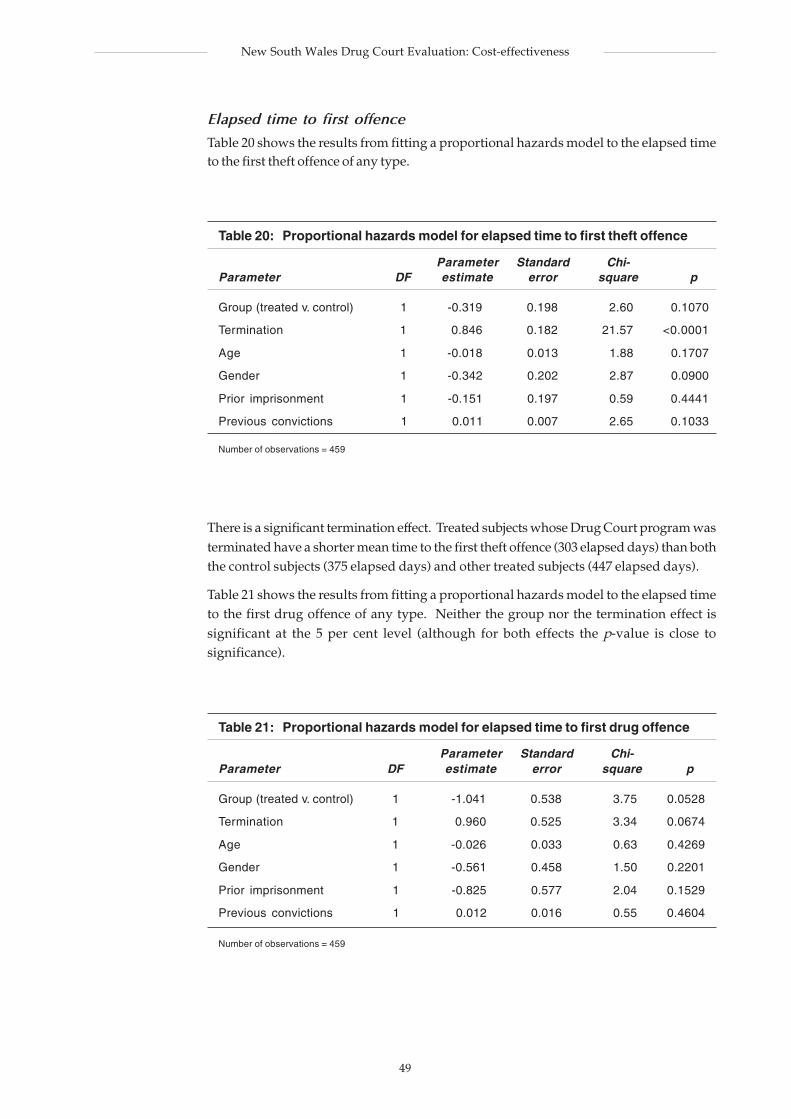
49
New South Wales Drug Court Evaluation: Cost-effectiveness
Elapsed time to first offence
Table 20 shows the results from fitting a proportional hazards model to the elapsed timeto the first theft offence of any type.
Table 20: Proportional hazards model for elapsed time to first theft offence
Parameter Standard Chi-Parameter DF estimate error square p
Group (treated v. control) 1 -0.319 0.198 2.60 0.1070
Termination 1 0.846 0.182 21.57 <0.0001
Age 1 -0.018 0.013 1.88 0.1707
Gender 1 -0.342 0.202 2.87 0.0900
Prior imprisonment 1 -0.151 0.197 0.59 0.4441
Previous convictions 1 0.011 0.007 2.65 0.1033
Number of observations = 459
There is a significant termination effect. Treated subjects whose Drug Court program wasterminated have a shorter mean time to the first theft offence (303 elapsed days) than boththe control subjects (375 elapsed days) and other treated subjects (447 elapsed days).
Table 21 shows the results from fitting a proportional hazards model to the elapsed timeto the first drug offence of any type. Neither the group nor the termination effect issignificant at the 5 per cent level (although for both effects the p-value is close tosignificance).
Table 21: Proportional hazards model for elapsed time to first drug offence
Parameter Standard Chi-Parameter DF estimate error square p
Group (treated v. control) 1 -1.041 0.538 3.75 0.0528
Termination 1 0.960 0.525 3.34 0.0674
Age 1 -0.026 0.033 0.63 0.4269
Gender 1 -0.561 0.458 1.50 0.2201
Prior imprisonment 1 -0.825 0.577 2.04 0.1529
Previous convictions 1 0.012 0.016 0.55 0.4604
Number of observations = 459
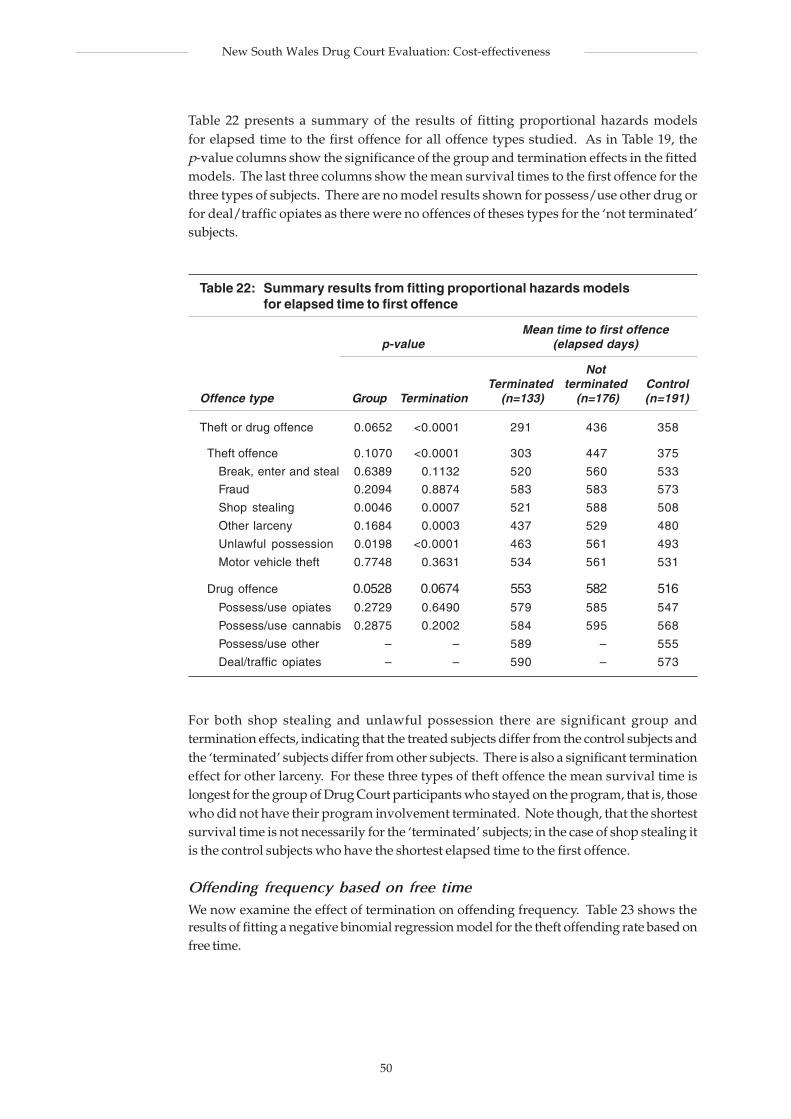
50
New South Wales Drug Court Evaluation: Cost-effectiveness
Table 22 presents a summary of the results of fitting proportional hazards modelsfor elapsed time to the first offence for all offence types studied. As in Table 19, thep-value columns show the significance of the group and termination effects in the fittedmodels. The last three columns show the mean survival times to the first offence for thethree types of subjects. There are no model results shown for possess/use other drug orfor deal/traffic opiates as there were no offences of theses types for the ‘not terminated’subjects.
Table 22: Summary results from fitting proportional hazards modelsfor elapsed time to first offence
Mean time to first offencep-value (elapsed days)
NotTerminated terminated Control
Offence type Group Termination (n=133) (n=176) (n=191)
Theft or drug offence 0.0652 <0.0001 291 436 358
Theft offence 0.1070 <0.0001 303 447 375
Break, enter and steal 0.6389 0.1132 520 560 533
Fraud 0.2094 0.8874 583 583 573
Shop stealing 0.0046 0.0007 521 588 508
Other larceny 0.1684 0.0003 437 529 480
Unlawful possession 0.0198 <0.0001 463 561 493
Motor vehicle theft 0.7748 0.3631 534 561 531
Drug offence 0.0528 0.0674 553 582 516Possess/use opiates 0.2729 0.6490 579 585 547
Possess/use cannabis 0.2875 0.2002 584 595 568
Possess/use other – – 589 – 555
Deal/traffic opiates – – 590 – 573
For both shop stealing and unlawful possession there are significant group andtermination effects, indicating that the treated subjects differ from the control subjects andthe ‘terminated’ subjects differ from other subjects. There is also a significant terminationeffect for other larceny. For these three types of theft offence the mean survival time islongest for the group of Drug Court participants who stayed on the program, that is, thosewho did not have their program involvement terminated. Note though, that the shortestsurvival time is not necessarily for the ‘terminated’ subjects; in the case of shop stealing itis the control subjects who have the shortest elapsed time to the first offence.
Offending frequency based on free timeWe now examine the effect of termination on offending frequency. Table 23 shows theresults of fitting a negative binomial regression model for the theft offending rate based onfree time.
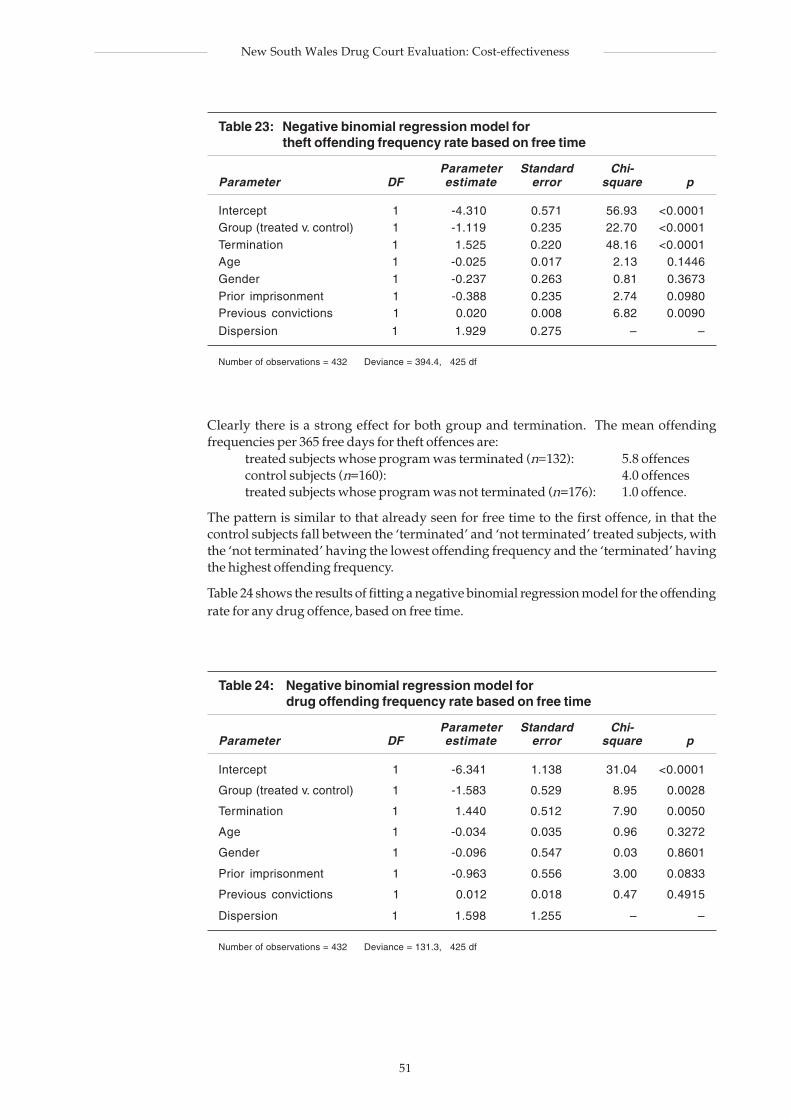
51
New South Wales Drug Court Evaluation: Cost-effectiveness
Table 23: Negative binomial regression model fortheft offending frequency rate based on free time
Parameter Standard Chi-Parameter DF estimate error square p
Intercept 1 -4.310 0.571 56.93 <0.0001Group (treated v. control) 1 -1.119 0.235 22.70 <0.0001Termination 1 1.525 0.220 48.16 <0.0001Age 1 -0.025 0.017 2.13 0.1446Gender 1 -0.237 0.263 0.81 0.3673Prior imprisonment 1 -0.388 0.235 2.74 0.0980Previous convictions 1 0.020 0.008 6.82 0.0090
Dispersion 1 1.929 0.275 – –
Number of observations = 432 Deviance = 394.4, 425 df
Clearly there is a strong effect for both group and termination. The mean offendingfrequencies per 365 free days for theft offences are:
treated subjects whose program was terminated (n=132): 5.8 offencescontrol subjects (n=160): 4.0 offencestreated subjects whose program was not terminated (n=176): 1.0 offence.
The pattern is similar to that already seen for free time to the first offence, in that thecontrol subjects fall between the ‘terminated’ and ‘not terminated’ treated subjects, withthe ‘not terminated’ having the lowest offending frequency and the ‘terminated’ havingthe highest offending frequency.
Table 24 shows the results of fitting a negative binomial regression model for the offendingrate for any drug offence, based on free time.
Table 24: Negative binomial regression model fordrug offending frequency rate based on free time
Parameter Standard Chi-Parameter DF estimate error square p
Intercept 1 -6.341 1.138 31.04 <0.0001
Group (treated v. control) 1 -1.583 0.529 8.95 0.0028
Termination 1 1.440 0.512 7.90 0.0050
Age 1 -0.034 0.035 0.96 0.3272
Gender 1 -0.096 0.547 0.03 0.8601
Prior imprisonment 1 -0.963 0.556 3.00 0.0833
Previous convictions 1 0.012 0.018 0.47 0.4915
Dispersion 1 1.598 1.255 – –
Number of observations = 432 Deviance = 131.3, 425 df
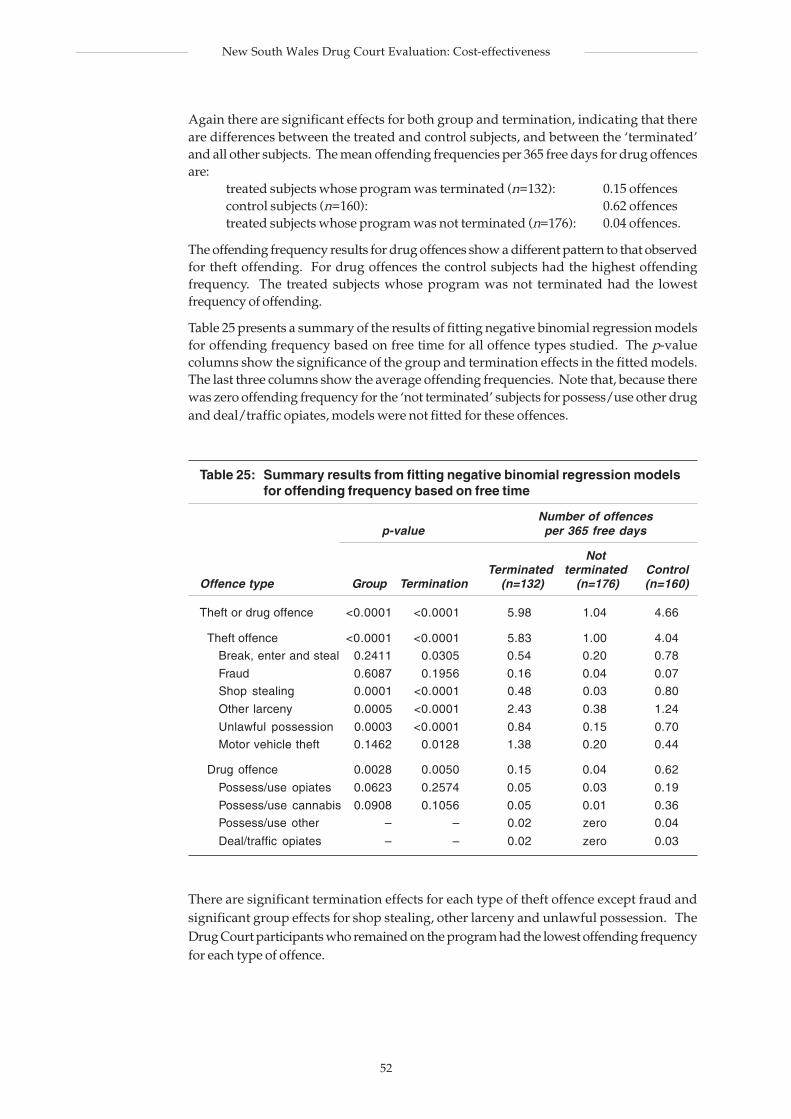
52
New South Wales Drug Court Evaluation: Cost-effectiveness
Again there are significant effects for both group and termination, indicating that thereare differences between the treated and control subjects, and between the ‘terminated’and all other subjects. The mean offending frequencies per 365 free days for drug offencesare:
treated subjects whose program was terminated (n=132): 0.15 offencescontrol subjects (n=160): 0.62 offencestreated subjects whose program was not terminated (n=176): 0.04 offences.
The offending frequency results for drug offences show a different pattern to that observedfor theft offending. For drug offences the control subjects had the highest offendingfrequency. The treated subjects whose program was not terminated had the lowestfrequency of offending.
Table 25 presents a summary of the results of fitting negative binomial regression modelsfor offending frequency based on free time for all offence types studied. The p-valuecolumns show the significance of the group and termination effects in the fitted models.The last three columns show the average offending frequencies. Note that, because therewas zero offending frequency for the ‘not terminated’ subjects for possess/use other drugand deal/traffic opiates, models were not fitted for these offences.
Table 25: Summary results from fitting negative binomial regression modelsfor offending frequency based on free time
Number of offencesp-value per 365 free days
NotTerminated terminated Control
Offence type Group Termination (n=132) (n=176) (n=160)
Theft or drug offence <0.0001 <0.0001 5.98 1.04 4.66
Theft offence <0.0001 <0.0001 5.83 1.00 4.04
Break, enter and steal 0.2411 0.0305 0.54 0.20 0.78
Fraud 0.6087 0.1956 0.16 0.04 0.07
Shop stealing 0.0001 <0.0001 0.48 0.03 0.80
Other larceny 0.0005 <0.0001 2.43 0.38 1.24
Unlawful possession 0.0003 <0.0001 0.84 0.15 0.70
Motor vehicle theft 0.1462 0.0128 1.38 0.20 0.44
Drug offence 0.0028 0.0050 0.15 0.04 0.62
Possess/use opiates 0.0623 0.2574 0.05 0.03 0.19
Possess/use cannabis 0.0908 0.1056 0.05 0.01 0.36
Possess/use other – – 0.02 zero 0.04
Deal/traffic opiates – – 0.02 zero 0.03
There are significant termination effects for each type of theft offence except fraud andsignificant group effects for shop stealing, other larceny and unlawful possession. TheDrug Court participants who remained on the program had the lowest offending frequencyfor each type of offence.
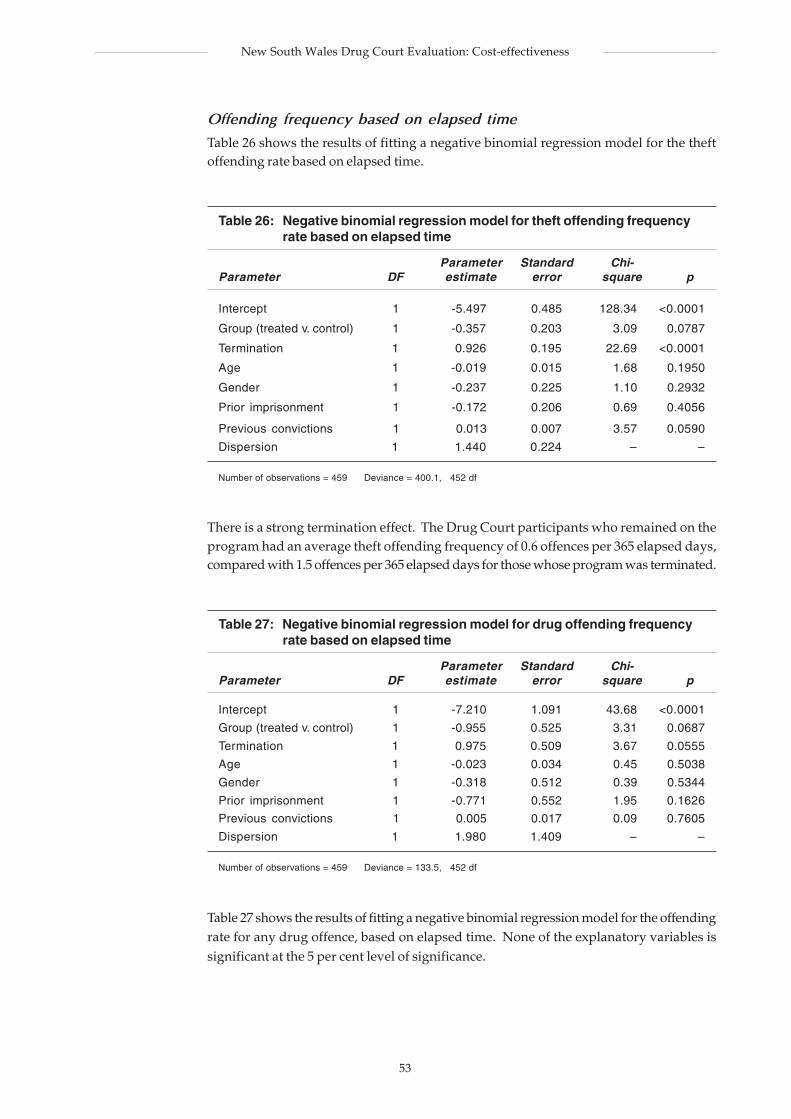
53
New South Wales Drug Court Evaluation: Cost-effectiveness
Offending frequency based on elapsed time
Table 26 shows the results of fitting a negative binomial regression model for the theftoffending rate based on elapsed time.
Table 26: Negative binomial regression model for theft offending frequencyrate based on elapsed time
Parameter Standard Chi-Parameter DF estimate error square p
Intercept 1 -5.497 0.485 128.34 <0.0001
Group (treated v. control) 1 -0.357 0.203 3.09 0.0787
Termination 1 0.926 0.195 22.69 <0.0001
Age 1 -0.019 0.015 1.68 0.1950
Gender 1 -0.237 0.225 1.10 0.2932
Prior imprisonment 1 -0.172 0.206 0.69 0.4056
Previous convictions 1 0.013 0.007 3.57 0.0590
Dispersion 1 1.440 0.224 – –
Number of observations = 459 Deviance = 400.1, 452 df
There is a strong termination effect. The Drug Court participants who remained on theprogram had an average theft offending frequency of 0.6 offences per 365 elapsed days,compared with 1.5 offences per 365 elapsed days for those whose program was terminated.
Table 27: Negative binomial regression model for drug offending frequencyrate based on elapsed time
Parameter Standard Chi-Parameter DF estimate error square p
Intercept 1 -7.210 1.091 43.68 <0.0001
Group (treated v. control) 1 -0.955 0.525 3.31 0.0687
Termination 1 0.975 0.509 3.67 0.0555
Age 1 -0.023 0.034 0.45 0.5038
Gender 1 -0.318 0.512 0.39 0.5344
Prior imprisonment 1 -0.771 0.552 1.95 0.1626
Previous convictions 1 0.005 0.017 0.09 0.7605
Dispersion 1 1.980 1.409 – –
Number of observations = 459 Deviance = 133.5, 452 df
Table 27 shows the results of fitting a negative binomial regression model for the offendingrate for any drug offence, based on elapsed time. None of the explanatory variables issignificant at the 5 per cent level of significance.
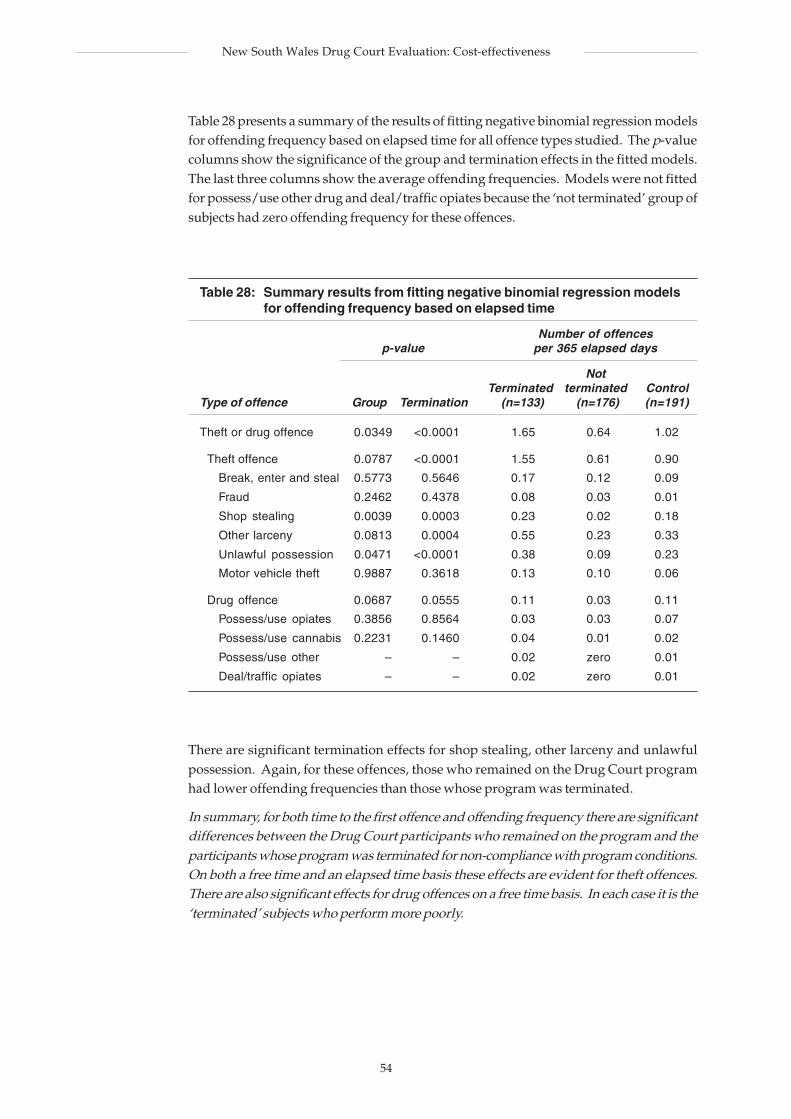
54
New South Wales Drug Court Evaluation: Cost-effectiveness
Table 28 presents a summary of the results of fitting negative binomial regression modelsfor offending frequency based on elapsed time for all offence types studied. The p-valuecolumns show the significance of the group and termination effects in the fitted models.The last three columns show the average offending frequencies. Models were not fittedfor possess/use other drug and deal/traffic opiates because the ‘not terminated’ group ofsubjects had zero offending frequency for these offences.
Table 28: Summary results from fitting negative binomial regression modelsfor offending frequency based on elapsed time
Number of offencesp-value per 365 elapsed days
NotTerminated terminated Control
Type of offence Group Termination (n=133) (n=176) (n=191)
Theft or drug offence 0.0349 <0.0001 1.65 0.64 1.02
Theft offence 0.0787 <0.0001 1.55 0.61 0.90
Break, enter and steal 0.5773 0.5646 0.17 0.12 0.09
Fraud 0.2462 0.4378 0.08 0.03 0.01
Shop stealing 0.0039 0.0003 0.23 0.02 0.18
Other larceny 0.0813 0.0004 0.55 0.23 0.33
Unlawful possession 0.0471 <0.0001 0.38 0.09 0.23
Motor vehicle theft 0.9887 0.3618 0.13 0.10 0.06
Drug offence 0.0687 0.0555 0.11 0.03 0.11
Possess/use opiates 0.3856 0.8564 0.03 0.03 0.07
Possess/use cannabis 0.2231 0.1460 0.04 0.01 0.02
Possess/use other – – 0.02 zero 0.01
Deal/traffic opiates – – 0.02 zero 0.01
There are significant termination effects for shop stealing, other larceny and unlawfulpossession. Again, for these offences, those who remained on the Drug Court programhad lower offending frequencies than those whose program was terminated.
In summary, for both time to the first offence and offending frequency there are significantdifferences between the Drug Court participants who remained on the program and theparticipants whose program was terminated for non-compliance with program conditions.On both a free time and an elapsed time basis these effects are evident for theft offences.There are also significant effects for drug offences on a free time basis. In each case it is the‘terminated’ subjects who perform more poorly.
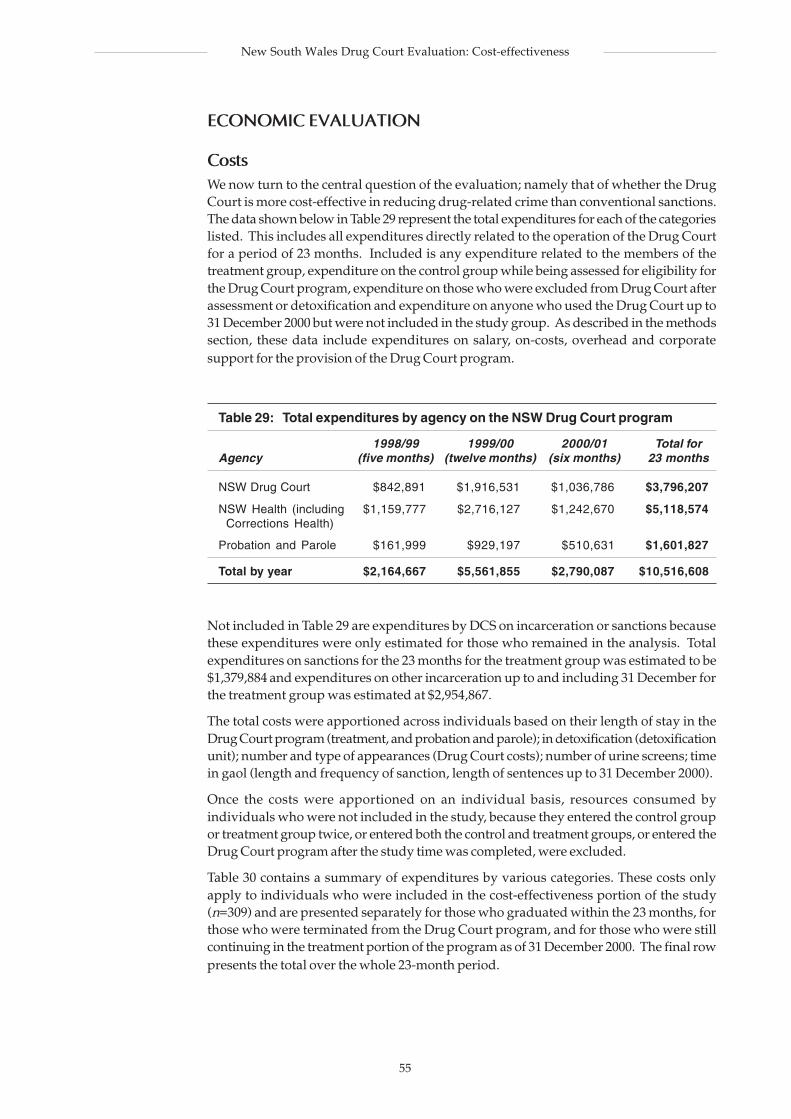
55
New South Wales Drug Court Evaluation: Cost-effectiveness
ECONOMIC EVALUATION
CostsWe now turn to the central question of the evaluation; namely that of whether the DrugCourt is more cost-effective in reducing drug-related crime than conventional sanctions.The data shown below in Table 29 represent the total expenditures for each of the categorieslisted. This includes all expenditures directly related to the operation of the Drug Courtfor a period of 23 months. Included is any expenditure related to the members of thetreatment group, expenditure on the control group while being assessed for eligibility forthe Drug Court program, expenditure on those who were excluded from Drug Court afterassessment or detoxification and expenditure on anyone who used the Drug Court up to31 December 2000 but were not included in the study group. As described in the methodssection, these data include expenditures on salary, on-costs, overhead and corporatesupport for the provision of the Drug Court program.
Table 29: Total expenditures by agency on the NSW Drug Court program
1998/99 1999/00 2000/01 Total forAgency (five months) (twelve months) (six months) 23 months
NSW Drug Court $842,891 $1,916,531 $1,036,786 $3,796,207
NSW Health (including $1,159,777 $2,716,127 $1,242,670 $5,118,574Corrections Health)
Probation and Parole $161,999 $929,197 $510,631 $1,601,827
Total by year $2,164,667 $5,561,855 $2,790,087 $10,516,608
Not included in Table 29 are expenditures by DCS on incarceration or sanctions becausethese expenditures were only estimated for those who remained in the analysis. Totalexpenditures on sanctions for the 23 months for the treatment group was estimated to be$1,379,884 and expenditures on other incarceration up to and including 31 December forthe treatment group was estimated at $2,954,867.
The total costs were apportioned across individuals based on their length of stay in theDrug Court program (treatment, and probation and parole); in detoxification (detoxificationunit); number and type of appearances (Drug Court costs); number of urine screens; timein gaol (length and frequency of sanction, length of sentences up to 31 December 2000).
Once the costs were apportioned on an individual basis, resources consumed byindividuals who were not included in the study, because they entered the control groupor treatment group twice, or entered both the control and treatment groups, or entered theDrug Court program after the study time was completed, were excluded.
Table 30 contains a summary of expenditures by various categories. These costs onlyapply to individuals who were included in the cost-effectiveness portion of the study(n=309) and are presented separately for those who graduated within the 23 months, forthose who were terminated from the Drug Court program, and for those who were stillcontinuing in the treatment portion of the program as of 31 December 2000. The final rowpresents the total over the whole 23-month period.
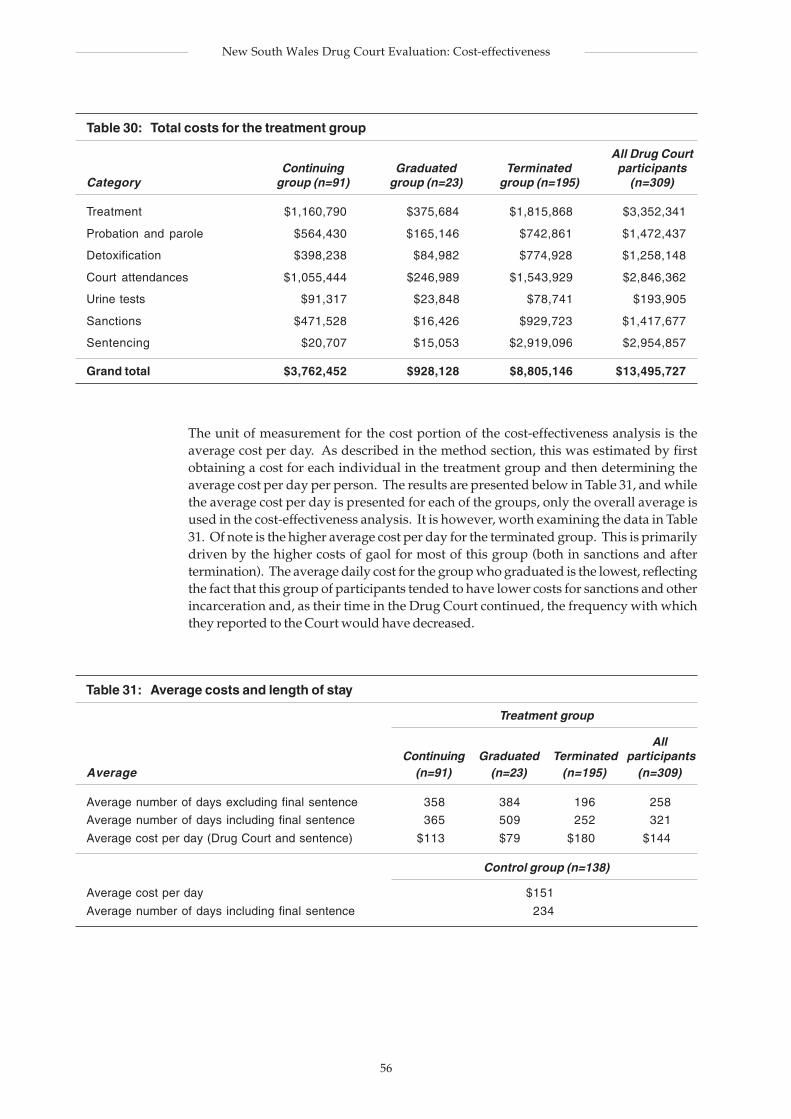
56
New South Wales Drug Court Evaluation: Cost-effectiveness
Table 30: Total costs for the treatment group
All Drug CourtContinuing Graduated Terminated participants
Category group (n=91) group (n=23) group (n=195) (n=309)
Treatment $1,160,790 $375,684 $1,815,868 $3,352,341
Probation and parole $564,430 $165,146 $742,861 $1,472,437
Detoxification $398,238 $84,982 $774,928 $1,258,148
Court attendances $1,055,444 $246,989 $1,543,929 $2,846,362
Urine tests $91,317 $23,848 $78,741 $193,905
Sanctions $471,528 $16,426 $929,723 $1,417,677
Sentencing $20,707 $15,053 $2,919,096 $2,954,857
Grand total $3,762,452 $928,128 $8,805,146 $13,495,727
The unit of measurement for the cost portion of the cost-effectiveness analysis is theaverage cost per day. As described in the method section, this was estimated by firstobtaining a cost for each individual in the treatment group and then determining theaverage cost per day per person. The results are presented below in Table 31, and whilethe average cost per day is presented for each of the groups, only the overall average isused in the cost-effectiveness analysis. It is however, worth examining the data in Table31. Of note is the higher average cost per day for the terminated group. This is primarilydriven by the higher costs of gaol for most of this group (both in sanctions and aftertermination). The average daily cost for the group who graduated is the lowest, reflectingthe fact that this group of participants tended to have lower costs for sanctions and otherincarceration and, as their time in the Drug Court continued, the frequency with whichthey reported to the Court would have decreased.
Table 31: Average costs and length of stay
Treatment group
AllContinuing Graduated Terminated participants
Average (n=91) (n=23) (n=195) (n=309)
Average number of days excluding final sentence 358 384 196 258
Average number of days including final sentence 365 509 252 321
Average cost per day (Drug Court and sentence) $113 $79 $180 $144
Control group (n=138)
Average cost per day $151
Average number of days including final sentence 234
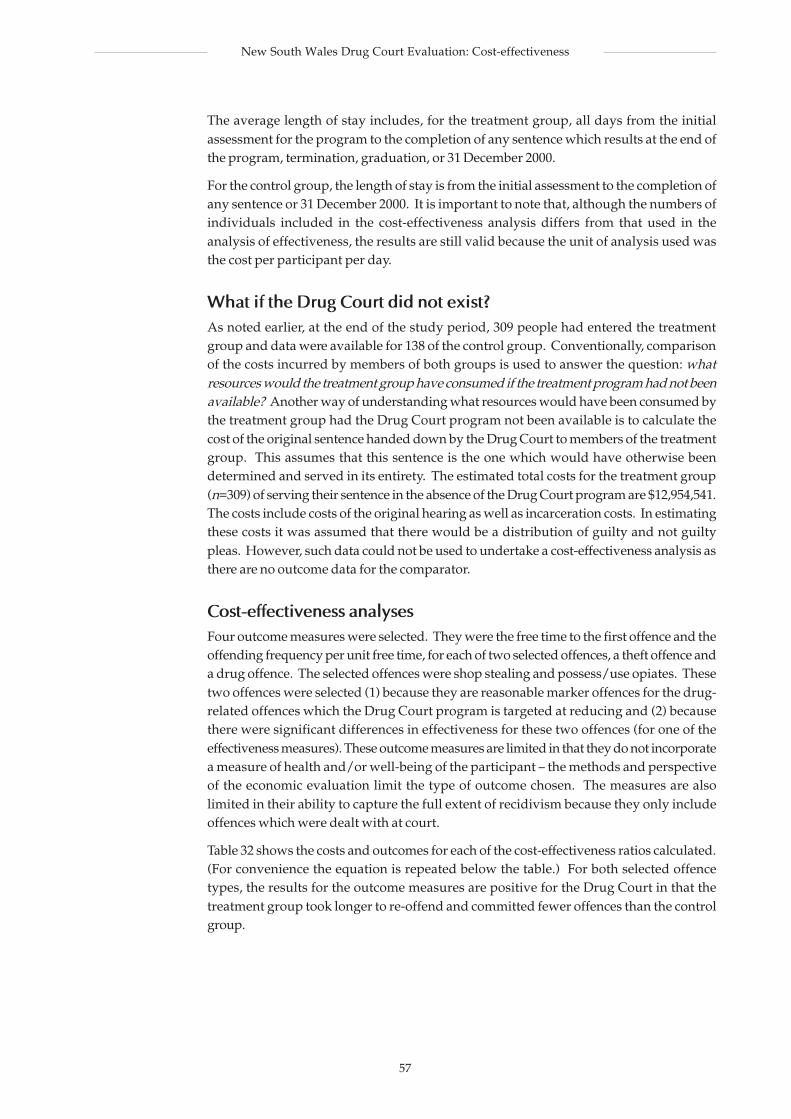
57
New South Wales Drug Court Evaluation: Cost-effectiveness
The average length of stay includes, for the treatment group, all days from the initialassessment for the program to the completion of any sentence which results at the end ofthe program, termination, graduation, or 31 December 2000.
For the control group, the length of stay is from the initial assessment to the completion ofany sentence or 31 December 2000. It is important to note that, although the numbers ofindividuals included in the cost-effectiveness analysis differs from that used in theanalysis of effectiveness, the results are still valid because the unit of analysis used wasthe cost per participant per day.
What if the Drug Court did not exist?As noted earlier, at the end of the study period, 309 people had entered the treatmentgroup and data were available for 138 of the control group. Conventionally, comparisonof the costs incurred by members of both groups is used to answer the question: whatresources would the treatment group have consumed if the treatment program had not beenavailable? Another way of understanding what resources would have been consumed bythe treatment group had the Drug Court program not been available is to calculate thecost of the original sentence handed down by the Drug Court to members of the treatmentgroup. This assumes that this sentence is the one which would have otherwise beendetermined and served in its entirety. The estimated total costs for the treatment group(n=309) of serving their sentence in the absence of the Drug Court program are $12,954,541.The costs include costs of the original hearing as well as incarceration costs. In estimatingthese costs it was assumed that there would be a distribution of guilty and not guiltypleas. However, such data could not be used to undertake a cost-effectiveness analysis asthere are no outcome data for the comparator.
Cost-effectiveness analysesFour outcome measures were selected. They were the free time to the first offence and theoffending frequency per unit free time, for each of two selected offences, a theft offence anda drug offence. The selected offences were shop stealing and possess/use opiates. Thesetwo offences were selected (1) because they are reasonable marker offences for the drug-related offences which the Drug Court program is targeted at reducing and (2) becausethere were significant differences in effectiveness for these two offences (for one of theeffectiveness measures). These outcome measures are limited in that they do not incorporatea measure of health and/or well-being of the participant – the methods and perspectiveof the economic evaluation limit the type of outcome chosen. The measures are alsolimited in their ability to capture the full extent of recidivism because they only includeoffences which were dealt with at court.
Table 32 shows the costs and outcomes for each of the cost-effectiveness ratios calculated.(For convenience the equation is repeated below the table.) For both selected offencetypes, the results for the outcome measures are positive for the Drug Court in that thetreatment group took longer to re-offend and committed fewer offences than the controlgroup.
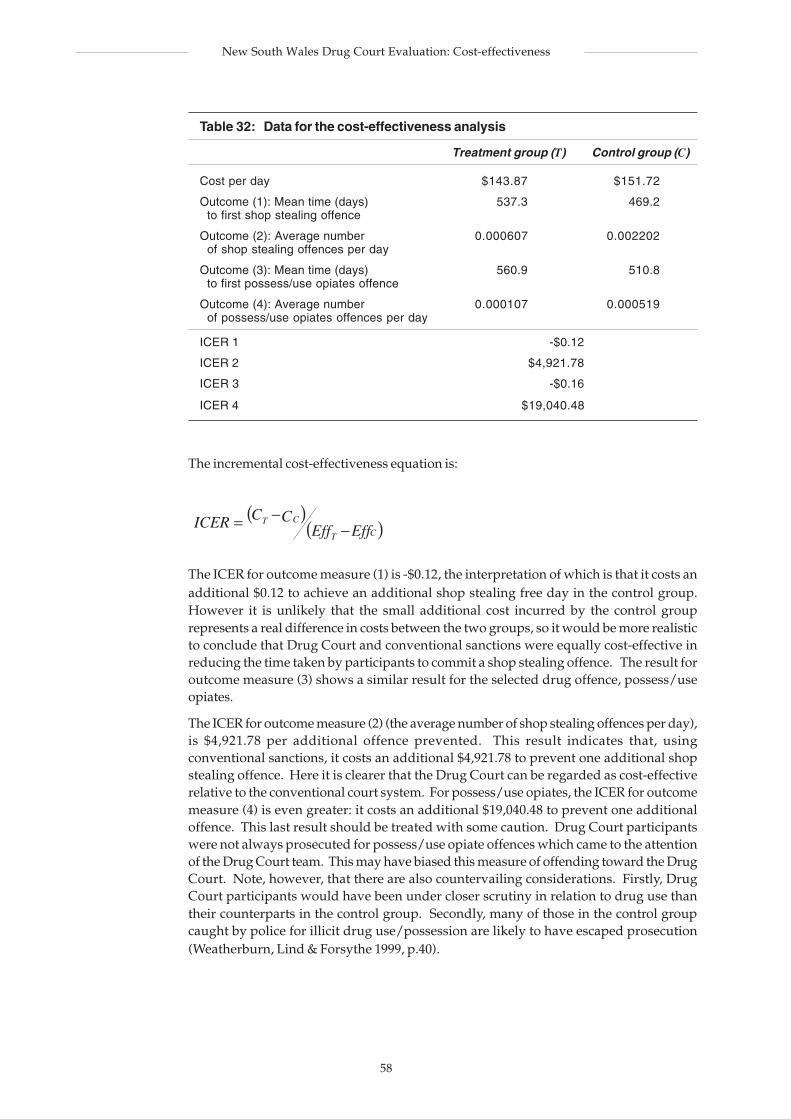
58
New South Wales Drug Court Evaluation: Cost-effectiveness
Table 32: Data for the cost-effectiveness analysis
Treatment group (T) Control group (C)
Cost per day $143.87 $151.72
Outcome (1): Mean time (days) 537.3 469.2to first shop stealing offence
Outcome (2): Average number 0.000607 0.002202of shop stealing offences per day
Outcome (3): Mean time (days) 560.9 510.8to first possess/use opiates offence
Outcome (4): Average number 0.000107 0.000519of possess/use opiates offences per day
ICER 1 -$0.12
ICER 2 $4,921.78
ICER 3 -$0.16
ICER 4 $19,040.48
The incremental cost-effectiveness equation is:
( )( )CT
CTEffEff
CCICER −−=
The ICER for outcome measure (1) is -$0.12, the interpretation of which is that it costs anadditional $0.12 to achieve an additional shop stealing free day in the control group.However it is unlikely that the small additional cost incurred by the control grouprepresents a real difference in costs between the two groups, so it would be more realisticto conclude that Drug Court and conventional sanctions were equally cost-effective inreducing the time taken by participants to commit a shop stealing offence. The result foroutcome measure (3) shows a similar result for the selected drug offence, possess/useopiates.
The ICER for outcome measure (2) (the average number of shop stealing offences per day),is $4,921.78 per additional offence prevented. This result indicates that, usingconventional sanctions, it costs an additional $4,921.78 to prevent one additional shopstealing offence. Here it is clearer that the Drug Court can be regarded as cost-effectiverelative to the conventional court system. For possess/use opiates, the ICER for outcomemeasure (4) is even greater: it costs an additional $19,040.48 to prevent one additionaloffence. This last result should be treated with some caution. Drug Court participantswere not always prosecuted for possess/use opiate offences which came to the attentionof the Drug Court team. This may have biased this measure of offending toward the DrugCourt. Note, however, that there are also countervailing considerations. Firstly, DrugCourt participants would have been under closer scrutiny in relation to drug use thantheir counterparts in the control group. Secondly, many of those in the control groupcaught by police for illicit drug use/possession are likely to have escaped prosecution(Weatherburn, Lind & Forsythe 1999, p.40).
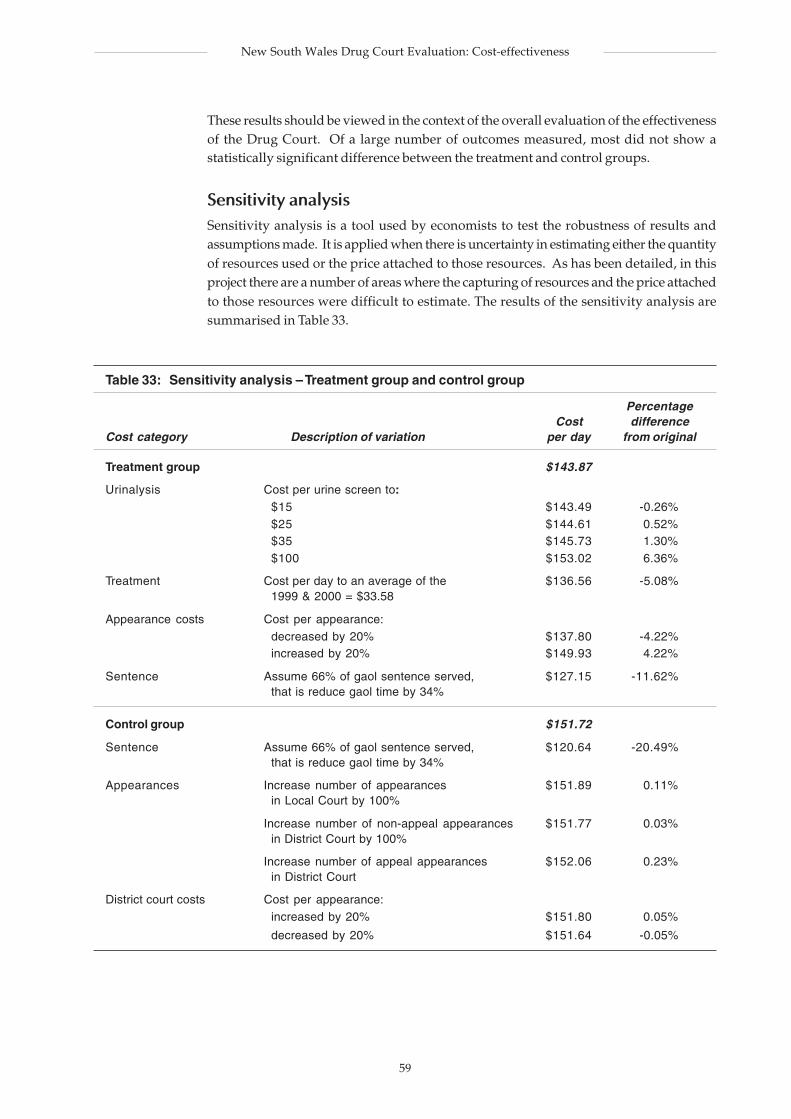
59
New South Wales Drug Court Evaluation: Cost-effectiveness
These results should be viewed in the context of the overall evaluation of the effectivenessof the Drug Court. Of a large number of outcomes measured, most did not show astatistically significant difference between the treatment and control groups.
Sensitivity analysisSensitivity analysis is a tool used by economists to test the robustness of results andassumptions made. It is applied when there is uncertainty in estimating either the quantityof resources used or the price attached to those resources. As has been detailed, in thisproject there are a number of areas where the capturing of resources and the price attachedto those resources were difficult to estimate. The results of the sensitivity analysis aresummarised in Table 33.
Table 33: Sensitivity analysis – Treatment group and control group
PercentageCost difference
Cost category Description of variation per day from original
Treatment group $143.87
Urinalysis Cost per urine screen to:$15 $143.49 -0.26%$25 $144.61 0.52%$35 $145.73 1.30%$100 $153.02 6.36%
Treatment Cost per day to an average of the $136.56 -5.08%1999 & 2000 = $33.58
Appearance costs Cost per appearance:decreased by 20% $137.80 -4.22%increased by 20% $149.93 4.22%
Sentence Assume 66% of gaol sentence served, $127.15 -11.62%that is reduce gaol time by 34%
Control group $151.72
Sentence Assume 66% of gaol sentence served, $120.64 -20.49%that is reduce gaol time by 34%
Appearances Increase number of appearances $151.89 0.11%in Local Court by 100%
Increase number of non-appeal appearances $151.77 0.03%in District Court by 100%
Increase number of appeal appearances $152.06 0.23%in District Court
District court costs Cost per appearance:increased by 20% $151.80 0.05%
decreased by 20% $151.64 -0.05%
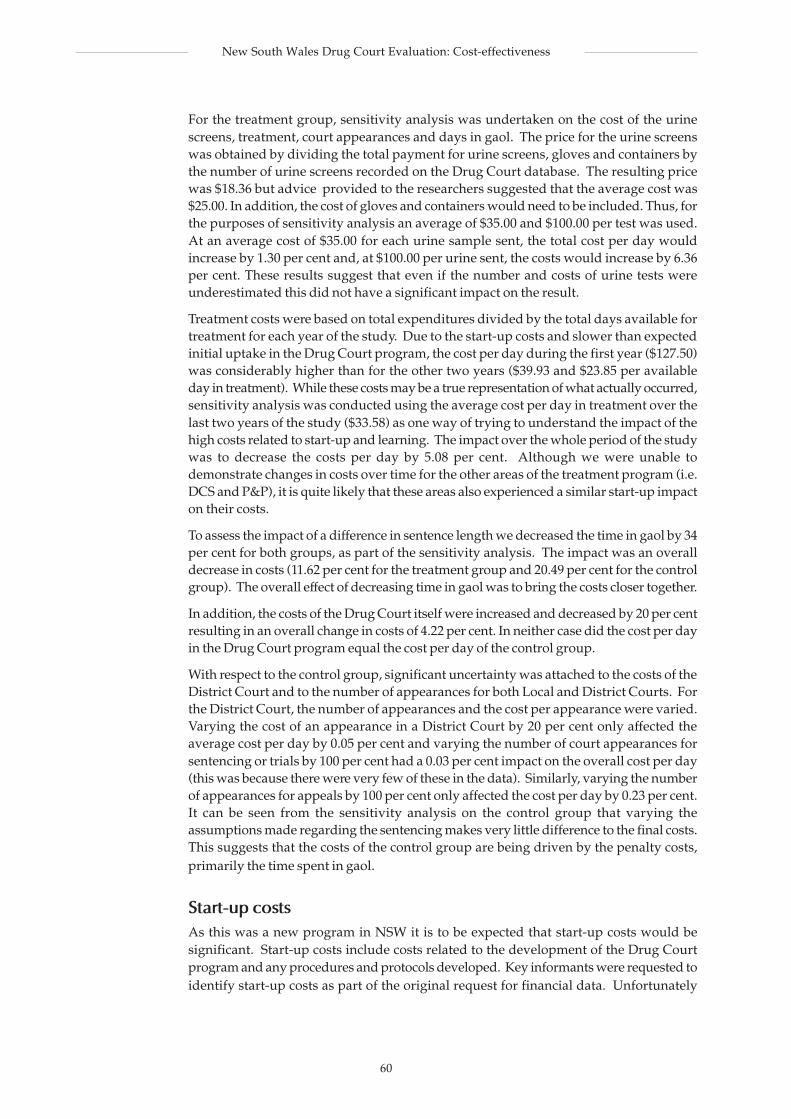
60
New South Wales Drug Court Evaluation: Cost-effectiveness
For the treatment group, sensitivity analysis was undertaken on the cost of the urinescreens, treatment, court appearances and days in gaol. The price for the urine screenswas obtained by dividing the total payment for urine screens, gloves and containers bythe number of urine screens recorded on the Drug Court database. The resulting pricewas $18.36 but advice provided to the researchers suggested that the average cost was$25.00. In addition, the cost of gloves and containers would need to be included. Thus, forthe purposes of sensitivity analysis an average of $35.00 and $100.00 per test was used.At an average cost of $35.00 for each urine sample sent, the total cost per day wouldincrease by 1.30 per cent and, at $100.00 per urine sent, the costs would increase by 6.36per cent. These results suggest that even if the number and costs of urine tests wereunderestimated this did not have a significant impact on the result.
Treatment costs were based on total expenditures divided by the total days available fortreatment for each year of the study. Due to the start-up costs and slower than expectedinitial uptake in the Drug Court program, the cost per day during the first year ($127.50)was considerably higher than for the other two years ($39.93 and $23.85 per availableday in treatment). While these costs may be a true representation of what actually occurred,sensitivity analysis was conducted using the average cost per day in treatment over thelast two years of the study ($33.58) as one way of trying to understand the impact of thehigh costs related to start-up and learning. The impact over the whole period of the studywas to decrease the costs per day by 5.08 per cent. Although we were unable todemonstrate changes in costs over time for the other areas of the treatment program (i.e.DCS and P&P), it is quite likely that these areas also experienced a similar start-up impacton their costs.
To assess the impact of a difference in sentence length we decreased the time in gaol by 34per cent for both groups, as part of the sensitivity analysis. The impact was an overalldecrease in costs (11.62 per cent for the treatment group and 20.49 per cent for the controlgroup). The overall effect of decreasing time in gaol was to bring the costs closer together.
In addition, the costs of the Drug Court itself were increased and decreased by 20 per centresulting in an overall change in costs of 4.22 per cent. In neither case did the cost per dayin the Drug Court program equal the cost per day of the control group.
With respect to the control group, significant uncertainty was attached to the costs of theDistrict Court and to the number of appearances for both Local and District Courts. Forthe District Court, the number of appearances and the cost per appearance were varied.Varying the cost of an appearance in a District Court by 20 per cent only affected theaverage cost per day by 0.05 per cent and varying the number of court appearances forsentencing or trials by 100 per cent had a 0.03 per cent impact on the overall cost per day(this was because there were very few of these in the data). Similarly, varying the numberof appearances for appeals by 100 per cent only affected the cost per day by 0.23 per cent.It can be seen from the sensitivity analysis on the control group that varying theassumptions made regarding the sentencing makes very little difference to the final costs.This suggests that the costs of the control group are being driven by the penalty costs,primarily the time spent in gaol.
Start-up costsAs this was a new program in NSW it is to be expected that start-up costs would besignificant. Start-up costs include costs related to the development of the Drug Courtprogram and any procedures and protocols developed. Key informants were requested toidentify start-up costs as part of the original request for financial data. Unfortunately
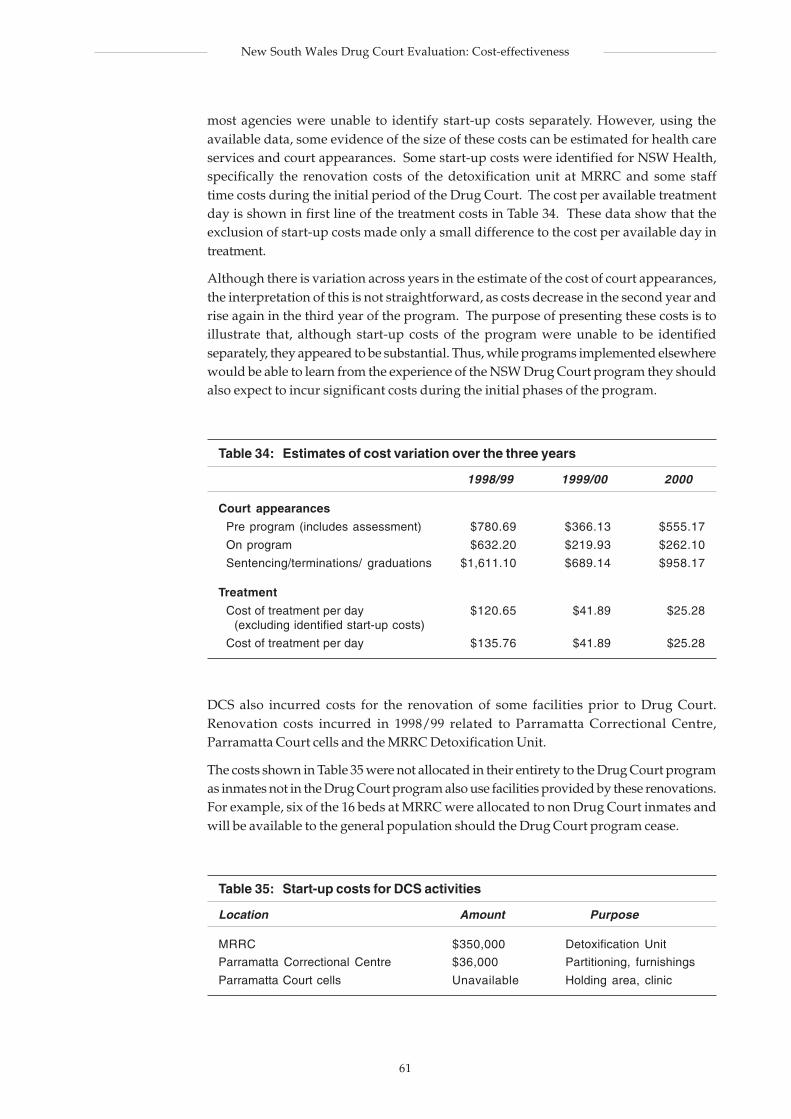
61
New South Wales Drug Court Evaluation: Cost-effectiveness
most agencies were unable to identify start-up costs separately. However, using theavailable data, some evidence of the size of these costs can be estimated for health careservices and court appearances. Some start-up costs were identified for NSW Health,specifically the renovation costs of the detoxification unit at MRRC and some stafftime costs during the initial period of the Drug Court. The cost per available treatmentday is shown in first line of the treatment costs in Table 34. These data show that theexclusion of start-up costs made only a small difference to the cost per available day intreatment.
Although there is variation across years in the estimate of the cost of court appearances,the interpretation of this is not straightforward, as costs decrease in the second year andrise again in the third year of the program. The purpose of presenting these costs is toillustrate that, although start-up costs of the program were unable to be identifiedseparately, they appeared to be substantial. Thus, while programs implemented elsewherewould be able to learn from the experience of the NSW Drug Court program they shouldalso expect to incur significant costs during the initial phases of the program.
Table 34: Estimates of cost variation over the three years
1998/99 1999/00 2000
Court appearances
Pre program (includes assessment) $780.69 $366.13 $555.17
On program $632.20 $219.93 $262.10
Sentencing/terminations/ graduations $1,611.10 $689.14 $958.17
Treatment
Cost of treatment per day $120.65 $41.89 $25.28 (excluding identified start-up costs)
Cost of treatment per day $135.76 $41.89 $25.28
DCS also incurred costs for the renovation of some facilities prior to Drug Court.Renovation costs incurred in 1998/99 related to Parramatta Correctional Centre,Parramatta Court cells and the MRRC Detoxification Unit.
The costs shown in Table 35 were not allocated in their entirety to the Drug Court programas inmates not in the Drug Court program also use facilities provided by these renovations.For example, six of the 16 beds at MRRC were allocated to non Drug Court inmates andwill be available to the general population should the Drug Court program cease.
Table 35: Start-up costs for DCS activities
Location Amount Purpose
MRRC $350,000 Detoxification Unit
Parramatta Correctional Centre $36,000 Partitioning, furnishings
Parramatta Court cells Unavailable Holding area, clinic
62
New South Wales Drug Court Evaluation: Cost-effectiveness
DISCUSSION
This study is the first assessment of the cost and cost-effectiveness of a drug court inAustralia. While a number of assessments of the costs of similar programs have beenpublished overseas (mainly in the US), drug courts have not by and large been subjectedto much systematic economic evaluation. The present study therefore represents alandmark in terms of rigorous appraisal of an existing drug court program.
The NSW Drug Court program is not a single service designed to deal with a definedproblem shared by all receivers of the service. It is a complex intervention designed tobenefit people with a range of different problems, all of which have resulted in drugdependence and drug-related crime. Such interventions pose unique problems forevaluators (MRC Health Services Research Board 2000; Godber, Robinson, & Steiner 1997;Coast, Hensher, Mulligan, Shepperd & Jones 2000). In the present case these problemsincluded the fact that not all participating agencies collected data in ways which weresuitable for the identification of resource use or the calculation of costs. This wascomplicated by some inadvertent errors in implementing the trial as a research process:some individuals originally allocated to the control group were subsequently allocated aplace in the treatment group and two were allowed to enter the program a second time,after having their first program terminated.
Data that would have enabled a more detailed economic evaluation were often of poorquality or simply not available. For example, tracking the days in residential rehabilitationby Drug Court identification number would have made the allocation of these costs moreaccurate. The quality of the data able to be used to estimate individual resource use hasbeen affected by a number of factors such as incomplete data on participants. In addition,inadequate documentation of changes in treatment protocols made it difficult to beconfident of the accuracy of the cost estimates. Further, computer-based records of programphase and treatment used for individuals were over-written which compounds thepotential for costs to be inaccurate. Subsequent evaluations of drug court or similarprograms would benefit from all agencies involved being consistent in documentingresources used by participants by individual identification numbers and by agreeingthat individual-level data would be made available for the purposes of assessing costs.
Ideally, the average cost per episode of treatment would have been compared with theaverage cost of sanctioning someone in the control group. The results of such a calculationfor the NSW Drug Court are $46,224 for the treatment group and $35,334 for the controlgroup. This suggests that the Drug Court was more expensive than conventional sanctions.However, such a comparison must be approached with caution. Because the graduationrate was much lower than expected our estimates of the cost per treatment episode are notvery reliable. To get around this problem we have calculated an average daily cost ofmaintaining someone on the Drug Court program and compared that to the average dailycost of sanctioning someone in the conventional way.
The results of this calculation reveal that, for the 23-month period of the evaluation, theDrug Court was as cost-effective as conventional sanctions in delaying the time to thefirst offence and cost-effective in reducing the frequency of offending. Sensitivity analysisindicates that these conclusions are robust under a range of plausible variations in theparameter values that underpin the costing. The relative cost-effectiveness of the DrugCourt is encouraging considering its highly experimental nature and the lack of experiencein Australia in establishing and running Drug Court programs. It is all the more notablebecause, although we had no alternative to the use of official records to measure drug-related crime, changes in offences dealt with by court are arguably a fairly crude andinsensitive measure of changes in criminal activity.
63
New South Wales Drug Court Evaluation: Cost-effectiveness
It is also worth bearing in mind that the costing perspective which informs this study waslimited to the measurement of costs that could be called treatment costs within the DrugCourt program and the control group. We have ignored the broader societal benefits thatmay flow from the Drug Court program. These include reduced demand (over the longterm) on health services and the criminal justice system, reduced insurance claims, reducedsocial security outlays and reduced pain and suffering as a result of criminal victimisation.We have also ignored some of the costs associated with conventional sanctions. Theseinclude the personal cost to offenders and the families when the former are deprived oftheir liberty and any social and public health costs that might flow from imprisonment(e.g. reduced offender employment prospects, higher rates of Hepatitis C and HIV-AIDS).Had it been possible to quantify these benefits and costs, the gap between the Drug Courtand conventional sanctions in terms of cost-effectiveness may well have been larger.
This said, there are areas where the cost-effectiveness of the NSW Drug Court has beenand could potentially be further improved. One of the major cost drivers for both treatmentand control groups is the cost of imprisonment. In the case of the control group this ishardly surprising, since the majority were imprisoned. In the case of the Drug Courtprogram imprisonment costs stem partly from the fact that prison is frequently used as asanction for non-compliance with program conditions and partly from the fact that alarge number of participants who were terminated from the program were sentenced totime in gaol. An important efficiency gain the Court has already made to its ownfunctioning stems from its decision to introduce suspended sanctions and permitparticipants to reduce these sanctions through good behaviour. This policy has twoadvantages. Firstly it reduces the ‘churning’ of offenders through the prison system whichwas feature of the Drug Court when program breaches were being punished with periodsin custody as short as a day. This reduction in ‘churning’ of offenders through the prisonsystem reduces the cost of the Drug Court relative to conventional sanctions. Secondly,because it introduces loss of prison time as a reward, it potentially increases theeffectiveness of the Drug Court program.
There are a number of other potential avenues of improvement to the cost-effectiveness ofthe Drug Court program. These are better targeting of offenders, earlier termination ofprogram participants who make insufficient progress in reducing drug use and criminalactivity, more realistic program graduation criteria, optimisation of treatment, andimprovements in cross-Departmental cooperation in relation to the program. We willdeal with each of these in turn.
The results of the effectiveness evaluation (see Tables 19-28) show that those who remainon the Drug Court program commit significantly fewer offences and take longer to committheir first offence than either those rejected from the program or those sanctioned in theconventional way. The problem for the Drug Court is that it is difficult to tell, upon entryto the program, who will succeed on it and who will fail. As a result, to reap the benefitsof the program a large number of people have to be placed on it who will subsequentlyfail. Forty-three per cent of the subjects who entered the Drug Court program in our studywere later removed from it for further offences or non-compliance with program conditions.This high termination rate increases the cost of the Drug Court program, while at thesame time lowering its measured effectiveness. If it were possible more clearly to identifythose who are more likely to succeed on the program, and thereby reduce the programtermination rate, the cost-effectiveness of the Drug Court program could be increased.
How might the Drug Court improve its targeting of offenders? To get a comprehensiveanswer to this question it would be necessary to undertake a systematic statistical analysisof the factors (e.g. age, gender, period of heroin use, marital status etc.) which distinguishthose who remain on the program from those who are removed from it. Due to the limitedamount of background data collected on Drug Court participants and changes in the
64
New South Wales Drug Court Evaluation: Cost-effectiveness
Drug Court program it would not be advisable to conduct such an analysis retrospectively(i.e. on the basis of extant data). It would not be difficult, however, to set up a prospectivestudy of the predictors of program retention. In the meantime it is worth noting thatFreeman (2002) found the Drug Court program retention rate to be twice as high foroffenders facing sentences of six months or more compared with offenders given sentencesof less than six months. One immediate way of improving the targeting of the Drug Courtprogram, therefore, might be to reduce the number of offenders accepted onto the programwho are facing relatively short prison terms.
Predicting those who will succeed on the Drug Court program will always be an uncertainscience. Given that the program is targeted at recidivist drug-dependent offenders oneshould expect a relatively high program failure rate. At the same time, those who remainon the program, but do not reduce their drug consumption or criminal activity, consumeDrug Court resources while contributing nothing to the Drug Court’s effectiveness. Thisresource consumption is not insignificant because participants are often removed fromthe program some months after entering it. Another way in which to improve the cost-effectiveness of the Drug Court, then, would be to identify those who are not likely tosucceed on the program and remove them at an earlier point in time. This suggestionshould not be taken to mean that people should be removed from the program at the firstpositive drug test or for the first infraction of program rules. It is unrealistic to expectrecidivist drug-dependent offenders to cease all use of drugs abruptly upon entering theprogram. The point is rather that it would be better to remove those who do not showreasonable signs of progress at a fairly early stage than to persevere with them in the hopethat they will eventually respond to treatment.
One of the problems faced by the Drug Court in pursuing this course of action is that thelegislative threshold for program termination requires the Court to be satisfied on thebalance of probabilities ‘that there is no useful purpose to be served in the drug offender’sfurther participation in the program’ (NSW Drug Court Act 1998, s.10(1)(b)). This is ahigh threshold for termination since, in any individual case, it will always be difficult tosay that no useful purpose is served by keeping an offender on the program. Such athreshold might be understandable if the benefits of continuation on the program werelarge relative to its costs, but it is doubtful that they are. The opportunity costs of keepingsomeone on the program who shows no significant sign of improvement include the factthat other potentially more motivated offenders are deprived of an opportunity toparticipate in the program and the fact that the community has to bear the cost of furthercriminal victimisation. Keeping someone on the Drug Court program who persistentlyfails to meet program conditions may also exert a corrosive effect on the willingness ofother participants to abide by the conditions of their Drug Court program.
Instead of removing an offender from the program only at the point when ‘no usefulpurpose’ is served by keeping them on, it might be better to change the threshold so thatoffenders are removed when, in the judgement of the Court, the benefits to the offender areoutweighed by the risk and cost to the community. This would give greater weight both tocommunity protection and to the need to ensure that the benefits of public investment inthe Drug Court program are fully optimised. A change of this nature has already beensuggested by one member of the Drug Court team, several of whom have expresseddiscontent with the termination provisions in the Drug Court Act (Taplin, 2002, p. 57).
Improvements might also be made to the cost-effectiveness of the Drug Court in relation tothe criteria for program graduation. The Drug Court Act itself does not stipulate any suchcriteria. Instead it simply states that ‘successful completion’ of the program is one basison which an offender’s program might be terminated. It has been left to the Court itself to
65
New South Wales Drug Court Evaluation: Cost-effectiveness
define the requirements for ‘successful’ program completion. The Court has taken a fairlystringent view of these requirements (Milson 2002), with the result that participants in itsprogram are taking much longer to graduate than anticipated. To graduate, an offendermust, over a period of six months, remain drug and crime ‘free’, accept a ‘drug and crimefree’ lifestyle, stabilise their social and domestic environment, either gain employment orbe employment ‘ready’ and be fiscally responsible. Over the past year these requirementshave been relaxed in two respects. Firstly, an offender who relapses during the last (third)phase of their program is only required to meet the conditions described above for afurther three-month period. Secondly, the requirement in relation to employment hasbeen modified to include home duties.
It may ultimately be a matter for judgment whether these are reasonable criteria on whichto release an offender of their legal obligations to the community. But it is easy to seecircumstances in which an offender might cease all predatory criminal activity withoutcompletely giving up all use of illicit drugs. One common response on the part of thosestruggling to reduce their consumption of an addictive drug, such as heroin, seems to bea switch to other less addictive and less expensive drugs such as cannabis (Weatherburn,Jones, Freeman & Makkai 2001). The switch to less expensive, less addictive drugs may beaccompanied by a substantial reduction or even cessation of criminal activity. As thingsstand, however, a Drug Court program participant testing positive for cannabis cannot beexpected to graduate from the program, even if their predatory criminal activity has ceasedaltogether. Considering that the principal aim of the Drug Court is to reduce drug-relatedcrime, and that most drug-related crime stems from cocaine or heroin dependence, itcould be argued that program completion would be warranted once a person has ceasedoffending and substantially reduced their use of illicit drugs, particularly heroin orcocaine.
It would enhance the cost-effectiveness of the intervention if more were known aboutwhich health care intervention or combination of interventions were successful inimproving the health and social outcomes of offenders. Again, a comprehensive answerwould require a systematic analysis of the factors, both offender-related and treatment-related, which distinguish successful interventions from others. Some information maybe available from studies already undertaken in Australia but it is important that anyanalysis be conducted in a similar context to that of the Drug Court.
A final area where improvements might be made is in the area of service coordination. Indiscussions with the various stakeholders involved in the Drug Court Program it becameapparent that many were of the opinion that communication, treatment planning andcase coordination could be improved (see Taplin 2002). Examples mentioned to some ofthe authors of this report include:
– differences of opinion regarding the withholding of counselling and educationalprograms during sanctions;
– there appeared to be some uncertainty whether all participants who abscondedfrom treatment were reported immediately to the Drug Court resulting in delays towarrants being issued.
There is no documented evidence that resolution of these and other administration andorganisational issues would improve the outcomes and/or the costs but often commonsense would suggest that gains would be made.
66
New South Wales Drug Court Evaluation: Cost-effectiveness
CONCLUSION
The principal object of the NSW Drug Court was to provide an alternative and more cost-effective means of reducing drug-related crime than conventional sanctions. For mostoffence categories Drug Court participants took less time to offend and exhibited lowerrates of offending than control group members who had been sanctioned in theconventional way. However, the differences were statistiically significant only for a limitednumber of the offence types examined.
When those who were retained on the program were compared with those rejected from itor placed in the control group, the lower rates of crime among Drug Court participantswere much more evident. This result held up even in the presence of controls for other pre-existing factors (e.g. differences in prior criminal record) which might have explained thebetter performance of Drug Court participants.
Although it is more effective for some indicators, the Drug Court is not much less expensivethan conventional sanctions. It proved impossible to obtain reliable estimates of the totalcost per episode of placement on a Drug Court program but the estimated cost per day($144) is only about ten dollars less than the cost per day of conventional sanctions($152). Although this difference is small, the Drug Court appears to be at least as cost-effective as conventional sanctions. In terms of cost-effectiveness in increasing the time tothe first offence, the two methods of disposition are essentially equivalent. In terms ofpreventing additional offences, the Drug Court appears to be more cost-effective thanconventional sanctions, at least for the two marker offence types we selected, namelyshop stealing and possess/use opiates. There is a greater cost to prevent each additionaloffence for these offence types for those conventionally sactioned than for those placed onthe Drug Court program.
There is scope for cost savings and effectiveness improvements within the NSW DrugCourt. The Court itself has already made significant progress in this regard by introducinga system of suspended sanctions for program non-compliance. Future efforts to reducethe cost of the Drug Court program should focus on improving its ability to identify thosewho will respond favourably to the program, ensuring that those who will not respondare removed sooner, identifying which treatment regimes are most effective, adopting amore realistic set of graduation criteria and securing better cooperation amongst thoseinvolved in the Drug Court program.

67
New South Wales Drug Court Evaluation: Cost-effectiveness
NOTES
1 Note that it is not the intent of this section to comment on the adequacy of resource flows,but rather to outline the nature of those flows.
2 For reasons explained later (see section entitled Estimating costs for the control group) thenumber of persons included in the cost-effectiveness analysis differed slightly from thenumber included in the effectiveness analysis.
3 These expenses could alternatively have been allocated over the total number ofMagistrates in NSW rather than over Registry staff.
68
New South Wales Drug Court Evaluation: Cost-effectiveness
REFERENCES
Applegate, B.K. & Santana, S. 2000, ‘Intervening with youthful substance abusers:A preliminary analysis of a juvenile drug court’, The Justice System Journal, vol. 21, no. 3,pp. 281-300.
Bean, P. 1996, ‘America’s drug courts: A new development in criminal justice’, CriminalLaw Review, pp. 718-21.
Belenko, S. 1998, ‘Research on drug courts: A critical review’, National Drug Court InstituteReview, vol. 1, no. 1, pp. 1-42.
Belenko, S. 2001, Research on Drug Courts: A Critical Review 2001 Update, NationalCentre on Addiction and Substance Abuse, Columbia University.
Blumstein, A., Cohen, J., Roth, J. A. & Visher, C. A. (eds) 1986, Criminal Careers and CareerCriminals, vol. 1, National Academy Press, Washington DC.
Braithwaite, J., 1988, Crime, Shame and Reintegration, Cambridge University Press,Cambridge.
Breckenridge, J.F., Winfree, L.T., Maupin, J.R. & Clason, D.L. 2000, ‘Drunk drivers, DWI“Drug Court”, treatment, and recidivism, who fails?’, Justice Research and Policy, vol. 2,no. 1, pp. 87-105.
Brewster, M.P. 2001, ‘An evaluation of the Chester County (PA) Drug Court Program’,Journal of Drug Issues, vol. 31, no. 1, pp. 177-206.
Briscoe, S., & Coumarelos, C. 2000, New South Wales Drug Court: Monitoring Report,Crime and Justice Bulletin no. 52, NSW Bureau of Crime Statistics and Research, Sydney.
Brown, J. 1997, ‘Drug diversion courts: Are they needed and will they succeed in breakingthe cycle of drug-related crime?’, New England Journal on Criminal and CivilConfinement, vol. 23, pp. 63-99.
Coast, J., Hensher, M., Mulligan, J. A., Shepperd, S., & Jones, J. 2000, ‘Conceptual andpractical difficulties with the economic evaluation of health services developments’,Journal of Health Services & Research Policy, vol.5: no. 1, pp. 42-48.
Deschenes, E. P., Turner, S. & Greenwood, P. W. 1995, ‘Drug Court or probation?: Anexperimental evaluation of Maricopa County’s Drug Court’, The Justice System Journal,vol. 18, no. 1, pp. 55-73.
Drummond, M., O’Brien, B., Stoddart, G., & Torrance, G, 1997, Methods for the EconomicEvaluation of Health Care Programmes, Oxford University Press, Oxford.
Drug Court of NSW Review Committee 1999, Review of Drug Court Procedure, DrugCourt of New South Wales Review Committee, unpublished report, Drug Court of NSW,Parramatta, Sydney.
Freeman, K. 2001, New South Wales Drug Court Evaluation: Interim Report on Health andWell-being of Participants, Crime and Justice Bulletin no. 53, NSW Bureau of Crime Statisticsand Research, Sydney.
Freeman, K. 2002, New South Wales Drug Court Evaluation: Health Well-Being and ParticipantSatisfaction, New South Wales Bureau of Crime Statistics and Research, Sydney.
69
New South Wales Drug Court Evaluation: Cost-effectiveness
Freeman, K., Karski, R., & Doak, P. 2000, New South Wales Drug Court Evaluation: Programand Participant Profiles, Crime and Justice Bulletin no. 50, NSW Bureau of Crime Statisticsand Research, Sydney.
Freiberg, A. 2000, ‘Australian Drug Courts’, Criminal Law Journal, vol. 24, no. 4,pp. 213-235.
General Accounting Office 1997, Drug Courts: Overview of Growth, Characteristics, and Results,Report to the Committee on the Judiciary, US Senate, and the Committee on the Judiciary,House of Representatives, United States General Accounting Office, Washington.
Godber, E., Robinson, R.& Steiner, A. 1997, ‘Economic evaluation and the shifting balancetowards primary care - definitions, evidence and methodological issues’, HealthEconomics, vol. 6, no.3: pp. 275-294.
Gold, M., Siegel, J., L.B., R., Russell, L.B, & Weinstein, M.C., 1996, Cost-Effectiveness inHealth and Medicine, Oxford University Press, Oxford.
Goldkamp, J.S. 1994, ‘Miami’s Treatment Drug Court for felony defendants: Someimplications of assessment findings’, The Prison Journal, vol. 73, no. 2, pp. 110-166.
Gottfredson, D.C., Coblentz, K.& Harmon, M.A. 1997, ‘A short-term outcome evaluationof the Baltimore City Drug Treatment Court Program’, Perspectives, Winter, pp. 33-38.
Granfield, R., Eby, C., & Brewster, T. 1998, ‘An examination of the Denver Drug Court:The impact of a treatment-oriented, drug-offender system’, Law and Policy, vol. 20, no. 2,pp. 183-200.
Hall, W. 1996, Methadone Maintenance as a Crime Control Measure, Crime and JusticeBulletin no. 29, NSW Bureau of Crime Statistics and Research, Sydney.
Hall, W. 1997, ‘The role of legal coercion in the treatment of offenders with alcohol andheroin problems’, The Australian and New Zealand Journal of Criminology, vol. 30,no. 2, pp. 103-120.
Incidardi, J.A., McBride, D.C., & Rivers J.E., 1996, Drug Control and the Courts, SagePublications, London.
Makkai, T. 1998, Drug courts: issues and prospects, Trends and Issues in Crime andCriminal Justice, Australian Institute of Criminology, Canberra.
Miethe, T.D., Lu, H., & Reese, E. 2000, ‘Reintegrative shaming and recidivism risks inDrug Court: Explanations for some unexpected findings’, Crime and Delinquency,vol. 46, no. 4, pp. 522-541.
Milson, Judge, N. 2002, Personal communication.
MRC Health Services and Public Health Research Board 2000, A framework for thedevelopment and evaluation of RCTs for complex interventions to improve health, MedicalResearch Council, London.
Peters, R. H. & Murrin, M. R. 2000, ‘Effectiveness of treatment-based drug courts in reducingcriminal recidivism’, Criminal Justice and Behavior, vol. 27, no. 1, pp. 72-96.
Prendergast, M. L. & Maugh, T. H., II 1995, ‘Drug courts: Diversion that works’, The Judges’Journal, vol. 34, pp. 10-14.
Russell, L. B., Gold, M. R., Siegel, J. E., Daniels, N. & Weinstein, M.C., 1996, The role of cost-effectiveness analysis in health and medicine, Panel on Cost-Effectiveness in Health andMedicine, Journal of the American Medical Association, vol. 276, no 14: pp. 1172-1177.
70
New South Wales Drug Court Evaluation: Cost-effectiveness
Spohn, C., Piper, R.K., Martin, T., & Frenzel, E.D. 2001, ‘Drug Courts and recidivism:The results of an evaluation using two comparison groups and multiple indicators ofrecidivism’, Journal of Drug Issues, vol. 31, no. 1, pp. 149-176.
Taplin, S. 2002, NSW Drug Court Evaluation: A Process Evaluation, NSW Bureau of CrimeStatistics and Research, Sydney.
US Department of Justice 1997, Defining Drug Courts: The Key Components, US Departmentof Justice, Office of Justice Programs, Washington DC.
Vito, G.F., & Tewksbury, R.A. 1999, ‘The Impact of Treatment: The Jefferson County(Kentucky) Drug Court Program’, Federal Probation, vol. 62, no. 2, pp. 46-51.
Weatherburn, D., Jones, C., Freeman, K. & Makkai, T. 2001, The Australian Heroin Droughtand its Implications for Drug Policy, Crime and Justice Bulletin no. 59, NSW Bureau ofCrime Statistics and Research, Sydney.
Weatherburn, D., Lind, B. & Forsythe, L. 1999, Drug Law Enforcement: Its Effect onTreatment Experience and Injection Practices, NSW Bureau of Crime Statistics andResearch, Sydney.
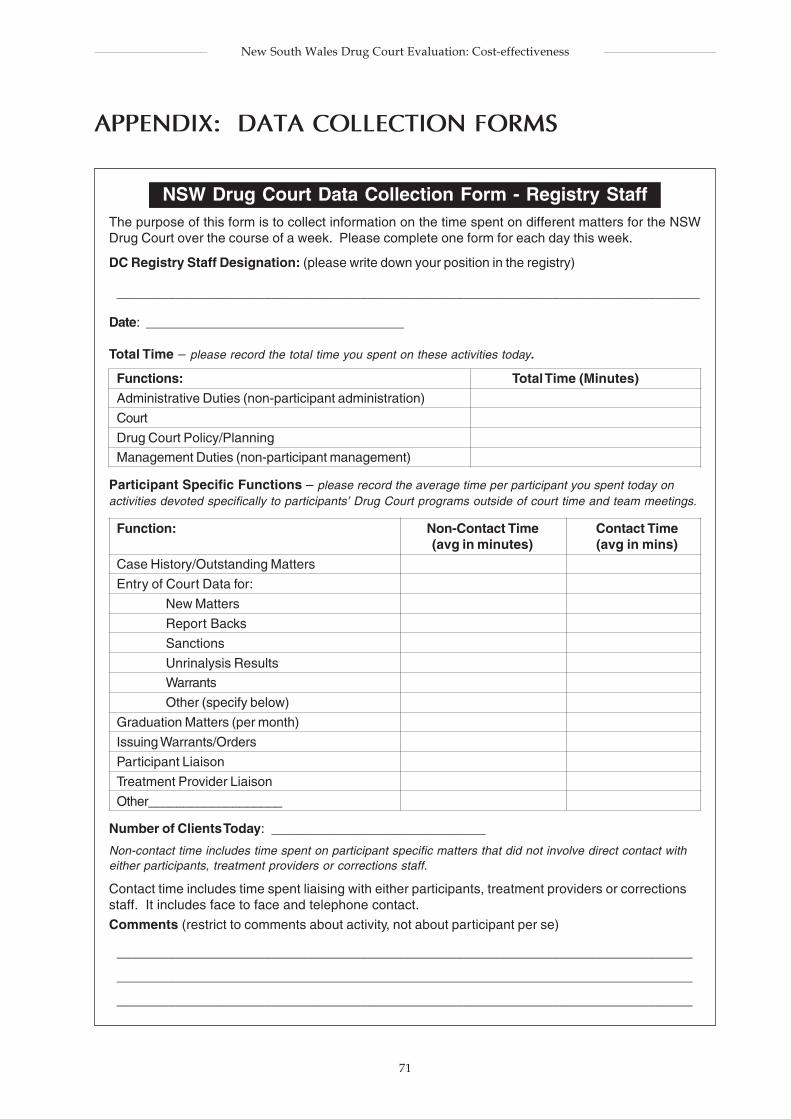
71
New South Wales Drug Court Evaluation: Cost-effectiveness
APPENDIX: DATA COLLECTION FORMS
NSW Drug Court Data Collection Form - Registry StaffThe purpose of this form is to collect information on the time spent on different matters for the NSWDrug Court over the course of a week. Please complete one form for each day this week.
DC Registry Staff Designation: (please write down your position in the registry)
_______________________________________________________________________________
Date: ___________________________________
Total Time – please record the total time you spent on these activities today.
Functions: Total Time (Minutes)
Administrative Duties (non-participant administration)
Court
Drug Court Policy/Planning
Management Duties (non-participant management)
Participant Specific Functions – please record the average time per participant you spent today onactivities devoted specifically to participants’ Drug Court programs outside of court time and team meetings.
Function: Non-Contact Time Contact Time(avg in minutes) (avg in mins)
Case History/Outstanding Matters
Entry of Court Data for:
New Matters
Report Backs
Sanctions
Unrinalysis Results
Warrants
Other (specify below)
Graduation Matters (per month)
Issuing Warrants/Orders
Participant Liaison
Treatment Provider Liaison
Other___________________
Number of Clients Today: _____________________________
Non-contact time includes time spent on participant specific matters that did not involve direct contact witheither participants, treatment providers or corrections staff.
Contact time includes time spent liaising with either participants, treatment providers or correctionsstaff. It includes face to face and telephone contact.
Comments (restrict to comments about activity, not about participant per se)
______________________________________________________________________________
______________________________________________________________________________
______________________________________________________________________________

72
New South Wales Drug Court Evaluation: Cost-effectiveness
NSW Drug Court Data Collection FormThe purpose of this form is to collect information on the time spent on different matters for NSW DrugCourt participants over the course of a week. Please complete one form for each day this week.
DC Team Member (please tick appropriate box)
Judge Legal Aid Solicitor Public Prosecutor Other___________Health Officer Probation and Parole Court Reporter Sheriffs Officer
Date: ___________________________________
Total Time – please record the total time you spent on these activities today.
Functions: Total Time (Minutes)
Administrative Duties (non-participant administration)
Court
Drug Court Policy/Planning
Management Duties (non-participant management)
Team meeting
Participant Specific Functions – please record the average time per participant you spent today onactivities devoted specifically to participants’ Drug Court programs outside of court time and team meetings.
Function: Non-Contact Time Contact Time(avg in minutes) (avg in mins)
Assessment
Case History/Research/Preparation
Liaison
Case Manager
Participant
Treatment Provider
Other___________________
Counselling
Monitoring
Treatment Plan
Other___________________
Number of Clients Today: _____________________________
Non-contact time includes time spent on participant specific matters that did not involve direct contact witheither participants, treatment providers or corrections staff.
Contact time includes time spent liaising with either participants, treatment providers or correctionsstaff. It includes face to face and telephone contact.
Comments (restrict to comments about activity, not about participant per se)
______________________________________________________________________________
______________________________________________________________________________
______________________________________________________________________________