NEW OPPORTUNITIES - ftgcorp.comFullReport) .pdf · TO OUR SHAREHOLDERS 2 Firan Technology Group...
32
NEW OPPORTUNITIES Annual Report 2004
Transcript of NEW OPPORTUNITIES - ftgcorp.comFullReport) .pdf · TO OUR SHAREHOLDERS 2 Firan Technology Group...
NEW OPPORTUNITIES
Annual Report 2004
MANAGEMENT’S DISCUSSION ANDANALYSIS
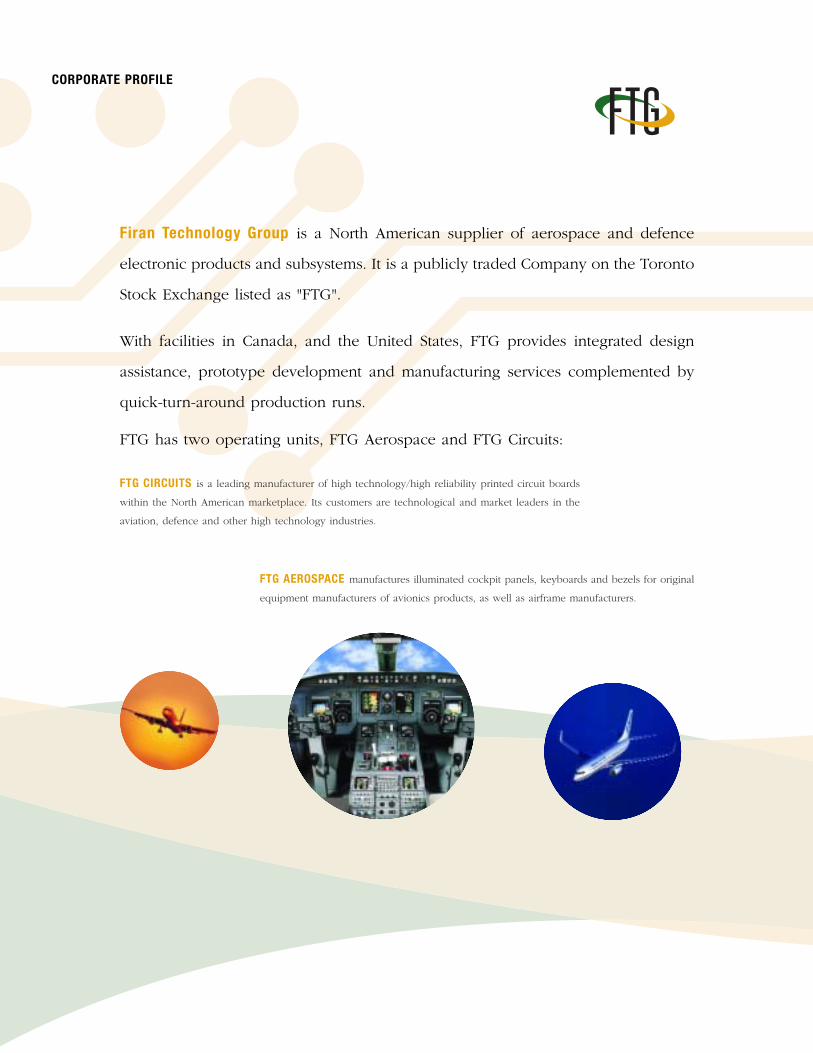
Firan Technology Group is a North American supplier of aerospace and defence
electronic products and subsystems. It is a publicly traded Company on the Toronto
Stock Exchange listed as "FTG".
With facilities in Canada, and the United States, FTG provides integrated design
assistance, prototype development and manufacturing services complemented by
quick-turn-around production runs.
FTG has two operating units, FTG Aerospace and FTG Circuits:
CORPORATE PROFILE
FTG CIRCUITS is a leading manufacturer of high technology/high reliability printed circuit boards
within the North American marketplace. Its customers are technological and market leaders in the
aviation, defence and other high technology industries.
FTG AEROSPACE manufactures illuminated cockpit panels, keyboards and bezels for original
equipment manufacturers of avionics products, as well as airframe manufacturers.
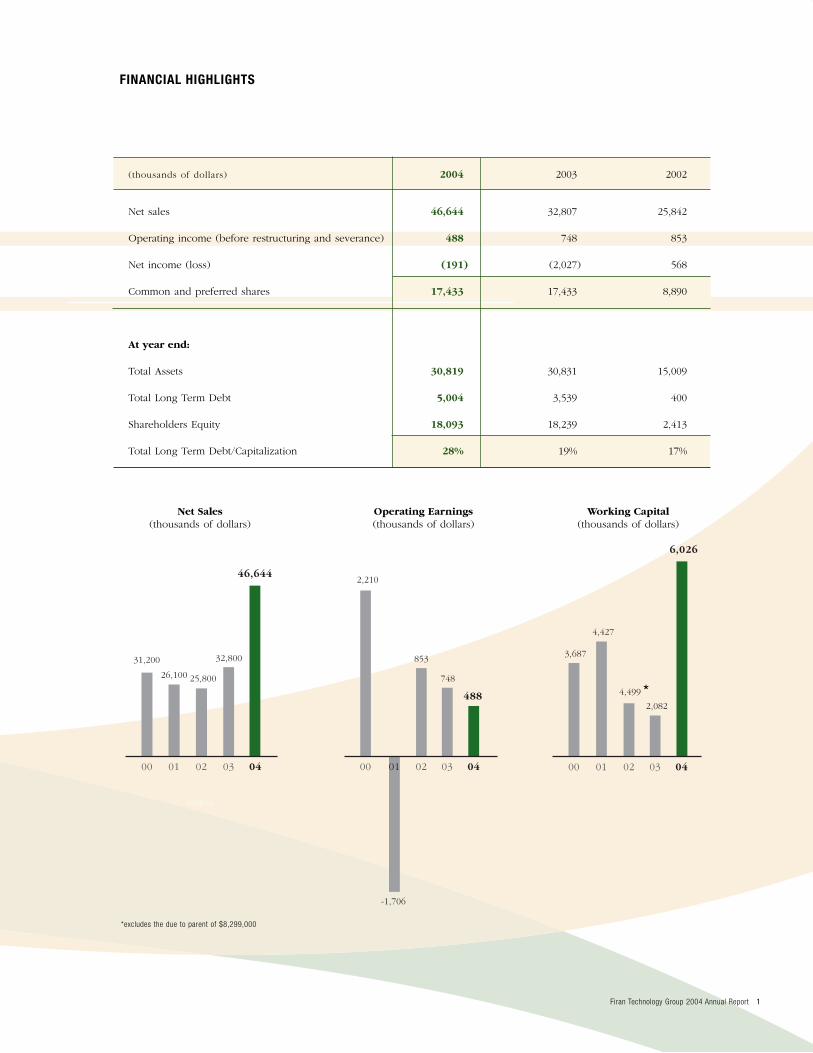
FINANCIAL HIGHLIGHTS
(thousands of dollars) 2004 2003 2002
Net sales 46,644 32,807 25,842
Operating income (before restructuring and severance) 488 748 853
Net income (loss) (191) (2,027) 568
Common and preferred shares 17,433 17,433 8,890
At year end:
Total Assets 30,819 30,831 15,009
Total Long Term Debt 5,004 3,539 400
Shareholders Equity 18,093 18,239 2,413
Total Long Term Debt/Capitalization 28% 19% 17%
Firan Technology Group 2004 Annual Report 1
*excludes the due to parent of $8,299,000
00 01 02 03 04 00 03 04
31,200
25,800
32,800
46,644
26,100
2,210
853
748
488
-1,706
00 01 02 03 04
3,687
4,499
2,082
6,026
4,427
(000's)
01 02
Net Sales Operating Earnings Working Capital(thousands of dollars) (thousands of dollars) (thousands of dollars)
*

TO OUR SHAREHOLDERS
2 Firan Technology Group 2004 Annual Report
Fiscal 2004 was a pivotal year for FTG in creating a solid foundation for the future. As we close out
2004 we are a much stronger business with substantial opportunities ahead.
Early in 2004 we successfully completed the integration of the Circuit World and FTG businesses. With
this accomplished, we reconsidered our strategic options for our aerospace business and concluded
that our best approach would be to retain it within FTG. This decision was based on the strong outlook
for the business as well as the synergies we saw with our circuits business due to the strong customer
overlap. The financial results from this business through the year validate our decision.
We have continued to refine our market focus and we are now targeting aerospace and defence
applications as our first priority. Through 2004 we penetrated a number of new accounts in these areas
and we laid the foundation for future growth in other accounts. With our investments in quality systems
and our ability to build the highest reliability products, we will also target high technology commercial
applications where these capabilities differentiate us from other suppliers.
While the aerospace market remained robust throughout the year, we did see a slowdown in the circuit
board industry towards the end of the year. This industry continues to see pressure from competitors
in the Far East and this includes continuing downward price pressure.
Just after our year-end, our acquisition of Young Electronics, a circuit board manufacturer in California,
reinforced our focus in the aerospace and defence applications. This important strategic acquisition also
established us with a manufacturing presence in the United States, our largest market.
Firan Technology Group 2004 Annual Report 3
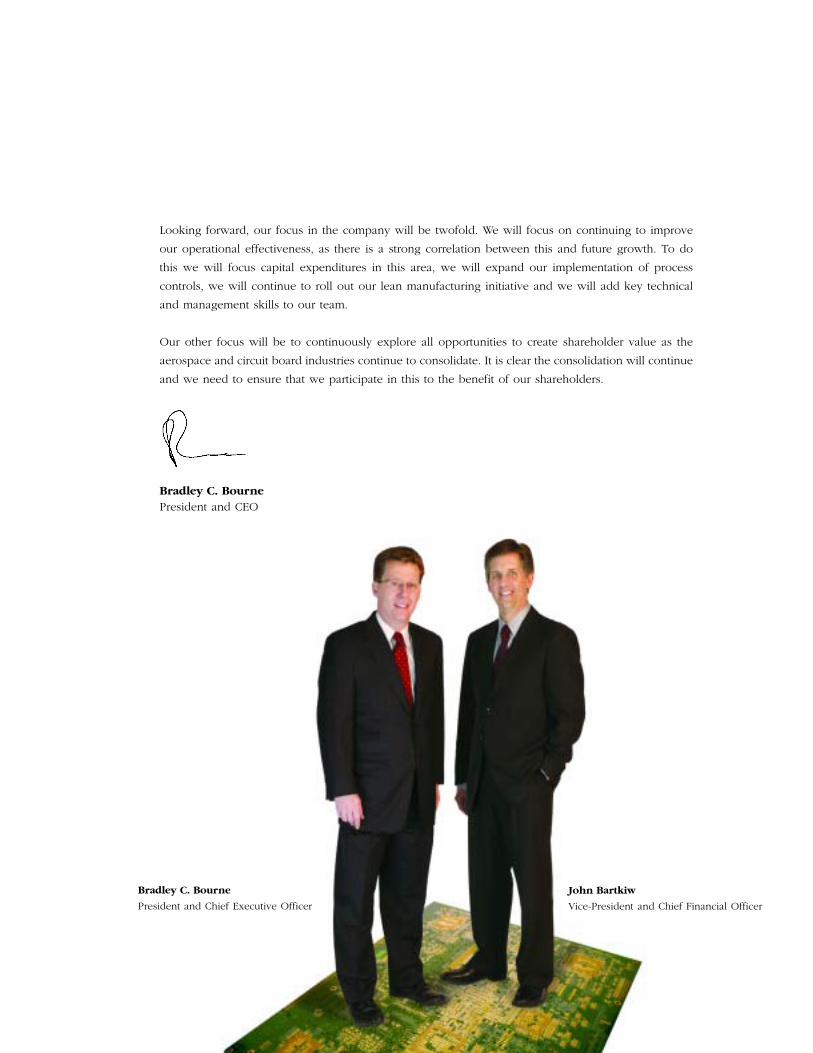
Looking forward, our focus in the company will be twofold. We will focus on continuing to improve
our operational effectiveness, as there is a strong correlation between this and future growth. To do
this we will focus capital expenditures in this area, we will expand our implementation of process
controls, we will continue to roll out our lean manufacturing initiative and we will add key technical
and management skills to our team.
Our other focus will be to continuously explore all opportunities to create shareholder value as the
aerospace and circuit board industries continue to consolidate. It is clear the consolidation will continue
and we need to ensure that we participate in this to the benefit of our shareholders.
Bradley C. BournePresident and CEO
Bradley C. Bourne
President and Chief Executive Officer
John Bartkiw
Vice-President and Chief Financial Officer
REVIEW OF OPERATIONS
4 Firan Technology Group 2004 Annual Report
FTG has fabricated aerospace and defense electronic products for more than 30 years. We’re proud of our
experience, especially in industries where time is measured in microseconds and new technology is superseded
daily. However, experience is only significant when partnered with efficiency and cutting edge innovation. Our
ability to provide the right products and services to complex electronic applications keeps us in business and is also
the catalyst for our long-term growth.
Over the years both businesses have built a solid customer base. Today FTG Circuits is a Canadian technology leader
in the North American circuit board industry where sales are currently $8-9 billion annually. The sub-contract
segment is the fastest growing sector of the overall market and profit margins for complex circuits are typically
higher than those for simpler boards used in consumer electronics. Over 70 percent of FTG’s sales comes from the
sale of sophisticated printed circuits to the world's leading original equipment manufacturers and their sub-contract
assemblers. In addition, more than 75 percent of FTG’s sales are made to leading edge Aerospace, Defense,
Telecommunications and Medical industry suppliers located in the U.S.
FTG Aerospace delivered record results for the year with exceptional revenue growth. The division also contributed
to the company’s bottom line with strong profit and improved margins despite the appreciation of the Canadian
dollar. With new marketing initiatives in place and enhanced manufacturing capacity, FTG Aerospace is ready and
capable to face the challenges ahead.
Our Successes
In many ways 2004 was a pivotal year for FTG. We marked milestones that when collectively considered make one
thing apparent: FTG is stronger than ever and possesses a firm foundation for continued growth.
We successfully completed the merger of Circuit World Corporation and Firan Technology Group Inc. The benefits
to the new organization were sizeable. We retained all our customers through the transition and transferred existing
military and security certifications and approvals to the new company. In addition, we met the challenge of
integrating our production staff into one streamlined facility and achieved a cost savings in excess of $5,000,000 in
the process.
As a newly formed company we made a considered decision to consolidate our products under one brand name
– Firan Technology Group Corporation. To increase awareness of our new brand we introduced a new logo and
visual identity, and also launched a comprehensive new website, www.firantechnology.com.
To ensure that FTG has access to the working capital necessary to finance long-term growth plans we secured a
strong financial partner in the Royal Bank of Canada. Signing the $11,250,000 multi-year banking agreement will
allow us to penetrate new markets and continue producing innovative products for an expanding customer base.
One of our biggest achievements in 2004 was the purchase of Young Electronics, a profitable Los Angeles, California
based printed circuit board business. This strategic acquisition gives FTG instant access to one of the largest
concentrations of aerospace and defense industries in the U.S. By owning a U.S. operation we will also surmount
purchasing barriers many U.S. defense firms have put in place when it comes to buying products and services from
outside the United States. In addition, our ownership in Young Electronic will help reduce currency risks and
minimize our exposure to the strengthening Canadian dollar.

Firan Technology Group 2004 Annual Report 5

REVIEW OF OPERATIONS
6 Firan Technology Group 2004 Annual Report
Firan Technology Group 2004 Annual Report 7
Our Challenges
Although 2004 was successful, it was not without its challenges. At the beginning of the year we experienced a six-week
delay in the integration of the two printed circuit board manufacturing facilities. By mid January, the manufacturing
integration was completed and our facilities were again running at a normalized rate.
Our sales and profitability were also negatively affected as the Canadian dollar strengthened against its U.S counterpart. To
manage exposure to currency risks we enter into foreign exchange contracts on a regular basis. By employing this strategy,
in combination with the benefits accrued from the newly streamlined operating procedures, we returned to profitability in
the second and third quarters of 2004.
Looking Forward
The printed circuit board is omnipresent: It is the fundamental component of every piece of electronic equipment in use
around the world today. Since computer chips must be mounted on a platform of some kind, the circuit board is, and will
almost certainly continue to be, the only product that can fulfill this role.
Competing in the printed circuit board arena is demanding and the players are aggressive. While 2004 was the best year
the industry has experienced in a long time, the market softened during the latter part of the year and business indicators
point to a flat 2005 for the North American marketplace. The sector has also been hit with price increases from its suppliers
due to rising commodity costs. The anticipated challenges for FTG Circuits will likely be: increased competition and
decreased opportunities to boost end customer pricing.
Building on past year’s organizational improvements, FTG Aerospace is ready to embark on an aggressive expansion of its
client base and market share. The division will also continue to implement the deployment of new technologies and product
development processes while continuing to refine the existing manufacturing capabilities.
FTG’s fundamental strengths — like quality products, responsive customer service, innovation, efficiency and experience —
are big advantages for managing challenge and for increasing market share. We will focus our energy and resources on
sectors with the greatest opportunities for sustainable growth and profitability. We believe the best returns will be realized
in the aerospace/military and the high reliability/high technology commercial markets, and in the past year we have shaped
our new company to meet the needs of these two important sectors. As an energized FTG moves forward we are confident
we will provide our shareholders with a strong return on their investment.
FTG Circuits Division
FTG Circuits designs and fabricates high technology, highly reliable multilayer rigid and flexible printed circuit boards. Our
customers are technological and market leaders in the aviation, defence, medical, telecommunications, test and
instrumentation industries.
In 2004 the FTG Circuits Division sales were 49 percent higher than in 2003. While our year-over-year sales increased,
primarily as a result of the merger, they were lower than expected. We believe the six-week delay in the integration of the
two printed circuit board manufacturing facilities was the reason for this decrease.
We signed a new two year contract extension with Rockwell Collins valued at approximately USD $6.25M. (Rockwell Collins is a
U.S. provider of aviation electronic and communication solutions for government, aircraft manufacturers and more than 400 airline
customers.) This business relationship reinforces our focus on the aerospace and defense markets as growth areas for FTG.

REVIEW OF OPERATIONS
8 Firan Technology Group 2004 Annual Report
In addition, FTG joined with the United States Navy and Rockwell Collins to put into action a new lean manufacturing
program. This program has helped streamline FTG production enhanced the way we conduct business.
Building our Business
In 2004 FTG Circuit Division applied for and received certification from the NASA Marshall Space Flight Center. We were
pleased to obtain this certification since it allows us to supply printed circuit boards to NASA and all its suppliers. This is
a great achievement for FTG and will help us maximize sales opportunities in a profitable sector.
The acquisition of California based Young Electronics will help FTG Circuits achieve more focused production facilities and
also increase our market penetration via partnerships with Young Electronics customers including Honeywell, Smiths
Industries, Harris Corporation and Boeing.
FTG Aerospace Division
FTG Aerospace manufactures illuminated cockpit panels, keyboards and bezels for original equipment manufacturers of
avionics products as well as airframe manufacturers.
2004 was a banner year for FTG Aerospace. New customer initiatives and increased manufacturing capacity spurred
substantial growth. Bookings for the year exceeded $10 million with our top five customers accounting for 46 percent of
the total. Our sales were 20 percent higher than in 2003 and we are delighted to report a profit growth of 96 percent.
These results are especially noteworthy since they were achieved in the face of the strengthening Canadian dollar and a 23
percent reduction in sales to Bombardier who has consistently been our largest customer.
Revitalization and Growth
To reinforce our market position, we signed a new long-term agreement with Honeywell and made a commitment to
diversify our customer base. Since we believe production capacity can limit sales, we are increasing our staff complement
and also implementing new and more efficient production initiatives.
FTG Aerospace has a clear-cut plan for growth: We will increase our customer base by showcasing existing successes; expand
our current product offering to include the assembly of sub-systems, invest in an increased manufacturing capacity and train
our people to deliver enhanced products and services to our customers. With this plan, and a firm foundation upon which
to build, FTG Aerospace is solidly positioned for growth in 2005 and beyond.

Firan Technology Group 2004 Annual Report 9

MANAGEMENT’S DISCUSSION and ANALYSIS
10 Firan Technology Group 2004 Annual Report
This report is management’s analysis of Firan Technology Group Corporation’s (the “Company” and “FTG”) financial results
for the years ended November 30, 2004 and 2003 and its outlook for the future. It should be read in conjunction with the
Financial Statements and Accompanying Notes.
This document may contain forward-looking statements that reflect the current views and/or expectations of the Company
with respect to its performance, business and future events. Such statements are subject to a number of risks, uncertainties
and assumptions. Actual results and events may vary significantly from such statements.
OVERVIEW
FTG is an aerospace and defence electronics product and subsystem supplier within the North American marketplace. FTG
has two operating units, FTG Circuits and FTG Aerospace.
FTG Circuits is a leading manufacturer of high technology/high reliability printed circuit boards within the North
American marketplace. Our customers are technological and market leaders in the aviation, defence, medical,
telecommunications, test and instrumentation industries.
FTG Aerospace manufactures illuminated cockpit panels, keyboards and bezels for original equipment manufacturers of
avionics products as well as airframe manufacturers.
On July 30, 2003, Circuit World Corporation (“CWC”) completed the acquisition of Firan Technology Group Inc. (“FTGI”),
a wholly owned subsidiary of Glendale International Corp. (“Glendale”). Under the terms of the agreement, CWC issued
8,541,987 common shares to Glendale, representing 49% of the outstanding voting shares of the Company.
The transaction was accounted for as a reverse takeover of CWC by FTGI. Legally, CWC is regarded as the parent company.
However in accordance with Canadian generally accepted accounting principles, since the former shareholders of FTGI have
effective control of CWC after the acquisition, FTGI is treated as the acquirer and CWC is treated as the acquired company.
On May 10, 2004, by way of amendment to the articles of incorporation, the Company changed its name from Circuit
World Corporation to Firan Technology Group Corporation (“FTG”).
RESULTS OF OPERATIONS
Sales
Sales for 2004 were $46,644,000 an increase of 42% as compared with sales of $32,807,000 in 2003. The increase in sales is
primarily attributable to the merger between FTGI and CWC in 2003. In fiscal 2003, the two companies were merged for a
period of three months as compared to 2004 when the two companies were merged for the entire year.
The Circuits division generated $37,659,000 in sales in 2004, which was 49% higher than 2003. While sales increased year
over year, primarily as a result of the merger, they were below expectations. One of the major contributors to the plan not
being achieved was the challenging first quarter, which was a direct result of closing the former FTGI Circuit production
facility and the impact of a 6-week delay in the integration.
In addition, overall financial performance was affected by the continual decline in the value of the US currency in terms
of the Canadian dollar. When comparing the average exchange rates for 2003 and 2004, the strengthened Canadian dollar
reduced the value of US dollar based sales at the Circuits division by approximately $3,000,000 in 2004. Sales to the US
accounted for 93% of the Circuits division’s total sales.
Sales from the Aerospace division were $8,985,000 for fiscal 2004, which is a 20% increase over fiscal 2003. The Aerospace
division performed extremely well in 2004 as a result of new customer program wins and increased manufacturing capacity.
The Aerospace division was less affected by the weakening of the US dollar as 60% of the division’s sales were denominated
in US dollars.
Sales to the Company’s top 10 customers accounted for 64% of overall sales in fiscal 2004. This compares to 62% of
overall sales in 2003. The Company’s two largest customers accounted for 20% and 16% of sales respectively in fiscal 2004.
The next largest customer accounted for 5% of sales in 2004.
Export sales to the United States represented 87% of overall sales as compared to 82% in 2003.
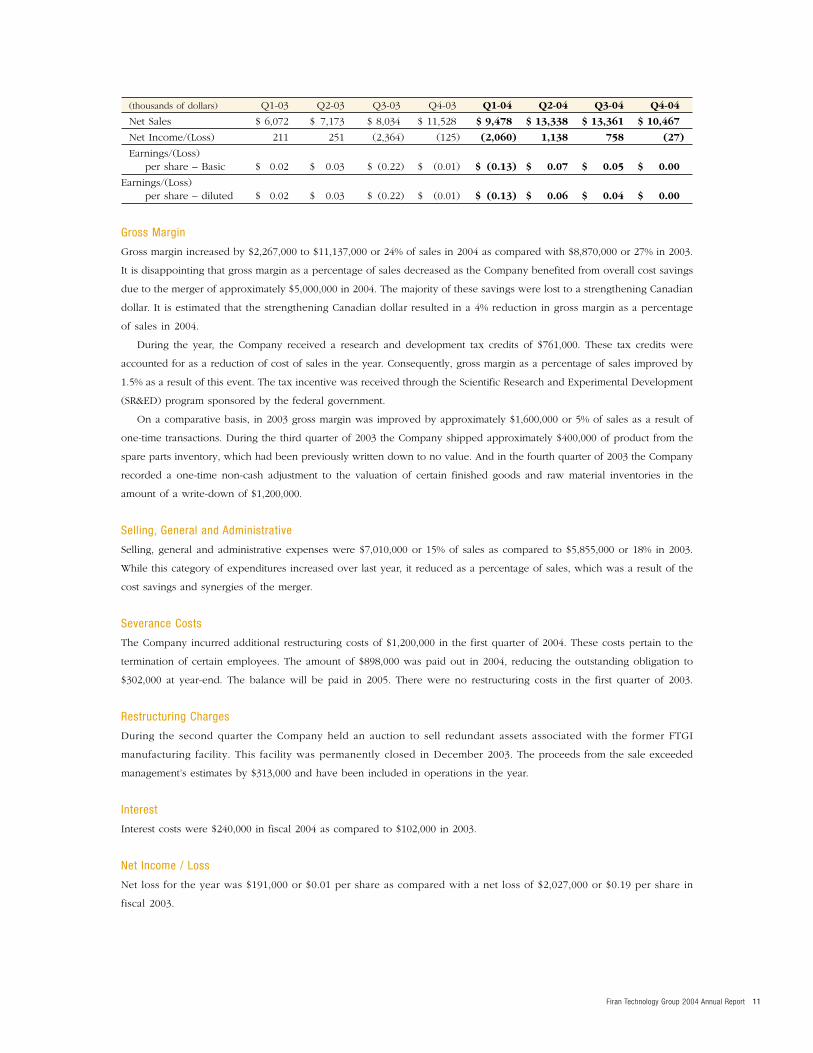
Below is a table outlining historical quarterly performance.
MANAGEMENT’S RESPONSIBILTY for FINANCIAL STATEMENTS
Firan Technology Group 2004 Annual Report 11
(thousands of dollars) Q1-03 Q2-03 Q3-03 Q4-03 Q1-04 Q2-04 Q3-04 Q4-04
Net Sales $ 6,072 $ 7,173 $ 8,034 $ 11,528 $ 9,478 $ 13,338 $ 13,361 $ 10,467
Net Income/(Loss) 211 251 (2,364) (125) (2,060) 1,138 758 (27)
Earnings/(Loss) per share – Basic $ 0.02 $ 0.03 $ (0.22) $ (0.01) $ (0.13) $ 0.07 $ 0.05 $ 0.00
Earnings/(Loss)per share – diluted $ 0.02 $ 0.03 $ (0.22) $ (0.01) $ (0.13) $ 0.06 $ 0.04 $ 0.00
Gross Margin
Gross margin increased by $2,267,000 to $11,137,000 or 24% of sales in 2004 as compared with $8,870,000 or 27% in 2003.
It is disappointing that gross margin as a percentage of sales decreased as the Company benefited from overall cost savings
due to the merger of approximately $5,000,000 in 2004. The majority of these savings were lost to a strengthening Canadian
dollar. It is estimated that the strengthening Canadian dollar resulted in a 4% reduction in gross margin as a percentage
of sales in 2004.
During the year, the Company received a research and development tax credits of $761,000. These tax credits were
accounted for as a reduction of cost of sales in the year. Consequently, gross margin as a percentage of sales improved by
1.5% as a result of this event. The tax incentive was received through the Scientific Research and Experimental Development
(SR&ED) program sponsored by the federal government.
On a comparative basis, in 2003 gross margin was improved by approximately $1,600,000 or 5% of sales as a result of
one-time transactions. During the third quarter of 2003 the Company shipped approximately $400,000 of product from the
spare parts inventory, which had been previously written down to no value. And in the fourth quarter of 2003 the Company
recorded a one-time non-cash adjustment to the valuation of certain finished goods and raw material inventories in the
amount of a write-down of $1,200,000.
Selling, General and Administrative
Selling, general and administrative expenses were $7,010,000 or 15% of sales as compared to $5,855,000 or 18% in 2003.
While this category of expenditures increased over last year, it reduced as a percentage of sales, which was a result of the
cost savings and synergies of the merger.
Severance Costs
The Company incurred additional restructuring costs of $1,200,000 in the first quarter of 2004. These costs pertain to the
termination of certain employees. The amount of $898,000 was paid out in 2004, reducing the outstanding obligation to
$302,000 at year-end. The balance will be paid in 2005. There were no restructuring costs in the first quarter of 2003.
Restructuring Charges
During the second quarter the Company held an auction to sell redundant assets associated with the former FTGI
manufacturing facility. This facility was permanently closed in December 2003. The proceeds from the sale exceeded
management’s estimates by $313,000 and have been included in operations in the year.
Interest
Interest costs were $240,000 in fiscal 2004 as compared to $102,000 in 2003.
Net Income / Loss
Net loss for the year was $191,000 or $0.01 per share as compared with a net loss of $2,027,000 or $0.19 per share in
fiscal 2003.
12 Firan Technology Group 2004 Annual Report
AUDITORS’ REPORT
Goodwill
On July 30, 2003 the Company recognized $896,000 of Goodwill as a result of the merger between CCW and FTGI. The
Goodwill figure was calculated based on the purchase price, the estimated fair value of assets at the time of the transaction
and certain assumptions relating to costs to complete, restructure and integrate the businesses. The Company underestimated
acquisition day liabilities by $143,000 and consequently adjusted the Goodwill upward by that amount in 2004.
CAPITAL EXPENDITURES
The Company invested $1,100,000 in plant and equipment during fiscal 2004, a slight decrease from $1,439,000 in 2003. One
of the primary benefits of the merger was reduced capital spending. The expenditures related primarily to upgrades to
machinery and leasehold to improve integration of the two merged businesses.
LIQUIDITY
As at November 30, 2004, the Company had $2,870,000 in cash as compared to $39,000 on the same date in 2003.
On July 19, 2004, the Company entered into a new banking agreement with the Royal Bank of Canada. The $11,250,000
credit facility is made up of both operating and term facilities. The term facilities are made up of a $1,500,000 loan due
and payable on the earlier of the repayment of the $1,500,000 promissory note owed to FTG by the Company’s controlling
shareholder or July 30, 2005. In addition, the Company entered into a sale lease back for certain manufacturing equipment.
The US$3,009,000 lease has a term of two years with a five-year loan amortization. All current and future borrowings are
secured by a first charge on all assets of the Company. The proceeds of the term loans were used to pay down the existing
term loan to the Company’s lenders with the balance used for working capital purposes.
Accounts receivable at the year-end decreased 8% to $6,867,000 from $7,470,000 in 2003. The decrease in receivables
reflects the slight decrease in shipment in the fourth quarter of 2004 as compared to last year.
In 2004, inventory decreased $461,000 from the prior year resulting in an ending balance of $4,363,000. The decrease
was a result of lower sales and improved inventory management.
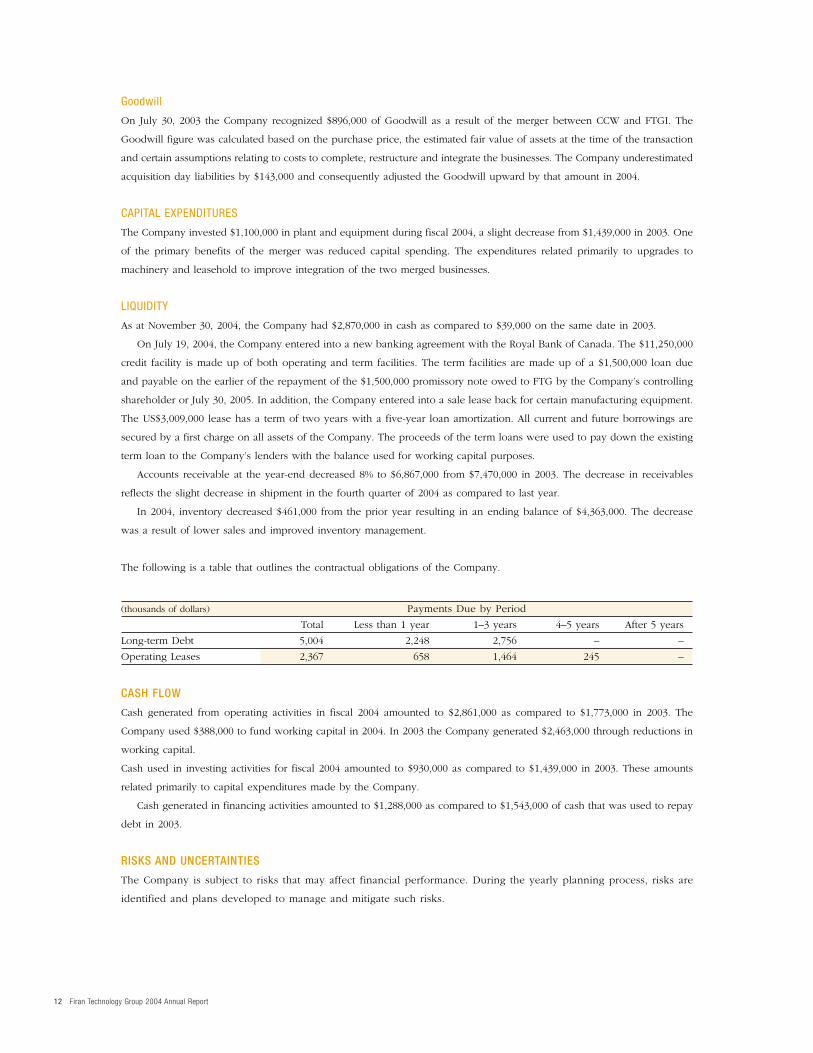
The following is a table that outlines the contractual obligations of the Company.
(thousands of dollars) Payments Due by Period
Total Less than 1 year 1–3 years 4–5 years After 5 years
Long-term Debt 5,004 2,248 2,756 – –
Operating Leases 2,367 658 1,464 245 –
CASH FLOW
Cash generated from operating activities in fiscal 2004 amounted to $2,861,000 as compared to $1,773,000 in 2003. The
Company used $388,000 to fund working capital in 2004. In 2003 the Company generated $2,463,000 through reductions in
working capital.
Cash used in investing activities for fiscal 2004 amounted to $930,000 as compared to $1,439,000 in 2003. These amounts
related primarily to capital expenditures made by the Company.
Cash generated in financing activities amounted to $1,288,000 as compared to $1,543,000 of cash that was used to repay
debt in 2003.
RISKS AND UNCERTAINTIES
The Company is subject to risks that may affect financial performance. During the yearly planning process, risks are
identified and plans developed to manage and mitigate such risks.
MANAGEMENT’S RESPONSIBILTY for FINANCIAL STATEMENTS
Firan Technology Group 2004 Annual Report 13
Reliance on key customers is a risk facing the Company. The Company’s two largest customers account for 20% and
16% of sales respectively. The Company has been doing business with these customers for over 20 years and has supply
agreements with both.
The Company is exposed to foreign exchange fluctuations as the majority of the sales is earned in U.S. dollars. Operating
expenses are incurred mainly in Canadian dollars. However, the Company’s long-term debt and most of the manufacturing
materials are sourced in U.S. dollars, providing a natural economic hedge for some of our currency exposure. The Company
regularly enters into forward exchange contracts to sell excess U.S. dollars generated from operations.
The current and future success of the Company is predicated on attracting and maintaining key employees. Being a
clear leader in technology, and offering incentives such as the Share Option Plan allows us to be competitive in attracting
key personnel.
OUTLOOK
FTG Aerospace is poised for another year of growth as a result of the gains made in 2004. To achieve this growth,
Aerospace needs to increase its manufacturing capacity, attract qualified personnel and enhance its manufacturing system.
The printed circuit board industry remains a highly competitive industry. While 2004 was the best year the industry
experienced in many years; it appears the market has softened during the latter part of the year. Most of the current
industry data points towards a flat 2005 for the North American printed circuit board industry. This will only intensify
competition and reduce opportunities for industry participants to increase pricing to its end customers. This comes in an
environment where the industry has received price increases from its suppliers due to rising commodity prices.
The keys to success will be to focus on the markets that present the best opportunity for profitable growth. These
segments include the aerospace/military markets and the high reliability/high technology commercial markets. The
Company is well positioned for future growth in these markets and believes these markets represent the best opportunities
for sustainable growth that yield superior margins.
Given the industry dynamics, consolidation will continue within the industry. The viable economic size of a printed
circuit board company continues to increase. The Company participated in this consolidation trend by purchasing a printed
circuit board facility in 2004. On December 10, 2004 the Company acquired Young Electronics, a U.S. printed circuit board
manufacturer based in Los Angeles, California and focused primarily on the aerospace, defense and oil field industries. Young
Electronics had annual sales of approximately US$10,000,000 in fiscal 2004 and was profitable. The Company financed the
cash purchase price of US$5,000,000 through a combination of a private placement of units of the Company consisting of
common shares and warrants, and secured bank debt.
The purchase of Young Electronics has significant strategic benefit to the Company. The acquisition reinforces the
Company’s market focus in aerospace and defense applications. Young’s California location places it in the center of one of
the largest concentrations of aerospace and defense industries in the U.S. For the Company, a U.S. operation is expected to
reduce some of the barriers U.S. defense firms have in contracting outside the country and will also help the Company to
move towards more focused production facilities.
March 3, 2005
14 Firan Technology Group 2004 Annual Report
MANAGEMENT’S RESPONSIBILTY for FINANCIAL STATEMENTS
The information in this annual report is the responsibility of management. The financial statements have been prepared by
management in accordance with Canadian Generally Accepted Accounting Principles and in accordance with the accounting
policies set out in note 1 to the financial statements. The preparation of financial statements requires management to make
estimates and assumptions that affect the reported amounts of assets and liabilities at the date of the financial statements and
the reported amounts of revenues and expenses during the year. Management believes that reasonable care and judgment
is applied in making such estimates and assumptions.
Management maintains a system of internal accounting controls to provide reasonable assurance that assets are safeguarded
and that transactions are authorized, recorded and reported properly. Management reviews these accounting controls on an
ongoing basis and reports its findings and recommendations to the Audit Committee of the Board of Directors.
The Board of Directors carries out its responsibility for the financial statements principally through its Audit Committee,
consisting of 3 members, who are outside directors. This committee reviews the financial statements with management prior
to submission to the Board for approval.
The Company’s external auditors, Deloitte & Touche LLP, have audited the financial statements and their opinion on these
statements is set out below.
Bradley C. Bourne John Bartkiw
President and Chief Executive Officer Chief Financial Officer
January 11, 2005 January 11, 2005
AUDITORS’ REPORT
To the Shareholders of Firan Technology Group Corporation
We have audited the balance sheets of Firan Technology Group Corporation as at November 30, 2004 and 2003 and the
statements of operations and deficit and of cash flows for the years then ended. These financial statements are the
responsibility of the Company’s management. Our responsibility is to express an opinion on these financial statements
based on our audits.
We conducted our audits in accordance with Canadian generally accepted auditing standards. Those standards require
that we plan and perform an audit to obtain reasonable assurance whether the financial statements are free of material
misstatement. An audit includes examining, on a test basis, evidence supporting the amounts and disclosures in the
financial statements. An audit also includes assessing the accounting principles used and significant estimates made by
management, as well as evaluating the overall financial statement presentation.
In our opinion, these financial statements present fairly, in all material respects, the financial position of the Company
as at November 30, 2004 and 2003 and the results of its operations and its cash flows for the years then ended in
accordance with Canadian generally accepted accounting principles.
Chartered Accountants
Toronto, Ontario
January 11, 2005

Firan Technology Group 2004 Annual Report 15
BALANCE SHEETS
November 30, 2004 and 2003 (thousands of dollars) 2004 2003
ASSETSCURRENT
Cash $ 2,870 $ 39
Accounts receivable 6,867 7,470
Inventories (Note 3) 4,363 4,824
Promissory note (Note 13) 1,500 – Prepaid expenses 396 275
15,996 12,608
PLANT AND EQUIPMENT (Note 4) 9,923 12,242
FUTURE INCOME TAXES (Note 8) 3,684 3,515
PROMISSORY NOTE (Note 13) – 1,500
GOODWILL (Note 2) 1,039 896 OTHER ASSETS 177 70
$ 30,819 $ 30,831
LIABILITIES
CURRENT
Accounts payable and accrued liabilities $ 7,059 $ 7,135
Accrued restructuring and severance costs (Note 6) 663 1,710
Current portion of long-term debt (Note 5) 2,248 1,473 Income taxes payable – 208
9,970 10,526
LONG-TERM DEBT (Note 5) 2,756 2,066
12,726 12,592
COMMITMENTS (Note 11)
SHAREHOLDERS’ EQUITY
SHARE CAPITAL – COMMON SHARES (Note 7 (b)) 10,347 10,347
SHARE CAPITAL – PREFERRED SHARES (Note 7(c)) 2,218 2,218
CONTRIBUTED SURPLUS (Note 7(f)) 6,798 6,753
DEFICIT (1,270) (1,079)
18,093 18,239
$ 30,819 $ 30,831
Approved by the Board
Director Director
STATEMENTS of OPERATIONS and DEFICIT
16 Firan Technology Group 2004 Annual Report
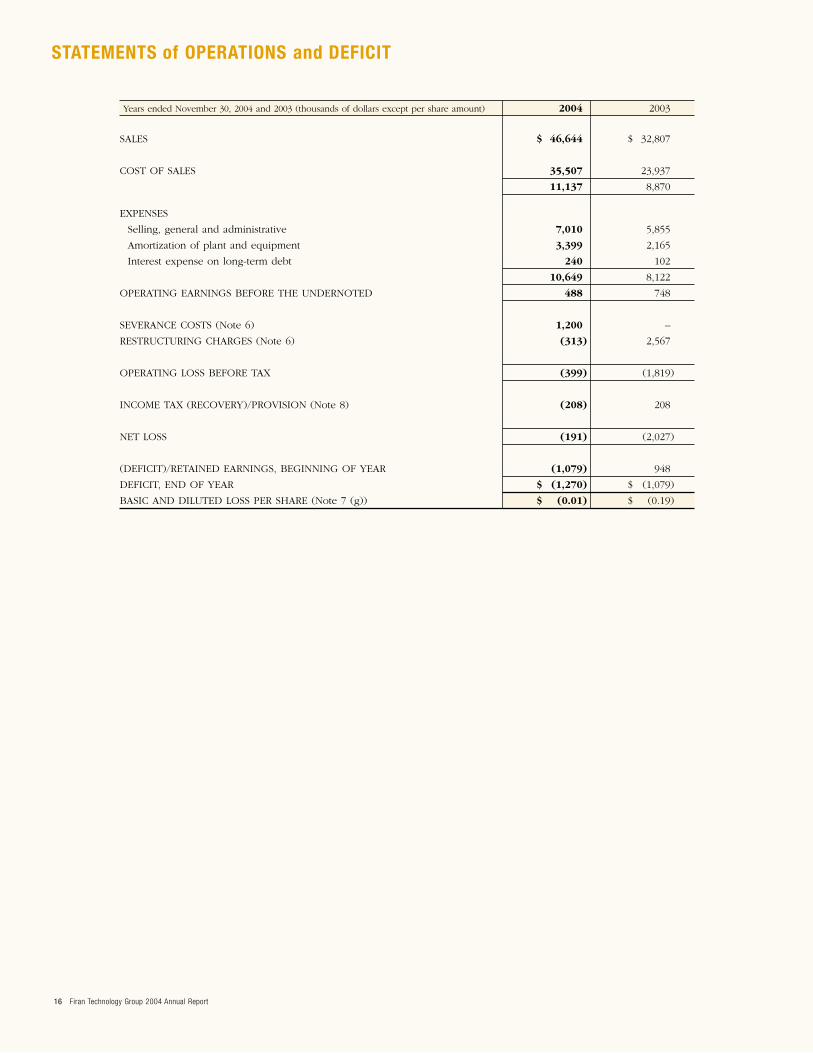
Years ended November 30, 2004 and 2003 (thousands of dollars except per share amount) 2004 2003
SALES $ 46,644 $ 32,807
COST OF SALES 35,507 23,937
11,137 8,870
EXPENSES
Selling, general and administrative 7,010 5,855
Amortization of plant and equipment 3,399 2,165
Interest expense on long-term debt 240 102
10,649 8,122
OPERATING EARNINGS BEFORE THE UNDERNOTED 488 748
SEVERANCE COSTS (Note 6) 1,200 –
RESTRUCTURING CHARGES (Note 6) (313) 2,567
OPERATING LOSS BEFORE TAX (399) (1,819)
INCOME TAX (RECOVERY)/PROVISION (Note 8) (208) 208
NET LOSS (191) (2,027)
(DEFICIT)/RETAINED EARNINGS, BEGINNING OF YEAR (1,079) 948
DEFICIT, END OF YEAR $ (1,270) $ (1,079)
BASIC AND DILUTED LOSS PER SHARE (Note 7 (g)) $ (0.01) $ (0.19)
STATEMENTS of CASH FLOWS
Firan Technology Group 2004 Annual Report 17
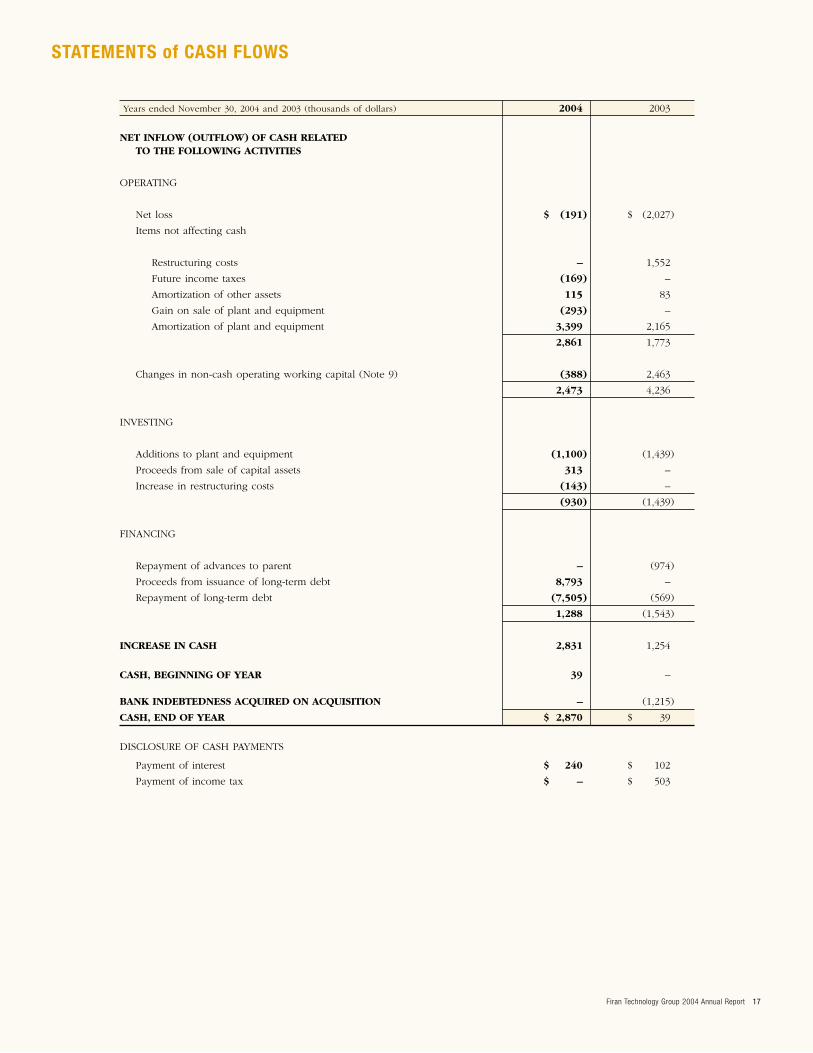
Years ended November 30, 2004 and 2003 (thousands of dollars) 2004 2003
NET INFLOW (OUTFLOW) OF CASH RELATEDTO THE FOLLOWING ACTIVITIES
OPERATING
Net loss $ (191) $ (2,027)
Items not affecting cash
Restructuring costs – 1,552
Future income taxes (169) –
Amortization of other assets 115 83
Gain on sale of plant and equipment (293) –
Amortization of plant and equipment 3,399 2,165
2,861 1,773
Changes in non-cash operating working capital (Note 9) (388) 2,463
2,473 4,236
INVESTING
Additions to plant and equipment (1,100) (1,439)
Proceeds from sale of capital assets 313 –
Increase in restructuring costs (143) –
(930) (1,439)
FINANCING
Repayment of advances to parent – (974)
Proceeds from issuance of long-term debt 8,793 –
Repayment of long-term debt (7,505) (569)
1,288 (1,543)
INCREASE IN CASH 2,831 1,254
CASH, BEGINNING OF YEAR 39 –
BANK INDEBTEDNESS ACQUIRED ON ACQUISITION – (1,215)
CASH, END OF YEAR $ 2,870 $ 39
DISCLOSURE OF CASH PAYMENTS
Payment of interest $ 240 $ 102
Payment of income tax $ – $ 503
NOTES to the FINANCIAL STATEMENTS
18 Firan Technology Group 2004 Annual Report
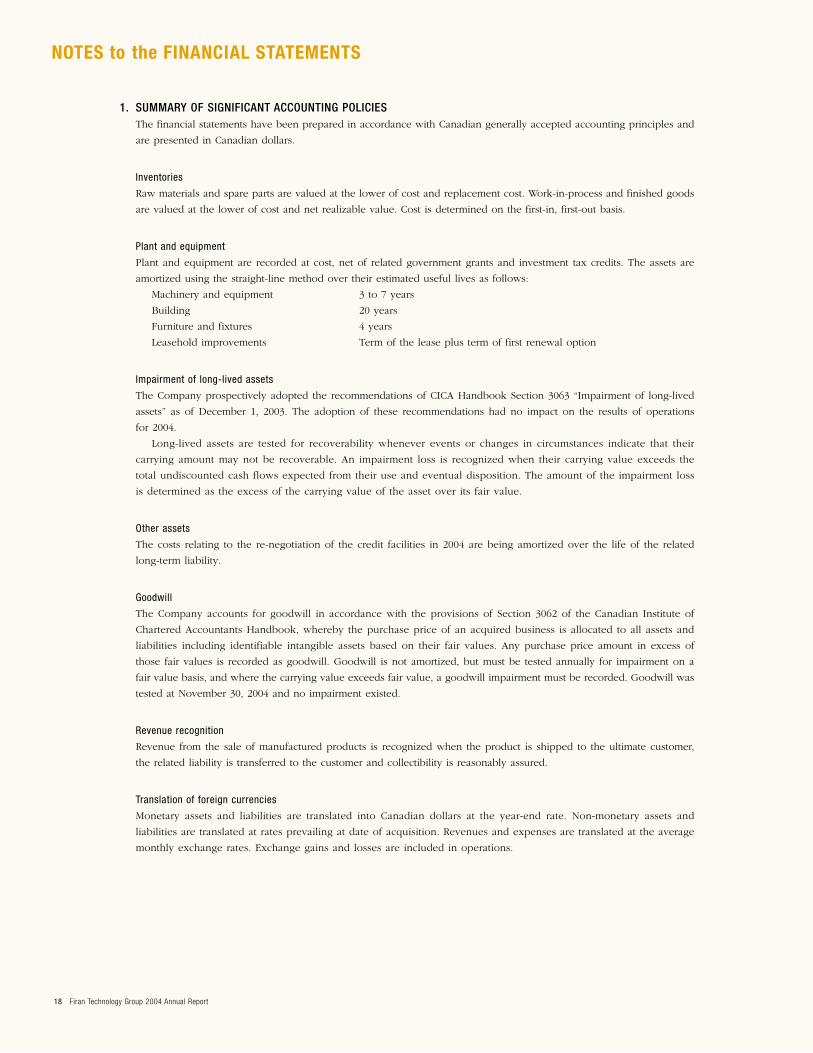
1. SUMMARY OF SIGNIFICANT ACCOUNTING POLICIESThe financial statements have been prepared in accordance with Canadian generally accepted accounting principles and
are presented in Canadian dollars.
Inventories
Raw materials and spare parts are valued at the lower of cost and replacement cost. Work-in-process and finished goods
are valued at the lower of cost and net realizable value. Cost is determined on the first-in, first-out basis.
Plant and equipment
Plant and equipment are recorded at cost, net of related government grants and investment tax credits. The assets are
amortized using the straight-line method over their estimated useful lives as follows:
Machinery and equipment 3 to 7 years
Building 20 years
Furniture and fixtures 4 years
Leasehold improvements Term of the lease plus term of first renewal option
Impairment of long-lived assets
The Company prospectively adopted the recommendations of CICA Handbook Section 3063 “Impairment of long-lived
assets” as of December 1, 2003. The adoption of these recommendations had no impact on the results of operations
for 2004.
Long-lived assets are tested for recoverability whenever events or changes in circumstances indicate that their
carrying amount may not be recoverable. An impairment loss is recognized when their carrying value exceeds the
total undiscounted cash flows expected from their use and eventual disposition. The amount of the impairment loss
is determined as the excess of the carrying value of the asset over its fair value.
Other assets
The costs relating to the re-negotiation of the credit facilities in 2004 are being amortized over the life of the related
long-term liability.
Goodwill
The Company accounts for goodwill in accordance with the provisions of Section 3062 of the Canadian Institute of
Chartered Accountants Handbook, whereby the purchase price of an acquired business is allocated to all assets and
liabilities including identifiable intangible assets based on their fair values. Any purchase price amount in excess of
those fair values is recorded as goodwill. Goodwill is not amortized, but must be tested annually for impairment on a
fair value basis, and where the carrying value exceeds fair value, a goodwill impairment must be recorded. Goodwill was
tested at November 30, 2004 and no impairment existed.
Revenue recognition
Revenue from the sale of manufactured products is recognized when the product is shipped to the ultimate customer,
the related liability is transferred to the customer and collectibility is reasonably assured.
Translation of foreign currencies
Monetary assets and liabilities are translated into Canadian dollars at the year-end rate. Non-monetary assets and
liabilities are translated at rates prevailing at date of acquisition. Revenues and expenses are translated at the average
monthly exchange rates. Exchange gains and losses are included in operations.
Firan Technology Group 2004 Annual Report 19
1. SUMMARY OF SIGNIFICANT ACCOUNTING POLICIES (continued)
Measurement uncertainty
The preparation of the Company’s financial statements, in accordance with Canadian generally accepted accounting
principles, requires management to make estimates and assumptions that affect the reported amount of assets and
liabilities such as allowances for bad debts, inventory obsolescence and warranty provisions, and disclosures of
contingent assets and liabilities at the date of the financial statements and the reported amounts of revenues and
expenses during the reporting year. Due to the inherent uncertainty involved in making such estimates, actual results
reported in future periods could differ from those estimates.
Income taxes
The Company uses the liability method of accounting for income taxes. Under the liability method, future income tax
assets and liabilities are determined based on the differences between the financial reporting and tax bases of assets and
liabilities, and are measured using the substantively enacted tax rates and laws that are expected to be in effect in the
periods in which the future income tax assets or liabilities are expected to be settled or realized.
Research and development
Research costs are expensed as incurred. Development costs are expensed as incurred unless they meet the specific
criteria for capitalization.
Stock-based compensation plans
At November 30, 2004 the Company has a stock-based compensation plan for certain employees, officers and directors.
No compensation expense is recognized for these plans when stock or stock options are issued. Any consideration paid
on exercise of stock options or purchase of stock is credited to share capital.
Hedging Relationships
The Company has adopted CICA Accounting Guideline 13 “Hedging Relationships” effective December 1, 2003.
The guideline provides guidance related to the accounting for hedging activities and contains specific criteria for the
application of hedge accounting.
The Corporation’s derivative financial instruments do not qualify for hedge accounting; accordingly they have been
accounted for using the fair value method. Any resulting gain or loss on the recording of derivative financial instruments
at fair value is included in the statement of operations in the financial statements.
Guarantees
In the 2003 fiscal year, the Canadian Institute of Chartered Accountants (“CICA”) issued Accounting Guideline 14, –
disclosure of guarantees – (“AcG-14”), which addresses the disclosure to be made by a guarantor in its interim and
annual financial statements about its obligations under guarantees.
AcG-14 requires the guarantor to disclose the nature of the guarantees, the maximum potential amount of future
payments and the current carrying amount of the liability for the non-contingent component of the guarantee, which is
the obligation to stand ready to perform in the event that specified triggering events or conditions occur. The disclosure
is required even if is not probable that payments will be required under the guarantee or if the guarantee was issued
with a premium payment or as part of a transaction with multiple elements.
The Company has adopted the disclosure requirements of AcG-14 and determined that there were no guarantees in
their current contracts.
NOTES TO THE FINANCIAL STATEMENTS
20 Firan Technology Group 2004 Annual Report
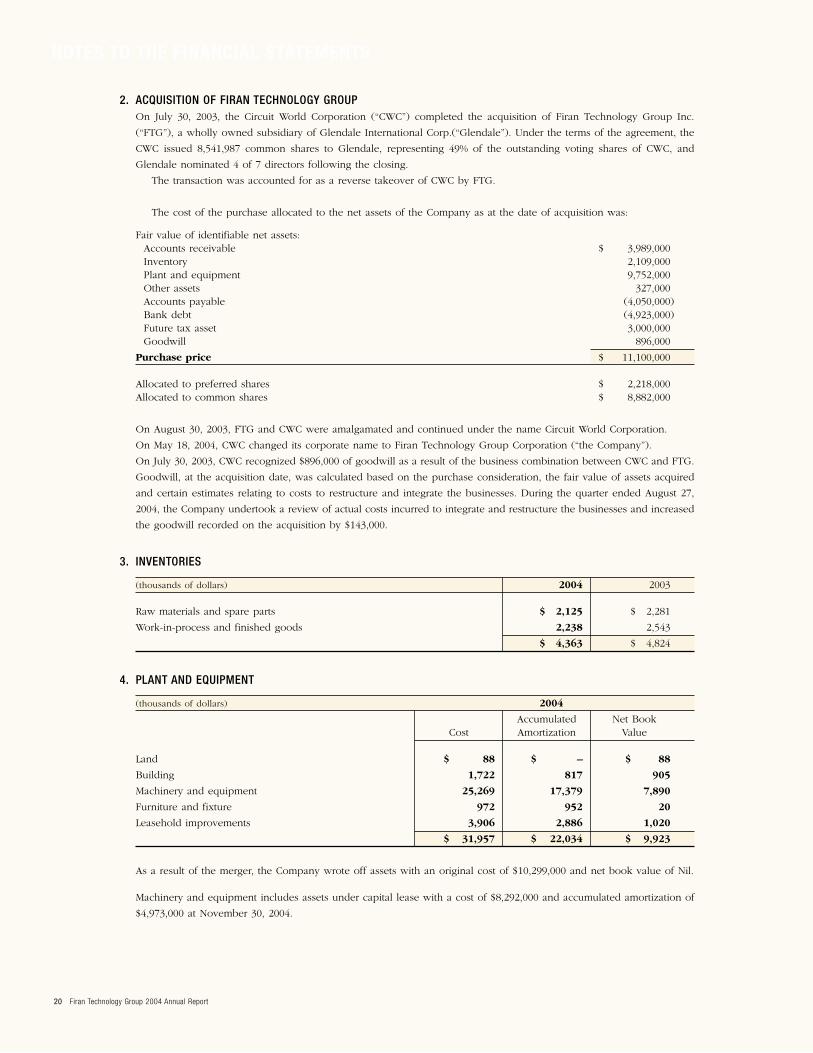
2. ACQUISITION OF FIRAN TECHNOLOGY GROUPOn July 30, 2003, the Circuit World Corporation (“CWC”) completed the acquisition of Firan Technology Group Inc.
(“FTG”), a wholly owned subsidiary of Glendale International Corp.(“Glendale”). Under the terms of the agreement, the
CWC issued 8,541,987 common shares to Glendale, representing 49% of the outstanding voting shares of CWC, and
Glendale nominated 4 of 7 directors following the closing.
The transaction was accounted for as a reverse takeover of CWC by FTG.
The cost of the purchase allocated to the net assets of the Company as at the date of acquisition was:
Fair value of identifiable net assets:Accounts receivable $ 3,989,000Inventory 2,109,000Plant and equipment 9,752,000Other assets 327,000Accounts payable (4,050,000)Bank debt (4,923,000)Future tax asset 3,000,000Goodwill 896,000
Purchase price $ 11,100,000
Allocated to preferred shares $ 2,218,000Allocated to common shares $ 8,882,000
On August 30, 2003, FTG and CWC were amalgamated and continued under the name Circuit World Corporation.
On May 18, 2004, CWC changed its corporate name to Firan Technology Group Corporation (“the Company”).
On July 30, 2003, CWC recognized $896,000 of goodwill as a result of the business combination between CWC and FTG.
Goodwill, at the acquisition date, was calculated based on the purchase consideration, the fair value of assets acquired
and certain estimates relating to costs to restructure and integrate the businesses. During the quarter ended August 27,
2004, the Company undertook a review of actual costs incurred to integrate and restructure the businesses and increased
the goodwill recorded on the acquisition by $143,000.
3. INVENTORIES
(thousands of dollars) 2004 2003
Raw materials and spare parts $ 2,125 $ 2,281
Work-in-process and finished goods 2,238 2,543
$ 4,363 $ 4,824
4. PLANT AND EQUIPMENT
(thousands of dollars) 2004
Accumulated Net BookCost Amortization Value
Land $ 88 $ – $ 88
Building 1,722 817 905
Machinery and equipment 25,269 17,379 7,890
Furniture and fixture 972 952 20
Leasehold improvements 3,906 2,886 1,020
$ 31,957 $ 22,034 $ 9,923
As a result of the merger, the Company wrote off assets with an original cost of $10,299,000 and net book value of Nil.
Machinery and equipment includes assets under capital lease with a cost of $8,292,000 and accumulated amortization of
$4,973,000 at November 30, 2004.

Firan Technology Group 2004 Annual Report 21
4. PLANT AND EQUIPMENT (continued)
(thousands of dollars) 2003
Accumulated Net BookCost Amortization Value
Land $ 88 $ – $ 88
Building 1,722 731 991
Machinery and equipment 39,416 29,267 10,149
Furniture and fixtures 956 937 19
Leasehold improvements 3,694 2,699 995
$ 45,876 $ 33,634 $ 12,242
5. LONG-TERM DEBT
(thousands of dollars) 2004 2003
Promissory notes, unsecured and interest free, repayable at $100,000 annually on the 26th of January $ 200 $ 300
Term loan secured by a first charge on certain property, withinterest at bank base rate plus 0.25%, repayable in monthly principal payments of $41,000 to January 2007, repaid in July 2004 – 1,845
Term loan secured by a first charge on certain property, with interest at bank prime plus 2.25%, repayable in monthly principal payments – 149 of $7,848 to June 2005, repaid in July 2004
Term loan secured by a first charge on certain property, with interest at U.S. bank prime plus 2.25%, repayable in monthly payments of U.S. $50,430 to June 2005, repaid in July 2004 – 1,245
Term loan secured by a first charge on certain property, with interest at bank prime plus 2.00%, payable in monthly payments of interest onlyof $7,200, principal due July 30, 2005 1,500 –
Capital lease in U.S. dollars for certain manufacturing equipment, with interest at 6.0%, payable in monthly interest and principal payments of U.S. $58,712 to July 19, 2006. 3,304 –
5,004 3,539 Less amounts due within one year 2,248 1,473
$ 2,756 $ 2,066
In addition to the bank term loans above (subject to a maximum borrowing limit of the lesser of $5,750,000 and a
portion of accounts receivable and inventory), the Company has available an authorized line of credit of $5,000,000
at a rate of prime plus 0.5%, renewable in November 2005, of which $5,000,000 remained unused at year-end. The
line of credit is secured by a first charge on certain property.
Under the terms of the bank agreement, the Company must satisfy certain restrictive covenants as to minimum
financial ratios.
Principal payments required on long-term debt in each of the next two years are as follows:
(thousands of dollars)
2005 $ 2,248
2006 2,756
$ 5,004
NOTES TO THE FINANCIAL STATEMENTS
22 Firan Technology Group 2004 Annual Report
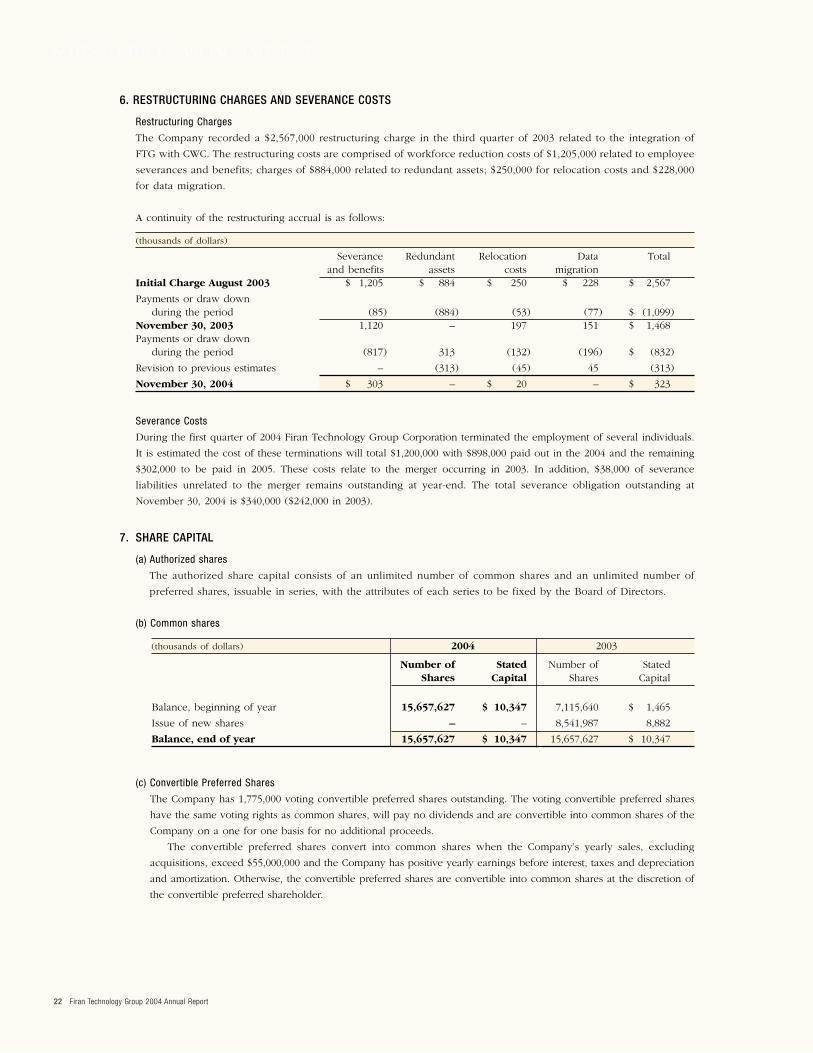
6. RESTRUCTURING CHARGES AND SEVERANCE COSTS
Restructuring Charges
The Company recorded a $2,567,000 restructuring charge in the third quarter of 2003 related to the integration of
FTG with CWC. The restructuring costs are comprised of workforce reduction costs of $1,205,000 related to employee
severances and benefits; charges of $884,000 related to redundant assets; $250,000 for relocation costs and $228,000
for data migration.
A continuity of the restructuring accrual is as follows:
(thousands of dollars)
Severance Redundant Relocation Data Totaland benefits assets costs migration
Initial Charge August 2003 $ 1,205 $ 884 $ 250 $ 228 $ 2,567
Payments or draw down during the period (85) (884) (53) (77) $ (1,099)
November 30, 2003 1,120 – 197 151 $ 1,468 Payments or draw down
during the period (817) 313 (132) (196) $ (832)
Revision to previous estimates – (313) (45) 45 (313)
November 30, 2004 $ 303 – $ 20 – $ 323
Severance Costs
During the first quarter of 2004 Firan Technology Group Corporation terminated the employment of several individuals.
It is estimated the cost of these terminations will total $1,200,000 with $898,000 paid out in the 2004 and the remaining
$302,000 to be paid in 2005. These costs relate to the merger occurring in 2003. In addition, $38,000 of severance
liabilities unrelated to the merger remains outstanding at year-end. The total severance obligation outstanding at
November 30, 2004 is $340,000 ($242,000 in 2003).
7. SHARE CAPITAL
(a) Authorized shares
The authorized share capital consists of an unlimited number of common shares and an unlimited number of
preferred shares, issuable in series, with the attributes of each series to be fixed by the Board of Directors.
(b) Common shares
(thousands of dollars) 2004 2003
Number of Stated Number of StatedShares Capital Shares Capital
Balance, beginning of year 15,657,627 $ 10,347 7,115,640 $ 1,465
Issue of new shares – – 8,541,987 8,882
Balance, end of year 15,657,627 $ 10,347 15,657,627 $ 10,347
(c) Convertible Preferred Shares
The Company has 1,775,000 voting convertible preferred shares outstanding. The voting convertible preferred shares
have the same voting rights as common shares, will pay no dividends and are convertible into common shares of the
Company on a one for one basis for no additional proceeds.
The convertible preferred shares convert into common shares when the Company’s yearly sales, excluding
acquisitions, exceed $55,000,000 and the Company has positive yearly earnings before interest, taxes and depreciation
and amortization. Otherwise, the convertible preferred shares are convertible into common shares at the discretion of
the convertible preferred shareholder.
Firan Technology Group 2004 Annual Report 23
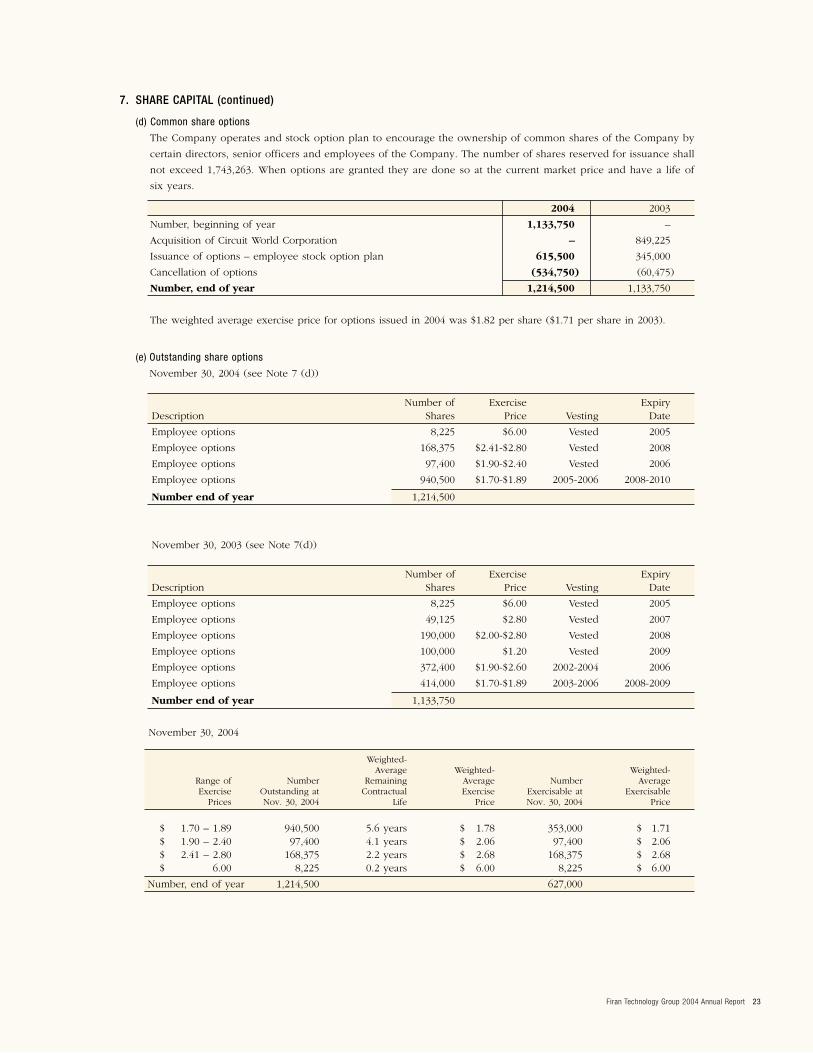
7. SHARE CAPITAL (continued)
(d) Common share options
The Company operates and stock option plan to encourage the ownership of common shares of the Company by
certain directors, senior officers and employees of the Company. The number of shares reserved for issuance shall
not exceed 1,743,263. When options are granted they are done so at the current market price and have a life of
six years.
2004 2003
Number, beginning of year 1,133,750 –
Acquisition of Circuit World Corporation – 849,225
Issuance of options – employee stock option plan 615,500 345,000
Cancellation of options (534,750) (60,475)
Number, end of year 1,214,500 1,133,750
The weighted average exercise price for options issued in 2004 was $1.82 per share ($1.71 per share in 2003).
(e) Outstanding share options
November 30, 2004 (see Note 7 (d))
Number of Exercise Expiry Description Shares Price Vesting Date
Employee options 8,225 $6.00 Vested 2005
Employee options 168,375 $2.41-$2.80 Vested 2008
Employee options 97,400 $1.90-$2.40 Vested 2006
Employee options 940,500 $1.70-$1.89 2005-2006 2008-2010
Number end of year 1,214,500
November 30, 2003 (see Note 7(d))
Number of Exercise Expiry Description Shares Price Vesting Date
Employee options 8,225 $6.00 Vested 2005
Employee options 49,125 $2.80 Vested 2007
Employee options 190,000 $2.00-$2.80 Vested 2008
Employee options 100,000 $1.20 Vested 2009
Employee options 372,400 $1.90-$2.60 2002-2004 2006
Employee options 414,000 $1.70-$1.89 2003-2006 2008-2009
Number end of year 1,133,750
November 30, 2004
Weighted-Average Weighted- Weighted-
Range of Number Remaining Average Number AverageExercise Outstanding at Contractual Exercise Exercisable at Exercisable
Prices Nov. 30, 2004 Life Price Nov. 30, 2004 Price
$ 1.70 – 1.89 940,500 5.6 years $ 1.78 353,000 $ 1.71 $ 1.90 – 2.40 97,400 4.1 years $ 2.06 97,400 $ 2.06 $ 2.41 – 2.80 168,375 2.2 years $ 2.68 168,375 $ 2.68 $ 6.00 8,225 0.2 years $ 6.00 8,225 $ 6.00
Number, end of year 1,214,500 627,000

NOTES TO THE FINANCIAL STATEMENTS
24 Firan Technology Group 2004 Annual Report
November 30, 2003
Weighted-Average Weighted- Weighted-
Range of Number Remaining Average Number AverageExercise Outstanding at Contractual Exercise Exercisable at Exercisable
Prices Nov. 30, 2003 Life Price Nov. 30, 2003 Price
$ 1.20 100,000 6.3 years $ 1.20 100,000 $ 1.20 1.70 – 1.71 414,000 5.8 years $ 1.70 43,000 $ 1.70
$ 1.90 – 2.60 184,400 5.2 years $ 2.04 184,400 $ 2.04 $ 2.61 – 3.00 427,125 3.3 years $ 2.68 340,292 $ 2.70 $ 6.00 8,225 1.2 years $ 6.00 8,225 $ 6.00
Number, end of year 1,133,750 675,917
(f) Contributed surplus
In connection with a term loan financing, the Company issued 100,000 warrants that enable the debtor to purchase
shares of the Company at $1.61 per share. The value attributed to these warrants was $45,000 and has been
recorded to contributed surplus.
(g) Earnings per share
The following table sets forth the computation of basic and diluted loss per share:
(thousands of dollars) 2004 2003
Numerator
Net loss $ (191) $ (2,027)
Numerator for basic loss per share –net loss applicable to common shares $ (191) $ (2,027)
Effect of dilutive securities:
Numerator for diluted loss per share –net loss applicable to common shares $ (191) $ (2,027)
Denominator
Denominator for basis loss per share –weighted average shares 15,657 10,959
Effect of dilutive securities:Options – –
Denominator for diluted loss per share –adjusted weighted average shares and assumed conversions 15,657 10,959
Basic and diluted loss per share $ (0.01) $ (0.19)
The Company has 1,775,000 voting convertible preferred shares outstanding. While the convertible preferred shares
have the same voting rights as common shares they are not considered in calculating basic earnings per share.
(h) Pro forma stock based compensation to employees
As permitted under Canadian generally accepted accounting principles, stock based compensation is not recorded in
the accounts of the Company under the fair value method of accounting for all employee stock based compensation.
The Company must however disclose the pro forma effect on net loss and loss per share the options would have on
the Company if accounted for under the fair value method.
The fair value of stock options used to compute pro forma net loss and net loss per share is the estimated fair
value at grant date using the Black-Scholes option-pricing model with the following weighted average assumptions:
Weighted average assumptions
Expected dividend 0.00%
Expected volatility 55%
Risk-free interest rate 5.00%
Expected option life in years 3 years
Firan Technology Group 2004 Annual Report 25
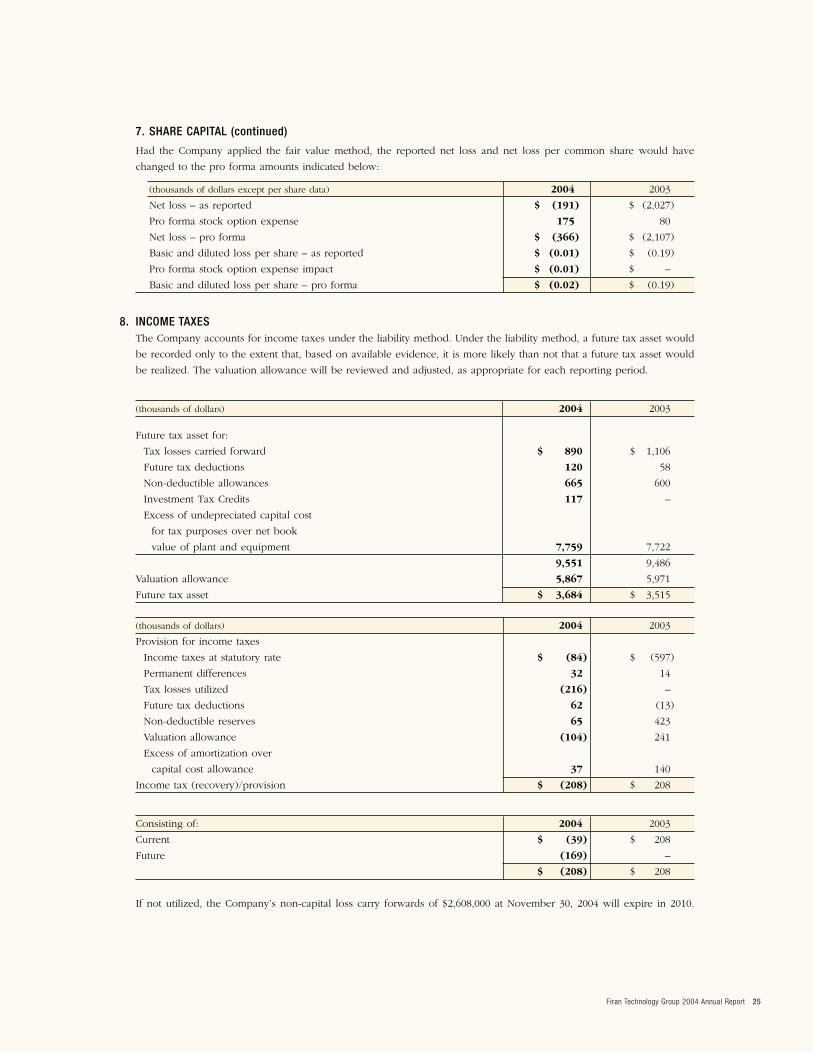
7. SHARE CAPITAL (continued)
Had the Company applied the fair value method, the reported net loss and net loss per common share would have
changed to the pro forma amounts indicated below:
(thousands of dollars except per share data) 2004 2003
Net loss – as reported $ (191) $ (2,027)
Pro forma stock option expense 175 80
Net loss – pro forma $ (366) $ (2,107)
Basic and diluted loss per share – as reported $ (0.01) $ (0.19)
Pro forma stock option expense impact $ (0.01) $ –
Basic and diluted loss per share – pro forma $ (0.02) $ (0.19)
8. INCOME TAXESThe Company accounts for income taxes under the liability method. Under the liability method, a future tax asset would
be recorded only to the extent that, based on available evidence, it is more likely than not that a future tax asset would
be realized. The valuation allowance will be reviewed and adjusted, as appropriate for each reporting period.
(thousands of dollars) 2004 2003
Future tax asset for:
Tax losses carried forward $ 890 $ 1,106
Future tax deductions 120 58
Non-deductible allowances 665 600
Investment Tax Credits 117 –
Excess of undepreciated capital cost
for tax purposes over net book
value of plant and equipment 7,759 7,722
9,551 9,486
Valuation allowance 5,867 5,971
Future tax asset $ 3,684 $ 3,515
(thousands of dollars) 2004 2003
Provision for income taxes
Income taxes at statutory rate $ (84) $ (597)
Permanent differences 32 14
Tax losses utilized (216) –
Future tax deductions 62 (13)
Non-deductible reserves 65 423
Valuation allowance (104) 241
Excess of amortization over
capital cost allowance 37 140
Income tax (recovery)/provision $ (208) $ 208
Consisting of: 2004 2003
Current $ (39) $ 208
Future (169) –
$ (208) $ 208
If not utilized, the Company’s non-capital loss carry forwards of $2,608,000 at November 30, 2004 will expire in 2010.

NOTES TO THE FINANCIAL STATEMENTS
26 Firan Technology Group 2004 Annual Report
9. CHANGES IN NON-CASH OPERATING WORKING CAPITALThe changes in non-cash operating items are comprised of the following:
(thousands of dollars) 2004 2003
Accounts receivable $ 603 $ 1,768
Inventories 461 209
Prepaid expenses (121) 24
Income taxes payable (208) 10
Accounts payable and accrued liabilities (76) (1,258)
Accrued restructuring and severance (1,047) 1,710
$ (388) $ 2,463
10. FINANCIAL INSTRUMENTSThe Company’s earnings are affected by fluctuations in interest rates and foreign exchange rates, and the degree of
volatility of these rates. The Company does not use derivative instruments to reduce its exposure to interest rate risk.
The Company enters into foreign exchange contracts with respect to its anticipated future cash flows from time to time.
Fair Value
The Company has determined that the estimated fair value of financial instruments approximated their carrying value
at November 30, 2004 and 2003, except for the non-interest bearing promissory note estimated at $1,415,000. Fair
value estimates are made at a specific point in time, using available information about the financial instrument. These
estimates are subjective in nature and often cannot be determined with precision.
Credit risk
Credit risk arises from the potential that a counterparty will fail to perform its obligations. The Company is exposed
to credit risk from customers. However, the Company has a significant number of customers, which minimizes
concentration of credit risk, and the majority of the Company’s customers are large multinational stable organizations.
The Company’s two largest customers account for 20% and 16% of sales respectively.
Foreign currency risk
Foreign currency risk arises because of fluctuations in exchange rates. The Company conducts a significant portion of
its business activities in foreign currencies, primarily United States dollars. The assets, liabilities, revenue and expenses
that are denominated in foreign currencies will be affected by changes in the exchange rate between the Canadian
dollar and these foreign currencies. The Company’s long-term debt and most of the manufacturing materials are sourced
in U.S. dollars, providing a natural economic hedge for significant portion of our currency exposure. The Company
recognized foreign exchange losses in 2004 of $186,000 as compared to $1,059,000 in 2003.
Interest rate risk
Interest rate risk arises because of the fluctuation in interest rates. Significant portions of the Company’s debt obligations
are subject to interest rates, which vary with the lending institution’s prime rates.
Firan Technology Group 2004 Annual Report 27
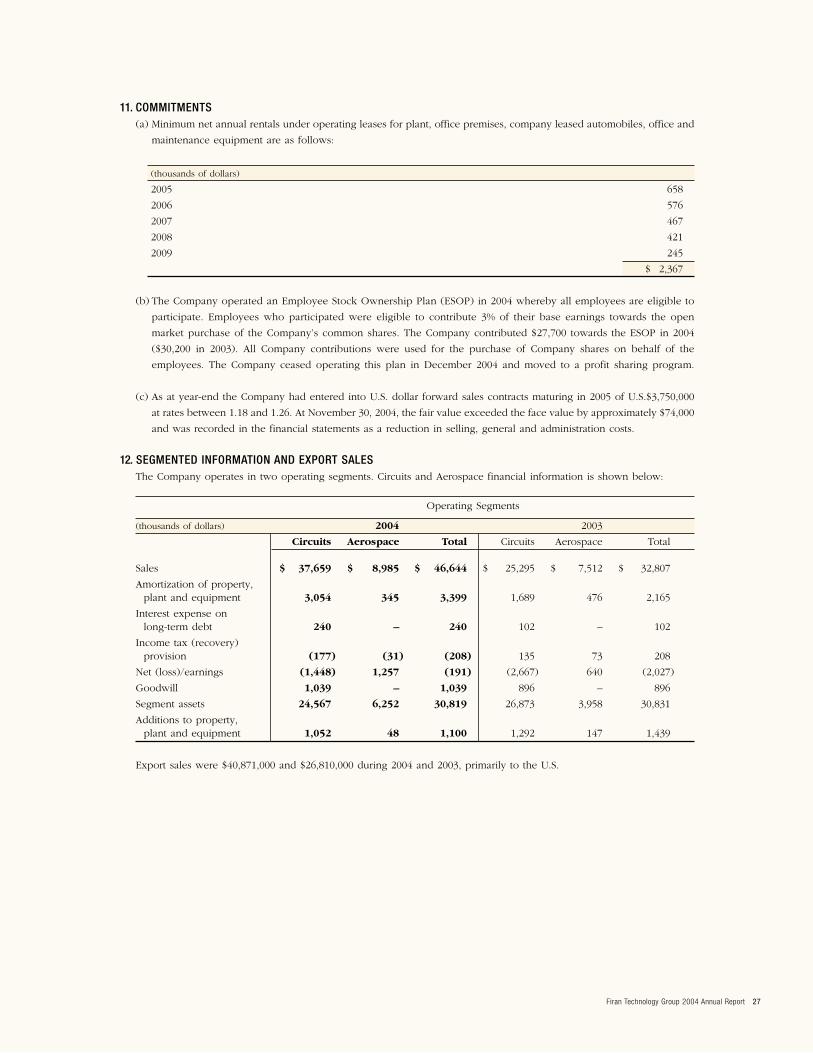
11. COMMITMENTS(a) Minimum net annual rentals under operating leases for plant, office premises, company leased automobiles, office and
maintenance equipment are as follows:
(thousands of dollars)
2005 658
2006 576
2007 467
2008 421
2009 245
$ 2,367
(b) The Company operated an Employee Stock Ownership Plan (ESOP) in 2004 whereby all employees are eligible to
participate. Employees who participated were eligible to contribute 3% of their base earnings towards the open
market purchase of the Company’s common shares. The Company contributed $27,700 towards the ESOP in 2004
($30,200 in 2003). All Company contributions were used for the purchase of Company shares on behalf of the
employees. The Company ceased operating this plan in December 2004 and moved to a profit sharing program.
(c) As at year-end the Company had entered into U.S. dollar forward sales contracts maturing in 2005 of U.S.$3,750,000
at rates between 1.18 and 1.26. At November 30, 2004, the fair value exceeded the face value by approximately $74,000
and was recorded in the financial statements as a reduction in selling, general and administration costs.
12. SEGMENTED INFORMATION AND EXPORT SALES The Company operates in two operating segments. Circuits and Aerospace financial information is shown below:
Operating Segments
(thousands of dollars) 2004 2003
Circuits Aerospace Total Circuits Aerospace Total
Sales $ 37,659 $ 8,985 $ 46,644 $ 25,295 $ 7,512 $ 32,807
Amortization of property, plant and equipment 3,054 345 3,399 1,689 476 2,165
Interest expense on long-term debt 240 – 240 102 – 102
Income tax (recovery) provision (177) (31) (208) 135 73 208
Net (loss)/earnings (1,448) 1,257 (191) (2,667) 640 (2,027)
Goodwill 1,039 – 1,039 896 – 896
Segment assets 24,567 6,252 30,819 26,873 3,958 30,831
Additions to property, plant and equipment 1,052 48 1,100 1,292 147 1,439
Export sales were $40,871,000 and $26,810,000 during 2004 and 2003, primarily to the U.S.

NOTES TO THE FINANCIAL STATEMENTS
28 Firan Technology Group 2004 Annual Report
13. RELATED PARTY TRANSACTIONS(a) The $1,500,000 promissory note is due from the Company’s controlling shareholder. The note is non-interest bearing
and matures at the earlier of July 25, 2005 or upon the divestiture, transfer or sale of certain property. The promissory
note is secured by a specific charge on this property.
Upon disposal of the property, should the controlling shareholder receive, net proceeds greater than $1,850,000, 50%
of the excess proceeds will be due and payable to the Company.
(b) The Company rented two facilities during the year from its controlling shareholder. The Company vacated one
building and continues to rent the other. The Company has accrued rental payments of $176,000 in the accounts,
which remain unpaid at November 30, 2004 and are under normal credit terms.
(c) In addition, included in accounts payable and accrued liabilities is $447,000 owing to the Company’s controlling
shareholder at November 30, 2004 and are under normal credit terms.
14. SUBSEQUENT EVENTSOn December 10, 2004, the Company acquired from Ambitech International Inc. all of the shares of SnS Enterprises Inc.
(dba Young Electronics), a U.S. printed circuit board manufacturer based in Los Angeles, California. FTG financed the
cash purchase price of US$5,000,000 by a combination of a private placement of units of FTG consisting of common
shares and warrants, and secured bank debt.
The treasury private placement offering consists of 2,142,600 units for gross proceeds of approximately C$3,000,000
(C$1.40 per unit). Each unit is comprised of one common share in the capital of FTG and one-half common share
purchase warrant. Each whole warrant entitles the holder to purchase one common share at a price of C$1.75 until
December 10, 2006. The secured bank debt consists of a US$3,000,000 term facility and a US$1,000,000 revolving
operating facility made available to SnS Enterprises on normal commercial terms and guaranteed by FTG.
The anticipated allocation of the purchase price is as follows:
Fair value of identifiable net assets:
Accounts Receivable 2,116,000
Inventory 1,973,000
Plant and equipment 440,000
Other assets 89,000
Accounts Payable (1,571,000)
Capital lease (22,000)
Goodwill 3,175,000
Purchase price $ 6,200,000

CORPORATE DIRECTORY
Printed on acid-free and chlorine-free papers using environmentally friendly ink.
Printed in Canada
Desi
gned a
nd p
roduce
d b
y:
Fra
iman
Desi
gn I
nc.
ww
w.f
raim
andesi
gn.c
om
CORPORATE HEAD OFFICEFiran Technology Group Coporation
250 Finchdene Square
Scarborough, Ontario
Canada M1X 1A5
Tel: 416-299-4000
Fax: 416-292-4308
Toll free: 1-800-258-5396
Web site: www.firantechnology.com
GENERAL COUNSELBlake Cassels & Graydon
P.O. Box 25
Commerce Court West
Toronto, Ontario M5L 1A9
TRANSFER AGENTCIBC Mellon Trust Company
320 Bay Street
P.O. Box 1
Toronto, Ontario M5H 4A6
Canada
AUDITORSDeloitte & Touche LLP
Suite 1400, BCE Place
181 Bay Street
Toronto, Ontario M5J 2V1
Canada
STOCK LISTINGThe Company’s shares are traded on the
Toronto Stock Exchange under the symbol FTG
DIRECTORSRay G. Harris
Chairman, Firan Technology Group Corporation
and Corporate Consultant
Bradley C. Bourne
President and Chief Executive Officer
Firan Technology Group Corporation
Patrick Bermingham
President
Bermingham Construction
Edward C. Hanna
Chairman, Chief Executive Officer and President
Glendale International Corp.
David McLeish
Chairman
Octagon Capital Corporation
Philip L. Szabo
Chief Financial Officer
Glendale International Corp.
OFFICERSBradley C. Bourne
President and Chief Executive Officer
Firan Technology Group Corporation
John Bartkiw
Vice-President and Chief Financial Officer
Firan Technology Group Corporation
Joseph R. Ricci
Vice-President, Finance and Administration
Firan Technology Group Corporation
ANNUAL GENERAL MEETINGAll shareholders and other interested parties are cordially invited to attend the Annual General Meeting of Shareholders on:
April 28th, 2005, 4:30 p.m. at the
TSX Broadcast & Conference Centre
The Exchange Tower
130 King Street West
Toronto, Ontario

Firan Technology Group
250 Finchdene SquareScarborough, Ontario Canada M1X 1A5Tel: 416-299-4000 Fax: 416-292-4308Toll free: 1-800-258-5396Website: www.firantechnology.com