New in Version 3 CPT Tool 3 of project and point level · CPT Tool 3 gINT Add-In ... correlations...
4
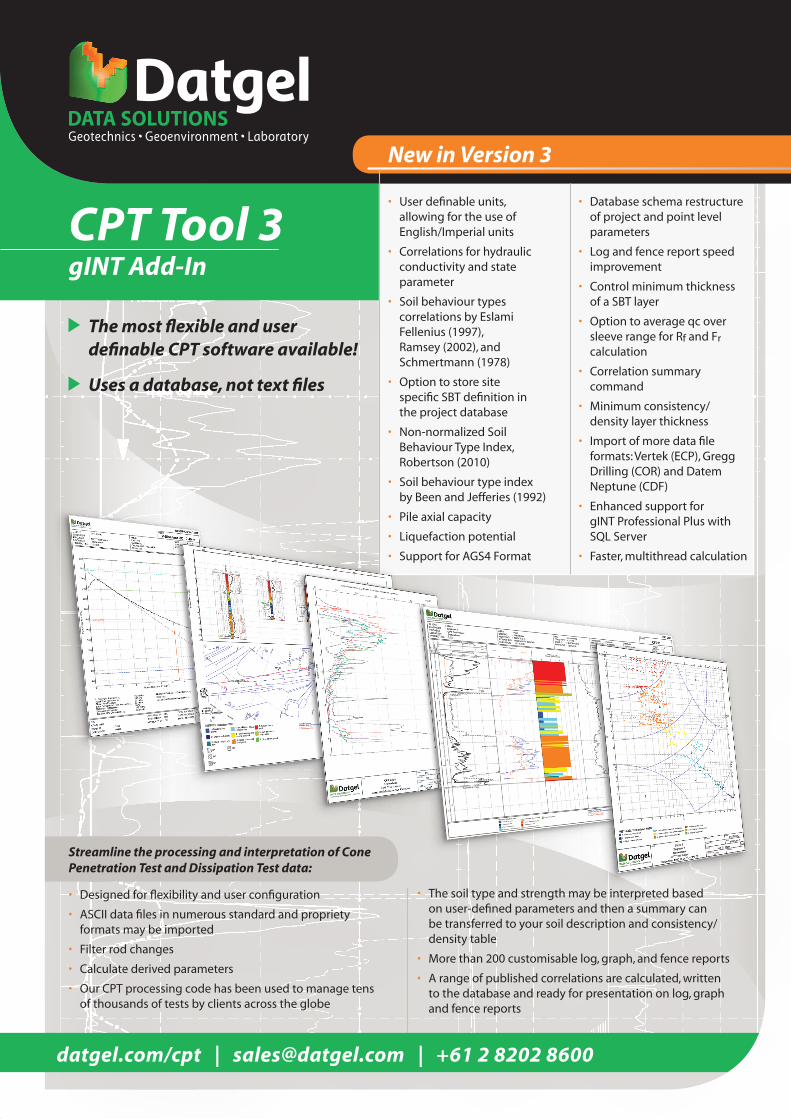
CPT Tool 3 gINT Add-In Streamline the processing and interpretation of Cone Penetration Test and Dissipation Test data: • Designed for flexibility and user configuration • ASCII data files in numerous standard and propriety formats may be imported • Filter rod changes • Calculate derived parameters • Our CPT processing code has been used to manage tens of thousands of tests by clients across the globe • The soil type and strength may be interpreted based on user-defined parameters and then a summary can be transferred to your soil description and consistency/ density table • More than 200 customisable log, graph, and fence reports • A range of published correlations are calculated, written to the database and ready for presentation on log, graph and fence reports datgel.com/cpt | [email protected] | +61 2 8202 8600 The most flexible and user definable CPT software available! Uses a database, not text files New in Version 3 • User definable units, allowing for the use of English/Imperial units • Correlations for hydraulic conductivity and state parameter • Soil behaviour types correlations by Eslami Fellenius (1997), Ramsey (2002), and Schmertmann (1978) • Option to store site specific SBT definition in the project database • Non-normalized Soil Behaviour Type Index, Robertson (2010) • Soil behaviour type index by Been and Jefferies (1992) • Pile axial capacity • Liquefaction potential • Support for AGS4 Format • Database schema restructure of project and point level parameters • Log and fence report speed improvement • Control minimum thickness of a SBT layer • Option to average qc over sleeve range for Rf and Fr calculation • Correlation summary command • Minimum consistency/ density layer thickness • Import of more data file formats: Vertek (ECP), Gregg Drilling (COR) and Datem Neptune (CDF) • Enhanced support for gINT Professional Plus with SQL Server • Faster, multithread calculation
Transcript of New in Version 3 CPT Tool 3 of project and point level · CPT Tool 3 gINT Add-In ... correlations...
CPT Tool 3 gINT Add-In
Streamline the processing and interpretation of Cone Penetration Test and Dissipation Test data:
• Designed for flexibility and user configuration
• ASCII data files in numerous standard and propriety formats may be imported
• Filter rod changes
• Calculate derived parameters
• Our CPT processing code has been used to manage tens of thousands of tests by clients across the globe
• The soil type and strength may be interpreted based on user-defined parameters and then a summary can be transferred to your soil description and consistency/density table
• More than 200 customisable log, graph, and fence reports
• A range of published correlations are calculated, written to the database and ready for presentation on log, graph and fence reports
datgel.com/cpt | [email protected] | +61 2 8202 8600
The most flexible and user definable CPT software available!
Uses a database, not text files
New in Version 3
• User definable units, allowing for the use of English/Imperial units
• Correlations for hydraulic conductivity and state parameter
• Soil behaviour types correlations by Eslami Fellenius (1997), Ramsey (2002), and Schmertmann (1978)
• Option to store site specific SBT definition in the project database
• Non-normalized Soil Behaviour Type Index, Robertson (2010)
• Soil behaviour type index by Been and Jefferies (1992)
• Pile axial capacity
• Liquefaction potential
• Support for AGS4 Format
• Database schema restructure of project and point level parameters
• Log and fence report speed improvement
• Control minimum thickness of a SBT layer
• Option to average qc over sleeve range for Rf and Fr calculation
• Correlation summary command
• Minimum consistency/ density layer thickness
• Import of more data file formats: Vertek (ECP), Gregg Drilling (COR) and Datem Neptune (CDF)
• Enhanced support for gINT Professional Plus with SQL Server
• Faster, multithread calculation
Formula Configuration1
2
3
4
5
6
7
89
10
2
3
4
5
6
7
89
100
2
3
4
5
6
7
89
1,000
0.1 2 3 4 5 6 7 8 9 1 2 3 4 5 6 7 8 9 101
2
3
4
5
6
7
8910
2
3
4
5
6
7
89100
2
3
4
5
6
7
891,000
0.1 2 3 4 5 6 7 8 9 1 2 3 4 5 6 7 8 9 10
Qt
Fr
2
3
5
4
6
78
9
1
A4
DA
TGE
L C
PT
TOO
L D
GD
LIB
2.2
3.G
LB G
raph
CP
T R
OB
ER
TSO
N 9
0 Q
T V
S. F
R A
4P D
ATG
EL
CP
T TO
OL
DG
D 2
.23
SI.G
PJ
2012
-02-
21 S
BT.
GD
W 2
1/Fe
b/20
12 2
0:43
8.3
0.00
2 D
atge
l CP
T To
ol g
INT
Add
-In
FIGURE NoPROJECT No
SCALE
CHECKED DATE
DATEDRAWNTITLE
2.22
Not To Scale
21/02/2012
21/02/2012Client 1
Engineer 1Somewhere
CPT Tool ProjectRobertson 1990 Qt vs. Fr - CPT 02
METHOD: Robertson 19901 - Sensitive, fine grained
2 - Organic soil - peats
3 - Clays - clay to silty clay
4 - Silt mixtures - clayey silt to silty clay
5 - Sand mixtures - silty sand to sandy silt
6 - Sands - clean sand to silty sand
7 - Gravelly sand to sand
8 - Very stiff sand to clayey sand
9 - Very stiff fine grained
SBT graph
-7
-6
-5
-4
-3
-2
-1
0
1
2
30 10 20 30 40 50
PointID
CPT 00CPT 01CPT 02CPT 03CPT 04
Ele
vatio
n (m
)
Cone Resistance, qc (MPa) or Total Cone Resistance, qt (MPa)
A4D
ATG
EL C
PT T
OO
L D
GD
LIB
2.0
1.G
LB G
raph
CP
T Q
C Q
T VS
ELE
VATI
ON
CO
LOU
R D
ATG
EL C
PT T
OO
L D
GD
2.0
1.G
PJ <
<Dra
win
gFile
>> D
atge
l CP
T To
ol g
INT
Add-
In 2
7/10
/200
9 16
:19
FIGURE NoPROJECT No
SCALE
CHECKED DATE
DATEDRAWNTITLE
123456
Not To Scale
27/10/2009
CB
DB
27/10/2009CPT ClientSomewhere
CPT Tool ProjectCone Resistance versus Elevation
1
CPT QC QT VS ELEVATION Colour Graph Report
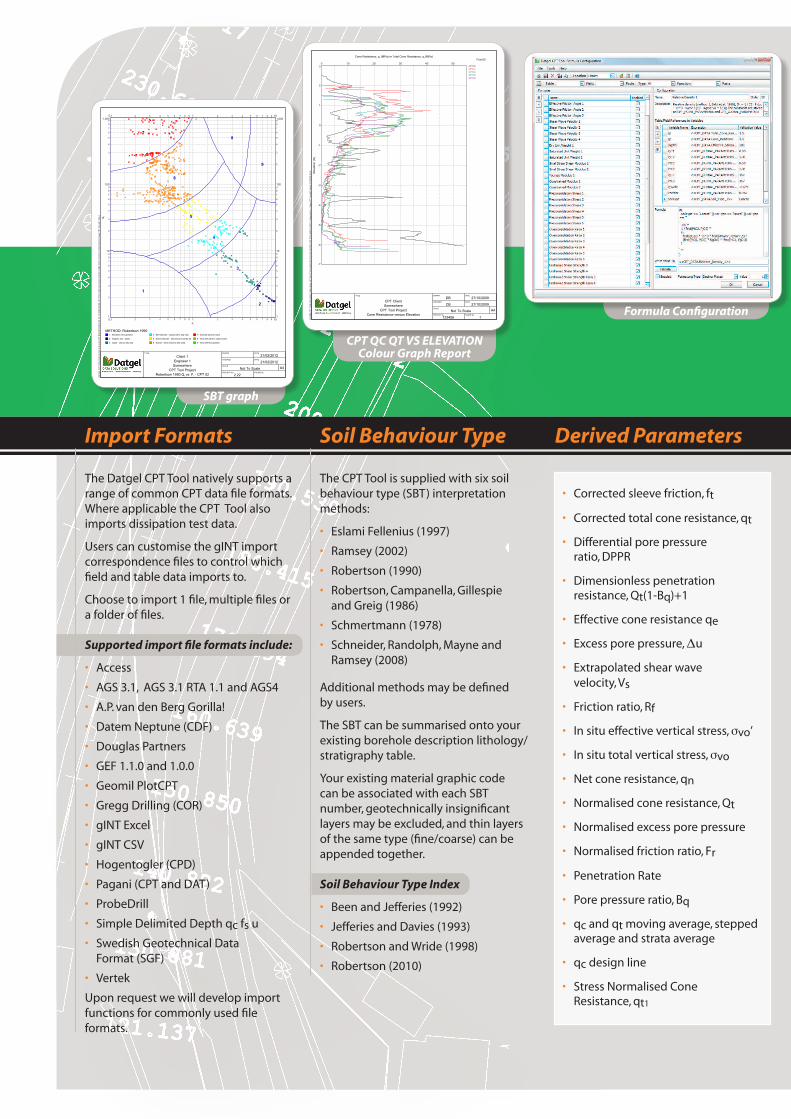
Import Formats
The Datgel CPT Tool natively supports a range of common CPT data file formats. Where applicable the CPT Tool also imports dissipation test data.
Users can customise the gINT import correspondence files to control which field and table data imports to.
Choose to import 1 file, multiple files or a folder of files.
Supported import file formats include:
• Access
• AGS 3.1, AGS 3.1 RTA 1.1 and AGS4
• A.P. van den Berg Gorilla!
• Datem Neptune (CDF)
• Douglas Partners
• GEF 1.1.0 and 1.0.0
• Geomil PlotCPT
• Gregg Drilling (COR)
• gINT Excel
• gINT CSV
• Hogentogler (CPD)
• Pagani (CPT and DAT)
• ProbeDrill
• Simple Delimited Depth qc fs u
• Swedish Geotechnical Data Format (SGF)
• Vertek
Upon request we will develop import functions for commonly used file formats.
Soil Behaviour Type
The CPT Tool is supplied with six soil behaviour type (SBT) interpretation methods:
• Eslami Fellenius (1997)
• Ramsey (2002)
• Robertson (1990)
• Robertson, Campanella, Gillespie and Greig (1986)
• Schmertmann (1978)
• Schneider, Randolph, Mayne and Ramsey (2008)
Additional methods may be defined by users.
The SBT can be summarised onto your existing borehole description lithology/stratigraphy table.
Your existing material graphic code can be associated with each SBT number, geotechnically insignificant layers may be excluded, and thin layers of the same type (fine/coarse) can be appended together.
Soil Behaviour Type Index
• Been and Jefferies (1992)
• Jefferies and Davies (1993)
• Robertson and Wride (1998)
• Robertson (2010)
Derived Parameters
• Corrected sleeve friction, ft
• Corrected total cone resistance, qt
• Differential pore pressure ratio, DPPR
• Dimensionless penetration resistance, Qt(1-Bq)+1
• Effective cone resistance qe
• Excess pore pressure, Δu
• Extrapolated shear wave velocity, Vs
• Friction ratio, Rf
• In situ effective vertical stress, σvo’
• In situ total vertical stress, σvo
• Net cone resistance, qn
• Normalised cone resistance, Qt
• Normalised excess pore pressure
• Normalised friction ratio, Fr
• Penetration Rate
• Pore pressure ratio, Bq
• qc and qt moving average, stepped average and strata average
• qc design line
• Stress Normalised Cone Resistance, qt1
-7
-6
-5
-4
-3
-2
-1
0
1
2
30 10 20 30 40 50 60 70 80 90 100
PointID
CPT 00CPT 01CPT 02
Method: Baldi et al. (1986) and Al-Homoud and Wehr (2006) Jamiolkowski et al. (2001) Kulhawy and Mayne (1990)
Relative Density, Dr (%)
Ele
vatio
n (m
, AH
D)
A4
DA
TGE
L C
PT
TOO
L D
GD
LIB
2.0
5.G
LB G
raph
CP
T D
R R
L D
ATG
EL
CP
T TO
OL
DG
D 2
.05.
GP
J <<
Dra
win
gFile
>> 0
4/M
ay/2
010
21:5
4 8.
2.00
8 D
atge
l CP
T To
ol g
INT
Add
-In
FIGURE NoPROJECT No
SCALE
CHECKED DATE
DATEDRAWNTITLE
2.04
Not To Scale
4/05/2010
PMW
PMW
4/05/2010CPT ClientSomewhere
CPT Tool ProjectRelative Density versus Elevation
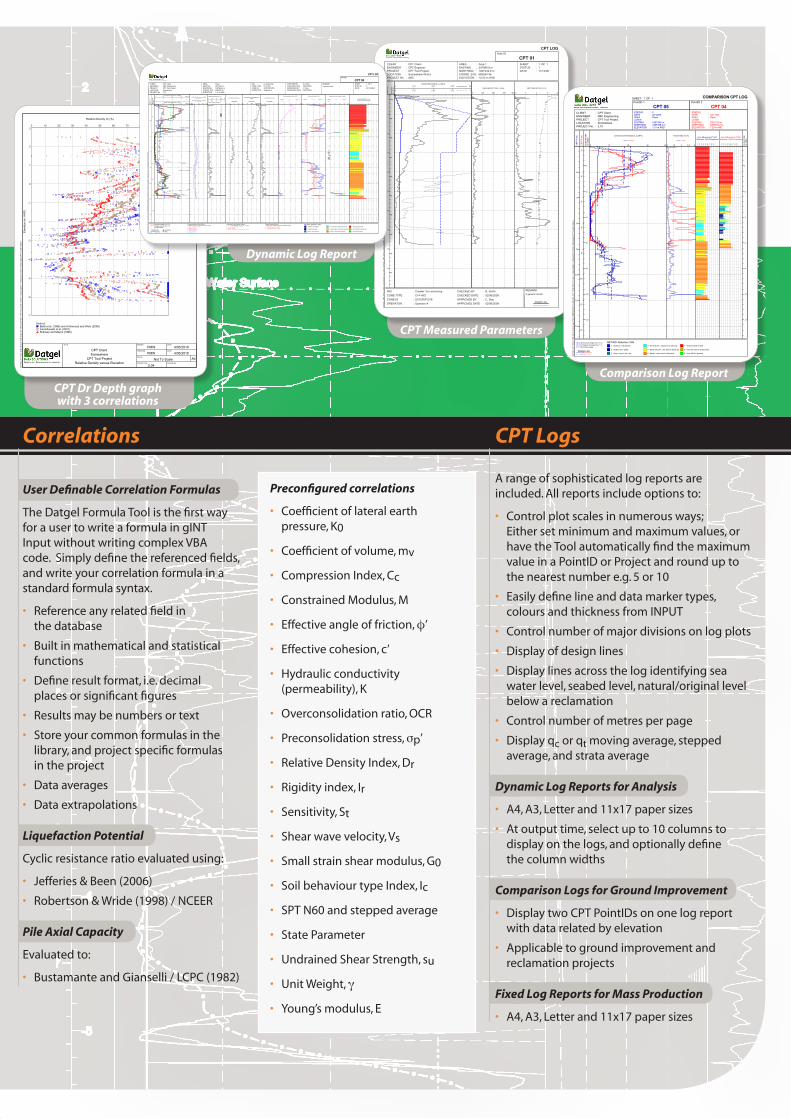
CPT Dr Depth graph with 3 correlations
1.25 2.50 3.750 5FRICTION RATIO, Rf (%)
2 4 60 8
SLEEVE FRICTION, fs (kPa)
125 250 3750 500
CONE RESISTENCE, qc (MPa)12.5 25.0 37.50 50
Hole ID
SHEET : 1 OF 1STATUS : 1DATE : 11/12/08
CPT 01
CHECKED BY : B. SmithCHECKED DATE : 02/06/2009APPROVED BY : C. DoeAPPROVED DATE : 02/06/2009
REMARKA general remark.
RIG : Crawler 1no anchoringCONE TYPE : C+F+W2CONE ID : S15CFIIP.D76OPERATOR : Operator A
CLIENT : CPT ClientENGINEER : CPT EngineerPROJECT : CPT Tool ProjectLOCATION : Somewhere WorldPROJECT No. : ABC
CPT LOG
AREA : Area 1EASTING : 247985.8 mNORTHING : 1267342.9 mCOORD. SYS.: MGA94 56ELEVATION : 10.23 m AHD
Dep
th (m
)
1
2
3
4
5
6
7
8
9
Ele
vatio
n(m
AH
D)
10
9
8
7
6
5
4
3
2
1
DA
TGEL
_CP
T_TO
OL_
DG
D_L
IB_0
9.G
LB L
og C
PT
DA
TGEL
_CP
T_TO
OL_
DG
D_0
9.G
PJ <
<Dra
win
gFile
>> D
atge
l CP
T To
ol g
INT
Add-
In 2
0/03
/200
9 18
:12
Design Line
CPT Measured Parameters
ELE
VA
TIO
N(m
AH
D)
0
-2
-4
-6
-8
-10
-12
Design Line
ELE
VA
TIO
N(m
AH
D)
0
-2
-4
-6
-8
-10
-12
DE
PTH
(m)
0
2
4
6
8
10
12
14
DE
PTH
(m)
2
4
6
8
10
12
14
1 - Sensitive, fine grained
2 - Organic soil - peats
3 - Clays - clay to silty clay
4 - Silt mixtures - clayey silt to silty clay
5 - Sand mixtures - silty sand to sandy silt
7 - Gravelly sand to sand
8 - Very stiff sand to clayey sand
9 - Very stiff fine grained6 - Sands - clean sand to silty sand
METHOD: Robertson 1990
0 1.5 3 4.5 6
Friction Ratio, Rf (%)Corrected Cone Resistance, qt (MPa)
0 10 20 30 40
PointID 1SHEET: 1 OF 1
CLIENT : CPT ClientENGINEER : ABC EngineeringPROJECT : CPT Tool ProjectLOCATION : SomewherePROJECT No. : 2.10
COMPARISON CPT LOGPointID 2
CPT 05STATUS : 2DATE : 23/12/09AREA : PlaceLAYER :EASTING : 248139.6 mNORTHING : 1267426.3 mELEVATION : 1.51 m AHD
CPT 04STATUS :DATE : 12/11/08AREA : PlaceLAYER :EASTING : 248114.9 mNORTHING : 1267400.2 mELEVATION : 1.20 m AHD
DA
TGEL
CPT
TO
OL
DG
D L
IB 2
.10.
GLB
Log
CP
TU C
OM
PAR
ISO
N A
4 D
ATG
EL C
PT T
OO
L D
GD
2.1
0.G
PJ <
<Dra
win
gFile
>> 2
1/Se
p/20
10 2
3:52
8.2
.824
Dat
gel C
PT
Tool
gIN
T Ad
d-In
SOIL BEHAVIOUR TYPE:Robertson 1990 Extrapolated
1 2 3 4 5 6 7 8 9
SOIL BEHAVIOUR TYPE:Robertson 1990 Extrapolated
1 2 3 4 5 6 7 8 9
qt Strata Average
qt Moving Average Over 0.5 mqt Stepped Average Over 1 m
Comparison Log Report
CPT Logs
A range of sophisticated log reports are included. All reports include options to:
• Control plot scales in numerous ways; Either set minimum and maximum values, or have the Tool automatically find the maximum value in a PointID or Project and round up to the nearest number e.g. 5 or 10
• Easily define line and data marker types, colours and thickness from INPUT
• Control number of major divisions on log plots
• Display of design lines
• Display lines across the log identifying sea water level, seabed level, natural/original level below a reclamation
• Control number of metres per page
• Display qc or qt moving average, stepped average, and strata average
Dynamic Log Reports for Analysis
• A4, A3, Letter and 11x17 paper sizes
• At output time, select up to 10 columns to display on the logs, and optionally define the column widths
Comparison Logs for Ground Improvement
• Display two CPT PointIDs on one log report with data related by elevation
• Applicable to ground improvement and reclamation projects
Fixed Log Reports for Mass Production
• A4, A3, Letter and 11x17 paper sizes
Undrained Shear Strength Method:1. su = (qt·103 - vo)/Nkt; or (qc·103 - vo)/Nk2. su = (qt·103)/Nkt; or (qc·103)/Nk3. Wroth (1984)4. Trak et al. (1980), Terzaghi et al. (1996)
Overconsolidation Ratio Method:1. Mayne (1995); Demers & Leroueil (2002)2. Chen & Mayne (1996)3. Mayne (2005)4. Robertson (2009)5. Mayne (2005)6. Mayne (2007)
Relative Density Method:1. Baldi et al. (1986); Al-Homoud & Wehr (2006)2. Jamiolkowski et al. (2001)3. Kulhawy & Mayne (1990)
CPT 05
CPT LOG
SHEET : 1 OF 1STATUS : 2DATE : 23/12/2009
AREA : PlaceEASTING : 248139.6 mNORTHING : 1267426.3 mCOORD. SYS. : MGA94 56ELEVATION : 1.51 m AHD
CLIENT : CPT ClientENGINEER : ABC EngineeringPROJECT : CPT Tool ProjectLOCATION : SomewherePROJECT No. : 2.10
A general remark.REMARKRIG : no anchoring
CONE TYPE : C+F+W2CONE ID : S15CFIIP.D76OPERATOR : Operator A
CHECKED BY : B. SmithCHECKED DATE : 06/02/2009APPROVED BY : C. DoeAPPROVED DATE : 06/02/2009
PointID
DA
TGEL
CPT
TO
OL
DG
D L
IB 2
.10.
GLB
Log
CP
T D
YN
AMIC
A3L
DAT
GEL
CPT
TO
OL
DG
D 2
.10.
GPJ
<<D
raw
ingF
ile>>
21/
Sep/
2010
23:
34 8
.2.8
24 D
atge
l CP
T To
ol g
INT
Add-
In
DissipationTest
Design Line
1 - Sensitive, fine grained
2 - Organic soil - peats
3 - Clays - clay to silty clay
4 - Silt mixtures - clayey silt to silty clay
5 - Sand mixtures - silty sand to sandy silt
7 - Gravelly sand to sand
8 - Very stiff sand to clayey sand
9 - Very stiff fine grained6 - Sands - clean sand to silty sand
METHOD: Robertson 1990qt Moving Average Over 0.5 mqt Stepped Average Over 1 mqt Strata Average
-300 9000 300 600
In Situ Pore Pressure, u0 (kPa)
Porewater Pressure, u2 (kPa)5
3
4
2
6
25 50 750 100
Overconsolidation Ratio, OCR
1 1
4
32
40 80 120 1600 200
Undrained Shear Strength, su (kPa)
25 50 750 100
Relative Density, Dr (%)
1 32
-0.6 -0.1 0.4 0.9 1.4
Pore Pressure Ratio, Bq
0 1.5 3 4.5 6
Friction Ratio, Rf (%)0 10 20 30
1 2 30
0 400Sleeve Friction Resistance, fs (kPa)
4
100 200 300
40Corrected Cone Resistance, qt (MPa)
0 6
Slope Indicator (°)
1.5 3 4.5Friction Ratio, Rf (%)
20 -513.75 7.5 1.25
Normalised Cone Resistance, Qt(MPa)
100001 10 100 1000 1 2 3 4 5 6 7 8 9
SOIL BEHAVIOUR TYPE:Robertson 1990 Extrapolated
ELE
VA
TIO
N(m
AH
D)
0
-2
-4
-6
-8
-10
-12
DE
PTH
(m)
2
4
6
8
10
12
14
Dynamic Log Report
Correlations
User Definable Correlation Formulas
The Datgel Formula Tool is the first way for a user to write a formula in gINT Input without writing complex VBA code. Simply define the referenced fields, and write your correlation formula in a standard formula syntax.
• Reference any related field in the database
• Built in mathematical and statistical functions
• Define result format, i.e. decimal places or significant figures
• Results may be numbers or text
• Store your common formulas in the library, and project specific formulas in the project
• Data averages
• Data extrapolations
Liquefaction Potential
Cyclic resistance ratio evaluated using:
• Jefferies & Been (2006)
• Robertson & Wride (1998) / NCEER
Pile Axial Capacity
Evaluated to:
• Bustamante and Gianselli / LCPC (1982)
Preconfigured correlations
• Coefficient of lateral earth pressure, K0
• Coefficient of volume, mv
• Compression Index, Cc
• Constrained Modulus, M
• Effective angle of friction, φ’
• Effective cohesion, c’
• Hydraulic conductivity (permeability), K
• Overconsolidation ratio, OCR
• Preconsolidation stress, σp’
• Relative Density Index, Dr
• Rigidity index, Ir
• Sensitivity, St
• Shear wave velocity, Vs
• Small strain shear modulus, G0
• Soil behaviour type Index, Ic
• SPT N60 and stepped average
• State Parameter
• Undrained Shear Strength, su
• Unit Weight, γ
• Young’s modulus, E

Fence Diagram/Cross Section
Dynamic user-definable fence or cross section reports:
• Choose up to 6 parameters and correlations to display, e.g. qc, qt, Rf, Ic plots
• Soil behaviour type coloured column
• Material graphic column
• Legend for soil behaviour type
• Legend for material graphic
• A4, A3, Letter and 11x17 paper sizes
Dissipation Test
Dissipation tests may be analysed using the strain path method (SPM) proposed by Houlsby and Teh 1988.
Dissipation tests carried out in overconsolidated soils maybe corrected using the square root time method, as proposed in Sully et al. 1999, and short tests may be extrapolated forward to estimate tx, (e.g. t50).
Data Correction Tool
Allows for one-off corrections of data
Example applications:• Offset one parameter a fixed depth, e.g. offset sleeve
friction for many tests in one process
• Re-zero the depth if 0 depth is not the ground surface
• Apply calibrations to a parameter defined by a formula
• Correct depth for inclination
100
150
200
250
300
350
400
450
500
550
600
0.0 0.5 1.0 1.5 2.0 2.5 3.0 3.5 4.0
Por
e pr
essu
re, u
(kP
a)
Nom
alis
ed E
xces
s Po
re P
ress
ure,
U
ui
0.0
0.1
0.2
0.3
0.4
0.5
0.6
0.7
0.8
0.9
1.0
Square Root Time, t1/2 (min1/2)
u at U = 50%
t50
u0
AREA : Sydney 19-05-08EASTING : 248189.7 mNORTHING : 1267403.9 mCOORD. SYS.: MGA94 56ELEVATION : 3.10 m AHD
Test ID
DISSIPATION TEST
V-Diss test NC - 14.63 mCLIENT : CPT ClientENGINEER :PROJECT : CPT Tool ProjectLOCATION : SomewherePROJECT No. : 123456
REMARKRIG : TRACK RIGCONE TYPE :CONE ID : EC17OPERATOR :
ANALYSED BY : DATE:CHECKED BY : DATE:APPROVED BY : DATE:
Horizontal Coefficent of Consolidation, ch: 1.50x10³ m2/yrRatio ch/cv: 3Vertical Coefficent of Consolidation, cv: 4.99x10² m2/yr
SHEET : 1 OF 1STATUS :DATE :
In Situ Pore Pressure, u0: 128.76 kPaInitial Pore Pressure, ui: 579.6 kPaFinial Pore Pressure: 579.640255 kPaDegree of Dissipation: 50 %Dissipation Pressure: 354.06 kPaTime for 50% Dissipation, t50: 0.34 min
DA
TGEL
CPT
TO
OL
DG
D L
IB 2
.01.
GLB
Gra
ph C
PT
DIS
S. P
OR
E P
RE
SSU
RE
VS. S
QR
T D
ATG
EL C
PT T
OO
L D
GD
2.0
1.G
PJ <
<Dra
win
gFile
>> D
atge
l CP
T To
ol g
INT
Add-
In 2
7/10
/200
9 16
:24
Normally Consolidated Test
60
80
100
120
140
160
180
200
220
240
260
280
300
0 1 2 3 4 5 6 7 8 9
uc
Por
e pr
essu
re, u
(kP
a)
Nom
alis
ed E
xces
s Po
re P
ress
ure,
U
ui
-0.1
0.0
0.1
0.2
0.3
0.4
0.5
0.6
0.7
0.8
0.9
1.0
Square Root Time, t1/2 (min1/2)
u at U = 50%
t50
u0
AREA :EASTING :NORTHING :COORD. SYS.: MGA94 56ELEVATION :
Test ID
DISSIPATION TEST
V-Diss test OC - 7.49 mCLIENT : CPT ClientENGINEER :PROJECT : CPT Tool ProjectLOCATION : SomewherePROJECT No. : 123456
REMARKRIG :CONE TYPE :CONE ID : 3167OPERATOR : PMW
adsf; varANALYSED BY : ABC DATE: 02/01/2009CHECKED BY : DEF DATE: 03/01/2009APPROVED BY : GHI DATE: 04/01/2009
Horizontal Coefficent of Consolidation, ch: 2.68x100 m2/yrRatio ch/cv: 5Vertical Coefficent of Consolidation, cv: 5.36x10⁻¹ m2/yr
SHEET : 1 OF 1STATUS : 3DATE : 01/01/09
In Situ Pore Pressure, u0: 73.48 kPaInitial Pore Pressure, ui: 240 kPaFinial Pore Pressure: 261 kPaBack Extrapolated Pore Pressure, uc: 277 kPaDegree of Dissipation: 50 %Dissipation Pressure: 175.2 kPaTime for 50% Dissipation, t50: 43.27 min
DA
TGEL
CPT
TO
OL
DG
D L
IB 2
.01.
GLB
Gra
ph C
PT
DIS
S. P
OR
E P
RE
SSU
RE
VS. S
QR
T D
ATG
EL C
PT T
OO
L D
GD
2.0
1.G
PJ <
<Dra
win
gFile
>> D
atge
l CP
T To
ol g
INT
Add-
In 2
7/10
/200
9 16
:12
Overconsolidated Test with Back Extrapolation
-11
-10
-9
-8
-7
-6
-5
-4
-3
-2
-1
0
1
2
3
220 240 260 280 300 320 340 360 380
(3 m) 0
qt (MPa)4010 20 300300
su (kPa)
100200
Sof
tFi
rmStif
f
Ver
y S
tiff
Ver
y S
oft
Har
d
1 2 34 5
06
Rf (%)1.534.5 0
Dr (%)
10025 50 75
Ver
y D
ense
Ver
y D
ense
Den
se
Med
ium
Den
se
Loos
e
Ver
y Lo
ose
1 2 3
(1 m) 0
qt (MPa)4010 20 300300
su (kPa)
100200
Sof
tFi
rmStif
f
Ver
y S
tiff
Ver
y S
oft
Har
d
24 5
06
Rf (%)1.534.5 0
Dr (%)
10025 50 75
Ver
y D
ense
Ver
y D
ense
Den
se
Med
ium
Den
se
Loos
e
Ver
y Lo
ose
1 2 3
(2 m) 0
qt (MPa)4010 20 300300
su (kPa)
100200
Sof
tFi
rmStif
f
Ver
y S
tiff
Ver
y S
oft
Har
d
1 2 34 5
06
Rf (%)1.534.5 0
Dr (%)
10025 50 75
Ver
y D
ense
Ver
y D
ense
Den
se
Med
ium
Den
se
Loos
e
Ver
y Lo
ose
1 2 3
(2 m) 0
qt (MPa)4010 20 300300
su (kPa)
100200
Sof
tFi
rmStif
f
Ver
y S
tiff
Ver
y S
oft
Har
d
1 2 34 5
06
Rf (%)1.534.5 0
Dr (%)
10025 50 75
Ver
y D
ense
Ver
y D
ense
Den
se
Med
ium
Den
se
Loos
eV
ery
Loos
e
1 2 3(-2 m)0
qt (MPa)4010 20 300300
su (kPa)
100200
Sof
tFi
rmStif
f
Ver
y S
tiff
Ver
y S
oft
Har
d
1 2 34 5
06
Rf (%)1.534.5 0
Dr (%)
10025 50 75
Ver
y D
ense
Ver
y D
ense
Den
se
Med
ium
Den
se
Loos
e
Ver
y Lo
ose
1 2 3
Relative Density Method:1. Baldi et al. (1986); Al-Homoud & Wehr (2006)2. Jamiolkowski et al. (2001)3. Kulhawy & Mayne (1990)
Undrained Shear Strength Method:1. su = (qt - vo)/Nkt; or (qc - vo)/Nk2. su = qt/Nkt; or qc/Nk3. Wroth (1984)4. Trak et al. (1980), Terzaghi et al. (1996)5. Robertson (2009), su = u/N
714.505
DH2
111.121
121.137
130.881
140.822
150.850
160.639
170.694
180.415
190.539
200.043
190.832
200.884
210.934
220.805225
250
275
300
325 350
375
SP
SM
CH
OH
ELE
VA
TIO
N (m
MS
L)
MAP KEY Borehole Cone penetration test
A3
DA
TGE
L C
PT
TOO
L D
GD
LIB
2.2
3.G
LB F
ence
CP
T FE
NC
E A
3L D
ATG
EL
CP
T TO
OL
DG
D 2
.23
SI.G
PJ
<<D
raw
ingF
ile>>
21/
Feb/
2012
20:
40 8
.30.
002
Dat
gel C
PT
Tool
gIN
T A
dd-In
FIGURE NoPROJECT No
SCALE
CHECKED DATE
DATEDRAWNTITLE
2.22
H 1:507 V 1:140
1/01/2012PMW
21/02/2012Client 1
Engineer 1Somewhere
CPT Tool ProjectInferred Subsurface Section
METHOD: Robertson 19904 - Silt mixtures - clayeysilt to silty clay
5 - Sand mixtures - siltysand to sandy silt
1 - Sensitive, finegrained
2 - Organic soil - peats
3 - Clays - clay to siltyclay
6 - Sands - clean sandto silty sand
7 - Gravelly sand tosand
8 - Very stiff sand toclayey sand
9 - Very stiff fine grained
CP
T 01
CP
T 02
CP
T 03
CP
T 04
CP
T 05
2480
00E
2480
00E
2480
25E
2480
25E
2480
50E
2480
50E
2480
75E
2480
75E
2481
00E
2481
00E
2481
25E
2481
25E
2481
50E
2481
50E
1267325N
1267325N
1267350N
1267350N
1267375N
1267375N
1267400N
1267400N
1267425N
1267425N
1267450N
1267450N
CPT 01A
CPT 05 SchneiderCPT TEST 02CPT TEST 03
CPT TEST 04
CPT TEST 05CPT TEST 06V-CPTU BUW u0 TS Profile
CPT 01
CPT 02CPT 03
CPT 04
CPT 05
Fence Diagram
datgel.com/cpt | [email protected] | +61 2 8202 8600
Data Correction Tool