New Analysis Projects in the Interior West FIA Program John D. Shaw Interior West Forest Inventory...
41
New Analysis Projects in the Interior West FIA Program John D. Shaw Interior West Forest Inventory and Analysis USDA Forest Service Interior West FIA User Group Webcast April 13, 2010
-
Upload
logan-gray -
Category
Documents
-
view
252 -
download
0
Transcript of New Analysis Projects in the Interior West FIA Program John D. Shaw Interior West Forest Inventory...

New Analysis Projects in the Interior West FIA Program
John D. ShawInterior West Forest Inventory and Analysis
USDA Forest Service
Interior West FIA User Group WebcastApril 13, 2010
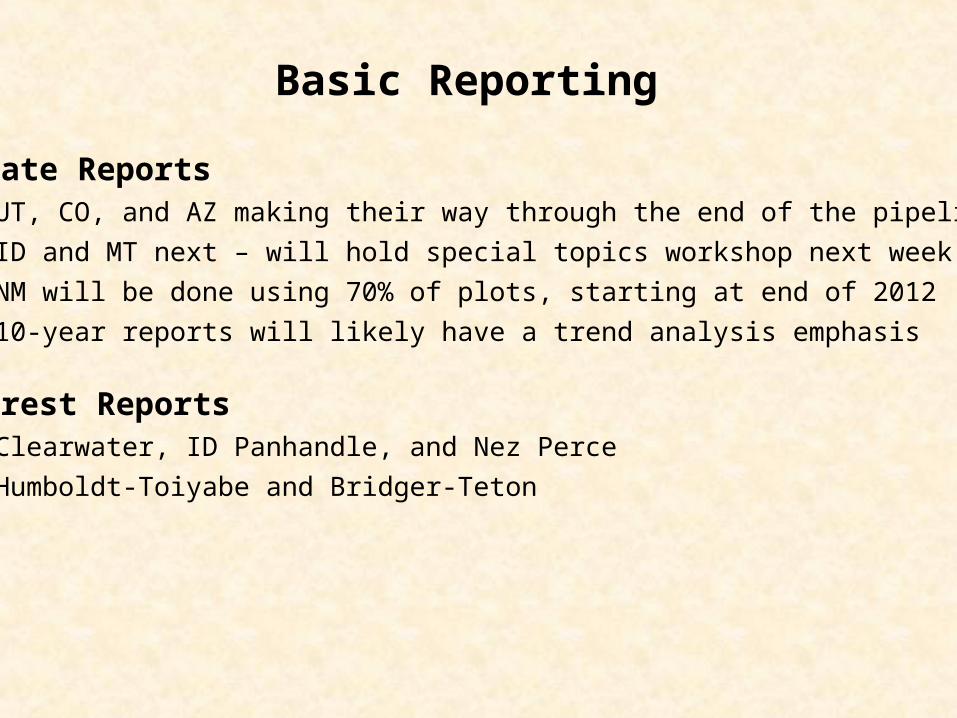
State Reports• UT, CO, and AZ making their way through the end of the pipeline
• ID and MT next – will hold special topics workshop next week
• NM will be done using 70% of plots, starting at end of 2012
• 10-year reports will likely have a trend analysis emphasis
Forest Reports• Clearwater, ID Panhandle, and Nez Perce
• Humboldt-Toiyabe and Bridger-Teton
Basic Reporting

Stand Density IndexConsistency of definitions and analysis
From: Reineke, L.H. 1933. J. Agr. Res. 46(7):627-638.

Stand Density Index
• Wrapping up work on SDImax and related issues
• Paper given at National Silviculture Workshop• Work has progressed in consultation with silviculturists and
Forest Management Service Center
• FIA-based SDIs to be included in FVS• Series of papers to be submitted this year
AVGOFSDI
A_FORTYP: 221.0000030
20
10
0
Std. Dev = 89.61
Mean = 187.6
N = 195.00
529 830450

Growth and Growing Stock Analysis: What is the influence of compositional and structural diversity on productivity?
Ponderosa pine example
1474 plots with PP component
Jim LongDepartment of Wildland Resources

Ponderosa pine Other spp
Pure, even-aged
Mixed, irregularPure, irregular
Mixed, even-aged
Dividing Stands (plots) by Composition and Structure
From Long and Shaw. 2010. Forestry (Oxford). In press.

Analysis Approach
• FIA data include periodic increment (remeasurement, cores)
• Divide plots into categories based on composition and structure
• Model current annual increment as a function of stocking (SDI), stand height, and site quality (site index)
• Fit model to pure, even-aged stand data (reference condition)
• PAI (m3/ha/yr) = 0.0302 * SDIsum0.7050 * HT-0.4783 * SI1.5191
(r2 = 0.86)
• Use reference equation to predict PAI of other classes
• Analyze residuals for differences

Pure, even-aged
Mixed, irregularPure, irregular
Mixed, even-aged
ReferenceModel
Residuals vs Reference
Model
From Long and Shaw. 2010. Forestry (Oxford). In press.

• No significant differences among groups
• There are lots of reasons to manage for compositional and structural diversity, but productivity doesn’t appear to be one of them
• Greater variability in irregular, mixed stands may be related to diversity of associates
• Easy to repeat this test for other target species
Take-home Points

Average annual mortality rates for aspen and coniferous species in Colorado by measurement year, 2002-2006
0.00%
0.50%
1.00%
1.50%
2.00%
2.50%
3.00%
2002 2003 2004 2005 2006
Measurement year
Per
cent
Aspen
Conifers
From: Thompson, M.T. et al. 5-year Interim Report for Colorado (in press)
FIA Annual Inventory Data Capture Temporal Trends
Average annual mortality rates for aspen and coniferous species in Colorado by measurement year, 2002-2006.

Analysis Approach• Lots of need to address emerging issues – e.g., MPB
• See presentations by Mike Thompson (next) and Ray Czaplewski (3:15)
• Many studies on insect effects analyze the aftermath
• FIA plots in place during onset, peak, and decline of large-scale events
• Anatomy of an MPB epidemic
• Develop a series of postulates based on literature
• Test each postulate against FIA time series
Jim LongDepartment of Wildland Resources

Relative density
Mor
talit
y (%
)
early
late
Ln TPHA
Ln Q
MD
early
late
Rank of % mortality- +
Sta
nd-L
evel
Mor
talit
y
100%
early
late
Relative DBH- +
Cum
ulat
ive
Mor
talit
y
100%
early
late
Susceptibility vs density(Anhold et al. 1996)
Progression in size-density space
Progression by size class Progression of severity

Relative density
Mor
talit
y (%
)
early
late
late
Possible asymmetry over time…
Simplified from Anhold et al. (1996) WJAF

0%
10%
20%
30%
40%
50%
60%
70%
80%
90%
100%
0% 10% 20% 30% 40% 50% 60% 70% 80% 90% 100%
2008
2007
2006
2005
2004
2003
2002
Preliminary results for stand-level mortality over timeM
orta
lity
of lo
dgep
ole
pine
com
pone
nt
Percentile rank of stand-level mortality
Rank of % mortality- +S
tand
-Lev
el M
orta
lity
early
late
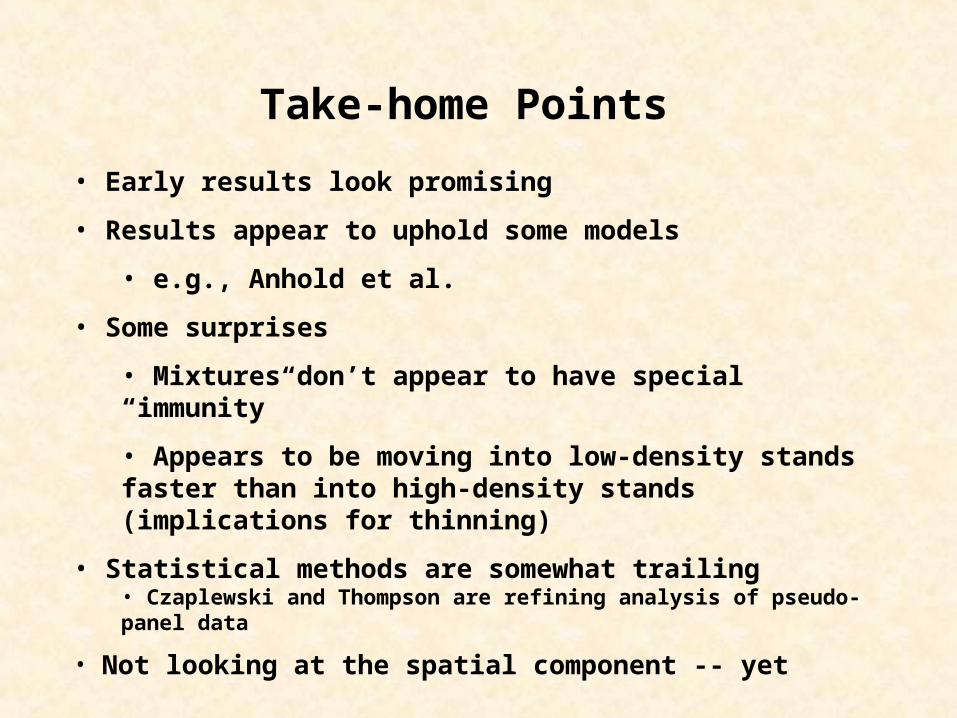
• Early results look promising
• Results appear to uphold some models
• e.g., Anhold et al.
• Some surprises
• Mixtures don’t appear to have special “immunity”
• Appears to be moving into low-density stands faster than into high-density stands (implications for thinning)
• Statistical methods are somewhat trailing• Czaplewski and Thompson are refining analysis of pseudo-panel data
• Not looking at the spatial component -- yet
Take-home Points

USING FOREST INVENTORY AND ANALYSIS DATA TO QUANTIFY WILDLIFE HABITAT IN FORESTED LANDSCAPES: AN OVERVIEW OF POTENTIAL APPLICATIONS
Chris Witt USFS Inventory, Monitoring and Analysis, Rocky Mountain Research Station,
Ogden, Utah

Mexican Spotted Owl Recovery Plan
• Listed as “Threatened” by USFWS in 1993
• Recovery Plan issued in 1995
• Goals of the Plan include: – no loss of existing habitat – review of plan effectiveness
after ten years

0
5,000
10,000
15,000
20,000
25,000
30,000
35,000
40,000
45,000
Pine-OakForest type
Crown Cover ≥45 percent
≥ 4.86 trees >45.7 cm DBH /
ha
Basal Area ≥10.2 m2
> 20% SDI from>45.7 cm DBH
> 25% SDI from30.5 - 45.7cm
DBH
All thresholdsmet
Habitat Component
Hecta
res
1999 Federal lands 2007 Federal lands1999 Private lands 2007 Private lands
Error bars represent 95% C.I.
Pine-Oak Forest TypeGila Mountains Recovery Unit: Arizona

Lewis’ Woodpecker Breeding and Nesting
Photo: Tom Grey
Used annual inventory data (2000 – 2007) to quantify forests providing important breeding habitat for M. lewis.
Crown cover
Woody understory
Snag densities

Results: Forest Type, Crown Cover, Woody Cover, Snags
0
50,000
100,000
150,000
200,000
250,000
Aspen Lodgepole pine White fir Douglas-fir Ponderosa pine
Forest type
Acr
es
Suitable at >13 % woody cover Suitable at >25 % woody cover
Error bars represent 95% confidence intervals

Additional Research: Utah State University/UDWR
• Established “phantom” plots at known M. lewis nest sites in aspen (n = 16 in 2009)
• Compare data to existing P2 plot data
• Visit FIA plots to conduct bird counts (with emphasis on M. lewis)
• Produce a perpetual monitoring tool for M. lewis and other forest vertebrates on Utah’s Sensitive Species List

Aspen, Heartrot, and Cavity-Nesting Aspen, Heartrot, and Cavity-Nesting BirdsBirds
• Aspen trees infected with Phellinus tremulae facilitates cavity excavation.
• Tree and stand characteristics that promote infection in the western U.S. are largely unknown
• Regional differences in tree and stand characteristics could play a role in bird assemblages.

Infected vs. Non-infected standsInfected vs. Non-infected stands
Not infected: n = 3023, mean = 17.89, SD = 8.31Infected: n = 3023, mean = 21.21, SD = 9.29
F (1, 6044) = 213.66, p < 0.0001
Not infected: n = 392, mean = 31.64, SD = 33.35Infected: n = 392, mean = 48.99, SD = 33.92
F (1, 782) = 52.11, p < 0.0001
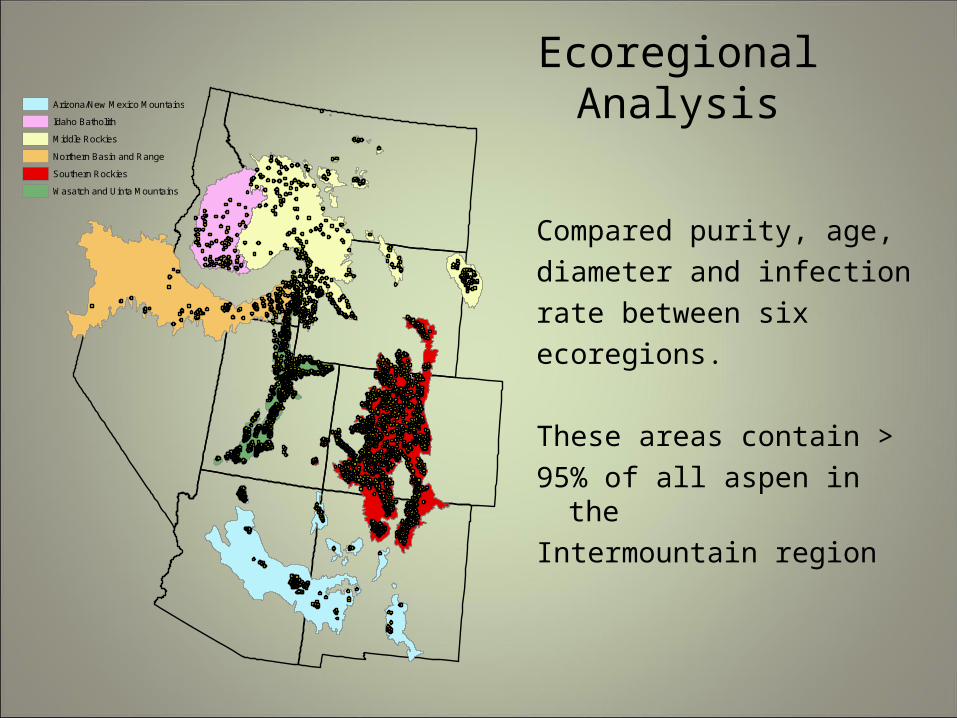
Ecoregional AnalysisLegend
ASPEN PLOTS
CEC Ecoregions
Arizona/New Mexico Mountains
Idaho Batholith
Middle Rockies
Northern Basin and Range
Southern Rockies
Wasatch and Uinta Mountains
IW-FIA states
Compared purity, age, diameter and infectionrate between six ecoregions.
These areas contain > 95% of all aspen in the Intermountain region

Ecoregional Comparisons:Ecoregional Comparisons:Stand PurityStand Purity
Infection rate: 31.1 13.6 19.6 12.3 19.8 11.7

Infection rate: 31.1 13.6 19.6 12.3 19.8 11.7
Ecoregional Comparisons:Ecoregional Comparisons:Tree AgeTree Age

SummaryFIA data are being used to:
– Help managers with habitat treatment expectations(large sample size, systematic sampling of resource)
– Track changes (or lack thereof) in habitat quality after management plan implementation(remeasurement of plots over time)
– Quantify existing habitat for target species or guilds(plot and condition-level variables that reflect species needs)
– Identify limiting habitat features on a landscape-scale(strategic-level population estimates of habitat features)

Forest Genetics Sampling
• IW-FIA cooperating with RMRS and other geneticists to explore grid-based genetics sampling• All tree species + select pathogens
• Expect ~15K samples
• Focal species for first round of analysis:• Aspen – Bryce Richardson (RMRS-Provo), Karen Mock (USU)• Douglas-fir (Sam Cushman (RMRS-Moscow), FS genetics lab• Armillaria – Ned Klopfenstein (RMRS-Moscow), Mee-Sook Kim (Kookmin University, South Korea), Marylou Fairweather (R3 FHP)
• Several objectives:• Collection feasibility• Database proof-of-concept (i.e., genetic traits stored like DIA and HT)• Biogeographic analyses
• Future opportunities (winners vs losers after future events)
• E-Genetics: grab a sample and see what is (and was) there

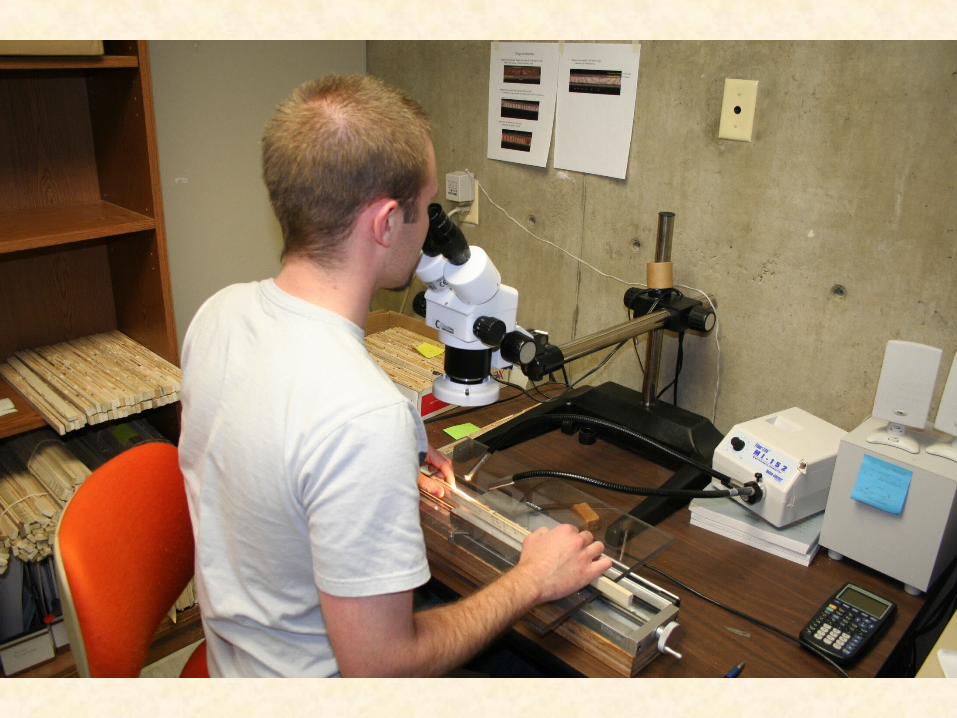
Tree Ring Archiving and Analysis Project
• Complete cores were collected by IW-FIA during 1980s and 1990s periodic inventories
• Primarily used for aging and recent increment• Had done limited full-core reading and no analysis
• Initial estimate of ~8000 cores from most IW states• ~90% considered salvageable
• Established contract with Utah State University dendroecology lab for reading and archiving (2-year project)
• JVA for initial analysis in two areas (overlapping 2-year project)• Basic growth and yield modeling
• e.g., FVS large-tree diameter growth model• Climate studies
• About 8 months in on reading / archiving
R. Justin DeRoseDepartment of Wildland Resources

About 50 of these in FIA storage…

Sorting the good, the bad, and the ugly…


Getting organized by county within state

What we have so far…

What we have so far…
(all species)

What we have so far…
40 pinyons >300 years old

• Tree ring chronologies are typically on the most climate-sensitive sites
• ITRDB sites are relatively sparse, but have been used to develop climate surfaces for space in between
• Chronologies on FIA grid can test relationships across landscapes and elevation gradients
Tree Rings and Climate

CO2 ppm
1451 Pinyon – Raw Ring Width Data
CO2 ppmSmoothed ring widthRing width

CO2 ppm
1451 Pinyon – Growth for Diameter
Expected diameter growthNormalized ring width
Questions?
John D. ShawUSDA Forest Service Rocky Mountain Research StationOgden Forestry Sciences Lab507 25th StreetOgden, UT 84401
Phone: (801) 598-5902Email: [email protected]: www.fs.fed.us/rm/ogden