Nevada’s Manufacturing Sector
22
Emsi Q2 2021 Data Set | www.economicmodeling.com 1 Nevada’s Manufacturing Sector
Transcript of Nevada’s Manufacturing Sector

Emsi Q2 2021 Data Set | www.economicmodeling.com 1
Nevada’s Manufacturing Sector

Emsi Q2 2021 Data Set | www.economicmodeling.com 2
Industry Summary for Manufacturing
Industry Detail
Payrolled Business Locations (2020) 2,072
Jobs Multiplier 5
Unemployed Only Available for 2-Digit
Regional Trends
Region 2010 Jobs 2020 Jobs Change % Change
Nevada 39,633 58,843 19,210 48.5%
Las Vegas-Henderson-Paradise, NV
20,480 26,000 5,520 27.0%
Reno, NV 11,547 24,624 13,077 113.2%
United States 11,821,901 12,520,140 698,239 5.9%
58,843 48.5% $80,294Jobs (2020) % Change (2010-2020) Avg. Earnings Per Job (2020)
48% below National average Nation: 5.9% Nation: $87,768

Emsi Q2 2021 Data Set | www.economicmodeling.com 3
Regional Breakdown of Nevada’s Manufacturing Sector
County Name 2010 Jobs 2020 Jobs2010 - 2020
Change2010 - 2020 %
Change
Avg. Earnings Per Job
2020 Location Quotient
Clark County 20,480 26,000 5,520 27% $72,154 0.32
Washoe County 11,153 13,981 2,828 25% $78,812 0.75
Storey County 394 10,643 10,249 2602% $103,535 7.68
Carson City County
2,678 2,701 24 1% $75,520 1.07
Douglas County 1,746 2,095 348 20% $86,881 1.26
Lyon County 2,036 1,989 (47) (2%) $77,283 1.79
Churchill County 288 545 258 90% $86,514 0.72
Humboldt County 267 292 25 9% $70,425 0.46
Nye County 148 253 105 71% $60,022 0.23
Elko County 246 186 (59) (24%) $68,787 0.10
Eureka County 0 36 36 Insf. Data $60,773 0.10
Pershing County 85 31 (53) (63%) $58,940 0.19
White Pine County 36 27 (10) (27%) $68,611 0.08
Lincoln County <10 26 Insf. Data Insf. Data $51,159 0.22
Lander County 21 13 (8) (39%) $50,552 0.04
Esmeralda County <10 12 Insf. Data Insf. Data $75,852 0.40
Mineral County 27 <10 Insf. Data Insf. Data Insf. Data 0.07
County not reported
14 <10 Insf. Data Insf. Data Insf. Data 0.00
39,633 58,843 19,210 48% $80,294

Emsi Q2 2021 Data Set | www.economicmodeling.com 4
Top Occupations Employed in these Industries
DescriptionEmployed in
Industry Group (2020)
% of Total Jobs in
Industry Group (2020)
Miscellaneous Assemblers and Fabricators 4,265 7.2%
Electrical, Electronic, and Electromechanical Assemblers, Except Coil Winders, Tapers, and Finishers
2,490 4.2%
First-Line Supervisors of Production and Operating Workers 2,326 4.0%
Laborers and Freight, Stock, and Material Movers, Hand 2,292 3.9%
Inspectors, Testers, Sorters, Samplers, and Weighers 1,601 2.7%
Industry Requirements (Top Supply Chain)
Purchases from In-region Purchases Imported Purchases Total Purchases
Corporate, Subsidiary, and Regional Managing Offi ces
$357,505,184 $130,282,907 $487,788,091
Iron and Steel Mills and Ferroalloy Manufacturing
$10,333,773 $311,894,684 $322,228,457
Nonferrous Metal (except Aluminum) Smelting and Refi ning
$75,173,601 $229,234,340 $304,407,942
Plastics Material and Resin Manufacturing
$30,884,203 $236,553,401 $267,437,604
Nonferrous Metal (except Copper and Aluminum) Rolling, Drawing, and Extruding
$45,247,410 $177,573,045 $222,820,455

Emsi Q2 2021 Data Set | www.economicmodeling.com 5
Industry Gender Breakdown
Gender 2020 Jobs 2020 Percent
Males 41,487 70.5%
Females 17,356 29.5%
Industry Age Breakdown
Age 2020 Jobs 2020 Percent
14-18 324 0.6%
19-24 5,318 9.0%
25-34 13,968 23.7%
35-44 13,139 22.3%
45-54 12,828 21.8%
55-64 10,125 17.2%
65+ 3,141 5.3%

Emsi Q2 2021 Data Set | www.economicmodeling.com 6
Industry Race/Ethnicity Breakdown
Race/Ethnicity 2020 Jobs 2020 Percent
White 31,732 53.9%
Hispanic or Latino 17,021 28.9%
Asian 4,673 7.9%
Black or African American 3,316 5.6%
Two or More Races 1,255 2.1%
American Indian or Alaska Native 492 0.8%
Native Hawaiian or Other Pacifi c Islander 355 0.6%
Emsi Q2 2021 Data Set | www.economicmodeling.com 7
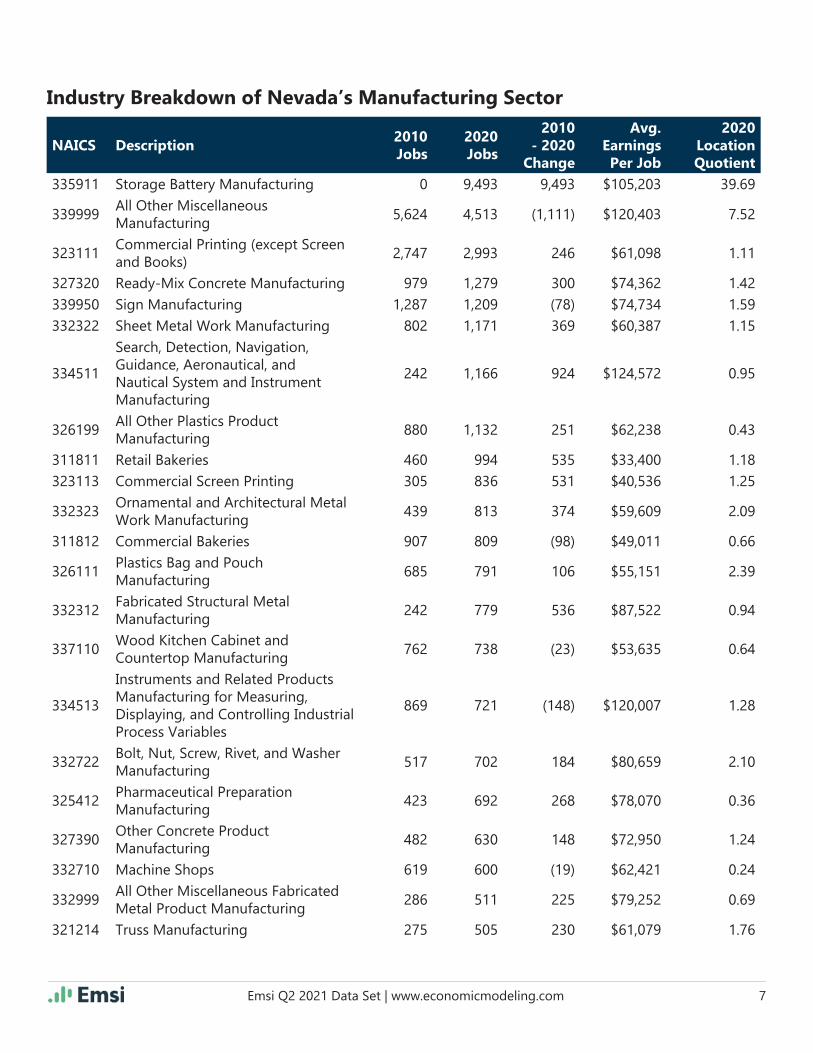
Industry Breakdown of Nevada’s Manufacturing Sector
NAICS Description2010 Jobs
2020 Jobs
2010 - 2020
Change
Avg. Earnings Per Job
2020 Location Quotient
335911 Storage Battery Manufacturing 0 9,493 9,493 $105,203 39.69
339999All Other Miscellaneous Manufacturing
5,624 4,513 (1,111) $120,403 7.52
323111Commercial Printing (except Screen and Books)
2,747 2,993 246 $61,098 1.11
327320 Ready-Mix Concrete Manufacturing 979 1,279 300 $74,362 1.42339950 Sign Manufacturing 1,287 1,209 (78) $74,734 1.59332322 Sheet Metal Work Manufacturing 802 1,171 369 $60,387 1.15
334511
Search, Detection, Navigation, Guidance, Aeronautical, and Nautical System and Instrument Manufacturing
242 1,166 924 $124,572 0.95
326199All Other Plastics Product Manufacturing
880 1,132 251 $62,238 0.43
311811 Retail Bakeries 460 994 535 $33,400 1.18323113 Commercial Screen Printing 305 836 531 $40,536 1.25
332323Ornamental and Architectural Metal Work Manufacturing
439 813 374 $59,609 2.09
311812 Commercial Bakeries 907 809 (98) $49,011 0.66
326111Plastics Bag and Pouch Manufacturing
685 791 106 $55,151 2.39
332312Fabricated Structural Metal Manufacturing
242 779 536 $87,522 0.94
337110Wood Kitchen Cabinet and Countertop Manufacturing
762 738 (23) $53,635 0.64
334513
Instruments and Related Products Manufacturing for Measuring, Displaying, and Controlling Industrial Process Variables
869 721 (148) $120,007 1.28
332722Bolt, Nut, Screw, Rivet, and Washer Manufacturing
517 702 184 $80,659 2.10
325412Pharmaceutical Preparation Manufacturing
423 692 268 $78,070 0.36
327390Other Concrete Product Manufacturing
482 630 148 $72,950 1.24
332710 Machine Shops 619 600 (19) $62,421 0.24
332999All Other Miscellaneous Fabricated Metal Product Manufacturing
286 511 225 $79,252 0.69
321214 Truss Manufacturing 275 505 230 $61,079 1.76
Emsi Q2 2021 Data Set | www.economicmodeling.com 8
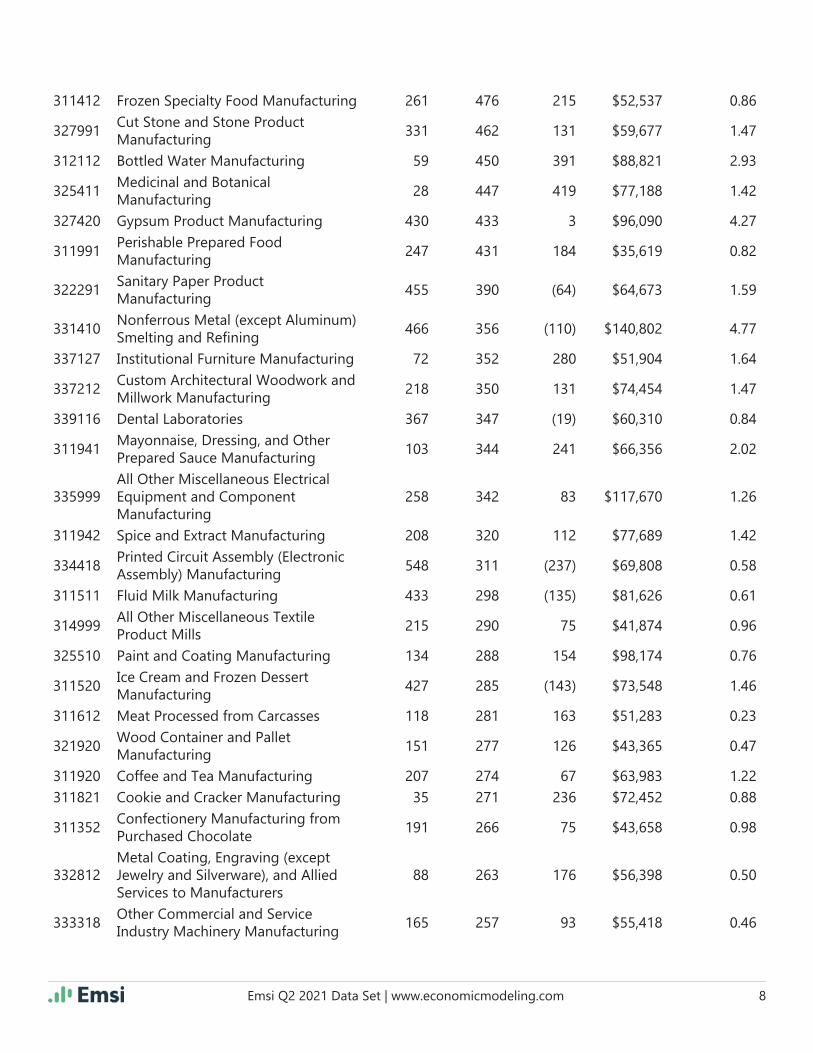
311412 Frozen Specialty Food Manufacturing 261 476 215 $52,537 0.86
327991Cut Stone and Stone Product Manufacturing
331 462 131 $59,677 1.47
312112 Bottled Water Manufacturing 59 450 391 $88,821 2.93
325411Medicinal and Botanical Manufacturing
28 447 419 $77,188 1.42
327420 Gypsum Product Manufacturing 430 433 3 $96,090 4.27
311991Perishable Prepared Food Manufacturing
247 431 184 $35,619 0.82
322291Sanitary Paper Product Manufacturing
455 390 (64) $64,673 1.59
331410Nonferrous Metal (except Aluminum) Smelting and Refi ning
466 356 (110) $140,802 4.77
337127 Institutional Furniture Manufacturing 72 352 280 $51,904 1.64
337212Custom Architectural Woodwork and Millwork Manufacturing
218 350 131 $74,454 1.47
339116 Dental Laboratories 367 347 (19) $60,310 0.84
311941Mayonnaise, Dressing, and Other Prepared Sauce Manufacturing
103 344 241 $66,356 2.02
335999All Other Miscellaneous Electrical Equipment and Component Manufacturing
258 342 83 $117,670 1.26
311942 Spice and Extract Manufacturing 208 320 112 $77,689 1.42
334418Printed Circuit Assembly (Electronic Assembly) Manufacturing
548 311 (237) $69,808 0.58
311511 Fluid Milk Manufacturing 433 298 (135) $81,626 0.61
314999All Other Miscellaneous Textile Product Mills
215 290 75 $41,874 0.96
325510 Paint and Coating Manufacturing 134 288 154 $98,174 0.76
311520Ice Cream and Frozen Dessert Manufacturing
427 285 (143) $73,548 1.46
311612 Meat Processed from Carcasses 118 281 163 $51,283 0.23
321920Wood Container and Pallet Manufacturing
151 277 126 $43,365 0.47
311920 Coffee and Tea Manufacturing 207 274 67 $63,983 1.22311821 Cookie and Cracker Manufacturing 35 271 236 $72,452 0.88
311352Confectionery Manufacturing from Purchased Chocolate
191 266 75 $43,658 0.98
332812Metal Coating, Engraving (except Jewelry and Silverware), and Allied Services to Manufacturers
88 263 176 $56,398 0.50
333318Other Commercial and Service Industry Machinery Manufacturing
165 257 93 $55,418 0.46

Emsi Q2 2021 Data Set | www.economicmodeling.com 9
321219Reconstituted Wood Product Manufacturing
123 254 131 $80,009 1.97
326113Unlaminated Plastics Film and Sheet (except Packaging) Manufacturing
276 253 (23) $70,472 0.75
336310Motor Vehicle Gasoline Engine and Engine Parts Manufacturing
186 239 53 $60,644 0.47
314910 Textile Bag and Canvas Mills 132 238 106 $50,027 1.01
336390Other Motor Vehicle Parts Manufacturing
102 238 136 $67,517 0.19
332119Metal Crown, Closure, and Other Metal Stamping (except Automotive)
37 237 200 $90,148 0.53
336412Aircraft Engine and Engine Parts Manufacturing
495 234 (261) $85,327 0.30
333413Industrial and Commercial Fan and Blower and Air Purifi cation Equipment Manufacturing
191 228 37 $54,101 0.85
311919 Other Snack Food Manufacturing 30 228 197 $50,711 0.58322230 Stationery Product Manufacturing <10 226 Insf. Data $65,264 1.61
333924Industrial Truck, Tractor, Trailer, and Stacker Machinery Manufacturing
44 226 182 $79,330 0.93
332321Metal Window and Door Manufacturing
145 225 80 $53,198 0.39
326122Plastics Pipe and Pipe Fitting Manufacturing
298 213 (85) $64,734 0.84
325998All Other Miscellaneous Chemical Product and Preparation Manufacturing
112 210 98 $101,324 0.58
332994Small Arms, Ordnance, and Ordnance Accessories Manufacturing
108 210 102 $68,339 1.13
336413Other Aircraft Parts and Auxiliary Equipment Manufacturing
123 209 86 $67,816 0.21
332911 Industrial Valve Manufacturing 260 206 (55) $69,553 0.86312111 Soft Drink Manufacturing 93 195 102 $63,888 0.28
331492Secondary Smelting, Refi ning, and Alloying of Nonferrous Metal (except Copper and Aluminum)
133 194 61 $95,527 2.11
327410 Lime Manufacturing 128 192 63 $105,627 5.03311421 Fruit and Vegetable Canning 162 191 29 $85,325 0.38321918 Other Millwork (including Flooring) 142 187 45 $68,489 0.55
331491Nonferrous Metal (except Copper and Aluminum) Rolling, Drawing, and Extruding
166 187 20 $83,702 1.40
331512 Steel Investment Foundries 191 186 (5) $75,350 1.69
334419Other Electronic Component Manufacturing
128 175 47 $56,177 0.32

Emsi Q2 2021 Data Set | www.economicmodeling.com 10
334417 Electronic Connector Manufacturing <10 172 Insf. Data $53,325 0.86
337214Offi ce Furniture (except Wood) Manufacturing
68 171 103 $64,432 0.83
326121Unlaminated Plastics Profi le Shape Manufacturing
36 166 130 $74,517 0.81
336214Travel Trailer and Camper Manufacturing
80 165 85 $57,069 0.43
339112Surgical and Medical Instrument Manufacturing
180 160 (20) $82,939 0.13
335931Current-Carrying Wiring Device Manufacturing
<10 158 Insf. Data $87,816 0.57
337215Showcase, Partition, Shelving, and Locker Manufacturing
127 157 30 $46,554 0.43
311230 Breakfast Cereal Manufacturing 106 153 46 $94,600 1.37326160 Plastics Bottle Manufacturing 95 152 58 $73,406 0.49
325180Other Basic Inorganic Chemical Manufacturing
226 148 (78) $118,329 0.41
335311Power, Distribution, and Specialty Transformer Manufacturing
<10 147 Insf. Data $108,132 0.61
339113Surgical Appliance and Supplies Manufacturing
114 146 32 $96,192 0.16
326150Urethane and Other Foam Product (except Polystyrene) Manufacturing
84 146 63 $87,113 0.46
339920Sporting and Athletic Goods Manufacturing
159 144 (15) $73,055 0.34
325620 Toilet Preparation Manufacturing 40 143 103 $62,658 0.28
326299All Other Rubber Product Manufacturing
75 140 66 $66,359 0.65
311111 Dog and Cat Food Manufacturing 103 140 37 $78,753 0.52
327331Concrete Block and Brick Manufacturing
114 135 21 $100,388 0.80
334413Semiconductor and Related Device Manufacturing
95 130 35 $105,708 0.08
327215Glass Product Manufacturing Made of Purchased Glass
112 129 17 $67,717 0.31
336991Motorcycle, Bicycle, and Parts Manufacturing
93 127 34 $46,601 1.44
312230 Tobacco Manufacturing <10 124 Insf. Data $21,829 1.24
321911Wood Window and Door Manufacturing
42 123 81 $73,385 0.26
332311Prefabricated Metal Building and Component Manufacturing
104 123 19 $77,302 0.42
314120 Curtain and Linen Mills 116 123 6 $56,279 0.72333517 Machine Tool Manufacturing 51 122 71 $83,102 0.34

Emsi Q2 2021 Data Set | www.economicmodeling.com 11
327310 Cement Manufacturing 101 121 20 $109,570 0.96
334220Radio and Television Broadcasting and Wireless Communications Equipment Manufacturing
116 119 3 $110,993 0.26
332431 Metal Can Manufacturing 0 116 116 $88,201 0.69312120 Breweries 17 116 98 $48,976 0.15315210 Cut and Sew Apparel Contractors 36 113 77 $28,213 0.39
326191Plastics Plumbing Fixture Manufacturing
74 112 37 $61,561 0.89
331524Aluminum Foundries (except Die-Casting)
111 106 (6) $69,136 0.72
311514Dry, Condensed, and Evaporated Dairy Product Manufacturing
0 105 105 $74,406 0.64
311830 Tortilla Manufacturing 62 105 43 $39,064 0.59
333612Speed Changer, Industrial High-Speed Drive, and Gear Manufacturing
69 105 36 $93,434 0.99
339930 Doll, Toy, and Game Manufacturing 93 104 11 $56,843 0.89332510 Hardware Manufacturing 77 101 24 $47,911 0.46
326140Polystyrene Foam Product Manufacturing
75 101 26 $56,458 0.37
334310Audio and Video Equipment Manufacturing
33 98 64 $123,008 0.54
339910Jewelry and Silverware Manufacturing
136 98 (39) $66,377 0.44
324122Asphalt Shingle and Coating Materials Manufacturing
97 96 (1) $143,249 0.94
321999All Other Miscellaneous Wood Product Manufacturing
35 95 60 $25,597 0.33
332112 Nonferrous Forging 87 95 8 $82,747 1.36
336320Motor Vehicle Electrical and Electronic Equipment Manufacturing
101 94 (6) $67,180 0.17
333912Air and Gas Compressor Manufacturing
58 93 35 $108,088 0.53
337121Upholstered Household Furniture Manufacturing
31 93 62 $43,473 0.19
336111 Automobile Manufacturing 175 91 (84) $77,201 0.08
334515Instrument Manufacturing for Measuring and Testing Electricity and Electrical Signals
85 90 5 $66,624 0.26
333914Measuring, Dispensing, and Other Pumping Equipment Manufacturing
136 87 (50) $101,542 0.35
326220Rubber and Plastics Hoses and Belting Manufacturing
65 86 21 $69,785 0.44

Emsi Q2 2021 Data Set | www.economicmodeling.com 12
312140 Distilleries <10 86 Insf. Data $72,129 0.52
334416Capacitor, Resistor, Coil, Transformer, and Other Inductor Manufacturing
130 85 (44) $45,337 0.56
324110 Petroleum Refi neries 57 85 28 $155,828 0.14
331210Iron and Steel Pipe and Tube Manufacturing from Purchased Steel
0 84 84 $151,007 0.36
311119 Other Animal Food Manufacturing 46 83 36 $75,796 0.26
339940Offi ce Supplies (except Paper) Manufacturing
101 82 (19) $86,529 0.83
321992Prefabricated Wood Building Manufacturing
60 82 22 $55,643 0.53
334516Analytical Laboratory Instrument Manufacturing
166 80 (86) $111,090 0.22
336411 Aircraft Manufacturing <10 79 Insf. Data $63,303 0.04
322220Paper Bag and Coated and Treated Paper Manufacturing
133 78 (55) $67,963 0.16
339115 Ophthalmic Goods Manufacturing 209 77 (132) $58,186 0.36
333999All Other Miscellaneous General Purpose Machinery Manufacturing
151 76 (76) $79,382 0.21
326130Laminated Plastics Plate, Sheet (except Packaging), and Shape Manufacturing
<10 75 Insf. Data $56,383 0.42
334519Other Measuring and Controlling Device Manufacturing
71 74 3 $75,360 0.23
322121 Paper (except Newsprint) Mills <10 74 Insf. Data $117,362 0.15
311340Nonchocolate Confectionery Manufacturing
82 73 (9) $58,008 0.38
333991Power-Driven Handtool Manufacturing
30 71 41 $78,996 0.80
327992Ground or Treated Mineral and Earth Manufacturing
73 69 (4) $64,267 1.43
332721Precision Turned Product Manufacturing
201 69 (132) $49,253 0.19
322299All Other Converted Paper Product Manufacturing
43 69 26 $57,212 0.44
327999All Other Miscellaneous Nonmetallic Mineral Product Manufacturing
75 68 (7) $64,240 0.62
336330Motor Vehicle Steering and Suspension Components (except Spring) Manufacturing
11 67 56 $48,237 0.25
333415
Air-Conditioning and Warm Air Heating Equipment and Commercial and Industrial Refrigeration Equipment Manufacturing
161 67 (95) $79,716 0.08

Emsi Q2 2021 Data Set | www.economicmodeling.com 13
337122Nonupholstered Wood Household Furniture Manufacturing
48 66 18 $40,951 0.23
333514Special Die and Tool, Die Set, Jig, and Fixture Manufacturing
54 65 11 $82,505 0.12
335912 Primary Battery Manufacturing <10 65 Insf. Data $96,963 0.58312113 Ice Manufacturing 60 63 3 $54,101 1.00
332420Metal Tank (Heavy Gauge) Manufacturing
93 61 (32) $71,615 0.18
333241Food Product Machinery Manufacturing
<10 61 Insf. Data $70,074 0.35
332813Electroplating, Plating, Polishing, Anodizing, and Coloring
129 61 (69) $56,060 0.12
325211Plastics Material and Resin Manufacturing
<10 61 Insf. Data $84,005 0.11
322219Other Paperboard Container Manufacturing
20 60 40 $78,438 0.27
313230 Nonwoven Fabric Mills 58 58 0 $77,406 0.44
332912Fluid Power Valve and Hose Fitting Manufacturing
63 58 (6) $75,926 0.18
335314Relay and Industrial Control Manufacturing
14 57 44 $84,081 0.15
333511 Industrial Mold Manufacturing 22 57 35 $78,136 0.18
311999All Other Miscellaneous Food Manufacturing
30 57 27 $64,478 0.17
311710Seafood Product Preparation and Packaging
109 56 (52) $42,877 0.19
335122Commercial, Industrial, and Institutional Electric Lighting Fixture Manufacturing
39 56 17 $85,201 0.29
333249Other Industrial Machinery Manufacturing
11 56 44 $78,825 0.11
332991Ball and Roller Bearing Manufacturing
<10 56 Insf. Data $78,897 0.28
322211Corrugated and Solid Fiber Box Manufacturing
48 56 7 $80,506 0.06
332618Other Fabricated Wire Product Manufacturing
34 55 21 $77,505 0.25
311411Frozen Fruit, Juice, and Vegetable Manufacturing
<10 54 Insf. Data $51,086 0.20
334111 Electronic Computer Manufacturing 70 53 (17) $53,198 0.05
315240Women’s, Girls’, and Infants’ Cut and Sew Apparel Manufacturing
47 52 5 $30,995 0.31
325520 Adhesive Manufacturing 14 52 38 $104,290 0.26
Emsi Q2 2021 Data Set | www.economicmodeling.com 14
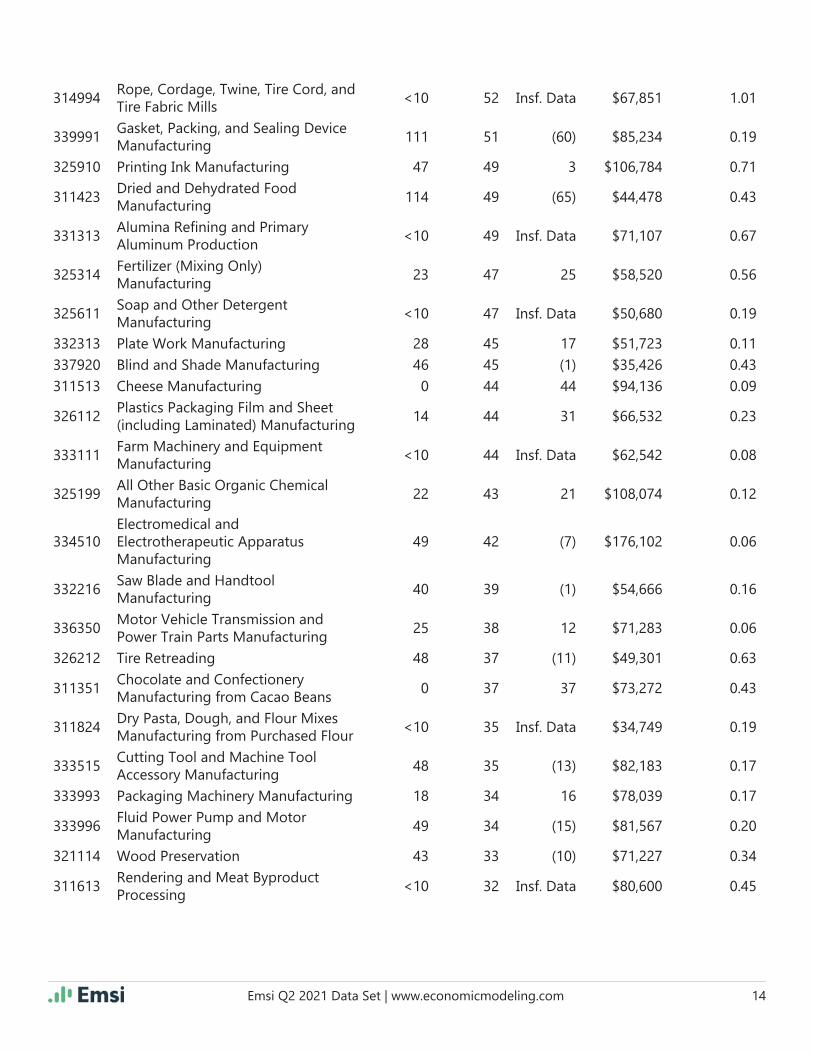
314994Rope, Cordage, Twine, Tire Cord, and Tire Fabric Mills
<10 52 Insf. Data $67,851 1.01
339991Gasket, Packing, and Sealing Device Manufacturing
111 51 (60) $85,234 0.19
325910 Printing Ink Manufacturing 47 49 3 $106,784 0.71
311423Dried and Dehydrated Food Manufacturing
114 49 (65) $44,478 0.43
331313Alumina Refi ning and Primary Aluminum Production
<10 49 Insf. Data $71,107 0.67
325314Fertilizer (Mixing Only) Manufacturing
23 47 25 $58,520 0.56
325611Soap and Other Detergent Manufacturing
<10 47 Insf. Data $50,680 0.19
332313 Plate Work Manufacturing 28 45 17 $51,723 0.11337920 Blind and Shade Manufacturing 46 45 (1) $35,426 0.43311513 Cheese Manufacturing 0 44 44 $94,136 0.09
326112Plastics Packaging Film and Sheet (including Laminated) Manufacturing
14 44 31 $66,532 0.23
333111Farm Machinery and Equipment Manufacturing
<10 44 Insf. Data $62,542 0.08
325199All Other Basic Organic Chemical Manufacturing
22 43 21 $108,074 0.12
334510Electromedical and Electrotherapeutic Apparatus Manufacturing
49 42 (7) $176,102 0.06
332216Saw Blade and Handtool Manufacturing
40 39 (1) $54,666 0.16
336350Motor Vehicle Transmission and Power Train Parts Manufacturing
25 38 12 $71,283 0.06
326212 Tire Retreading 48 37 (11) $49,301 0.63
311351Chocolate and Confectionery Manufacturing from Cacao Beans
0 37 37 $73,272 0.43
311824Dry Pasta, Dough, and Flour Mixes Manufacturing from Purchased Flour
<10 35 Insf. Data $34,749 0.19
333515Cutting Tool and Machine Tool Accessory Manufacturing
48 35 (13) $82,183 0.17
333993 Packaging Machinery Manufacturing 18 34 16 $78,039 0.17
333996Fluid Power Pump and Motor Manufacturing
49 34 (15) $81,567 0.20
321114 Wood Preservation 43 33 (10) $71,227 0.34
311613Rendering and Meat Byproduct Processing
<10 32 Insf. Data $80,600 0.45

Emsi Q2 2021 Data Set | www.economicmodeling.com 15
315990Apparel Accessories and Other Apparel Manufacturing
23 32 9 $29,961 0.28
336340Motor Vehicle Brake System Manufacturing
<10 32 Insf. Data $68,837 0.16
337910 Mattress Manufacturing 73 30 (43) $29,714 0.15
315280Other Cut and Sew Apparel Manufacturing
<10 29 Insf. Data $32,503 0.26
332215Metal Kitchen Cookware, Utensil, Cutlery, and Flatware (except Precious) Manufacturing
<10 29 Insf. Data $47,764 0.35
333995Fluid Power Cylinder and Actuator Manufacturing
<10 29 Insf. Data $51,981 0.19
332811 Metal Heat Treating 14 27 14 $86,626 0.16
333994Industrial Process Furnace and Oven Manufacturing
<10 27 Insf. Data $66,342 0.31
335929Other Communication and Energy Wire Manufacturing
52 26 (26) $98,367 0.25
324121Asphalt Paving Mixture and Block Manufacturing
11 26 15 $135,277 0.18
327332 Concrete Pipe Manufacturing 0 26 26 $70,504 0.35
334412Bare Printed Circuit Board Manufacturing
<10 26 Insf. Data $64,445 0.10
336211 Motor Vehicle Body Manufacturing 52 25 (27) $64,426 0.05327993 Mineral Wool Manufacturing 32 25 (7) $78,153 0.17
325612Polish and Other Sanitation Good Manufacturing
20 25 5 $74,654 0.11
326291Rubber Product Manufacturing for Mechanical Use
30 25 (5) $54,079 0.09
327120Clay Building Material and Refractories Manufacturing
10 25 14 $58,956 0.12
333922Conveyor and Conveying Equipment Manufacturing
25 24 (1) $86,387 0.08
334210 Telephone Apparatus Manufacturing 18 24 6 $72,844 0.15
334614Software and Other Prerecorded Compact Disc, Tape, and Record Reproducing
<10 24 Insf. Data $145,915 0.29
316998All Other Leather Good and Allied Product Manufacturing
42 23 (20) $13,976 0.23
311615 Poultry Processing 0 22 22 $50,980 0.01
335313Switchgear and Switchboard Apparatus Manufacturing
49 21 (28) $96,488 0.07
332913Plumbing Fixture Fitting and Trim Manufacturing
<10 21 Insf. Data $55,996 0.20

Emsi Q2 2021 Data Set | www.economicmodeling.com 16
325991Custom Compounding of Purchased Resins
24 21 (4) $93,902 0.13
334512Automatic Environmental Control Manufacturing for Residential, Commercial, and Appliance Use
82 21 (61) $65,993 0.16
339114Dental Equipment and Supplies Manufacturing
19 20 2 $56,644 0.15
334517 Irradiation Apparatus Manufacturing 0 19 19 $116,296 0.15
311813Frozen Cakes, Pies, and Other Pastries Manufacturing
0 19 19 $48,469 0.17
323120 Support Activities for Printing 89 19 (70) $114,823 0.10
311930Flavoring Syrup and Concentrate Manufacturing
14 18 3 $118,787 0.25
323117 Books Printing <10 17 Insf. Data $47,088 0.12
336999All Other Transportation Equipment Manufacturing
<10 15 Insf. Data $47,517 0.10
332439Other Metal Container Manufacturing
140 14 (126) $49,898 0.11
334613Blank Magnetic and Optical Recording Media Manufacturing
23 14 (9) $60,461 0.47
333120Construction Machinery Manufacturing
<10 14 Insf. Data $92,154 0.02
332992Small Arms Ammunition Manufacturing
17 13 (4) $47,066 0.14
337211Wood Offi ce Furniture Manufacturing
20 12 (9) $40,383 0.07
336510 Railroad Rolling Stock Manufacturing <10 12 Insf. Data $125,613 0.06
332993Ammunition (except Small Arms) Manufacturing
0 11 11 $47,358 0.09
336414Guided Missile and Space Vehicle Manufacturing
131 10 (121) $101,434 0.02
311225 Fats and Oils Refi ning and Blending 0 10 10 $57,293 0.16
334290Other Communications Equipment Manufacturing
62 <10 Insf. Data Insf. Data 0.01
316110Leather and Hide Tanning and Finishing
13 <10 Insf. Data Insf. Data 0.18
334118Computer Terminal and Other Computer Peripheral Equipment Manufacturing
91 <10 Insf. Data Insf. Data 0.01
321113 Sawmills <10 <10 Insf. Data Insf. Data 0.00325120 Industrial Gas Manufacturing 21 <10 Insf. Data Insf. Data 0.03339992 Musical Instrument Manufacturing <10 <10 Insf. Data Insf. Data 0.02

Emsi Q2 2021 Data Set | www.economicmodeling.com 17
315220Men’s and Boys’ Cut and Sew Apparel Manufacturing
<10 <10 Insf. Data Insf. Data 0.05
334514Totalizing Fluid Meter and Counting Device Manufacturing
77 <10 Insf. Data Insf. Data 0.03
324199All Other Petroleum and Coal Products Manufacturing
0 <10 Insf. Data Insf. Data 0.19
321912Cut Stock, Resawing Lumber, and Planing
<10 <10 Insf. Data Insf. Data 0.01
324191Petroleum Lubricating Oil and Grease Manufacturing
28 <10 Insf. Data Insf. Data 0.01
335121Residential Electric Lighting Fixture Manufacturing
38 <10 Insf. Data Insf. Data 0.13
337125Household Furniture (except Wood and Metal) Manufacturing
0 <10 Insf. Data Insf. Data 0.20
337124Metal Household Furniture Manufacturing
0 <10 Insf. Data Insf. Data 0.01
335129Other Lighting Equipment Manufacturing
<10 <10 Insf. Data Insf. Data 0.12
321991Manufactured Home (Mobile Home) Manufacturing
0 <10 Insf. Data Insf. Data 0.01
335220Major Household Appliance Manufacturing
0 <10 Insf. Data Insf. Data 0.01
335312 Motor and Generator Manufacturing 67 <10 Insf. Data Insf. Data 0.02
311224Soybean and Other Oilseed Processing
18 <10 Insf. Data Insf. Data 0.04
336612 Boat Building <10 <10 Insf. Data Insf. Data 0.02322122 Newsprint Mills 0 <10 Insf. Data Insf. Data 0.03
336360Motor Vehicle Seating and Interior Trim Manufacturing
0 <10 Insf. Data Insf. Data 0.01
335210Small Electrical Appliance Manufacturing
<10 <10 Insf. Data Insf. Data 0.01
316992Women's Handbag and Purse Manufacturing
22 <10 Insf. Data Insf. Data 0.90
333997 Scale and Balance Manufacturing 0 <10 Insf. Data Insf. Data 0.04
325320Pesticide and Other Agricultural Chemical Manufacturing
0 <10 Insf. Data Insf. Data 0.02
314110 Carpet and Rug Mills 0 <10 Insf. Data Insf. Data 0.04
311911Roasted Nuts and Peanut Butter Manufacturing
0 <10 Insf. Data Insf. Data 0.02
332613 Spring Manufacturing 14 <10 Insf. Data Insf. Data 0.07
332919Other Metal Valve and Pipe Fitting Manufacturing
34 <10 Insf. Data Insf. Data 0.05

Emsi Q2 2021 Data Set | www.economicmodeling.com 18
332996Fabricated Pipe and Pipe Fitting Manufacturing
38 <10 Insf. Data Insf. Data 0.02
312130 Wineries 16 <10 Insf. Data Insf. Data 0.01
333131Mining Machinery and Equipment Manufacturing
<10 <10 Insf. Data Insf. Data 0.07
333132Oil and Gas Field Machinery and Equipment Manufacturing
0 <10 Insf. Data Insf. Data 0.00
333244Printing Machinery and Equipment Manufacturing
32 <10 Insf. Data Insf. Data 0.02
333414Heating Equipment (except Warm Air Furnaces) Manufacturing
20 <10 Insf. Data Insf. Data 0.02
331110Iron and Steel Mills and Ferroalloy Manufacturing
<10 <10 Insf. Data Insf. Data 0.01
327110Pottery, Ceramics, and Plumbing Fixture Manufacturing
108 <10 Insf. Data Insf. Data 0.01
333314Optical Instrument and Lens Manufacturing
53 <10 Insf. Data Insf. Data 0.04
333992Welding and Soldering Equipment Manufacturing
0 <10 Insf. Data Insf. Data 0.00
333923Overhead Traveling Crane, Hoist, and Monorail System Manufacturing
<10 <10 Insf. Data Insf. Data 0.02
336611 Ship Building and Repairing 0 0 0 $0 0.00
326211Tire Manufacturing (except Retreading)
48 0 (48) $0 0.00
313240 Knit Fabric Mills 0 0 0 $0 0.00331511 Iron Foundries 0 0 0 $0 0.00
336992Military Armored Vehicle, Tank, and Tank Component Manufacturing
0 0 0 $0 0.00
322110 Pulp Mills 0 0 0 $0 0.00313310 Textile and Fabric Finishing Mills 0 0 0 $0 0.00
321213Engineered Wood Member (except Truss) Manufacturing
0 0 0 $0 0.00
339993Fastener, Button, Needle, and Pin Manufacturing
<10 0 Insf. Data $0 0.00
336419Other Guided Missile and Space Vehicle Parts and Auxiliary Equipment Manufacturing
0 0 0 $0 0.00
339994Broom, Brush, and Mop Manufacturing
0 0 0 $0 0.00
336415Guided Missile and Space Vehicle Propulsion Unit and Propulsion Unit Parts Manufacturing
0 0 0 $0 0.00

Emsi Q2 2021 Data Set | www.economicmodeling.com 19
331523Nonferrous Metal Die-Casting Foundries
<10 0 Insf. Data $0 0.00
331529Other Nonferrous Metal Foundries (except Die-Casting)
0 0 0 $0 0.00
332111 Iron and Steel Forging <10 0 Insf. Data $0 0.00322130 Paperboard Mills 0 0 0 $0 0.00339995 Burial Casket Manufacturing 0 0 0 $0 0.00331513 Steel Foundries (except Investment) <10 0 Insf. Data $0 0.00
327212Other Pressed and Blown Glass and Glassware Manufacturing
<10 0 Insf. Data $0 0.00
327910 Abrasive Product Manufacturing 0 0 0 $0 0.00
331314Secondary Smelting and Alloying of Aluminum
0 0 0 $0 0.00
311212 Rice Milling 0 0 0 $0 0.00316210 Footwear Manufacturing <10 0 Insf. Data $0 0.00
321212Softwood Veneer and Plywood Manufacturing
0 0 0 $0 0.00
321211Hardwood Veneer and Plywood Manufacturing
0 0 0 $0 0.00
331221 Rolled Steel Shape Manufacturing <10 0 Insf. Data $0 0.00331222 Steel Wire Drawing 19 0 (19) $0 0.00327211 Flat Glass Manufacturing 0 0 0 $0 0.00311213 Malt Manufacturing 0 0 0 $0 0.00
331420Copper Rolling, Drawing, Extruding, and Alloying
0 0 0 $0 0.00
331315Aluminum Sheet, Plate, and Foil Manufacturing
<10 0 Insf. Data $0 0.00
336370 Motor Vehicle Metal Stamping 0 0 0 $0 0.00313110 Fiber, Yarn, and Thread Mills 0 0 0 $0 0.00311221 Wet Corn Milling 0 0 0 $0 0.00
331318Other Aluminum Rolling, Drawing, and Extruding
0 0 0 $0 0.00
311211 Flour Milling 0 0 0 $0 0.00313210 Broadwoven Fabric Mills 25 0 (25) $0 0.00311313 Beet Sugar Manufacturing 0 0 0 $0 0.00336213 Motor Home Manufacturing 0 0 0 $0 0.00313320 Fabric Coating Mills 95 0 (95) $0 0.00325312 Phosphatic Fertilizer Manufacturing <10 0 Insf. Data $0 0.00
325413In-Vitro Diagnostic Substance Manufacturing
<10 0 Insf. Data $0 0.00
315110 Hosiery and Sock Mills 0 0 0 $0 0.00325110 Petrochemical Manufacturing 0 0 0 $0 0.00
Emsi Q2 2021 Data Set | www.economicmodeling.com 20
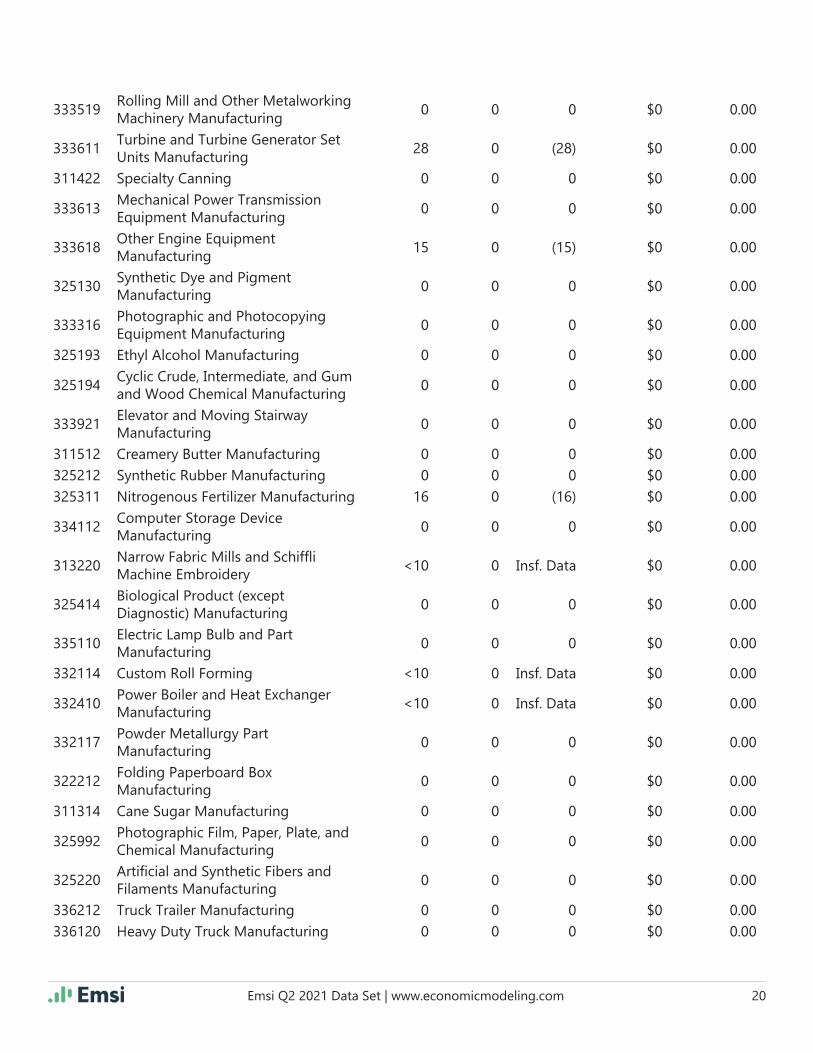
333519Rolling Mill and Other Metalworking Machinery Manufacturing
0 0 0 $0 0.00
333611Turbine and Turbine Generator Set Units Manufacturing
28 0 (28) $0 0.00
311422 Specialty Canning 0 0 0 $0 0.00
333613Mechanical Power Transmission Equipment Manufacturing
0 0 0 $0 0.00
333618Other Engine Equipment Manufacturing
15 0 (15) $0 0.00
325130Synthetic Dye and Pigment Manufacturing
0 0 0 $0 0.00
333316Photographic and Photocopying Equipment Manufacturing
0 0 0 $0 0.00
325193 Ethyl Alcohol Manufacturing 0 0 0 $0 0.00
325194Cyclic Crude, Intermediate, and Gum and Wood Chemical Manufacturing
0 0 0 $0 0.00
333921Elevator and Moving Stairway Manufacturing
0 0 0 $0 0.00
311512 Creamery Butter Manufacturing 0 0 0 $0 0.00325212 Synthetic Rubber Manufacturing 0 0 0 $0 0.00325311 Nitrogenous Fertilizer Manufacturing 16 0 (16) $0 0.00
334112Computer Storage Device Manufacturing
0 0 0 $0 0.00
313220Narrow Fabric Mills and Schiffl i Machine Embroidery
<10 0 Insf. Data $0 0.00
325414Biological Product (except Diagnostic) Manufacturing
0 0 0 $0 0.00
335110Electric Lamp Bulb and Part Manufacturing
0 0 0 $0 0.00
332114 Custom Roll Forming <10 0 Insf. Data $0 0.00
332410Power Boiler and Heat Exchanger Manufacturing
<10 0 Insf. Data $0 0.00
332117Powder Metallurgy Part Manufacturing
0 0 0 $0 0.00
322212Folding Paperboard Box Manufacturing
0 0 0 $0 0.00
311314 Cane Sugar Manufacturing 0 0 0 $0 0.00
325992Photographic Film, Paper, Plate, and Chemical Manufacturing
0 0 0 $0 0.00
325220Artifi cial and Synthetic Fibers and Filaments Manufacturing
0 0 0 $0 0.00
336212 Truck Trailer Manufacturing 0 0 0 $0 0.00336120 Heavy Duty Truck Manufacturing 0 0 0 $0 0.00

Emsi Q2 2021 Data Set | www.economicmodeling.com 21
336112Light Truck and Utility Vehicle Manufacturing
0 0 0 $0 0.00
315190 Other Apparel Knitting Mills 0 0 0 $0 0.00
333243Sawmill, Woodworking, and Paper Machinery Manufacturing
<10 0 Insf. Data $0 0.00
335991Carbon and Graphite Product Manufacturing
0 0 0 $0 0.00
335932Noncurrent-Carrying Wiring Device Manufacturing
0 0 0 $0 0.00
325920 Explosives Manufacturing 0 0 0 $0 0.00325613 Surface Active Agent Manufacturing 0 0 0 $0 0.00335921 Fiber Optic Cable Manufacturing 0 0 0 $0 0.00311611 Animal (except Poultry) Slaughtering 0 0 0 $0 0.00
333112Lawn and Garden Tractor and Home Lawn and Garden Equipment Manufacturing
0 0 0 $0 0.00
333242Semiconductor Machinery Manufacturing
0 0 0 $0 0.00
327213 Glass Container Manufacturing 0 0 0 $0 0.0039,633 58,843 19,210 $80,294

Emsi Q2 2021 Data Set | www.economicmodeling.com 22
Data Sources and Calculations
Industry DataEmsi industry data have various sources depending on the class of worker. (1) For QCEW Employees, Emsi primarily uses the QCEW (Quarterly Census of Employment and Wages), with supplemental estimates from County Business Patterns. (2) Non-QCEW employees data are based on a number of sources including QCEW, Current Employment Statistics, County Business Patterns, BEA State and Local Personal Income reports, the National Industry-Occupation Employment Matrix (NIOEM), the American Community Survey, and Railroad Retirement Board statistics. (3) Self-Employed and Extended Proprietor classes of worker data are primarily based on the American Community Survey, Nonemployer Statistics, and BEA State and Local Personal Income Reports. Projections for QCEW and Non-QCEW Employees are informed by NIOEM and long-term industry projections published by individual states.
Input-Output DataThe input-output model in this report is Emsi’s gravitational fl ows multi-regional social account matrix model (MR-SAM). It is based on data from the Census Bureau’s Current Population Survey and American Community Survey; as well as the Bureau of Economic Analysis’ National Income and Product Accounts, Input-Output Make and Use Tables, and Gross State Product data. In addition, several Emsi in-house data sets are used, as well as data from Oak Ridge National Labs on the cost of transportation between counties.
Staffi ng Patterns DataThe staffi ng pattern data in this report are compiled from several sources using a specialized process. For QCEW and Non-QCEW Employees classes of worker, sources include Occupational Employment Statistics, the National Industry-Occupation Employment Matrix, and the American Community Survey. For the Self-Employed and Extended Proprietors classes of worker, the primary source is the American Community Survey, with a small amount of information from Occupational Employment Statistics.
State Data SourcesThis report uses state data from the following agencies: Nevada Department of Employment, Training and Rehabilitation