
Networking as a Barrier to Entry and the Competitive...
48
Networking as a Barrier to Entry and the Competitive Supply of Venture Capital *† Yael Hochberg Alexander Ljungqvist Kellogg School of Management Stern School of Business Northwestern University New York University and CEPR Yang Lu Stern School of Business New York University May 6, 2007 * Thanks for helpful comments and suggestions go to John Asker, Ola Bengtsson, Jan Eberly, Shane Greenstein, Arvind Krishnamurthy, Laura Lindsey, Andrew Metrick (our AFA discussant), Leslie Papke, Mitchell Petersen, David Scharfstein (our EVI discussant), Morten Sørensen, Scott Stern, Per Strömberg (our RICAFE2 discussant), Toby Stuart (our NBER discussant), Toni Whited, Jeffrey Wooldridge, and seminar participants at the European Central Bank, Cornell University, Northwestern University, the University of Texas at Austin, the City University of New York, Hong Kong University of Science and Technology, the University of Pittsburgh, the University of Wisconsin-Madison, the Australian National University, the University of Zurich, the Berkley Workshop at New York University, the 2007 American Finance Association meeting, the 2006 RICAFE2 Conference at the LSE, the Third EVI Conference at Harvard University, the 2006 NBER Entrepreneurship Meetings, and the 2007 Next Generation Conference at LBS. Lu gratefully acknowledges funding from the Ewing Marion Kauffman Foundation. † Address correspondence to: [email protected] (Hochberg), [email protected] (Ljungqvist), or [email protected] (Lu).
Transcript of Networking as a Barrier to Entry and the Competitive...

Networking as a Barrier to Entry
and the Competitive Supply of Venture Capital * †
Yael Hochberg Alexander Ljungqvist Kellogg School of Management Stern School of Business
Northwestern University New York Universityand CEPR
Yang LuStern School of Business
New York University
May 6, 2007
* Thanks for helpful comments and suggestions go to John Asker, Ola Bengtsson, Jan Eberly, Shane Greenstein, Arvind Krishnamurthy, Laura Lindsey, Andrew Metrick (our AFA discussant), Leslie Papke, Mitchell Petersen, David Scharfstein (our EVI discussant), Morten Sørensen, Scott Stern, Per Strömberg (our RICAFE2 discussant), Toby Stuart (our NBER discussant), Toni Whited, Jeffrey Wooldridge, and seminar participants at the European Central Bank, Cornell University, Northwestern University, the University of Texas at Austin, the City University of New York, Hong Kong University of Science and Technology, the University of Pittsburgh, the University of Wisconsin-Madison, the Australian National University, the University of Zurich, the Berkley Workshop at New York University, the 2007 American Finance Association meeting, the 2006 RICAFE2 Conference at the LSE, the Third EVI Conference at Harvard University, the 2006 NBER Entrepreneurship Meetings, and the 2007 Next Generation Conference at LBS. Lu gratefully acknowledges funding from the Ewing Marion Kauffman Foundation. † Address correspondence to: [email protected] (Hochberg), [email protected] (Ljungqvist), or [email protected] (Lu).

Networking as a Barrier to Entry
and the Competitive Supply of Venture Capital
Abstract
We examine whether networks among incumbent venture capital firms help restrict entryinto local VC markets in the U.S., thus improving VCs’ bargaining power over entrepreneurs. We show that VC markets with more extensive networking among the incumbent players experience less entry. The effect is sizeable economically and appearsrobust to plausible endogeneity concerns. Entry is accommodated if the entrant has established relationships with a target-market incumbent in its own home market. In turn, incumbents react strategically to an increased threat of entry, in the sense that they freeze out any incumbent that builds a relationship with a potential entrant. Finally, companiesseeking venture capital raise money on worse terms in more densely networked marketswhile increased entry is associated with higher valuations.
Key words: Venture Capital, Start-up Financing, Networks, Syndication, Barriers to Entry, Entry Deterrence.
JEL classification: G24, L13, L14, L22, L84.

Entrepreneurship and innovation are commonly considered key determinants of an economy’s
capacity for wealth creation, job growth, and competitiveness. Venture capitalists serve a vital
economic function by identifying, funding, and nurturing promising entrepreneurs, though
whether they provide capital and services on competitive terms is much debated. In this paper,
we examine whether U.S. venture capital firms engage in practices designed to increase their
bargaining power over entrepreneurs, by restricting entry into local VC markets, such as Silicon
Valley in California or Route 128 in Massachusetts. Our results are consistent with the
hypothesis that incumbents engage in strategic behavior that reduces entry and benefit from
doing so through paying lower prices for their investments.
What does it take to enter a local VC market? There are no obvious natural or regulatory
barriers to entry; VCs are free to open offices in any location they choose. But to do deals in
what is, after all, a relatively opaque and above all private market, they need to be visible to local
entrepreneurs who, moreover, must consider them a credible funding source worth approaching.
If entrants wish to be proactive about sourcing deal flow, they need access to information about
promising ideas, trends, and people, preferably ahead of other VCs. And once they have found
start-ups to back, they need local knowledge and connections to provide them with “value-added
services”, such as help identifying managerial talent, suppliers, or customers.
Having to establish visibility, credibility, access to information, and local knowledge from
scratch puts entrants at an obvious cost and time disadvantage relative to incumbents, but this
ignores an additional important advantage to incumbency, namely network externalities. VCs
routinely cooperate by referring deals and people to each other, helping to put funding together
through investment syndicates, providing introductions to suppliers or customers, and sharing
their resources in other ways. Indeed, they may sometimes do so specifically to raise the cost of

2
entry. For instance, by referring promising deals they cannot fund themselves to their friends,
incumbent VCs may be able to reduce the time entrepreneurs spend searching for funding, with
the result that entrants are less likely to see the deal flow (Inderst and Mueller (2004)). Or they
may refuse to join an entrant’s syndicate, making it harder for the entrant to assemble funding for
any deal that requires syndication, perhaps due to its size or risk profile.
If life as a VC is easier for those who are already members of the club, perhaps the most cost-
effective way to enter a VC market is to gain an incumbent’s cooperation – in the form of access
to the incumbent’s information, expertise, or contacts – with a view to eventually gaining
admission to the club. This raises two questions: What incentives does an incumbent have to
cooperate with an entrant? And how will other incumbents react?
The most obvious inducement an entrant can offer in return for cooperation in the target
market is access to its home market. Thus, entry may involve an element of reciprocity. That
benefits the cooperating incumbent but must be balanced against any negative reaction from the
other incumbents. More formally, consider a group of incumbent VCs, each of which maximizes
its profit while considering the effect of its actions on the behavior of the others. Individually,
each VC chooses whether or not to cooperate with an entrant trying to break into the market. If
an incumbent chooses to cooperate, it expects to be punished by the other incumbents. The
resulting Nash equilibrium is a function of the expected severity of punishment. The harsher is
expected punishment, the more likely it is that incumbents will refrain from helping entrants. An
incumbent’s dominant strategy then depends on the gain from dealing with an entrant (such as
reciprocal access to the entrant’s home market), the expected punishment (such as refusal to
cooperate with the deviating VC for one or more periods), and (because coordinating punishment
becomes harder the more incumbents there are) the number of incumbents.

3
While many forms of cooperation are not observable, it is possible to use data on syndication
relationships to proxy for how interdependent incumbents have chosen to be. VC firms that are
prone to sharing their investments with other incumbents presumably also share other network
resources.1 All else equal, we expect more densely networked markets to be harder to enter, not
only because of the relatively greater network externalities that incumbents (but not entrants)
enjoy in such markets, but also because withdrawal of network access (“suspension from the
club”) may provide an effective threat of punishment against the offender.2
Our results are consistent with the hypothesis that networking among venture capitalists
reduces entry. First, we find that there is less entry in VC markets in which incumbents are more
tightly networked with each other, as evidenced by their past syndication patterns. The
magnitude of the effect is large: Controlling for other likely determinants of market entry, a one-
standard deviation increase in the extent to which incumbents are networked (using measures
borrowed from economic sociology) reduces the number of entrants in the median market by
around a third.
The networking patterns we observe in the data may not be exogenous; rather, they may
reflect omitted variables affecting both networking and entry. For example, unobserved variation
in the cost of doing business in a given industry or location could induce networking (say, to
economize on information costs) and independently reduce entry. To correct for this potential
endogeneity problem, we follow two approaches. First, we use instrumental variables motivated
by non-strategic and mechanical determinants of syndication decisions. This strengthens our
1 Reasons to syndicate include pooling capital and diversifying risk (Lerner (1994)), improved screening (Sah andStiglitz (1986)), obtaining access to other VCs’ deal flow on a reciprocal basis (Lerner (1994)), and the ability todraw on the expertise of other VCs when nurturing investments (Brander, Amit, and Antweiler (2002)).2 Anecdotal evidence supports a link between entry and networking. Kuemmerle and Ellis (1999) report that whenplanning its ultimately successful entry into the U.S. venture capital market, the president of Japan-based JAFCOLtd. “suspected that the densely networked U.S. VC industry would present considerable barriers to entry.”

4
results. Second, we exploit the nested-panel structure of our data to identify omitted time-varying
factors that are either location-specific or industry-specific. This produces results that are very
similar to the IV estimates.
Our second test focuses on the probability that a potential entrant successfully enters a
market. Strong networks among the incumbents in the target market reduce the likelihood of
entry. But not every potential entrant is deterred. Controlling for geographic proximity to the
target market and prior experience in the industry (which each double the likelihood of entry),
we find that a potential entrant is significantly more likely to enter if it has previously established
ties to incumbents through inviting them into syndicates in its own home market. Moreover, it is
with these very same incumbents that the entrant does business in the target market. In the
context of the entry deterrence game sketched out above, this suggests that incumbents deviate
from the strategy of non-cooperation with entrants when the gain from deviating – reciprocal
access to the entrant’s home market – is sufficiently tempting.
The cost of deviation is punishment, in the form of reduced syndication opportunities with
fellow incumbents. We show that after doing business with a potential entrant, an incumbent’s
probability of being invited into fellow incumbents’ syndicates decreases considerably and
significantly for up to five years after the event. This effect is concentrated in markets with a
small number of incumbents, consistent with the notion that punishment invites free-riding and
so is viable only with a small number of players.
Finally, we examine the price effect of reduced entry by comparing the valuations of
companies receiving VC funding in relatively more protected and relatively more open markets.
Controlling as best we can for other value drivers, we find that valuations are significantly lower
in more densely networked markets: A one-standard deviation increase in our networking

5
measures is associated with an around 10% decrease in valuation, from the mean of $25.6
million. This indicates that incumbent VCs benefit from reduced entry through paying lower
prices for their investments. On the other hand, the more market share entrants can capture, the
higher are the valuations paid in a market in the following year, suggesting that entry is pro-
competitive and, at least in that sense, benefits entrepreneurs.
Our contribution is threefold. First, we provide evidence that networking can have the effect
of reducing entry in the VC market. We believe that our results may generalize to other
industries that make heavy use of networks, such as investment banking. Second, our results help
explain prior empirical evidence that better networked VCs enjoy better performance (see
Hochberg, Ljungqvist, and Lu (2007)). Part of the explanation for this may be due to the lower
prices VCs pay for their investments in more densely networked markets. Third, we shed light on
the process of entry in the VC industry. Successful entry appears to involve “joining the club” by
offering the incumbents syndication opportunities in one’s home market. This is interesting in
light of Lerner’s (1994) observation that “the process through which some of the entrants joined
the core of established venture organizations remains unclear.”
I. Sample and Data
Most of our data comes from Thomson Financial’s Venture Economics (VE) database. We
consider all investments in U.S. companies made by U.S. based VC funds between 1975 and
2003 that are included in the VE database. We exclude investments by angels and buyout funds.
A. Market Definitions
Sorenson and Stuart (2001) show that VCs tend to specialize in a certain industry and to
invest locally, not least because VC investments require substantial monitoring and active
management. Thus, the VC industry appears to be segmented into industry-specific, localized

6
markets. We use the six broad industry groups defined by Venture Economics3 and cross each
with either states or metropolitan statistical areas (MSAs), giving two alternative market
definitions. States usually cover larger geographic areas, resulting in a broader market definition,
while MSAs can usefully aggregate economic activity across borders (e.g., the tristate area
around New York City). In practice, our results are nearly identical using either definition.
For inclusion in the sample, a market-year must have a history of at least 25 investments in
the prior five years (to exclude markets with no real history of VC investment) and at least five
VC deals in the year of analysis (to exclude inactive markets). This results in 129 distinct
state/industry markets and 130 distinct MSA/industry markets. Our panels have between one and
24 annual observations for each market. The state/industry and MSA/industry panels are nested
in the sense that there are multiple industries for each location in year t, and vice versa for each
industry. The total number of market-years is 1,375 using states and 1,292 using MSAs.
B. Incumbents and Entrants
We define incumbents as VC firms that have invested in the target market at some time prior
to year t and continue to have investments in the market as of year t. Entrants are defined as VC
firms that invest in the market for the first time in year t.4 Entrants are not necessarily
inexperienced “rookies”; for the most part, they are themselves incumbents in other markets, and
they may well be more experienced than the marginal incumbent in the target market.
To measure the extent of entry in a market in year t, we code four variables:
3 Of the 19,012 portfolio companies in the sample, 40.6% are “Computer related”, 25.3% are “Non-high-technology,” 15.4% are “Communications and media,” 9.4% are “Medical, health, life sciences,” 5.4% are “Semiconductors, other electronics,” and 3.8% are “Biotechnology.”4 For robustness purposes, we also consider as entrants firms for which some amount of time has passed since theirlast investment in a market. Our results are robust to considering a range of time limits on prior investment history.

7
(a) the number of deals lead-managed by entrants in the market;5
(b) the number of entrants in the market;
(c) the number of entrants that lead-manage deals in the market; and
(d) the fraction of deals lead-managed by entrants in the market.
Table I, Panel A reports descriptive statistics for entrants and incumbents, separately for
state/industry and MSA/industry markets. In the median state-market-year, there are 15
incumbents and nine entrants, five of which enter by leading syndicates for one deal each, giving
a combined market share of 28.6%. In the median MSA-market-year, there are 16 incumbents
and eight entrants, four of which enter by leading one deal each with a market share of 25%.
C. Market-level Network Measures
Social network analysis provides a convenient way to measure how interconnected
incumbents are in a market.6 Consider the markets shown in Figures 1 and 2. Figure 1 graphs the
network that arises from syndication of investments in computer-related companies located in
Michigan over the five-year window 1979-1983. Nodes represent VC firms and arrows represent
syndicate ties.7 Arrows point from the VC leading a syndicate to the non-lead member. (Two-
headed arrows indicate that each VC has led a syndicate in which the other was a non-lead
member.) Figure 2 shows the non-high-tech VC network in Pennsylvania in 1990-1994. Visual
inspection suggests that the network in Figure 1 is dense; every VC firm has at least one tie to
one or more VCs. In contrast, the network illustrated in Figure 2 is sparse; only two of the VC
firms in this market have a tie to another VC.
5 In common with the VC literature, a deal is defined as a collection of investments in a given portfolio company ina specific round of financing. We identify the lead as the investor making the largest investment in the round.6 See Wasserman and Faust (1997) for a detailed review of network analysis methods. See Hochberg, Ljungqvist,and Lu (2007) for an application to venture capital.7 Venture Economics distinguishes between VC funds and management firms. A VC fund has a limited (usually ten-year) life, so we assume relationships reside at the level of the VC firm.

8
Networks can be represented in matrix form. Cells reflect whether two VCs co-invested in
the same portfolio company, and can be coded in one of two ways. The “undirected” matrix
records as a tie any participation by both VC firms i and j in a syndicate. The “directed” matrix
differentiates between syndicates led by VC i versus those led by VC j.8 (Figures 1 and 2
illustrate directed networks.) A natural measure of how interconnected incumbents are is the
proportion of all logically possible ties that are actually present in their market, called density.
For example, the maximum number of undirected ties among three incumbents A, B, and C is
three – everyone is tied to everyone else. If only A and C are connected to each other, the density
is 1/3 (one tie out of the three possible).
Formally, in an undirected network of n actors, the number of logically possible ties is ½n(n-
1); in a directed network, it is n(n-1). Let pijm=1 if at least one syndication relationship exists
between VCs i and j in market m, and zero otherwise. Then the density of the undirected network
equals j i pijm / (n(n-1)). Let qijm=1 if at least one syndication relationship exists in market m in
which VC i was the lead investor and VC j was a syndicate member, and zero otherwise. The
density of the directed network then equals j i qijm / (n(n-1)).
In common with the industrial organization literature, we focus on relationships among the
dominant incumbents and ignore ties among the competitive fringe, reasoning that the latter do
not reflect an attempt to deter entry. We classify an incumbent as dominant if the VC firm is
among the group of firms that contribute the first 80% of invested dollars in the target market
measured over the prior five-year window; our results are not sensitive to this choice of cut-off.
VC firms that enter a market eventually become incumbents. To capture this dynamic, we
construct a new network for each market for each year t, using data on syndications among the
8 Unlike the undirected matrix, the directed matrix does not record a tie between VCs j and k who were members ofthe same syndicate if neither led the syndicate in question.

9
incumbents over the five years ending in t-1. Table I, Panel B reports descriptive statistics. The
density of directed and undirected ties in the average state/industry market is 2.1% and 7.8% of
its theoretical maximum, respectively (densities computed for MSA/industry pairs are somewhat
larger). To illustrate, the Massachusetts biotech industry typifies a densely networked market; it
ranks among the highest symmetric-density markets in every year in our panel. The New York
non-high-tech industry, on the other hand, is the least densely networked market in most years.
D. Market Characteristics
The level of entry we observe in the data is an equilibrium outcome of the interaction of the
potential demand for and the potential supply of VC capital. Both are difficult to observe and
hence challenging to measure. To proxy for demand and supply factors that affect the entry
decision, our models include a range of controls, summarized in Table I, Panel C.
Better investment performance in a particular target market may attract entrants. Absent data
on investment returns, we follow Hochberg, Ljungqvist, and Lu (2007) and compute the fraction
of incumbent portfolio companies in a market that were successfully exited through an IPO or an
M&A transaction between t-5 and t-1. We then compute the target market’s excess exit rate as
the market exit rate relative to the median exit rate across all markets in the same industry in that
five-year window. This averages 4.7% in state markets and 15.1% in MSA markets.
Markets with more volatile deal flow may provide more opportunity for entry if incumbents
cannot easily meet unexpected increases in demand. To proxy for swings in market demand, we
compute the coefficient of variation of the monthly number of deals over the prior five years.
The average market has a coefficient of variation of 1.161 (state) or 1.173 (MSA).
Larger markets and those less economically developed generally have a higher demand for
external capital and more capacity for new VC funding, and thus are more likely to attract

10
entrants. We use the number of deals completed in a market in year t-1 as a proxy for market
size. This averages 37.9 deals in state-markets and 28.6 deals in MSA markets. To proxy for a
state’s economic development, we include both its gross state product (GSP), as reported by the
U.S. Department of Commerce’s Bureau of Economic Analysis (BEA), and its annual GSP
growth rate. For MSAs, we use data for the state or states the MSA is located in. Since our
sample covers more than 20 years of data, we use the BEA’s implicit GNP deflator to adjust for
inflation. Real GSP in the mean state/industry market is $323 billion with a growth rate of 3.3%,
compared to $547.6 billion in the mean MSA/industry market with a growth rate of 3.6%.9
Certain types of deals are more likely to be syndicated, such as larger and later-stage
investments (Lerner (1994), Brander, Amit and Antweiler (2002)). Thus, in markets where deals
are typically syndicated, incumbents might reduce entry simply by refusing to syndicate with
entrants. To capture this possibility, we calculate the fraction of deals in a market that were
syndicated in the prior five years. This averages 42.5% in the average state/industry market and
47.2% in the average MSA/industry market.
Investment opportunities are a reasonable proxy for a demand-side factor affecting entry.
Controlling for investment opportunities in a private market is not easy. We follow Gompers and
Lerner (2000a) who use public-market pricing multiples as a proxy for private-market investment
climates. Specifically, we construct annual book-to-market ratios from Compustat data for each
of the six Venture Economics industries. The mean value-weighted industry book-to-market ratio
in our data is around 0.5. This variable varies by year and industry but not by state or MSA.
If VC firms raise funds in response to perceived investment opportunities in a particular
industry, fund inflows are another useful proxy for the industry investment climate. Real VC
9 Larger states tend to have more MSAs and so are overweighted in this particular summary statistic.

11
fund inflows average around $7 billion per year and industry over the sample period.
Many start-up companies develop and commercialize cutting-edge technologies, and so
require skilled and educated workers. Education levels in a particular geographic region may
hence be related to the probability of entrepreneurial success and consequently to the supply of
VC funding. We obtain data on annual state-level science and engineering degree completions
from the National Science Foundation (NSF).10 This averages 2.6 per a thousand inhabitants.
E. Characteristics of Potential Entrants
All else equal, we expect more entry if there is a larger pool of “qualified” potential entrants
(see Berry (1992)). A VC firm is considered to be a potential entrant if (1) it was founded in or
before year t; (2) it has at least one fund under management that was raised in the previous six
years; and (3) it has not invested in this particular market prior to year t.11 We consider three key
characteristics of potential entrants.
VC investments require substantial monitoring and active management and so tend to be
local. We therefore control for the geographic distance between each potential entrant’s location
and the target market. Following Coval and Moskowitz (1999), we compute the geographic
distance for each pair of VC i and target market m as follows:
+)cos()cos()cos()(arccos{cos mmiiim lonlatlonlatD
+ sin(lat)sin()cos()sin()cos( mmii lonlatlonlat i)sin(latm)}2 r / 360 (1)
where lat and lon are the latitudes and longitudes (measured in degrees of arc) and r is the radius
10 Science and engineering includes the following subjects: Engineering, physical sciences, geosciences,mathematics and computer sciences, life sciences, and science and engineering technologies. 11 Condition (2) ensures that we capture active funds. A typical VC fund spends its first few years nurturingportfolio companies and the remainder of its life exiting them (Ljungqvist and Richardson (2003)).

12
of the earth ( 3,963 miles).12 We then compute the fraction of potential entrants that are located
within 100 miles of the target market. (Our results are robust to alternative cut-offs.)
Presumably, prior investment experience in the industry or state/MSA help a potential entrant
enter a market. Thus, we assign potential entrants to four groups based on their industry and
geographic investment patterns in the prior five years. In the mean state market, 6.8% of
potential entrants have previously invested in both the industry and state, 31% have invested in
the industry before but not in the state, 5.9% have invested in the state but not in the industry,
and the remainder in neither. Figures for MSA markets are similar; see Table I, Panel D.
A key question we address is whether an entrant’s prior relationships with incumbents,
established in other markets, can facilitate entry. For each potential entrant, we generate
indicator variables capturing whether, in the prior five years, the potential entrant (a) participated
in a deal lead-managed by an incumbent; or (b) lead-managed a deal in another market in which
an incumbent was a co-investor. In the jargon of network analysis, these correspond to positive
indegree and outdegree, respectively. In the average market-year, around 20% of potential
entrants have served as co-investors for incumbents elsewhere during the prior five years, while
around 13% have lead-managed syndicates in which incumbents were co-investors.
II. Market-Level Analysis
A. A Descriptive Model of Entry in Venture Capital
To see if the data support a link between the extent of entry in a VC market and the density
of the incumbents’ network ties, we regress the number of deals entrants win in year t in market
m on the networking measure for the market as of year t-1 and suitably lagged controls for the
pool of qualified potential entrants and the aforementioned market characteristics. We have two
12 We use zip codes to identify the coordinates of a VC’s headquarters, assuming it is located in the center of the zipcode area. To find the coordinates of a market, we use the modal zip code of all portfolio companies in the market.

13
alternative network measures (asymmetric and symmetric density) and two alternative market
definitions (using states and MSAs), resulting in four specifications.13 Given the count nature of
the dependent variable, and the fact that we have repeated observations per market, the models
are estimated using conditional fixed-effects Poisson. We also include year fixed effects.
Table II reports the resulting estimates. The pseudo-R2 exceeds 50% indicating good
explanatory power. In each of the four specifications, we find a strongly negative and significant
relation between the extent of networking and the number of deals entrants win, consistent with
our conjecture that networking can help deter entry. As we control separately for whether deals
are typically syndicated in the market, networking likely captures more than a straightforward
refusal to syndicate a deal with an entrant.
The controls behave as expected. There is significantly more entry if there is a larger pool of
qualified potential entrants for the market, in the sense of geographic proximity to the market or
prior investment experience (especially having invested both in the area and the industry).14 A
greater prevalence of past network ties between potential entrants and incumbents also makes
entry more likely, giving a first indication that entry indeed involves a measure of reciprocity: By
sharing its deal flow today, a VC firm may gain access to another market at a later date.
As for the market characteristics, as expected, the number of deals entrants win increases in
investment opportunities (as proxied by industry book-to-market ratios), variability of demand,
flows of capital into the industry, and the size of the VC market (as measured by the number of
deals in the previous year). There is less entry in larger states (based on state GSP) and (using the
MSA definition) in states with more science and engineering graduates. Entry is unrelated to the
13 In a previous draft, we included two further popular network measures, namely “degree” and “eigenvector”, with qualitatively similar results (available on request).14 Sensibly, experience in the state or MSA by VCs focused on other industries is associated with less entry.

14
market’s lagged performance history, the number of incumbents, and GSP growth.
B. Omitted Variables and Causality
Table II provides evidence of a link between the extent of entry in a VC market and the
density of the incumbents’ network ties, but the correlation could well be spurious. A first-order
concern is that some omitted variable simultaneously makes networking more advantageous and
entry less desirable, making networking endogenous. An obvious example is the cost of doing
business in a given market. VCs might network to reduce cost; at the same time, high-cost
markets may attract less entry. In this case, the results in Table II would overstate the effect of
networking on entry. The reverse is also possible. Suppose we have inadequate controls for
investment opportunities. In markets with poor investment opportunities, VCs may be less keen
to share their deals, while entry is also less attractive. In this case, the results in Table II would
understate the effect of networking on entry.
Table II includes market fixed effects, which takes care of time-invariant market-specific
omitted variables. To examine whether our results are biased due to time-varying omitted
variables, we adopt two approaches. The first uses instrumental variables to deal directly with the
potential endogeneity of networking; the second approach exploits the nested panel structure of
our data to construct proxies for two likely types of omitted variables.
C. A Two-stage Model of Market-level Entry
Our first approach uses two instruments chosen to satisfy the exclusion restriction; that is, the
instruments likely correlate with the extent of networking but are unlikely to affect entry directly.
C.1. Geographic Clustering of Demand
If more frequent interaction helps VCs form ties, it is more likely that dense networks will
result. Markets in which demand is spread uniformly over a wide geographic area presumably

15
offer fewer opportunities for VCs to interact than markets in which demand is concentrated in a
few clusters of economic activity. Silicon Valley is an obvious case in point. More generally,
VCs tend to meet while in town to attend board meetings of their portfolio companies
(Kuemmerle and Ellis (1999)) and during “pitch events” for local startups seeking capital. The
more clustered are portfolio companies and start-ups, the greater the chances that any two VCs
will meet and establish a relationship. Thus, our first instrument is based on the geographic
distribution of demand in a market, measured as the entropy of the number of investments per
zip code area in the market.15,16 The more unequal the distribution, the lower the entropy.
C.2. Presence of Corporate VCs
For reasons unrelated to entry considerations, markets with a heavy presence of corporate
venture programs are likely to be less densely networked. According to Gompers and Lerner
(2000b), corporate VCs differ from traditional VCs both in terms of investment objectives
(which are often strategic rather than financial) and their longevity (which averages a mere four
years). This alone makes them less likely to view networking as a way to reduce long-run entry
into a given market: It may be something they are content to free-ride on, but their incentives to
contribute to entry deterrence – for instance, by carrying out costly punishment strategies – are
clearly much lower. Corporate VCs also tend to form less dense syndication networks, for a
simple reason. Because of compensation issues, they are typically staffed with managers
seconded from the parent corporation, as opposed to dedicated venture capital professionals
(Gompers and Lerner (2001)). These individuals are likely to be considerably less well
networked (at the personal level) than are dedicated VC professionals, and this tends to lead to
15 Denote by N the number of investments in a market in the prior five years, and ni the number of such investments
in zip code area i. Then the market’s entropy equals i ni / N ln(1/( ni / N)).16 In a previous draft, we used the coefficient of variation of the distance between each pair of portfolio companiesin a market, calculated using equation (1). This produces marginally stronger results, available on request.

16
opportunistic as opposed to strategic syndication.
Thus, the presence of corporate VCs in a market is expected to be associated with lower
levels of networking, a prediction borne out empirically in Zheng (2004). At the same time, it is
hard to see why the presence of corporate VCs should encourage or deter entry directly.
C.3. First-stage Results
The first-stage regression in our IV models predicts the extent of networking in the market as
a function of the two instruments, the second-stage control variables (as per Table II), and
market and year fixed effects. Table III reports the estimates for each of the four specifications.
Overall, the models appear to be well specified: The within-group R2 in each exceeds 50%.
Having valid instruments that satisfy the exclusion restriction is not sufficient to ensure
unbiased two-stage estimators in finite samples; the instruments also need to correlate ‘strongly’
with the endogenous first-stage variable. The F-tests suggest our instruments are collectively
strong in three of the four models, using Staiger and Stock’s (1997) recommended critical value
of 10. (The F-statistic of 7.5 in the asymmetric density model with MSA markets is borderline.)
Consistent with our hypothesis that markets in which demand is concentrated geographically
experience more networking, we find that the entropy of demand is negatively and significantly
related to both density measures under both market definitions. The same is true of the fraction
of corporate VCs in a market (except when we model symmetric density in MSA markets).
C.4. Determinants of Market Entry: Second-stage Results
Table IV presents the results of the instrumental-variables entry models. The dependent
variables in Panels A, B, and C are the number of deals won by new entrants in year t, the
number of VC firms entering a market, and the number of VCs entering as lead-managers,
respectively. As in Table II, we estimate conditional fixed-effects Poisson models, though we

17
now instrument the networking measures using predicted values from Table III. The dependent
variable in Panel D is the fraction of deals by number lead-managed by entrants, which has
support on [0,1] and positive mass at both 0 and 1.17 To avoid the well-known biases of OLS in
this situation, we estimate fractional logit models using quasi-MLE, modeling the conditional
mean as E(y|x)=exp(x )/(1+exp(x )); see Papke and Wooldridge (1996). As fractional logits
cannot currently accommodate fixed effects, Panel D pools repeated observations on each
market. To conserve space, we report only the coefficients for the instrumented network
measures and the R2; the coefficients on the controls mirror those shown in Table II.
As before, we find a negative and statistically significant relation between networking and
the number of deals won by entrants.18 Comparing Table II to Panel A of Table IV, it is clear that
failure to account for endogeneity imparts a positive (i.e., attenuating) bias to the point estimates.
This suggests that the omitted variable or variables simultaneously make networking and entry
more desirable. On net, they are thus of the omitted-investment-opportunities variety, rather than
the omitted-cost type.
The economic effect of networking is large. At the means of the other covariates, a one-
standard deviation increase in asymmetric density, for instance, reduces the expected number of
deals entrants win in state markets by 1.5. This is large compared to the median of five. The
predicted difference in the number of deals won in the least and most networked markets is 9.7.
(In general, the economic effects are somewhat smaller when we consider MSA markets, though
as Table I shows, so is the extent of entry. For instance, in Panel A, the corresponding number
for the two MSA specifications is around four.) Networking has the third largest economic effect
17 We obtain qualitatively similar results when we instead use the fraction of deals by value won by entrants.18 Consistent IV standard errors are obtained using the procedure derived in Murphy and Topel (1985, Section 5).

18
in this specification, after variation in investment opportunities and state GSP.
Similar results obtain for the other three measures of entry. Both the overall number of
entrants and the number of entrants that lead syndicates are negatively and significantly related
to networking. The effects are again large economically. In Panel B, for instance, a one-standard
deviation increase in asymmetric density is associated with a decrease of 2.9 in the number of
entrants in state/industry markets (compared to a median of nine). The corresponding effect in
Panel C, which focuses on the number of VC entering as lead investors, is 1.3, compared to a
median of five. In Panel D, we find that entrants’ combined market share is likewise significantly
lower in more networked markets, and the economic effect is again quite large. A one-standard
deviation increase in network density reduces the fraction of deals lead-managed by entrants by
between 9.7% and 11.4% from the unconditional mean, depending on the specification.
Collectively, the results from the market-level entry models shown in Table IV suggest that
even after accounting for the endogeneity of networking in the target market, networking by
incumbents can present a barrier to entry for potential entrants, and thus may restrict the
competitive supply of venture capital to entrepreneurial firms.
D. Correction for Omitted Variables
How persuasive the IV results are depends on how plausible our instruments are judged to
be. The nested structure of our panel allows us to investigate the effects of omitted variables
without relying on instruments. Suppose the omitted variables, currently subsumed in the error
terms of the networking and entry equations, are of the form stlt CC , where l indexes
locations (state or MSA) and s indexes industries. In other words, suppose the omitted variables
are time-varying factors that are location-specific or industry-specific. Then, density

19
lstlstlst XD = lststltlst CCX . Under this quite general assumption,19 we can
construct a proxy for Clt using only observables. Specifically, we subtract from Dlst its average
across locations, holding industry constant, and solve for Clt. Because Cst doesn’t vary across
locations, it cancels out and we obtain a proxy for Clt that is a function of observables and a
constant term (mean Clt) which is subsumed in the market fixed effects:
lstl lt
ltl lst
lt
lstl lst
lt
lstlstltlt CN
XN
XDN
DCC )()1
(*
Estimates of can be obtained from a regression of Dlst on observables Xlst. The proxy for Cst is
constructed analogously. The two proxies are then included in the entry equation to reduce the
bias-inducing correlation between the networking variable and the disturbances.
Table V presents the results of the augmented entry models for the same four entry measures
as in Table IV. In each of the 16 specifications, the effect of networking on entry is negative, and
it is statistically significant at the 5% level in 13 of the 16 models and at the 10% level in 15. The
coefficient estimates are similar in magnitude to those in the IV models in Table IV, and larger
(more negative) than those in the naïve models shown in Table II. Though not reported, the
coefficients estimated for , the proxy for location-specific omitted factors, are consistently
positive and statistically significant; the coefficients for are never significant. The relevant
omitted variable is hence location-specific, and the sign suggests it captures something that
makes both networking and entry more desirable (such as omitted investment opportunities).
*
ltC
*
stC
In sum, both the IV approach and the omitted variables correction support the interpretation
that more densely networked markets are associated with less entry, even after accounting for
19 Bearing in mind that we include market fixed effects, the only type of omitted variable we cannot capture this wayis one that varies simultaneously across time, location, and industry.

20
possible omitted variables that make networking endogenous to entry.
III. Firm-level Analysis
We now turn to the entry decision of an individual potential entrant. This sheds light on how
determined entrants can overcome networking-related entry barriers. Specifically, we explore
whether an entrant can soften the reaction it receives in a market by first establishing ties to one
or more of the incumbents in its own home market. We distinguish between the case where a
potential entrant has previously invited an incumbent to be a participant in a syndicate in its
home market (positive outdegree) and the case where a potential entrant was a junior investor in
a multi-market incumbent’s syndicate in another market (positive indegree).
Table VI presents summary information on the characteristics of potential entrants in the 129
state markets (results for MSA markets look similar). Panel A shows that VC firms with prior
ties to incumbents are more than three times more likely to enter a market than are other
potential entrants, whether we focus on outdegree or indegree. This supports the notion that
reciprocity is an important part of a successful entry strategy in venture capital.
Panels B and C show that investors located closer to a target market and those that have
previous industry-related and/or geographic experience are consistently more likely to enter a
market than are other potential entrants. This mirrors the market-level results of the previous
section. For example, the entry rate among VCs headquartered within 100 miles of the center of
the target market is 5.01% in a given year, compared to 1.28% among those located further
away.20 Similarly, the entry rate for potential entrants with both previous industry and state
investment experience is 4.42%, compared to 1.21% among other VCs.21
20 As above, we define the center as the modal location of portfolio companies (in a given industry) in the state. Our results are not sensitive to the 100-mile cutoff. However we measure it, closer VCs are more likely to enter.21 Similar patterns obtain if we define entrants as firms that enter as lead investors rather than syndicate members.

21
To control for other influences on the entry decision, we estimate firm-level probit models in
which the dependent variable equals one if the potential entrant enters the market successfully
and zero otherwise. The main variables of interest are the density of incumbents’ relationships in
the target market and a set of indicators for the variables considered in Table VI: Proximity to
the market, previous investment experience, and prior ties to incumbents. Other controls include
the size of the VC firm and the performance history, investment opportunities, demand variation,
market size, overall supply of VC capital, and state economic development measures described
in Section I. Adding the omitted-variable proxies and has no effect on the results.*
ltC *
stC
The results are reported in Table VII. As before, there are four models, based on two
alternative network measures and two alternative market definitions. The models have good
overall fit, with pseudo R2 of around 16%. In each specification, we find that a potential entrant
is significantly less likely to enter the more networked the market. This mirrors the main result of
the market-level models discussed in Section II.
Who does enter? Prior ties to incumbents have a positive and significant effect on the
likelihood of entry in all four models, for both indegree and outdegree. Thus, successful entrants
are those who have syndicated with target-market incumbents in other markets. The models
include interaction terms crossing indegree and outdegree with the networking measures, and
these are each positive and mostly statistically significant. Thus, for entrants with suitable
connections, the extent of networking in the target market appears to be irrelevant. To explore
this idea more formally, we test the following linear restrictions:
network measure · (1 + indegree) = 0
network measure · (1 + outdegree) = 0
network measure · (1 + outdegree + indegree) = 0

22
In none of the four models in Table VII are the combined effects significantly negative,
suggesting that networking presents a significant barrier to entry only for entrants that lack ties to
any incumbent. In fact, entrants with both positive indegree and positive outdegree are actually
significantly more likely to enter the more densely networked the market.22
Larger VC firms, measured by capital under management since inception, are significantly
more likely to enter. While size might proxy for a range of relevant characteristics, entry by large
VC firms may be more likely to be accommodated because big players can offer greater rewards
in the form of syndication opportunities in their home markets.
The single most significant determinant of the entry decision in Table VII is location.
Depending on specification, VC firms located within 100 miles of the center of the target market
are between 126% and 143% more likely to enter than those located farther away. Previous
related investment experience, whether in the area or the industry or both, is similarly helpful.
Economically, these effects too are large. For instance, prior experience in the industry and state
increases the likelihood of entry by around 1.8 percentage points from the unconditional mean of
1.5%, an increase of around 120%. Prior industry experience in the absence of prior investments
in the state has a smaller economic effect, increasing the likelihood of entry by around 36%,
while experience in the state but not the industry increases it by 29%. The effects of the
remaining control variables largely mirror those found in the market-level analysis.
IV. Strategic vs. Efficient Networking
Suppose there are two markets, configured as follows: Market 1 = [VC1 VC2 VC3] and
22 An interesting related question is who entrants syndicate with when they enter. Our data show that entrants are more likely to syndicate with incumbent VC firms that they have done business with elsewhere before. Specifically, we find that the probability that an entrant syndicates with a related incumbent is 18.3%. The median probabilityunder the null that pairings conditional on entry are random is 10.8%, based on 200 draws from a bootstrappedsample. The observed and simulated probabilities are significantly different at p<0.0001.
23
Market 2 = [VC4 VC5]. Let x be the unconditional probability that VC5 enters Market 1. Based
on our findings in the previous section, if VC3 does a deal with VC5 in Market 2 (VC5’s home
market), this increases the probability that VC5 will enter Market 1, say to x+y. This increase in
the threat of entry should elicit a strategic response from VC1 and VC2, the other incumbents of
Market 1. We would expect them to try to reduce the attractiveness of entry, most obviously by
cutting VC3 out of the loop (informationally, etc.), so as to neutralize the link VC5 has made into
their market. Testing for such a response allows us to distinguish between strategic reasons to
network (i.e., intentionally making entry harder) and efficient reasons to network (i.e., to save on
costs while accidentally making entry harder).23
Empirically, we perform a difference-in-difference test, comparing the difference over time
in each incumbent’s participation in its home-market network as a function of whether or not the
incumbent has done business with a potential entrant in another market. The unit of observation
is thus an incumbent VC firm, i. The dependent variable is the change in the probability that firm
i is invited to join a syndicate lead-managed by another incumbent operating in its market. The
main variable of interest is an indicator set equal to one if firm i co-syndicated with a potential
entrant in another market during year t-1. We test the hypothesis that the other incumbents in i’s
home market react by excluding it from some or all of their syndicates for a period of time.
As strategic behavior invites free-riding, we expect the likelihood and severity of punishment
to be greater the fewer incumbents are active in the market. Hence we interact the variable of
interest with an indicator set equal to one if there are five or fewer incumbents in the market.
(Our results are not sensitive to other reasonable cut-offs.) To allow for flexibility in the duration
of punishment, we compute the change in syndication probability from year t to each of the next
23 This test is biased against us. VC3 will only do business with VC5 if it expects the other incumbents’ response tobe relatively lenient – which will make it harder to detect such a response in the data.

24
five years. Note that VC firms entering after year t (i.e., future incumbents) are not included in
this calculation, as they cannot plausibly punish VC firm i for causing entry to become easier
before they themselves entered. We also screen out markets with a monopolist incumbent, as
there can be no strategic response.
Table VIII reports the results. With two market definitions (state and MSA) and a five-year
window, we estimate ten OLS regressions. Each controls for year and industry effects as well as
two VC firm characteristics: Size and degree, a measure of network centrality. We expect larger
and better connected VCs to face more lenient reactions.
As expected, the effect on a VC firm’s inclusion in other incumbents’ syndicates of having
done business with a potential entrant is negative, but not significantly so unless the market has a
small number of incumbents. Combining the direct and interaction effects, doing business with a
potential entrant reduces the probability of inclusion in home-market syndicates the next year by
1.1 percentage points (= –0.313–0.806) in state markets and 2.2 percentage points in MSA
markets with five or fewer incumbents. The unconditional probability in year t is 4.8% and 5.9%,
respectively, so the reduction is large economically. In other words, incumbents appear to
respond strategically to an increased threat of entry. The strategic response is not only large, it is
persistent and its extent increases over time. In state markets, an incumbent that has done
business with a potential entrant can expect to see its home-market syndication opportunities
decrease by 2.3, 3.5, 3.4, and 4.3 percentage points after two, three, four, and five years,
respectively. (For MSA markets, the response peaks after four years, at –4.6 percentage points.)
V. Valuation Effects
Our results support the hypothesis that strategic networking deters at least some entrants. As
a result, we expect incumbent VCs to exploit their increased bargaining power by negotiating

25
more favorable funding terms at the expense of entrepreneurs. Because we do not observe any
qualitative funding terms (such as control rights, liquidation preferences, anti-dilution protection,
and so on), we focus on the valuations at which venture-backed companies raise VC funding.
Companies typically receive funding in distinct stages, which provides VCs with the option
to cease funding if a business model turns out not to work. Not surprisingly, the average
company’s valuation increases over a sequence of funding rounds and with its maturity. It also
appears to be related to networking. Sorting state markets into quartiles based on asymmetric
density, for instance, the average real valuation is $10.6 million in the most densely networked
markets versus $20.4 million in the least densely networked ones.
These figures do not control for other reasons why valuations might differ. Table IX reports
OLS regression results where the unit of analysis is a funding round and the dependent variable
is the log of the round valuation. The explanatory variables of interest are the density measures;
the fraction of deals entrants won in the company’s market the previous year; and an indicator
identifying whether the company’s lead investor is an entrant (=1) or an incumbent (=0). If entry
deterrence is effective, we expect lower valuations in more densely networked markets. Where
entrants manage to overcome the entry barriers put in their way, we expect higher valuations.
Finally, entrants likely have to offer higher valuations to compete with incumbents.
Absent data on sales, earnings, or book values in the Venture Economics database, there are
no company-specific value drivers we can control for beyond stage of development and funding
round number. Following Gompers and Lerner (2000a), we instead control for the book-to-
market ratio of the company’s industry (to proxy for investment opportunities), a valuation index
of publicly listed companies in the same industry, constructed as in Gompers and Lerner (2000a),
and the amount of money raised in the previous year by VC funds focusing on the company’s

26
industry (to capture any “money chasing deals” phenomena). We also include a proxy for the
lead investor’s investment experience (the log size of assets under management), the lagged
number of deals completed in the company’s market, an indicator identifying seed- or early-stage
companies, a set of funding round dummies (the omitted category is a first-round investment),
and market fixed effects to control for otherwise unobserved heterogeneity across markets, such
as local pricing anomalies, conditions in the managerial labor market, and so on.
As in Section II.D, we augment the regression with the omitted variable proxies and ,
to allow for the possibility that time-varying factors that are either location-specific or industry-
specific influence both the networking decision and valuations in a market. An example is cost:
High-cost locations may be associated with more networking and lower valuations.
*
ltC *
stC
The resulting regressions have good fit, in view of the approximately 40% adjusted R2.
Regardless of how we measure it, companies in more densely networked markets are valued
significantly less highly, suggesting that incumbent VCs benefit from reduced entry through
paying lower prices for their investments. Economically, a one-standard deviation increase in
asymmetric or symmetric density is associated with a more than 10% decrease in round valuation
from the unconditional mean of $25.6 million, all else equal. On the other hand, the more market
share entrants have captured in the recent past, the higher are the valuations paid, suggesting that
entry benefits entrepreneurs through higher prices. Also, perhaps not surprisingly, entrants pay
significantly higher valuations than do incumbents, all else equal.
The results for the controls mirror those in Gompers and Lerner (2000a). Higher industry
valuations in the public markets are associated with higher valuations being paid in the private
markets, while more money chasing deals drives valuations up significantly. Valuations are also
higher in more active markets (based on the number of completed deals) and when a more

27
experienced VC leads the round. Early-stage companies receive lower valuations while
valuations increase significantly as a company progresses through follow-on funding rounds.
While these results support the notion that entry deterrence has real, detrimental effects for
the terms on which entrepreneurs can access the VC market, the Venture Economics valuation
data have two shortcomings which could lead to spurious results. First, they are self-reported,
and there is every reason to expect companies to disclose valuations strategically; for instance, a
company may choose not to disclose a “down-round” valuation (i.e., a discount to the previous
round). Indeed, only one fifth of the funding rounds in the VE database disclose valuations.
To correct for strategic disclosure, we follow Hwang, Quigley, and Woodward (2005) who
estimate an ordered probit model of seven events at which valuations could be disclosed.24 The
explanatory variables are the company’s development status (as per its most recent prior funding
round), its VE industry group and location, the stock market capitalization at the time, year
effects, and the elapsed time since the most recent funding round, the importance of which is
allowed to vary with the type of the previous round (seed, late-stage, and so on). From the
ordered probit estimates, they construct the inverse Mill’s ratio for each company and round.
We replicate their model in our data and obtain results that are at least as strong as theirs (not
shown). When we include the inverse Mill’s ratio in the Table IX specifications, we continue to
find that round valuations are lower in more densely networked markets, but increase after
entrants have won more market share and if an entrant leads a round. As Panel B of Table X
shows, all coefficients are highly statistically significant. Compared to the relevant coefficients
from the Table IX specifications, reproduced in Panel A for ease of comparison, the selection-
24 The events are: 1) Revelation of value through shutdown; 2) funding through acquisition, without revelation ofvalue; 3) no funding at all; 4) VC funding without revelation of value; 5) VC funding with revelation of value; 6)funding through acquisition with revelation of value; 7) funding and revelation of value through an IPO.

28
corrected model produces slightly smaller economic effects for the network measures.
The second shortcoming of the VE valuation data is the absence of company-level data on
value drivers. No doubt our valuation models leave out many factors that influence valuations,
such as the company’s track record, the quality of management, or the strength of intellectual
property. However, we can exploit the panel structure of the data – companies receive multiple
funding rounds – to remove the effect of unobserved company-specific factors. We do so while
continuing to control for unobserved market-specific factors that might bear on valuation. The
resulting model is a mixed linear model with two levels of random effects (for the company and
for the market), which can be estimated using maximum residual likelihood; see Baltagi, Song,
and Jung (2001). The coefficients of interest are reported in Panel C of Table X. The likelihood
ratio tests strongly reject the null that market and company-level effects are jointly zero (indeed
each level is significant, though this is not shown). While some coefficients are somewhat
smaller than in Panel A, we continue to find, as before, that networking significantly reduces
valuations while entry increases them.
Our final models, shown in Panel D, adjust for both selective disclosure and unobserved
company-level heterogeneity by including the inverse Mill’s ratios in the mixed effects model.
While this reduces the coefficient estimates for the networking a bit further, our conclusions
remain unaffected. Thus, the effects of networking and entry on company valuations do not
appear to be an artifact of well-known problems with the VE valuation data.
V. Conclusions
We examine whether networking among U.S. VC firms restricts entry into local VC markets,
thereby improving their bargaining power over entrepreneurs. We expect more densely
networked markets to be harder to enter, not only because of the relatively greater network

29
externalities that incumbents enjoy in such markets, but also because withdrawal of network
access may provide an effective threat of punishment against incumbents who cooperate with
new entrants.
We provide evidence that markets in which incumbents maintain dense syndication networks
with each other are indeed associated with reduced entry, controlling for a wide variety of other
influences that bear on entry. Moreover, evidence derived from plausible instruments for
networking suggests that prevailing network conditions in a target market causally influence
entry decisions. The magnitude of these effects is economically large, and robust to a wide range
of specifications.
One way to overcome this particular barrier to entry is through establishing ties to the
incumbents in other markets, i.e., by “joining the club.” The price of admission appears to be
letting incumbents in on the entrant’s deal flow in unrelated markets. In addition, previous
investment experience in the targeted industry or a prior presence in the targeted geographic area
facilitates entry. However, entrants also appear to enter by offering to pay higher prices.
While networking is no doubt motivated by efficiency considerations, its entry-reducing
effects do not appear entirely accidental. Our evidence shows that incumbents react strategically
to an increased threat of entry – such as when a fellow incumbent does business with a potential
entrant in another market – by reducing their syndication ties to the offending VC.
Having established a link between syndication networks and reduced entry, we ask whether
incumbents’ bargaining power vis-à-vis entrepreneurs increases. We show that the valuations at
which companies can raise VC funding depend on the extent of networking and the degree of
entry that results, consistent with networking providing an effective barrier to entry. Our results
are consistent with the hypothesis that incumbents engage in strategic behavior that reduces entry

30
and benefit from doing so through paying lower prices for their investments.
Our findings illustrate the role of networking as an entry deterrent. While we focus on the
VC setting, we believe our findings generalize to other industries that make heavy use of
networks, such as investment banking. In addition, they help explain prior empirical evidence
that better networked VCs enjoy better performance (see Hochberg, Ljungqvist, and Lu (2007)).
Our work also sheds light on the process of entry. Successful entry appears to involve “joining
the club” by offering the incumbents syndication opportunities in one’s home market. Finally,
our findings present interesting policy implications. If networking poses an effective barrier to
entry, this may lead to a more restricted supply of capital to entrepreneurial ventures and to
harsher funding terms. The structure of the local VC market therefore has significant
implications for entrepreneurial ventures seeking startup capital. More broadly, we may ask how
strategic behavior in the VC market affects the funding of new ventures and their eventual
success.

31
References
Baltagi, Badi H., Seuck H. Song, and Byoung C. Jung, 2001, The unbalanced nested error component regression model, Journal of Econometrics 101, 357-381.
Berry, Steven T., 1992, Estimation of a model of entry in the airline industry, Econometrica 60, 889-917.
Bonacich, Philip, 1972, Factoring and weighting approaches to status scores and clique identification, Journal of Mathematical Sociology 2, 113-120.
Bonacich, Philip, 1987, Power and centrality: A family of measures, American Journal of
Sociology 92, 1170-1182.
Brander, James, Raphael Amit, and Werner Antweiler, 2002, Venture capital syndication: Improved venture selection versus the value-added hypothesis, Journal of Economics and
Management Strategy 11, 423-452.
Bygrave, William D., 1988, The structure of the investment networks of venture capital firms,Journal of Business Venturing 3, 137-158.
Coval, Joshua D., and Tobias J. Moskowitz, 1999, Home bias at home: Local equity preference in domestic portfolios, Journal of Finance 54, 2045-2073
Gompers, Paul A., and Josh Lerner, 2000a, Money chasing deals? The impact of fund inflows on private equity valuations, Journal of Financial Economics 55, 281-325.
Gompers, Paul A., and Josh Lerner, 2000b, The determinants of corporate venture capital success: Organizational structure, incentives, and complementarities, in Randall Morck,editor, Concentrated Ownership. Chicago, IL: University of Chicago Press.
Gompers, Paul A., and Josh Lerner, 2001, The Money of Invention: How Venture Capital
Creates New Wealth, Boston, MA: Harvard Business School Press.
Hochberg, Yael V., Alexander Ljungqvist, and Yang Lu, 2007, Whom you know matters:Venture capital networks and investment performance, Journal of Finance 62, 251-301.
Hsu, David, 2004, What do entrepreneurs pay for venture capital affiliation? Journal of Finance
59, 1805-1844.
Hwang, Min, John M. Quigley, and Susan E. Woodward, 2005, An index for venture capital, 1987-2003, Contributions to Economic Analysis and Policy 4, 1-43.
Inderst, Roman, and Holger Mueller, 2004, The effect of capital market characteristics on the value of start-up firms, Journal of Financial Economics 72, 319-356.
Kuemmerle, Walter, and Chad Ellis, 1999, JAFCO America Ventures, Inc.: Building a Venture
Capital Firm. Boston, MA: Harvard Business School Publishing.
Lerner, Josh, 1994, The syndication of venture capital investments, Financial Management 23,16-27.

32
Ljungqvist, Alexander, and Matthew Richardson, 2003, The investment behavior of private equity fund managers, Working paper, New York University.
Murphy, Kevin M., and Robert H. Topel, 1985, Estimation and inference in two-step econometric models, Journal of Business and Economic Statistics 13, 370–379.
Papke, Leslie E., and Jeffrey M. Wooldridge, 1996, Econometric methods for fractional response variables with an application to 401(k) plan participation rates, Journal of Applied
Econometrics 11, 619-632.
Sah, Raj K., and Joseph E. Stiglitz, 1986, The architecture of economic systems: Hierarchies and poliarchies, American Economic Review 76, 716-727.
Sorenson, Olav, and Toby E. Stuart, 2001, Syndication networks and the spatial distribution of venture capital investments, American Journal of Sociology 106, 1546-1588.
Staiger, Douglas, and James H. Stock, 1997, Instrumental variables regression with weak instruments, Econometrica 65, 557-586.
Wasserman, Stanley, and Katherine Faust, 1997, Social Network Analysis: Methods and
Applications. New York, NY: Cambridge University Press.
Zheng, Ju Kimberly, 2004, A social network analysis of corporate venture capital syndication, Working Paper, University of Waterloo.

33
Figure 1. Example of a Densely Networked Market The figure shows the network that arises from syndication of portfolio company investments in the market forcomputer-related ventures in Michigan over the five-year window 1979-1983. Nodes on the graph represent VCfirms, and arrows represent syndicate ties between them. The direction of the arrow represents the lead/non-leadrelationship between syndicate members. The arrow points from the VC leading the syndicate to the non-leadmember. Two-directional arrows indicate that both VCs on the arrow have at one point in the time window led a syndicate in which the other was a non-lead member.
Figure 2. Example of a Sparsely Networked Market The figure shows the network that arises from syndication of portfolio company investments in the market for non-high-tech ventures in Pennsylvania over the five-year window 1990-1994.

34
Table I. Descriptive Sample Statistics. The unit of observation in this table is a market-year. We define a market as a combination of one of the six Venture Economics industries and either a U.S. state or a Metropolitan Statistical Area (MSA). Venture Economics classifies investments into the following industries: Biotechnology; communications and media; computer related; medical/health/life science; semiconductors/other electronics; and non-high-technology. To qualify for inclusion in the sample, a market-year has to have a minimum of 25 investments in the prior five years and five investments in the current year. There are 129 distinct state markets and 130 distinct MSA markets. Under each definition, there are between one and 24 annual observations for each market, resulting in 1,375 state-market-years and 1,292 MSA-market-years. Entrants in Panel A are defined as VC firms investing in a given market in year t that had never invested in this market before year t. For a market in year t, we use data from the previous five years (from t-5 to t-1) to construct network densities, shown in Panel B. Density is defined as the proportion of all logically possible ties among incumbents that are present in the market. Asymmetric density is calculated from directed networks (i.e., conditioning on lead vs. syndicate participant ties) and symmetric density is calculated from undirected networks. Panel C characterizes the markets. To control for performance in a market, and in the absence of return data, we calculate the fraction of venture-backed firms in a market that were successfully exited through an IPO or an M&A transaction during the prior five years. To measure excess performance in a market, we subtract from this the median exit rate across all geographic markets in the same Venture Economics industry. B/M is the value-weighted book/market ratio of public companies in the relevant industry. We map public-market B/M ratios to industries based on four-digit SIC codes. The VC inflows variable is the real aggregate amount of capital raised by VC funds specializing in the industry. We take a fund’s industry specialization to be the Venture Economics industry that accounts for the largest share of its portfolio, based on dollars invested. Potential entrants in Panel D are defined as the VC firms satisfying the following three conditions: (1) the firm was founded (i.e., raised its first fund) in or before year t; (2) the firm has at least one fund under management that was raised in the previous six years; and (3) the firm has not invested in this particular market prior to year t. We use trailing five-year windows to construct the characteristics of potential entrants. A potential entrant VC firm’s indegree is the normalized number of unique VCs in the market in question that have led syndicates the firm was a non-lead member of. A potential entrant VC firm’s outdegree is the normalized number of unique VCs in the market that have participated as non-lead investors in syndicates lead-managed by the firm. (The lead investor is identified as the VC firm that invests the largest amount in the portfolio company in a given round.)

35
Table I. Descriptive Sample Statistics (Continued).
State markets MSA markets
MeanStd.Dev. Median Mean
Std.Dev. Median
Panel A: Entry measures
# incumbents 28.3 41.0 15 24.3 28.4 16
# deals won by incumbents 24.1 57.5 10 16.8 27.4 9
# entrants 14.7 19.9 9 12.7 17.0 8
# entrants that lead syndicates 7.2 9.6 5 5.8 7.8 4
# deals won by entrants 8.5 12.2 5 6.7 9.6 4fraction of deals by # lead-managed by entrants 0.301 0.182 0.286 0.274 0.171 0.250
Panel B: Network measures
asymmetric density 0.021 0.013 0.018 0.024 0.014 0.021
symmetric density 0.078 0.052 0.067 0.092 0.053 0.081
Panel C: Market, state, and industry characteristics (t-1)
excess investment performance in market 0.047 0.095 0.038 0.151 0.108 0.140
coefficient of variation of monthly # deals 1.161 0.346 1.171 1.173 0.326 1.175
# deals in market 37.9 78.0 18 28.6 42.2 17
real GSP ($billion) 323.8 262.1 237.2 547.6 413.9 450.1
real GSP growth rate 0.033 0.026 0.032 0.036 0.029 0.036
fraction of deals that are syndicated, t-5 to t-1 0.425 0.131 0.429 0.472 0.144 0.483
value-weighted mean industry B/M ratio 0.524 0.225 0.489 0.501 0.217 0.473
inflow into VC funds in industry ($m) 6,954.6 12,309.6 2,247.0 7,415.4 13,003.4 2,247.0 # science & eng. degrees awarded in state per 1000 inhabitants 2.6 0.8 2.5 2.5 0.5 2.4
Panel D: Potential entrants
fraction located within 100 miles of market 0.065 0.073 0.025 0.086 0.074 0.059 fraction investing in same industry and same area 0.068 0.028 0.064 0.066 0.033 0.062 fraction investing in same industry but not same area 0.310 0.157 0.291 0.318 0.153 0.298 fraction investing in same area but not same industry 0.059 0.081 0.028 0.044 0.046 0.025
fraction w/ positive indegree 0.200 0.096 0.193 0.206 0.090 0.203
fraction w/ positive outdegree 0.131 0.054 0.132 0.137 0.053 0.137

36
Table II. Number of Deals Entrants Lead. The dependent variable is the number of deals won by VC firms entering a market in year t. Given the count nature of the dependent variable, and the fact that we have repeated observations per market, we estimate conditional fixed-effects Poisson models. Intercepts are not shown. Heteroskedasticity-consistent standard errors (clustered on market) are shown in italics. We use ***, **, and * to denote significance at the 0.1%, 1%, and 5% level, respectively. In the two specifications where markets are defined as state/industry pairs, the number of distinct markets is 129 and the number of observations (market-years) is 1,375. In the two specifications where markets are defined as MSA/industry pairs, the number of markets is 130 and the number of observations is 1,292.
State markets MSA markets
Network measure used: asymmetric density
symmetric density
asymmetric density
symmetric density
network measure -6.398*** -2.259*** -8.391*** -2.322***
1.945 0.469 1.933 0.416
Potential entrants
fraction headquartered within 100 miles 1.605*** 1.567*** 0.656** 0.644**
0.338 0.338 0.212 0.212
fraction investing in same industry and same area 1.794* 1.856* 2.839*** 2.994***
0.853 0.851 0.602 0.602
fraction investing in same industry but not in area 0.680* 0.633* -0.582*** -0.579***
0.270 0.270 0.171 0.171
fraction investing in same area but not in industry -2.117*** -2.142*** -1.715*** -1.693**
0.559 0.560 0.539 0.538
fraction w/ positive indegree 0.074 0.080 -0.817 -0.733
0.451 0.451 0.474 0.474
fraction w/ positive outdegree 2.163** 2.179** 4.357*** 4.123***
0.723 0.723 0.756 0.757
Market, state, and industry characteristics (t-1)
fraction of deals syndicated, t-5 to t-1 0.301 0.289 -0.571*** -0.585***
0.177 0.174 0.149 0.140
1/(# distinct VC firms incumbent in the market) 0.832 -0.148 1.278 -0.931
1.508 1.377 1.986 1.689
excess investment performance in market 0.180 0.190 -0.139 -0.135
0.163 0.164 0.138 0.138
value-weighted mean industry book/market ratio -2.149*** -2.131*** -0.789*** -0.877***
0.179 0.179 0.114 0.117
coeff. variation of monthly no. of deals in market 0.138* 0.139* 0.049 0.051
0.062 0.061 0.062 0.062
log inflow into VC funds in industry ($m) 0.147*** 0.147*** 0.245*** 0.240***
0.025 0.025 0.017 0.017
log no. deals in market 0.058 0.045 0.421*** 0.404***
0.037 0.037 0.025 0.026
# science & engineering degrees awarded/1000 inhabitants 0.051 0.056 -0.092** -0.085*
0.048 0.048 0.035 0.035
log real GSP ($m) -0.998*** -1.034*** -0.037* -0.036*
0.254 0.256 0.017 0.017
real GSP growth rate (%) 0.868 0.852 -0.151 -0.194
0.633 0.632 0.616 0.616
Diagnostics
Pseudo-R2 59.1 % 59.2 % 53.2 % 53.3 %
Wald-test: all coeff. = 0 ( 2) 10,249*** 10,262*** 7,420.4*** 7,433.3***

37
Table III. First-stage Models. The models are estimated using OLS with fixed (market) effects. The motivation for our two instruments can be found in the text. All control variables are defined as in Table I. Intercepts are not shown. Heteroskedasticity-consistent standard errors (clustered on market) are shown in italics. We use ***, **, and * to denote significance at the 0.1%, 1%, and 5% level (two-sided), respectively. In the two specifications where markets are defined as state/industry pairs, the number of distinct markets is 129 and the number of observations (market-years) is 1,375. In the two specifications where markets are defined as MSA/industry pairs, the number of markets is 130 and the number of observations is 1,292.
State markets MSA markets
Dependent variable: asymmetric density
symmetric density
asymmetric density
symmetric density
Instruments
entropy of demand distribution -0.002* -0.017*** -0.002*** -0.022***
0.001 0.004 0.001 0.003
fraction of $ invested by corporate VCs in market -0.020*** -0.086*** -0.007* -0.020
0.004 0.015 0.003 0.014
Potential entrants
fraction headquartered within 100 miles 0.013 0.044 -0.008 -0.042
0.007 0.031 0.009 0.040
fraction having invested in same industry and same area -0.045** -0.046 0.030* 0.205***
0.015 0.066 0.014 0.061
fraction having invested in same industry but not in area -0.019*** -0.063*** 0.000 -0.015
0.005 0.020 0.004 0.018
fraction having invested in same area but not in industry -0.012 -0.037 -0.002 -0.080
0.011 0.049 0.014 0.063
fraction w/ positive indegree -0.005 -0.024 -0.018* -0.057
0.008 0.036 0.008 0.036
fraction w/ positive outdegree 0.004 0.040 0.010 0.018
0.014 0.059 0.013 0.058
Continued over.

38
Table III. First-stage Models (Continued).
State markets MSA markets
Dependent variable: asymmetric density
symmetric density
asymmetric density
symmetric density
Market, state, and industry characteristics (t-1)
fraction of deals syndicated, t-5 to t-1 0.029*** 0.067*** 0.040*** 0.105***
0.003 0.013 0.002 0.011
1/(# distinct VC firms incumbent in the market) 0.326*** 0.190 0.598*** 0.856***
0.025 0.110 0.027 0.123
excess investment performance in market 0.002 0.020 0.000 -0.005
0.003 0.011 0.002 0.010
value-weighted mean industry book/market ratio 0.002 0.024 0.003 0.000
0.003 0.014 0.003 0.014
coeff. of variation of monthly no. of deals in market -0.004** -0.005 -0.004*** -0.019***
0.001 0.005 0.001 0.005
log inflow into VC funds in industry ($m) 0.000 -0.002 0.000 -0.002
0.000 0.002 0.000 0.002
log no. deals in market 0.000 -0.003 0.000 -0.006*
0.001 0.003 0.001 0.003
# science & engineering degrees awarded/1000 inhabitants -0.003*** -0.007 -0.004** -0.009
0.001 0.004 0.001 0.006
log real GSP ($m) -0.015*** -0.069*** -0.001 0.004
0.004 0.018 0.002 0.009
real GSP growth rate (%) 0.031** 0.074 0.002 -0.045
0.011 0.049 0.010 0.044
Diagnostics
Within-groups R2 60.3 % 54.3 % 68.8 % 60.7 %
Wald-test: all coeff. = 0 (F) 44.5*** 34.8*** 61.8*** 43.3***
F-test: all FE = 0 5.5*** 5.9*** 7.1*** 7.2***
Instrument strength test (F-test with critical value of 10) 17.8*** 24.4*** 7.5*** 20.4***
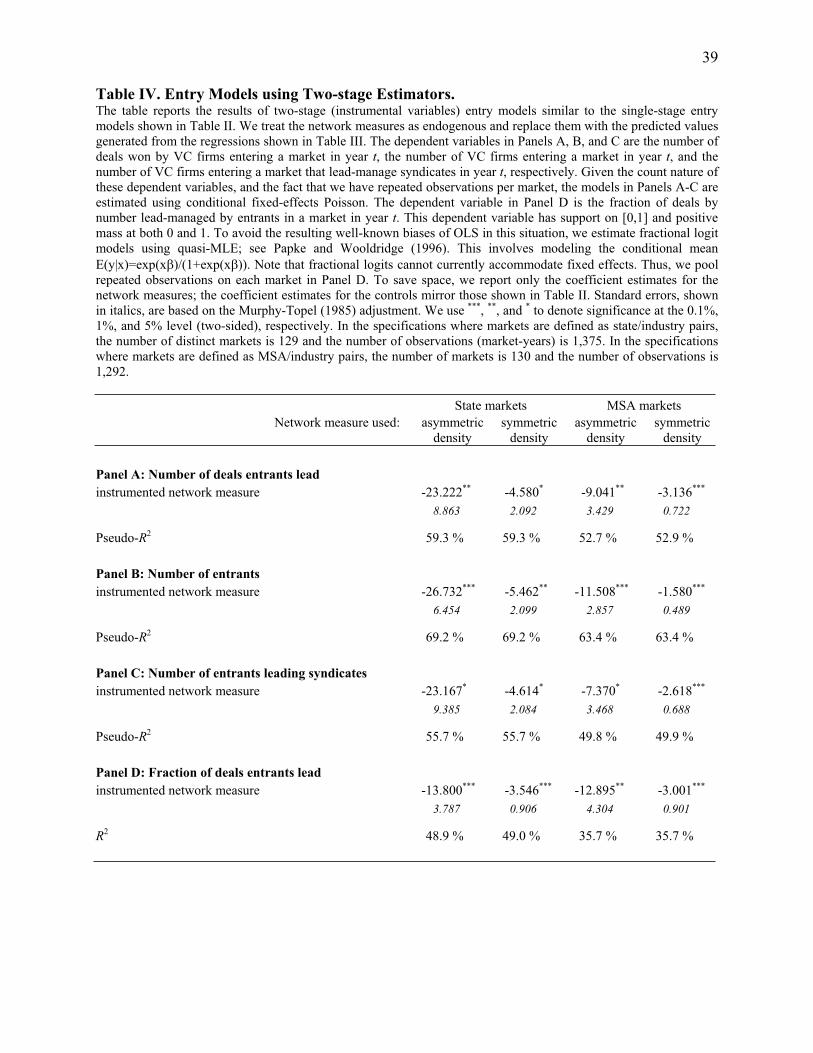
39
Table IV. Entry Models using Two-stage Estimators. The table reports the results of two-stage (instrumental variables) entry models similar to the single-stage entry models shown in Table II. We treat the network measures as endogenous and replace them with the predicted values generated from the regressions shown in Table III. The dependent variables in Panels A, B, and C are the number of deals won by VC firms entering a market in year t, the number of VC firms entering a market in year t, and the number of VC firms entering a market that lead-manage syndicates in year t, respectively. Given the count nature of these dependent variables, and the fact that we have repeated observations per market, the models in Panels A-C are estimated using conditional fixed-effects Poisson. The dependent variable in Panel D is the fraction of deals by number lead-managed by entrants in a market in year t. This dependent variable has support on [0,1] and positive mass at both 0 and 1. To avoid the resulting well-known biases of OLS in this situation, we estimate fractional logit models using quasi-MLE; see Papke and Wooldridge (1996). This involves modeling the conditional mean
E(y|x)=exp(x )/(1+exp(x )). Note that fractional logits cannot currently accommodate fixed effects. Thus, we pool repeated observations on each market in Panel D. To save space, we report only the coefficient estimates for the network measures; the coefficient estimates for the controls mirror those shown in Table II. Standard errors, shown in italics, are based on the Murphy-Topel (1985) adjustment. We use ***, **, and * to denote significance at the 0.1%, 1%, and 5% level (two-sided), respectively. In the specifications where markets are defined as state/industry pairs, the number of distinct markets is 129 and the number of observations (market-years) is 1,375. In the specifications where markets are defined as MSA/industry pairs, the number of markets is 130 and the number of observations is 1,292.
State markets MSA markets
Network measure used: asymmetric density
symmetric density
asymmetric density
symmetric density
Panel A: Number of deals entrants lead
instrumented network measure -23.222** -4.580* -9.041** -3.136***
8.863 2.092 3.429 0.722
Pseudo-R2 59.3 % 59.3 % 52.7 % 52.9 %
Panel B: Number of entrants
instrumented network measure -26.732*** -5.462** -11.508*** -1.580***
6.454 2.099 2.857 0.489
Pseudo-R2 69.2 % 69.2 % 63.4 % 63.4 %
Panel C: Number of entrants leading syndicates
instrumented network measure -23.167* -4.614* -7.370* -2.618***
9.385 2.084 3.468 0.688
Pseudo-R2 55.7 % 55.7 % 49.8 % 49.9 %
Panel D: Fraction of deals entrants lead
instrumented network measure -13.800*** -3.546*** -12.895** -3.001***
3.787 0.906 4.304 0.901
R2 48.9 % 49.0 % 35.7 % 35.7 %

40
Table V. Entry Models with Correction for Omitted Variables. The table reports the results of entry models purged of the effects of omitted variables that are time-varying and either location-specific (Clt) or industry-specific (Cst) and that simultaneously affect networking decisions and entry. The omitted variable correction exploits the nested panel structure of our data. It consists of augmenting the entry models with proxies for Clt and Cst, constructed as densitylst – mean(densitylst) – [predicted densitylst – mean(predicted densitylst)]. To obtain a proxy for Clt, means are computed across locations l and within year t andindustry s; for Cst, means are computed across industries s and within year t and location l. Predicted densities are obtained from the models shown in Table III, without instruments. The inclusion of Clt and Cst in the entry model removes the effect of the omitted variables from the coefficients estimated for the networking variables, our primary variables of interest. The dependent variables and econometric specifications are the same as for the entry models shown in Table IV. To save space, we report only the coefficient estimates for the network measures; the coefficient estimates for the controls mirror those shown in Table II. Standard errors are shown in italics. We use ***, **, and * to denote significance at the 0.1%, 1%, and 5% level (two-sided), respectively. In the specifications where markets are defined as state/industry pairs, the number of distinct markets is 129 and the number of observations (market-years) is 1,375. In the specifications where markets are defined as MSA/industry pairs, the number of markets is 130 and the number of observations is 1,292.
State markets MSA markets
Network measure used: asymmetric density
symmetric density
asymmetric density
symmetric density
Panel A: Number of deals entrants lead
network measure -25.857*** -9.107*** -22.574* -8.535***
5.698 1.314 9.635 1.807
Pseudo-R2 59.4 % 59.7 % 52.8 % 53.2 %
Panel B: Number of entrants
network measure -15.557*** -5.865*** -13.109 -4.312**
4.556 1.120 6.929 1.479
Pseudo-R2 69.2 % 69.4 % 63.4 % 63.5 %
Panel C: Number of entrants leading syndicates
network measure -22.337*** -8.405*** -22.565** -8.238***
5.414 1.258 8.634 1.665
Pseudo-R2 55.6 % 55.9 % 49.8 % 50.1 %
Panel D: Fraction of deals entrants lead
network measure -10.762 -5.894*** -13.630 -4.902*
6.742 1.469 10.643 2.042
R2 48.2 % 49.1 % 35.6 % 35.9 %

41
Table VI. Entry Levels and Rates. In this table, we define a market as a combination of one of the six Venture Economics industries and a U.S. state. (Results for markets defined as MSA/industry pairs are similar and not shown.) Venture Economics classifies investments into the following industries: Biotechnology; communications and media; computer related; medical/health/life science; semiconductors/other electronics; and non-high-technology. To qualify for inclusion in the sample, a market has to have a minimum of 25 investments in the prior five years and five investments in the current year. There are 129 markets with between one and 24 annual observations, giving a total number of observations of 1,375. Potential entrants are defined as U.S. VC firms that have never invested in a given market prior to year t. Entrants are defined as potential entrants that invest in the market in year t. The fractions of potential entrants that enter in the final column are pairwise significantly different at the 0.1% level for each question in the table.
Total # of potential entrants # entering % entering
Panel A: Prior syndication ties to incumbents
Has potential entrant participated in deals led by incumbents in prior 5 years? (positive indegree) Yes 260,399 8,786 3.37 No 1,186,769 11,690 0.99
Has potential entrant led deals with incumbents as co-investors in prior 5 years? (positive outdegree) Yes 170,659 6,483 3.80 No 1,276,509 13,993 1.10
Panel B: Proximity to target market
Is the potential entrant located within 100 miles of the center of the target market? Yes 74,963 3,757 5.01 No 1,215,246 15,499 1.28
Panel C: Prior investment experience
Has potential entrant invested in the same industry and same state in prior 5 years (but not in this market)? Yes 91,891 4,061 4.42 No 1,355,277 16,415 1.21
Has potential entrant invested in the same state but not the same industry in prior 5 years? Yes 81,409 2,245 2.76 No 1,365,759 18,231 1.33
Has potential entrant invested in the same industry but not the same state in prior 5 years? Yes 484,014 7,180 1.48 No 963,154 13,296 1.38

42
Table VII. Firm-level Entry Models: Syndicate Membership. The dependent variable equals one if the potential entrant enters, and zero otherwise. Where markets are defined as state/industry pairs, there are 1,131 market-years and 3,024 distinct potential entrants. Where markets are defined as MSA/industry pairs, there are 970 market-years and 2,993 distinct potential entrants. All models are estimated using probit MLE. Intercepts and year fixed effects are not shown. Heteroskedasticity-consistent standard errors are shown in italics. We use ***, **, and * to denote significance at the 0.1%, 1%, and 5% level (two-sided), respectively.
State markets MSA markets
Network measure used: asymmetric density
symmetric density
asymmetric density
symmetric density
network measure -1.748*** -0.493*** -1.472*** -0.368**
0.482 0.122 0.454 0.121
Potential entrants
=1 if positive outdegree 0.037* 0.041** 0.110*** 0.111***
0.015 0.015 0.017 0.017
… x network measure 3.276*** 0.794*** 1.149 0.289
0.703 0.180 0.709 0.179
=1 if positive indegree 0.065*** 0.064*** 0.077*** 0.070***
0.014 0.014 0.016 0.016
… x network measure 3.207*** 0.846*** 3.401*** 0.953***
0.669 0.170 0.669 0.169
ln(1+assets under management since VC firm’s inception) 0.069*** 0.069*** 0.050*** 0.050***
0.002 0.002 0.002 0.002
=1 if located within 100 miles of center of market 0.530*** 0.530*** 0.582*** 0.582***
0.009 0.009 0.009 0.009
=1 if has invested in same industry and same area (-5 yrs) 0.390*** 0.389*** 0.488*** 0.486***
0.011 0.011 0.012 0.012
=1 if has invested in same industry but not in area (-5 yrs) 0.181*** 0.181*** 0.228*** 0.228***
0.008 0.008 0.009 0.009
=1 if has invested in same area but not in industry (-5 yrs) 0.131*** 0.130*** 0.119*** 0.118***
0.013 0.013 0.016 0.016
Continued over.

43
Table VII. Firm-level Entry Models: Syndicate Membership (Continued).
State markets MSA markets
Network measure used: asymmetric density
symmetric density
asymmetric density
symmetric density
Market, state, and industry characteristics (t-1)
excess investment performance in market 0.065 0.061 0.068 0.068
0.039 0.039 0.039 0.039
value-weighted mean industry book/market ratio -0.329*** -0.333*** -0.309*** -0.302***
0.023 0.024 0.027 0.028
coeff. variation of monthly no. of deals in market 0.156*** 0.156*** 0.138*** 0.138***
0.015 0.015 0.016 0.015
log inflow into VC funds in industry ($m) 0.037*** 0.037*** 0.031*** 0.032***
0.004 0.004 0.004 0.004
log no. deals in market 0.347*** 0.346*** 0.340*** 0.342***
0.006 0.006 0.006 0.007
log real GSP ($m) -0.003 -0.003 0.002 0.002
0.005 0.005 0.003 0.003
real GSP growth rate 0.518** 0.533** 0.404* 0.416*
0.181 0.181 0.174 0.174
Diagnostics
Pseudo-R2 15.8 % 15.8 % 16.2 % 16.2 %
Wald test: all coeff. = 0 ( 2) 26,945*** 26,990*** 22,858*** 22,893***
Wald test: network measure · (1+ outdegree) = 0 4.0* 2.3 0.2 0.2
Wald test: network measure · (1+ indegree) = 0 4.5* 4.0* 8.1** 11.5***
Wald test: network measure · (1+ indegree + outdegree) = 0 65.6*** 58.9*** 27.1*** 33.2***
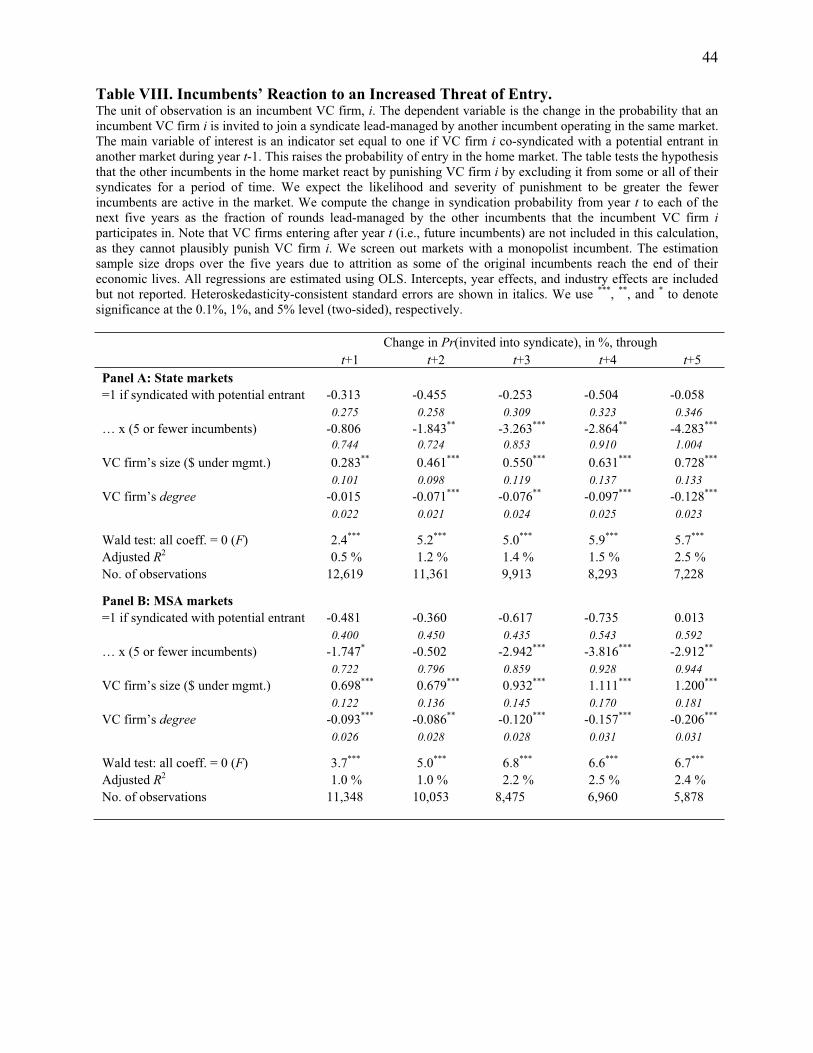
44
Table VIII. Incumbents’ Reaction to an Increased Threat of Entry. The unit of observation is an incumbent VC firm, i. The dependent variable is the change in the probability that an incumbent VC firm i is invited to join a syndicate lead-managed by another incumbent operating in the same market. The main variable of interest is an indicator set equal to one if VC firm i co-syndicated with a potential entrant in another market during year t-1. This raises the probability of entry in the home market. The table tests the hypothesis that the other incumbents in the home market react by punishing VC firm i by excluding it from some or all of their syndicates for a period of time. We expect the likelihood and severity of punishment to be greater the fewer incumbents are active in the market. We compute the change in syndication probability from year t to each of the next five years as the fraction of rounds lead-managed by the other incumbents that the incumbent VC firm i
participates in. Note that VC firms entering after year t (i.e., future incumbents) are not included in this calculation, as they cannot plausibly punish VC firm i. We screen out markets with a monopolist incumbent. The estimation sample size drops over the five years due to attrition as some of the original incumbents reach the end of their economic lives. All regressions are estimated using OLS. Intercepts, year effects, and industry effects are included but not reported. Heteroskedasticity-consistent standard errors are shown in italics. We use ***, **, and * to denote significance at the 0.1%, 1%, and 5% level (two-sided), respectively.
Change in Pr(invited into syndicate), in %, through
t+1 t+2 t+3 t+4 t+5
Panel A: State markets
=1 if syndicated with potential entrant -0.313 -0.455 -0.253 -0.504 -0.058
0.275 0.258 0.309 0.323 0.346
… x (5 or fewer incumbents) -0.806 -1.843** -3.263*** -2.864** -4.283***
0.744 0.724 0.853 0.910 1.004
VC firm’s size ($ under mgmt.) 0.283** 0.461*** 0.550*** 0.631*** 0.728***
0.101 0.098 0.119 0.137 0.133
VC firm’s degree -0.015 -0.071*** -0.076** -0.097*** -0.128***
0.022 0.021 0.024 0.025 0.023
Wald test: all coeff. = 0 (F) 2.4*** 5.2*** 5.0*** 5.9*** 5.7***
Adjusted R2 0.5 % 1.2 % 1.4 % 1.5 % 2.5 %
No. of observations 12,619 11,361 9,913 8,293 7,228
Panel B: MSA markets
=1 if syndicated with potential entrant -0.481 -0.360 -0.617 -0.735 0.013
0.400 0.450 0.435 0.543 0.592
… x (5 or fewer incumbents) -1.747* -0.502 -2.942*** -3.816*** -2.912**
0.722 0.796 0.859 0.928 0.944
VC firm’s size ($ under mgmt.) 0.698*** 0.679*** 0.932*** 1.111*** 1.200***
0.122 0.136 0.145 0.170 0.181
VC firm’s degree -0.093*** -0.086** -0.120*** -0.157*** -0.206***
0.026 0.028 0.028 0.031 0.031
Wald test: all coeff. = 0 (F) 3.7*** 5.0*** 6.8*** 6.6*** 6.7***
Adjusted R2 1.0 % 1.0 % 2.2 % 2.5 % 2.4 %
No. of observations 11,348 10,053 8,475 6,960 5,878

45
Table IX. Round-level Valuation Models. The unit of observation is a funding round and the dependent variable is the log of the valuation put on the company in that round. All models are estimated using OLS with market fixed effects. Markets are defined either as state/industry pairs or as MSA/industry pairs. In the latter definition, we lose some observations due to missing zip codes. Year effects are jointly and individually insignificant and so excluded. Intercepts are not shown. Standard errors are shown in italics. We use ***, **, and * to denote significance at the 0.1%, 1%, and 5% level (two-sided), respectively.
Dependent variable: log valuation
State markets MSA markets
Network measure used: asymmetric density
symmetric density
asymmetric density
symmetric density
network measure -12.503*** -3.898*** -10.657*** -4.227***
2.361 0.685 2.135 0.682
fraction of deals won by entrants in previous year 0.616*** 0.648*** 0.353** 0.385***
0.122 0.123 0.112 0.112
Lead investor characteristics
=1 if lead investor in current round is entrant 0.283*** 0.282*** 0.262*** 0.259***
0.027 0.027 0.027 0.027
investment experience (log dollars under management) 0.076*** 0.075*** 0.069*** 0.068***
0.004 0.004 0.004 0.004
Market, state, and industry characteristics
value-weighted mean industry book/market ratio -0.392** -0.349* -0.550*** -0.432**
0.141 0.141 0.146 0.146
price index of publicly traded equity in same industry 0.286*** 0.288*** 0.308*** 0.310***
0.025 0.025 0.026 0.026
log inflow into VC funds in industry ($m) 0.140*** 0.142*** 0.135*** 0.136***
0.012 0.012 0.013 0.013
log no. deals in market 0.030 0.004 0.032 0.004
0.039 0.040 0.038 0.039
proxy for omitted location-specific variable 9.048 3.197** 4.417 1.299
4.894 1.134 4.335 0.924
proxy for omitted industry-specific variable 1.909 0.554 7.310 3.911***
2.948 0.673 3.855 0.990
Company characteristics
=1 if seed or early-stage -0.658*** -0.656*** -0.644*** -0.642***
0.023 0.023 0.026 0.026
=1 if second funding round 0.460*** 0.460*** 0.487*** 0.488***
0.027 0.027 0.030 0.030
=1 if third funding round 0.800*** 0.799*** 0.848*** 0.847***
0.031 0.031 0.035 0.035
=1 if fourth or later funding round 0.964*** 0.963*** 1.035*** 1.034***
0.030 0.030 0.033 0.033
Diagnostics
Adjusted R2 40.1 % 40.1 % 41.5 % 41.6 %
Wald test: all coeff. = 0 (F) 466.5*** 467.2*** 398.7*** 400.4***
No. of rounds 11,106 11,106 9,003 9,003

46
Table X. Alternative Round-level Valuation Models. The unit of observation is a funding round and the dependent variable is the log of the valuation put on the company in that round. To save space, we report only the coefficient estimates of interest; the coefficient estimates for the controls mirror those shown in Table IX. Panel A is the OLS-with-market-fixed-effects specification taken from Table IX and is included for ease of comparison. Panel B corrects for possible endogenous disclosure of round valuations by including the inverse Mill’s ratio from an ordered probit following Hwang, Quigley, and Woodward (2005). Panel C is a mixed linear model with two levels of random effects: For the company and for the market. This hierarchical model, which assumes that company effects are nested within market effects, allows us to control for unobserved company-level valuation drivers. Panel D combines the selection correction of Panel B with the two-level model of Panel C. Standard errors are shown in italics. We use ***, **, and * to denote significance at the 0.1%, 1%, and 5% level (two-sided), respectively.
Dependent variable: log valuation
State markets MSA markets
Network measure used: asymmetric density
symmetric density
asymmetric density
symmetric density
Panel A: Market fixed effects model (from Table IX)
network measure -12.503*** -3.898*** -10.657*** -4.227***
2.361 0.685 2.135 0.682
fraction of deals won by entrants in previous year 0.616*** 0.648*** 0.353** 0.385***
0.122 0.123 0.112 0.112
=1 if lead investor in current round is entrant 0.283*** 0.282*** 0.262*** 0.259***
0.027 0.027 0.027 0.027
Panel B: Heckman-selection corrected model
network measure -10.983*** -3.449*** -9.014*** -3.671***
2.377 0.690 2.151 0.688
fraction of deals won by entrants in previous year 0.631*** 0.659*** 0.380*** 0.408***
0.122 0.122 0.112 0.112
=1 if lead investor in current round is entrant 0.292*** 0.291*** 0.271*** 0.269***
0.027 0.027 0.027 0.027
inverse Mill’s ratio 0.118*** 0.115*** 0.146*** 0.140***
0.021 0.023 0.025 0.026
Panel C: Two-level mixed effects model
network measure -9.094*** -2.721*** -9.934*** -3.521***
2.116 0.610 1.929 0.612
fraction of deals won by entrants in previous year 0.478*** 0.492*** 0.347*** 0.364***
0.104 0.104 0.096 0.096
=1 if lead investor in current round is entrant 0.221*** 0.220*** 0.211*** 0.210***
0.024 0.024 0.024 0.024
LR test vs. linear model 2) 2,391.0*** 2,425.6*** 1,979.6*** 1,977.0***
Panel D: Heckman-correct mixed effects model
network measure -7.245*** -2.165*** -8.127*** -2.902***
2.135 0.617 1.944 0.619
fraction of deals won by entrants in previous year 0.487*** 0.499*** 0.373*** 0.388***
0.104 0.104 0.096 0.096
=1 if lead investor in current round is entrant 0.229*** 0.227*** 0.219*** 0.219***
0.024 0.024 0.024 0.024
inverse Mill’s ratio 0.127*** 0.124*** 0.152*** 0.149***
0.021 0.021 0.023 0.023
LR test vs. linear model 2) 2,424.8*** 2,456.5*** 2,019.1*** 2,013.0***