MANAGERIAL OVERCONFIDENCE AND CORPORATE POLICIES Itzhak...
46
MANAGERIAL OVERCONFIDENCE AND CORPORATE POLICIES Itzhak Ben-David The University of Chicago Chicago IL 60637, USA [email protected] John R. Graham Duke University Durham NC 27708, USA National Bureau of Economic Research Cambridge MA 02912, USA [email protected] Campbell R. Harvey * Duke University Durham NC 27708, USA National Bureau of Economic Research Cambridge MA 02912, USA [email protected] May 2007 ABSTRACT We use a direct measure of overconfidence to test whether managerial overconfi- dence manifests itself in corporate policies. We collect a unique panel of over 6,500 quarterly stock market forecasts (expected returns, and the 10 th and 90 th percentiles of their perceived distributions) by Chief Financial Officers (CFOs) over a span of more than six years. On average, CFOs are miscalibrated: realized returns are within respondents’ 80% confidence intervals only 40% of the time. Controlling for firm char- acteristics, companies with overconfident CFOs (i.e., CFOs with narrow confidence intervals) invest more, have higher debt leverage, pay out fewer dividends, use propor- tionally more long-term than short-term debt, engage in market timing activity, and tilt executive compensation towards performance-based bonuses. In addition, merger announcements by firms with overconfident CFOs are negatively received by investors. JEL Classification: G30, G31, G32, G35 Keywords: Overconfidence, Optimism, Behavioral Biases, Behavioral Corporate Finance, In- vestments, Dividends, Managerial Forecast, Mergers, Corporate Policies * Corresponding author. We thank Jim Bettman, George Constantinides, Werner DeBondt, Simon Ger- vais, Markus Glaser, Dirk Hackbarth (AFA Discussant), Ulrike Malmendier, John Payne, Hersh Shefrin, Doug Skinner, Richard Thaler and workshop participants at the AFA Annual Meetings 2007 at Chicago, University of Chicago, DePaul University, Tel-Aviv University, and the Whitebox Conference for Behavioral Economics at Yale for helpful comments and suggestions. We especially thank Hui Chen for modeling sug- gestions. We also received helpful comments on a preliminary version of this paper at MIT and Yale. We appreciate the research assistance of Hai Huang. All errors are our own.
Transcript of MANAGERIAL OVERCONFIDENCE AND CORPORATE POLICIES Itzhak...
MANAGERIAL OVERCONFIDENCE AND CORPORATE POLICIES
Itzhak Ben-David
The University of ChicagoChicago IL 60637, USA
John R. Graham
Duke UniversityDurham NC 27708, USA
National Bureauof Economic Research
Cambridge MA 02912, [email protected]
Campbell R. Harvey∗
Duke UniversityDurham NC 27708, USA
National Bureauof Economic Research
Cambridge MA 02912, [email protected]
May 2007
ABSTRACT
We use a direct measure of overconfidence to test whether managerial overconfi-dence manifests itself in corporate policies. We collect a unique panel of over 6,500quarterly stock market forecasts (expected returns, and the 10th and 90th percentilesof their perceived distributions) by Chief Financial Officers (CFOs) over a span ofmore than six years. On average, CFOs are miscalibrated: realized returns are withinrespondents’ 80% confidence intervals only 40% of the time. Controlling for firm char-acteristics, companies with overconfident CFOs (i.e., CFOs with narrow confidenceintervals) invest more, have higher debt leverage, pay out fewer dividends, use propor-tionally more long-term than short-term debt, engage in market timing activity, andtilt executive compensation towards performance-based bonuses. In addition, mergerannouncements by firms with overconfident CFOs are negatively received by investors.
JEL Classification: G30, G31, G32, G35Keywords: Overconfidence, Optimism, Behavioral Biases, Behavioral Corporate Finance, In-vestments, Dividends, Managerial Forecast, Mergers, Corporate Policies
∗Corresponding author. We thank Jim Bettman, George Constantinides, Werner DeBondt, Simon Ger-vais, Markus Glaser, Dirk Hackbarth (AFA Discussant), Ulrike Malmendier, John Payne, Hersh Shefrin,Doug Skinner, Richard Thaler and workshop participants at the AFA Annual Meetings 2007 at Chicago,University of Chicago, DePaul University, Tel-Aviv University, and the Whitebox Conference for BehavioralEconomics at Yale for helpful comments and suggestions. We especially thank Hui Chen for modeling sug-gestions. We also received helpful comments on a preliminary version of this paper at MIT and Yale. Weappreciate the research assistance of Hai Huang. All errors are our own.

I. Introduction
A key role of managers is to estimate future unknowns (e.g., demand, cash flows, competition)
and use these predictions as inputs to design corporate policies. Complicating this task,
psychological evidence indicate that people exhibit overconfidence in predictions, i.e., they
forecast probability distributions that are too narrow. This happens either because they
overestimate their ability to predict the future1 or because they underestimate the volatility
of random events.2 Despite the importance of this issue, there has been no wide-scale
empirical research that studies the relation between the overconfidence (miscalibration) of
managers and the corporate policies they devise.
In this paper we measure the overconfidence of managers in a unique sample of over 6,500
stock market forecasts made by top U.S. financial executives. Our measure of overconfidence
is based on miscalibration of beliefs, and operationalized using a method drawn from labo-
ratory experiments of overconfidence. We link our estimate of executive overconfidence to
firm-level archival data and study how miscalibration is reflected in corporate policies. Each
quarter, from March 2001 to March 2007, we surveyed hundreds of U.S. Chief Financial Of-
ficers (CFOs) and asked them to predict expected one- and ten-year market equity returns
as well as the 10th and 90th percentiles of the distribution of market returns. We use the
narrowness of the individual probability distributions for stock market returns as a proxy for
each respondent’s confidence. By evaluating the same forecasting task across all executives,
we can assess whether CFOs are miscalibrated and disentangle this bias from any potential
bias in the mean estimate (optimism). We examine the time-series and cross-sectional de-
1Surveyed subjects typically provide too-narrow confidence bounds for their predictions (Alpert and Raiffa1982). Researchers also document that experts in a variety of professional fields overestimate the precisionof their information, e.g., clinical psychologists (Oskamp 1965), and physicians and nurses (Christensen-Szalanski and Bushyhead 1981, Baumann, Deber, and Thompson 1991).
2Studies have shown that professionals are miscalibrated with regard to estimating the probabilities ofrandom outcomes, e.g., engineers (Kidd 1970) and entrepreneurs (Cooper, Woo, and Dunkelberg 1988). Re-lated to our study, von Holstein (1972) documents that investment bankers provide miscalibrated forecastsof stock market returns; Deaves, Luders, and Schroder (2005) find that stock market forecasters are overcon-fident on average and become more overconfident with past successful forecasts, and Bar-Yosef and Venezia(2006) report that subjects (students and security analysts) in the laboratory exhibit overconfidence in theirpredictions of future accounting numbers. Deaves, Luders, and Lou (2003) find that laboratory subjects whoare miscalibrated also tend to trade excessively.
1

terminants of overconfidence3 (i.e., the narrowness of the confidence interval), and analyze
the relation between our overconfidence measure and a range of corporate policies including
investment, mergers and acquisitions, financing, payout, market timing, and compensation.
Several recent studies examine the relation between corporate policies and managerial
biases. In several papers, Malmendier and Tate capture CEOs’ overestimation of their own
firm’s future returns (feeling “above average”) using the degree of under-diversification of
the executives’ personal portfolios, and also according to their respective characteristics
as they are portrayed in the press (Malmendier and Tate 2005b). They show that biased
managers exhibit high investment-cash flow sensitivity (Malmendier and Tate 2005a), engage
intensively in unsuccessful mergers and acquisitions (Malmendier and Tate 2006), and avoid
tapping the capital markets (Malmendier, Tate, and Yan 2006). Using Malmendier and
Tate’s news-based proxy, Hribar and Yang (2006) show that firms with CEOs who feel
“above average” are more likely to issue point estimates in their earnings forecast (rather
than estimate ranges) and are more likely to manage earnings around these forecasts.
In contrast, our empirical design allows us to separate overconfidence from optimism. We
define overconfidence as a general miscalibration in beliefs (Lichtenstein and Fischoff 1977,
Koriat, Lichtenstein, and Fischoff 1980, Lichtenstein, Fischoff, and Phillips 1982, Kruger and
Dunning 1999, Alba and Hutchison 2000, Shefrin 2001, Soll and Klayman 2004, Hackbarth
2006). According to this definition, overconfident people overestimate the precision of their
own beliefs, or underestimate of the variance of risky processes; in other words, their subjec-
tive probability distributions are too narrow. The specific interpretation of overconfidence is
important particularly when testing theoretical predictions regarding the effects of specific bi-
ases on corporate policies. Theoretical models distinguish between optimistic managers who
overestimate the mean of their firms’ cash flows (Shefrin 2001, Heaton 2002, Hackbarth 2006),
which we refer to as optimism, and overconfident managers who either underestimate the
volatility of their firms’ future cash flows (Shefrin 2001, Hackbarth 2006) or overweight their
private signals relative to public information (Gervais, Heaton, and Odean 2005).4 Our sur-
3Although we measure relative confidence, we use the term overconfidence, given that the majority ofCFOs provide responses that would be considered overconfident by any reasonable scale, as revealed inSection III.
4Daniel, Hirshleifer, and Subrahmanyam (1998) and Gervais and Odean (2001) use similar overconfidencedefinitions for stock market investors.
2
vey allows us to disentangle respondents’ biases in the first and second moments, in other
words, we can measure miscalibration (overconfidence) separately from optimism. To our
knowledge, our paper is the only paper with direct and distinct measures of miscalibration
and optimism, and that links both these constructs to firms and their actions.
The paper consists of two parts. In the first part, we investigate whether respondent CFOs
are, on average, overconfident in their predictions. According to the confidence bounds that
CFOs provide, they are severely miscalibrated: only 40% of the realized S&P 500 returns
fall within the 80% confidence interval that respondents offer. We document that expected
market returns and confidence bounds depend on recent past market returns and on returns
of the CFOs’ own firms. Interestingly, the lower confidence bound is far more sensitive to
past market returns than is the upper confidence bound. As a consequence of the different
sensitivities, CFOs are more confident following high market return periods and less confident
following low market returns periods. This behavior is consistent with Soll and Klayman
(2004), who argue that people make inference about the distribution of random or unknown
variables from a few known cases (such as past returns), and with Arnold (1986), March
and Shapira (1987) and Kahneman and Lovallo (1993), who argue that managers focus
on downside risk. In addition, we document that CFO overconfidence is a time-persistent
characteristic that increases with skill.
In the second part of the paper, we associate CFO overconfidence with a variety of cor-
porate policies. Our main result is that overconfident CFOs maintain aggressive investment
and financing policies, and behave as if they perceive their firms as undervalued by the
market. This result is consistent with the hypothesis that overconfident managers value
risky cash flows with discount rates that are too low (Roll 1986, Gervais, Heaton, and
Odean 2005, Hackbarth 2006).
We find that several corporate policies are associated with the overconfidence of CFOs.
First, firms with overconfident CFOs invest more on average, and in particular, acquire other
firms. Nevertheless, they systematically experience low returns at merger announcements,
suggesting that their merger plans are expected to destroy value in the eyes of investors.
Second, we find that firms with overconfident CFOs have less flexible capital structure.
In particular, debt leverage and the proportion of long-term debt to total debt are higher
3

for firms with overconfident managers. Third, firms with overconfident CFOs pay fewer
dividends. Fourth, these firms repurchase more stock following a decline in their share price,
but issue less stock in response to an increase in price. Finally, in firms with overconfident
CFOs, compensation is more likely to be performance-based, yet total compensation is the
same as in firms of less confident CFOs.
Our paper is organized as follows. Section II details the method that we use to collect
the overconfidence data, the construction of variables, and presents some summary statistics.
In Section III, we provide evidence on the miscalibration in CFO expectations. Section IV
explores the determinants of overconfidence. Section V examines the relation between man-
agerial overconfidence and corporate policies. In Section VI we discuss interpretation issues.
Some concluding remarks are offered in Section VII.
II. Data
A. Executive Survey
Our study is based on a unique data set of stock market predictions made by senior finance
executives, the majority of whom are CFOs and financial vice presidents, collected in 25
quarterly surveys conducted by Duke University between March 2001 and March 2007. Each
quarter we poll between 2,000 and 3,000 financial officers with a short survey on important
topical issues (Graham and Harvey 2006). The usual response rate for the quarterly survey
is 5% to 8% and most of the responses arrive within the first two days of the survey invitation
date.5 The survey usually contains eight questions about the U.S. economy, firm policies,
and firm short-term forecasts. Some of the questions are identical for each survey and some
change through time depending on economic conditions. The historical surveys as well as
the results can be accessed at www.cfosurvey.org.
We base our overconfidence proxies on two survey questions. The first question is:
5The bulk of our tests exploit variation within the respondent group, yet the overall response rate of 5%to 8% could potentially lead to non-response bias in the inference of some tests (e.g., in Section III). Weexplore this issue further in Section II.E.
4

“Over the next year, I expect the average annual S&P 500 return will be:
- There is a 1-in-10 chance it will be less than %
- Expected return: %
- There is a 1-in-10 chance it will be greater than %”
The second question is similar but relates to annualized stock market return forecasts over
the next 10 years, where the first words change from “Over the next year, ...” to “Over the
next 10 years, ...”.6
In contrast to most studies that use survey data, we are able to examine the characteristics
of a sizable fraction of the respondents. Although the survey does not require CFOs to
provide identifying information, in about half of the cases firms voluntarily provide such
information, and about a quarter of the firms are confirmed to be U.S. public firms. Overall,
our sample includes 6,505 one-year expected returns and 5,895 ten-year expected returns
with valid 10th and 90th percentiles. Of this sample, 2,507 observations are from public firms
(self-reported), and of them, we are able to match 1,877 observations (721 unique firms) to
CRSP and Compustat. For the analysis in Section V, we exclude utility firms (2-digit SIC
code 49) and financial firms (2-digit SIC code 60 to 69), and require respondents to respond
to optimism questions (see Section II.C below), leaving 1,074 observations (505 unique firms).
B. Measures of Overconfidence
Our overconfidence measure maps each CFO’s 10th and 90th percentile predictions into an
individual probability distribution for each respondent. Wide distributions reflect high sub-
jective uncertainty about the estimated variable, while narrow distributions reflect subjective
confidence. We use the method proposed by Davidson and Cooper (1976) to recover respon-
dent i’s individual probability distribution, based on the normal distribution. The imputed
volatility is calculated as:
σi =x(0.90)− x(0.10)
Z(1)
6The first question appeared in the surveys in its current form starting 2001Q2. The second question hasbeen asked in its current form since 2002Q1. In the earliest surveys, executives were asked only for theirexpected returns.
5

where x(0.90) and x(0.10) represent the 90th and 10th percentile of the respondent’s dis-
tribution, and Z is the number of standard deviations within the confidence interval. For
confidence intervals of 80% in a normal distribution, Z equals 2.65. Keefer and Bodily (1983)
show that, given information about the 90th and 10th percentiles, this simple approximation
is the preferred method for estimating the standard deviation of a probability distribution
of a random variable.
Our desired measure of overconfidence is a relative measure that is independent of CFOs’
opinions about the future level of the stock market.7 To disentangle the tightness of confi-
dence bounds from the level of expected returns and contemporaneous market effects, we use
a double-sorting procedure. This procedure allows us to measure the narrowness of CFOs’
confidence intervals with respect to confidence intervals of other CFOs who hold similar be-
liefs about the stock market at the same point in time. First, for each survey date, we form
deciles based on expected returns, then within each of these groups, we sort again to form
deciles based on confidence intervals.8 We use this procedure to generate two overconfidence
variables, one short-term and one long-term. Overconfidence ST is the short-term overcon-
fidence measure and is based on one-year forecasts of the S&P 500. Overconfidence LT is
the long-term overconfidence measure, analogously based on the ten-year forecasts. To ease
interpretation of the results, we orthogonalize the two overconfidence variables and scale
them so that they have values between 0 and 1.
C. Attitudes Towards the Stock Market, U.S. Economy and Own
Firms
Our survey data have the advantage of allowing the measurement of overconfidence while
controlling for potential optimism in expected returns. We create two optimism variables,
Optimism ST and Optimism LT , based on expected one- and ten-year return forecasts,
7For example, CFOs who are bullish about the stock market may also anticipate high volatility and thusprovide wide confidence intervals because they believe that the direction of the stock market is related tovolatility, and not because they have low confidence.
8Our results are qualitatively the same if, instead of the double-sorting procedure, we decile rank re-spondents according to their confidence interval scaled by their expected returns. The non-parametricdouble-sorting procedure that we use has the advantage of not imposing a linear relation between confidenceintervals and expected returns.
6

respectively. The optimism variables reflect the decile-rank of expected returns within a
given survey date. Since we are interested in disentangling the effects of optimism from
the effects of overconfidence, we orthogonalize each optimism variable with respect to the
relevant overconfidence variable, and then orthogonalize the long-term optimism variable
against the short-term optimism variable. Finally, we scale the variables to be within 0 and
1.
We are also interested in isolating the effects of overconfidence from other, potentially
correlated, attitudes about the U.S. economy and about own firms. In particular, it is plau-
sible that managers who exhibit overconfidence are also optimistic about the future of their
firms. Alternatively, it is possible that managers who anticipate a bright future for their firms
feel more confident. In these two cases, our tests might capture the effects of the covariates
of overconfidence, rather than the direct effect of overconfidence. To address this concern,
in addition to using Optimism ST/LT about the expected returns of the stock market, we
introduce additional controls for optimism about the U.S. economy (Optimism U.S.) and
for firm-specific optimism (Optimism firm), based on two questions that appear in most
surveys.9 The questions are:
“a. Rate your optimism about the U.S. economy on a scale from 0-100, with 0
being the least optimistic and 100 being the most optimistic.
b. Rate your optimism about the financial prospects for your company on a scale
from 0-100, with 0 being the least optimistic and 100 being the most optimistic.”
To facilitate the interpretation of these variables, we decile-rank them within survey date,
orthogonolize them to each other, and scale them so that they have values between 0 and 1.
D. Firm Data
Throughout the analysis, we use several databases with firm-level information. A detailed
description of the variables is provided in the Appendix. First, we retrieve accounting data
from Compustat, including industry classification, book leverage, asset market-to-book ratio,
9We have responses for these questions for 84% of the identified observations (excluding three surveys:2001Q4, 2002Q1, 2005Q1).
7

profitability, 5-year sales growth, collateralized assets, capital expenditures scaled by lagged
assets, cash spent on acquisitions scaled by lagged assets, and indicator variables for repur-
chases and dividend payments. We merge the survey observations with annual Compustat
data, matching by the nearest fiscal end-of-year date. We also gather information about
equity issuances and repurchased equity from the Quarterly Compustat file. Second, we use
CRSP to compute one-year past returns for the market and firms; in addition we use CRSP
in addition to Compustat to approximate firm age. Third, in our analysis of executive com-
pensation, we use Execucomp. These data include the details of the compensation packages
of the top five executives at the 1,500 largest firms in the U.S. stock market. Fourth, we
use merger transactions data and information about acquired targets from Thomson SDC
Platinum.10
E. Summary Statistics
In Table I, Panels A through D, we present summary statistics for survey responses and
the characteristics of the respondent firms. Panel A presents a broad profile of respondent
firms. The annual sales of the median firm is $2.0bn. The average asset market-to-book
ratio (M/B) is 1.50, and the average annualized five-year sales growth rate is 6.5%. Their
profitability (operating profit scaled by lagged total assets) averages 13.5% and capital ex-
penditure intensity averages 5.1% (capital expenditures scaled by lagged total assets). 54.8%
of the firms pay dividends and 40.1% repurchase their own shares around the survey date.
Respondents come from a balanced range of industries (Table I, Panel B).
In Panel C we compare the attributes of our sample for which we have Compustat data to
the attributes of the pooled population of Compustat firms between 2001 and 2006. Overall,
our sample firms are more established and advanced in their life cycle than most Compustat
firms. In particular, respondent firms are relatively mature and large: 50.2% of the identified
firms in our sample are from the top firm-age quintile of Compustat firms and 62.2% are from
the top sales quintile of Compustat firms. In other characteristics, such as market-to-book
10To ensure that our results are not driven by outliers and following the practice of many studies usingsimilar data, we winsorize our survey data within each survey date at the 1% level. Similarly, we winsorizeCompustat and CRSP data.
8
ratio, past sales growth, and debt, our sample firms are similar to the universe of Compustat
firms. Overall, the portion of our respondents that we can link to Compustat over-samples
large and mature firms, and therefore our results should be interpreted with this in mind.
III. Are CFOs Overconfident?
In this section we conduct two tests to assess whether CFO respondents are, on average,
overconfident. There could be two reasons for CFO overconfidence. First, as discussed
in the introduction, previous studies in psychology have almost unanimously shown that
people, and professionals in particular, are overconfident on average. Second, and most
compelling, is an argument attributed to Goel and Thakor (2005). They argue that top
executives should be expected to be overconfident because promotion in corporations is
typically based on past performance, which is ultimately tied to the risk taken by executives.
Overconfident managers underestimate risk and therefore take actions with excessive risk.
As a consequence, the variance of outcomes from their actions is greater, and therefore
overconfident managers will be over-represented among the right-tail “winners” and are
more likely to get promoted.
We perform two tests to investigate whether CFOs are overconfident. The first test
measures the fraction of ex post S&P 500 return realizations that fall between the 10th and
90th percentiles provided by CFOs’ predictions. The second test compares the individual
volatility imputed from the survey data to the individual volatility as predicted by a simple
model of bias.
A. Ex Post Realizations vs. Ex Ante Predictions
We begin by calculating CFO overconfidence as miscalibration of beliefs. We compute the
percentage of executives for whom the realized return of the stock market falls within their
80% confidence intervals as derived from the 10th and 90th percentile survey responses. If
executives are well-calibrated and our sample period is representative, we expect this figure
to be 80%.
9

Table II presents the response statistics per survey. We list the survey means for the
lower confidence bounds (column (1)), expected returns (column (2)), and upper confidence
bounds (column (3)) for the one-year forecasts. In column (4) we present the mean of the
individual volatilities where each is computed using Equation (1), and column (5) contains
the disagreement volatility (dispersion of beliefs), which is calculated as the standard devi-
ation of expected returns across all respondents for any given date. Similarly, we present
the results for the ten-year forecasts starting in column (6). Finally, we report market data
in columns (11) to (13): realized returns and volatility for the forecasted horizon, and the
VIX11 for the survey date.
Table III compares the S&P 500 forecasts to realizations. In column (1) we calculate the
average forecast error (the difference between mean expected returns from Table II, column
(2), and the S&P 500 return realization in column (11)). The mean forecast error is 2.5%.
In columns (2) to (4) of Table III we compute for each survey cohort the percentage
of CFOs for whom the S&P 500 realization was in the 80% confidence interval. We judge
whether CFOs are miscalibrated by examining whether ex post market realizations fall in the
ex ante confidence intervals. Over the sample period, only 40.4% of the stock market return
realizations are within the 80% confidence bounds estimated by CFOs (see column (3) and
Figure 1). This degree of miscalibration is not unusual for studies that request respondents
to estimate 80% confidence bounds (Lichtenstein, Fischoff, and Phillips 1982, Russo and
Schoemaker 1992, Klayman, Soll, Gonzales-Vallejo, and Barlas 1999, Soll and Klayman
2004). Thus, based on a miscalibration definition, CFOs as a group are overconfident in our
sample.
B. Model of Bias
Next, we consider a simple model of forecasting that allows us to assess ex ante whether
CFOs are overconfident. With the model, we assess the tightness of CFO confidence intervals
without needing to compare forecasts to outcomes (as in the Section III.A). This procedure
11VIX is an index that reflects the average of imputed volatility across traded options in the S&P 500futures index, traded in the Chicago Board of Options Exchange (CBOE).
10

helps us assess whether ten-year stock market forecasts are too tight (even though ex post
realizations are not yet available), and also provides additional tightness benchmarks for the
one-year forecasts. In particular, we test whether the 10th and 90th percentiles provided by
CFOs fit anticipated volatility, as well as whether they are calibrated to historical S&P 500
volatility.
We assume that the true model of the S&P 500 returns is:
rSP = µSP + εSP , (2)
where µSP is the unobservable mean return, and the error term εSP ∼ N(0, σ2SP ).
Forecaster i believes that the future return of the S&P 500 is
ri = µi + εi, (3)
where µi is the mean return estimate, and εi is a forecaster-specific error term. The forecaster
does not know the unobservable mean return of the stock market µSP , instead she believes
that
µi = µSP + e + ei, (4)
where e potentially captures a systematic bias in beliefs about the mean. If e > 0 then fore-
casters are on average optimistic. The error term ei captures the uncertainty that forecaster
i has about the mean, and ei ∼ N(0, σ2e). For simplicity, we assume mutual independence
between ei and εi.
The forecaster-specific error term εi is assumed normally distributed εi ∼ N(0, σ2SP + θi).
The additional term θi potentially captures overestimation (θi < 0) or underestimation
(θi > 0) of stock market volatility. This parameter corresponds with the definition of over-
confidence as underestimating the volatility of random process (as in Hackbarth 2006).
Thus the total variance of the forecasted returns ri is:
σ2i = σ2
SP + θi + σ2e . (5)
11

In the context of our survey, we interpret the CFO responses as the mean and the 10th and
90th percentiles of the return distribution ri, from which we can extract the total variance
σ2i .
B.1. Model Calibration: Are CFOs Optimistic?
Using the survey data, we calibrate some of the parameters of the model.12 We estimate
whether CFOs are optimistic on average with respect to the S&P 500 by examining whether
their forecast errors (expected returns minus realized returns) are significantly greater than
zero. The forecast error, therefore, is:
e = E[ri]− µSP . (6)
Forecast errors are presented in Table III, column (1). The average forecast error is positive
but insignificantly different from zero e = 2.5% (t = 0.49). Hence, expected returns provided
by the CFOs appear unbiased within the sample period.
B.2. Model Calibration: Are CFOs Overconfident?
We first assess whether CFOs are overconfident in the short-term. For each survey we
estimate the mean bias about the variance, θ, across agents:
θ = E[σ2i ]− σ2
SP − σ2e . (7)
We estimate E[σ2i ] as the mean of the individual variances in each survey, averaged across
surveys (0.0040), and σ2e as the variance of point estimates across forecasters, averaged across
surveys (0.0015). We use three different proxies for the variance of the stock market, σ2SP ,
based on: (1) market expectation of future stock market variance, averaged across surveys13
12All our statistical inferences adjust for the overlapping periods, using Newey and West (1987).13Based on the VIX index (see Table II, column (13)). The mean annual variance imputed by the VIX
over the sample period was 0.0443 (21.0% in standard deviation terms).
12
(0.0443), (2) realized stock market variance, averaged across surveys14 (0.0286), and (3)
historical stock market variance15 (0.0201).
Even if we pick the most conservative estimate for the variance of the stock market,
drawn from historical statistics, CFOs underestimate the variance of the stock market by
E[θ] = −0.0176 (t = −67.7) (−13.3% in standard deviation terms). Therefore, CFOs are
overconfident as a group according to the short-term miscalibration definition.16
Next, we assess ex ante whether CFOs are overconfident in the long-term. To do so,
we re-estimate Equation (7) for the long-term overconfidence. We estimate E[σ2i ] as the
mean of the individual variances, averaged across surveys (0.0015), and σ2e as the mean
of the variance of point estimates, averaged across surveys (0.0007) (both are annualized
estimates). We use two estimates for the ten-year stock market variance, σ2SP , both based on
historical realizations: (1) the average annualized stock market variance across all ten-year
windows since 1950 (0.0209), and (2) the lowest annualized stock market variance across all
ten-year windows since 1950 (0.0129).
The results indicate that CFOs in our sample are overconfident in the long-term. When
using the average stock market variance for the calculation, the bias in the perceived variance
of stock market returns is θ = −0.0201 (−14.2% in standard deviation terms). Based on
the lowest stock market variance in any given ten year window, CFOs still underestimate
the variance by θ = −0.0121 (−11.0% in standard deviation terms). This bias is depicted
in Figure 3. The top histogram presents the distribution of annualized ten-year historical
market volatilities and the bottom histogram presents the distribution of the corresponding
survey-imputed volatilities. While historical ten-year volatilities are concentrated between
14The mean of the squared one-year realized volatility: 0.0286 (16.9% in standard deviation terms; seeTable II, column (12)).
15The variance of the S&P 500 is the mean of all historical one-year windows of realized variance of theS&P 500 between January 1950 and December 2006, 0.0201 (14.2% in standard deviation terms). Thehistorical distributions of the one-year volatilities are illustrated in Figure 2. In the top chart we present thehistogram of the distribution of one-year historical volatilities of the S&P 500. In the bottom panel of thefigure we provide the histogram of imputed survey volatilities for comparison. The histograms indicate thatCFOs anticipate distinctly lower volatilities than those actually experienced over the previous 57 years.
16We could also introduce a bias in the uncertainty about the mean, σ2e , relative to a Bayesian forecaster.
Such a parameter would match the definition of overconfidence as being “too sure of oneself,” i.e., forecastersdiscount the public signal (as in Gervais, Heaton, and Odean 2005). Nonetheless, the size of such bias isbounded from above by σ2
e and therefore is economically unimportant relative to the empirical size of theestimated bias in the variance θ.
13
11% and 16%, almost the entire distribution of survey-based volatilities is below 10%. The
fact that overconfidence is stronger in the long-term than in the short-term is consistent
with the findings of Gilovich, Kerr, and Medvec (1993) that overconfidence increases with
the temporal distance between forecast and realization.
IV. Determinants of Overconfidence
In this section, we investigate which factors affect managerial forecasts, and examine some
candidate variables that could potentially explain temporal and cross-sectional overconfi-
dence.
A. Past Market and Firm Performance
There is theoretical justification that, following good outcomes, people predict narrower
distributions of future events. In a model by Einhorn and Hogarth (1978), decision makers
“learn” about their ability by observing the outcomes of past decisions, ignoring exogenous
determinants of these outcomes. Following favorable outcomes, decision makers become more
confident about their judgemental abilities through a self-attribution mechanism, even if the
outcome was independent of their prior decisions. In applying this idea to trading behavior,
Gervais and Odean (2001) argue that traders become overconfident after observing a series
of past successes that they attribute to their own abilities. As an extension of this reasoning,
Hilary and Menzly (2006) find that security analysts exhibit greater aggressiveness following
successes in predicting earnings.
Table IV explores the relation between one-year survey forecasts and future and past
S&P 500 return realizations.17 In Panel A we regress average forecasts across surveys (lower
bounds, expected returns, and upper bounds), as well as the average imputed individual
volatility, on future and past S&P 500 one-year returns. Since we examine quarterly forecasts
for one-year horizons, we encounter autocorrelations due to overlapping data and therefore
17For brevity we present only analysis of one-year forecasts. Ten-year forecasts exhibit similar patterns.Results are available upon request.
14

adjust the standard errors for the two-year overlap18 in the data using the Newey and West
(1987) procedure with 7 quarterly lags. The negative (and statistically insignificant) coeffi-
cients on one-year future S&P returns in columns (1) to (3) indicate that the CFOs’ stock
market forecasts are not associated with future market return realizations.
Interestingly, CFOs are more confident following periods of high stock market returns.
One-year forecasts are correlated with past S&P 500 returns (columns (1) to (3) in Panel
A). This effect is especially strong on the lower bound (R2 = 0.76) and on the expected
returns that CFOs provide. Since the average confidence upper bounds are not affected
by past returns very much (R2 = 0.11), individual volatility effectively increases following
poor past returns and decreases following periods of high stock market returns (negative
coefficient in column (4)).19 This effect is well depicted in 10th and 90th percentiles (averaged
across respondents) in Figure 4. In March 2003, the lower confidence bound was relatively
low (−7.0%) because the actual S&P 500 return in the year before the survey date was
exceptionally low (−31.0%). Likewise, the average lower confidence bound in September 2003
was relatively high (1.1%) because the realized return in the preceding year was especially
high (17.5%). The average upper confidence bound, however, does not co-move as much
with past market returns. These results are consistent with the model of Gervais and Odean
(2001) and with Alba, Hutchison, and Lynch (1991) and Soll and Klayman (2004), who
argue that forecasters often use past extreme cases to estimate the distribution of uncertain
variables. The lower confidence bound is particularly sensitive to past returns, perhaps
because managers tend to focus on downside risk in their analysis of projects (Arnold 1986,
March and Shapira 1987, Kahneman and Lovallo 1993).
In Panel B of Table IV, we test whether CFO stock market forecasts are influenced
by past returns of their own firms. In these regressions, we face cross-sectional correlation
(executives forecast the same index) and overlapping data problems (forecasting horizon
is one year and observations are quarterly). We resolve the issue by using a Fama and
MacBeth (1973) approach in which we perform cross-sectional regressions of forecasts on
past one-year firm returns. Then, we compute the mean of the regressions’ coefficients and
18Allowing for data overlap for both one-year past returns and for one-year future returns.19These results are in line with Deaves, Luders, and Schroder (2005), who analyze the forecasts of German
stock market forecasters and with Shefrin (2005), who reports results from the UBS survey of retail investors.
15

adjust the standard errors with the Newey and West (1987) procedure for three lags. This
procedure is also advantageous because it implicitly demeans firm returns each quarter, so
that the effects depicted in the regressions in Panel B are distinct from the effects depicted
in the regressions in Panel A. The results suggest that lower return bounds and expected
returns provided by CFOs are associated with their own firms’ past returns. Comparing the
results in Panel A to those in Panel B, we note that the effect of past market-wide returns
on the confidence bounds is larger by an order of magnitude, relative to the effect of past
firm-specific returns.
B. Personal Characteristics
In this section, we examine the personal determinants of CFO overconfidence. In particu-
lar, we explore the persistence of overconfidence through time, its relation to demographic
attributes, and its association with skill.
B.1. Persistence of Overconfidence
First, we investigate whether overconfidence and optimism are persistent characteristics of
decision makers. Across surveys, there are 764 pairs of sequential responses from the same
executives (i.e., respondent from the same firm with same position in the firm). For these
observations, the correlation between sequential Overconfidence ST (Overconfidence LT )
is 0.46 (0.30), and the correlation between sequential Optimism ST (Optimism LT ) is
slightly lower 0.33 (0.27). Hence, both optimism and overconfidence persist through time
for a given CFO, although overconfidence exhibits stronger persistence. These results are
consistent with evidence about the stability of individual biases over time (Jonsson and
Allwood 2003, Glaser, Langer, and Weber 2005).
B.2. Demographic Profile
Second, we conduct a test that explores the relation between executive biases and demo-
graphic characteristics. We collect demographic details from respondents in two surveys
16
(2003Q4 and 2004Q1). The questions inquire about age, education, professional experience,
and gender. Our analysis (untabulated) reveals few significant relations between overconfi-
dence and demographic attributes. Specifically, we find that CFOs with different levels of
education and experience express the same degree of overconfidence, while older CFOs are
more overconfident in the short-term. Furthermore, we find no significant gender difference
in overconfidence.
B.3. Do Overconfidence Variables Capture Skill?
Third, we consider the possibility is that our overconfidence measures simply capture skill
rather than miscalibration, i.e., CFOs who forecast the stock market better also provide
narrower confidence bounds. To investigate the relation between overconfidence and skill
we examine whether overconfident CFOs produce more accurate forecasts. Table V, column
(1) presents regressions of absolute forecast error (as a proxy for skill) on the overconfidence
variables. The results indicate that overconfident CFOs predict future stock market returns
more precisely.
However, the tradeoff between the size of confidence intervals and the improvement in
accuracy is less than proportional. When moving from the median to the top decile of long-
term overconfidence, the size of confidence intervals decreases by about 6.5% (untabulated),
but the average absolute forecast error decreases only by 0.32% (half of 0.63%, Table V,
column (1)). This difference in magnitudes implies that miscalibration could overshadow
accuracy on net. In other words, although overconfident CFOs are slightly more accurate,
their confidence intervals are still much too narrow.
To test this hypothesis, we examine whether the likelihood that a realization would fall
within the confidence interval is correlated with overconfidence, even after controlling for
the absolute forecast error. Thus, we regress an indicator variable of whether S&P 500
realizations fall within each individual confidence interval on two variables: the individual
overconfidence measures, and the absolute forecast error. If skill (low forecast error) entirely
explains CFOs’ tight confidence intervals, then the overconfidence variables should not be sig-
nificant in the regression. The results in column (2) show that both overconfidence variables
17

remain negative and statistically significant even after controlling for the absolute forecast
error. These results are consistent with the findings of the psychological literature suggesting
that overconfidence increases with accuracy (Sporer, Penrod, Read, and Cutler 1995) and
expertise (Arkes, Dawes, and Christensen 1986, Paese and Feuer 1991, Spense 1996). We
conclude therefore that although CFO overconfidence is associated with skill, our overconfi-
dence measures capture genuine miscalibration.
C. Firm Characteristics
Next, we investigate whether CFO overconfidence and optimism are related to firm char-
acteristics. We assess whether company age, profitability, sales growth, firm size, market-
to-book, or 12-month past returns are associated with overconfidence and optimism. In an
untabulated analysis we find that CFOs who work for large firms, high past growth firms,
and firms with high past 12-month returns are more confident in the short-term. CFOs at
high market-to-book firms are overconfident in the long-term. CFOs at old firms, profitable
firms, small firms, and firms with high past returns are more optimistic about the S&P 500,
and CFOs from successful firms (high market-to-book and high past returns) are optimistic
about the prospects of their own firms.
V. Managerial Overconfidence and Corporate Policies
In this section, we investigate whether corporate policies are associated with biases in the
beliefs of decision makers. In a previous study, Bertrand and Schoar (2003) document that
managers have their own unique personal style which helps to explain the cross-section of
corporate policies. Overconfidence may be one of the managerial traits that affects decision
making. In particular, overconfident managers may make different decisions than do their
peers in a variety of corporate domains that involve assessing uncertain outcomes.
In general, overconfidence can cause two related effects. First, overconfident managers
underestimate the risk in cash flows. As a consequence executives may perceive some
negative NPV projects as profitable and therefore invest too much (Gervais, Heaton, and
18

Odean 2005, Aktas, de Bodt, and Roll 2005, Hackbarth 2006) and/or divert internal funds
towards investment (Hackbarth 2006). In addition, overconfident managers are hypothesized
to choose an aggressive capital structure for their firms (Hackbarth 2006), or they may agree
to link their compensation more closely to performance (Keiber 2002). Second, because
overconfident managers underestimate the volatility of risky processes, they may perceive
their firms’ cash flows as safer than they really are. In other words, they believe that their
firms are undervalued by the market (Hackbarth 2006). As a result, they may repurchase
shares more intensely in response to a decline in share prices, or may be more reluctant to
issue new shares following run-ups in price, in anticipation of further increases.
All our corporate policy regressions contain a similar set of controls for the known deter-
minants of such policies. Specifically, our controls include collateral (measured as the portion
of tangible assets out of total assets), logged firm value, asset market-to-book, book lever-
age, profitability, 5-year past sales growth, 12-month past returns, a dividend-payer dummy,
industry fixed effects, and survey date fixed effects. In addition, we include the S&P 500
optimism variables and firm and U.S. optimism variables. We believe that these variables
control for common determinants of corporate policies, including for growth opportunities
that could be correlated with overconfidence. Furthermore, to keep consistency with the
corporate finance literature, we exclude utilities and financial firms from the sample. In a
robustness test, we confirm that our results qualitatively hold for the entire sample of firms.
A. Investment Policy
The first prediction that we test is proposed by several theoretical studies. Roll (1986),
Shefrin (2001), Gervais, Heaton, and Odean (2005), Hackbarth (2006), and Goel and Thakor
(2005) predict that managers who underestimate risk end up investing more. We test this
hypothesis by regressing capital expenditure (capex) intensity and acquisition intensity on
overconfidence and control variables. The capex intensity variable is computed as quarterly
capital expenditures scaled by lagged assets. Acquisitions intensity is calculated as the dollar
value of quarterly acquisitions scaled by lagged assets.
19

The results for the investment analysis are presented in Table VI, columns (1) and (2).
Overall, firms with overconfident managers invest more in capital expenditures in general
(column (1)), and in acquisitions in particular (column (2)). Both capital expenditures and
acquisitions intensity strongly increase with long-term overconfidence but not with short-
term overconfidence (t = 2.8 and t = 2.0, respectively), possibly because investments are
generally long-term decisions. To quantify the effect, moving from the median to the top
decile of overconfidence increases firm capital expenditures by about 1.7% (the mean of
capex intensity across sample firms is 8.1%). Note that other than long-term overconfidence,
no other confidence- or optimism-related variable is statistically significant, stressing the
importance of our overconfidence measure in the decision making process.
We further investigate the relation between CFO overconfidence and the characteristics of
mergers executed by their firms. In column (3) of Table VI, we analyze the market reaction
to merger announcements. For each observation in our sample we match announced mergers
from Thomson SDC Platinum according to the nearest date to the survey date, restricting
the date-difference to, at most, two years. The regression includes controls for the method of
payment (stock or cash), whether the merger is diversifying or not (according to whether the
acquirers’ 2-digit SICs match their targets’ 2-digit SICs), and the logged transaction value.
Our results show that merger plans by firms of overconfident managers are negatively
received by the market. In column (3) we use a sample of 373 merger announcements to
regress announcement returns (3-day market-adjusted returns around the announcement
event) on overconfidence and optimism variables. We find that firms of overconfident CFOs
(in the long-term) experience lower announcement returns at an economically and statisti-
cally significant magnitude (t = −2.3). Malmendier and Tate (2006) report a similar effect
on announcement returns for CEOs who do not exercise their executive options, and who are
described as “optimistic” and “confident” in the press. Consistent with the previous results
about firm investments, also in this case overconfidence is the only attitude variable that
is significant in the regression. A shift from the median to the top decile of overconfidence
reduces announcement returns by −1.2% (mean announcement returns are 0.9%).
20

B. Capital Structure Policy
Hackbarth (2006) argues that overconfident managers pursue aggressive financial policies.
In particular, overconfident managers believe that the volatility of their firms’ cash flows is
lower than it actually is, and therefore they underestimate the chances of bankruptcy. As a
consequence, overconfident CFOs may choose more aggressive debt policies.
Our tests concentrate on two types of debt policies: leverage and maturity structure.
First, we regress book-leverage on a set of right-hand side variables similar to those used
in the previous tests. The results in Table VI, column (4), indicate that overconfidence
is positively related to debt leverage, although weakly so (t = 1.8 and t = 0.6 for short-
term overconfidence and long-term overconfidence, respectively). To illustrate the economic
magnitude of the effect, a shift from the median to the top decile of overconfidence increases
leverage ratios by about 1.5% (average leverage in our sample is 21.2%).
Second, we test whether overconfidence leads managers to select a risky capital structure,
in the sense of being inflexible. In particular, overconfident CFOs may commit their firms to
long-term interest payments, thereby committing debt capacity and potentially increasing
interest rate risk. Furthermore, overconfident CFOs may be able to convince investors to
supply long-term funds based on the current assets in place more effectively than could their
peers.
We test this hypothesis in column (5). We construct a variable that measures the portion
of long-term debt (above one year in maturity) out of total debt (LT debt/Total debt) and
use it as the dependent variable. In column (5), the coefficients on both overconfidence
variables are positive and statistically significant (t = 1.8 and t = 2.4 for short-term and
long-term overconfidence, respectively). An increase from the median to the top decile in each
overconfidence variable is associated with a higher share of long-term debt by about 7.9%
(the mean proportion of long-term debt out of total debt is 76.2%). Thus, overconfidence is
associated with committing more heavily to long-term debt.
21

C. Payout Policy
Executive overconfidence could also be associated with payout policy. Overconfident man-
agers may believe that available investment opportunities are less risky or more profitable
than they really are, and therefore overestimate their net present value (Gervais, Heaton,
and Odean 2005). To finance those projects, overconfident managers might use funds that
otherwise would have been paid out to investors as dividends (Hackbarth 2006). This pre-
diction is consistent with survey evidence of Brav, Graham, Harvey, and Michaely (2005)
who document that dividend-paying firms are on average mature firms with less available
investment opportunities; hence, firms of overconfident managers may pay less dividends
because their managers perceive greater investment opportunities than there really are.
In Table VI, column (6), we perform a probit regression of an indicator variable for
whether firms pay dividends in the current year on the overconfidence variables and the usual
controls (including a control for whether the firm repurchases stock in the current year).
Both overconfidence variables are negative; however, only the long-term overconfidence is
statistically significant (t = −2.5), perhaps because dividend decisions are viewed as very
sticky and long-term commitments by CFOs (Brav et al., 2005). The effect of overconfidence
on dividend payout is economically significant. For the average firm, when increasing long-
term overconfidence from the median to the top decile, the propensity to pay dividends
decreases by about 12.4%.
D. Market Timing Activity
Empirical evidence suggests that many firms engage in market timing, i.e., they issue shares
following price increases and repurchase shares following price declines. Baker and Wurgler
(2002) argue that the cross-section of corporate capital structure can be explained as an
accumulation of responses to past price changes. Further, Graham and Harvey (2001) doc-
ument that CFOs agree that market timing (recent past stock price changes) is a primary
consideration for decisions about stock issuances and repurchases.
22

Miscalibration in beliefs may exacerbate timing activity. Similar to the behavior of
overconfident investors (Gervais and Odean 2001), overconfident managers may discount
the public signal (market valuation) and repurchase shares shortly after price declines. If in
addition overconfident CFOs believe that the market undervalues their firms (as in Hackbarth
2006), they may defer engaging in SEOs following high returns.
We test these predictions by examining the magnitude of repurchases and equity is-
suances as a response to past returns, interacted with the overconfidence variables. Specif-
ically, for each firm-quarter we compute the ratio of repurchases to lagged total assets
(Repurchasesq/Total assetsq−1) and the ratio of seasoned equity issuances (SEOs) to lagged
total assets (SEOsq/Total assetsq−1). We regress these variables on overconfidence inter-
acted with past returns, in addition to the usual variables.
The repurchase analysis is presented in Table VI, column (7). The dependent variable
is Repurchasesq/Total assetsq−1. The coefficients on both overconfidence variables inter-
acted with past returns are negative, although only short-term overconfidence is significantly
different from zero (t = −2.9 and t = −1.1 for short-term and long-term overconfidence, re-
spectively). This coefficients should be interpreted as follows. Given a decline in share price,
firms with overconfident CFOs repurchase a greater fraction of their shares (in terms of book
assets), all else being equal. This result is in line with Hackbarth (2006) who argues that
overconfident managers perceive their firms as undervalued by the market.
In column (8), we use SEOsq/Total assetsq−1 as dependent variable. Consistent with the
extant literature, the coefficients on the past returns variables suggest that SEOs are larger
following high past returns (Table VI, column (6)). Both coefficients of the interactions are
negative, although only long-term overconfidence is significantly different from zero (t = −0.7
and t = −1.9 for short-term and long-term overconfidence, respectively). These coefficients
imply that, given an increase in returns, firms with overconfident CFOs issue a smaller
fraction of equity.
Put together, the results for repurchases and SEOs are consistent with the hypothesis that
overconfident managers perceive their firms as undervalued by the market. Overconfident
23

CFOs repurchase equity more intensely following a decline in stock prices and limit their
issuances following increases in share prices.
E. Executive Compensation
Overconfidence may alter executive demand for variable compensation that is contingent
on performance. There are two competing hypotheses for the effects of managerial over-
confidence on the composition of compensation. Gervais, Heaton, and Odean (2005) argue
that overconfident managers have fewer career concerns and, therefore, are aligned with
stockholders in their objectives. Consequently, overconfident managers would require less
incentive compensation to induce them to exert effort. Keiber (2002) argues that overcon-
fidence leads to the opposite effect. Since overconfident managers underestimate the risk in
variable compensation, they are willing to take on more such risk.
We use Execucomp data to test the compensation hypotheses. First, we compute for
each firm-year the average fraction of bonus compensation out of salary and bonus across
the range of executives. The data set is based on Execucomp database and includes 571
observations. Then, we regress this variable on the overconfidence variables in addition
to controls and industry and time fixed effects. The regression in Table VI, column (8),
indicates that the fraction of variable compensation significantly increases with short-term
overconfidence.20 An increase from the median to the top decile of short-term overconfidence
translates to an increase of 2.8% in the importance of the bonus (average bonus is 42.1%).
We next investigate whether overconfident managers are compensated for the greater risk
contained in their compensation packages. To do so, we examine whether total compensation
(including options, stock grants, etc.) is different for overconfident managers. We find that
the coefficients on the overconfidence variables are small and statistically insignificant (results
are untabulated for brevity.) Hence, overall compensation is insensitive to overconfidence. In
sum, the results are consistent with (Keiber 2002), suggesting that overconfident executives
are willing to bear more risk in their own portfolios without being compensated for it.
20In unreported analysis, we do not find that options compensation is associated with overconfidence.
24

VI. Forecasting the S&P 500 vs. Forecasting Cash-
Flows
Our tests about the effects of managerial overconfidence on corporate decision making are
a joint test of (i) whether our S&P 500 overconfidence variable is a valid proxy for CFOs’
overconfidence about their own firms and cash flows (carryover effect), and (ii) whether
managerial overconfidence affects corporate policies. Our results are consistent with both
the carryover effect and the link between overconfidence and corporate policies. In addition,
the carryover effect is supported by some psychology research.
An extensive literature in psychology and in experimental economics examines whether
biases like overconfidence spill over from one domain to other domains. West and Stanovich
(1997) find that overconfidence regarding motor skills is correlated with overconfidence re-
garding cognitive skills. Glaser and Weber (2007) present a study in which overconfidence
is measured in several ways, such as by different types of miscalibration questions. The au-
thors find that respondents who exhibit overconfidence in stock market forecasts are likely to
exhibit overconfidence in general knowledge questions. Several studies document that indi-
vidual degrees of overconfidence are stable within tasks (forecasting, in our case), e.g., Glaser,
Langer, and Weber (2005), Klayman, Soll, Gonzales-Vallejo, and Barlas (1999), Jonsson and
Allwood (2003). These studies show that although people sometimes exhibit different levels
of overconfidence across domains, there are reliable differences in overconfidence across indi-
viduals. While many studies find that overconfidence spills over from one domain to another,
others find weak or no carryover effects. For example, Biais, Hilton, Mazurier, and Pouget
(2005) find that although in there is some evidence that overconfidence carries over across
domains (subjects that are classified as miscalibrated perform worse in a trading game), in
other cases, the link does not exist (there is no relation between miscalibration score and
trading volume).
Carryover effects are found also in empirical economics. For example, Puri and Robinson
(2007) find that people with optimistic beliefs about their life-span also make optimistic
economic decisions, e.g., they are more likely to be self-employed and tilt their portfolios
towards individual stocks. In the context of our results, CFOs who are overconfident in
25
forecasting the S&P 500 also appear to be overconfident in the dimensions of their own
firms, as evidenced by the relation between overconfidence and corporate policies.
Finally, to investigate these issues further, we test whether our overconfidence measures
better explain the corporate policies of firms that co-move with the market. Future cash flows
of high-beta firms are highly correlated with the future market returns, and thus S&P-based
overconfidence variables should be more closely linked to CFO overconfidence about cash
flows and other corporate attributes in these firms. We pursue this idea by interacting mar-
ket beta (βMKT ) with overconfidence variables and adding it to the regression specifications
used in the previous section.21 If the overconfidence variables reflect executive overconfi-
dence about their own firms’ attributes, then there should be a stronger association between
corporate policies and the overconfidence variables for high-beta firms (i.e., the coefficient of
the interaction term should have the same sign as the main effect of overconfidence).
Table VII presents the results of this test. In each column we regress one corporate
policy (capex intensity, acquisitions intensity, merger announcement returns, debt leverage,
fraction of long-term debt, dividends, and executive compensation) on the interactions of
beta and the overconfidence variables, and also on the main effect of beta, optimism, control
variables, and industry and time fixed effects. To support our hypothesis, the coefficients
on the statistically-significant overconfidence variables in Table VI should have the same
signs as the coefficients interacted with market beta. The results provide some support for
the idea that the impact of overconfidence on corporate policies is stronger for high-beta
firms. For example, for long-term overconfidence, the beta-interactions have the same signs
as the main effect variables, and three of the seven beta terms are significant (Table VI).
To illustrate, keeping long-term overconfidence level constant, high-beta firms invest more
than do low-beta firms. Similarly, high-beta firms with overconfident CFOs experience lower
returns when announcing prospective mergers than do low-beta firms. Hence, our results
are generally consistent with the hypothesis that the effects of market-based overconfidence
carry over more strongly in firms with cash flows that co-move with the market.22
21For each firm-quarter we form a sample of the previous 60 month returns (minimum of 20 months). Ina regression of monthly firm excess returns on contemporaneous market excess returns, market beta βMKT
is the coefficient on stock market excess returns.22In an additional test we replaced βMKT with R2 from a firm-level regression of firm past returns on the
market portfolio. Returns of high-R2 are more correlated with the market than are those of low-R2 firms.
26
VII. Conclusion
We provide new evidence and novel insights about the relation between behavioral biases of
managers and corporate policies. Our study is based on a unique data set of stock market
predictions by over 6,500 top financial executives collected over a span of more than six years.
Our survey questions are targeted to measure overconfidence as the degree of miscalibration
of beliefs, a method that has been exclusively used before in laboratory experiments. Our
data set is distinct because we have direct measures of both overconfidence and optimism
for a large number of top U.S. executives, and because we can link our estimates to archival
data and thus examine the relation between overconfidence and corporate actions.
The paper highlights the drivers behind managerial biases. We find that CFOs are mis-
calibrated on average: only 40% of stock market realizations fall within the 80% confidence
intervals that executives provide. We find that confidence intervals are especially narrow fol-
lowing high stock market returns because managers condition their lower confidence bound
on past stock market performance. Moreover, our results indicate that miscalibration de-
pends on personal traits (skill) in addition to corporate characteristics.
We present novel empirical analysis that ties managerial overconfidence (measured as
miscalibration) to a wide range of corporate policies, as predicted by the theoretical litera-
ture. Firms with overconfident CFOs invest more and engage in more acquisitions, and the
market reaction to their acquisitions is negative. We also find a positive relation between
managerial overconfidence and financial structure: firms of overconfident CFOs have higher
debt leverage, rely more on long-term debt, and pay fewer dividends. Also, they repurchase
more shares after a decline in share prices, but issue fewer shares following price run-ups. Fi-
nally, we find that executive compensation in firms with overconfident CFOs is tilted towards
performance-based pay.
We find that the correlation between βMKT and R2 is high (0.63), and that the results from the regressionanalysis are qualitatively the same. The results are untabulated for brevity but are available upon request.
27

References
Aktas, Nihat, Eric de Bodt, and Richard Roll, 2005, Hubris, learning, and M&A decisions, WorkingPaper.
Alba, Joseph A., and J. Wesley Hutchison, 2000, Knowledge calibration: What consumers knowand what they think they know, Journal of Consumer Research 27, 123–156.
, and John G. Lynch, 1991, Memory and decision making, in Handbook of ConsumerResearch . pp. 1–49 (Prentice-Hall: Englewood Cliffs, NJ) eds. Thomas S. Robertson and HaroldH. Kassarjian.
Alpert, Murray, and Howard Raiffa, 1982, A progress report on the training of probability asses-sors, in Daniel Kahneman, Paul Slovic, and Amos Tversky, ed.: Judgement under Uncertainty:Heuristics and Biases (Cambridge University Press: Cambridge).
Arkes, Hal R., Robyn M. Dawes, and Caryn Christensen, 1986, Factors influencing the use of adecision rule in a probabilistic task, Organizational Behavior and Human Decision Processes 37,93–110.
Arnold, Jasper H., 1986, Assessing capital risk: You can’t be too conservative, Harvard BusinessReview 64, 113–121.
Baker, Malcolm, and Jeffrey Wurgler, 2002, Market timing and capital structure, Journal of Finance57, 1–32.
Bar-Yosef, Sasson, and Itzhak Venezia, 2006, An experimental study of overconfidence in accountingnumbers predictions, Hebrew University Working Paper.
Baumann, Andrea O., Raisa B. Deber, and Gail G. Thompson, 1991, Overconfidence amongphysicians and nurses: The micro-certainty, macro-uncertainty phenomenon, Social Science &Medicine 32, 167–174.
Bertrand, Marianne, and Antoinette Schoar, 2003, Managing with style: The effect of managers onfirm policies, Quarterly Journal of Economics 118, 1169–1208.
Biais, Bruno, Denis Hilton, Karine Mazurier, and Sebastien Pouget, 2005, Judgmental overconfi-dence, self-monitoring and trading performance in an experimental financial market, Review ofEconomic Studies 72, 287–312.
Brav, Alon, John R. Graham, Campbell R. Harvey, and Roni Michaely, 2005, Payout policy in thetwenty-first century, Journal of Financial Economics 77, 483–528.
Christensen-Szalanski, Jay J., and James B. Bushyhead, 1981, Physicians’ use of probabilisticinformation in a real clinical setting, Journal of Experimental Psychology: Human Perceptionand Performance 7, 928–935.
Cooper, Arnold C., Carolyn W. Woo, and William C. Dunkelberg, 1988, Entrepeneurs’ perceivedchances for success, Journal of Business Venturing 3, 97–108.
Daniel, Kent D., David Hirshleifer, and Avanidhar Subrahmanyam, 1998, Investor psychology andsecurity market under- and overreactions, Journal of Finance 53, 1839–1885.
Davidson, L. B., and D. O. Cooper, 1976, A simple way of developing a probability distribution ofpresent value, Journal of Petroleum Technology September, 1069–1078.
Deaves, Richard, Erik Luders, and Guo Ying Lou, 2003, An experimental test of the impact ofoverconfidence and gender on trading activity, Working paper.
Deaves, Richard, Erik Luders, and Michael Schroder, 2005, The dynamics of overconfidence: Evi-dence from stock market forecasters, Centre for European Economic Research Working Paper.
28

Einhorn, Hillel J., and Robyn Hogarth, 1978, Confidence in judgement: Persistence in the illusionof validity, Psychological Review 85, 395–416.
Fama, Eugene F., and James MacBeth, 1973, Risk, return and equilibrium: Empirical tests, Journalof Political Economy 81, 607–636.
Gervais, Simon, J.B. Heaton, and Terrance Odean, 2005, Overconfidence, investment policy andmanager welfare, Working Paper.
Gervais, Simon, and Terrance Odean, 2001, Learning to be overconfident, Review of FinancialStudies 14, 1–27.
Gilovich, Thomas, Margaret Kerr, and Victoria Husted Medvec, 1993, Effect of temporal perspec-tive on subjective confidence, Journal of Personality and Social Psychology 64, 552–560.
Glaser, M., L. Langer, and M. Weber, 2005, Overconfidence of professionals and lay men: Individualdifferences within and between tasks, Working Paper.
Glaser, Markus, and Martin Weber, 2007, Overconfidence and trading volume, Geneva Risk andInsurance Review forthcoming.
Goel, Anand M., and Anjan V. Thakor, 2005, Overconfidence, CEO selection and corporate gov-ernance, Working Paper.
Graham, John R., and Campbell R. Harvey, 2001, The theory and practice of corporate finance:Evidence from the field, Journal of Financial Economics 60, 187–243.
, 2006, The Duke/CFO Business Outlook survey, http:\\www.cfosurvey.org.
Hackbarth, Dirk, 2006, Managerial traits and capital structure decisions, Working Paper.
Heaton, J.B., 2002, Managerial optimism and corporate finance, Financial Management 31, 33–45.
Hilary, Gilles, and Lior Menzly, 2006, Does past success lead analysts to become overconfident?,Management Science 52, 489–500.
Hribar, Paul, and Holly Yang, 2006, CEO overconfidence, management earnings forecasts, andearnings management, Working paper, Cornell University.
Jonsson, Anna-Carin, and Carl Martin Allwood, 2003, Stability and variability in the realismof confidence judgments over time, content domain, and gender, Personality and IndividualDifferences 34, 559–574.
Kahneman, Daniel, and D. Lovallo, 1993, Timid choices and bold forecasts: A cognitive perspectiveon risk taking, Management Science 39, 17–31.
Keefer, Donald L., and Samuel E. Bodily, 1983, Three-point approximations for continuous randomvariables, Management Science 29, 595–609.
Keiber, Karl Ludwig, 2002, Managerial compensation contracts and overconfidence, Working Paper.
Kidd, John B., 1970, The utilization of subjective probabilities in production planning, Acta Psy-chologica 34, 338–347.
Klayman, Joshua, Jack B. Soll, Claudia Gonzales-Vallejo, and Sema Barlas, 1999, Overconfidence:It depends on how, what, and whom you ask, Organizational Behavior and Human DecisionProcesses 79, 216–247.
Koriat, Asher, Sarah Lichtenstein, and Barauch Fischoff, 1980, Reasons for confidence, Journal ofExperimental Psychology: Human Learning and Memory 6, 107–118.
Kruger, Justin, and David Dunning, 1999, Unskilled and unaware of it: How difficulties in rec-ognizing one’s own incompetence lead to inflated self-assessments, Journal of Personality andSocial Psychology 77, 1121–1134.
29
Lichtenstein, Sarah, and Barauch Fischoff, 1977, Do those who know more also know more abouthow much they know?, Organizational Behavior and Human Performance 20, 159183.
Lichtenstein, Sarah, Baruch Fischoff, and Lawrence Phillips, 1982, Calibration of probabilities:The state of the art to 1980, in Daniel Kahneman, Paul Slovic, and Amos Tversky, ed.: Judge-ment under Uncertainty: Heuristics and Biases . pp. 306–334 (Cambridge University Press:Cambridge).
Malmendier, Ulrike, and Geoffrey Tate, 2005a, CEO overconfidence and corporate investment,Journal of Finance 60, 2661–2700.
, 2005b, Does overconfidence affect corporate investment? CEO overconfidence measuresrevisited, European Financial Management 11, 649–659.
, 2006, Who makes acquisitions? CEO overconfidence and the market’s reaction, WorkingPaper.
, and Jun Yan, 2006, Corporate financial policies with overconfident managers, WorkingPaper.
March, James G., and Zur Shapira, 1987, Managerial perspectives on risk and risk taking, Man-agement Science 33, 1404–1418.
Newey, Whitney K., and Kenneth D. West, 1987, A simple, positive semidefinite, heteroskedasticityand autocorrelation consistent covariance-matrix, Econometrica 55, 703–708.
Oskamp, Stuart, 1965, Overconfidence in case study judgements, Journal of Consulting Psychology29, 261–265.
Paese, Paul W., and Michael A. Feuer, 1991, Decisions, actions, and the appropriateness of confi-dence in knowledge, Journal of Behavioral Decision Making 4, 1–16.
Puri, Manju, and David T. Robinson, 2007, Optimism and economic choice, Journal of FinancialEconomics forthcoming.
Roll, Richard, 1986, The hubris theory of corporate takeovers, Journal of Business 59, 197–216.
Russo, J. Edward, and Paul J. H. Schoemaker, 1992, Managing overconfidence, Sloan ManagementReview 33, 7–17.
Shefrin, Hersh, 2001, Behavioral corporate finance, Journal of Applied Corporate Finance 14, 113–124.
, 2005, A Behavioral Approach to Asset Pricing (Elsevier Academic Press: Burlington,Massachusetts) first edn.
Soll, Jack B., and Joshua Klayman, 2004, Overconfidence in interval estimates, Journal of Experi-mental Psychology: Learning, Memory, and Cognition 30, 299–314.
Spense, Mark T., 1996, Problem-problem solver characteristics affecting the calibration of judg-ments, Organizational Behavior and Human Decision Processes 67, 271–279.
Sporer, Seigfried Ludwig, Steven Penrod, Don Read, and Brian Cutler, 1995, Choosing, confidence,and accuracy: a meta-analysis of confidence-accuracy relation in eye-witness identification stud-ies, Psychological Bulletin 118, 315–327.
von Holstein, C. Stael, 1972, Probabilistic forecasting: An experiment related to the stock market,Organizational Behavior and Human Performance 8, 139–158.
West, Richard F., and Keith E. Stanovich, 1997, The domain specificity and generality of overcon-fidence: individual differences in performance estimation bias, Psychonomic Bulletin and Review4, 387–392.
30

Appendix: Variable Definitions
Variables from CFO SurveyRaw short-term forecast Survey response of expected one-year S&P 500 return.Raw long-term forecast Survey response of expected ten-year S&P 500 return.Raw lower (upper) bounds Survey response for the level of S&P 500 returns for which
there is a 1-in-10 chance of being lower (greater). Applies toshort-term (one-year) and long-term (ten-year) returns.
abs(forecast error) Absolute value of the forecast error (forecasted returns minusrealized returns).
Individual volatility (Raw upper bound - raw lower bound) / 2.65. Applies toshort-term (one-year) and long-term (ten-year) forecasts.
Disagreement volatility Standard deviation of mean forecasts (expected returns) withinsurvey date. Applies to short-term (one-year) and long-term(ten-year) forecasts.
Optimism ST Decile ranking of individual short-term expected returnswithin each survey date. Orthogonalized with respect toOverconfidence ST . Variable is scaled between 0 and 1.
Optimism LT Decile ranking of individual short-term expected returnswithin each survey date. Orthogonalized with respect toOverconfidence ST and Optimism ST . Variable is scaledbetween 0 and 1.
Overconfidence ST Decile ranking of individual volatility of short-term forecastswithin each survey date and forecast decile (i.e., double sortingon short-term optimism). Ranking is scaled between 0 and 1,and sorted in descending order so that 0 reflects the decile ofleast overconfident executives and 1 reflects the decile of mostoverconfident executives.
Overconfidence LT Decile ranking of individual volatility of long-term forecastswithin each survey date and forecast decile (i.e., double sort-ing on raw long-term optimism). Orthogonalized with respectto Overconfidence ST . Ranking is scaled between 0 and 1,and sorted in descending order so that 0 reflects the decile ofleast overconfident executives and 1 reflects the decile of mostoverconfident executives.
Optimism firm Raw response to a question about how optimistic managers areabout their firms’ financial future (responses range from 0 to100). Variable is decile-ranked within survey date and scaledbetween 0 and 1.
Optimism U.S. Raw response to a question about how optimistic managers areabout the future of the U.S. economy (responses range from0 to 100). Variable is decile-ranked within survey date andscaled between 0 and 1.
31
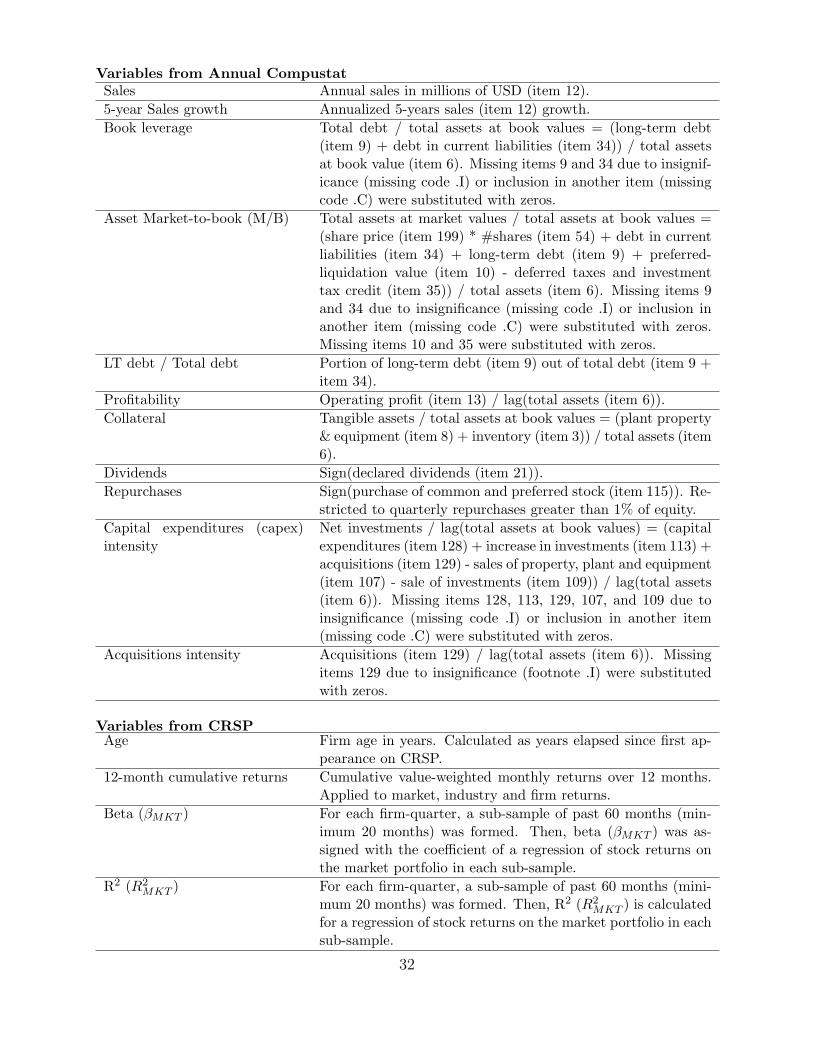
Variables from Annual CompustatSales Annual sales in millions of USD (item 12).5-year Sales growth Annualized 5-years sales (item 12) growth.Book leverage Total debt / total assets at book values = (long-term debt
(item 9) + debt in current liabilities (item 34)) / total assetsat book value (item 6). Missing items 9 and 34 due to insignif-icance (missing code .I) or inclusion in another item (missingcode .C) were substituted with zeros.
Asset Market-to-book (M/B) Total assets at market values / total assets at book values =(share price (item 199) * #shares (item 54) + debt in currentliabilities (item 34) + long-term debt (item 9) + preferred-liquidation value (item 10) - deferred taxes and investmenttax credit (item 35)) / total assets (item 6). Missing items 9and 34 due to insignificance (missing code .I) or inclusion inanother item (missing code .C) were substituted with zeros.Missing items 10 and 35 were substituted with zeros.
LT debt / Total debt Portion of long-term debt (item 9) out of total debt (item 9 +item 34).
Profitability Operating profit (item 13) / lag(total assets (item 6)).Collateral Tangible assets / total assets at book values = (plant property
& equipment (item 8) + inventory (item 3)) / total assets (item6).
Dividends Sign(declared dividends (item 21)).Repurchases Sign(purchase of common and preferred stock (item 115)). Re-
stricted to quarterly repurchases greater than 1% of equity.Capital expenditures (capex)intensity
Net investments / lag(total assets at book values) = (capitalexpenditures (item 128) + increase in investments (item 113) +acquisitions (item 129) - sales of property, plant and equipment(item 107) - sale of investments (item 109)) / lag(total assets(item 6)). Missing items 128, 113, 129, 107, and 109 due toinsignificance (missing code .I) or inclusion in another item(missing code .C) were substituted with zeros.
Acquisitions intensity Acquisitions (item 129) / lag(total assets (item 6)). Missingitems 129 due to insignificance (footnote .I) were substitutedwith zeros.
Variables from CRSPAge Firm age in years. Calculated as years elapsed since first ap-
pearance on CRSP.12-month cumulative returns Cumulative value-weighted monthly returns over 12 months.
Applied to market, industry and firm returns.Beta (βMKT ) For each firm-quarter, a sub-sample of past 60 months (min-
imum 20 months) was formed. Then, beta (βMKT ) was as-signed with the coefficient of a regression of stock returns onthe market portfolio in each sub-sample.
R2 (R2MKT ) For each firm-quarter, a sub-sample of past 60 months (mini-
mum 20 months) was formed. Then, R2 (R2MKT ) is calculated
for a regression of stock returns on the market portfolio in eachsub-sample.
32

Variables from Quarterly CompustatRepurchasesq / Total assetsq−1 Quarterly repurchases scaled by lagged total assets: (item 93)
/ lag(item 44).SEOsq / Total assetsq−1 Quarterly seasoned equity offerings scaled by lagged total as-
sets: (item 84) / lag(item 44).
Variables from ExecucompBonus fraction Average across the firm’s executives of: bonus (BONUS) /
(Salary (SALARY) + bonus (BONUS)).log(Total compensation) Average across the firm’s executives of total compensation
(TDC1): Salary, Bonus, Other Annual, Total Value of Re-stricted Stock Granted, Total Value of Stock Options Granted(using Black-Scholes), Long-Term Incentive Payouts, and AllOther Total.
Variables from The Chicago Board Options ExchangeVolatility Index (VIX) An index for the implied volatility on 30-day options. The
index is constructed by the Chicago Board Options Exchange(CBOE) from a wide range of wide range of S&P 500 (S&P 100until August 2003) index options (both calls and puts). Theindex reflects the anticipated volatility in the next 30 days. Seehttp://www.cboe.com/micro/vix/vixwhite.pdf for furtherdetails.
Variables from Thomson SDC PlatinumMerger announcement excessreturns (-1,1)
Market-adjusted returns of acquirers for the day precedingmerger announcement through the day following the announce-ment.
33

Table ISummary Statistics
The table presents descriptive statistics of the sample firms. Panel A presents summary statistics for thevariables used in the study. Panel A B presents an industry and size breakdown according to CFOs’ ownreporting. Panel C compares the distribution of key attributes of the sample firms to those of firm fromthe Compustat universe from 2001 to 2006. The columns represent Compustat quintiles, and the numbersreport the percentage sample observations that fall within each quintile. Panel D presents a correlation table(sample is restricted to identified firms), where bold figures represent significance level of 10%. Variabledefinitions are provided in the Appendix.
Panel A: Summary Statistics
Survey Variables (Full Sample) Obs Mean Std Dev Min Median MaxRaw forecasts ST (%) 6505 6.34 3.84 -15.00 6.00 25.00Individual volatility ST (%) 6505 4.91 3.58 0.38 3.77 26.42Confidence interval ST (%) 6505 13.08 9.84 0.09 10.00 100.00Optimism ST 6505 0.50 0.31 0.00 0.56 1.00Overconfidence ST 6505 0.50 0.31 0.00 0.56 1.00Raw forecasts LT (%) 5895 7.67 2.76 1.00 8.00 40.00Individual volatility LT (%) 5895 3.33 2.11 0.38 3.02 19.25Confidence interval LT (%) 5895 8.99 6.93 0.04 8.00 120.00Optimism LT 5895 0.50 0.32 0.00 0.56 1.00Overconfidence LT 5895 0.50 0.32 0.00 0.56 1.00abs(forecast error ST) (%) 4252 7.99 8.49 0.00 5.64 66.00S&P 500 realization within confidence interval 4252 0.46 0.50 0.00 0.00 1.00Optimism firm 4997 0.51 0.32 0.00 0.56 1.00Optimism U.S. 5039 0.51 0.31 0.00 0.56 1.00Firm Characteristics (for sample firms that can be linked to Compustat)Profitability 1072 0.14 0.12 -1.93 0.13 0.71log(Sales) 1074 7.60 1.93 0.49 7.60 10.93Asset Market-to-Book 1074 1.47 0.98 0.16 1.17 13.97Collateral 1074 0.38 0.22 0.01 0.38 0.945yr Sales growth 1036 0.09 0.17 -0.32 0.07 1.46Book leverage 1073 0.21 0.17 0.00 0.21 1.17LT debt / Total debt 995 0.76 0.28 0.00 0.88 1.00Dividends 1074 0.58 0.49 0.00 1.00 1.00Repurchases 1074 0.40 0.49 0.00 0.00 1.00Capex intensity 1073 0.08 0.11 -0.24 0.05 1.23Acquisitions intensity 1024 0.04 0.09 -0.02 0.00 1.00Repurchasesq / Total assetsq−1 1010 0.02 0.04 0.00 0.00 0.33SEOsq / Total assetsq−1 1010 0.02 0.07 0.00 0.00 1.39Firm Characteristics (for sample firms that can be linked to CRSP)Age (years) 1074 32.52 22.18 3.25 26.25 81.08Firm 12-month past returns 1073 0.18 0.50 -0.91 0.13 5.23Beta (βMKT ) 1061 1.12 0.87 -0.48 0.93 4.49Executive Compensation (for sample firms that can be linked to Execucomp)Bonus / (Salary + Bonus) 574 0.42 0.20 0.00 0.45 0.87log(Salary + Bonus) 574 6.85 0.68 5.07 6.84 8.81Thomson SDC Platinum (for sample firms that can be linked to Thomson)Merger announcement excess returns 377 0.01 0.05 -0.14 0.00 0.29
34
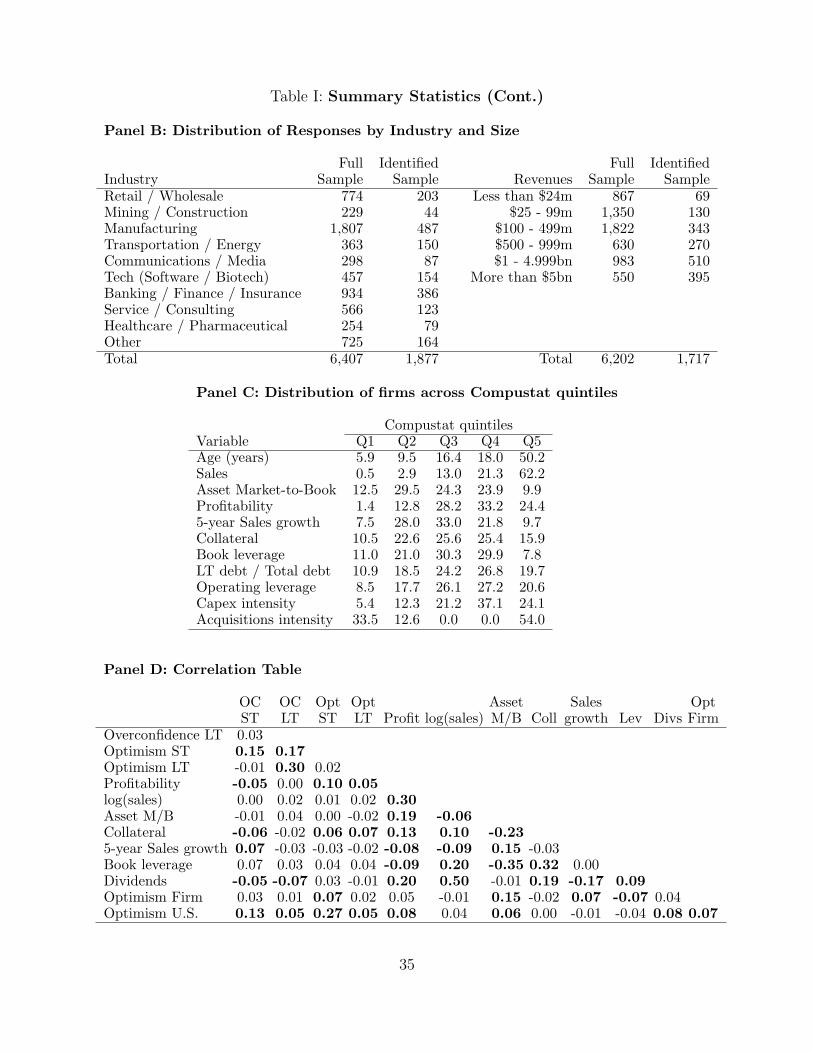
Table I: Summary Statistics (Cont.)
Panel B: Distribution of Responses by Industry and Size
Full Identified Full IdentifiedIndustry Sample Sample Revenues Sample SampleRetail / Wholesale 774 203 Less than $24m 867 69Mining / Construction 229 44 $25 - 99m 1,350 130Manufacturing 1,807 487 $100 - 499m 1,822 343Transportation / Energy 363 150 $500 - 999m 630 270Communications / Media 298 87 $1 - 4.999bn 983 510Tech (Software / Biotech) 457 154 More than $5bn 550 395Banking / Finance / Insurance 934 386Service / Consulting 566 123Healthcare / Pharmaceutical 254 79Other 725 164Total 6,407 1,877 Total 6,202 1,717
Panel C: Distribution of firms across Compustat quintiles
Compustat quintilesVariable Q1 Q2 Q3 Q4 Q5Age (years) 5.9 9.5 16.4 18.0 50.2Sales 0.5 2.9 13.0 21.3 62.2Asset Market-to-Book 12.5 29.5 24.3 23.9 9.9Profitability 1.4 12.8 28.2 33.2 24.45-year Sales growth 7.5 28.0 33.0 21.8 9.7Collateral 10.5 22.6 25.6 25.4 15.9Book leverage 11.0 21.0 30.3 29.9 7.8LT debt / Total debt 10.9 18.5 24.2 26.8 19.7Operating leverage 8.5 17.7 26.1 27.2 20.6Capex intensity 5.4 12.3 21.2 37.1 24.1Acquisitions intensity 33.5 12.6 0.0 0.0 54.0
Panel D: Correlation Table
OC OC Opt Opt Asset Sales OptST LT ST LT Profit log(sales) M/B Coll growth Lev Divs Firm
Overconfidence LT 0.03Optimism ST 0.15 0.17Optimism LT -0.01 0.30 0.02Profitability -0.05 0.00 0.10 0.05log(sales) 0.00 0.02 0.01 0.02 0.30Asset M/B -0.01 0.04 0.00 -0.02 0.19 -0.06Collateral -0.06 -0.02 0.06 0.07 0.13 0.10 -0.235-year Sales growth 0.07 -0.03 -0.03 -0.02 -0.08 -0.09 0.15 -0.03Book leverage 0.07 0.03 0.04 0.04 -0.09 0.20 -0.35 0.32 0.00Dividends -0.05 -0.07 0.03 -0.01 0.20 0.50 -0.01 0.19 -0.17 0.09Optimism Firm 0.03 0.01 0.07 0.02 0.05 -0.01 0.15 -0.02 0.07 -0.07 0.04Optimism U.S. 0.13 0.05 0.27 0.05 0.08 0.04 0.06 0.00 -0.01 -0.04 0.08 0.07
35

Tab
leII
:S&
P500
Retu
rnFore
cast
sand
Confidence
Inte
rvals
by
Surv
ey
Date
The
tabl
epr
esen
tssu
mm
ary
stat
isti
csby
surv
eyda
te.
Avg
lower
boun
d(%
)is
aver
age
CFO
10th
perc
enti
lefo
ron
e-ye
ar(c
olum
n(1
))or
ten-
year
(col
umn
(6))
S&P
500
retu
rn.A
vgon
e-ye
arS&
P50
0ex
pect
edre
turn
(%)
isav
erag
eC
FO
fore
cast
sfo
ron
e-ye
ar(c
olum
n(2
))or
ten-
year
(col
umn
(7))
S&P
500
retu
rn.
Avg
uppe
rbo
und
(%)
isav
erag
eC
FO
90th
perc
enti
lefo
ron
e-ye
ar(c
olum
n(3
))or
ten-
year
(col
umn
(8))
S&P
500
retu
rn.
One
-yea
r(T
en-y
ear)
Indi
vidu
alvo
latilit
y(%
)is
the
indi
vidu
alvo
lati
lity
mea
sure
impu
ted
from
resp
onde
nts’
confi
denc
ein
terv
alfo
rth
eon
e-ye
ar(t
en-y
ear)
S&P
500
fore
cast
s.O
ne-y
ear
(Ten
-yea
r)D
isag
reem
ent
vola
tilit
y(%
)is
the
stan
dard
devi
atio
nof
poin
tes
tim
ates
for
the
one-
year
(ten
-yea
r)S&
P50
0fo
reca
sts
acro
ssre
spon
dent
s.Rea
lized
one-
year
S&P
500
retu
rn(%
)is
real
ized
one-
year
S&P
500
retu
rnfo
llow
ing
the
surv
eyda
te.
Rea
lized
vola
tilit
yis
the
annu
alvo
lati
lity
ofth
eS&
P50
0on
eye
arfr
omth
esu
rvey
date
mea
sure
dw
ith
daily
retu
rns.
VIX
isth
eC
hica
goB
oard
ofO
ptio
nsE
xcha
nge
(CB
OE
)vo
lati
lity
inde
x,th
atre
flect
sth
eav
erag
eof
impu
ted
vola
tilit
yac
ross
trad
edop
tion
son
the
S&P
500
(S&
P10
0be
fore
Aug
ust
2003
)fu
ture
sin
dex.
One
-yea
rfo
reca
sts
Ten
-yea
rfo
reca
sts
Mar
ket
data
Avg
Avg
Avg
Avg
Dis
-A
vgA
vgA
vgA
vgD
is-
Rea
lized
low
erex
pect
edup
per
indi
vidu
alag
reem
ent
low
erex
pect
edup
per
indi
vidu
alag
reem
ent
one-
year
Rea
lized
boun
dre
turn
boun
dvo
lati
lity
vola
tilit
ybo
und
retu
rnbo
und
vola
tilit
yvo
lati
lity
retu
rns
vola
tilit
yV
IX(%
)(%
)(%
)(%
)(%
)(%
)(%
)(%
)(%
)(%
)(%
)(%
)(%
)Su
rvey
date
Obs
(1)
(2)
(3)
(4)
(5)
Obs
(6)
(7)
(8)
(9)
(10)
(11)
(12)
(13)
13M
ar20
0113
8n/
a5.
3n/
an/
a6.
714
1n/
a9.
4n/
an/
a3.
0-3
.620
.427
.611
Jun
2001
146
-2.7
6.0
13.6
6.1
3.8
145
n/a
9.2
n/a
n/a
2.4
-19.
218
.824
.010
Sep
2001
136
-5.0
4.6
12.9
6.8
5.9
136
n/a
9.1
n/a
n/a
2.6
-16.
724
.131
.83
Dec
2001
188
-4.3
6.9
14.8
7.2
5.3
188
n/a
8.8
n/a
n/a
2.5
-18.
525
.925
.812
Mar
2002
173
-0.4
7.4
12.6
4.9
3.6
173
3.7
8.4
12.7
3.3
2.4
-31.
026
.519
.64
Jun
2002
315
-3.3
5.1
10.6
5.2
3.6
308
3.0
8.2
12.2
3.5
2.6
-5.2
27.1
23.9
17Se
p20
0235
1-4
.25.
010
.95.
74.
234
43.
28.
012
.13.
42.
417
.521
.838
.03
Dec
2002
276
-2.0
6.8
12.5
5.5
4.0
271
3.4
7.9
11.9
3.2
2.7
15.6
17.6
28.3
17M
ar20
0318
2-6
.94.
611
.36.
94.
317
82.
07.
411
.53.
62.
328
.714
.531
.812
Jun
2003
350
-1.6
7.9
14.4
6.1
4.9
344
1.9
7.6
12.2
3.9
2.6
13.8
12.5
20.4
15Se
p20
0315
11.
17.
712
.64.
33.
814
73.
37.
410
.62.
81.
911
.211
.619
.34
Dec
2003
216
1.1
9.2
15.0
5.2
3.8
212
3.4
8.2
12.1
3.3
2.3
11.4
11.2
16.3
18M
ar20
0420
2-0
.97.
413
.75.
54.
419
82.
97.
811
.83.
32.
16.
010
.818
.59
Jun
2004
175
-0.4
7.1
12.3
4.8
3.6
172
3.1
8.0
11.5
3.1
2.8
6.2
10.7
15.8
8Se
p20
0418
0-0
.66.
712
.04.
73.
817
42.
77.
611
.13.
22.
910
.310
.214
.11
Dec
2004
284
-0.2
6.6
11.4
4.4
3.1
281
3.2
7.6
11.1
3.0
2.6
6.2
10.4
13.0
22Fe
b20
0527
1-0
.66.
211
.14.
43.
226
93.
27.
511
.33.
12.
79.
210
.413
.124
May
2005
308
-0.9
5.3
9.9
4.1
2.6
299
2.6
7.3
11.3
3.3
3.3
5.4
9.5
12.7
28A
ug20
0531
5-0
.75.
610
.24.
13.
030
92.
37.
210
.93.
22.
28.
010
.813
.715
Nov
2005
337
-0.8
5.5
10.2
4.2
3.0
329
2.3
6.9
11.0
3.3
2.1
13.6
10.0
12.2
23Fe
b20
0626
4-0
.66.
411
.44.
53.
225
82.
17.
211
.13.
42.
312
.79.
611
.923
May
2006
477
-0.1
6.2
10.8
4.1
3.3
470
3.1
7.7
11.8
3.3
2.5
18.3
29A
ug20
0645
3-0
.95.
710
.24.
23.
243
62.
67.
711
.73.
44.
012
.321
Nov
2006
383
-0.1
6.7
11.8
4.5
3.2
374
2.9
7.9
12.1
3.5
3.4
9.9
1M
ar20
0737
20.
47.
011
.84.
33.
436
32.
87.
811
.73.
42.
715
.8A
vera
ge26
6-1
.46.
412
.05.
13.
926
12.
87.
911
.63.
32.
63.
915
.419
.5
36

Table IIIOne-Year S&P 500 Return Forecasts vs. Realizations by Survey Date
The table compares survey forecasts with S&P 500 realizations by survey date. Average forecast error (%) isdefined as Average one-year S&P 500 expected return (%) minus Realized one-year S&P 500 return (%) (seedefinitions in Table II). S&P 500 realizations: % below 10th percentile is the percentage of respondents forwhom the realized one-year S&P 500 return is below their 10th percentile predictions. S&P 500 realizations:% between 10th and 90th percentiles is the percentage of respondents for whom the realized one-year S&P500 return is between their 10th percentile and 90th percentile predictions. S&P 500 realizations: % above90th percentile is the percentage of respondents for whom the realized one-year S&P 500 return is abovetheir 90th percentile predictions.
S&P 500 realizations. . .Average % below % between % above
forecast error 10th 10th and 90th 90th
(%) percentile percentiles percentileSurvey date (1) (2) (3) (4)13 Mar 2001 9.0 n/a n/a n/a11 Jun 2001 25.2 96.6 3.4 0.010 Sep 2001 21.2 89.0 11.0 0.03 Dec 2001 25.2 91.0 9.0 0.0
12 Mar 2002 38.2 100.0 0.0 0.04 Jun 2002 10.3 73.0 27.0 0.0
17 Sep 2002 -12.5 0.0 14.0 86.03 Dec 2002 -8.8 0.0 19.9 80.1
17 Mar 2003 -24.1 0.0 2.7 97.312 Jun 2003 -4.8 0.0 50.3 49.715 Sep 2003 -3.5 0.0 53.6 46.44 Dec 2003 -2.2 0.0 68.5 31.5
18 Mar 2004 1.5 11.9 83.2 5.09 Jun 2004 1.0 5.1 86.9 8.08 Sep 2004 -3.7 0.0 47.2 52.81 Dec 2004 0.4 4.9 78.9 16.2
22 Feb 2005 -2.9 0.0 61.3 38.724 May 2005 -0.1 3.9 82.5 13.628 Aug 2005 -1.8 0.0 56.5 43.515 Nov 2005 -8.1 0.0 19.9 80.123 Feb 2006 -6.3 0.0 31.8 68.2
Average 2.5 23.8 40.4 35.9
37

Table IVDeterminants of Forecasts and Individual Volatilities
The table explores the determinants of CFO forecasts of the one-year ahead S&P 500 return and individualvolatilities. Panel A presents regressions of lower bounds, expected returns, upper bounds and individualvolatilities on future S&P 500 returns and past returns, where standard errors (in parentheses) in are adjustedfor autocorrelation using the Newey and West (1987) procedure with 7 lags. Observation units in Panel Aare means of survey responses within a given quarter. Panel B presents results from Fama and MacBeth(1973) regressions, where standard errors (in parentheses) are adjusted for autocorrelation using the Neweyand West (1987) procedure with three lags. In Panel B, the independent variables are past firm returns.In both panels, dependent variables are expressed as decimals (not percentage points). Variable definitionsare provided in the Appendix. *, **, *** denote two-tailed significance at the 10%, 5%, and 1% level,respectively.
Panel A: Regressions of mean forecasts on S&P 500 returns
One-year forecasts (%)Lower Expected Upper Individualbound return bound volatility
(1) (2) (3) (4)12-months future S&P return -1.18 -1.12 -3.31 -0.80
(0.95) (1.09) (1.94) (0.99)12-months past S&P return 11.30*** 4.64*** 0.88 -3.93***
(1.37) (1.06) (2.04) (1.04)Intercept -1.57*** 6.43*** 12.24*** 5.21***
(0.13) (0.31) (0.49) (0.20)
Observations 20 21 20 20R2 0.76 0.40 0.11 0.48
Panel B: Regressions of forecasts on own-firm returns (Fama-MacBeth)
One-year forecasts (%)Lower Expected Upper Individualbound return bound volatility
(1) (2) (3) (4)12-months past firm return 0.59** 0.39*** 0.17 -0.13
(0.22) (0.12) (0.33) (0.12)Intercept -1.92** 6.24*** 11.89*** 5.21***
(0.70) (0.21) (0.34) (0.33)
Average number of observations 79 82 80 79Number of regressions 22 22 22 22Average R2 0.01 0.01 0.03 0.02
38

Table VSkill and Overconfidence
The table explores the relation between CFO overconfidence and skill. Column (1) presents the results of aregression of absolute forecast errors (in percentage) on overconfidence measures (Fama-Macbeth regression).Column (2) presents the results of a regression where the dependent variable is an indicator variable thatreceives the value 1 if S&P 500 realization is within the 10th and 90th percentiles provided by CFOs, and 0otherwise (Fama-Macbeth regression). Standard errors are adjusted for autocorrelation of three lags usingthe Newey and West (1987) procedure. Variable definitions are provided in the Appendix. *, **, *** denotetwo-tailed significance at the 10%, 5%, and 1% level, respectively. All regressions have intercepts that arenot presented.
Realizationabs(forecast error) within 10th and 90th and
(%) percentiles (0/1) ×100(1) (2)
Overconfidence ST -0.65*** -52.67***(0.18) (3.98)
Overconfidence LT -0.63*** -5.01**(0.21) (1.93)
abs(forecast error) (%) -6.21***(0.73)
Average number of observations 247 252Number of regressions 17 16Average R2 0.02 0.35
39

Table
VI:
Overc
onfidence
and
Corp
ora
tePolici
es
The
tabl
epr
esen
tsre
sult
sfr
omre
gres
sing
CFO
over
confi
denc
eon
capi
tal
stru
ctur
e,pa
yout
polic
y,an
dco
mpe
nsat
ion
vari
able
s.T
hede
pend
ent
vari
able
sar
eca
pex
inte
nsity
(%)
(col
umn
(1))
,acq
uisi
tion
sin
tens
ity
(%)
(col
umn
(2))
,3-d
aym
erge
ran
noun
cem
ent
exce
ss(m
arke
t-ad
just
ed)
retu
rns
(-1,
1)(c
olum
n(3
)),
book
leve
rage
(col
umn
(4))
,L
Tdebt
Tota
ldebt
(%)
(col
umn
(5))
,di
vide
ndpa
yer
dum
my
(col
umn
(6))
,qu
arte
rly
repu
rcha
ses
scal
edby
lagg
edto
talas
sets
Repu
rch
ases
q
Tota
lassets
q−
1(%
)(c
olum
n(7
)),
quar
terl
yeq
uity
issu
ance
s(S
EO
s)sc
aled
byla
gged
tota
las
sets
SE
Os
q
Tota
lassets
q−
1(%
)(c
olum
n(8
)),
Bon
us
Bon
us+
Sala
ry
(%)
(col
umn
(9))
.A
llre
gres
sion
sar
eO
LS
regr
essi
ons
apar
tfr
omco
lum
n(6
)w
hich
isa
prob
itre
gres
sion
(mar
gina
leffe
cts
for
the
aver
age
firm
are
repo
rted
).In
depe
nden
tva
riab
les
incl
ude
Over
confid
ence
ST
,Over
confid
ence
LT
,Opti
mis
mS
T,O
pti
mis
mL
T,O
pti
mis
mfir
m,
Opti
mis
mU
.S.,
inte
ract
ions
ofov
erco
nfide
nce
vari
able
sw
ith
past
retu
rns,
cont
rols
,and
fixed
effec
ts.
Con
trol
vari
able
sin
clud
ebo
okle
vera
ge(e
xcep
tfo
rin
colu
mn
(4))
,co
llate
ral,
log(
sale
s),as
set
M/B
,pr
ofita
bilit
y,di
vide
nds
indi
cato
r(e
xcep
tfo
rin
colu
mn
(6))
,5-
year
sale
sgr
owth
,an
d12
-mon
thpa
stre
turn
s.Fix
edeff
ects
incl
ude
indu
stry
fixed
effec
ts(S
IC2)
and
surv
eyda
tefix
edeff
ects
.T
here
gres
sion
repo
rted
inco
lum
n(6
)in
clud
esa
cont
rol
for
repu
rcha
ses
(dum
my)
.U
tilit
ies
and
finan
cial
firm
sar
eex
clud
edfr
omth
esa
mpl
e.A
ccou
ntin
gda
taar
efr
omC
ompu
stat
.M
erge
rsda
taar
efr
omT
hom
son
SDC
Pla
tinu
m.
Ret
urns
data
are
from
CR
SP.V
aria
ble
defin
itio
nsar
epr
ovid
edin
the
App
endi
x.*,
**,**
*de
note
two-
taile
dsi
gnifi
canc
eat
the
10%
,5%
,an
d1%
leve
l,re
spec
tive
ly.
Stan
dard
erro
rsar
ecl
uste
red
atth
e2-
digi
tSI
Cle
vel.
Mer
ger
anno
unce
men
tC
apex
Acq
uisi
tion
sex
cess
Boo
kB
onus
inte
nsity
inte
nsity
retu
rns
(-1,
1)le
vera
geL
Tdeb
t qT
ota
ldeb
t q−
1D
ivid
ends
Rep
urch
ase
s qT
ota
lA
sset
s q−
1
SE
Os q
Tota
lA
sset
s q−
1fr
acti
on(%
)(%
)(%
)(%
)(%
)0/
1(%
)(%
)(%
)(1
)O
LS
(2)
OLS
(3)
OLS
(4)
OLS
(5)
OLS
(6)
prob
it(7
)O
LS
(8)
OLS
(9)
OLS
Ove
rcon
fiden
ceST
-1.3
4-1
.68
-0.1
92.
91*
8.44
*-0
.03
-0.6
0-0
.03
5.69
*(1
.11)
(1.1
5)(0
.98)
(1.6
5)(4
.61)
(0.0
9)(0
.55)
(0.6
6)(2
.98)
Ove
rcon
fiden
ceLT
3.30
***
2.03
**-2
.43*
*0.
987.
40**
-0.2
5**
-0.3
80.
040.
94(1
.19)
(1.0
0)(1
.08)
(1.6
4)(3
.08)
(0.1
0)(0
.36)
(0.5
9)(2
.66)
Opt
imis
mST
-0.2
00.
59-0
.77
1.32
-5.3
6*0.
05-0
.01
-0.3
4-0
.67
(1.9
3)(1
.61)
(1.1
0)(1
.70)
(3.1
2)(0
.08)
(0.6
3)(0
.48)
(3.0
6)O
ptim
ism
LT-0
.29
-0.3
41.
381.
02-1
.78
0.03
-0.4
7-0
.15
1.75
(1.2
3)(1
.04)
(1.1
1)(1
.58)
(2.9
8)(0
.08)
(0.5
2)(0
.33)
(3.1
8)O
ptim
ism
firm
0.09
-1.0
80.
85-0
.99
2.81
0.09
0.25
-0.0
13.
07(0
.87)
(0.6
7)(0
.77)
(1.8
6)(4
.07)
(0.0
7)(0
.45)
(0.2
8)(1
.90)
Opt
imis
mU
.S.
0.12
-0.6
3-1
.22
-1.0
03.
210.
13*
-0.2
5-0
.11
-1.3
2(1
.41)
(1.3
8)(1
.25)
(1.8
3)(3
.46)
(0.0
8)(0
.42)
(0.3
9)(4
.01)
Ove
rcon
fiden
ceST
-1.5
3**
-1.3
2×
12m
thpa
stre
t(0
.63)
(2.0
1)O
verc
onfid
ence
LT-0
.56
-1.9
6**
×12
mth
past
ret
(0.5
0)(0
.98)
Obs
erva
tion
s10
3398
837
310
3395
696
197
297
157
1R
2(P
seud
o-R
2)
0.25
0.24
0.31
0.40
0.26
0.39
0.37
0.44
0.48
40

Table VIIIs the Effect of Overconfidence Stronger in High-Beta Firms?
The table tests how closely linked the overconfidence variables are with corporate policies in high beta firms.The dependent variables correspond to the dependent variables in the previous tables (capex intensity,acquisitions intensity, the fraction of long-term debt out of total debt, dividend indicator, and the fractionof bonus compensation out of bonus and salary compensation). Independent variables include OC ST(Overconfidence ST ), OC LT (Overconfidence LT ), Optimism ST , Optimism LT , Optimism firm,Optimism U.S., market beta, interactions of market beta and overconfidence variables, controls, and fixedeffects. Control variables include book leverage (except for in column (4)), collateral, log(sales), M/B,profitability, dividends indicator (except for in column (6)), 5-year sales growth, and 12-month past returns.Fixed effects include industry fixed effects (SIC2) and survey date fixed effects. Column (6) includes acontrol for repurchases (dummy). Utilities and financial firms are excluded from the sample. Detailedvariable definitions are provided in the Appendix. All regressions are OLS regressions except for regression(4) which is a probit regression (marginal effects for the average firm are reported). *, **, *** denote two-tailed significance at the 10%, 5%, and 1% level, respectively. All regressions have intercepts that are notpresented. Standard errors are clustered at the 2-digit SIC level.
Mergerannouncement
Capex Acquisitions excess Book Bonusintensity intensity returns (-1, 1) leverage LT debtq
Tot Debtq−1Dividends fraction
(%) (%) (%) (%) (%) 0/1 (%)(1) OLS (2) OLS (3) OLS (4) OLS (5) OLS (6) probit (7) OLS
OC ST ×βMKT -2.35** -0.09 -0.04 -0.01 -3.44 0.18 -1.12(1.08) (0.99) (1.06) (1.76) (3.82) (0.12) (2.18)
OC LT ×βMKT 1.20 0.85 -1.96** 0.51 7.09 -0.23** 5.64**(1.37) (0.79) (0.73) (2.32) (4.50) (0.12) (2.22)
Observations 1025 980 370 1025 950 953 568R2 (Pseudo-R2) 0.26 0.25 0.33 0.41 0.27 0.52 0.50
41

Figure 1. Time-Series of CFO Miscalibration
Figure 1. The percentage of CFOs for whom S&P 500 realized returns fall in the 80%confidence interval, by survey quarter
0%
80%
2001/Q2
2001/Q3
2001/Q4
2002/Q1
2002/Q2
2002/Q3
2002/Q4
2003/Q1
2003/Q2
2003/Q3
2003/Q4
2004/Q1
2004/Q2
2004/Q3
2004/Q4
2005/Q1
2005/Q2
2005/Q3
2005/Q4
2006/Q1
Survey Quarter
% o
f C
onfi
den
ce I
nte
rval
s th
at
Con
tain
S&
P 5
00 R
ealiz
atio
ns
42

Figure 2. Distribution of One-Year S&P 500 Volatilities
Figure 2a. Historical distribution of S&P 500 one-year volatility (1950-2006)
0%
5%
10%
15%
20%
0 5 10 15 20 25 30
1-Year Historical Volatility (%)
Rel
ativ
e F
req
uen
cy
Figure 2b. One-year volatility imputed from survey confidence intervals
0%
5%
10%
15%
20%
0 5 10 15 20 25 30
1-Year Survey Individual Volatility (%)
Rel
ativ
e F
req
uen
cy
43

Figure 3. Distribution of Ten-Year S&P 500 Volatilities
Figure 3a. Historical distribution of S&P 500 ten-year volatility (1950-2006)
0%
10%
20%
30%
0 5 10 15 20 25 30
10-Year Historical Volatility (Annualized %)
Rel
ativ
e F
req
uen
cy
Figure 3b. Ten-year volatility imputed from survey confidence intervals
0%
10%
20%
30%
0 5 10 15 20 25 30
10-Year Survey Individual Volatility (Annualized %)
Rel
ativ
e F
req
uen
cy
44

Figure 4. Expected Returns, Confidence Bounds and Realized Returns
Figure 4. Means of expected returns, 80% confidence bounds (means of lower and upperconfidence bounds) and one-year ahead realized S&P 500 returns, by survey quarter
-40%
-30%
-20%
-10%
0%
10%
20%
30%
2000
/Q1
2000
/Q2
2000
/Q3
2000
/Q4
2001
/Q1
2001
/Q2
2001
/Q3
2001
/Q4
2002
/Q1
2002
/Q2
2002
/Q3
2002
/Q4
2003
/Q1
2003
/Q2
2003
/Q3
2003
/Q4
2004
/Q1
2004
/Q2
2004
/Q3
2004
/Q4
2005
/Q1
2005
/Q2
2005
/Q3
2005
/Q4
2006
/Q1
2006
/Q2
2006
/Q3
2006
/Q4
2007
/Q1
Survey Quarter
For
ecas
ted
1-Y
ear
Ret
urn
s (%
)or
Rea
lize
d 1
-Yea
r R
etu
rns
(%)
Forecasted 1-Year Returns (mean)Realized 1-Year ReturnsForecasted 10th/90th Percentiles (mean)
45