
Network-Based Marketing: Identifying Likely Adopters via ...
21
Statistical Science 2006, Vol. 21, No. 2, 256–276 DOI: 10.1214/088342306000000222 © Institute of Mathematical Statistics, 2006 Network-Based Marketing: Identifying Likely Adopters via Consumer Networks Shawndra Hill, Foster Provost and Chris Volinsky Abstract. Network-based marketing refers to a collection of marketing techniques that take advantage of links between consumers to increase sales. We concentrate on the consumer networks formed using direct interactions (e.g., communications) between consumers. We survey the diverse literature on such marketing with an emphasis on the statistical methods used and the data to which these methods have been applied. We also provide a discus- sion of challenges and opportunities for this burgeoning research topic. Our survey highlights a gap in the literature. Because of inadequate data, prior studies have not been able to provide direct, statistical support for the hypoth- esis that network linkage can directly affect product/service adoption. Using a new data set that represents the adoption of a new telecommunications ser- vice, we show very strong support for the hypothesis. Specifically, we show three main results: (1) “Network neighbors”—those consumers linked to a prior customer—adopt the service at a rate 3–5 times greater than baseline groups selected by the best practices of the firm’s marketing team. In ad- dition, analyzing the network allows the firm to acquire new customers who otherwise would have fallen through the cracks, because they would not have been identified based on traditional attributes. (2) Statistical models, built with a very large amount of geographic, demographic and prior purchase data, are significantly and substantially improved by including network in- formation. (3) More detailed network information allows the ranking of the network neighbors so as to permit the selection of small sets of individuals with very high probabilities of adoption. Key words and phrases: Viral marketing, word of mouth, targeted market- ing, network analysis, classification, statistical relational learning. 1. INTRODUCTION Network-based marketing seeks to increase brand recognition and profit by taking advantage of a so- Shawndra Hill is a Doctoral Candidate and Foster Provost is Associate Professor, Department of Information, Operations and Management Sciences, Leonard N. Stern School of Business, New York University, New York, New York 10012-1126, USA (e-mail: [email protected]; [email protected]). Chris Volinsky is Director, Statistics Research Department, AT&T Labs Research, Shannon Laboratory, Florham Park, New Jersey 07932, USA (e-mail: [email protected]). cial network among consumers. Instances of network- based marketing have been called word-of-mouth mar- keting, diffusion of innovation, buzz marketing and viral marketing (we do not consider multilevel market- ing, which has become known as “network” market- ing). Awareness or adoption spreads from consumer to consumer. For example, friends or acquaintances may tell each other about a product or service, increasing awareness and possibly exercising explicit advocacy. Firms may use their websites to facilitate consumer- to-consumer advocacy via product recommendations (Kautz, Selman and Shah, 1997) or via on-line cus- tomer feedback mechanisms (Dellarocas, 2003). Con- 256
Transcript of Network-Based Marketing: Identifying Likely Adopters via ...

Statistical Science2006, Vol. 21, No. 2, 256–276DOI: 10.1214/088342306000000222© Institute of Mathematical Statistics, 2006
Network-Based Marketing: IdentifyingLikely Adopters via ConsumerNetworksShawndra Hill, Foster Provost and Chris Volinsky
Abstract. Network-based marketing refers to a collection of marketingtechniques that take advantage of links between consumers to increase sales.We concentrate on the consumer networks formed using direct interactions(e.g., communications) between consumers. We survey the diverse literatureon such marketing with an emphasis on the statistical methods used and thedata to which these methods have been applied. We also provide a discus-sion of challenges and opportunities for this burgeoning research topic. Oursurvey highlights a gap in the literature. Because of inadequate data, priorstudies have not been able to provide direct, statistical support for the hypoth-esis that network linkage can directly affect product/service adoption. Usinga new data set that represents the adoption of a new telecommunications ser-vice, we show very strong support for the hypothesis. Specifically, we showthree main results: (1) “Network neighbors”—those consumers linked to aprior customer—adopt the service at a rate 3–5 times greater than baselinegroups selected by the best practices of the firm’s marketing team. In ad-dition, analyzing the network allows the firm to acquire new customers whootherwise would have fallen through the cracks, because they would not havebeen identified based on traditional attributes. (2) Statistical models, builtwith a very large amount of geographic, demographic and prior purchasedata, are significantly and substantially improved by including network in-formation. (3) More detailed network information allows the ranking of thenetwork neighbors so as to permit the selection of small sets of individualswith very high probabilities of adoption.
Key words and phrases: Viral marketing, word of mouth, targeted market-ing, network analysis, classification, statistical relational learning.
1. INTRODUCTION
Network-based marketing seeks to increase brandrecognition and profit by taking advantage of a so-
Shawndra Hill is a Doctoral Candidate and Foster Provostis Associate Professor, Department of Information,Operations and Management Sciences, Leonard N. SternSchool of Business, New York University, New York, NewYork 10012-1126, USA (e-mail:[email protected]; [email protected]). ChrisVolinsky is Director, Statistics Research Department, AT&TLabs Research, Shannon Laboratory, Florham Park, NewJersey 07932, USA (e-mail: [email protected]).
cial network among consumers. Instances of network-based marketing have been called word-of-mouth mar-keting, diffusion of innovation, buzz marketing andviral marketing (we do not consider multilevel market-ing, which has become known as “network” market-ing). Awareness or adoption spreads from consumer toconsumer. For example, friends or acquaintances maytell each other about a product or service, increasingawareness and possibly exercising explicit advocacy.Firms may use their websites to facilitate consumer-to-consumer advocacy via product recommendations(Kautz, Selman and Shah, 1997) or via on-line cus-tomer feedback mechanisms (Dellarocas, 2003). Con-
256

NETWORK-BASED MARKETING 257
sumer networks may also provide leverage to the ad-vertising or marketing strategy of the firm. For exam-ple, in this paper we show how analysis of a consumernetwork improves targeted marketing.
This paper makes two contributions. First we sur-vey the burgeoning methodological research literatureon network-based marketing, in particular on statisti-cal analyses for network-based marketing. We reviewthe research questions posed, and the data and analytictechniques used. We also discuss challenges and op-portunities for research in this area. The review allowsus to postulate necessary data requirements for study-ing the effectiveness of network-based marketing andto highlight the lack of current research that satisfiesthose requirements. Specifically, research must haveaccess both to direct links between consumers and todirect information on the consumers’ product adoption.Because of inadequate data, prior studies have not beenable to provide direct, statistical support (Van den Bulteand Lilien, 2001) for the hypothesis that network link-age can directly affect product/service adoption.
The second contribution is to provide empirical sup-port that network-based marketing indeed can im-prove on traditional marketing techniques. We intro-duce telecommunications data that present a naturaltestbed for network-based marketing models, in whichcommunication linkages as well as product adoptionrates can be observed. For these data, we show threemain results: (1) “Network neighbors”—those con-sumers linked to a prior customer—adopt the service ata rate 3–5 times greater than baseline groups selectedby the best practices of the firm’s marketing team. Inaddition, analyzing the network allows the firm to ac-quire new customers who otherwise would have fallenthrough the cracks, because they would not have beenidentified based on traditional attributes. (2) Statisticalmodels, built with a very large amount of geographic,demographic and prior purchase data, are significantlyand substantially improved by including network in-formation. (3) More sophisticated network informationallows the ranking of the network neighbors so as topermit the selection of small sets of individuals withvery high probabilities of adoption.
2. NETWORK-BASED MARKETING
There are three, possibly complementary, modes ofnetwork-based marketing.
Explicit advocacy: Individuals become vocal advo-cates for the product or service, recommending it totheir friends or acquaintances. Particular individuals
such as Oprah, with her monthly book club reading list,may represent “hubs” of advocacy in the consumer re-lationship network. The success of The Da Vinci Code,by Dan Brown, may be due to its initial marketing:10,000 books were delivered free to readers thought tobe influential enough (e.g., individuals, booksellers) tostimulate the traffic in paid-for editions (Paumgarten,2003). When firms give explicit incentives to con-sumers to spread information about a product via wordof mouth, it has been called viral marketing, althoughthat term could be used to describe any network-basedmarketing where the pattern of awareness or adoptionspreads from consumer to consumer.
Implicit advocacy: Even if individuals do not speakabout a product, they may advocate implicitly throughtheir actions—especially through their own adoptionof the product. Designer labeling has a long tradi-tion of using consumers as implicit advocates. Firmscommonly capitalize on influential individuals (such asathletes) to advocate products simply by conspicuousadoption. More recently, firms have tried to induce thesame effect by convincing particularly “cool” membersof smaller social groups to adopt products (Gladwell,1997; Hightower, Brady and Baker, 2002).
Network targeting: The third mode of network-basedmarketing is for the firm to market to prior purchasers’social-network neighbors, possibly without any advo-cacy at all by customers. For network targeting, thefirm must have some means to identify these socialneighbors.
These three modes may be used in combination.A well-cited example of viral marketing combines net-work targeting and implicit advocacy: The Hotmailfree e-mail service appended to the bottom of everyoutgoing e-mail message the hyperlinked advertise-ment, “Get your free e-mail at Hotmail,” therebytargeting the social neighbors of every current user(Montgomery, 2001), while taking advantage of theuser’s implicit advocacy. Hotmail saw an exponen-tially increasing customer base. Started in July 1996,in the first month alone Hotmail acquired 20,000 cus-tomers. By September 1996 the firm had acquired over100,000 accounts, and by early 1997 it had over 1 mil-lion subscribers.
Traditional marketing methods do not appeal tosome segments of consumers. Some consumers ap-parently value the appearance of being on the cuttingedge or “in the know,” and therefore derive satisfac-tion from promoting new, exciting products. The firmBzzAgents (Walker, 2004) has managed to entice vol-untary (unpaid) marketing of new products. Further-

258 S. HILL, F. PROVOST AND C. VOLINSKY
more, although more and more information has be-come available on products, parsing such informationis costly to the consumer. Explicit advocacy, such asword-of-mouth advocacy, can be a useful way to filterout noise.
A key assumption of network-based marketingthrough explicit advocacy is that consumers propagate“positive” information about products after they eitherhave been made aware of the product by traditionalmarketing vehicles or have experienced the productthemselves. Under this assumption, a particular subsetof consumers may have greater value to firms becausethey have a higher propensity to propagate product in-formation (Gladwell, 2002), based on a combinationof their being particularly influential and their havingmore friends (Richardson and Domingos, 2002). Firmsshould want to find these influencers and to promoteuseful behavior.
3. LITERATURE REVIEW
Many quantitative statistical methods used in em-pirical marketing research assume that consumers actindependently. Typically, many explanatory attributesare collected on each actor and used in multivari-ate modeling such as regression or tree induction. Incontrast, network-based marketing assumes interde-pendency among consumer preferences. When inter-dependencies exist, it may be beneficial to account fortheir effects in targeting models. Traditionally in statis-tical research, interdependencies are modeled as part ofa covariance structure, either within a particular obser-vational unit (as in the case of repeated measures ex-periments) or between observational units. Studies ofnetwork-based marketing instead attempt to measurethese interdependencies through implicit links, such asmatching on geographic or demographic attributes, orthrough explicit links, such as direct observation ofcommunications between actors. In this section, we re-view the different types of data and the range of statis-tical methods that have been used to analyze them, andwe discuss the extent to which these methods naturallyaccommodate networked data.
Work in network-based marketing spans the fieldsof statistics, economics, computer science, sociology,psychology and marketing. In this section, we orga-nize prominent work in network-based marketing bysix types of statistical research: (1) econometric mod-eling, (2) network classification modeling, (3) surveys,(4) designed experiments with convenience samples,(5) diffusion theory and (6) collaborative filtering and
recommender systems. In each case, we provide anoverview of the approach and a discussion of a promi-nent example. This (brief ) survey is not exhaustive. Inthe final subsection, we discuss some of the statisticalchallenges inherent in incorporating this network struc-ture.
3.1 Econometric Models
Econometrics is the application of statistical meth-ods to the empirical estimation of economic relation-ships. In marketing this often means the estimation oftwo simultaneous equations: one for the marketing or-ganization or firm and one for the market. Regressionand time-series analysis are found at the core of econo-metric modeling, and econometric models are oftenused to assess the impact of a target marketing cam-paign over time.
Econometric models have been used to study the im-pact of interdependent preferences on rice consump-tion (Case, 1991), automobile purchases (Yang andAllenby, 2003) and elections (Linden, Smith and York,2003). For each of the aforementioned studies, geogra-phy is used in part as a proxy for interdependence be-tween consumers, as opposed to direct, explicit com-munication. However, different methods are used inthe analysis. Most recently, Yang and Allenby (2003)suggested that traditional random effects models arenot sufficient to measure the interdependencies of con-sumer networks. They developed a Bayesian hierar-chical mixture model where interdependence is builtinto the covariance structure through an autoregressiveprocess. This framework allows testing of the presenceof interdependence through a single parameter. It alsocan incorporate the effects of multiple networks, eachwith its own estimated dependence structure. In theirapplication, they use geography and demography tocreate a “network” of consumers in which links arecreated between consumers who exhibit geographic ordemographic similarity. The authors showed that thegeographically defined network of consumers is moreuseful than the demographic network for explainingconsumer behavior as it relates to purchasing Japanesecars. Although they do not have data on direct commu-nication between consumers, the framework presentedby Yang and Allenby (2003) could be extended to ex-plicit network data where links are created betweenconsumers through their explicit communication as op-posed to demographic or geographic similarity.
A drawback of this approach is that the interde-pendence matrix has size n2, where n is the numberof consumers; consumer networks are extremely large

NETWORK-BASED MARKETING 259
and prohibit parameter estimation using this method.Sparse matrix techniques or clever clustering of the ob-servations would be a natural extension.
3.2 Network Classification Models
Network classification models use knowledge of thelinks between entities in a network to estimate a quan-tity of interest for those entities. Typically, in such amodel an entity is influenced most by those directlyconnected to it, but is also affected to a lesser ex-tent by those further away. Some network classifica-tion models use an entire network to make predictionsabout a particular entity on the network; Macskassyand Provost (2004) provided a brief survey. However,most methods have been applied to small data sets andhave not been applied to consumer data. Much researchin network classification has grown out of the pioneer-ing work by Kleinberg (1999) on hubs and authoritieson the Internet, and out of Google’s PageRank algo-rithm (Brin and Page, 1998), which (to oversimplify)identifies the most influential members of a networkby how many influential others “point” to them. Al-though neither study uses statistical models, both arerelated to well-understood notions of degree centralityand distance centrality from the field of social-networkanalysis.
One paper that models a consumer network for max-imizing profit is by Richardson and Domingos (2002),in which a social network of customers is modeled asa Markov random field. The probability that a givencustomer will buy a given product is a function of thestates of her neighbors, attributes of the product andwhether or not the customer was marketed to. In thisframework it is possible to assign a “network value”to every customer by estimating the overall benefit ofmarketing to that customer, including the impact thatthe marketing action will have on the rest of the net-work (e.g., through word of mouth). The authors testedtheir model on a database of movie reviews from an In-ternet site and found that their proposed methodologyoutperforms non-network methods for estimating cus-tomer value. Their network formulation uses implicitlinks (customers are linked when a customer reads areview by another customer and subsequently reviewsthe item herself ) and implicit purchase information(they assume a review of an item implies a purchaseand vice versa).
3.3 Surveys
Most research in this area does not have informa-tion on whether consumers actually talk to each other.
To address this shortcoming, some studies use surveysampling to collect comprehensive data on consumers’word-of-mouth behavior. By sampling individuals andcontacting them, researchers can collect data that aredifficult (or impossible) to obtain directly by observingnetwork-based marketing phenomena (Bowman andNarayandas, 2001). The strength of these studies liesin the data, including the richness and flexibility of theanswers that can be collected from the responders. Forinstance, researchers can acquire data about how cus-tomers found out about a product and how many oth-ers they told about the product. An advantage is thatresearchers can design their sampling scheme to con-trol for any known confounding factors and can devisefully balanced experimental designs that test their hy-potheses. Since the purpose of models built from sur-vey data is description, simple statistical methods likelogistic regression or analysis of variance (ANOVA)typically are used.
Bowman and Narayandas (2001) surveyed morethan 1700 purchasers of 60 different products who pre-viously had contacted the manufacturer of that product.The purchasers were asked specific questions abouttheir interaction with the manufacturer and its impacton subsequent word-of-mouth behavior. The authorswere able to capture whether the customers told oth-ers of their experience and if so, how many peoplethey told. The authors found that self-reported “loyal”customers were more likely to talk to others about theproducts when they were dissatisfied, but interestinglynot more likely when they were satisfied. Althoughstudies like this collect some direct data on consumers’word-of-mouth behavior, the researchers do not knowwhich of the consumers’ contacts later purchased theproduct. Therefore, they cannot address whether word-of-mouth actually affects individual sales.
3.4 Designed Experiments with ConvenienceSamples
Designed experiments enable researchers to studynetwork-based marketing in a controlled setting. Al-though the subjects typically comprise a conveniencesample (such as those undergraduates who answer anad in the school newspaper), the design of the experi-ment can be completely randomized. This is unlike thestudies that rely on secondary data sources or data fromthe Web. Typically ANOVA is used to draw conclu-sions.
Frenzen and Nakamoto (1993) studied the factorsthat influence individuals’ decisions to disseminate in-formation through a market via word-of-mouth. The

260 S. HILL, F. PROVOST AND C. VOLINSKY
subjects were presented with several scenarios that rep-resented different products and marketing strategies,and were asked whether they would tell trusted andnontrusted acquaintances about the product/sale. Theystudied the effect of the cost/value manipulations onthe consumers’ willingness to share information ac-tively with others, as a function of the strength ofthe social tie. In this study, the authors did not allowthe subjects to construct their explicit consumer net-work; instead, they asked the participants to hypoth-esize about their networks. The experiments used thedata from a convenience sample to generalize overa complete consumer network. The authors also em-ployed simulations in their study. They found that thestronger the moral hazard (the risk of problematic be-havior) presented by the information, the stronger theties must be to foster information propagation. Gen-erally, the authors showed that network structure andinformation characteristics interact when individualsform their information transmission decisions.
3.5 Diffusion Models
Diffusion theory provides tools, both quantitativeand qualitative, to assess the likely rate of diffusionof a technology or product. Qualitatively, researchershave identified numerous factors that facilitate or hin-der technology adoption (Fichman, 2004), as well associal factors that influence product adoption (Rogers,2003). Quantitative diffusion research involves empir-ical testing of predictions from diffusion models, ofteninformed by economic theory.
The most notable and most influential diffusionmodel was proposed by Bass (1969). The Bass modelof product diffusion predicts the number of users whowill adopt an innovation at a given time t . It hypoth-esizes that the rate of adoption is a function solelyof the current proportion of the population who haveadopted. Specifically, let F(t) be the cumulative pro-portion of adopters in the population. The diffusionequation, in its simplest form, models F(t) as a func-tion of p, the intrinsic adoption rate, and q , a mea-sure of social contagion. When q > p, this equationdescribes an S-shaped curve, where adoption is slowat first, takes off exponentially and tails off at the end.This model can effectively model word-of-mouth prod-uct diffusion at the aggregate, societal level.
In general, the empirical studies that test and ex-tend accepted theories of product diffusion rely onaggregate-level data for both the customer attributesand the overall adoption of the product (Ueda, 1990;Tout, Evans and Yakan, 2005); they typically do not
incorporate individual adoption. Models of productdiffusion assume that network-based marketing is ef-fective. Since understanding when diffusion occursand the extent to which it is effective is importantfor marketers, these methods may benefit from usingindividual-level data. Data on explicit networks wouldenable the extension of existing diffusion models, aswell as the comparison of results using individual- ver-sus aggregate-level data.
In his first study, Bass tested his model empiricallyagainst data for 11 consumer durables. The modelyielded good predictions of the sales peak and thetiming of the peak when applied to historical data.Bass used linear regression to estimate the parame-ters for future sales predictions, measuring the good-ness of fit (R2 value) of the model for 11 consumerdurable products. The success of the forecasts suggeststhat the model may be useful in providing long-rangeforecasting for product sales or adoption. There hasbeen considerable follow-up work on diffusion sincethis groundbreaking work. Mahajan, Muller and Kerin(1984) review this work. Recent work on product diffu-sion explores the extent to which the Internet (Fildes,2003) as well as globalization (Kumar and Krishnan,2002) play a role in product diffusion.
3.6 Collaborative Filtering and RecommenderSystems
Recommender systems make personalized recom-mendations to individual consumers based on de-mographic content and link data (Adomavicius andTuzhilin, 2005). Collaborative filtering methods focuson the links between consumers; however, the links arenot direct. They associate consumers with each otherbased on shared purchases or similar ratings of sharedproducts.
Collaborative filtering is related to explicit consumernetwork-based marketing because both target market-ing tasks benefit from learning from data stored in mul-tiple tables (Getoor, 2005). For example, Getoor andSahami (1999), Huang, Chung and Chen (2004) andNewton and Greiner (2004) established the connectionbetween the recommendation problem and statisticalrelational learning through the application of proba-bilistic relational models (PRM’s) (Getoor, Friedman,Koller and Pfeffer, 2001). However, neither group usedexplicit links between customers for learning. Recom-mendation systems may well benefit from informationabout explicit consumer interaction as an additional,perhaps quite important, aspect of similarity.

NETWORK-BASED MARKETING 261
3.7 Research Opportunities and StatisticalChallenges
We see that there is a burgeoning body of workthat addresses consumers’ interactions and their effectson purchasing. To our knowledge the foregoing typesrepresent the main statistical approaches taken in re-search on network-based marketing. In each approach,there are assumptions made in the data collection or inthe analysis that restrict them from providing strongand direct support for the hypothesis that network-based marketing indeed can improve on traditionaltechniques. Surveys and convenience samples can suf-fer from small and possibly biased samples. Collab-orative filtering models have large samples, but donot measure direct links between individuals. Modelsin network classification and econometrics historicallyhave used proxies like geography instead of data ondirect communications, and almost all studies have noaccurate, specific data on which (and what) customerspurchase.
To paint a complete picture of network influence fora particular product, the ideal data set would have thefollowing properties: (1) large and unbiased sample,(2) comprehensive covariate information on subjects,(3) measurement of direct communication betweensubjects and (4) accurate information on subjects’ pur-chases. The data set we present in the next sectionhas all of these properties and we will demonstrateits value for statistical research into network influence.The question of how to analyze such data brings upmany statistical issues:
Data-set size. Network-based marketing data setsoften arise from Internet or telecommunications ap-plications and can be quite large. When observationsnumber in the millions (or hundreds of millions), thedata become unwieldy for the typical data analyst andoften cannot be handled in memory by standard statis-tical analysis software. Even if the data can be loaded,their size renders the interactive style of analysis com-mon with tools like R or Splus painfully slow. In Inter-net or telecommunications studies, there often are twomassive sources of data: all actors (web sites, commu-nicators), along with their descriptive attributes, andthe transactions among these actors. One solution isto compress the transaction information into attributesto be included in the actors’ attribute set. It has beenshown that file squashing (DuMouchel, Volinsky et al.,1999), which attempts to combine the best features ofpreprocessed data with random sampling, can be use-ful for customer attrition prediction. DuMouchel et al.
claimed that squashing can be useful when dealingwith up to billions of records. However, there may bea loss of important information which can be capturedonly by complex network structure.
More sophisticated network information derivedfrom transactional data can also be incorporated intothe matrix of customer information by deriving net-work attributes such as degree distribution and timespent on the network (which we demonstrate below).Similarly, other types of data such as geographical dataor temporal data, which otherwise would need to behandled by some sophisticated methodology, can befolded into the analysis by creating new covariates.It remains an open question whether clever data en-gineering can extract all useful information to createa set of covariates for traditional analysis. For exam-ple, knowledge of communication with specific sets ofindividuals can be incorporated, and may provide sub-stantial benefit (Perlich and Provost, 2006).
Once the data are combined, the remaining data setstill may be quite large. While much data mining re-search is focused on scaling up the statistical toolbox totoday’s massive data sets, random sampling remains aneffective way to reduce data to a manageable size whilemaintaining the relationships we are trying to discover,if we assume the network information is fully encodedin the derived variables. The amount of sampling nec-essary will depend on the computing environment andthe complexity of the model, but most modern systemscan handle data sets of tens or hundreds of thousandsof observations. When sampling, care must be taken tostratify by any attributes that are of particular interestor to oversample those attributes that have extremelyskewed distributions.
Low incidence of response. In applications where theresponse is a consumer’s purchase or reaction to a mar-keting event, it is common to have a very low responserate, which can result in poor fit and reduced ability todetect significant effects for standard techniques likelogistic regression. If there are not many independentattributes, one solution is Poisson regression, which iswell suited for rare events. Poisson regression requiresforming buckets of observations based on the indepen-dent attributes and modeling the aggregate responsein these buckets as a Poisson random variable. Thisrequires discretization of any continuous independentattributes, which may not be desirable. Also, if thereare even a moderate number of independent attributes,the buckets will be too sparse to allow Poisson mod-eling. Other solutions that have been proposed includeoversampling positive responses and/or undersampling

262 S. HILL, F. PROVOST AND C. VOLINSKY
negative responses. Weiss (2004) gave an overview ofthe literature on these and related techniques, show-ing that there is mixed evidence as to their effective-ness. Other studies of note include the following. Weissand Provost (2003) showed that, given a fixed samplesize, the optimal class proportion in training data variesby domain and by ultimate objective (but can be de-termined); generally speaking, to produce probabilityestimates or rankings, a 50:50 distribution is a good de-fault. However, Weiss and Provost’s results are only fortree induction. Japkowicz and Stephen (2002) experi-mented with neural networks and support-vector ma-chines, in addition to tree induction, showing (amongother things) that support-vector machines are insen-sitive to class imbalance. However, they consideredprimarily noise-free data. Other techniques to dealwith unbalanced response attributes include ensemble(Chan and Stolfo, 1998; Mease, Wyner and Buja, 2006)and multiphase rule induction (Clearwater and Stern,1991; Joshi, Kumar and Agarwal, 2001). This is an areain need of more systematic empirical and theoreticalstudy.
Separating word-of-mouth from homophily. Unlessthere is information about the content of communi-cations, one cannot conclude that there was word-of-mouth transmission of information about the product.Social theory tells us that people who communi-cate with each other are more likely to be simi-lar to each other, a concept called homophily (Blau,1977; McPherson, Smith-Lovin and Cook, 2001). Ho-mophily is exhibited for a wide variety of relation-ships and dimensions of similarity. Therefore, linkedconsumers probably are like-minded, and like-mindedconsumers tend to buy the same products. One way toaddress this issue in the analysis is to account for con-sumer similarity using propensity scores (Rosenbaumand Rubin, 1984). Propensity scores were developedin the context of nonrandomized clinical trials and at-tempt to adjust for the fact that the statistical profile ofpatients who received treatment may be different thanthe profile of those who did not, and that these differ-ences could mask or enhance the apparent effect of thetreatment. Let T represent the treatment, X representthe independent attributes excluding the treatment andY represent the response. Then the propensity scorePS(x) = P(T = 1|X = x). By matching propensityscores in the treatment and control groups using typicalindicators of homophily like demographic data, we canaccount (partially) for the possible confoundedness ofother independent attributes.
Incorporating extended network structure. Data withnetwork structure lend themselves to a robust set ofnetwork-centric analyses. One simple method (em-ployed in our analysis) is to create attributes fromthe network data and plug them into a traditionalanalysis. Another approach is to let each actor be in-fluenced by her neighborhood modeled as a Markovrandom field. Domingos and Richardson (2001) usedthis technique to assign every node a “network value.”A node with high network value (1) has a high prob-ability of purchase, (2) is likely to give the producta high rating, (3) is influential on its neighbors’ rat-ings and (4) has neighbors like itself. Hoff, Raftery andHandcock (2002) defined a Markov-chain Monte Carlomethod to estimate latent positions of the actors forsmall social-network data sets. This embeds the actorsin an unobserved “social space,” which could be moreuseful than the actual transactions themselves for pre-dicting sales. The field of statistical relational learning(Getoor, 2005) has recently produced a wide variety ofmethods that could be applicable. Often these modelsallow influence to propagate through the network.
Missing data. Missing data in network transactionsare common—often only part of a network is observ-able. For instance, firms typically have transactionaldata on their customers only or may have one classof communication (e-mail) but not another (cellularphone). One attempt to account for these missing edgesis to use network structure to assign a probability ofa missing edge everywhere an edge is not present.Thresholding this probability creates pseudo-edges,which can be added to the network, perhaps with alesser weight (Agarwal and Pregibon, 2004). This isclosely related to the link prediction problem, whichtries to predict where the next links will be (Liben-Nowell and Kleinberg, 2003). One extension of thePRM framework models link structure through the useof reference uncertainty and existence uncertainty. Theextension includes a unified generative model for bothcontent and relational structure, where interactions be-tween the attributes and link structure are modeled(Getoor, Friedman, Koller and Taskar, 2003).
4. DATA SET AND PRIMARY HYPOTHESIS
This section details our data set, derived primar-ily from a direct-mail marketing campaign to po-tential customers of a new communications service(later we augment the primary data with a large setof consumer-specific attributes). The firm’s market-ing team identified and marketed to a list of prospects

NETWORK-BASED MARKETING 263
using its standard methods. We investigate whethernetwork-related effects or evidence of “viral” informa-tion spread are present in this group. As we will de-scribe, the firm also marketed to a group we identifiedusing the network data, which allows us to test our hy-potheses further. We are not permitted to disclose cer-tain details, including specifics about the service beingoffered and the exact size of the data set.
4.1 Initial Data Details
In late 2004, a telecommunications firm undertook alarge direct-mail marketing campaign to potential cus-tomers of a new communications service. This serviceinvolved new technology and, because of this, it wasbelieved that marketing would be most successful tothose consumers who were thought to be “high tech.”
In keeping with standard practice, the marketingteam collected attributes on a large set of prospects—consumers whom they believed to be potential adoptersof the service. The marketing team used demographicdata, customer relationship data, and various other datasources to create profitability and behavioral modelsto identify prospective targets—consumers who wouldreceive a targeted mailing. The data the marketingteam provided us with did not contain the underly-ing customer attributes (e.g., demographics), but in-
stead included values for derived attributes that de-fined 21 marketing segments (Table 1) that were usedfor campaign management and post hoc analyses. Thesample included millions of consumers. The team be-lieved that the different segments would have varyingresponse rates and it was important to separate the seg-ments in this way to learn the most from the campaign.
An important derived variable was loyalty, a three-level score based on previous relationships with thefirm, including previous orders of this and other ser-vices. Roughly, loyalty level 3 comprises customerswith moderate-to-long tenure and/or those who havesubscribed to a number of services in the past. Loyaltylevel 2 comprises those customers with which the firmhas had some limited prior experiences. Loyalty level 1comprises consumers who did not have service with thefirm at the time of mailing; little (if any) information isavailable on them. Previous analyses have shown thatloyalty and tenure attributes have substantial impact onresponse to campaigns.
Other important attributes were based on demo-graphics and other customer characteristics. The at-tribute Intl is an indicator of whether the prospect hadpreviously ordered any international services; Tech1(hi, med or low) and Tech2 (1–10, where 1 = hightech) are scores derived from demographics and other
TABLE 1Descriptive statistics for the marketing segments (see Section 4.1 for details)
Segment Loyalty Intl Tech1 Tech2 Early Adopt Offer % of list %NN
1 3 Y Hi 1–7 Med–Hi P1 1.6 0.632 3 Y Med 1–7 Med–Hi P1 2.4 1.263 2 Y Hi 1–4 Hi P1 1.7 0.084 2 Y Med 1–4 Hi P1 1.7 0.105 1 Y Hi 1–4 Hi P1 0.1 0.226 1 Y Med 1–4 Hi P1 0.1 0.257 3 N Hi 1–7 Med–Hi P2 10.9 0.508 3 N Med 1–7 Med–Hi P2 13.1 0.839 2 N Hi 1–4 Hi P2 17.5 0.04
10 2 N Med 1–4 Hi P2 11.0 0.0711 1 N Hi 1–4 Hi P2 5.3 0.1412 1 N Med 1–4 Hi P2 7.7 0.2513 3 N Hi 1–7 Med–Hi P2 2.0 0.6314 1, 2 N Hi 1–4 Hi P2 2.0 0.1515 1 Y ? ? ? P3 2.0 1.0116 1 N ? ? ? P2 1.6 0.4617 3 N Hi 1–7 Med–Hi P2+ 2.0 0.7018 1, 2 N Hi 1–4 Hi P2+ 2.0 0.1519 1, 2, 3 Y Hi 1–7 Med–Hi P3 1.8 0.6720 2 N Hi, Med 1–4 Hi L1 6.0 0.0521 2 N Hi, Med 1–4 Hi L2 6.0 0.05

264 S. HILL, F. PROVOST AND C. VOLINSKY
attributes that estimate the interest and ability of thecustomer to use a high-tech service; Early Adopt isa proprietary score that estimates the likelihood ofthe customer to use a new product, based on previ-ous behavior. We also show the Offer, indicating thatdifferent segments received different marketing mes-sages: P1–P3 indicate different postcards that weresent, L1 and L2 indicate different letters, and a “+”indicates that a “call blast” accompanied the mailing.In defining the segments, those groups with high loy-alty values were permitted lower values from the tech-nology and early adoption models. Segments 15 and 16were provided by an external vendor; there were insuf-ficient data on these prospects to fit our Tech and EarlyAdopt models, as indicated by a “?” in Table 1.
4.2 Primary Hypothesis and Network Neighbors
The research goal we consider here is whether re-laxing the assumption of independence between con-sumers can improve demonstrably the estimation ofresponse likelihood. Thus, our first hypothesis is thatsomeone who has direct communication with a currentsubscriber is more likely herself to adopt the service.It should be noted that the firm knows only of com-munications initiated by one of its customers through aservice of the firm, so the network data are incomplete(considerably), especially for the lower loyalty groups.Data on communications events include anonymousidentifiers for the transactors, a time stamp and thetransaction duration. For the purposes of this research,all data are rendered anonymous so that individualidentities are protected.
In pursuit of our hypothesis, we constructed an at-tribute called network neighbor (or NN)—a flag thatindicates whether the targeted consumer had commu-nicated with a current user of the service in a time pe-riod prior to the marketing campaign. Overall, 0.3% ofthe targets are network neighbors. In Table 1, the per-centage of network neighbors (%NN) is broken downby segment.
In addition, the marketing team invited us to createour own segment, which they also would target. Our“segment 22” consisted of network neighbors that werenot already on the current list of targets. To make sureour list contained viable prospects, the marketing teamcalculated the derived technology and early adopterscores for the consumers on our list. They filteredbased on these scores, but they relaxed the thresholdsused to limit their original list. For instance, someonewith loyalty = 1 needed a Tech2 score less than 4 tomerit inclusion on the initial list; this threshold was
relaxed for our list to Tech2 less than 7. In this way,the marketing team allowed prospects who missed in-clusion on the first cut to make it into segment 22 ifthey were network neighbors. However, the market-ing team still avoided targeting customers who theybelieved had very small probabilities of a purchase.For those network neighbors who did not score highenough to warrant inclusion in segment 22, we stilltracked their purchase records to see if any of them sub-scribed to the service in the absence of the marketingcampaign; see below. Overall, the profile of the candi-dates in our segment 22 was considered to be subparin terms of demographics, affinity and technologicalcapability. Notably, for our final conclusions, these tar-gets are potential customers the firm would have other-wise ignored. The size of segment 22 was about 1.2%of the marketing list.
To summarize, the above process divides the pros-pect universe along two dimensions: (1) targets—thoseconsumers identified by the marketing models as beingworthy of solicitation—and (2) network neighbors—those who had direct communication with a subscriber.Table 2 shows the relative size for each combination(using the non-network-neighbor targets as the refer-ence set). Note the non-NN nontargets, who neitherare network neighbors nor are they deemed to be goodprospects. This group is the majority of the prospectspace and includes consumers that the firm has very lit-tle information about, because they are low-usage com-municators or do not subscribe to any services with thefirm.
4.3 Modeling with Consumer-Specific Data
To determine whether relaxing the independence as-sumption (using the network data) improves model-ing, we fit models using a wide range of demographicand consumer-specific independent attributes (manyof which are known or believed to affect the esti-mated likelihood of purchase). Overall, we collectedthe values for over 150 attributes to assess their ef-fect on sales likelihood and their interactions with thenetwork-neighbor variable. These values included thefollowing:
• Loyalty data: We obtained finer-grained loyalty in-formation than the simple categorization describedabove, including past spending, types of service,how often the customer responded to prior mailings,a loyalty score generated by a proprietary model andinformation about length of tenure.

NETWORK-BASED MARKETING 265
TABLE 2Data categories
Target = Y Target = N
NN = Y NN targets NN nontargetsSegments 1–22Relative size = 0.015 Relative size = 0.10Prospects identified by marketing models and who alsoare network neighbors. Those in segment 22 have re-duced thresholds on the marketing model scores.
Consumers who were network neighbors, but were notmarketed to because they scored poorly on marketingmodels.
NN = N Non-NN targets Non-NN nontargetsSegments 1–21Relative size = 1 Relative size > 8Prospects identified by marketing models but who arenot network neighbors.
Consumers who were not network neighbors and alsowere not considered to be good prospects by the mar-keting model.
NOTES. The data for our study are broken down into targets and network neighbors. The “relative size” value shows the number of prospectswho show up in each group, relative to the non-NN target group.
• Geographic data: Geographic data were necessaryfor the direct mail campaign. These data include city,state, zip code, area code and metropolitan city code.
• Demographic data: These include information suchas gender, education level, credit score, head ofhousehold, number of children in the household, ageof members in the household, occupation and homeownership. Some of this information was inferred atthe census tract level from the geographic data.
• Network attributes: As mentioned earlier, we ob-served communications of current subscribers withother consumers. In addition to the simple network-neighbor flag described earlier, we derived moresophisticated attributes from prospects’ communica-tion patterns. We will return to these in Section 5.6.
4.4 Data Limitations
We encountered missing values for customers acrossall loyalty levels. The amount of missing information isdirectly related to the level of experience we have hadwith the customer just prior to the direct mailing. Forexample, geography data are available for all targetsacross all three loyalty levels. On the other hand, as thenumber of services and tenure with the firm decline,so does the amount of information (e.g., transactions)available for each target. Given the difference in in-formation as loyalty varies, we grouped customers byloyalty level and treated the levels separately in ouranalyses. This stratification leaves three groups thatare mostly internally consistent with respect to miss-ing values.
The overall response rate is very low. As discussedabove, this presents challenges inherent with a heav-ily skewed response variable. For example, an analysisthat stratifies over many different attributes may haveseveral strata with no sales at all, rendering these stratamostly useless. The data set is large, which helps toameliorate this problem, but in turn presents logisticalproblems with many sophisticated statistical analyses.In this paper, we restrict ourselves to relatively straight-forward analyses.
4.5 Loyalty Distribution
A look at the distribution of the loyalty groups acrossthe four categories (Figure 1) of prospects shows thatthe firm targeted customers in the higher loyalty groupsrelatively heavily. The network-neighbor target groupappears to skew toward the less loyal prospects; thisis due to the fact that segment 22, which makes up alarge part of the network-neighbor population, com-prises predominantly low-loyalty consumers.
5. ANALYSIS
Next we will show direct, statistical evidence thatconsumers who have communicated with prior cus-tomers are more likely to become customers. We showthis in several ways, including using our own bestefforts to build competing targeting models and con-ducting thorough assessments of predictive ability onout-of-sample data. Then we consider more sophisti-cated network attributes and show that targeting can beimproved further.

266 S. HILL, F. PROVOST AND C. VOLINSKY
FIG. 1. Loyalty distribution by customer category. The three bars show the relative sizes of the three loyalty groups for our four datacategories. The network neighbors (NN) show a much larger proportion of low-loyalty consumers than the non-NN group.
5.1 Network-Based Marketing Improves Response
Segmentation provides an ideal setting to test the sig-nificance and magnitude of any improvement in model-ing by including network-neighbor information, whilestratifying by many attributes known to be important,such as loyalty and tenure. The response variable isthe take rate for the targets in the two months followingthe direct mailing. The take rate is the proportion of thetargeted consumers who adopted the service within aspecified period following the offer. For each segment,we performed a simple logistic regression for the inde-pendent network-neighbor attribute versus the depen-dent sales response. In Figure 2, we graphically presentparameter estimates (equivalent to log-odds ratios) forthe network attribute along with 95% confidence inter-vals for 20 of the 21 segments (segment 5 had only asmall number of network-neighbor prospects and zero
FIG. 2. Results of logistic regression. Parameter estimates plot-ted as log-odds ratios with 95% confidence intervals. The numberplotted at the value of the parameter estimate refers back to seg-ment numbers from Table 1.
network-neighbor sales, and therefore had an infinitelog odds). Figure 2 shows that in all 20 segments thenetwork-neighbor effect is positive (the parameter esti-mate is greater than zero), demonstrating an increasedtake rate for the network-neighbor group within eachsegment. For 17 of these segments, the log-odds ratiois significantly different from the null hypothesis valueof 0 (p < 0.05), indicating that being a network neigh-bor significantly affected sales in those segments.
While odds ratios allow for tests of significance ofan independent variable, they are not as directly inter-pretable as comparisons of take rates of the network-neighbor and non-network-neighbor groups in a givensegment. The take rates for the network neighborsare plotted versus the non-network neighbors in Fig-ure 3, where the size of the point is proportional tothe log size of the segment. All segments have highertake rates in the network-neighbor subgroup, except forthe one segment that had no network-neighbor sales(the smallest sample size). Over the entire data set, thenetwork-neighbors’ take rates were greater by a fac-tor of 3.4. This value is plotted in Figure 3 as a dottedline with slope = 3.4. The right-hand plot of Figure 3shows the relationship between each segment’s takerate and its lift ratio, defined as the take rate for NNdivided by the take rate for non-NN. The plot showsthat the benefit of being a network neighbor is greaterfor those segments with lower overall take rates.
As Figure 3 shows, some of the segments had muchhigher take rates than others. To assess statistical sig-nificance of the network-neighbor effect after account-ing for this segment effect, we ran a logistic regressionacross all segments, including the main effects for the

NETWORK-BASED MARKETING 267
FIG. 3. Take rates for marketing segments. Left: For each segment, comparison of the take rate of the non-network neighbors with that ofthe network neighbors. The size of the glyph is proportional to the log size of the segment. There is one outlier not plotted, with a take rateof 11% for the network neighbors and 0.3% for the non-network neighbors. Reference lines are plotted at x = y and at the overall take-rateratio of 3.4. Right: Plot of the take rate for the non-network group versus lift ratio for the network neighbors.
network-neighbor attribute, dummy attributes for eachsegment and the interaction terms between the two.Two of the interaction terms had to be deleted: onefrom segment 22, which only had network-neighborcases, and one from the segment with no sales fromthe network neighbors. We ran a full logistic regressionand used stepwise variable selection.
TABLE 3Coefficients and confidence intervals for the final segment model
Attribute Coeff (c.i.) Significancea
Network neighbor (NN) 2.0 (1.7, 2.3) **Segment = 1 1.7 (0.9, 2.5) **Segment = 2 1.8 (1.2, 2.4) **Segment = 4 2.1 (1.3, 3.0) **Segment = 5 1.9 (0.4, 3.3) **Segment = 6 1.9 (1.2, 2.5) **Segment = 7 1.4 (1.0, 1.9) **Segment = 8 1.3 (0.9, 1.7) **Segment = 17 1.5 (0.7, 2.2) **Segment = 19 2.2 (1.6, 2.9) **NN × Segment = 1 −1.1 (−2.1, 0.0) *NN × Segment = 2 −0.9 (−1.7, −0.2) **NN × Segment = 4 −1.8 (−4.0, 0.4) **NN × Segment = 6 −1.5 (−2.6, −0.6) **NN × Segment = 7 −1.2 (−1.7, −0.6) **NN × Segment = 8 −0.8 (−1.3, −0.4) **NN × Segment = 17 −1.6 (−2.8, −0.5) **NN × Segment = 19 −1.1 (−1.9, −0.3) **
aSignificance of the attributes in the logistic regression model isshown at the 0.05 (*) and 0.01 (**) levels.
The results of the logistic regression reiterate the sig-nificance of being a network neighbor. The final modelcan be found in Table 3. The coefficient of 2.0 for thenetwork-neighbor attribute in the final model is an esti-mate of the log odds, which we exponentiate to get anodds ratio of 7.49, with a 95% confidence interval of(5.64, 9.94). More than half of the segment effects andmost of the interactions between the network-neighborattribute and those segment effects are significant. Theinterpretation of these interactions is important. Notethat the magnitudes of the interaction coefficients arenegative and very close in magnitude to the coefficientsof the main effects of the segments themselves. There-fore, although the segments themselves are significant,in the presence of the network attribute the segments’effect is mostly negated by the interaction effect. Sincethe segments represent known important attributes likeloyalty, tenure and demographics, this is evidence thatbeing a network neighbor is at least as important in thiscontext.
In Table 4 we present an analysis of deviance table,an analog to analysis of variance used for nested lo-gistic regressions (McCullagh and Nelder, 1983). Thetable confirms the significance of the main effects andof the interactions. Each level of the nested model issignificant when a chi-squared approximation is usedfor the differences of the deviances. The fact that somany interactions are significant demonstrates that thenetwork-neighbor effect varies for different segmentsof the prospect population.

268 S. HILL, F. PROVOST AND C. VOLINSKY
TABLE 4Analysis of deviance table for the network-neighbor study
Variable Deviance DF Change in deviance Significancea
Intercept 11200Segment 10869 9 63 **Segment + NN 10733 1 370 **Segment + NN + interactions 10687 8 41 **
aSignificance of the group of attributes at each step is shown at the 0.05 (*) and 0.01 (**) levels.
5.2 Segment 22
The segment data enable us to compare take ratesof network and non-network targets for the segmentsthat contained both types of targets. However, many ofthe network-neighbor targets fall into the network-onlysegment 22. Segment 22 comprises prospects that theoriginal marketing models deemed not to be good can-didates for targeting. As we can see from the distribu-tion in Figure 1, this segment for the most part containsconsumers who had no prior relationship with the firm.
We compare the take rates for segment 22 with thetake rates for the combined group, including all of seg-ments 1–21, in the leftmost three bars of Figure 4.The network-neighbor segment 22 is (not surprisingly)not as successful as the NN groups in segments 1–21,since the targets in segments 1–21 were selected basedon characteristics that made them favorable for mar-keting. Interestingly, we see that the segment 22 net-work neighbors outperform the non-NN targets fromsegments 1–21. These segment 22 network neighbors,identified primarily on the basis of their network ac-tivity, were more likely by almost 3 to 1 to purchasethan the more “favorable” prospects who were not net-work neighbors. Since those in segment 22 either were
FIG. 4. Take rates for marketing segments. Take rates for thenetwork neighbors and non-network neighbors in segments 1–21compared with the all-network-neighbor segment 22 and with thenontarget network neighbors. All take rates are relative to thenon-network-neighbor group (segments 1–21).
not identified by marketing analysts or were deemed tobe unworthy prospects, they represent customers whowould have “fallen through the cracks” in the tradi-tional marketing process.
5.3 Improving a Multivariate Targeting Model
Now we will assess whether the NN attribute can im-prove a multivariate targeting model by incorporatingall that we know or can find out (over 150 different at-tributes) about the targets, including geography, demo-graphics and other company-specific attributes, frominternal and external sources (see Section 3.2).
As discussed in Section 3.7, we tried to address(as well as possible) an important causal question thatarises: Is this network-neighbor effect due to word ofmouth or simply due to homophily? The observed ef-fect may not be indicating viral propagation, but in-stead may simply demonstrate a very effective wayto find like-minded people. This theoretical distinctionmay not matter much to the firm for this particular typeof marketing process, but is important to make, for ex-ample, before designing future campaigns that try totake advantage of word-of-mouth behavior.
Although we cannot control for unobserved similar-ities, we can be as careful as possible in our analysisto ensure that the statistical profile of the NN prospectsis the same as the profile for the non-NN cases. Sinceour data set contains many more non-NN cases thanNN cases, we match each NN case with a single non-NN case that is as close as possible to it by calculatingpropensity scores using all of the explanatory attributesconsidered (as described in Section 3.7). At the end ofthis matching process, the NN group is as close as isreasonably possible in statistical properties to the non-NN group.
Due to heterogeneity of data sources across the threeloyalty groups, we used the propensity scores to createa matched data set for each group. For each (individu-ally), we fitted a full logistic regression including in-teractions and selected a final model using stepwise
NETWORK-BASED MARKETING 269
TABLE 5Results of multivariate model
Loyalty
3 2 1
Significant NN NN NNattributes Discount calling plan (-)(I) Discount calling plan (-) Previous responder to
Level of Int’l Comm.(I) Tenure with firm mailing# of devices in house (-) Referral plan High Tech MsgRevenue band High Tech model score (I) Letter (vs. postcard)Tenure with firm (-) Region of country indicator Recent responder to mailingInternational communicator Belonged to loyalty program User of incentive credit cardBelonged to loyalty program Chumer (-) Any children in house (-)Referral plan College gradType of previous service Tenure at residence (-)Credit score Any children in house (-)Number of adults in house Child < 18 at home (-)
Beta hat for NN(95% CI) 0.68 (0.46, 0.91) 0.99 (0.49, 1.49) 0.84 (0.52, 1.16)
Take rate 0.9% 0.4% 0.3%
NOTES. Significant attributes from logistic regressions across loyalty levels (p < 0.05). Bold indicates significance at 0.01 level; (-) indicatesthe effect of the variable was negative; (I) indicates a significant interaction with the NN variable.
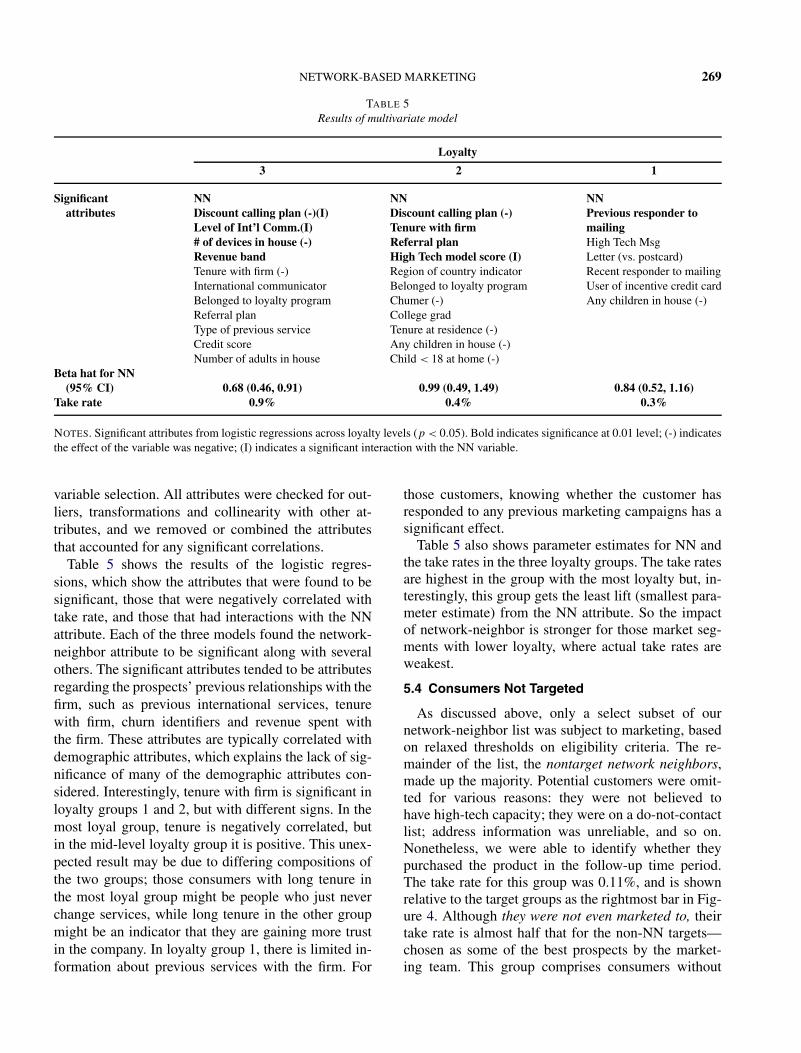
variable selection. All attributes were checked for out-liers, transformations and collinearity with other at-tributes, and we removed or combined the attributesthat accounted for any significant correlations.
Table 5 shows the results of the logistic regres-sions, which show the attributes that were found to besignificant, those that were negatively correlated withtake rate, and those that had interactions with the NNattribute. Each of the three models found the network-neighbor attribute to be significant along with severalothers. The significant attributes tended to be attributesregarding the prospects’ previous relationships with thefirm, such as previous international services, tenurewith firm, churn identifiers and revenue spent withthe firm. These attributes are typically correlated withdemographic attributes, which explains the lack of sig-nificance of many of the demographic attributes con-sidered. Interestingly, tenure with firm is significant inloyalty groups 1 and 2, but with different signs. In themost loyal group, tenure is negatively correlated, butin the mid-level loyalty group it is positive. This unex-pected result may be due to differing compositions ofthe two groups; those consumers with long tenure inthe most loyal group might be people who just neverchange services, while long tenure in the other groupmight be an indicator that they are gaining more trustin the company. In loyalty group 1, there is limited in-formation about previous services with the firm. For
those customers, knowing whether the customer hasresponded to any previous marketing campaigns has asignificant effect.
Table 5 also shows parameter estimates for NN andthe take rates in the three loyalty groups. The take ratesare highest in the group with the most loyalty but, in-terestingly, this group gets the least lift (smallest para-meter estimate) from the NN attribute. So the impactof network-neighbor is stronger for those market seg-ments with lower loyalty, where actual take rates areweakest.
5.4 Consumers Not Targeted
As discussed above, only a select subset of ournetwork-neighbor list was subject to marketing, basedon relaxed thresholds on eligibility criteria. The re-mainder of the list, the nontarget network neighbors,made up the majority. Potential customers were omit-ted for various reasons: they were not believed tohave high-tech capacity; they were on a do-not-contactlist; address information was unreliable, and so on.Nonetheless, we were able to identify whether theypurchased the product in the follow-up time period.The take rate for this group was 0.11%, and is shownrelative to the target groups as the rightmost bar in Fig-ure 4. Although they were not even marketed to, theirtake rate is almost half that for the non-NN targets—chosen as some of the best prospects by the market-ing team. This group comprises consumers without

270 S. HILL, F. PROVOST AND C. VOLINSKY
any known favorable characteristics that would haveput them on the list of prospects. The fact that theyare network neighbors alone supports a relatively hightake rate, even in the absence of direct marketing.This lends some support to an explanation of word-of-mouth propagation rather than homophily.
Finally, we will briefly discuss the remainder of theconsumer space—the non-NN nontarget group. Unfor-tunately, it is very difficult to estimate a take rate in thiscategory, which could be considered a baseline rate forall of the other take rates. To do this, we would need toestimate the size of the space of all prospects. This in-cludes all of the prospects the firm knows about, as wellas customers of the firm’s competitors and consumerswho might purchase this product that do not have cur-rent telecommunications service with any provider. Ithas been established that the size of the communica-tions market is difficult to estimate (Poole, 2004); ourbest estimates of this baseline take rate put it at wellbelow 0.01%, at least an order of magnitude less thaneven the nontarget network neighbors.
On the other hand, a by-product of our study is thatwe can upper-bound the effect of the mass market-ing campaigns in general by comparing the target-NNgroup and the nontarget-NN group. The difference intake rates between the targeted network neighbors andthe nontargeted network neighbors is about 10 to 1.This difference cannot all be attributed to the marketingeffect, since the targeted group was specifically chosento be better prospects and it is likely that more of themwould have signed up for the service even in the totalabsence of marketing. However, it does seem reason-able to call this factor of 10 an upper bound on theeffect of the marketing.
5.5 Out-of-Sample Ranking Performance
These results suggest that we can give fine-grainedestimations as to which customers are more or lesslikely to respond to an offer. Such estimations can bequite valuable: the consumer pool is immense and acampaign will have a limited budget. Therefore, be-ing able to pick a better list of “top-k” prospects willlead directly to increased profit (assuming targetingcosts are not much higher for higher ranked prospects).In this section, we show that combining the network-neighbor attribute with the traditional attributes im-proves the ability to rank customers accurately.
For each consumer, we create a record that com-prises all of the traditional attributes (trad atts), includ-ing loyalty, demographic and geographic attributes, as
well as network-neighbor status. Note that in differentbusiness scenarios, different types and amounts of dataare available. For example, for low-loyalty customers,very few descriptive attributes are known. We reportresults here using all attributes; the findings are quali-tatively similar for every different subset of attributeswe have tried (namely, segment, loyalty, geography,demographic). The response variable is the same asabove and we used the same logistic regression mod-els. We measure the predictive ranking ability in the bi-nary response variable by an increase in the Wilcoxon–Mann–Whitney statistic, equivalent to the area underthe ROC curve (AUC). The ROC curve represents thetrade off between false negative and false positive ratesfor each predicted possible probability score cutoff re-sulting from the logistic regression model. Specifically,the AUC is the probability that a randomly chosen (asyet unseen) taker will be ranked higher than a randomlychosen nontaker; AUC = 1.0 means the classes are per-fectly separated and AUC = 0.5 means the list is ran-domly shuffled. All reported AUC values are averagesobtained using 10-fold cross-validation.
Table 6 shows the AUC values for the three loy-alty groups, quantifying the expected benefit from theimproved logistic regression models. There is an in-crease in AUC for each group, with the largest increasebelonging to loyalty level 1, for which the least infor-mation is available; note that here the ranking abilitywithout the network information is not much betterthan random.
To visualize this improvement, Figure 5(a) shows cu-mulative response (“lift”) curves when using the modelon loyalty group 3. The lower curve depicts the per-formance of the model using all traditional attributes,and the upper curve includes the traditional marketingattributes and the network-neighbor attribute. In Fig-ure 5(b), one can see the marked improvement that
TABLE 6ROC analysis: AUC values that result from the application of
logistic regression models
Loyalty trad atts trad atts + NN
1 0.54 0.602 0.64 0.673 0.60 0.64
NOTE. The logistic regression models were built using all availableattributes with (trad atts + NN) and without (trad atts) the network-neighbor attribute. We see an increase in AUC across all loyaltygroups when the NN attribute is included in the model.

NETWORK-BASED MARKETING 271
FIG. 5. (a) Lift curves. Power of the segmentation curves for models built with all attributes with (trad atts) and without (trad atts + NN)network-neighbor attribute. The model with the NN attribute outperforms the model without it. For example, if the firm sent out 50% of themailing, they would get 70% of the positive responses with the NN compared to receiving only 63% of the responses without it. (b) Top-kanalysis. Consumers are ranked by the probability scores from the logistic regression model. The model that includes the NN attributeoutperforms the model without. For example, for the top 20% of targets, the take rate is 1.51% without the NN attribute and 1.72% with theNN attribute.
would be obtained from sending to the top-k prospectson the list. For example, for the top 20% of the list,without the NN attribute, the take rate is 1.51%; withthe NN attribute, it is 1.72%. The NN attribute does notimprove the ranking for the top 10% of the list.
5.6 Improving Performance By Adding MoreSophisticated Network Attributes
Knowing whether a consumer is a network neigh-bor is one of the simplest indicators of consumer-to-consumer interaction that can be extracted from thenetwork data. We now investigate whether augment-ing the model with more sophisticated social-networkinformation can add additional value. In this section,we focus on the social network that comprises (only)the current customers of this service (which here wewill call “the network”), along with the peripheryof prospects who have communicated with those onthe network (the network neighbors). We investigatewhether we can improve targeting by using more so-
phisticated measures of social relationship with thenetwork of existing customers.
Table 7 summarizes a set of additional social-network attributes that we add to the logistic regres-sion. The terminology we use is borrowed to somedegree from the fields of social-network analysis andgraph theory. Social-network analysis (SNA) involvesmeasuring relationships (including information trans-mission) between people on a network. The nodes inthe network represent people and the links betweenthem represent relationships between the nodes. TheSNA measures help quantify intuitive social notions,such as connectedness, influence, centrality, social im-portance and so on. Graph theory helps to understandproblems better by representing them as interconnectednodes, and provides vocabulary and methods for oper-ating mathematically.
Three of the attributes that we introduce can be de-rived from a prospect’s local neighborhood (the set ofimmediate communication partners on the network; re-call that these all are current customers). Degree mea-
TABLE 7Network attribute descriptions
Attribute Description
Degree Number of unique customers communicated with before the mailingTransactions Number of transactions to/from customers before the mailingSeconds of communication Number of seconds communicated with customers before mailingConnected to influencer Is an influencer in prospect’s local neighborhood?Connected component size Size of the connected component prospect belongs toMax similarity Max overlap in local neighborhood with any existing neighboring customer

272 S. HILL, F. PROVOST AND C. VOLINSKY
sures the number of direct connections a node has.Within the local neighborhood, we also count the num-ber of Transactions, and the length of those transac-tions (Seconds of communication).
The network is made up of many disjoint subgraphs.Given a graph G = (V , E), where V is a set of ver-tices (nodes) and E is a set of links between them,the connected components of G are the sets of ver-tices such that all vertices in each set are mutually con-nected (reachable by some path) and no two verticesin different sets are connected. The size of the con-nected component may be an indicator for awarenessof and positive views about the product. If a prospectis linked to a large set of “friends” all of whom haveadopted the service, she may be more likely to adoptherself. Connected component size is the size of thelargest connected component (in the network) to whichthe prospect is connected.
We also move beyond a prospect’s local neigh-borhood. Observing the local neighborhoods of aprospect’s local neighbors, we can define a measureof social similarity. We define social similarity as thesize of the overlap in the immediate network neighbor-hoods of two consumers. Max similarity is the max-imum social similarity between the prospect and anyneighbors of the prospect. Finally, the firm also canobserve the prior dynamics of its customers. In partic-ular, the firm can observe which customers communi-cated before and/or after their adoption as well as thedate customers signed up. Using this information, wedefine influencers as those subscribers who signed upfor the service and, subsequently, we see one of theirnetwork neighbors sign up for the service. Connectedto influencer is an indicator of whether the prospect isconnected to one of these influencers. We appreciatethat we do not actually know if there was true influ-ence.
We use all of the aforementioned attributes and showAUC values for these predictive models in Table 8. Wefind that some of these network attributes have con-siderable predictive power individually and have evenmore value when combined. This is indicated by AUCsof 0.68 for both transactions and seconds of commu-nication. We do not find high AUCs individually forconnected component size, similarity or connected toinfluencer. Ultimately, we find that the logistic regres-sion model built with the network attributes results inan AUC of 0.71 compared to an AUC of 0.66 withoutthe network attributes—using only the traditional mar-keting attributes described in previous sections. (Re-call that this represents the ability to rank the network
TABLE 8ROC analysis
Attribute(s) AUC
Transactions 0.68Seconds of communication 0.68Degree 0.59Connected to influencer 0.53Connected component size 0.55Similarity 0.55All network 0.71All traditional (loyalty, demographic, geographic) 0.66All traditional + all network 0.71
NOTE. AUC values result from logistic regression models built oneach of the constructed network attributes individually, as well asin combination. Results are presented for loyalty-level 3 customers.
neighbors, who already have especially high take ratesas a group, as we have shown.)
Interestingly, when we combine the traditional at-tributes with the network attributes, there is no ad-ditional gain in AUC, even though many of theseattributes were shown to be significant in the broaderanalysis above. The similarities represented implicitlyor explicitly in the network attributes seem to accountfor all useful information captured by traditional de-mographics and other marketing attributes. That tra-ditional demographics and other marketing attributesdo not add value is not only of theoretical interest, butpractical as well—for example, in cases such as thiswhere demographic data must be purchased.
Our result is further confirmed by the lift and takerate curves displayed in Figure 6(a) and (b), respec-tively. One can achieve substantially higher take ratesusing the new network attributes as compared to usingthe traditional attributes. For example, we find that forthe top 20% of the targeted list, without the networkattributes, the take rate is 2.2%; with the network at-tributes, it is 3.1%. Likewise, at the top 10% of the list,the take rate with the network attributes is 4.4% com-pared to 2.9% without them.
6. LIMITATIONS
We believe our study to be the first to combine dataon direct customer communication with data on prod-uct adoption to show the effect of network-based mar-keting statistically. However, there are limitations inour study that are important to point out.
There are several types of missing, incomplete orunreliable data which could influence our results. Wehave records of all of the communication (using the

NETWORK-BASED MARKETING 273
FIG. 6. (a) Lift curves. Power of segmentation curves for models built with all traditional attributes, with (trad atts + net) and without (tradatts) the network attributes. If the firm sent out 50% of the mailing, they would have received 77% of the positive responses with the networkattributes compared to receiving 63% of the responses without the network attributes. (b) Top-k analysis. The model including the networkattributes (trad atts + net) outperforms the model without them (trad atts). For example, for the top 20% of target ranked by score, the takerate is 2.2% without the network attributes and 3.1% with the network attributes.
firm’s service) to and from current customers of theservice. That is not true for all the network-neighborconsumers. As such, we do not have complete infor-mation about the network-neighbor targets (as well asthe non-network-neighbor targets). In addition, someof the attributes we used were collected by purchasingdata from external sources. These data are known tobe at least partially erroneous and outdated, although itis not well known how much so. An additional prob-lem is joining data on customers from external sourcesto internal communication data, leading to missingdata or sometimes just blatantly incorrect data. Finally,telecommunications firms are not legally able to col-lect information regarding the actual content of thecommunication, so we are not able to determine ifthe consumers in question discussed the product. Inthis regard, our data are inferior to some other do-mains where content is visible, such as Internet bulletinboards or product discussion forums.
We expect the network-neighbor effect to manifestitself differently for different types of products. Mostof the studies done to date on viral marketing have fo-cused on the types of products that people are likelyto talk about, such as a new, high-tech gadget or a re-cently released movie. We expect there to be less buzzfor less “sexy” products, like a new deodorant or a saleon grapes at the supermarket. The study presented inthis paper involves a new telecommunications service,which involves a new technology and features that con-sumers have perhaps never been exposed to before. Thefirm hopes the new technology and features are suchthat they would encourage word of mouth.
What can we say about other products that might notbe quite so buzz-worthy? To study this, we compared
the new service studied here to a roll-out of anotherproduct by the same firm. This other product was sim-ply a new pricing plan for an older telecommunicationsservice. Customers who signed up for this new plancould stand to save a significant amount of money, de-pending on their current usage patterns. However, therange and variety of telecommunications pricing plansin the marketplace is so extensive and so confusing tothe typical consumer that we do not believe that thisis the type of product that would generate a lot of dis-cussion between consumers. We refer to the two prod-ucts as the pricing plan and the new technology. Forthe pricing plan, we have the same knowledge of thenetwork as we do for the new technology. For thoseconsumers who belong to the pricing plan, we knowwho they communicate with and then we can followthese network-neighbor candidates to see if they ulti-mately sign up for the plan. We construct a measureof “network neighborness” as follows. For a series ofconsecutive months, we gather data for all customerswho ordered the product in that month. We calculatethe percentage of these new customers who were net-work neighbors, that is, those who had previously com-municated with a user of the product. This percentageis a measurement of the proportion of new sales be-ing driven by network effects. By comparing this per-centage across two products, we get insight into whichproduct stimulates network effects more.
We now look at this value for our two products overan 8-month period. The time period for the two prod-ucts was chosen so that it would be within the firstyear after the product was broadly available. The re-sults are shown in Figure 7. The two main points to

274 S. HILL, F. PROVOST AND C. VOLINSKY
FIG. 7. Network-neighborness plot for new service versus pricingplan.
take away are that the new service has a higher per-cent of purchasers who are network neighbors and alsoan increasing one (except for the dip in month 5). Incontrast the pricing plan has a flat network-neighborpercentage, never increasing above 3%.
Interestingly, the dip in the plot for the new servicecorresponds exactly to the month of the direct market-ing discussed earlier. Before the campaign, we can seethat the network-neighbor effect was increasing, thatmore and more of the purchasers in a given monthwere network neighbors. During the mass marketingcampaign, we exposed many non-network neighborsto the service and many of them ended up purchasingit, temporarily dropping the network-neighbor percent-age. After the campaign, we see the network-neighborpercentage starting to increase again.
This network-neighborness measure should not beconfused with the success of the product, as the pric-ing plan was quite successful from a sales perspective,but it does suggest that the pricing plan is a productthat has less of a network-based spread of information.This difference might be due to the new service creat-ing more word-of-mouth or perhaps we are seeing theeffects of homophily. People who interact with eachother are more likely to be similar in their propensityfor purchasing the new service than in their propensityfor purchasing a particular pricing plan. Again, the ef-fects of word of mouth versus homophily are difficultto discern without knowing the content of the commu-nication.
7. DISCUSSION
One of the main concerns for any firm is when, howand to whom they should market their products. Firms
make marketing decisions based on how much theyknow about their customers and potential customers.They may choose to mass market when they do notknow much. With more information, they may marketdirectly based on some observed characteristics. Weprovide strong evidence that whether and how well aconsumer is linked to existing customers is a powerfulcharacteristic on which to base direct marketing deci-sions. Our results indicate that a firm can benefit fromthe use of social networks to predict the likelihood ofpurchasing. Taking the network data into account im-proves significantly and substantially on both the firm’sown marketing “best practices” and our best efforts tocollect and model with traditional data.
The sort of directed network-based marketing thatwe study here has applicability beyond traditionaltelecommunciations companies. For example, eBayrecently purchased Internet-telephony upstart Skypefor $2.6 billion; they now also will have large-scale,explicit data on who talks to whom. With gmail,Google’s e-mail service, Google now has access toexplicit networks of consumer interrelationships andalready is using gmail for marketing; directed network-based marketing might be a next step. Various systemshave emerged recently that provide explicit linkagesbetween acquaintances (e.g., MySpace, Friendster,Facebook), which could be fruitful fields for network-based marketing. As more consumers create interlinkedblogs, another data source arises. More generally, theseresults suggest that such linkage data potentially couldbe a sort of data considered for acquisition by manytypes of firms, as purchase data now are being col-lected routinely by many types of retail firms throughloyalty cards. Even academic departments could bene-fit from such data; for example, the enrollment in spe-cialized classes could be bolstered by “marketing” tothose linked to existing students. Such links exist (e.g.,via e-mail). It remains to design tactics for using themthat are acceptable to all.
It is tempting to argue that we have shown that cus-tomers discuss the product and that discussion helps toimprove take rates. However, word of mouth is not theonly possible explanation for our result. As discussedin detail above, it may be that the network is a powerfulsource of information on consumer homophily, whichis in accord with social theories (Blau, 1977; McPher-son, Smith-Lovin and Cook, 2001). We have tried tocontrol for homophily by using a propensity-matchedsample to produce our logistic regression model. How-ever, it may well be that direct communications be-tween people is a better indicator of deep similarity

NETWORK-BASED MARKETING 275
than any demographic or geographic attributes. Eithercause, homophily or word of mouth, is interesting boththeoretically and practically.
ACKNOWLEDGMENTS
We would like to thank DeDe Paul and Deepak Agar-wal of AT&T, as well as Chris Dellarocas of the Uni-versity of Maryland, for useful discussions and helpfulsuggestions. We would also like to thank three anony-mous reviewers who offered insightful comments onprevious drafts.
REFERENCES
ADOMAVICIUS, G. and TUZHILIN, A. (2005). Toward the nextgeneration of recommender systems: A survey of the state-of-the-art and possible extensions. IEEE Trans. Knowledge andData Engineering 17 734–749.
AGARWAL, D. and PREGIBON, D. (2004). Enhancing communi-ties of interest using Bayesian stochastic blockmodels. In Proc.Fourth SIAM International Conference on Data Mining. SIAM,Philadelphia.
BASS, F. M. (1969). A new product growth for model consumerdurables. Management Sci. 15 215–227.
BLAU, P. M. (1977). Inequality and Heterogeneity: A PrimitiveTheory of Social Structure. Free Press, New York.
BOWMAN, D. and NARAYANDAS, D. (2001). Managing customer-initiated contacts with manufacturers: The impact on share ofcategory requirements and word-of-mouth behavior. J. Market-ing Research 38 281–297.
BRIN, S. and PAGE, L. (1998). The anatomy of a large-scale hy-pertextual Web search engine. Computer Networks and ISDNSystems 30 107–117.
CASE, A. C. (1991). Spatial patterns in household demand. Econo-metrica 59 953–965.
CHAN, E. and STOLFO, S. (1998). Toward scalable learning withnon-uniform class and cost distributions: A case study in creditcard fraud detection. In Proc. Fourth International Conferenceon Knowledge Discovery and Data Mining 164–168. AAAIPress, Menlo Park, CA.
CLEARWATER, S. H. and STERN, E. G. (1991). A rule-learningprogram in high-energy physics event classification. ComputerPhysics Communications 67 159–182.
DELLAROCAS, C. (2003). The digitization of word of mouth:Promise and challenges of online feedback mechanisms. Man-agement Sci. 49 1407–1424.
DOMINGOS, P. and RICHARDSON, M. (2001). Mining the networkvalue of customers. In Proc. Seventh ACM SIGKDD Interna-tional Conference on Knowledge Discovery and Data Mining57–66. ACM Press, New York.
DUMOUCHEL, W., VOLINSKY, C., JOHNSON, T., CORTES, C.and PREGIBON, D. (1999). Squashing flat files flatter. In Proc.Fifth ACM SIGKDD International Conference on KnowledgeDiscovery and Data Mining 6–15. ACM Press, New York.
FICHMAN, R. G. (2004). Going beyond the dominant paradigmfor information technology innovation research: Emerging con-cepts and methods. J. Assoc. Information Systems 5 314–355.
FILDES, R. (2003). Review of New-Product Diffusion Models, byV. Mahajan, E. Muller and Y. Wind, eds. Internat. J. Forecasting19 327–328.
FRENZEN, J. and NAKAMOTO, K. (1993). Structure, cooperation,and the flow of market information. J. Consumer Research 20360–375.
GETOOR, L. (2005). Tutorial on statistical relational learning. In-ductive Logic Programming, 15th International Conference.Lecture Notes in Comput. Sci. 3625 415. Springer, Berlin.
GETOOR, L., FRIEDMAN, N., KOLLER, D. and PFEFFER, A.(2001). Learning probabilistic relational models. In RelationalData Mining (S. Džeroski and N. Lavrac, eds.) 307–338.Springer, Berlin.
GETOOR, L., FRIEDMAN, N., KOLLER, D. and TASKAR, B.(2003). Learning probabilistic models of link structure. J. Mach.Learn. Res. 3 679–707. MR1983942
GETOOR, L. and SAHAMI, M. (1999). Using probabilistic relationmodels for collaborative filtering. In Proc. WEBKDD 1999, SanDiego, CA.
GLADWELL, M. (1997). The coolhunt. The New Yorker March 17,78–88.
GLADWELL, M. (2002). The Tipping Point: How Little Things CanMake a Big Difference. Back Bay Books, Boston.
HIGHTOWER, R., BRADY, M. K. and BAKER, T. L. (2002). Inves-tigating the role of the physical environment in hedonic serviceconsumption: An exploratory study of sporting events. J. Busi-ness Research 55 697–707.
HOFF, P. D., RAFTERY, A. E. and HANDCOCK, M. S. (2002). La-tent space approaches to social network analysis. J. Amer. Sta-tist. Assoc. 97 1090–1098. MR1951262
HUANG, Z., CHUNG, W. and CHEN, H. C. (2004). A graph modelfor E-commerce recommender systems. J. Amer. Soc. Informa-tion Science and Technology 55 259–274.
JAPKOWICZ, N. and STEPHEN, S. (2002). The class imbal-ance problem: A systematic study. Intelligent Data Analysis 6429–449.
JOSHI, M., KUMAR, V. and AGARWAL, R. (2001). Evaluatingboosting algorithms to classify rare classes: Comparison andimprovements. In Proc. IEEE International Conference on DataMining 257–264. IEEE Press, Piscataway, NJ.
KAUTZ, H., SELMAN, B. and SHAH, M. (1997). Referral web:Combining social networks and collaborative filtering. Comm.ACM 40(3) 63–65.
KLEINBERG, J. (1999). Authoritative sources in a hyperlinked en-vironment. J. ACM 46 604–632. MR1747649
KUMAR, V. and KRISHNAN, T. V. (2002). Multinational diffusionmodels: An alternative framework. Marketing Sci. 21 318–330.
LIBEN-NOWELL, D. and KLEINBERG, J. (2003). The link pre-diction problem for social networks. In Proc. Twelfth Interna-tional Conference on Information and Knowledge Management556–559. ACM Press, New York.
LINDEN, G., SMITH, B. and YORK, J. (2003). Amazon.comrecommendations—Item-to-item collaborative filtering. IEEEInternet Computing 7 76–80.
MACSKASSY, S. and PROVOST, F. (2004). Classification in net-worked data: A toolkit and a univariate case study. CeDERWorking Paper #CeDER-04-08, Stern School of Business, NewYork University.
MAHAJAN, V., MULLER, E. and KERIN, R. (1984). Introductionstrategy for new products with positive and negative word-of-mouth. Management Sci. 30 1389–1404.

276 S. HILL, F. PROVOST AND C. VOLINSKY
MCCULLAGH, P. and NELDER, J. A. (1983). Generalized LinearModels. Chapman and Hall, New York. MR0727836
MCPHERSON, M., SMITH-LOVIN, L. and COOK, J. (2001). Birdsof a feather: Homophily in social networks. Annual Review ofSociology 27 415–444.
MEASE, D., WYNER, A. and BUJA, A. (2006). Boosted classifi-cation trees and class probability/quantile estimation. J. Mach.Learn. Res. To appear.
MONTGOMERY, A. L. (2001). Applying quantitative marketingtechniques to the Internet. Interfaces 31(2) 90–108.
NEWTON, J. and GREINER, R. (2004). Hierarchical probabilisticrelational models for collaborative filtering. In Proc. Workshopon Statistical Relational Learning, 21st International Confer-ence on Machine Learning. Banff, Alberta, Canada.
PAUMGARTEN, N. (2003). No. 1 fan dept. acknowledged. The NewYorker May 5.
PERLICH, C. and PROVOST, F. (2006). Distribution-based aggre-gation for relational learning with identifier attributes. MachineLearning 62 65–105.
POOLE, D. (2004). Estimating the size of the telephone universe.A Bayesian Mark-recapture approach. In Proc. Tenth ACMSIGKDD International Conference on Knowledge Discoveryand Data Mining 659–664. ACM Press, New York.
RICHARDSON, M. and DOMINGOS, P. (2002). Mining knowledge-sharing sites for viral marketing. In Proc. Eighth ACM SIGKDD
International Conference on Knowledge Discovery and DataMining 61–70. ACM Press, New York.
ROGERS, E. M. (2003). Diffusion of Innovations, 5th ed. FreePress, New York.
ROSENBAUM, P. R. and RUBIN, D. B. (1984). Reducing bias inobservational studies using subclassification on the propensityscore. J. Amer. Statist. Assoc. 79 516–524.
TOUT, K., EVANS, D. J. and YAKAN, A. (2005). Collaborative fil-tering: Special case in predictive analysis. Internat. J. ComputerMathematics 82 1–11. MR2159280
UEDA, T. (1990). A study of a competitive Bass model which takesinto account competition among firms. J. Operations ResearchSociety of Japan 33 319–334.
VAN DEN BULTE, C. and LILIEN, G. L. (2001). Medical innova-tion revisited: Social contagion versus marketing effort. Ameri-can J. Sociology 106 1409–1435.
WALKER, R. (2004). The hidden (in plain sight) persuaders. TheNew York Times Magazine Dec. 5, 69–75.
WEISS, G. and PROVOST, F. (2003). Learning when training dataare costly: The effect of class distribution on tree induction.J. Artificial Intelligence Research 19 315–354.
WEISS, G. M. (2004). Mining with rarity: A unifying framework.ACM SIGKDD Explorations Newsletter 6 7–19.
YANG, S. and ALLENBY, G. M. (2003). Modeling interdependentconsumer preferences. J. Marketing Research 40 282–294.