

Netherlands Climate and Energy Outlook 2020 - Summary
18
Netherlands Climate and Energy Outlook 2020 Summary
Transcript of Netherlands Climate and Energy Outlook 2020 - Summary
Netherlands Climate and Energy Outlook 2020Summary
Nationale Energieverkenning 2017

Netherlands Climate and Energy Outlook 2020Summary
4 |
Netherlands Climate and Energy Outlook 2020 - Summary
© PBL Netherlands Environmental Assessment Agency
The Hague, 2020
PBL publication number: 4299
English summary of the full Dutch report ‘Klimaat- en Energieverkenning 2020’
Corresponding author
Coordinators
Pieter Hammingh, Marijke Menkveld, Bert Daniëls, Paul Koutstaal, Klara
Schure, Michiel Hekkenberg
Authors
PBL: Marian Abels-van Overveld, Dieuwert Blomjous, Pieter Boot, Gert Jan van
den Born, Corjan Brink, Evert-Jan Brouwer, Bert Daniëls, Eric Drissen, Hans
Elzenga, Gerben Geilenkirchen, Pieter Hammingh, Michiel Hekkenberg,
Maarten ’t Hoen, Marit van Hout, Olga Ivanova, Andrew Keys, Robert
Koelemeijer, Paul Koutstaal, Sander Lensink, Jordy van Meerkerk, Jelle van
Minnen, Marieke Nauta, Durk Nijdam, Jos Notenboom, Özge Özdemir, Jeroen
Peters, Steven van Polen, Marian van Schijndel, Marc Schouten, Klara Schure,
Winand Smeets, Kim Stutvoet-Mulder, Michel Traa, Gabriëlle Uitbeijerse, Paul
Vethman, Hans Visser, Cees Volkers, Anneke Vries, Harry Wilting, Emma van der
Zanden. CBS: Reinoud Segers, Sander Brummelkamp, Arthur Denneman, Anne
Miek Kremer, Sjoerd Schenau, Niels Schoenaker, Julius Hage, Robbie Vrenken,
Bart van Wezel, Robin van den Oever en Rutger Woolthuis. TNO Energie-
Transitie: Marijke Menkveld, Joost Gerdes, Renee Kooger, Arjan Plomp, Koen
Smekens, Joost van Stralen, Casper Tigchelaar, Omar Usmani, Wouter Wetzels.
RIVM: Margreet van Zanten, Erik Honig. RVO.nl: Several experts from RVO.nl.
Advisory board
Dominique Crijns (EZK), Frans Duijnhouwer (EZK), Marten Hamelink (EZK),
Sander Kes (EZK), Jan van Beuningen (BZK), Martin Bottema (BZK), Ave Jallai
(FIN), Bas Straathof (FIN), Niels Achterberg (IenW), Sjoukje Faber (IenW), Paul
Rijkse (IenW), Thijs van den Berg (IenW), Monique Remmers (LNV), Annemiek
van der Zande (LNV), Paulina Chromik (LNV), Charald Aal (RvS), Wouter
Timmerman (RvS), Roland Uittenboogaard (RvS), Alexander van der Vooren
(Voortgangsoverleg Klimaatakkoord), Marc Londo (Voortgangsoverleg
Klimaatakkoord), Pieter Boot (PBL), Corry Brooijmans (RIVM), Martin Scheepers
(TNO EnergieTransitie), Bert Stuij (RVO.nl), Wim Vosselman (CBS).
Ultimate responsibility
PBL Netherlands Environmental Assessment Agency
Graphics
PBL Beeldredactie
Layout
OBT Opmeer, The Hague
Production coordination
PBL Publishers

5 |
This publication can be downloaded from: www.pbl.nl/en. Parts of this
publication may be reproduced, providing the source is stated, in the form:
PBL, TNO, CBS and RIVM (2020), Netherlands Climate and Energy Outlook 2020 - Summary
PBL Netherlands Environmental Assessment Agency, The Hague.
PBL Netherlands Environmental Assessment Agency is the national institute for
strategic policy analysis in the fields of the environment, nature and spatial
planning. We contribute to improving the quality of political and administrative
decision-making by conducting outlook studies, analyses and evaluations in
which an integrated approach is considered paramount. Policy relevance is the
prime concern in all of our studies. We conduct solicited and unsolicited
research that is both independent and scientifically sound.

6 | Netherlands Climate and Energy Outlook 2020
Summary
The Climate and Energy Outlook (KEV) is a joint publication by PBL Netherlands Environmental Assessment Agency, TNO Energy Transition, Statistics Netherlands (CBS), the Netherlands Enterprise Agency (RVO.nl) and the National Institute for Public Health and the Environment (RIVM). In the KEV, these organisations provide an integrated insight into the past, present and future greenhouse gas emissions and the Dutch energy system. A great deal of attention is paid to national policy, although other developments also play a role.
The reason for this report is the Climate Act (May 2019), which provides a framework for the development of national policy on greenhouse gas emission reduction to 49% (by 2030) and 95% (by 2050), compared to the 1990 level. The Climate Act was followed by the Climate Agreement, which provides further detail on how to achieve the target for 2030. Because most policy measures are aimed at reducing emissions by 2030, the KEV covers the period up to that year. The KEV’s projections for 2030 take both adopted and proposed policy into account which had to be made public on 1 May 2020 as well as officially communicated and worked out in sufficiently concrete terms. The KEV determines the effects of this policy on energy consumption and greenhouse gas emissions.
This summary starts with six general observations and subsequently provides more detail about the projections on adopted and proposed policy measures, as summarised in the main data table below.
General observations
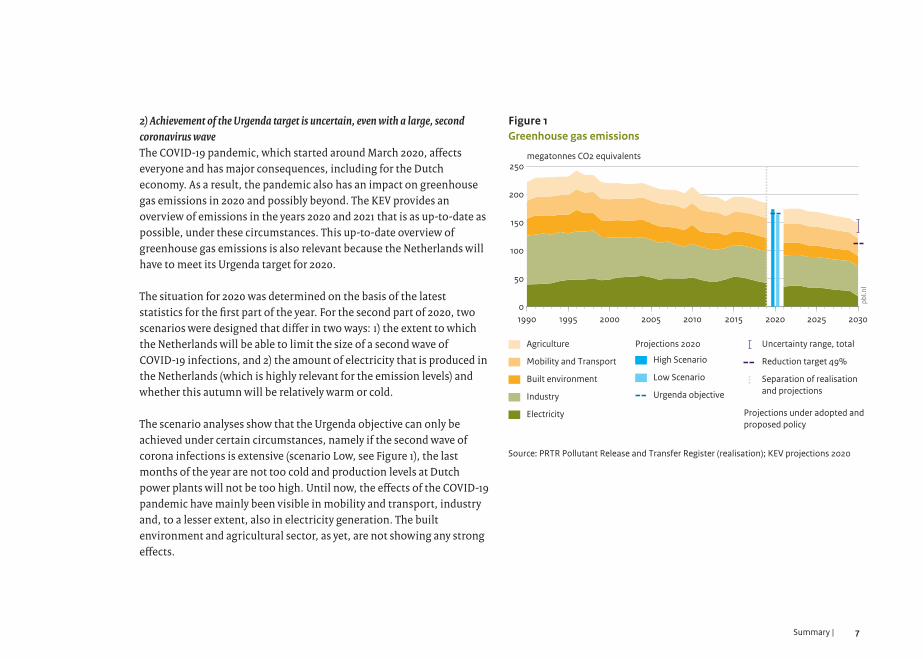
1) The pace of emission reduction needs to double to achieve the 2030 targetThe Dutch Cabinet’s target for 2030 is to reduce greenhouse gas emissions by 49%, compared to 1990 levels. In 2018, greenhouse gas emissions in the Netherlands, excluding those from land use, amounted to 188 Mt CO₂ equivalents. Preliminary figures for 2019 show that emissions decreased to 184 Mt CO₂ equivalents, equalling a reduction of 17%, compared to the base year 1990 (Figure 1). If the 49% target is to be achieved by 2030, this leaves a reduction task of 71 Mt CO₂ equivalents over the 2019–2030 period. The emissions projected for 2030, under adopted and proposed policy, amount to 147 Mt CO₂ equivalents, or 34%, compared to 1990 levels. This is more than 15 percentage points, or 34 Mt CO₂ equivalents, below the reduction target of 49% under the Climate Act.
For the reduction task that remains after 2019, around half is projected to be achieved through the policy measures taken into account in this KEV. There are a number of policy measures that were not concrete enough on 1 May 2020 to enable us to determine their impact. Those particular policies, in combination with policies yet to be added, will have to achieve the other half of the reduction required to bring the target of 49% within reach. In the 2010–2019 period, the average annual emission reduction was approximately 3 Mt CO₂ equivalents. According to this KEV, this same reduction rate will continue during the 2019–2030 period. However, in order to achieve the 49% reduction target by 2030, the annual reduction rate for this period needs to double to approximately 6 Mt CO₂ equivalents.
7Summary |
2) Achievement of the Urgenda target is uncertain, even with a large, second coronavirus waveThe COVID-19 pandemic, which started around March 2020, affects everyone and has major consequences, including for the Dutch economy. As a result, the pandemic also has an impact on greenhouse gas emissions in 2020 and possibly beyond. The KEV provides an overview of emissions in the years 2020 and 2021 that is as up-to-date as possible, under these circumstances. This up-to-date overview of greenhouse gas emissions is also relevant because the Netherlands will have to meet its Urgenda target for 2020.
The situation for 2020 was determined on the basis of the latest statistics for the first part of the year. For the second part of 2020, two scenarios were designed that differ in two ways: 1) the extent to which the Netherlands will be able to limit the size of a second wave of COVID-19 infections, and 2) the amount of electricity that is produced in the Netherlands (which is highly relevant for the emission levels) and whether this autumn will be relatively warm or cold.
The scenario analyses show that the Urgenda objective can only be achieved under certain circumstances, namely if the second wave of corona infections is extensive (scenario Low, see Figure 1), the last months of the year are not too cold and production levels at Dutch power plants will not be too high. Until now, the effects of the COVID-19 pandemic have mainly been visible in mobility and transport, industry and, to a lesser extent, also in electricity generation. The built environment and agricultural sector, as yet, are not showing any strong effects.
Figure 1
1990 1995 2000 2005 2010 2015 2020 2025 20300
50
100
150
200
250megatonnes CO2 equivalents
Source: PRTR Pollutant Release and Transfer Register (realisation); KEV projections 2020
pbl.n
l
Agriculture
Mobility and Transport
Built environment
Industry
Electricity
Projections 2020
High Scenario
Low Scenario
Urgenda objective
Uncertainty range, total
Reduction target 49%
Separation of realisationand projections
Projections under adopted andproposed policy
Greenhouse gas emissions
8 | Netherlands Climate and Energy Outlook 2020
3) Largest emission reductions in the power sector, fewer reductions among the end-use sectorsThe expected development in the power sector shows a strong policy focus on this sector. In 2019, greenhouse gas emissions from this sector were higher than in 1990. For this sector, implementation of the Climate Agreement of 2019, which was initiated in part by the Energy Agreement of 2013, will result in emissions more than halving by 2030. This is mainly due to the strong increase in renewable energy, the low natural gas prices – resulting in the use of more natural gas and less coal – and the cessation of coal-fired electricity generation. However, there are great uncertainties, because the Netherlands is an integral part of the Western European power market; a market that does not care much about national borders. If there are changes in fuel prices or electricity generation in the countries surrounding the Netherlands, this will also lead to changes in the operating hours of the Dutch power plants. Therefore, even with a certain installed capacity, the associated production of electricity is highly uncertain and may vary greatly, from year to year. Emission reductions in the end-use sectors are projected to be lower than in the power sector. By 2030, in industry and the built environment, reductions will be around 40% compared to 1990 levels, in agriculture this will be around 25% and in the mobility and transport sector amount to only a few per cent. In industry, most of the projected reductions have already been achieved in the past. Over two-thirds of the total reductions in greenhouse gas emissions from 2015 onwards will be achieved in the power sector and the remaining third will be realised by all end-use sectors combined.
4) Renewable heating and fuels lag behind and the energy savings rate decreasesIn particular, both the transition from coal to natural gas and the sustainability of electricity generation underlie the reduction in emissions; the sustainability of heat production and motor fuels and energy savings are lagging behind. The total share of renewable energy will increase from 8.7% in 2019 to 25% by 2030; the share of renewable electricity will increase from 18% in 2019 to 75% in 2030. The renewable share of energy used for heating is expected to increase by less, from 7% in 2019 to 13% by 2030. The share of biofuels in the transportation fuel supply is expected to increase even less, from 6% in 2019 to 7% by 2030. The agreements made under the Climate Agreement on the additional use of renewable fuels in transport were not included in these projections, because legislation and regulations in this area are still being worked out. The share of renewable energy in transport, calculated according to the EU Renewable Energy Directive, is much larger, partly because biofuels produced from waste streams are allowed to be counted double under this directive. The improvement in energy efficiency is decreasing, from 1.5% per year in the 2013–2020 period to 1% per year between 2020 and 2030.
5) The Netherlands is increasingly dependent on imported natural gas Less than a decade ago, the Netherlands was a major and reliable exporter of natural gas. It lost this position over a relatively short period of time. Since 2018, the Netherlands has become an importer, on balance, and national production is expected to meet less than a quarter of domestic demand, by as early as 2025. By 2030, the average natural gas consumption of a natural-gas-heated home will be half that of the year 2000. If this long-term trend in natural gas consumption had been less efficient, the shift from being a gas exporting nation to one that imports most of its natural gas would have taken place even more rapidly.
9Summary |
6) The Netherlands’ greenhouse gas footprint is larger than its national greenhouse gas emissionsThis is the first KEV edition to report on the greenhouse gas footprint of the Netherlands. The footprint attributes all consumption-related emissions to the country where the consumption takes place. The Dutch greenhouse gas footprint, therefore, also includes the emissions from companies in other countries that produce energy carriers, materials and products that are subsequently consumed in the Netherlands. And, vice versa, the greenhouse gases emitted in the Netherlands during the production of export products are attributed to the countries where those products are consumed. According to this calculation, the greenhouse gas footprint of the Netherlands is greater than its nationally emitted greenhouse gas levels.
Other observations
Emissions projected for 2030 are higher than reported in the KEV 2019; however, the uncertainty bandwidth should be taken into accountEmissions by 2030 are projected to be more than 2 Mt CO₂ equivalents higher than were calculated in the KEV 2019. Additional emission reductions in the industrial sector and the mobility and transport sector will be more than counterbalanced by a higher level of electricity generation. This is mainly due to changes in predicted energy prices and higher domestic electricity generation levels in the context of the European power market. The uncertain effects on emissions of European power market developments have major consequences, which is why the Dutch Government, in pursuing its objectives, would be well advised to not only aim for the mean value, but to also take the entire bandwidth into account.
Climate Agreement policy needs to take further shapeThis KEV generally shows that many of the agreements under the Climate Agreement still need to be developed further. Although many plans have been formulated, they still need further elaboration before they can be put into practice and their effects can be determined. As these were not included in our current projections, the differences with the KEV 2019 are only limited.
Objectives in and out of reachIn addition to the objectives defined in the Climate Agreement and the Urgenda target, the Dutch Cabinet also has set other climate- and energy-related targets for the years 2020 and 2030. Some of these appear to be within reach, others are not.
Renewable energy: whether the target of 14% renewable energy by 2020 will be achieved remains to be seen. The share of renewable energy in the Netherlands is between 10% and 11.6%, which includes the effect of COVID-19. Although the Netherlands’ agreement with Denmark for a maximum administrative purchase of 58 petajoules of renewable energy is allowed to be included, this may not be sufficient to achieve the target. According to the indicative trajectory in the Integrated National Energy and Climate Plan 2021–2030, the target of 27% in renewable energy by 2030 will not be achieved through the policy package that is included in these projections. The share of renewable energy is projected at 25% by 2030. The projected growth rate for renewable heating is much lower than the indicative target in the Renewable Energy Directive.
10 | Netherlands Climate and Energy Outlook 2020
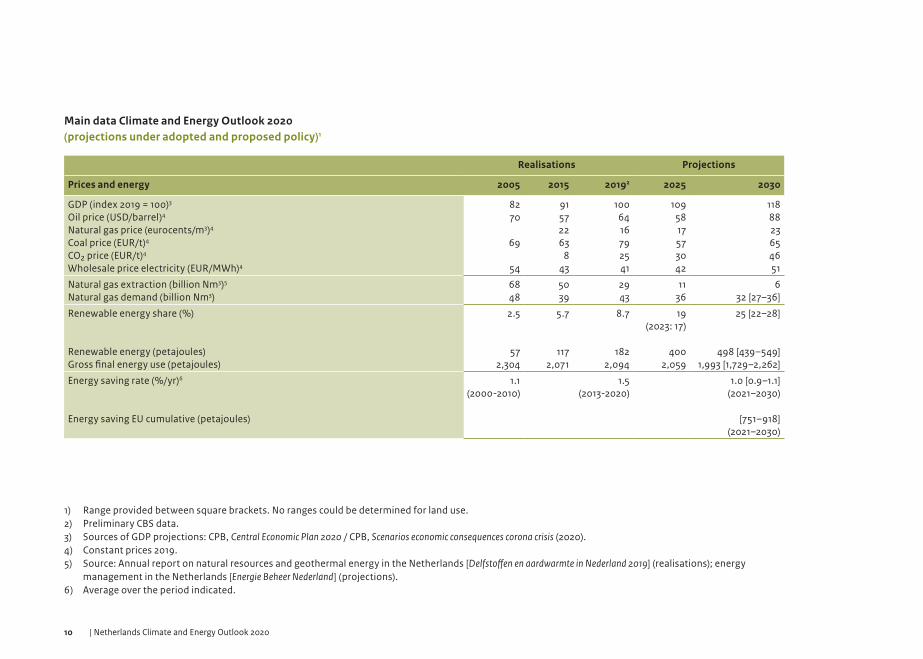
Main data Climate and Energy Outlook 2020 (projections under adopted and proposed policy)1
Realisations Projections
Prices and energy 2005 2015 20192 2025 2030
GDP (index 2019 = 100)3
Oil price (USD/barrel)4
Natural gas price (eurocents/m3)4
Coal price (EUR/t)4
CO₂ price (EUR/t)4
Wholesale price electricity (EUR/MWh)4
8270
69
54
91572263
843
1006416792541
1095817573042
1188823654651
Natural gas extraction (billion Nm3)5
Natural gas demand (billion Nm3)6848
5039
2943
1136
632 [27–36]
Renewable energy share (%)
Renewable energy (petajoules)Gross final energy use (petajoules)
2.5
572,304
5.7
1172,071
8.7
1822,094
19 (2023: 17)
4002,059
25 [22–28]
498 [439–549]1,993 [1,729–2,262]
Energy saving rate (%/yr)6
Energy saving EU cumulative (petajoules)
1.1 (2000-2010)
1.5 (2013-2020)
1.0 [0.9–1.1] (2021–2030)
[751–918] (2021–2030)
1) Range provided between square brackets. No ranges could be determined for land use.2) Preliminary CBS data.3) Sources of GDP projections: CPB, Central Economic Plan 2020 / CPB, Scenarios economic consequences corona crisis (2020).4) Constant prices 2019.5) Source: Annual report on natural resources and geothermal energy in the Netherlands [Delfstoffen en aardwarmte in Nederland 2019] (realisations); energy
management in the Netherlands [Energie Beheer Nederland] (projections).6) Average over the period indicated.
11Summary |
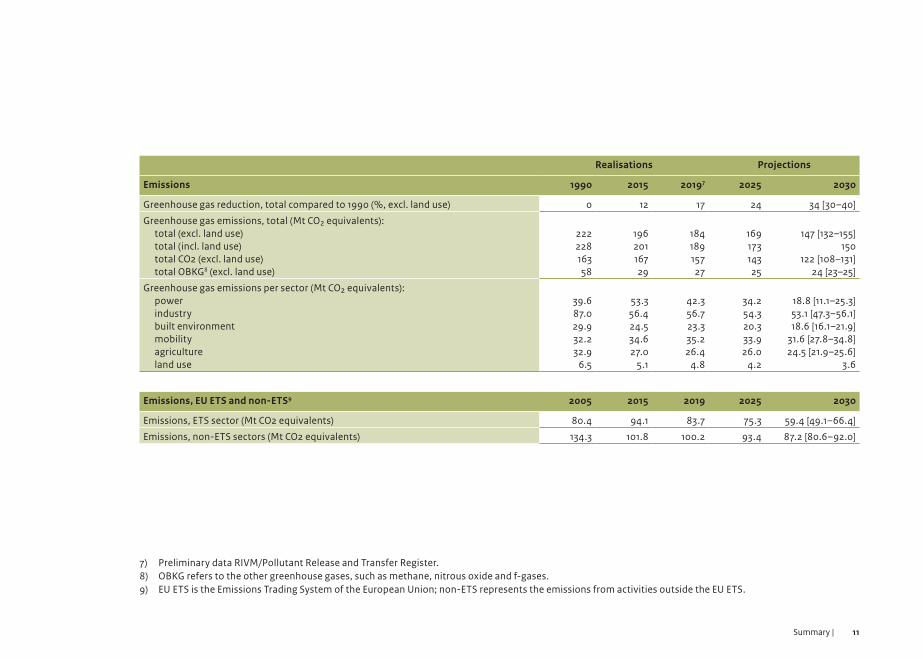
Realisations Projections
Emissions 1990 2015 20197 2025 2030
Greenhouse gas reduction, total compared to 1990 (%, excl. land use) 0 12 17 24 34 [30–40]
Greenhouse gas emissions, total (Mt CO₂ equivalents):total (excl. land use)total (incl. land use)total CO2 (excl. land use)total OBKG8 (excl. land use)
22222816358
19620116729
18418915727
16917314325
147 [132–155]150
122 [108–131]24 [23–25]
Greenhouse gas emissions per sector (Mt CO₂ equivalents):powerindustrybuilt environmentmobilityagricultureland use
39.687.029.932.232.9
6.5
53.356.424.534.627.0
5.1
42.356.723.335.226.4
4.8
34.254.320.333.926.0
4.2
18.8 [11.1–25.3]53.1 [47.3–56.1]18.6 [16.1–21.9]
31.6 [27.8–34.8]24.5 [21.9–25.6]
3.6
Emissions, EU ETS and non-ETS9 2005 2015 2019 2025 2030
Emissions, ETS sector (Mt CO2 equivalents) 80.4 94.1 83.7 75.3 59.4 [49.1–66.4]
Emissions, non-ETS sectors (Mt CO2 equivalents) 134.3 101.8 100.2 93.4 87.2 [80.6–92.0]
7) Preliminary data RIVM/Pollutant Release and Transfer Register.8) OBKG refers to the other greenhouse gases, such as methane, nitrous oxide and f-gases. 9) EU ETS is the Emissions Trading System of the European Union; non-ETS represents the emissions from activities outside the EU ETS.
12 | Netherlands Climate and Energy Outlook 2020
EU Energy Efficiency Directive (EED): Under Article 7 of the EED, the Netherlands is obligated to save energy in end-use sectors. For the 2014–2020 period, this target consisted of a cumulative final energy saving of 482 petajoules. With 593 petajoules over the 2014–2018 period, this target will be more than achieved. For the 2020–2030 period, the target is 924 petajoules. The policy measures included in these projections will be insufficient to achieve this target.
The EU Effort Sharing Decision (ESD) and EU Effort Sharing Regulation (ESR): The ESD sets national emission targets per EU Member State for the 2013–2020 period for sectors not covered by the European Emissions Trading System (EU ETS). The ESR deals with the targets for non-EU ETS sectors for the 2021–2030 period. The maximum in cumulative emissions allowed for the Netherlands, over the 2013–2020 period, is 921 Mt CO₂ equivalents. This target has been more than achieved, with the projected 810 Mt CO₂ equivalents. Between 2013 and 2020, annual emissions from the non-EUETS sectors decreased by more than 12 Mt CO₂ equivalents to 96 Mt CO₂ equivalents. This decrease can mainly be attributed to the built environment (7 Mt) and mobility and transport (over 3 Mt). The EU obligation for non-EU ETS emissions over the 2021–2030 period is projected at a cumulative maximum of 889 Mt CO₂ equivalents. However, the cumulative emissions for this period are projected to be 925 Mt CO₂ equivalents. This means that the EU obligation will be exceeded by approximately 36 Mt CO₂ equivalents. The Netherlands is allowed to offset part of its obligation using credits from Dutch land use over the same period. The credit amount is currently projected at around 10 Mt CO₂ equivalents, but is uncertain.
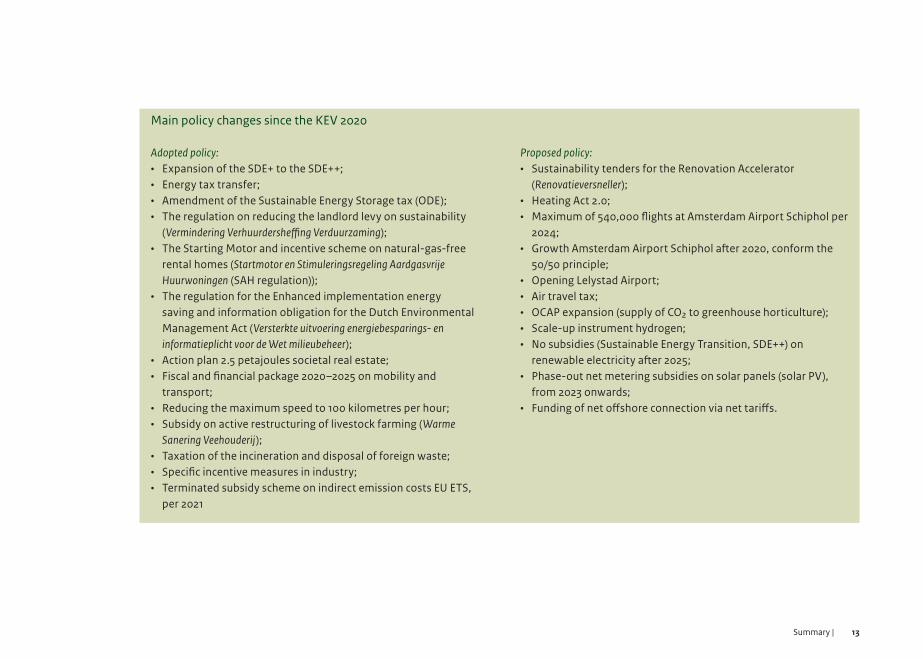
Policy changes compared to 2019PBL distinguishes between adopted and proposed policy changes. Both are included in the projections, but only include the proposed changes insofar those are sufficiently concrete. The text box below provides an overview of the most important changes in the adopted and proposed climate and energy policy since the KEV 2019.
Some of the proposed policy measures have not yet been sufficiently worked out and, therefore, were not included in these projections. The most notable policy measures include the package for natural-gas-free neighbourhoods; a carbon tax in industry; emission-free zones for traffic; the deployment of 27 petajoules in renewable energy in the transport sector; and the limitations on the use of coal in power plants for the coming years.
Starting pointsThe Dutch energy transition is taking place within a dynamic international environment. In calculating the mean values, we assumed a certain scenario for the economy and the price of both energy and CO₂. These are described in the background document to the KEV 2020 that provides an overview of starting points, scenario assumptions and policy (‘Overzicht van uitgangspunten, scenario-aannames en beleid in de KEV 2020’). The document also describes the various policy measures that either have or have not been included in the projections. For the year 2020, the corona pandemic was taken into account. The economy is assumed to be back on the baseline growth path from 2025 onwards. Possible long-term effects (such as people working more from home) are only included in the bandwidth.
13Summary |
Main policy changes since the KEV 2020
Adopted policy:• Expansion of the SDE+ to the SDE++;• Energy tax transfer;• Amendment of the Sustainable Energy Storage tax (ODE);• The regulation on reducing the landlord levy on sustainability
(Vermindering Verhuurdersheffing Verduurzaming);• The Starting Motor and incentive scheme on natural-gas-free
rental homes (Startmotor en Stimuleringsregeling Aardgasvrije Huurwoningen (SAH regulation));
• The regulation for the Enhanced implementation energy saving and information obligation for the Dutch Environmental Management Act (Versterkte uitvoering energiebesparings- en informatieplicht voor de Wet milieubeheer);
• Action plan 2.5 petajoules societal real estate;• Fiscal and financial package 2020–2025 on mobility and
transport;• Reducing the maximum speed to 100 kilometres per hour;• Subsidy on active restructuring of livestock farming (Warme
Sanering Veehouderij);• Taxation of the incineration and disposal of foreign waste;• Specific incentive measures in industry;• Terminated subsidy scheme on indirect emission costs EU ETS,
per 2021
Proposed policy:• Sustainability tenders for the Renovation Accelerator
(Renovatieversneller); • Heating Act 2.0; • Maximum of 540,000 flights at Amsterdam Airport Schiphol per
2024; • Growth Amsterdam Airport Schiphol after 2020, conform the
50/50 principle; • Opening Lelystad Airport; • Air travel tax; • OCAP expansion (supply of CO₂ to greenhouse horticulture); • Scale-up instrument hydrogen; • No subsidies (Sustainable Energy Transition, SDE++) on
renewable electricity after 2025; • Phase-out net metering subsidies on solar panels (solar PV),
from 2023 onwards; • Funding of net offshore connection via net tariffs.
14 | Netherlands Climate and Energy Outlook 2020
Over half of the decrease in energy consumption relates to heatingIn 2019, more than half of the final energy consumption was for heating. Over one quarter was in motor fuel use and almost one quarter in electricity. Final energy consumption decreased relatively strongly, between 2005 and 2015. Energy consumption decreased the most for heating (15%), during this period. The decreasing trend for heating has also translated into a decrease in primary energy consumption since 2005. Primary energy consumption is estimated to decline further, from 3,060 petajoules in 2019 to approximately 2,800 petajoules by 2030. This consists of energy consumption by end users, non-energy consumption (as a resource) in industry and consumption and conversion losses within the energy sector itself. Coal consumption will decline sharply in 2030, because of the mandatory cessation of coal use in electricity generation, from that year onwards. Under the proposed policy, oil consumption is projected to see a slight increase up to 2030. The use of oil products in transport will decrease, while the use of oil as a resource in the chemical industry is expected to increase by about the same amount. There will be a substantial increase in the contribution of renewable sources to the energy mix.
Electricity: phase-out of coal will lead to strong emission reductions by 2030; the renewable energy share will increase to 75%Greenhouse gas emissions from electricity generation have decreased strongly in recent years, from around 53 megatonnes in 2015 to around 42 megatonnes in 2019. In recent years, electricity that is produced by natural-gas-fired power plants has increased. This is due to the fact that modern natural-gas-fired power plants have a favourable market position compared to older coal-fired power plants abroad, mainly as a result of fuel and carbon price developments. Imports declined strongly in 2019 due to the favourable position of Dutch natural-gas-fired power
plants on the north-western European market and the drought in Norway. The amounts of electricity generated from biomass, wind and solar power in the Netherlands increased by 3.5 billion kilowatt hours, mainly due to an increase in the installed capacity for solar power. Emissions in the electricity sector are expected to decrease by between 11 and 25 Mt CO₂ equivalents, by 2030. The amount of electricity that is generated using coal and natural gas is decreasing and renewable electricity generation is increasing. In 2030, particularly, emissions are projected to decrease substantially (by over 9 Mt), due to the proposed ban on coal-fired electricity generation from that year onwards. This will have its impact on the emissions from the last three coal-fired power plants in the Netherlands. The share of renewable electricity will increase from 18% in 2019 to 75% by 2030. The Netherlands will become a net exporter and electricity production will increase.
Industry: without a carbon tax, Climate Agreement policy will have little effect in 2030In recent years, greenhouse gas emissions from industry have decreased from around 75 Mt CO₂ equivalents in 2000 to around 57 Mt in 2019. This was mainly due to the decrease in emissions of other greenhouse gases, from 25 Mt CO₂ equivalents in 2000 to 7 Mt in 2019. Projections do not yet include the announced carbon tax on industry, because the main design parameters are not yet sufficiently clear to determine its effect. As a result, greenhouse gas emissions from industry will continue to decline only slowly, to between 47 and 56 megatonnes by 2030; the projected average is 53 megatonnes, 48 of which in CO₂ and the remaining 5 in other greenhouse gases. The projections in this KEV assume that, without the introduction of a carbon tax, carbon capture and storage (CCS) will not be implemented before 2030.
15Summary |
Economic growth and the additional use of gas boilers will generate additional emissions, but these are counterbalanced by improved energy efficiency and electrification. Renewable energy use will increase, mainly due to the increasing use of biomass, from 7 petajoules in 2019 to 22 petajoules by 2030.
Built environment: less natural gas useThe projections indicate a decrease in total greenhouse gas emissions from the built environment, from around 23 Mt CO₂ equivalents in 2019 to between 16 and 22 Mt (the average being around 19 Mt) by 2030. Emissions from the built environment are produced mainly by households (around 70%). These emissions are projected to decrease from 16 Mt in 2019 to 14 Mt by 2030. These reductions are the result of lower levels of natural gas consumption due to decreasing household sizes, improved housing insulation and milder winters. In addition, the number of natural-gas-free homes is increasing due to the Starter Motor project (a project in which part of the existing social housing stock is converted into natural-gas-free homes) and particularly also because the mandatory connection to natural gas for new housing has been abolished.
CO₂ emissions from the services sector are projected to decline, from around 7 Mt in 2019 to 4.5 Mt by 2030. This decrease in greenhouse gas emissions can be explained by the decrease in natural gas consumption. This has to do with the information obligation and enforcement of the Dutch Environmental Management Act, in combination with a compulsory energy label C for existing office buildings and the ‘nearly energy-neutral buildings’ requirement (Bijna Energieneutrale Gebouwen (BENG)) for new construction developments.
Mobility and Transport: slight decrease in emissions despite increase in transport volumesDespite the expected increase in transport volumes, greenhouse gas emissions from the mobility and transport sector are projected to decrease by about 4 Mt, between 2019 and 2030. Emissions in 2030 are projected at 32 Mt CO₂ equivalents (with a 28–35 range). The decrease is mainly attributed to the increasing number of fuel-efficient petrol and diesel vehicles as a result of EU standards and the strong increase in the number of electric vehicles, partly under the influence of the national policy incentives for electric driving. The number of emission-free vehicles in 2030 is projected at nearly 1 million. The motorway maximum speed limit reduction to 100 kilometres per hour during the day and the planned introduction of a heavy goods vehicle tax also contribute to the projected emission reduction. Because of their insufficiently specific character, the plans for a maximum of 27 petajoules in renewable energy by 2030 and the introduction of emission-free zones for urban logistics were not included in these projections. Greenhouse gas emissions from mobility and transport are projected to be 2% lower by 2030, compared to 1990 levels.
Although the Netherlands does report on the greenhouse gases released from the combustion of fuels sold in the Netherlands to international shipping and aviation, these are not included in the Dutch emissions. Despite the decrease over the past twelve years, greenhouse gas emissions from international aviation and shipping, with 47 Mt CO₂ equivalents in 2019, are still 18% higher than their 1990 levels. These greenhouse gas emissions are projected to increase further to 51 Mt CO₂ equivalents by 2030, mainly due to the growth in international aviation.
16 | Netherlands Climate and Energy Outlook 2020
Agriculture: natural gas price has large impact on emissions from greenhouse horticulture and there are still many other greenhouse gases in arable and livestock farmingIn 2019, total greenhouse gas emissions from agriculture amounted to around 26 Mt CO₂ equivalents; 8 Mt of which are due to energy consumption, mainly in greenhouse horticulture, and 18 Mt are in methane and nitrous oxide emissions from arable and livestock farming. Total greenhouse gas emissions from the agricultural sector are projected to decline by 25% to around 25 (22–26) Mt CO₂ equivalents, between 1990 and 2030, and are mainly due to a decrease in other greenhouse gases.
CO₂ emissions from agriculture are projected to decline by more than 1 Mt, between 2019 and 2030, because of less natural gas use in cogeneration, although natural gas consumption will continue to increase up to 2025. The application of cogeneration will decrease after 2025, due to a lower and more volatile electricity price. As a result, the profitability of cogeneration will go down. Because the application of cogeneration declines after 2025, cheap heating will be less available and investments in energy saving will pay off, once again. As a result, the demand for energy will decrease. Subsidies under the SDE++ scheme (Stimulation of Sustainable Energy Transition) are expected to lead to an increase in the share of geothermal energy, from 5.6 petajoules in 2019 to 15 petajoules by 2030.
Between 2000 and 2019, total emissions of methane and nitrous oxide from livestock and arable farming decreased, from approximately 21 to 18 Mt CO₂ equivalents. This is mainly due to less fertiliser applied to
agricultural land and the associated reduction in nitrous oxide emissions by more than 2 Mt. Emissions of methane and nitrous oxide from agriculture are projected to decrease further, to 17.4 Mt CO₂ equivalents by 2030. This decrease of 0.5 Mt is due to the smaller numbers of young cattle and pigs. The projections assume that, without additional policy, the extent of manure fermentation and the reduction in methane from manure storage will remain limited up to and including 2030.
Between 2000 and 2018, the total supply of nitrogen to soils, through fertilisation and grazing, decreased by 180 million kilograms of nitrogen (from about 800 to 620 million kilograms). Up to 2030, the decrease is expected to be very limited. There was no exceedance of the phosphate and nitrogen cap for livestock manure in 2018 and 2019, which is also assumed to be the case in the projections for 2030.
Land use: net decrease in emissions Land use in the Netherlands results in net emissions. Between 2000 and 2018, land-use emissions decreased from around 6 to around 5 Mt CO₂ equivalents. This decrease results from decreasing emissions from agricultural land use (smaller acreage), less peatland, and an increase in carbon sequestration by forests due to increased acreage. Land-use emissions are projected to decrease further after 2019, to 3.6 Mt CO₂ equivalents by 2030. This is mainly because emissions from grasslands (mainly peat meadows) continue to decrease, while forests absorb more CO₂ (more acreage). Because land-use emissions in the Netherlands are projected to continue to decline after 2020, so-called credits will be created over the 2021–2030, according to EU rules. The Netherlands can
use these credits for part of the projected policy target among non-ETS sectors. The size of these credits is currently expected to be around 10 Mt CO₂ equivalents, although this figure is uncertain. The projections in the KEV 2020 on emissions from land use, land-use change and forestry for 2030 are approximately 2 Mt CO₂ lower than those in the KEV 2019. The differences are mainly due to improvements in the calculation method rather than to the impact of other policies.