Net Zero in New Zealand: Scenarios to ... - Vivid Economics · Net Zero in New Zealand: Scenarios...
99
Transcript of Net Zero in New Zealand: Scenarios to ... - Vivid Economics · Net Zero in New Zealand: Scenarios...

Net Zero in New Zealand: Scenarios to achieve domestic emissions neutrality in the second half of the century
This report has been compiled by Vivid Economics under contract with GLOBE-NZ, a cross-party group of 35 members, drawn from all parties within the 51st New Zealand Parliament. The report’s authors were Alex Kazaglis, John Ward, Stuart Evans, Paul Sammon and Luke Kemp. The project, funded for GLOBE-NZ by a group of donors within New Zealand, covered the period 1 September 2016 to 28 February 2017. The donors, in alphabetical order, were British High Commission, Mercury Energy, Mills Foundation, Morgan Foundation, Sam Morgan, Rob Morrison, NZ European Union Centres Network, Tindall Foundation, US Embassy, Vector NZ Ltd, Victoria Ransom, Warehouse Group and Z Energy. No advance commitment is made by either GLOBE-NZ or the donors to the policy merits of the report. The authors would like to express their deep gratitude to the very many stakeholders who contributed so generously with their time and expertise. Appreciation is also expressed to Pure Advantage, for its active involvement in the guidance of the project through its membership of the Joint Project Committee and to Catherine Leining, who served as an independent advisor to GLOBE-NZ and facilitated expert engagement.
The summary report and supporting technical report can be downloaded from: http://www.vivideconomics.com/publications/net-zero-in-new-zealand.
Net Zero in New Zealand: Scenarios to achieve domestic emissions neutrality in the second half of the century
Contents
1 Introduction ........................................................................................... 1
2 Energy, industry and waste ................................................................ 14
3 Land ...................................................................................................... 42
4 References ............................................................................................. 87

Net Zero in New Zealand: Scenarios to achieve domestic emissions neutrality in the second half of the century

1 Net Zero in New Zealand: Scenarios to achieve domestic emissions neutrality in the second half of the century
1 Introduction This Technical Report sets out the assumptions and rationale that supports the conclusions and recommendations in the Summary Report. The analysis starts with an overall introduction to the scenarios, how they have been defined and our approach to assessing costs. Section 2 then discusses the energy, industry and waste sectors as well as fugitive emissions, while Section 3 discusses agriculture and forestry. 1.1 Scenario analysis
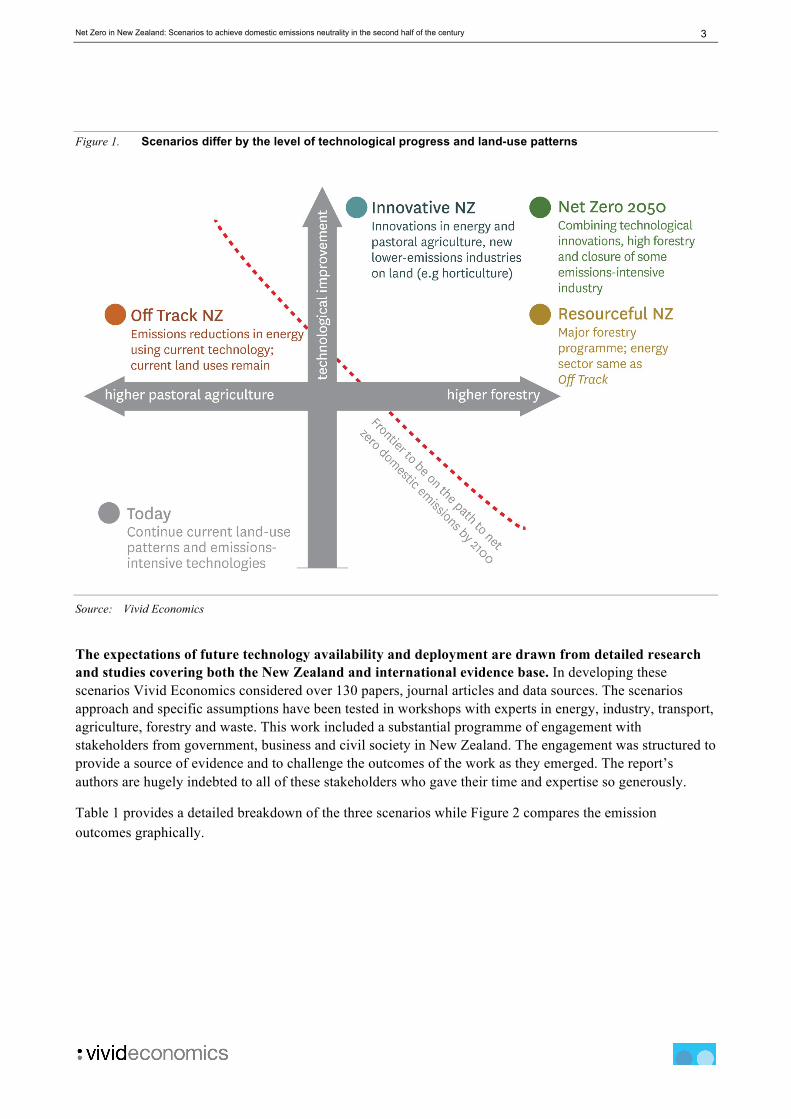
Scenario analysis attempts to increase our understanding of long term, uncertain future pathways in complex systems to support decision making (Bryan et al. 2016). Scenarios are ‘plausible descriptions of how the future may develop based on a coherent and internally consistent set of assumptions about key relationships and driving forces’ (IPCC 2000). The scenarios are designed to have: – Plausibility: the levels of ambition within each scenario should not extend beyond what is imaginable; – Coherence: within scenarios the choice of options should reflect the overall storyline within that scenario; – Distinction: differences between scenarios should reflect the key uncertainties. The analysis develops three scenarios (Figure 1), which differ by technology development and use of the land, leading to differences in 2050 emissions (Figure 2). The first scenario, Off Track New Zealand, is insufficient to put New Zealand on the path to net zero domestic emissions by 2100. Two scenarios – Innovative and Resourceful New Zealand – vary the degree of technological improvement and land uses in a way that generates more rapid emissions reductions. If this rate of reduction can be sustained – a challenge that requires the pursuit of ongoing emissions reductions beyond 2050 – these scenarios put New Zealand on the path to emissions neutrality in the second half of the century. Although the level of emissions reduction is similar between Resourceful and Innovative New Zealand, they demonstrate the possibility to use different strategies to reach this goal, either a smaller agriculture sector and more technology in the case of Innovative or a larger forestry sector in the case of Resourceful. Key characteristics of these scenarios are: – Off Track New Zealand envisages the country exploiting abundant opportunities to pursue emissions
reductions that are either at or near competitive with fossil fuel based alternatives. These opportunities, highlighted in a burgeoning international evidence base on so-called ‘deep decarbonisation’ opportunities, include energy efficiency, further decarbonisation of electricity generation, and electrification of the transport fleet and of low-grade heat. The use of the land is similar to current patterns and agricultural efficiency continues to improve, although at slower rates than have been experienced to date as lower cost opportunities are used up. In Off Track New Zealand, net emissions fall by around 10-25 per cent on current (that is, 2014, the most recent year for which emissions data is available) levels by 2050. This is insufficient to put New Zealand on track to overall net zero domestic emissions in the second half of the

2 Net Zero in New Zealand: Scenarios to achieve domestic emissions neutrality in the second half of the century
century and therefore consistent with the terms of the Paris Agreement1. This is true when considering all GHGs or just focusing on long-lived gases.
– Innovative New Zealand assumes optimistic technological developments beyond those in the Off Track New Zealand scenario. Energy efficiency improves to a greater degree and there are higher rates of electrification in heat and transport. New vaccines in the agriculture sector become available, which further reduce methane (CH4) emissions. Innovative New Zealand also involves the substitution of pastoral agriculture with higher value, lower emissions intensity uses of the land such as horticulture and crops, with a corresponding reduction in animal numbers. Net emissions fall by 70-80 per cent compared to current levels. This puts the country on track to reach net zero domestic emissions by 2100.
– Resourceful New Zealand is identical to Off Track New Zealand in its assumptions about technological improvement. Low-emissions options in the energy sector are deployed to the same extent and the agriculture sector is as efficient. However, a Resourceful New Zealand converts significant amounts of land to forestry, with a corresponding reduction in animal numbers. The reduction in animal numbers is not as large as that experienced in the Innovative New Zealand scenario. Net emissions fall by 65-75 per cent by 2050. This is likely to put New Zealand on track to net zero domestic emissions by 2100.
1 The Paris Agreement, which New Zealand ratified on 4th October 2016, and which came into force on 4th November 2016, commits the world to holding the increase in the global average temperature to well below 2°C above pre-industrial levels and pursuing efforts to limit the temperature increase to 1.5°C above pre-industrial levels. It also commits the world to ‘achieve a balance between anthropogenic emissions by sources and removals by sinks of greenhouse gases in the second half of this century’ – the so-called net zero goal.
3 Net Zero in New Zealand: Scenarios to achieve domestic emissions neutrality in the second half of the century
Figure 1. Scenarios differ by the level of technological progress and land-use patterns
Source: Vivid Economics
The expectations of future technology availability and deployment are drawn from detailed research and studies covering both the New Zealand and international evidence base. In developing these scenarios Vivid Economics considered over 130 papers, journal articles and data sources. The scenarios approach and specific assumptions have been tested in workshops with experts in energy, industry, transport, agriculture, forestry and waste. This work included a substantial programme of engagement with stakeholders from government, business and civil society in New Zealand. The engagement was structured to provide a source of evidence and to challenge the outcomes of the work as they emerged. The report’s authors are hugely indebted to all of these stakeholders who gave their time and expertise so generously.
Table 1 provides a detailed breakdown of the three scenarios while Figure 2 compares the emission outcomes graphically.
4 Net Zero in New Zealand: Scenarios to achieve domestic emissions neutrality in the second half of the century
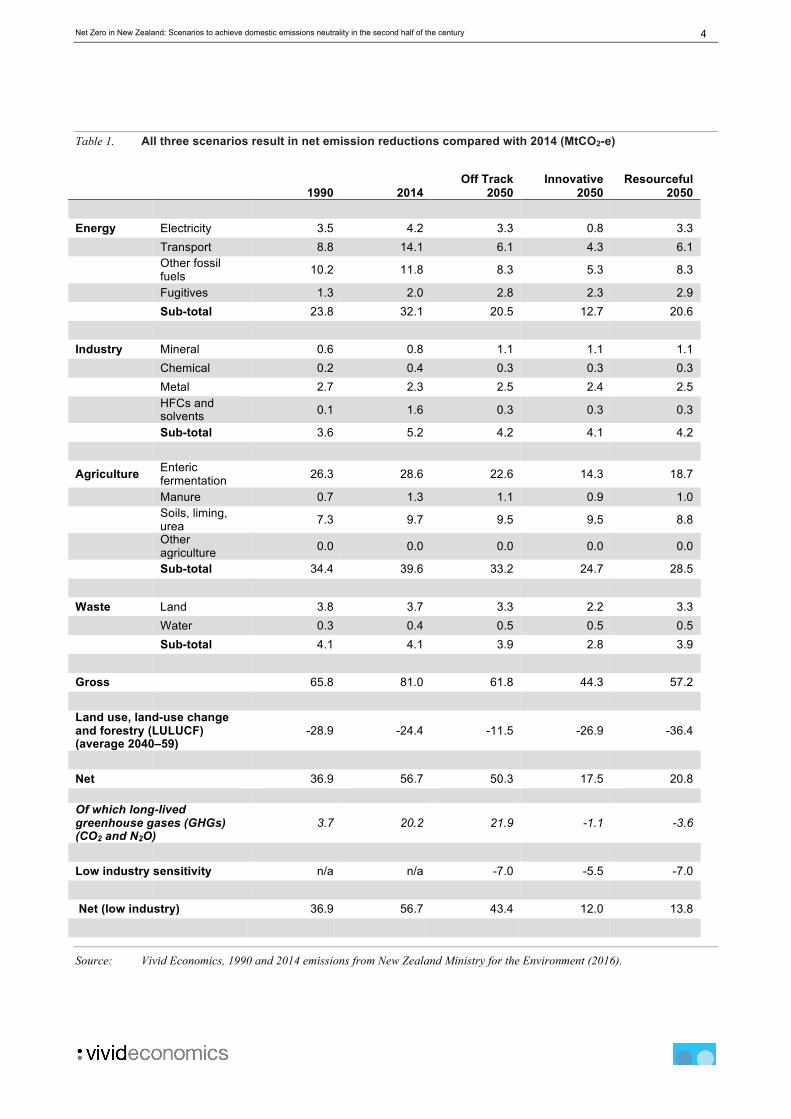
Table 1. All three scenarios result in net emission reductions compared with 2014 (MtCO2-e)
1990
2014 Off Track
2050 Innovative
2050 Resourceful
2050 Energy Electricity 3.5 4.2 3.3 0.8 3.3 Transport 8.8 14.1 6.1 4.3 6.1
Other fossil fuels 10.2 11.8 8.3 5.3 8.3
Fugitives 1.3 2.0 2.8 2.3 2.9 Sub-total 23.8 32.1 20.5 12.7 20.6 Industry Mineral 0.6 0.8 1.1 1.1 1.1 Chemical 0.2 0.4 0.3 0.3 0.3 Metal 2.7 2.3 2.5 2.4 2.5
HFCs and solvents 0.1 1.6 0.3 0.3 0.3
Sub-total 3.6 5.2 4.2 4.1 4.2
Agriculture Enteric fermentation 26.3 28.6 22.6 14.3 18.7
Manure 0.7 1.3 1.1 0.9 1.0
Soils, liming, urea 7.3 9.7 9.5 9.5 8.8
Other agriculture 0.0 0.0 0.0 0.0 0.0
Sub-total 34.4 39.6 33.2 24.7 28.5 Waste Land 3.8 3.7 3.3 2.2 3.3 Water 0.3 0.4 0.5 0.5 0.5 Sub-total 4.1 4.1 3.9 2.8 3.9 Gross 65.8 81.0 61.8 44.3 57.2 Land use, land-use change and forestry (LULUCF) (average 2040–59)
-28.9 -24.4 -11.5 -26.9 -36.4
Net 36.9 56.7 50.3 17.5 20.8 Of which long-lived greenhouse gases (GHGs) (CO2 and N2O)
3.7 20.2 21.9 -1.1 -3.6
Low industry sensitivity n/a n/a -7.0 -5.5 -7.0 Net (low industry) 36.9 56.7 43.4 12.0 13.8
Source: Vivid Economics, 1990 and 2014 emissions from New Zealand Ministry for the Environment (2016).
5 Net Zero in New Zealand: Scenarios to achieve domestic emissions neutrality in the second half of the century
Notes: The low industry emissions sensitivity relates to a situation in which there is closure of oil refineries, aluminium and
steel manufacturing plant. Emissions accounting seeks to mirror that used in the national inventory to the greatest
extent possible, however simplifications have been adopted, particularly regarding emissions from land-use, land-use
change and forestry, given the complexity of accounting for emissions from these sources. Figures reported in this table
for 1990 and 2014 reflect the national inventory. The 2050 projections represent an annual average level of emissions
from 2040-59 because of large variance of in-year estimates. We calculate these using an averaging approach for
calculating forestry sequestration and assume that all land currently forested remains forested and that it has reached
its long-term average carbon stock by2050. We also assume no sequestration from improved forest management of
native or plantation forests planted before 2015. The implication is that we only report net average annual carbon
stock changes in 2050 (2040-59) from new forests planted after 2014.
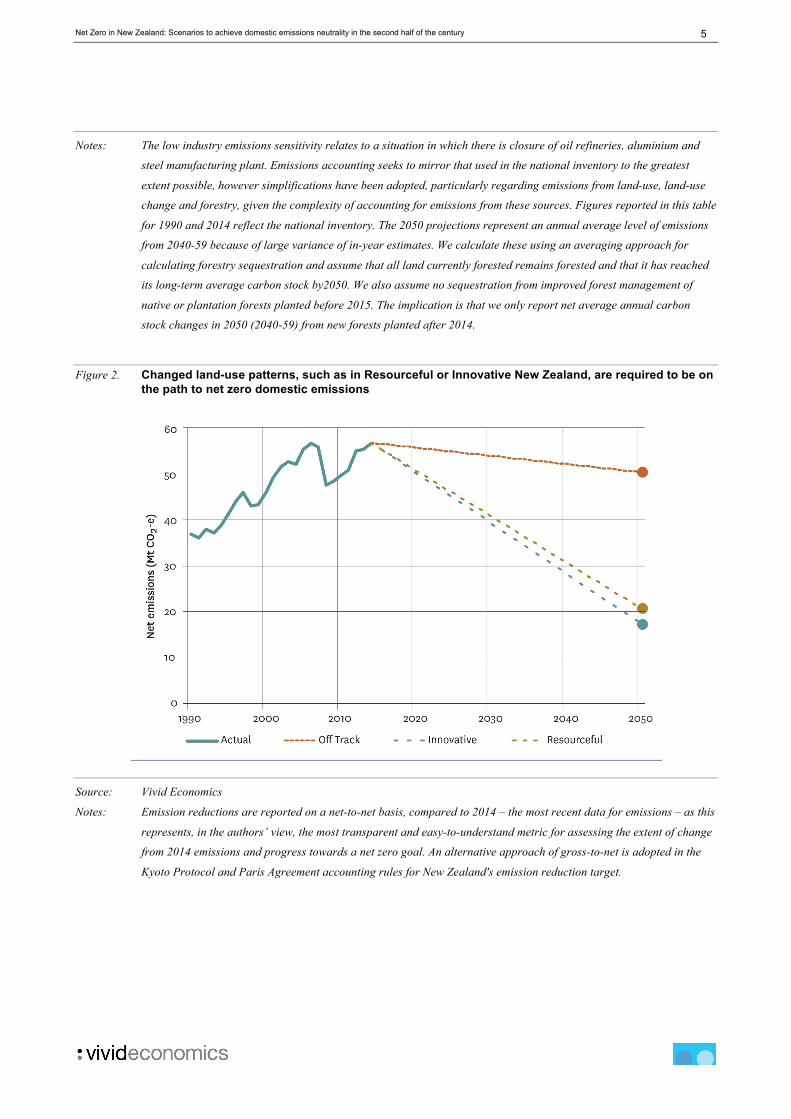
Figure 2. Changed land-use patterns, such as in Resourceful or Innovative New Zealand, are required to be on the path to net zero domestic emissions
Source: Vivid Economics
Notes: Emission reductions are reported on a net-to-net basis, compared to 2014 – the most recent data for emissions – as this
represents, in the authors’ view, the most transparent and easy-to-understand metric for assessing the extent of change
from 2014 emissions and progress towards a net zero goal. An alternative approach of gross-to-net is adopted in the
Kyoto Protocol and Paris Agreement accounting rules for New Zealand's emission reduction target.
6 Net Zero in New Zealand: Scenarios to achieve domestic emissions neutrality in the second half of the century
1.2 Scenario quantification
The scenario analysis takes account of sectoral interactions. This is of particular importance in New Zealand where the land sector (agriculture and forestry) plays an integral role in the economy, and has a major impact on New Zealand’s emissions. Where a high forestry programme is assumed, this competes for land use with pastoral agriculture, and provides opportunities for development of low-emissions wood processing industries, or a potential source of biomass for use in energy production that can decarbonise other sectors of the economy. Another important cross-sectoral interaction is the relationship between the heat and transport sectors and the power sector. A significant proportion of decarbonisation in the former two sectors is driven by electrification, increasing the capacity needed in the power sector. The study uses a scenario calculation tool to generate estimates of future emissions taking account options to reduce emissions across energy, industry, and land use in NZ, and their cross-sectoral interactions. The inputs to this calculator include emissions reduction option deployment (in turn reflecting the level of technological improvement), the availability of key resources such as land and bioenergy, and the size of key sectors (such as agriculture and energy intensive industry). It also enables us to test sensitivities regarding industrial production. The calculator is not a predictive tool nor does it seek to optimise the portfolio of emission reductions for a particular objective. Rather, it assumes that a variety of emission reduction opportunities are exploited, and calculates the impact of these options on emissions, demand for fuels, the size of certain industries and land use patterns. Figure 3 provides an overview of the calculator.

7 Net Zero in New Zealand: Scenarios to achieve domestic emissions neutrality in the second half of the century
Figure 3. The calculator takes account of key cross-sectoral impacts to calculate the emissions in each of the three scenarios
Source: Vivid Economics
This calculator focuses on the emission reduction opportunities that need to be exploited in the different scenarios, not the specific policies required to unlock these opportunities. In each sector, a wide range of different factors will influence the appropriate policy design needed to unlock emission reduction opportunities at different points in time. While such a detailed policy design is beyond the scope of this study, it is possible to identify key policy gaps where further attention is needed. The summary report discusses some of the key policy implications arising from the analysis and the important role that institutions can play in helping to deliver an enabling environment where that policy can be as effective and efficient as possible. The calculator represents each sector individually, enabling a more detailed exploration of sector pathways than some other top-down modelling frameworks. For many top-down modelling frameworks (for example, Computable General Equilibrium – CGE – models) GDP is a core model result. In contrast, the three scenarios each include sector-specific assumptions regarding levels of production. This allows a more detailed exploration of pathways and options for emissions reduction in each sector. A sector-specific approach also allows this exercise to consider emissions reduction opportunities that may not be included in CGE modelling approaches, which largely rely on analysing possible emission reductions from switching between existing technologies. All assumptions are consistent with assumptions of economic and population growth. Population and GDP numbers are broadly consistent with projections under both the low carbon scenarios of MBIE’s (MBIE 2016a) Electricity Demand and Generation Scenarios (EDGS), as well modelling from the Business New
Total emissions
Land Sector Energy, Industry and Waste
Agriculture Forestry
Production assumptions
Production assumptions
Mitigation opportunities and
technological change
Energy Transport Industry
Production energy
requirementsProduction
assumptionsProduction
assumptions
Sequestration rates, yields and
product uses
Production assumptions
Energy mix and generation mix
Technological change and
technology shares
Mitigation opportunities and
production efficiency
Demand, supply and land use scenarios Demand and supply scenarios
Waste
Production assumptions
Diversion and mitigation
opportunities
8 Net Zero in New Zealand: Scenarios to achieve domestic emissions neutrality in the second half of the century
Zealand Energy Council (2015) and assumptions in peer-review literature (Walmsley et al. 2014). Table 2 and Table 3 provide a detailed quantitative depiction of the different scenarios across a wide range of variables, relative to 2014 levels. All scenarios include rebalancing towards higher-value and lower-emissions industries. Innovative and Resourceful New Zealand involve a substitution of meat and milk products for forestry, horticultural and arable production, but to different degrees: an Innovative New Zealand entails more horticulture and arable products and a Resourceful New Zealand has relatively high forestry production. There is uncertainty in emissions outcomes from the potential closure of emissions-intensive industries due to changing economic circumstances. Future prospects of steel, refineries and petroleum in New Zealand are already uncertain, and will continue to be so. The loss of international competitiveness in these areas could be due to a range of factors including shipping costs, low economies of scale and differential emissions prices. We have not included scheduled industry closure as a potential strategy for emissions reduction as it is not necessarily compatible with our assumptions of economic growth. However, the potential for industry closure pervades all scenarios and so we report ranges in emissions outcomes to reflect the potential outcomes (that is, closure of iron and steel, refineries and aluminium facilities forms the lower emissions bound for each scenario).

9 Net Zero in New Zealand: Scenarios to achieve domestic emissions neutrality in the second half of the century
Table 2. Assumptions and outcomes – macro, energy, industry and waste
2014
Off Track 2050
Innovative 2050
Resourceful 2050
Central assumptions GDP (NZ$ billion 2009–10 constant) 211.3 422.4 422.4 422.4 Population (million) 4.5 6.1 6.1 6.1 Energy and transport Emissions intensity (kg CO2-e/GDP) 0.27 0.12 0.04 0.05 Energy intensity (MJ/$GDP) 2.86 1.33 1.25 1.36 Energy delivered (GWh) 164,892 150,259 140,288 153,592
Electricity (total) 39,206 70,926 83,414 71,347 Heat and direct energy 107,866 120,103 116,103 123,436
Electricity 39,148 61,668 72,784 62,089 Direct fuels 68,718 58,434 43,318 61,347
Transport 57,026 30,156 24,185 30,156 Electricity 58 9,258 10,630 9,258
Direct fuels 56,968 20,898 13,555 20,898 Electricity generation (GWh) 42,193 76,330 89,769 76,782
Coal 1,831 736 0 741 Gas 6,567 6,132 1,795 6,168
Hydro 24,076 29,076 29,076 29,076 Geothermal 6,871 17,089 17,954 17,190
Solar 17 1,996 3,591 2,007 Wind 2,192 20,226 36,456 20,518
Biofuels 585 1,007 898 1,013 Other 54 68 0 69 Renewable (% of total) 80% 91% 98% 91% Industrial processes
HFC refrigerants (MtCO2-e) 1.5 0.2 0.2 0.2 Waste
Waste per capita (kg) 735 620 504 620 Additional waste recycled n/a 8% 9% 8%
Emissions per tonne waste from CH4 capture n/a -12% -18% -12%
Source: Vivid Economics
10 Net Zero in New Zealand: Scenarios to achieve domestic emissions neutrality in the second half of the century
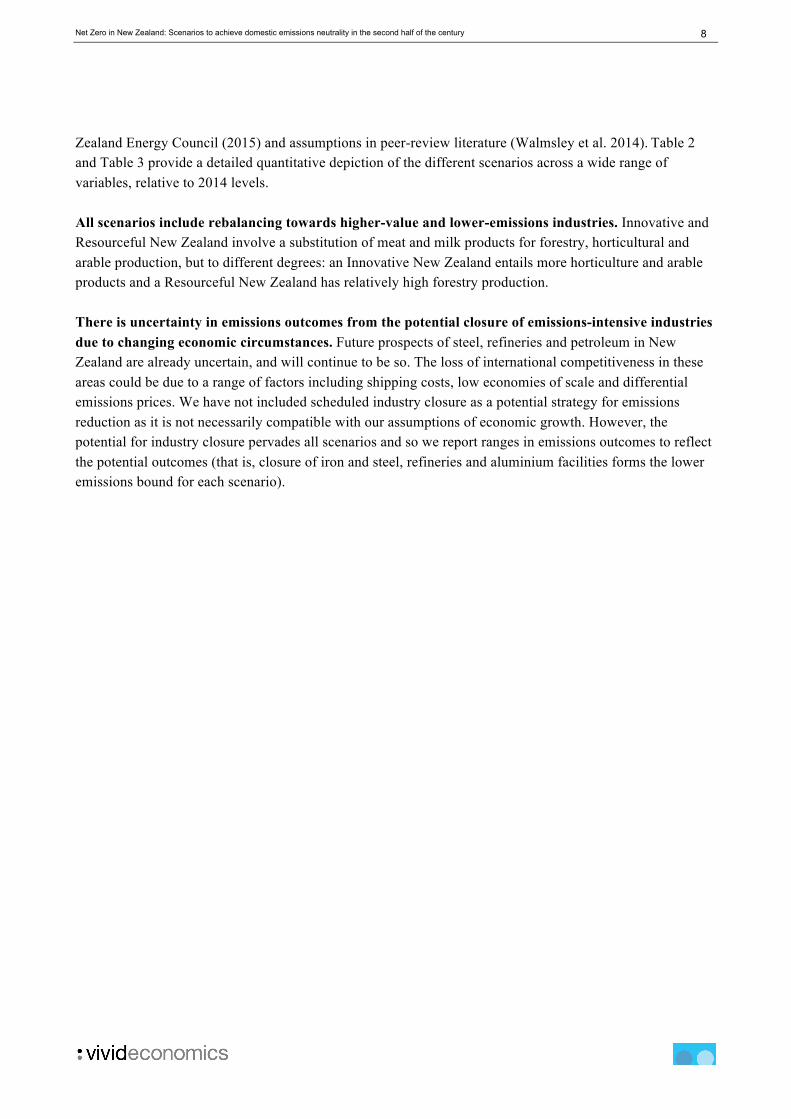
Table 3. Assumptions and outcomes – agriculture and forestry
2014
Off Track 2050
Innovative 2050
Resourceful 2050
Agriculture Livestock numbers (million) Dairy 6.7 6.7 5.4 6.0
Beef 3.7 3.7 2.6 3.0 Sheep 29.8 29.8 19.7 22.5 Productivity (index 2014 = 100) Dairy (milk, litres) 100 115 125 115
Beef (kg) 100 115 115 115 Sheep (kg) 100 115 115 115 Impact on emissions intensity of production from mitigation options (in 2050 for specified GHG)
Vaccine + inhibitor (CH4)
Dairy n/a -16% -30% -16% Beef n/a 0% -18% 0%
Sheep n/a 0% -18% 0% Selective breeding (CH4)
Dairy n/a -15% -15% -15% Beef n/a -15% -15% -15%
Sheep n/a -15% -15% -15% DCD (N2O)
Dairy n/a -8% -8% -8% Accelerated performance and precision agriculture (N2O and CO2)
Dairy n/a -10% -10% -10% Beef n/a -3% -3% -3%
Sheep n/a -3% -3% -3% Low-emissions feeds (CH4 and N2O)
Dairy n/a -7% -7% -7% Beef n/a -1% -1% -1% Forestry Average new planting rates 2015–70 (ha per year)
Exotic species n/a 9,300 27,709 37,936 Natives n/a 0 9,091 18,182 Long run average carbon stock (tCO2/ha) Plantations n/a 372 364 355
Natives (at 50 years) n/a 324 324 324 Sequestration rates on newly forested land (MtCO2-e per year) averaging approach excluding harvested wood products
2040–59 average Plantation forests n/a 4.7 14.1 18.9
Natives n/a 0.0 3.0 6.0 2100 in year
Plantation forests n/a 0.0 0.0 0.0 Natives n/a 0.0 0.3 0.6 Land use (million hectares) Farmland 12.4 11.5 10.6 9.8
Plantation forestry 1.7 2.1 2.9 3.3
Source: Vivid Economics

11 Net Zero in New Zealand: Scenarios to achieve domestic emissions neutrality in the second half of the century
1.3 Strategic cost assessment
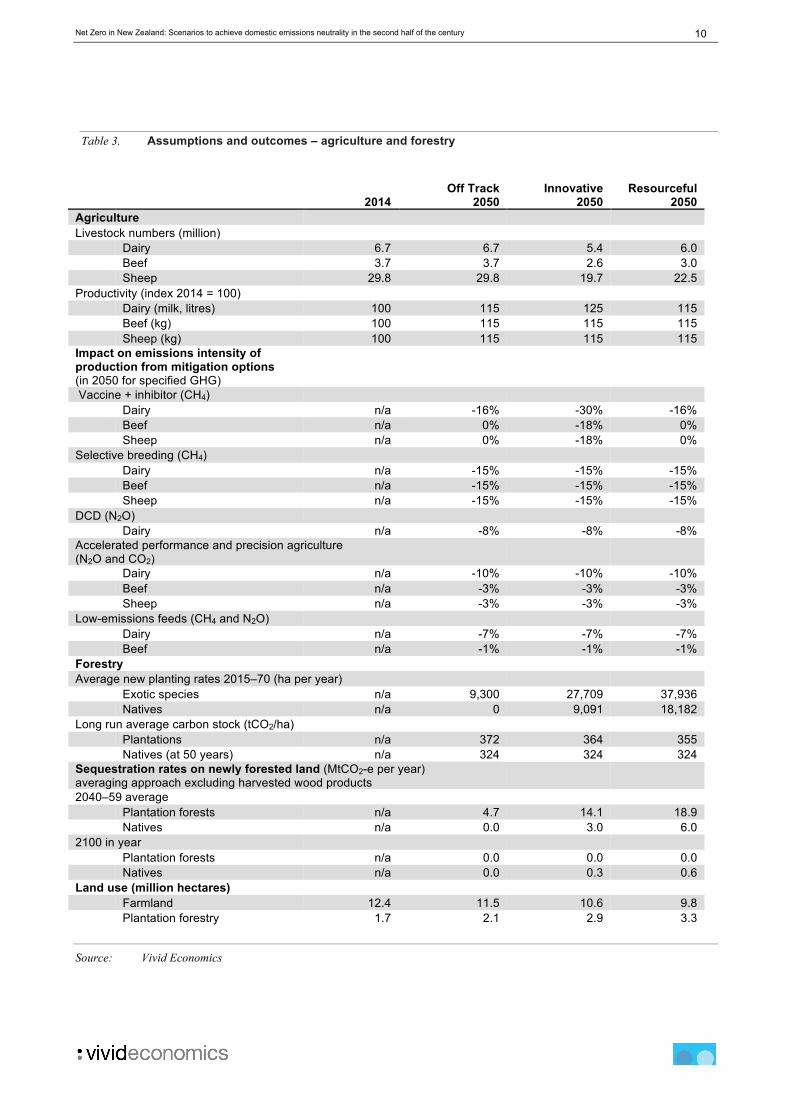
Our cost assessment is informed by estimates that other governments are already using when deciding what constitutes a reasonable cost to bear in avoiding dangerous climate change. Canada, France, Germany, Mexico, Norway and the UK all place a value on the emissions resulting from regulatory and policy decisions and look to proceed with actions where the benefits exceed the costs, including these emission costs. Similar practices are adopted by all of the main international financial institutions as well as by increasing number of private sector companies when making investment decisions (CDP 2015). A range of estimates for such carbon values exist, but the bulk of international estimates suggests that that a reasonable range could be well above NZD$100/tCO2-e in 2050 ($2014) (Figure 4). They are derived in one of two ways. In some cases, they reflect an explicit attempt to quantify the damage that an additional tonne of emissions will cause, with the intention that investments or policies should proceed only when the benefits of an intervention exceed all of its costs, including the costs associated with additional emissions exacerbating climate impacts. On other occasions, they are set with the intention of ensuring that emissions fall on a trajectory that is consistent with either domestic policy targets or the temperature goals of the Paris Agreement. The UK and German approach is based on the cost of meeting carbon targets, whereas US and Canada adopt a social cost of carbon approach. Regardless of approach, the carbon values are used for a similar purpose – to inform the appropriate level of ambition for domestic policymaking. The range of estimates for 2050 include:
― across 17 governments surveyed by the OECD the average price in 2050 is NZ$210-225/tCO2-e (Smith & Braathen 2015);
⎯ The UK and German approach is based on the cost of meeting carbon targets, and is around NZ$500/tCO2-e in 2050;
⎯ The US and Canadian approach is based on a social cost of carbon, of around NZ$100/tCO2-e in 2050, based on a 3 per cent discount rate which both countries argue is appropriate for governmental decision making.
France and Ireland also have carbon values for policy appraisal, but their trajectories do not extend as far as 2050.
12 Net Zero in New Zealand: Scenarios to achieve domestic emissions neutrality in the second half of the century
Figure 4. Emissions values used in policy appraisal in 2050 are above NZ$100 per tonne CO2-e
Note: Exchange rate USD to NZ$ used is 1.38.
Source: Smith and Braathen (2015); Vivid Economics. For some countries, for example the UK, carbon values relate to all
Kyoto gases, for others different values apply for non-CO2 gases (for example the US).
We place abatement opportunities into one of three categories depending on their costs relative to these values. Our analysis has sought to synthesise a wide range of evidence on the costs of reducing emissions in New Zealand. Compiling this evidence is challenging as small differences in calculation assumptions can lead to significantly different results. Rather than present precise point estimates of different abatement opportunities, it is more faithful to the evidence base to present them in one of three different categories:
⎯ Low-cost options are those that are expected to be less than NZD$50/tCO2-e in 2050, and may even be negative. In other words, they may become cheaper than their emissions-intensive competitors. For example, many expect that electric cars will become cheaper than cars with an internal combustion engine (ICEs) during the 2020s or 30s (IEA 2016; Concept Consultancy 2016c). Other low-cost options include energy efficiency, reducing peak electricity loads, forestry and some efficiency improvements for the least efficient farms. In agriculture, precision farming and de-intensification of dairy production could be low-cost options given they may result in lower input costs per unit of production. Methane inhibitors and vaccines may also be low cost if there is no production penalty;
⎯ Medium cost options are in the range of NZD$50/tCO2-e to NZD$100/tCO2-e in 2050, and hence are likely to be cost-effective relative to the 2050 policy values identified above. This includes electric heating of medium-grade heat options as well as the roll out of electric vehicles to reduce emissions from freight. In agriculture, opportunities to change feeds for instance to new types of rye grass is an example of a medium cost option;
13 Net Zero in New Zealand: Scenarios to achieve domestic emissions neutrality in the second half of the century
⎯ High cost options are above NZD$100/tCO2-e in 2050 and are likely to remain higher than the policy values identified above, without significant technological development. High cost options could include the electrification of high temperature heat, and reduction of emissions from industrial processes and fugitives.
The relative costs of energy abatement heavily depend on the price of fossil fuels. For example, an oil price rise to USD$90-100/bll could make medium- and high-cost transport options competitive without a decrease in their price or a rise in emissions prices. However, the price of fossil fuels is difficult to predict, particularly over the longer term. When conducting this assessment, the technology cost estimates were supplemented by a qualitative assessment of both co-benefits and co-costs. Most estimates of low-emission alternatives assess the capital and operating costs relative to the high emissions comparator. However, this assessment needs to be extended in two ways:
⎯ Co-benefits. Many emission reduction opportunities are valuable for reasons other than for helping to reduce the risk of climate change. For example, in New Zealand, emission reductions might also lead to improved health outcomes, reduced water pollution, and an enriched landscape. The co-benefits of specific actions are explored further below. In some cases, it is possible that for some measures, there could be an economic net benefit just due to the co-benefits alone;
⎯ Co-costs, barriers and negative externalities. Equally, on some occasions, there are barriers or negative implications from the transition to a low-emissions future that are not captured in an assessment of comparative technology costs. For instance, pursuing emission reduction opportunities might lead to changing patterns and location of employment opportunities. This could lead to an increased risk of structural unemployment and social dislocation. On some occasions, additional measures may be required to minimise or transfer these costs, such as compensation for those on low incomes or vulnerable industries, skills training and vocational programmes to prepare for new areas of employment.
Ideally, in both cases, the additional evidence would also be quantified. However, in many cases the current evidence base in New Zealand only allows a qualitative assessment. Further research is required to assess the extent and nature of co-benefits.
14 Net Zero in New Zealand: Scenarios to achieve domestic emissions neutrality in the second half of the century
2 Energy, industry and waste The energy, industry and waste sectors undergo a substantial transformation in all three scenarios. There are ongoing improvements in energy efficiency, an expanded power system through further investment in renewable electricity generation, and increased electrification of transport and heating. The scenarios assume an overall strategic approach for the energy sector of, first, improving energy efficiency and demand management; followed by reducing the carbon intensity of generation; and then extending low GHG emissions generation to new markets, particularly displacing high-carbon fuels in transport and heat. Some measures will allow for different aspects to be addressed simultaneously. For instance, electric cars both improve efficiency and provide low-emissions fuel substitution. This is facilitated by technologies that are at or near to competitive with incumbents, and that have large scope for roll-out. In addition to decarbonisation through electrification, all scenarios involve using bioenergy in sectors located close to feedstock sources – for example, paper and pulp and wood processing – as well as a significant contribution to process heat needs in agricultural processing. Alternative energy decarbonisation strategies based on different low-carbon energy vectors, such as hydrogen, are unlikely to be able to reduce emissions to such a large degree as it seems challenging to produce large quantities of hydrogen competitively. Current (2014) GHG emissions from the energy sector are around 32 MtCO2-e, of which 18 MtCO2-e are from the combustion of fossil fuels to produce electricity and heat, and 14 MtCO2-e are from transport. Industrial processes and waste contribute a further 5 and 4 MtCO2-e respectively. Projected future emissions are uncertain and depend on domestic factors such as economic growth, population and industrial structure, as well as international factors such as technological development, the demand for New Zealand export as well as the pace of international progress in reducing emissions. Rather than vary all of these factors, the energy analysis focuses on flexing the pace and scale of technology development and deployment. Under the Innovative scenario, New Zealand further reduces the emissions intensity of its economic activity through technological advances such as cost reductions in electric vehicles for freight, electric heating technologies for high-temperature applications. In the Off Track and Resourceful scenarios, barriers to these new technologies are higher. The potential for industry closure is a pervasive uncertainty across all scenarios. Energy-intensive industry faces a challenging future in New Zealand due to increasing globalisation and production shifting to areas of the globe with lower capital and labour costs. A key potential example of this is the future of the Tiwai Point aluminium smelter. The demand for industrial products might also vary as a result of decarbonisation – for example, there may be lower demand for refined fuels as transport shifts to electricity. There could also be opportunities to add value to industrial products through lower levels of embodied carbon. The production levels (and the associated emissions) of iron and steel, aluminium and petroleum refining vary between scenarios to reflect this uncertainty. We reflect this uncertainty by reporting a range in emissions estimates for each scenario (that is, the bottom end of the range reflects a world in which there are closures in iron and steel, refineries and aluminium).

15 Net Zero in New Zealand: Scenarios to achieve domestic emissions neutrality in the second half of the century
A summary of the headline emissions results for the energy, industry and waste sectors shows substantial reductions in all scenarios for the energy and transport sectors: − In the Off Track New Zealand and Resourceful scenarios, emissions from the heat, power and transport
sectors fall by 12 MtCO2-e to 21 MtCO2-e. In the Innovative New Zealand scenario, greater efficiency and electrification see emissions from heat, power and transport fall by a further 8 MtCO2-e to 13 MtCO2-e.
− Lower use of potent GHGs for refrigeration and other HFC uses is the main source of emissions reductions from industrial processes. Total emissions from industrial processes fall by 1 to 4.2 MtCO2-e.
− Emissions from waste fall marginally in the Off Track and Resourceful New Zealand scenarios, from 4.1 MtCO2-e to 3.9 MtCO2-e, and to 2.8 MtCO2-e in the Innovative New Zealand scenario.
− The future composition of New Zealand’s industrial sector is uncertain in a low-emission world. A low industrial production sensitivity suggests that emissions from energy, heat and transport would be up to 4.3 MtCO2-e lower in the Off Track and Resourceful New Zealand scenarios, and 2.9 MtCO2-e lower in the Innovative New Zealand scenario. Industrial process emissions could be 2.7 MtCO2-e lower in this sensitivity.
The remainder of this section sets out the assumptions that underpin how these emissions reductions are achieved. This section is subdivided to reflect the key emissions categories across energy, industry and waste: − electricity; − heat; − transport; − fugitives; − industrial processes; and − waste. The section concludes with a research agenda.
16 Net Zero in New Zealand: Scenarios to achieve domestic emissions neutrality in the second half of the century
2.1 Electricity
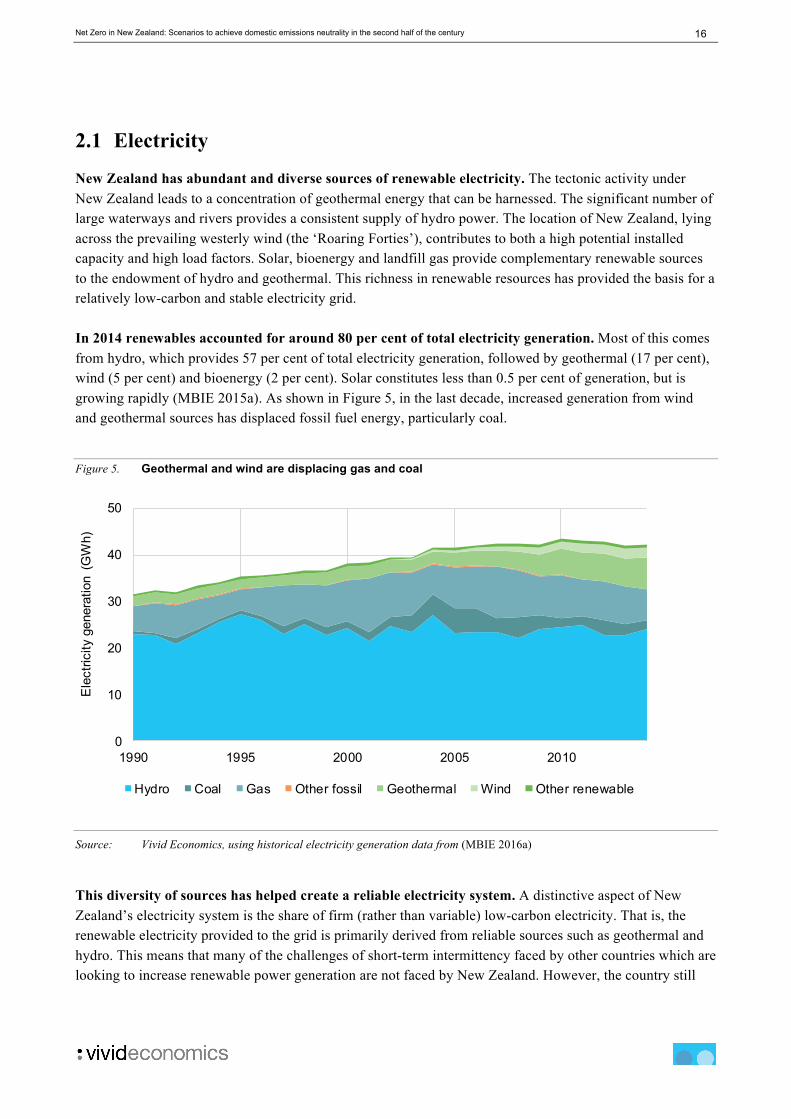
New Zealand has abundant and diverse sources of renewable electricity. The tectonic activity under New Zealand leads to a concentration of geothermal energy that can be harnessed. The significant number of large waterways and rivers provides a consistent supply of hydro power. The location of New Zealand, lying across the prevailing westerly wind (the ‘Roaring Forties’), contributes to both a high potential installed capacity and high load factors. Solar, bioenergy and landfill gas provide complementary renewable sources to the endowment of hydro and geothermal. This richness in renewable resources has provided the basis for a relatively low-carbon and stable electricity grid. In 2014 renewables accounted for around 80 per cent of total electricity generation. Most of this comes from hydro, which provides 57 per cent of total electricity generation, followed by geothermal (17 per cent), wind (5 per cent) and bioenergy (2 per cent). Solar constitutes less than 0.5 per cent of generation, but is growing rapidly (MBIE 2015a). As shown in Figure 5, in the last decade, increased generation from wind and geothermal sources has displaced fossil fuel energy, particularly coal.
Figure 5. Geothermal and wind are displacing gas and coal
Source: Vivid Economics, using historical electricity generation data from (MBIE 2016a)
This diversity of sources has helped create a reliable electricity system. A distinctive aspect of New Zealand’s electricity system is the share of firm (rather than variable) low-carbon electricity. That is, the renewable electricity provided to the grid is primarily derived from reliable sources such as geothermal and hydro. This means that many of the challenges of short-term intermittency faced by other countries which are looking to increase renewable power generation are not faced by New Zealand. However, the country still
0
10
20
30
40
50
1990 1995 2000 2005 2010
Ele
ctric
ity g
ener
atio
n (G
Wh)
Hydro Coal Gas Other fossil Geothermal Wind Other renewable

17 Net Zero in New Zealand: Scenarios to achieve domestic emissions neutrality in the second half of the century
faces challenges during dry periods given its reliance on hydro. Hydro storage capacity is limited to about two months – a cause for concern during years of drought (Walmsley et al. 2014). Fossil fuels also play a role in providing electricity in New Zealand, supplying around 19 per cent of generation and ensuring continued generation during dry periods. Fossil fuel generation is split between gas (15 per cent) and coal (4 per cent). Currently, essentially all fossil fuel generating facilities (1.5 GW gas and 0.5 GW coal) are located in the North Island. The largest fossil fuel generation stations are the Huntley units (coal/gas, gas and gas/diesel units) which have a total capacity of 0.9 GW (MBIE 2015a). Smaller gas/coal units at Ahuroa have access to underground storage, increasing their flexibility. Despite the contributions of gas and coal, the overall emissions intensity of New Zealand’s electricity system is low and falling. Both coal and gas generation have been decreasing over the past decade at an annual average of 4.1 and 2.3 per cent respectively (MBIE 2015a). Older inefficient fossil fuel plants are slowly being pushed out of the market by cheaper and cleaner sources such as geothermal and wind. In 2015, two major gas plants (Southdown and Otahuhu B) were closed, and Genesis Energy has indicated that it soon intends to shut the Huntley Rankine coal gas station (MBIE 2015b). At the same time, some industry players have announced intentions to invest in further fossil fuel generation. This includes a 360 MW gas-turbine generator in Waikato (Frykberg 2016). The level of demand placed on the grid is sensitive to industrial activity. The industrial sector is the largest consumer of electricity in New Zealand, consuming 14.5 TWh (37 per cent) in 2014. In 2014 the Tiwai Point Aluminium Smelter accounted for 13 per cent of national electricity consumption (MBIE 2016a). Much renewable resource remains untapped. The New Zealand Energy Scenarios (BusinessNZ Energy Council 2015) and MBIE Electricity Demand and Generations Scenarios (EDGS) (MBIE 2016a) include scenarios up to a total of 10–14 GW of renewable capacity (up from 7 GW in 2014) and 45–59 TWh (up from 34 TWh in 2014) of renewable generation. Technical studies suggest the potential for still further expansion, particularly in wind, which we address further in section 2.1.2.
2.1.1 Demand assumptions
The scenarios assume a 46 per cent baseline growth in electricity consumption between 2014 and 2050 (inclusive of energy efficiency), leading to generation of 62 TWh in 2050. This is in line with the Government’s Mixed Renewables Scenarios, as part of the EDGS (MBIE 2016a). This assumed an annual electricity demand growth of 1.1 per cent, reflecting moderate GDP and population growth. The EDGS assumed that energy efficiency improvements continue as prices increase at historical trends, as is also assumed in this assessment. Additional electrical energy efficiency is assumed in the Innovative scenario of 0.1 per cent per annum, reflecting a combination of slightly faster uptake of efficient lights, appliances, motors in industry, electric heating and electric vehicles.

18 Net Zero in New Zealand: Scenarios to achieve domestic emissions neutrality in the second half of the century
The more ambitious roll-out of electric vehicles and electrification, particularly of heat, in all three of our scenarios results in a further 15–30 TWh2 of electricity generation in 2050. Electrification of energy use, in particular low-grade heat, results in a further 5–19 TWh of generation in 2050. Electrification of transport results in a further 10–11 TWh of generation. This results in generation of 90 TWh in the Innovative New Zealand scenario, 76 TWh in the Off Track New Zealand scenario, and 77 TWh in the Resourceful New Zealand scenario (the slight difference between Off Track and Resourceful is due to different assumptions in the energy needed to process different agricultural and forestry product outputs). A breakdown of energy generation in 2050 across the different dimensions (growth and efficiency, electrification of transport and electrification of heat) is provided in Figure 6 and Figure 7. There are exceptions to the above rates of electricity demand growth in the industrial sector to reflect industry-specific dynamics: − In the case of dairy and dairy processing, pulp and paper and wood processing sectors, energy demand is
determined in conjunction with assumptions about the size of the dairy and forestry sectors as described in Section 3.
− For the petroleum and chemicals, primary metals, aluminium manufacturing and iron and steel manufacturing sectors electricity demand is assumed to grow at the rate of non-electricity energy in the MBIE Mixed Renewables scenarios – about 4 per cent from 2014 to 2050. This is because industry energy use is predominantly non-electricity, and so the growth of these sectors is likely to be closer to the rate of growth of non-electricity energy.
We have also included a sensitivity analysis for industrial closure. In this sensitivity, we assume closure of iron and steel, refineries and aluminium, as these are emissions-intensive. The analysis suggests that if the key energy-intensive industries close, electricity demand would be around 10–15 TWh lower across all scenarios. Closure would result in a maximum overall electricity generation of 75 TWh in the Innovative New Zealand scenario, 67 TWh in the Resourceful New Zealand scenario, and 66 TWh in the Off Track New Zealand scenario.
2 The lower estimates in this section are representative of the Resourceful New Zealand and Off Track New Zealand scenarios, while the higher estimate is for the Innovative New Zealand scenario.

19 Net Zero in New Zealand: Scenarios to achieve domestic emissions neutrality in the second half of the century
Figure 6. In Off Track and Resourceful New Zealand electricity generation grows through to 2050 due to increasing population and economic growth, as well as electrification of heat and transport
Source: Vivid Economics
Notes: There is a slight difference in electricity generation between Off Track and Resourceful scenarios due to different
assumptions about the energy requirements associated with different agriculture and forestry assumptions, detailed in
section 3.
Figure 7. In Innovative New Zealand electricity generation grows higher than in the other scenarios due to a greater degree of electrified heat and penetration of electric vehicles
Source: Vivid Economics
0102030405060708090
10020
14
Bas
elin
e
Hea
t and
oth
er
Tran
spor
t
Indu
stry
clo
sure
2050E
lect
ricity
gen
erat
ion
(TW
h)
0102030405060708090
100
2014
Bas
elin
e
Hea
t and
oth
er
Tran
spor
t
Indu
stry
clo
sure
2050Ele
ctric
ity g
ener
atio
n (T
Wh)

20 Net Zero in New Zealand: Scenarios to achieve domestic emissions neutrality in the second half of the century
2.1.2 Mitigation and technology assumptions
There is significant expansion in renewables in all scenarios. By 2050, the generation mix by 2050 is 91 per cent renewable under the Off Track and Resourceful New Zealand scenarios – broadly consistent with EDGS scenarios – or 98 per cent in the Innovative New Zealand scenario, reflecting more ambitious assumptions about the ability of demand-side response and batteries to balance variable renewables. The major renewable sources that expand are wind, geothermal and hydro, while the contributions of solar, biomass and ocean generation are constrained by geographical factors and cost: − Wind: There is the potential for much more wind to be constructed at low cost in New Zealand.
Availability of land and windy sites makes this technology an ideal candidate for significant further expansion. A wind resource study commissioned by the New Zealand Electricity Commission estimated that 14 GW of wind power is economically viable (at $75–90 per MWh) (Wagner 2008). A further 27 GW will become economical with a rise in the value of electricity ($90–125 per MWh). These technical potentials have been realised to different degrees internationally. In the UK – with a similar land area to New Zealand – there is an existing industry of 12 GW of onshore wind and an estimated economic potential of between 20–30 GW (NDRC 2016).
− Hydro: Further potential is constrained as most major opportunities have already been taken, and there is public interest in preserving waterways, including for environmental and recreational uses. There is, however, potential for further smaller-scale projects, amounting to between 0.5–1 GW in total.
− Geothermal: It is estimated by MBIE (2016a) that there is scope for at least 1 GW of additional geothermal capacity.
− Solar: Current solar PV uptake in New Zealand is low (43.25 MW in 2016), and there is significant room for growth (ITP 2016). Increased adoption of rooftop PV to 60 per cent of households would see generation from solar PV rise to 1.5 GW (Concept Consultancy 2016c), although the full potential is likely to be much higher than this. The falling cost of solar and distributed scale batteries could unlock further roll-out of this technology.
− Bioenergy: The use of New Zealand forestry resources in energy production is a potential route to emissions reduction. In our analysis, however, biomass is primarily used to reduce energy emissions in sectors where the feedstock is close to the source of demand, due to lower cost. This is particularly relevant for generating low-GHG medium-level industrial heat in the wood-processing and pulp and paper sectors, and displacing GHG-intensive coal in the processing of milk and other agricultural products.
− Ocean energy (wave and tidal): Tidal current power has significant potential for New Zealand in the longer term, but it is not likely to be a significant source of generation by 2050 given high costs (Sims et al. 2016).
Despite the high penetration of renewables, the grid maintains stability and reliability through a mix of technologies. Gas (2 per cent penetration in the Innovative and 8 per cent in Resourceful and Off Track), alongside pumped hydro and geothermal all help to maintain grid stability by providing spillage control and peak demand cover. A similar mix has been modelled on a half-hourly basis during a historically dry period and shown to effectively provide consistent supply (Mason et al. 2013). Studies have also shown the plausibility of very high penetrations even without batteries or smart grid technologies (Mason et al. 2013; Walmsley et al. 2014). Demand Side Response (DSR) of around 10-20 per cent of peak demand could be

21 Net Zero in New Zealand: Scenarios to achieve domestic emissions neutrality in the second half of the century
feasible based on international assessments. DSR in the US is currently around 5 per cent, but could increase to nearly 20 per cent (Siddiqui 2009). The IEA (2011) have estimated demand response potential in European and North American markets at 15-20 per cent of peak demand. Restructuring of the regulatory arrangements of the electricity market may be necessary to encourage investment and allow efficient operation. New Zealand’s market should allow the full participation of renewables in ancillary services markets as well as the energy market, and creating markets that clear close to real-time (IEA 2017a). Allowing customers to participate in wholesale markets may also be necessary to incentivise distributed generation and DSR. This may require implementation of smart metering, and new businesses models that can trade electricity on behalf of consumers. The low-emissions scenarios in this report do not include carbon capture and storage (CCS, or CCUS – carbon capture utilisation and storage) as a low-emissions option to 2050. There are constraints on the likely availability of CCS in New Zealand given the need to find suitable storage sites (Section Box 1). However, the use of CCUS in combination with bioenergy could be a suitable option for the post-2050 period to continue to reduce emissions when land constraints may begin to make further forestry planting challenging.
2.1.3 Costs and co-benefits
The future renewable grid under all scenarios should generate low- or medium-cost electricity. Currently, geothermal and wind are the lowest-cost sources of new generation (MBIE 2016d). New geothermal generation can be constructed for 9c/kWh (real $2011) (MBIE 2016d). The cost of other renewables systems are below this and likely to continue to fall over the coming decades: Bloomberg New Energy Finance forecasts that wind will be around 40 per cent cheaper and solar PV 60 per cent cheaper by 2040 (Bloomberg New Energy Finance 2016). Similarly, the IEA (2016b) estimates that solar prices will drop by 40–70 per cent by 2050, and onshore wind by 10–25 per cent. This will contribute to keeping an expanded renewable energy grid at low cost. There may be additional costs associated with ensuring grid stability, although many of the options here will also be low cost. The studies referenced above discussing the technical feasibility of grid stability with a larger proportion of renewable output do not provide associated cost estimates. However, demand management, geothermal and gas are all low-cost options for providing grid stability. Pumped hydro would require an emissions price of approximately NZ$100/tCO2-e to be more competitive and is thus a medium- to high-cost option (Kear & Chapman 2013). In the longer term as higher-cost measures such as storage will likely be required, although these could eventually reduce in cost, particularly given the falling cost of battery technology (Nykvist & Nilsson 2015). There is limited evidence on the co-benefits of reducing emissions from electricity in New Zealand, but they are likely to be small. International studies place a strong emphasis on increased energy security and health benefits from lower air pollution with decreased fossil fuel combustion (IPCC 2014b; West et al. 2013). However, imported oil is a negligible part of electricity generation, while health benefits are also
22 Net Zero in New Zealand: Scenarios to achieve domestic emissions neutrality in the second half of the century
likely to be low due to the already high penetration of renewable electricity on the grid, and the low urban density of New Zealand. There may be scope for the development of new industries. Reducing emissions can catalyse the emergence of new technologies and industries (Dechezlepretre & Sato 2014). New Zealand has a comparative advantage in its endowment of firm, renewable energy sources. In a low-emissions world, this could provide New Zealand with a competitive cost advantage in producing energy-intensive goods and services, including future (digital economy) products such as digital databases and servers. There is also the opportunity to add value to consumer products such as food by moving to less energy-intensive, higher-value-add products, and lowering embodied emissions through clean electricity-based production. Another potential area for innovation is distributed generation. Currently, distributed generation technologies are primarily being pioneered in the US, Japan and EU, with less activity in New Zealand (MBIE 2017; Nair & Zhang 2009). The research capabilities and already high renewables penetration within New Zealand could make it a useful testing ground for distributed generation technologies. Electricity storage also presents opportunities for New Zealand to become an early adopter and market leader. New Zealand will need to turn to storage technologies more quickly than others due to the already high penetration of renewables. This could allow it to experiment with new network business models and technologies which could be exported. 2.2 Direct (non-electricity) energy use
The vast majority of non-electricity stationary energy emissions derive from the combustion of fuels to generate heat for use in buildings and industry. Emissions associated with heat generation account for around 9 MtCO2-e of New Zealand’s current emissions. Industry is responsible for approximately 60 per cent of heat-related emissions (around 6.3 MtCO2-e) – primarily to deliver mechanical and chemical processes (MfE 2016). The remaining heat emissions come from commercial and residential buildings. Buildings require low-grade (i.e. low temperature) heat, and industry uses low-, medium- and high-grade heat. In total, emissions are split relatively evenly across these heat grades, but high-grade heat demand is concentrated in the petroleum and chemical industry as well as non-metallic-mineral manufacturing sectors (EECA 2016). Mobile motive power in agriculture, forestry, mining and construction makes up the remaining direct emissions, responsible for GHG of about 2.3 MtCO2-e. At present, renewable heat, especially geothermal and woody biomass, makes an important contribution to servicing these demands, although a substantial section of medium- and high-grade heat is generated from the combustion of fossil fuels, especially coal. Around 27 per cent of heat demand is met from bioenergy and geothermal sources, with the remainder from fossil fuel combustion (IEA 2017b). 87 per cent of renewables used for direct heating are derived from woody biomass, with the remainder coming from geothermal (MBIE 2015b). While the use of coal for direct heating has decreased in recent years, use of natural gas has grown (MBIE 2016b). A break-down of the emissions from different heating end-uses is provided in Table 4.

23 Net Zero in New Zealand: Scenarios to achieve domestic emissions neutrality in the second half of the century
Table 4. Low-grade heat is in used the residential sector, medium- and high-grade in the non-residential sector
End-use Applications GHG emissions (2014)
Low-grade heat Up to 100°C
Clothes drying, water and space heating, as well as some industrial processes. The bulk of low-grade heat demand comes from the residential and commercial sectors.
2.3 MtCO2-e (20% of direct energy emissions).
Medium-grade heat Between 100–300°C
Industrial processes such as dairy processing, milk powder production, meat production, cooking, etc.
3.6 MtCO2-e (30% of direct energy emissions).
High-grade heat Above 300°C
Intensive, high-energy industrial processes such as the production of steel and some chemicals.
3.3 MtCO2-e (28% of direct energy emissions).
Other direct energy use
Predominantly mobile motive power, but includes direct energy use for lighting, electronics, cooling, stationary motive power, pumping and iron and steel manufacturing.
2.6 MtCO2-e (22% of direct energy emissions).
Notes: Percentages may not sum due to rounding.
Source: Vivid Economics; emissions levels in the table have been estimated based on delivered energy in the EECA database
for 2014 (EECA 2016) and emissions factors from New Zealand’s national GHG inventory.
2.2.1 Demand and efficiency assumptions
A baseline 4 per cent growth in non-electricity energy consumption is assumed, in line with the EDGS Mixed Renewables Scenario (MBIE 2016a). In line with the electricity projections, this reflects our GDP and population growth assumptions, and current views on relative technology cost and expected fuel prices. It assumes that energy efficiency improvements continue as prices increase in line with historical trends. However, separate assumptions are made for specific industries: − for the dairy and wood product sectors, demand levels are determined in conjunction with assumptions
about the size of the sectors as described in section 3; − for the petroleum and chemicals, primary metal, aluminium manufacturing and iron and steel sectors,
business uncertainty is factored in by making different assumptions as to whether these sectors will form part of New Zealand’s industrial mix in 2050.

24 Net Zero in New Zealand: Scenarios to achieve domestic emissions neutrality in the second half of the century
2.2.2 Mitigation and technology assumptions
There are multiple opportunities for low-cost energy efficiency in heat. There is significant scope for improvements in the insulation of existing building stock and highly insulated new building stock. Industry also offers opportunities for energy efficiency. Government has recently identified up to 12 per cent improvement potential by 2030 that would also improve productivity (MBIE 2016e), and therefore may be available at low cost. Many heat emissions can also be easily reduced by the use of low-emissions electricity, including high-temperature electro-heat technologies. Table 5 specifies electrification rates across different end-uses in the various scenarios. Electrification can be achieved through highly efficient heat pumps or direct electric heating, with the latter being better suited to buildings which are already well insulated (Concept Consultancy 2016a; MacLean et al. 2016). Heat pumps are used increasingly in New Zealand (O’Sullivan et al. 2015). These are supported by programmes such as the EECA’s Warm Up New Zealand programme, with installation rates of between 90,000 and 120,000 per annum in recent years. There are other specific examples of heat pump use in commercial settings – for example, Christchurch International Airport is cooled and heated using a ground source heat pump. This is a system which could be replicated in many buildings in the South Island with a similar climate (Sims et al. 2016). Heat pumps and electrification could also be used in some medium grade heat applications. Solar heating is another option for low-GHG, low-grade heat. At present, high up-front costs are often not compensated by low running costs for solar heaters in New Zealand (Concept Consultancy 2016a), contrary to experience in most other countries. However, solar heaters should become increasingly competitive due to decreasing costs accompanied by minimal electricity price increases over the long term. Housing design and passive solar features can also drastically minimise heating needs and maximise solar heater output in new-build homes (Group 2016). Although this is not built into our scenarios explicitly, it could be an option for minimising emissions in new-build households and commercial buildings such as schools. Biomass and electric options can help reduce emissions from medium- and high-grade heat. For medium-grade heat, the analysis assumes that by 2050, all the heat needs of pulp, paper and wood product manufacturing will be provided by forest biomass from nearby sources. Biomass could also be used for medium-grade heat in the dairy and other food-manufacturing industries, although some upgrading and drying of the biomass feedstock may be required to deliver heat to meet temperature and quality requirements. For high-grade heat applications, such as iron smelting and petroleum refining, it is difficult to identify low-GHG options, and emissions-intensive fuels remain the source of heat in the Off Track New Zealand and Resourceful New Zealand scenarios. Emissions from high-grade heat could be reduced further through options such as torrefied wood (Scion 2009); biogas produced from the gasification of solid biomass; or high-temperature heat pumps, hydrogen, resistive heating, induction heating and plasma torches (AEA 2010). Further work is required to determine whether these options will be available at manageable cost, and the extent to which they can be deployed in New Zealand-specific circumstances.

25 Net Zero in New Zealand: Scenarios to achieve domestic emissions neutrality in the second half of the century
Table 5. Extent of electrification assumed in low-emissions scenarios in 2050
Current level of
electrification (2014)
Off Track Innovative Resourceful
High-grade heat 6% 6% 34% 6%
Medium-grade heat3 5% 15% 19% 13%
Low-grade heat 41% 75% 95% 75%
Aluminium manufacturing 100% 100% 100% 100%
Iron and steel manufacturing 0% 0% 0% 0%
Lighting, electronics, cooling, stationary motive power, pumping
98% 99% 99% 99%
Mobile motive power for industry 0% 0% 25% 0%
Notes: Percentages are derived from the EECA end-use database based on delivered energy. End-use categories are based on
EECA categories.
Source: Vivid Economics based on data from (EECA 2016)
2.2.3 Costs and co-benefits
Energy efficiency measures are low or negative cost largely due to cost savings on fuel and electricity; they also often yield significant co-benefits. This has been most clearly demonstrated in relation to residential housing. One cost–benefit analysis of the Warm Up New Zealand programme found that there was a net benefit of NZ$0.95 billion (Grimes et al. 2012). Similarly, a study of thermal insulation in low-income houses in New Zealand found benefits to outweigh costs by a ratio of 21:4 (Chapman et al. 2009). The primary benefits consisted of avoided hospital admissions and days away from work and school (productivity savings). The net benefit of heat efficiency measures has been further supported by a number of other studies in the New Zealand context (Barnard et al. 2011; Grimes et al. 2012).
3 Note, use of biomass for all medium-grade heat in pulp, paper, wood and for 75 per cent of medium-grade heat in agricultural processing.

26 Net Zero in New Zealand: Scenarios to achieve domestic emissions neutrality in the second half of the century
The costs of electrifying low-grade heating are likely to be low. The cost of heat pumps depends on the technology used. Water source heat pumps (which extract heat from water sources) are likely to offer the lowest cost, but can be used only in locations where there is a nearby water source. Ground source heat pumps (that extract heat from the ground) may be higher in capital cost than air source heat pumps (which extract heat from the air), but their improved performance may lead to lower lifetime costs. Depending on these factors, aggregate costs could vary widely. In New Zealand, the lifetime water heating costs for a small heat load electric heat pump are approximately NZ$1.20/kWh (Concept Consultancy 2016a). This is slightly lower than the lifetime water heating costs of a fixed connection gas heater at NZ$1.30/kWh. Gas heaters are slightly cheaper than heat pumps for high and medium heat loads (Concept Consultancy 2016a). In any case, the implementation of heat pumps and electrified heating appear to be a low-cost option for mitigating different heat loads in New Zealand. Electrification of high-grade heat processes would likely be high cost abatement without significant technological development. High-temperature heat pumps currently have an operational range of 80–150°C, but are improving. Higher-temperature heat pumps that can cover high-grade heat processes would require further research and development. The evidence on other technologies (hydrogen, resistive heating, induction heating and plasma torches) is poor although costs are expected to be high, at above NZ$340/tCO2-e (CCC 2012). Using biomass for heat mitigation is difficult to estimate, but will likely be low or medium cost. The cost of biomass significantly depends on the cost and availability of feedstocks, as well as capital costs. Where these are favourable – for instance, due to proximate availability of feedstock – biomass plants can compete with fossil-fuel-powered generation (IRENA 2012; Concept Consultancy 2016c). Small-scale biomass plants currently have a levelised cost of energy of US$0.8–0.15/kWh (U.S. Department of Energy Federal Energy Management Program (FEMP) 2016). This price is likely to fall over time with further innovation and research. This suggests that the cost of biomass for heating processes will be low for some industries or installations, such as those near feedstock sources, rising to medium for others. In the Resourceful New Zealand scenario, where there is heavy afforestation, biomass costs could fall further. The evidence base on the co-benefits of mitigating medium- and high-grade heat processes is limited. As described above, studies on heating co-benefits in New Zealand have focused on the residential sector. The potential co-benefits for high-grade heat in petroleum, chemical and rubber manufacturing industries, or medium-grade heat in dairy processing, are less clear. There could be potential health benefits in terms of avoided exposure to particulate matter. While this seems likely due to the confined spaces prevalent in many industrial processes, more research is needed. 2.3 Transport
The domestic transport sector accounts for the largest proportion of New Zealand’s energy emissions, with around 14 MtCO2e. This consists of four sources: road, rail, shipping and aviation. International aviation and shipping is beyond the scope of this study. Road-based transport currently dominates the emissions profile, accounting for around 90 per cent (12.8 MtCO2-e), with rail, domestic aviation and shipping making up the remainder (responsible for 0.2, 0.9 and 0.3 MtCO2-e in 2014 respectively) (MfE 2016).

27 Net Zero in New Zealand: Scenarios to achieve domestic emissions neutrality in the second half of the century
Road transport comprises both passenger and non-passenger vehicles, with the former accounting for 65 per cent of road emissions. Of the remaining emissions, 22 per cent come from the heavy duty vehicle fleet, 16 per cent come from the light commercial fleet, and <1 per cent from motorcycles (MOT 2015). New Zealand’s road transport has grown rapidly over the past decade. Between 1990 and 2014 emissions increased by around 70 per cent, making it the fastest-growing source of emissions in New Zealand. New Zealand has a high level of per capita emissions from transport compared with other OECD countries. Low population density and a relatively rural-based economy has led to a reliance on road transport and low levels of public transport uptake. New Zealand has the second-highest rate of car ownership among OECD countries at 604 cars per thousand people (Sims et al. 2016). New Zealand has a relatively old road vehicle fleet, with long lifetimes, further contributing to high road transport emissions per capita. In 2014, the average age of light vehicles was 14.2 years and 17.6 for trucks (MOT 2015). The vehicle fleet is equally split between new and used cars, with many of the used cars being imported. Older vehicles generally have higher levels of harmful emissions (MOT 2011) and lower levels of efficiency. These attributes make road transport in New Zealand both GHG-intensive and, due to the implied slow turnover in the vehicle fleet, difficult to change in the short term. Even though it accounts for only a small share of emissions, rail is the second-largest transport mode for domestic freight. The government-owned and -operated rail network covers over 4,000 kilometres (MfE 2013). In 2012 – the latest year for which data was available – rail accounted for around 7 per cent of freight movements, moving 16.1 million tonnes per year (MOT 2014). It is expected to grow by 51 per cent by 2042 to 24.3 million tonnes (MOT 2014). Rail also makes up a substantial part of urban passenger transport with rail networks in Wellington and Auckland accounting for approximately 22.1 million passenger trips per year (MfE 2016). Most train lines in New Zealand are run on diesel locomotives, although there are some sections of the network that are electrified. KiwiRail has recently decided to replace its currently electrified North Island main trunk railway with diesel locomotives, resulting in an extra 12,000 tonnes of CO2-e per year (Burr 2017). The geography of New Zealand means that aviation is an important part of transport emissions. New Zealand’s two largest cities (Wellington and Auckland) are located at opposite ends of the North Island. Although passenger numbers for domestic aviation have increased in recent years, emissions have declined and are relatively low compared with New Zealand’s international aviation emissions (approximately 0.9 MtCO2-e for domestic and 2.4 MtCO2-e for international) (New Zealand Government 2016). The recent decline is partly due to a shift towards larger aircraft for Air New Zealand. Maritime shipping is used for freight as well as a small amount of passenger travel. Most ferry and freight transport is across the Cook Strait between the North and South Islands. Ferry travel across the strait is provided through five vessels operated by two competing companies, as well as a number of smaller ferry services along the wider coastline (MfE 2013). While shipping makes up a minor share of transport emissions, these emissions increased by 58 per cent from 1990 levels to 0.4 MtCO2e (MBIE 2016c). Shipping emissions are likely to increase further. Maritime freight alone is projected to increase by 81 per cent by 2042 to 7.6 million tonnes (MOT 2014). Shipping is currently run on a combination of oil and

28 Net Zero in New Zealand: Scenarios to achieve domestic emissions neutrality in the second half of the century
a small amount of coal, with no biofuel-powered vessels currently in operation. As with international aviation, international shipping is beyond the scope of this study. 2.3.1 Demand and efficiency assumptions
Currently, light vehicles account for approximately 78 per cent of New Zealand’s road-based transport energy, use while heavy vehicles account for about 22 per cent. We assume these shares remain constant in the future and then apply different trends for emissions abatement for light and heavy vehicles. Further work into the possible evolution of the light/heavy vehicle split over time could improve these estimates. The fuel economy of New Zealand’s transport fleet is poor compared with other countries. Improvements in fuel efficiency, size and other factors can lead to efficiency improvements in both the light and heavy vehicle fleets. For the light vehicle fleet Business NZ Energy Council (2015) assumed improvements of 1.8 per cent per year, and these are included in the Off Track, Innovative and Resourceful New Zealand scenarios. This is similar to the ambitious goal of Auckland City Council to improve the fuel efficiency of the light vehicle fleet by 49 per cent by 2040 (approximately a 1.8 per cent per year improvement). For the heavy vehicle fleet the analysis assumes that fuel efficiency improves by 0.3 per cent per year. This corresponds to Auckland City Council targets and international estimates from the UK Committee on Climate Change (Committee on Climate Change 2015). Moderating the expected growth in demand for car travel could lead to an additional 10 per cent reduction GHG emissions from the transport sector on a 2050 baseline (Porter et al. 2013). Emissions reductions could be facilitated by increased urban density, telepresence, better use of vehicles with emerging optimisation and sharing technologies, a modal shift towards public and active transport (cycling, walking, etc.) as well as urban design that encourages such a shift (MOT 2014a; Nederhoff 2009). A 10 per cent reduction in GHG emissions below a 2050 baseline is in line with estimates from both the UK Committee on Climate Change (2015) as well as Ewing et al. (2007). It also falls within the broad range of existing study estimates outlined by Porter et al. (2013). The improvement of other measures already in place in New Zealand, such as vehicle fuel emissions standards and labelling, could result in further mitigation. Demand for transport for freight is expected to grow. We assume total freight demand by 1.54 per cent per year, in line with the expected growth rate for total freight demand by weight, from 2012 to 2042 (MOT 2014b). This freight growth rate is applied to both maritime and land transport. Demand for freight by land is split between heavy vehicles and rail based on the assumptions set out in the following section. A relative lack of data has made it difficult to calculate likely emissions trajectories for domestic aviation and maritime emissions. We grow air demand in line with projections of passenger growth from 2013 to 2030 (in New Zealand air forecasts), and assume energy efficiency increases of 3 per cent per year in line with projections from the Ministry of Transport (New Zealand Government 2016). Demand for maritime transport grows at the same rate as broader freight transport demand as outlined above.

29 Net Zero in New Zealand: Scenarios to achieve domestic emissions neutrality in the second half of the century
2.3.2 Mitigation and technological assumptions
Electrification of the light duty transport fleet is one of the most promising mitigation options in the transport sector. BEVs are either at or approaching price parity with ICEs in the next decade (Concept Consultancy 2016b, Bubeck et al. 2016; Trigg et al. 2013; IEA 2016). Given that the average lifetime of the fleet is around 14 years, with some of the longest lifetimes ranging up to 20 years, it is possible that most of the passenger fleet could be replaced with BEVs before 2050 without any early scrappage of vehicles. This would require that almost all new vehicles purchased are BEVs when they reach price parity in the 2020s. Modelling exercises (Shafiei et al. 2014; Leaver & Gillingham 2009) have generally assumed less than 100 per cent of new sales of BEVs. However, the rapid reductions in battery cost currently taking place justify a level of optimism regarding this assumption. Table 6 shows the levels of penetration of low-emissions vehicles assumed in the Off Track, Innovative and Resourceful scenarios.
Table 6. High levels of electrification are seen in the light vehicle fleet by 2050, and low-to-moderate electrification for the heavy fleet and rail
Off Track Innovative Resourceful
BEV penetration in light vehicle fleet 85% 95% 85%
BEV penetration in heavy vehicle fleet 25% 50% 25%
Electrification of rail 21% 21% 21%
Freight left on road (rail migration rate) 85% 75% 85%
Source: Vivid Economics
Hydrogen vehicles are another potential option for moving the light vehicle fleet away from the ICE. Some studies suggest that, for New Zealand, hydrogen vehicles are a plausible alternative to a fleet reliant on ICEs and BEVs (Gillingham & Leaver 2008; Kruger et al. 2003). Previously, mitigating emissions from hydrogen production would require substantial use of CCS (Leaver & Gillingham 2009), although the costs of electrolysis have fallen markedly and the requirement for CCS will likely dissipate over the coming decades. However, the most recent trends in BEVs suggest that they are likely to be a cheaper option than hydrogen vehicles while BEVs also enjoy a natural advantage in the context of New Zealand where electricity is already relatively low-carbon and low-cost. A switch towards hydrogen vehicles would likely require more substantial investments in infrastructure (power plants conducting electrolysis, pipelines or tankers for distribution, etc.). GHG emissions from non-passenger transport are more difficult to reduce due to greater vehicle weight and the longer distances travelled, although some modal shift should be possible. BEVs

30 Net Zero in New Zealand: Scenarios to achieve domestic emissions neutrality in the second half of the century
currently have little penetration in the heavy vehicle fleet. This is due to the higher cost and weight of battery packs that have an appropriate operational range for heavy vehicles. However, there are numerous options that are commercially available, decreasing in cost and already in use in places such as California and Sweden (Air Resources Board 2015). Previous studies have shown that, for the US, a combination of technologies could make an 80 per cent reduction in trucking emissions by 2050 possible, although this depends on the cost curve of hydrogen and BEV technologies (Fulton & Miller 2015). While hydrogen vehicles have potential in the heavy vehicle fleet, particularly in the longer term, there is still an infrastructure investment challenge. Given this, and the projected cost curve for battery pack density, we have assumed that BEVs are the dominant zero-emissions technology employed in the heavy vehicle fleet. A modal shift towards rail and shipping for freight also offers a relatively low-cost form of mitigation. Biofuels could be a medium-high cost option for decarbonising transport, but constraints on supply of sustainable biomass could limit the extent to which this option is possible. There is scope for the deployment of imported biofuels in these sectors, and this could serve as an insurance policy to assist in decarbonising the transport sector if electrification does not proceed at the desired rates. Previous modelling exercises have found that, even with subsidies, biofuels are unlikely to be price-competitive by 2050 (BusinessNZ Energy Council 2015). Other studies have estimated that biofuels would require a emissions price of NZ$100/tCO2 and oil prices of US$105/bbl (Hall 2013). While there have been recent innovations in reducing the cost for converting biomass to biofuels (Suckling 2013), it is unclear whether the cost curve will keep pace with electric vehicle or even hydrogen technologies.
2.3.3 Costs and co-benefits
The falling costs of BEVs mean that decarbonising the light vehicle fleet is likely to be a low-cost option. In some instances, the lifetime costs of BEVs are already cheaper than ICEs in New Zealand, driven by running costs that are approximately 20 per cent lower than ICEs (Bubeck et al. 2016; Concept Consultancy 2016b). The commercial price of many BEVs had already fallen below what many publications had forecast for 2020 (Nykvist & Nilsson 2015). The gap in costs is likely to expand as the cost of batteries falls and energy density increases: battery pack costs declined by 14 per cent per annum between 2007 and 2014 (Nykvist & Nilsson 2015). Currently, BEVs appear to be on target to reach the IEA estimate for price parity (US$300/kWh) by the 2020s (IEA 2016; Trigg et al. 2013). After the 2020s, continued reductions in price and improvements in battery energy density should ensure that BEVs become substantially cheaper than ICEs and competitive in terms of range. The cost of electrifying rail is difficult to estimate, but likely to be high. Generally, electric trains are more efficient than diesel trains, using 2.5–3 times less energy per unit of work as diesel locomotives (Simounet 2014). However, understanding the potential costs is difficult as the cost of electrification varies substantially between lines depending on the existing technology, track length, usage rate, etc., and in some cases is physically impossible (Simounet 2014). There is also a lack of studies, both generally and specifically for New Zealand. Given this, and reflecting the plans by KiwiRail to replace electric trains with diesel on the North Island Main Trunk line due to cost, it is both prudent and plausible to consider rail electrification as a high-cost option. However, cost savings due to efficiency and the commercialisation of
31 Net Zero in New Zealand: Scenarios to achieve domestic emissions neutrality in the second half of the century
new technologies such as vacuum circuit breakers and wayside energy storage could help reduce costs in the medium term (Simounet 2013; 2014). There are numerous co-benefits from reducing transport emissions, but the most significant are health-related. The health co-benefits of transport sector mitigation in New Zealand stem from two main causes: changes towards more active forms of transport and reductions in air pollution. A modal shift towards active transport will likely have major health benefits due to both decreased pollution and increased physical activity. Researchers at Auckland University found that the benefits of shifting short urban trips (<7kms) from motor vehicles to cycling were 40 times greater than the costs (Lindsay et al. 2011). The benefits for Māori were twice that of other groups due to a higher baseline mortality (Lindsay, Macmillan, and Woodward 2011). This study may be a conservative estimate as it does not consider the economic impact of foregone years of productivity due to early death. Both public and active transport may also help to build stronger community ties (Chapman 2008). Any transport measure that reduces the use of ICEs will have air-quality co-benefits. As well as CO2, ICEs produce numerous tailpipe emissions including sulphur dioxide (SO2), nitrogen oxide (NOx) and other local particulate matter. These have detrimental, sometimes severe, health impacts. The exact impact is difficult to quantify as it varies according to population density, existing levels of ICE use, levels of local sequestration, and so on. There is a lack of studies of New Zealand in this area (Concept Consultancy 2016). Global studies have suggested that mitigation can lead to co-benefits from avoided mortality due to air pollution (from all sources) that would justify a emissions price of US$50–380 per tonne CO2e (West et al. 2013). There may be other co-benefits but these require a larger evidence base. Arguably, by moving away from imported oil, New Zealand will be better shielded from international price shocks and volatility. With the right policies, there could also be scope for transport mitigation to drive new innovative industries. 2.4 Fugitives
Overall, fugitive emissions make up a relatively small, but growing, part of New Zealand’s energy emissions. Fugitive emissions occur during the production, storage and distribution of energy, as well as through non-productive combustion. In 2014, fugitive emissions were 2 MtCO2-e. This was only 4 per cent of total net emissions, but they are on an increasing trend, having grown in absolute terms by 48 per cent since 1990. Around 90 per cent of fugitive emissions in New Zealand arise from natural gas, oil and other energy sources. These have grown by 79 per cent since 1990. For natural gas, the primary driver of this increase has been venting at the Kapuni gas treatment plant (MfE 2016). The growth of geothermal energy has also significantly contributed to fugitive emissions, with this source of emissions increasing by 186 per cent between 1990 and 2014, to reach 0.8 MtCO2-e. In general, CO2 emissions from geothermal plants are in the range of 10–400g/kWh (NZ Geothermal
32 Net Zero in New Zealand: Scenarios to achieve domestic emissions neutrality in the second half of the century
Association 2016). Fugitive emissions vary between geothermal plants due to differences in geography and plant infrastructure. Solid-fuel fugitive emissions – emissions created by CH4 leakage during coal mining activities (MfE 2016) – account for a relatively small and declining share of fugitive emissions due to the reduction in coal production and closure of two coal plants in New Zealand (MfE 2013). In 2014, solid fuels accounted for only 10 per cent (0.2 MtCO2e) of overall fugitive emissions (MfE 2016).
2.4.1 Demand and efficiency assumptions
Energy production from geothermal sources increases in low-emissions scenarios, and thus fugitive emissions from this source also increase. The rate of increase is uncertain and dependent on both the level of increased energy production and the effectiveness of regulations around leakage and transportation. Even if oil, gas and coal extraction plateau or decrease, emissions from geothermal activity are likely to increase. Fugitive emissions change in line with the level of industrial activity. Under the low-industry sensitivity, there are no oil refineries or steel manufacturing, and so emissions from these sources revert to zero (this impacts fugitive emissions from coal and fugitive emissions from flaring gas). Fugitive emissions from gas processing remain in all scenarios.
2.4.2 Mitigation assumptions
Although options for reducing fugitive emissions exist, the evidence base regarding their potential in New Zealand is poor. Options include: − enacting stricter regulations on energy production and distribution, such as tighter monitoring and
standards for gas pipelines to reduce leakage; − modifications to geothermal plants, which can, depending on geological variation, decrease emissions
from geothermal sites (Holm et al. 2012). There are technologies in development, such as closed-loop systems, that could reduce fugitive emissions to zero (DOE 2006). However, there is currently no large-scale commercial deployment of these technologies or information on costs.
We have made a conservative assumption that no significant mitigation of fugitive emissions occurs in the Off Track New Zealand and Resourceful New Zealand scenarios. In the Innovative New Zealand scenario, we assume the emissions intensity of electricity generation from geothermal reduces by 1.4 per cent per annum, in line with international literature on the potential for fugitives reduction (ClimateWorks Australia 2014).
2.4.3 Costs and co-benefits
The evidence base on the costs and co-benefits of mitigating fugitive emissions in New Zealand is poor. Co-benefits are likely to exist through decreasing levels of air pollutants including CO2, CH4 and SO2. Yet most sources of fugitive emissions occur away from populated areas, which would reduce the extent of any health co-benefits.
33 Net Zero in New Zealand: Scenarios to achieve domestic emissions neutrality in the second half of the century
2.5 Industrial processes
Industrial processes and product use (IPPU) emissions were 5.2 MtCO2-e in 2014 (MfE 2016). These come from two sources: 1. non-combustion industrial processes that emit as waste streams:
− one third of IPPU emissions comes from steel production; − 16 per cent results from mineral industries such as cement and lime; − 12 per cent is a result of aluminium production at Tiwai Point, the majority of which is CO2, but
also includes perfluorocarbons (PFCs) which are produced in the primary aluminium-reduction process; and
− 8 per cent comes from chemical industries such as ammonia, methanol and hydrogen production. 2. Hydrofluorocarbons (HFCs) – highly potent GHGs which can have a global warming potential (GWP)
up to 15,000 times greater than CO2 over 100 years and that are used as solvents in refrigeration and air conditioning.
While progress has been made in reducing IPPU emissions in recent years, official projections suggest they will rise. Emissions of PFCs have declined from 1 MtCO2-e in 1990 to the current level of 73 ktCO2-e as a result of changes to Rio Tinto’s smelting process at Tiwai Point. However, remaining gases are projected to increase over the coming period. The Second Biennial Report (MfE 2015a) suggests that IPPU emissions will rise to 5.7 MtCO2-e in 2020 (13 per cent above 2014 levels), and to 6.6 MtCO2-e in 2030 (an increase of 30 per cent above 2014 levels).
2.5.1 Demand and efficiency assumptions
All scenarios assume the same levels of IPPU, and a sensitivity is included with regard to whether the refinery, steel and aluminium industries remain operational. Emissions from the production of minerals (predominantly cement) are assumed to grow in line with population as a proxy for increased activity in the building and construction industry. All other industries associated with IPPU emissons grow at the non-electricity energy growth rate of approximately 4 per cent total to 2050. This results in a lower underlying growth rate than suggested by the projections, although it is consistent with our expectations regarding future economic conditions in source sectors.
2.5.2 Mitigation and technological assumptions
The use of coking coal substitutes could be an important source of abatement for iron and steel. For example, a New Zealand company, CarbonScape, has developed a technology to produce ‘green coke’ from biomass, which can replace the coking coal used as a reducing agent for steel production and could thus be a source of abatement (CarbonScape 2017a). CarbonScape is in the commercialisation phase and has a contract to provide 9,000 tonnes of green coke to New Zealand Steel per annum, which should provide abatement of 28 ktCO2-e (CarbonScape 2017b).

34 Net Zero in New Zealand: Scenarios to achieve domestic emissions neutrality in the second half of the century
The cement industry could look to blending. Blended cement replaces some of the limestone-based clinker with coal fly ash and blast furnace slag can reduce emissions by up to 20 per cent (Rubenstein 2012). There may also be options for improved efficiency in the calcination process. Some industrial emissions intensities could be reduced through CCUS, although there are major uncertainties regarding its feasibility in New Zealand. In theory, industrial CCUS could play an important role in decarbonising some New Zealand industries. In many industrial processes, such as hydrogen production from steam, CH4 reforming, ethanol production, and processing of natural gas, the separation of CO2 is an inherent part of the fuel-production process. Capture from these high-purity sources is less capital-intensive than capture from diffuse sources of CO2, such as power generation (The White House 2016). These industrial CCUS opportunities could provide valuable early experience with permitting, infrastructure deployment, and market opportunities, which in turn could lower the cost of future CCUS projects. However, as discussed in Box 1, the economics of CCUS in New Zealand make it an unlikely technological option for wide-scale uptake to 2050.

35 Net Zero in New Zealand: Scenarios to achieve domestic emissions neutrality in the second half of the century
Box 1. Feasibility of CCUS
The technological feasibility of CCUS is proven and it is in use across a variety of industries and applications worldwide. It has been successfully implemented in natural gas processing, hydrogen production, fertiliser manufacture, and the production of synthetic natural gas. In the next two years, researchers expect the range of industrial applications to grow further to include ethanol production and steelworks (Global CCS Institute 2016). In some instances, individual industrial facilities can capture millions of tonnes of CO2 each year and the technology is a proven solution for reducing emissions at this type of large-scale source. It is possible that CCUS could be used to allow emissions-intensive processes and power sources to persist in a net zero future in New Zealand. For example, BusinessNZ Energy Council’s (2015) Kayak scenario envisages that the remaining Huntley coal units are removed from service in the 2020s but that coal returns in 2050 in the form of a 450 MW plant fitted with CCUS. In its Waka scenario, a 200 MW biomass integrated gasification combined-cycle plant with CCS is used to assist with the intermittency of renewable generation. However, there are two major challenges with CCUS which suggest that it may not be an appropriate technology in the New Zealand context: 1. Most industrial plants operate on a smaller scale than those where CCUS is currently competitive.
While the combined level of emissions from a number of such smaller-scale facilities can be significant, it may be high-cost for any individual facility to consider application of the full CCUS chain which includes capture, compression, transport and permanent storage of CO2.
2. Storage would be challenging: potential CO2 storage locations in New Zealand are principally depleted hydrocarbon fields, mainly in Taranaki. A potential bioenergy CCUS scheme based in a Taranaki dairy factory could operate as a demonstration facility. However, viability beyond this would be challenging as CO2 storage in deep aquifers would be ill-advised due to New Zealand’s tectonic activity.
Finally, across all scenarios, HFCs are displaced by gases with less or zero GWP in line with New Zealand’s international commitments. The growth in HFCs is a result of the phase-out of ozone-depleting substances (ODS) under the Montreal Protocol and the overall growth in air conditioning and refrigeration. While the Protocol has been successful in reducing ODS, an unintended consequence has been manufacturers substituting to HFCs. As a result, in 2016, over 200 countries agreed to the Kigali Amendment. As a signatory to the Amendment, New Zealand has committed to phase down the consumption and production of HFCs by 85 per cent of its 2011–13 average by 2036 (EIA 2016). Such a reduction suggests abatement of up to 1.3 MtCO2-e. We have assumed that New Zealand is successful in meeting its commitments under the Kigali Accord. Mechanisms to achieve this could include: − prohibiting the use of certain HFCs across a variety of end-uses where more sustainable alternatives are
available such as CO2 (given that it has lower GWP) and ammonia; − partnering with retailers and businesses to address the existing stock of refrigerators and air conditioners
in order to prevent HFC leakage over the coming decades;

36 Net Zero in New Zealand: Scenarios to achieve domestic emissions neutrality in the second half of the century
− introducing incentives for households to prevent emissions from appliances through appropriate disposal mechanisms.
As with the consumption of energy, we develop a sensitivity regarding growth in industrial process emissions. IPPU emissions from refineries, iron and steel and aluminium production are assumed to revert to zero under the industry-closure sensitivity.
2.5.3 Costs and co-benefits
The evidence base for the costs of mitigating IPPU emissions in New Zealand is weak, although each scenario assumes that most are high cost and thus are not taken up at scale. New technologies which reduce process emissions intensities, such as green coke and CCUS, are unlikely to be sufficiently cost-effective to be taken up at scale at current prices. Moreover, scenarios assume that CCUS remains high-cost up to 2050 and that it is not taken up. Given the availability of substitutes for HFCs, mitigating this source is likely to be low or medium cost. Although HFCs are emitted from a wide array of activities and sectors, the fact that their uses are well defined and often self-contained makes them easier to mitigate than other GHGs. The US Environmental Protection Agency estimates that most types of HFC abatement is low cost, although some such as aerosol and fire extinguisher solvent substitution could be medium cost (Camuzeaux 2012). 2.6 Waste
Emissions from waste in New Zealand are primarily methane (96 per cent of the total) caused by anaerobic degradation of biodegradable waste disposed in landfills and other dumps. Nitrous oxides (3.5 per cent) and CO2 (0.04 per cent) are also produced. From 1990, emissions increased at a rate of 1 per cent per annum, but peaked in 2005 and have since decreased. By 2014, emissions were 4.1 MtCO2-e as indicated in Table 7, the same level as in 1990. However, estimates of emissions from waste are subject to high ranges of uncertainties, ranging ±40 per cent (Graham 2015,MfE 2016).

37 Net Zero in New Zealand: Scenarios to achieve domestic emissions neutrality in the second half of the century
Table 7. Emissions from the waste sector are broadly unchanged over the past 24 years
Source Emissions (MtCO2-e) % change % share
1990 2014 1990–2014 2014
Solid waste disposal 3.768 3.716 -1.4 91
Incineration 0.002 0.003 60.4 0.1
Wastewater 0.335 0.366 9.3 9
Total 4.105 4.085 -0.5 -
Source: MfE (2016)
New Zealand’s waste emissions per capita are the second highest in the developed world and are forecast to remain at relatively high levels. Austria, Belgium, Germany, Netherlands, Sweden and UK have successfully reduced their waste emissions by more than 50 per cent since 1990. By contrast, as discussed above, New Zealand’s remain broadly the same as in 1990, and are twice the level of the OECD average. Moreover, they are projected to rise over the coming decades: in the country’s 2nd Biennial Report to the UNFCCC, even in the ‘with measures’ scenario, waste emissions are projected to be 4 per cent higher in 2030 than in 2013 (MfE 2015a). Around 45 per cent of total emissions from solid waste disposal arise from landfill, principally comprising household waste. Most households are serviced by kerbside recycling and refuse collections provided by local authorities and/or private waste operators: − Approximately three quarters of the material that is collected by kerbside recycling collections is
processed locally for re-use, either in New Zealand or overseas, and thus is not a source of emissions. − The remaining 24 per cent of household kerbside refuse waste is sent to landfill. Half of this is
putrescible organic waste such as kitchen waste and green waste. Other organic wastes which could be diverted from landfill include paper (14.3 per cent) and timber (1 per cent) (Waste Not Consulting 2009).
Over half – 55 per cent – of solid waste emissions are derived from unmanaged disposal sites including dumps. Such sites remain unregulated in New Zealand. The main sources of emissions in this segment – 60 per cent – are farm dumps which tend to include scrap metal, treated timber and fence posts, plastic wraps and ties, netting, glass, batteries and domestic refuse (Tonkin and Taylor 2014). Farm waste volumes have been trending downwards since 1990 when 1.75 million tonnes of farm waste was produced; volumes have since fallen by 17 per cent to approximately 1.45m tonnes in 2012 (Tonkin and Taylor 2014).

38 Net Zero in New Zealand: Scenarios to achieve domestic emissions neutrality in the second half of the century
Construction and demolition (C&D) waste, whether sent to managed or unmanaged sites, includes some organic materials and hence are a source of emissions. Approximately 850,000 tonnes of C&D waste is sent to landfill each year. While most of this waste is inert, C&D represents a source of emissions. For example, in South Africa, an average of 27 per cent of C&D waste is organic waste such as wood and paper (van Wyk 2014). Most of the dumping of C&D waste is unnecessary (Level 2016). Assuming the emissions intensity of C&D waste is the same as municipal solid waste, this analysis estimates that emissions of 0.3 MtCO2e are derived from this source. By separating it at source, at least half of it could be diverted and could thus provide a source of abatement, if the organic material can be processed (level 2016). Finally, wastewater emissions are almost 0.4 MtCO2-e, which is almost 10 per cent of waste emissions. Treatment of wastewater is associated with CO2, CH4, and N2O emissions. Abatement options could include source control to reduce the quantity of wastewater produced and emissions capture during treatment. However, these options are not considered in the analysis below due to a limited information base on feasibility and costs. 2.6.1 Demand assumptions
Population growth is assumed to be the main driver of waste emissions. Municipal household, C&D and wastewater waste emissions are all assumed to rise in line with population, but unmanaged site emissions do not as they have not been historically linked with population growth. 2.6.2 Mitigation and technical assumptions
The state of knowledge on the level of abatement achievable in the waste sector in New Zealand is limited. While waste quantities have been estimated by a range of organisations, there does not appear to have been any modelling exercises performed to identify the costs of achieving targets or reducing emissions from waste. In general, however, waste emissions can be reduced by: − reducing the quantity of biodegradable waste created and disposed of in landfill or unmanaged dumps
(including through increased recycling and composting); and − reducing the emissions intensity of landfill waste by techniques such as CH4 capture and improved
management. Reducing per capita waste emissions levels to the OECD average could deliver significant abatement by 2030. Many of the strategies to achieve such a cut at the household and business level are already well known and involve (MfE 2015b): 1. Reduce: via waste education programmes and resource efficiency programmes for businesses. 2. Reuse: through education and council-operated refuse collections and services. 3. Recycle: by ensuring sufficient recycling collection coverage with a particular need to increase coverage
in rural areas. Improved CH4 capture rates at landfill sites would reduce the emissions intensity of waste. New Zealand’s overall CH4 capture rate (across all landfills) is estimated at approximately 40 per cent, a level significantly below the rate found in places such as the US where 85 per cent is captured (The White House

39 Net Zero in New Zealand: Scenarios to achieve domestic emissions neutrality in the second half of the century
2016). This rate masks a large variation in capture rates, with some of the most efficient facilities achieving 90 per cent capture under the ETS criteria, while smaller, older sites have poor or zero collection efficiency. Higher rates of CH4 capture overall would require diversion of non-compostable organic waste to highly efficient municipal landfill sites (e.g. through food waste collection in urban areas) and through new system installations and improved practices at low-efficient landfill sites. Similar reductions have been achieved elsewhere, and city councils are becoming increasingly proactive in targeting significant cuts in municipal household waste. City councils have set ambitious targets to reduce municipal waste: Wellington City Council has a target of reducing waste emissions to 80 per cent below 2010 levels by 2050, while Auckland has targeted a 97 reduction in waste GHGs by 2040. Options for unmanaged facilities require greater regulation to facilitate waste diversion and CH4 capture. By regulating farm dumps and other unmanaged sites, and offering education and incentive-based schemes, CH4 emissions could be reduced through: − reducing dumping of biodegradable waste (such as green waste) in favour of composting; − diverting biodegradable waste to larger-scale facilities with CH4 capture systems; − encouraging the take-up of anaerobic bio-digesters on farms producing and capturing CH4, which can
then be used as a renewable energy source on-site. C&D waste emissions can be mitigated by re-using materials and diverting from landfill to facilities which can appropriately process the various types of C&D waste. Typically, it is possible to divert at least 50 per cent of C&D waste from a particular construction site. Indeed, in some cases, 60–70 per cent may be feasible, while the New Zealand Green Building Council reports that some commercial projects have diverted 90 per cent of building-site waste. The low-emissions scenarios in this assessment reduce per capita municipal household waste levels substantially, but assume a less ambitious path for unmanaged sites and construction and demolition waste given the more limited evidence base in these areas. − In all scenarios, we assume that C&D waste is re-used or sorted at source and thus is diverted from
landfill, resulting in a 25 per cent reduction in waste emissions per capita from this sector. As the sector’s emissions are assumed to rise in line with population growth, C&D emissions still increase by a total of 2 per cent in 2050 to 0.3 MtCO2-e.
− In all scenarios, wastewater emissions rise in line with population growth and are 35 per cent higher in 2050 at 0.5 MtCO2-e.
− In the Off Track New Zealand and Resourceful New Zealand scenarios, we assume that per capita municipal household waste quantities are reduced by approximately 25 per cent to reach the current OECD average by 2050, and emissions capture rates at landfill sites improve by 25 per cent. Furthermore, we assume that farm waste quantities decrease at half the rate of that experienced over 1990–2014. However, a rising population leads to total waste emissions falling only slightly to 95 per cent of current levels or 3.8 MtCO2-e.
− By contrast, Innovative New Zealand sees total waste falling to approximately 2.8 MtCO2-e in 2050. We assume that New Zealand can attain the highest-performing OECD country levels of per capita household waste quantities in 2050. Furthermore, CH4 capture rates at municipal landfill sites improve
40 Net Zero in New Zealand: Scenarios to achieve domestic emissions neutrality in the second half of the century
by 50 per cent to attain the UK average resulting in emissions from municipal household waste falling by 66 per cent from 2014 levels. On unmanaged sites, we assume that improved biodegradable efficiency and the use of anaerobic digesters result in lower emissions. We also assume a higher rate of farm waste reductions than in the other two scenarios given the de-intensification of dairy production under the Innovative New Zealand scenario. Overall, waste emissions fall by 34 per cent from 2014 levels.
2.6.3 Costs and co-benefits
The evidence base on costs of mitigating waste emissions in New Zealand, whether household waste, unmanaged sites or C&D, is weak. The introduction of the ETS levy has improved the information base within private waste-management companies, but significant gaps remain, particularly for unmanaged sites. Costs can be reduced if biomass in the form of waste organic matter, such as municipal solid waste, is used as feedstocks for heat and power plants. Utilisation of organic solids or sewage waste for the production of liquid biofuels or biogas through anaerobic digestion, combustion, gasification or pyrolysis can avoid costly waste treatment, transport and disposal. However, economies-of-scale effects are important when considering waste-to-energy solutions, and so they may be applicable only to a limited number of sites. Co-benefits from waste reductions include a reduced risk of leachate impacting groundwater, as well as other environmental benefits. Leachate is generated when soluble components of the waste stream are transported out of mixed waste through water. Leachate can enter groundwater, potentially resulting in environmental and/or health problems, particularly if it enters the food chain. All landfill sites generate leachate, but there is no guarantee it will impact groundwater: it could remain confined in a landfill indefinitely, or until it is extracted and treated. In other cases, leachate could leak through the landfill liner but be confined by impermeable bedrock. The risks of damage from leachate depend on the location of the landfill, its construction, and how the leachate is managed (Denne & Bond-Smith 2012). Other co-benefits are associated with a reduced need for future landfill sites or expanded current landfills, including reduced nuisance from odour, vermin, birds, noise, visual effects and impacts on property values. 2.7 Research agenda
Many of the technologies and approaches in the energy, industry and waste sectors are well known and at or near commercial with conventional and high carbon alternatives. Renewable electricity, electric vehicles, heat pumps and energy efficiency form the basis for most of the emissions reductions and while there is still scope for further technological learning over time, the need for breakthroughs is relatively lower than in the land sector. The transition envisaged in these scenarios is significant, however, and will require scaling up of these technologies to levels not seen historically in New Zealand; this-scale up will require new research and analytical work. Some of the priorities for further assessment include:
⎯ Detailed power sector plans, including options for flexibility. Although the EDGS scenarios already show how to achieve low emissions intensity, they are not compatible with the expansion required to support EVs. Scenarios should include a detailed assessment of the least cost capacity

41 Net Zero in New Zealand: Scenarios to achieve domestic emissions neutrality in the second half of the century
mix, including identification of priority sites or regions for new renewables, and the mix of options for system flexibility (demand side response, batteries, hydro and gas) to ensure system reliability.
⎯ Potential for almost complete decarbonisation of heat. The evidence base on the scope for decarbonising heat is poor. The costs and scope for rollout of electric heat options in low, medium and high temperature application could be much better characterised, including the timelines for potential rollout that take account of the turnover of the capital stock and potential supply chain constraints.
⎯ Estimates of supporting infrastructure: transmission, distribution and metering. Power sector scenarios should be accompanied by estimates of any new upgrades and network access arrangements to support high EV and heat pump uptake, as well as the onshore grid to connect new renewables. To rollout and coordinate a network of smart meters requires data management and software, and technical expertise. Software and metering trials are already in place but could be extended, noting the lessons learned from similar programmes internationally.
Significantly further research is required to unlock the emission reductions foreseen in the Innovative NZ scenario. In particular, it requires better understanding of the scope for high temperature heat and the use of electric vehicles for freight:
⎯ The options for low-carbon high temperature heat are currently expensive, and include both electric and biomass solutions. The costs of deploying these in the New Zealand warrants further exploration, particularly to decarbonise the major heat demands such as in milk drying and processing.
⎯ Electric vehicles in freight are currently expensive. Further evidence on the scope for rollout of these technologies under different assumptions for cost reduction is required.
Improved understanding of the options to reduce emissions from unmanaged sites in waste, and their costs, could address this large share of waste emissions. Better information is needed on the costs and abatement potential for the options to reduce industrial process and fugitive emissions for New Zealand sites. Finally, it is vital to begin laying the foundations for permanent emission reductions through development of negative emissions technologies. This includes scope for combining bioenergy with carbon capture and storage (BECCS) – which sequesters carbon dioxide from the atmosphere and then stores it underground – as well as direct air capture and carbon-storing materials.
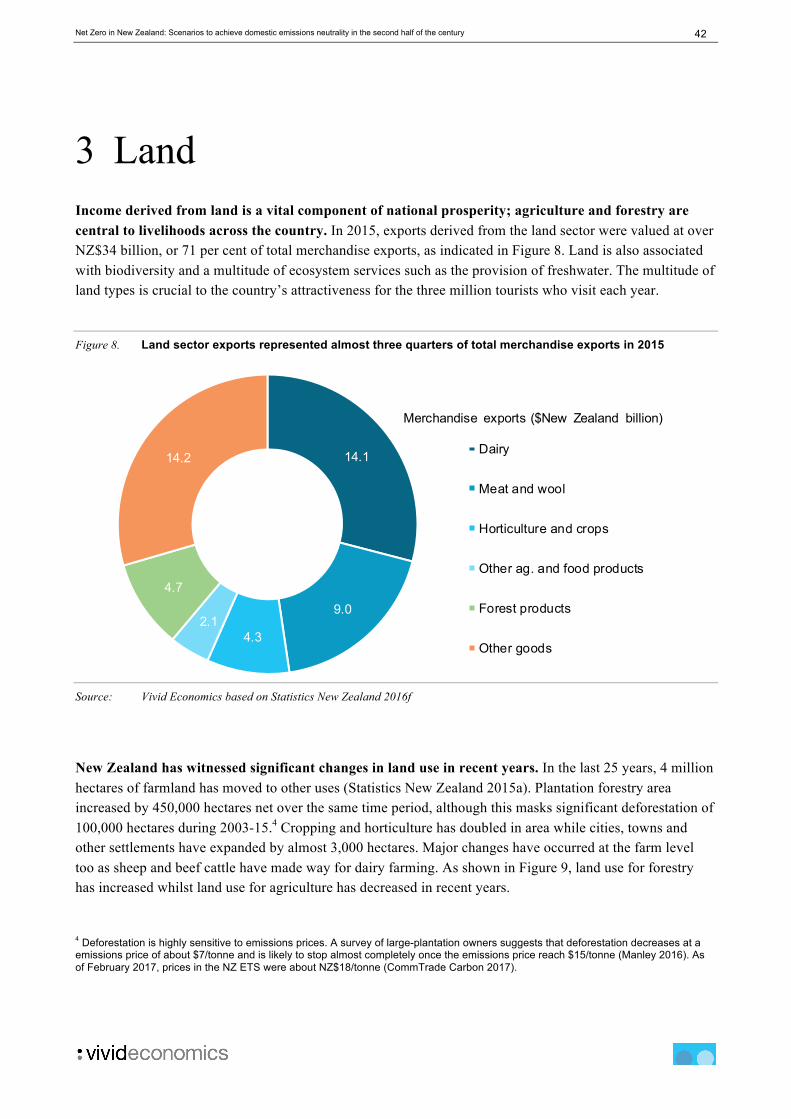
42 Net Zero in New Zealand: Scenarios to achieve domestic emissions neutrality in the second half of the century
3 Land Income derived from land is a vital component of national prosperity; agriculture and forestry are central to livelihoods across the country. In 2015, exports derived from the land sector were valued at over NZ$34 billion, or 71 per cent of total merchandise exports, as indicated in Figure 8. Land is also associated with biodiversity and a multitude of ecosystem services such as the provision of freshwater. The multitude of land types is crucial to the country’s attractiveness for the three million tourists who visit each year.
Figure 8. Land sector exports represented almost three quarters of total merchandise exports in 2015
Source: Vivid Economics based on Statistics New Zealand 2016f
New Zealand has witnessed significant changes in land use in recent years. In the last 25 years, 4 million hectares of farmland has moved to other uses (Statistics New Zealand 2015a). Plantation forestry area increased by 450,000 hectares net over the same time period, although this masks significant deforestation of 100,000 hectares during 2003-15.4 Cropping and horticulture has doubled in area while cities, towns and other settlements have expanded by almost 3,000 hectares. Major changes have occurred at the farm level too as sheep and beef cattle have made way for dairy farming. As shown in Figure 9, land use for forestry has increased whilst land use for agriculture has decreased in recent years.
4 Deforestation is highly sensitive to emissions prices. A survey of large-plantation owners suggests that deforestation decreases at a emissions price of about $7/tonne and is likely to stop almost completely once the emissions price reach $15/tonne (Manley 2016). As of February 2017, prices in the NZ ETS were about NZ$18/tonne (CommTrade Carbon 2017).
14.1
9.0
4.32.1
4.7
14.2Dairy
Meat and wool
Horticulture and crops
Other ag. and food products
Forest products
Other goods
Merchandise exports ($New Zealand billion)
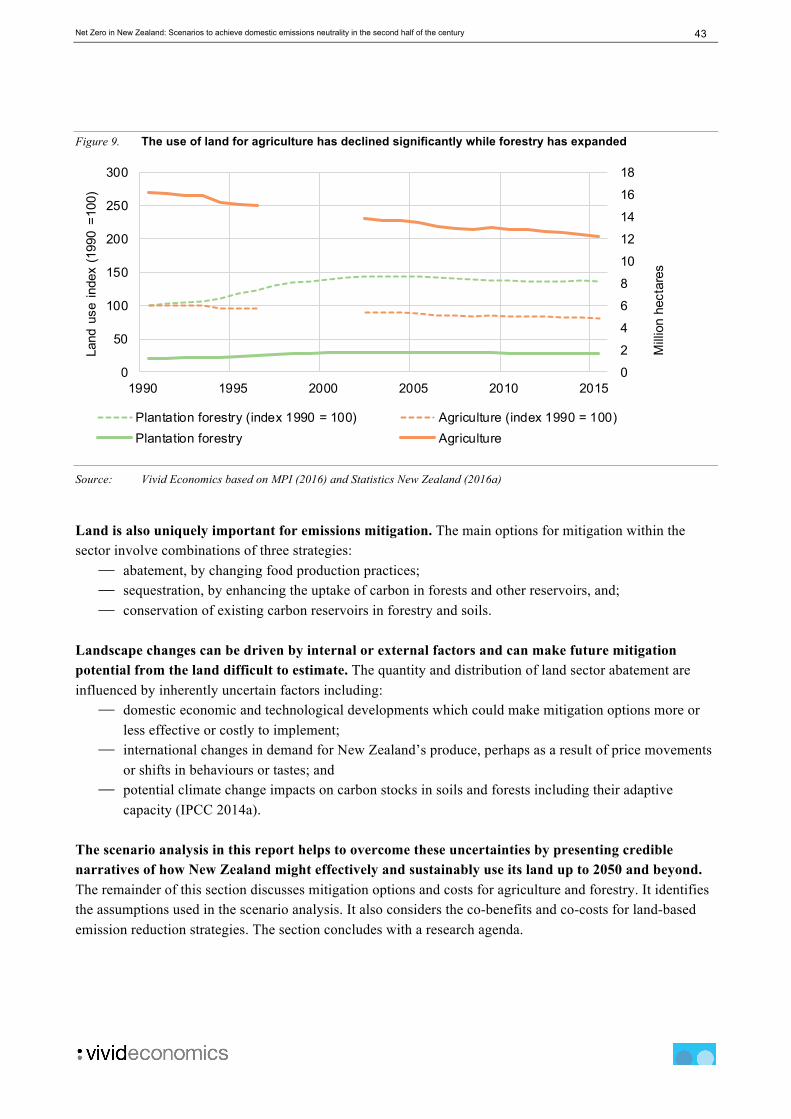
43 Net Zero in New Zealand: Scenarios to achieve domestic emissions neutrality in the second half of the century
Figure 9. The use of land for agriculture has declined significantly while forestry has expanded
Source: Vivid Economics based on MPI (2016) and Statistics New Zealand (2016a)
Land is also uniquely important for emissions mitigation. The main options for mitigation within the sector involve combinations of three strategies:
⎯ abatement, by changing food production practices; ⎯ sequestration, by enhancing the uptake of carbon in forests and other reservoirs, and; ⎯ conservation of existing carbon reservoirs in forestry and soils.
Landscape changes can be driven by internal or external factors and can make future mitigation potential from the land difficult to estimate. The quantity and distribution of land sector abatement are influenced by inherently uncertain factors including:
⎯ domestic economic and technological developments which could make mitigation options more or less effective or costly to implement;
⎯ international changes in demand for New Zealand’s produce, perhaps as a result of price movements or shifts in behaviours or tastes; and
⎯ potential climate change impacts on carbon stocks in soils and forests including their adaptive capacity (IPCC 2014a).
The scenario analysis in this report helps to overcome these uncertainties by presenting credible narratives of how New Zealand might effectively and sustainably use its land up to 2050 and beyond. The remainder of this section discusses mitigation options and costs for agriculture and forestry. It identifies the assumptions used in the scenario analysis. It also considers the co-benefits and co-costs for land-based emission reduction strategies. The section concludes with a research agenda.
0
2
4
6
8
10
12
14
16
18
0
50
100
150
200
250
300
1990 1995 2000 2005 2010 2015
Mill
ion
hect
ares
Land
use
inde
x (1
990
=100
)
Plantation forestry (index 1990 = 100) Agriculture (index 1990 = 100)Plantation forestry Agriculture
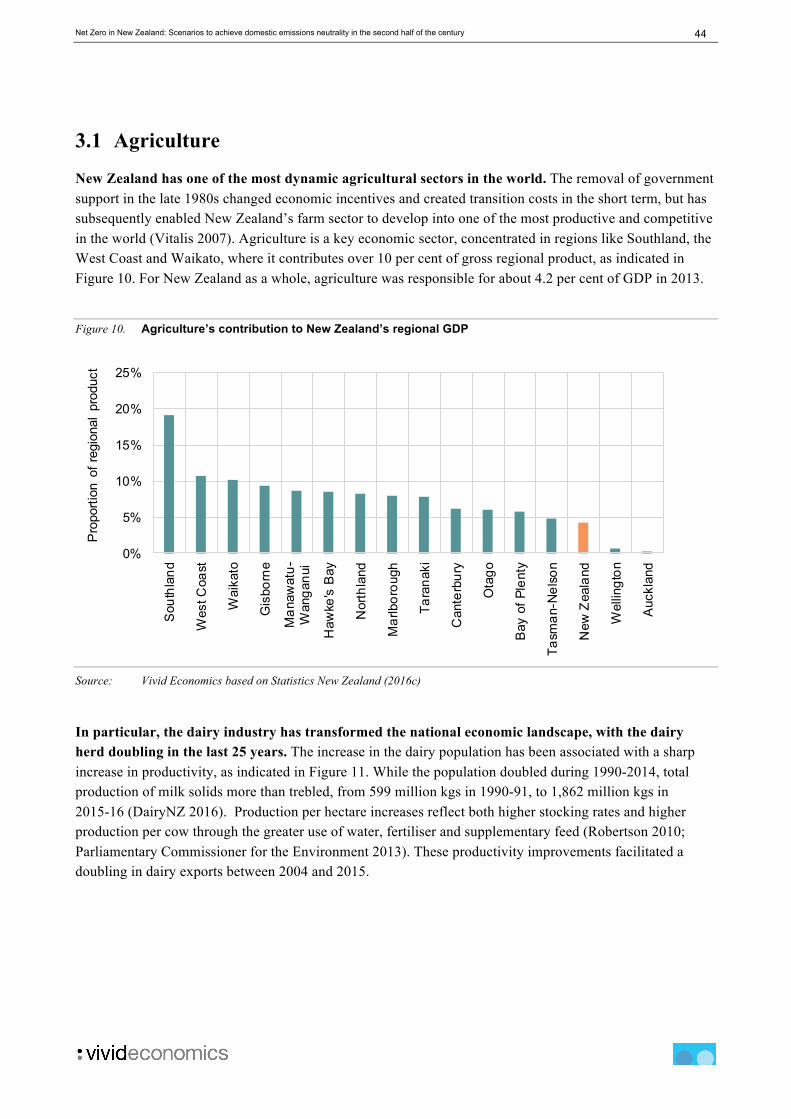
44 Net Zero in New Zealand: Scenarios to achieve domestic emissions neutrality in the second half of the century
3.1 Agriculture
New Zealand has one of the most dynamic agricultural sectors in the world. The removal of government support in the late 1980s changed economic incentives and created transition costs in the short term, but has subsequently enabled New Zealand’s farm sector to develop into one of the most productive and competitive in the world (Vitalis 2007). Agriculture is a key economic sector, concentrated in regions like Southland, the West Coast and Waikato, where it contributes over 10 per cent of gross regional product, as indicated in Figure 10. For New Zealand as a whole, agriculture was responsible for about 4.2 per cent of GDP in 2013.
Figure 10. Agriculture’s contribution to New Zealand’s regional GDP
Source: Vivid Economics based on Statistics New Zealand (2016c)
In particular, the dairy industry has transformed the national economic landscape, with the dairy herd doubling in the last 25 years. The increase in the dairy population has been associated with a sharp increase in productivity, as indicated in Figure 11. While the population doubled during 1990-2014, total production of milk solids more than trebled, from 599 million kgs in 1990-91, to 1,862 million kgs in 2015-16 (DairyNZ 2016). Production per hectare increases reflect both higher stocking rates and higher production per cow through the greater use of water, fertiliser and supplementary feed (Robertson 2010; Parliamentary Commissioner for the Environment 2013). These productivity improvements facilitated a doubling in dairy exports between 2004 and 2015.
0%
5%
10%
15%
20%
25%
Sou
thla
nd
Wes
t Coa
st
Wai
kato
Gis
born
e
Man
awat
u-W
anga
nui
Haw
ke's
Bay
Nor
thla
nd
Mar
lbor
ough
Tara
naki
Can
terb
ury
Ota
go
Bay
of P
lent
y
Tasm
an-N
elso
n
New
Zea
land
Wel
lingt
on
Auc
klan
d
Pro
porti
on o
f reg
iona
l pr
oduc
t
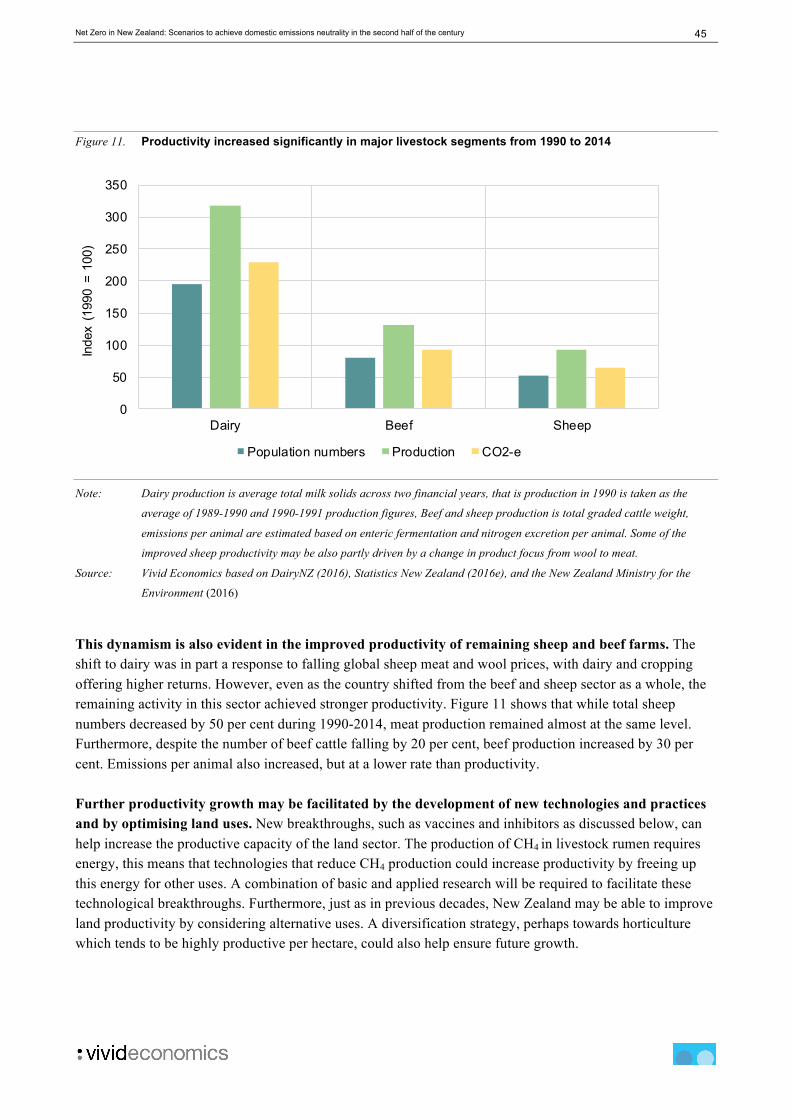
45 Net Zero in New Zealand: Scenarios to achieve domestic emissions neutrality in the second half of the century
Figure 11. Productivity increased significantly in major livestock segments from 1990 to 2014
Note: Dairy production is average total milk solids across two financial years, that is production in 1990 is taken as the
average of 1989-1990 and 1990-1991 production figures, Beef and sheep production is total graded cattle weight,
emissions per animal are estimated based on enteric fermentation and nitrogen excretion per animal. Some of the
improved sheep productivity may be also partly driven by a change in product focus from wool to meat.
Source: Vivid Economics based on DairyNZ (2016), Statistics New Zealand (2016e), and the New Zealand Ministry for the
Environment (2016)
This dynamism is also evident in the improved productivity of remaining sheep and beef farms. The shift to dairy was in part a response to falling global sheep meat and wool prices, with dairy and cropping offering higher returns. However, even as the country shifted from the beef and sheep sector as a whole, the remaining activity in this sector achieved stronger productivity. Figure 11 shows that while total sheep numbers decreased by 50 per cent during 1990-2014, meat production remained almost at the same level. Furthermore, despite the number of beef cattle falling by 20 per cent, beef production increased by 30 per cent. Emissions per animal also increased, but at a lower rate than productivity. Further productivity growth may be facilitated by the development of new technologies and practices and by optimising land uses. New breakthroughs, such as vaccines and inhibitors as discussed below, can help increase the productive capacity of the land sector. The production of CH4 in livestock rumen requires energy, this means that technologies that reduce CH4 production could increase productivity by freeing up this energy for other uses. A combination of basic and applied research will be required to facilitate these technological breakthroughs. Furthermore, just as in previous decades, New Zealand may be able to improve land productivity by considering alternative uses. A diversification strategy, perhaps towards horticulture which tends to be highly productive per hectare, could also help ensure future growth.
0
50
100
150
200
250
300
350
Dairy Beef Sheep
Inde
x (1
990
= 10
0)
Population numbers Production CO2-e
46 Net Zero in New Zealand: Scenarios to achieve domestic emissions neutrality in the second half of the century
However, the increases in the productivity of New Zealand’s farmers and the profitability of its farming sector are associated with costs greater than those suggested by market values. Most obvious in recent years has been the impact of agriculture on water quality: nitrogen leaching increased by almost 30 per cent from 1990 to 2012 (Statistics New Zealand 2015b). It has also led to a 14 per cent increase in agricultural GHG emissions during 1990-2014 (MfE 2016), principally as a result of:
- CH4 (methane) rising by 7 per cent during this time. This has a significantly stronger warming potential than CO2 in the short term. It is principally released as a result of enteric fermentation, which occurs as part of the digestive process within ruminant animals such as cattle and sheep.
- N2O (nitrous oxide) rising by 21 per cent. This is a particularly potent GHG which accumulates in the atmosphere and which is responsible for approximately 16 per cent of New Zealand’s net GHG emissions. A significant driver of increased N2O emissions is the increased use of biological and synthetic fertilisers on dairy pastures.
The farming sector has succeeded in reducing the emissions intensity of production significantly over the past few decades. Using a fixed apportionment of emissions from fertiliser to the main livestock (75 per cent to dairy, 10 per cent to beef, 10 per cent to sheep and 5 per cent to others), Reisinger et al (2016) suggest that emissions intensities have dropped substantially since 1990 and that the trend has improved further in recent years. Overall, from 1990 to 2012, emissions intensities declined by 0.8, 1.1 and 1.0 per cent per annum for dairy, beef and sheep respectively. This analysis was based on emissions per litres of fat- and protein-corrected milk, beef (growing animals plus cull beef and dairy cows) and total sheep meat slaughtered (lambs plus cull ewes), and excludes energy use and off-farm emissions. In 2014, emissions intensities in each livestock category were about 30 per cent below 1990 levels. While productivity gains have ensured that emissions have not risen at the same rate as output, current levels and projected future trends in emissions are inconsistent with net zero emissions pathways. Without the productivity gains that have been achieved since 1990, biological emissions from agriculture today could have been up to 40 per cent higher than they are today (Parliamentary Commissioner for the Environment 2016). However, total emissions from agriculture nonetheless increased by 14 per cent from 1990 to stand at 39.6 MtCO2-e per year in 2014, nearly all of which is associated with livestock farming (MfE 2016). Continued trends suggest that emissions could:
⎯ range from 42.1 to 44.3 MtCO2-e per year in 2030, or 22-29 per cent above 1990 levels; ⎯ rise to between 45.5 and 51.2 MtCO2-e per year in 2050, representing a 32-49 per cent increase on
1990 levels (Sims et al. 2016).
3.1.1 Mitigation assumptions and costs
In general, mitigation options fall into two main categories: constraining the growth in animal numbers/production, and decreasing the emissions intensity of production. However, in at least some cases, improving emissions intensity will be associated with a broader improvement in productivity (output per unit of input). This increased productivity in turn increases the profitability of agricultural production, potentially creating an incentive to increase output, and hence emissions. This rebound effect can offset some or all of the initial reduction in emissions brought about by intensity improvements.
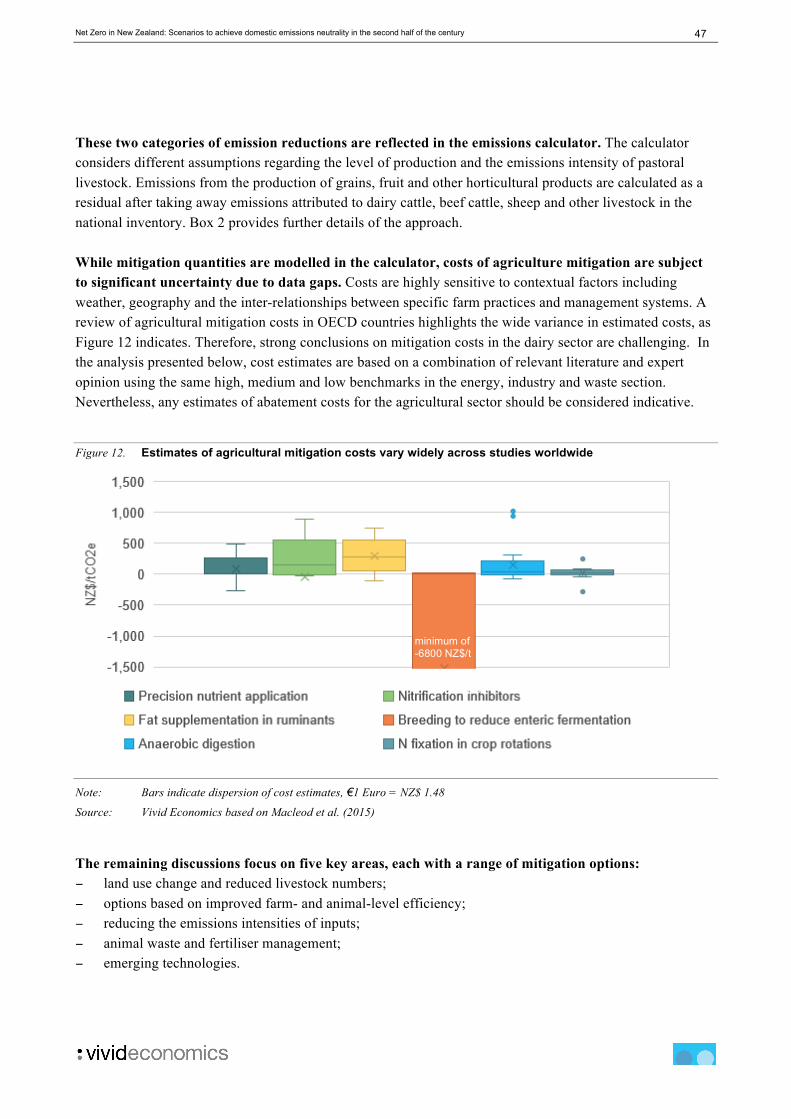
47 Net Zero in New Zealand: Scenarios to achieve domestic emissions neutrality in the second half of the century
These two categories of emission reductions are reflected in the emissions calculator. The calculator considers different assumptions regarding the level of production and the emissions intensity of pastoral livestock. Emissions from the production of grains, fruit and other horticultural products are calculated as a residual after taking away emissions attributed to dairy cattle, beef cattle, sheep and other livestock in the national inventory. Box 2 provides further details of the approach. While mitigation quantities are modelled in the calculator, costs of agriculture mitigation are subject to significant uncertainty due to data gaps. Costs are highly sensitive to contextual factors including weather, geography and the inter-relationships between specific farm practices and management systems. A review of agricultural mitigation costs in OECD countries highlights the wide variance in estimated costs, as Figure 12 indicates. Therefore, strong conclusions on mitigation costs in the dairy sector are challenging. In the analysis presented below, cost estimates are based on a combination of relevant literature and expert opinion using the same high, medium and low benchmarks in the energy, industry and waste section. Nevertheless, any estimates of abatement costs for the agricultural sector should be considered indicative.
Figure 12. Estimates of agricultural mitigation costs vary widely across studies worldwide
Note: Bars indicate dispersion of cost estimates, €1 Euro = NZ$ 1.48
Source: Vivid Economics based on Macleod et al. (2015)
The remaining discussions focus on five key areas, each with a range of mitigation options: − land use change and reduced livestock numbers; − options based on improved farm- and animal-level efficiency; − reducing the emissions intensities of inputs; − animal waste and fertiliser management; − emerging technologies.
minimum of -6800 NZD/t
minimum of -6800 NZ$/t
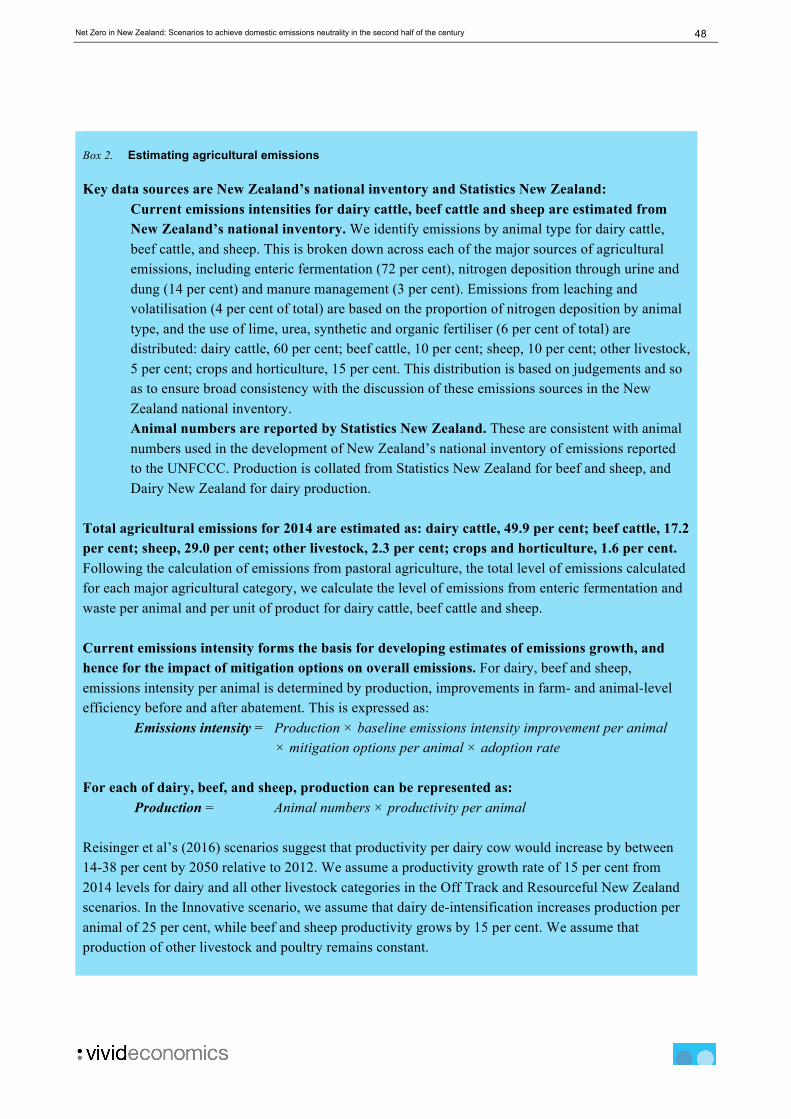
48 Net Zero in New Zealand: Scenarios to achieve domestic emissions neutrality in the second half of the century
Box 2. Estimating agricultural emissions
Key data sources are New Zealand’s national inventory and Statistics New Zealand: Current emissions intensities for dairy cattle, beef cattle and sheep are estimated from New Zealand’s national inventory. We identify emissions by animal type for dairy cattle, beef cattle, and sheep. This is broken down across each of the major sources of agricultural emissions, including enteric fermentation (72 per cent), nitrogen deposition through urine and dung (14 per cent) and manure management (3 per cent). Emissions from leaching and volatilisation (4 per cent of total) are based on the proportion of nitrogen deposition by animal type, and the use of lime, urea, synthetic and organic fertiliser (6 per cent of total) are distributed: dairy cattle, 60 per cent; beef cattle, 10 per cent; sheep, 10 per cent; other livestock, 5 per cent; crops and horticulture, 15 per cent. This distribution is based on judgements and so as to ensure broad consistency with the discussion of these emissions sources in the New Zealand national inventory. Animal numbers are reported by Statistics New Zealand. These are consistent with animal numbers used in the development of New Zealand’s national inventory of emissions reported to the UNFCCC. Production is collated from Statistics New Zealand for beef and sheep, and Dairy New Zealand for dairy production.
Total agricultural emissions for 2014 are estimated as: dairy cattle, 49.9 per cent; beef cattle, 17.2 per cent; sheep, 29.0 per cent; other livestock, 2.3 per cent; crops and horticulture, 1.6 per cent. Following the calculation of emissions from pastoral agriculture, the total level of emissions calculated for each major agricultural category, we calculate the level of emissions from enteric fermentation and waste per animal and per unit of product for dairy cattle, beef cattle and sheep. Current emissions intensity forms the basis for developing estimates of emissions growth, and hence for the impact of mitigation options on overall emissions. For dairy, beef and sheep, emissions intensity per animal is determined by production, improvements in farm- and animal-level efficiency before and after abatement. This is expressed as:
Emissions intensity = Production × baseline emissions intensity improvement per animal × mitigation options per animal × adoption rate
For each of dairy, beef, and sheep, production can be represented as:
Production = Animal numbers × productivity per animal Reisinger et al’s (2016) scenarios suggest that productivity per dairy cow would increase by between 14-38 per cent by 2050 relative to 2012. We assume a productivity growth rate of 15 per cent from 2014 levels for dairy and all other livestock categories in the Off Track and Resourceful New Zealand scenarios. In the Innovative scenario, we assume that dairy de-intensification increases production per animal of 25 per cent, while beef and sheep productivity grows by 15 per cent. We assume that production of other livestock and poultry remains constant.
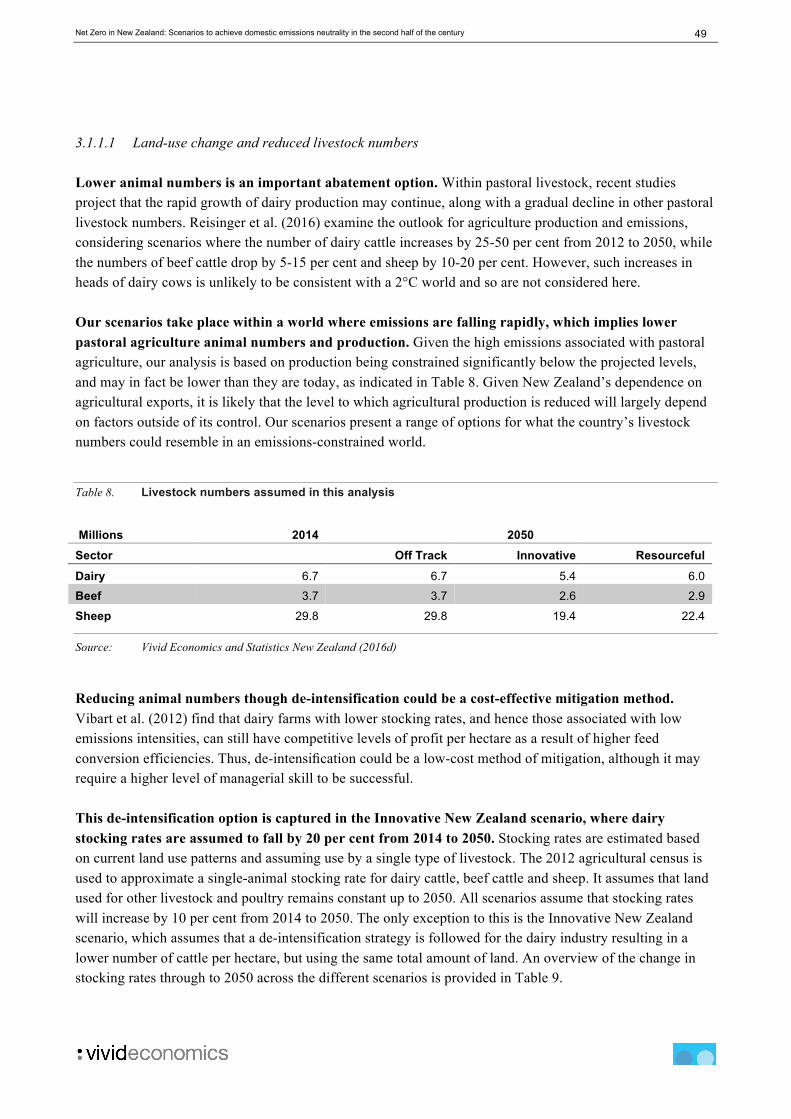
49 Net Zero in New Zealand: Scenarios to achieve domestic emissions neutrality in the second half of the century
3.1.1.1 Land-use change and reduced livestock numbers Lower animal numbers is an important abatement option. Within pastoral livestock, recent studies project that the rapid growth of dairy production may continue, along with a gradual decline in other pastoral livestock numbers. Reisinger et al. (2016) examine the outlook for agriculture production and emissions, considering scenarios where the number of dairy cattle increases by 25-50 per cent from 2012 to 2050, while the numbers of beef cattle drop by 5-15 per cent and sheep by 10-20 per cent. However, such increases in heads of dairy cows is unlikely to be consistent with a 2°C world and so are not considered here. Our scenarios take place within a world where emissions are falling rapidly, which implies lower pastoral agriculture animal numbers and production. Given the high emissions associated with pastoral agriculture, our analysis is based on production being constrained significantly below the projected levels, and may in fact be lower than they are today, as indicated in Table 8. Given New Zealand’s dependence on agricultural exports, it is likely that the level to which agricultural production is reduced will largely depend on factors outside of its control. Our scenarios present a range of options for what the country’s livestock numbers could resemble in an emissions-constrained world.
Table 8. Livestock numbers assumed in this analysis
Millions 2014 2050 Sector Off Track Innovative Resourceful
Dairy 6.7 6.7 5.4 6.0
Beef 3.7 3.7 2.6 2.9
Sheep 29.8 29.8 19.4 22.4
Source: Vivid Economics and Statistics New Zealand (2016d)
Reducing animal numbers though de-intensification could be a cost-effective mitigation method. Vibart et al. (2012) find that dairy farms with lower stocking rates, and hence those associated with low emissions intensities, can still have competitive levels of profit per hectare as a result of higher feed conversion efficiencies. Thus, de-intensification could be a low-cost method of mitigation, although it may require a higher level of managerial skill to be successful. This de-intensification option is captured in the Innovative New Zealand scenario, where dairy stocking rates are assumed to fall by 20 per cent from 2014 to 2050. Stocking rates are estimated based on current land use patterns and assuming use by a single type of livestock. The 2012 agricultural census is used to approximate a single-animal stocking rate for dairy cattle, beef cattle and sheep. It assumes that land used for other livestock and poultry remains constant up to 2050. All scenarios assume that stocking rates will increase by 10 per cent from 2014 to 2050. The only exception to this is the Innovative New Zealand scenario, which assumes that a de-intensification strategy is followed for the dairy industry resulting in a lower number of cattle per hectare, but using the same total amount of land. An overview of the change in stocking rates through to 2050 across the different scenarios is provided in Table 9.
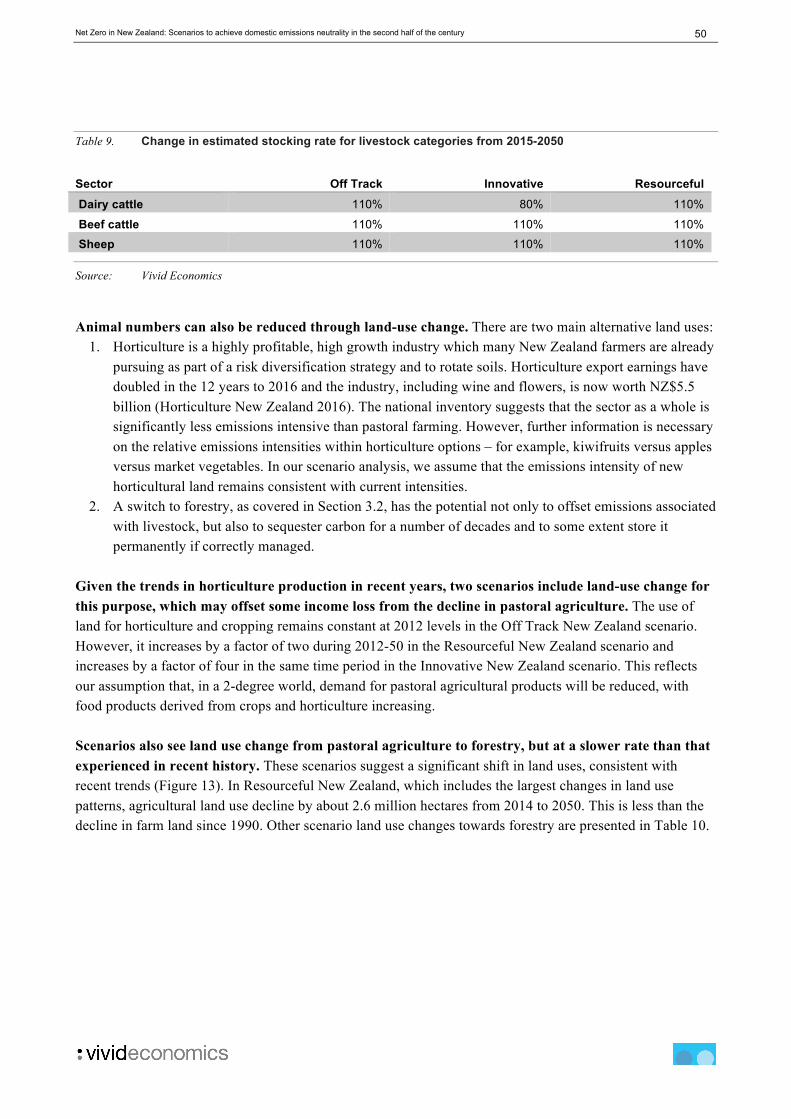
50 Net Zero in New Zealand: Scenarios to achieve domestic emissions neutrality in the second half of the century
Table 9. Change in estimated stocking rate for livestock categories from 2015-2050
Sector Off Track Innovative Resourceful Dairy cattle 110% 80% 110%
Beef cattle 110% 110% 110%
Sheep 110% 110% 110%
Source: Vivid Economics
Animal numbers can also be reduced through land-use change. There are two main alternative land uses: 1. Horticulture is a highly profitable, high growth industry which many New Zealand farmers are already
pursuing as part of a risk diversification strategy and to rotate soils. Horticulture export earnings have doubled in the 12 years to 2016 and the industry, including wine and flowers, is now worth NZ$5.5 billion (Horticulture New Zealand 2016). The national inventory suggests that the sector as a whole is significantly less emissions intensive than pastoral farming. However, further information is necessary on the relative emissions intensities within horticulture options – for example, kiwifruits versus apples versus market vegetables. In our scenario analysis, we assume that the emissions intensity of new horticultural land remains consistent with current intensities.
2. A switch to forestry, as covered in Section 3.2, has the potential not only to offset emissions associated with livestock, but also to sequester carbon for a number of decades and to some extent store it permanently if correctly managed.
Given the trends in horticulture production in recent years, two scenarios include land-use change for this purpose, which may offset some income loss from the decline in pastoral agriculture. The use of land for horticulture and cropping remains constant at 2012 levels in the Off Track New Zealand scenario. However, it increases by a factor of two during 2012-50 in the Resourceful New Zealand scenario and increases by a factor of four in the same time period in the Innovative New Zealand scenario. This reflects our assumption that, in a 2-degree world, demand for pastoral agricultural products will be reduced, with food products derived from crops and horticulture increasing. Scenarios also see land use change from pastoral agriculture to forestry, but at a slower rate than that experienced in recent history. These scenarios suggest a significant shift in land uses, consistent with recent trends (Figure 13). In Resourceful New Zealand, which includes the largest changes in land use patterns, agricultural land use decline by about 2.6 million hectares from 2014 to 2050. This is less than the decline in farm land since 1990. Other scenario land use changes towards forestry are presented in Table 10.

51 Net Zero in New Zealand: Scenarios to achieve domestic emissions neutrality in the second half of the century
Table 10. Scenario land use changes towards forestry are more modest than recent history
1990-2014 2014-50 Million hectares Actual Off Track Innovative Resourceful
Farmland -3.8 -0.9 -1.8 -2.6
Plantation forests 0.5 0.4 1.1 1.5
Natural reversion NA 0.0 0.4 0.7
Source: Vivid Economics, using Statistics New Zealand (2016b) and MPI (2016)
Figure 13. Agriculture and plantation forest land use by scenario
Source: Vivid Economics, using Statistics New Zealand (2016b) and MPI (2016)
3.1.1.2 Options based on improved farm- and animal- level efficiency There are three mitigation options based on improved management practices: accelerated efficiency, precision agriculture and selective breeding. There are further baseline productivity improvements per animal which are included as an assumption in the scenarios but are not considered as a mitigation option. The accelerated efficiency option focusses on improving the performance of the least emissions efficient farms. New Zealand farms vary widely in their biological emissions, with the highest emitters producing around twice as much CH4 per hectare and three times as much N2O per hectare as the lowest-emitting farms (Reisinger et al. 2016). While this variance partly reflects the variety of soils, climate, farm size, and farm type, the way a farm is managed can also be influential. There is evidence to suggest that average farm emissions intensity could decrease by 15 per cent through enhancing the performance of the lowest performing farms. Applying management practices that are already in commercial use, improvements in nitrogen-use efficiency may reduce nitrogen leaching by up to 30 per cent, and agricultural emissions
0
2
4
6
8
10
12
14
16
18
1990 2000 2010 2020 2030 2040 2050
Mill
ion
hect
ares
Plantation forestry Off track NZ Innovative NZ Resourceful NZAgriculture Off track NZ Innovative NZ Resourceful NZ

52 Net Zero in New Zealand: Scenarios to achieve domestic emissions neutrality in the second half of the century
intensity by up to 15 per cent. Thus, this option could help continue the trend towards lower GHG-intensive dairy products and may even accelerate it. However, in terms of costs, there may be a general negative relationship between emissions intensity and farm profit, although the nature of the relationship is context-specific (Anastasiadis & Kerr 2013).
Precision farming is a growing area of research which involves using new on-farm technology to optimise farm inputs such as fertilisers. Such techniques can be beneficial on fields where yield varies according to a predictable pattern due to differences in soil quality, weed infestation or drainage, with abatement estimates at the farm level ranging by 15-35 per cent in the US (Macleod et al. 2015). The financial benefits from precision farming can include reduced fertiliser and agrochemical use, reduced fossil fuel use, higher yield and improved land productivity. International estimates for the net benefits can be up to NZ$150/ha, although with a wide range (Macleod et al. 2015). In New Zealand, several case studies indicate that this technique could by highly cost-effective at a farm level and thus that abatement costs could be low or even negative (Yule et al. 2013). Accelerated efficiency and precision farming have the same impact in all scenarios. As highlighted in Table 11, these options could together provide significant source of abatement, in particular those that reduce the use of fertiliser and incorporate better management of manure and animal excretion. Our analysis assumes that the take-up rate of these improved practices is higher in the dairy industry, as their greater production intensity makes implementing capital intensive interventions more cost effective.
Table 11. Accelerated efficiency and precision agriculture reduce agricultural waste emissions
Dairy Beef Sheep Impact on total emissions per animal
-10% -10% -10%
Adoption rate 100% 30% 30%
Source: Vivid Economics
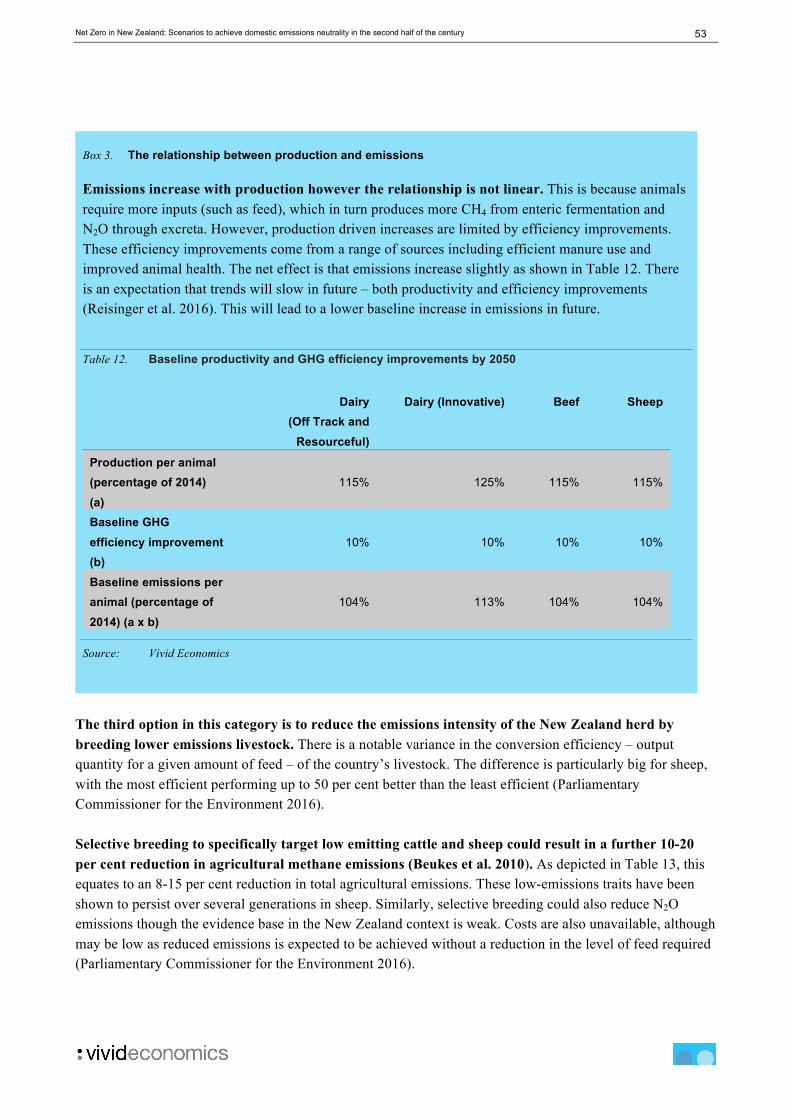
53 Net Zero in New Zealand: Scenarios to achieve domestic emissions neutrality in the second half of the century
Box 3. The relationship between production and emissions
Emissions increase with production however the relationship is not linear. This is because animals require more inputs (such as feed), which in turn produces more CH4 from enteric fermentation and N2O through excreta. However, production driven increases are limited by efficiency improvements. These efficiency improvements come from a range of sources including efficient manure use and improved animal health. The net effect is that emissions increase slightly as shown in Table 12. There is an expectation that trends will slow in future – both productivity and efficiency improvements (Reisinger et al. 2016). This will lead to a lower baseline increase in emissions in future.
Table 12. Baseline productivity and GHG efficiency improvements by 2050
Dairy (Off Track and
Resourceful)
Dairy (Innovative) Beef Sheep
Production per animal (percentage of 2014) (a)
115% 125% 115% 115%
Baseline GHG efficiency improvement (b)
10% 10% 10% 10%
Baseline emissions per animal (percentage of 2014) (a x b)
104% 113% 104% 104%
Source: Vivid Economics
The third option in this category is to reduce the emissions intensity of the New Zealand herd by breeding lower emissions livestock. There is a notable variance in the conversion efficiency – output quantity for a given amount of feed – of the country’s livestock. The difference is particularly big for sheep, with the most efficient performing up to 50 per cent better than the least efficient (Parliamentary Commissioner for the Environment 2016). Selective breeding to specifically target low emitting cattle and sheep could result in a further 10-20 per cent reduction in agricultural methane emissions (Beukes et al. 2010). As depicted in Table 13, this equates to an 8-15 per cent reduction in total agricultural emissions. These low-emissions traits have been shown to persist over several generations in sheep. Similarly, selective breeding could also reduce N2O emissions though the evidence base in the New Zealand context is weak. Costs are also unavailable, although may be low as reduced emissions is expected to be achieved without a reduction in the level of feed required (Parliamentary Commissioner for the Environment 2016).
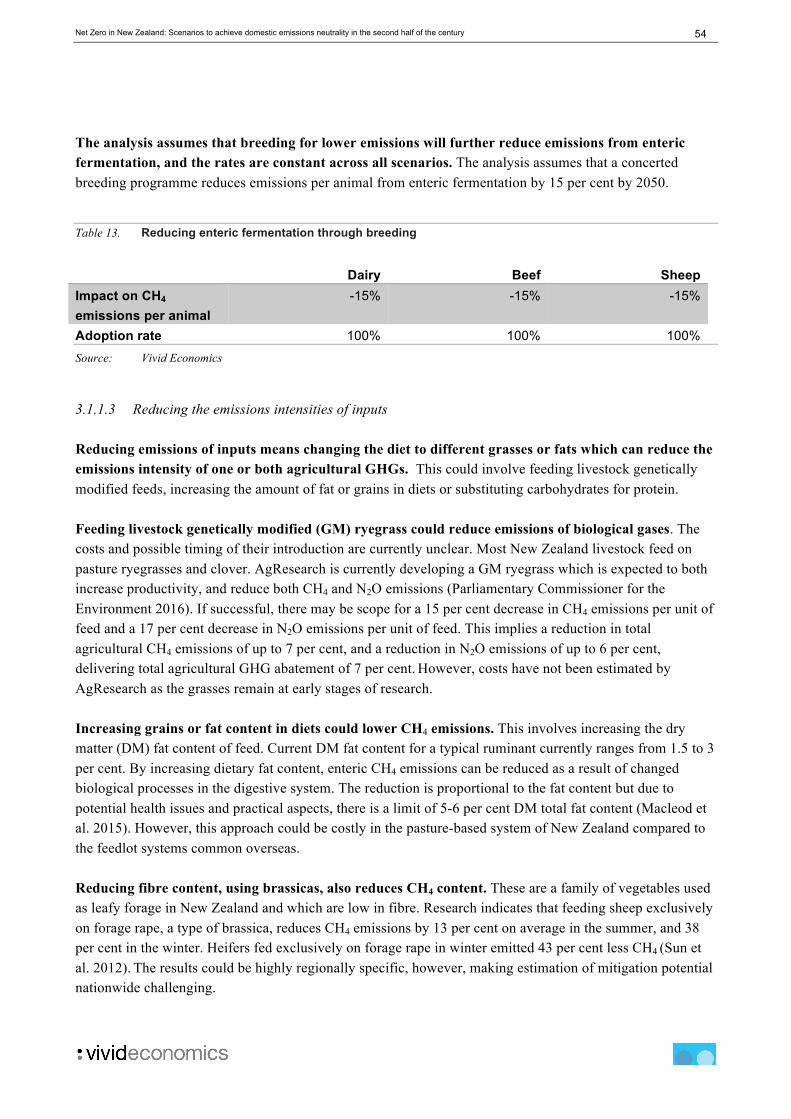
54 Net Zero in New Zealand: Scenarios to achieve domestic emissions neutrality in the second half of the century
The analysis assumes that breeding for lower emissions will further reduce emissions from enteric fermentation, and the rates are constant across all scenarios. The analysis assumes that a concerted breeding programme reduces emissions per animal from enteric fermentation by 15 per cent by 2050.
Table 13. Reducing enteric fermentation through breeding
Dairy Beef Sheep Impact on CH4 emissions per animal
-15% -15% -15%
Adoption rate 100% 100% 100% Source: Vivid Economics
3.1.1.3 Reducing the emissions intensities of inputs Reducing emissions of inputs means changing the diet to different grasses or fats which can reduce the emissions intensity of one or both agricultural GHGs. This could involve feeding livestock genetically modified feeds, increasing the amount of fat or grains in diets or substituting carbohydrates for protein. Feeding livestock genetically modified (GM) ryegrass could reduce emissions of biological gases. The costs and possible timing of their introduction are currently unclear. Most New Zealand livestock feed on pasture ryegrasses and clover. AgResearch is currently developing a GM ryegrass which is expected to both increase productivity, and reduce both CH4 and N2O emissions (Parliamentary Commissioner for the Environment 2016). If successful, there may be scope for a 15 per cent decrease in CH4 emissions per unit of feed and a 17 per cent decrease in N2O emissions per unit of feed. This implies a reduction in total agricultural CH4 emissions of up to 7 per cent, and a reduction in N2O emissions of up to 6 per cent, delivering total agricultural GHG abatement of 7 per cent. However, costs have not been estimated by AgResearch as the grasses remain at early stages of research. Increasing grains or fat content in diets could lower CH4 emissions. This involves increasing the dry matter (DM) fat content of feed. Current DM fat content for a typical ruminant currently ranges from 1.5 to 3 per cent. By increasing dietary fat content, enteric CH4 emissions can be reduced as a result of changed biological processes in the digestive system. The reduction is proportional to the fat content but due to potential health issues and practical aspects, there is a limit of 5-6 per cent DM total fat content (Macleod et al. 2015). However, this approach could be costly in the pasture-based system of New Zealand compared to the feedlot systems common overseas. Reducing fibre content, using brassicas, also reduces CH4 content. These are a family of vegetables used as leafy forage in New Zealand and which are low in fibre. Research indicates that feeding sheep exclusively on forage rape, a type of brassica, reduces CH4 emissions by 13 per cent on average in the summer, and 38 per cent in the winter. Heifers fed exclusively on forage rape in winter emitted 43 per cent less CH4 (Sun et al. 2012). The results could be highly regionally specific, however, making estimation of mitigation potential nationwide challenging.
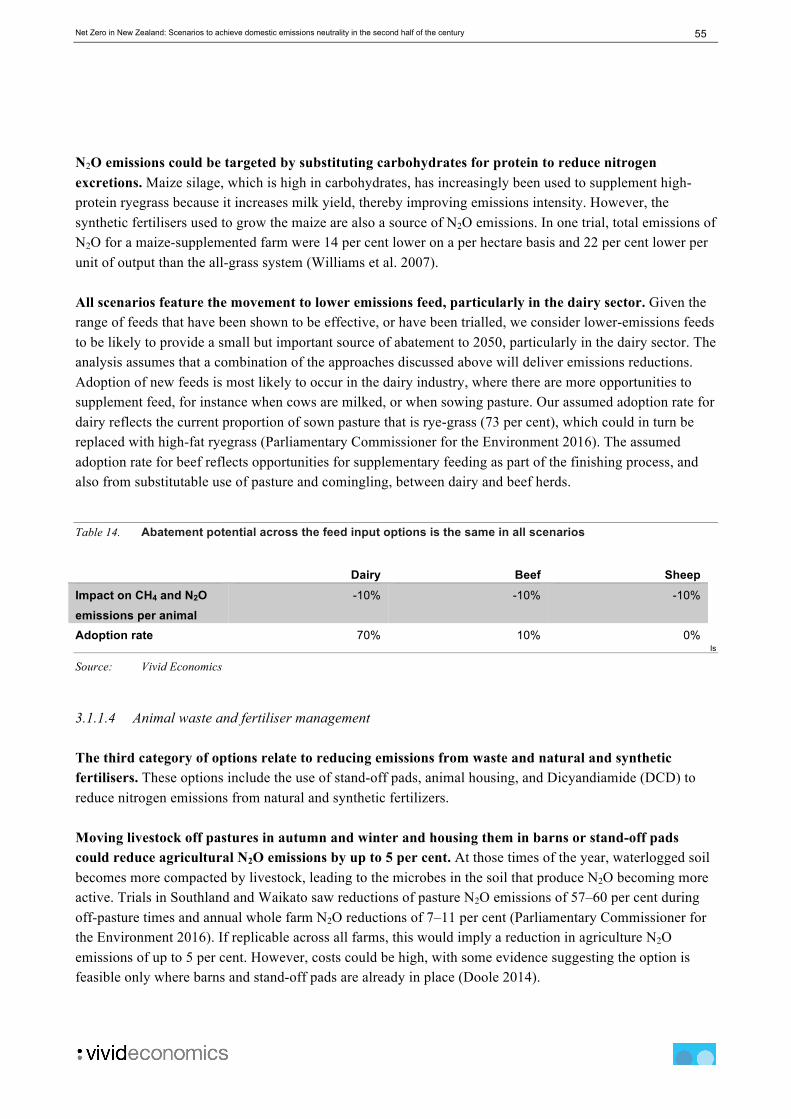
55 Net Zero in New Zealand: Scenarios to achieve domestic emissions neutrality in the second half of the century
N2O emissions could be targeted by substituting carbohydrates for protein to reduce nitrogen excretions. Maize silage, which is high in carbohydrates, has increasingly been used to supplement high-protein ryegrass because it increases milk yield, thereby improving emissions intensity. However, the synthetic fertilisers used to grow the maize are also a source of N2O emissions. In one trial, total emissions of N2O for a maize-supplemented farm were 14 per cent lower on a per hectare basis and 22 per cent lower per unit of output than the all-grass system (Williams et al. 2007). All scenarios feature the movement to lower emissions feed, particularly in the dairy sector. Given the range of feeds that have been shown to be effective, or have been trialled, we consider lower-emissions feeds to be likely to provide a small but important source of abatement to 2050, particularly in the dairy sector. The analysis assumes that a combination of the approaches discussed above will deliver emissions reductions. Adoption of new feeds is most likely to occur in the dairy industry, where there are more opportunities to supplement feed, for instance when cows are milked, or when sowing pasture. Our assumed adoption rate for dairy reflects the current proportion of sown pasture that is rye-grass (73 per cent), which could in turn be replaced with high-fat ryegrass (Parliamentary Commissioner for the Environment 2016). The assumed adoption rate for beef reflects opportunities for supplementary feeding as part of the finishing process, and also from substitutable use of pasture and comingling, between dairy and beef herds.
Table 14. Abatement potential across the feed input options is the same in all scenarios
Dairy Beef Sheep Impact on CH4 and N2O emissions per animal
-10% -10% -10%
Adoption rate 70% 10% 0% Is
Source: Vivid Economics
3.1.1.4 Animal waste and fertiliser management The third category of options relate to reducing emissions from waste and natural and synthetic fertilisers. These options include the use of stand-off pads, animal housing, and Dicyandiamide (DCD) to reduce nitrogen emissions from natural and synthetic fertilizers. Moving livestock off pastures in autumn and winter and housing them in barns or stand-off pads could reduce agricultural N2O emissions by up to 5 per cent. At those times of the year, waterlogged soil becomes more compacted by livestock, leading to the microbes in the soil that produce N2O becoming more active. Trials in Southland and Waikato saw reductions of pasture N2O emissions of 57–60 per cent during off-pasture times and annual whole farm N2O reductions of 7–11 per cent (Parliamentary Commissioner for the Environment 2016). If replicable across all farms, this would imply a reduction in agriculture N2O emissions of up to 5 per cent. However, costs could be high, with some evidence suggesting the option is feasible only where barns and stand-off pads are already in place (Doole 2014).
56 Net Zero in New Zealand: Scenarios to achieve domestic emissions neutrality in the second half of the century
Animal housing also provides the opportunity to reduce manure emissions and to optimise the use of manure as fertiliser. Mitigation from enhanced waste management is maximised when:
- manure is stored in anaerobic ponds, and the associated CH4 is captured and flared. This would prevent potentially substantial increases in the amount of manure collected and stored on farms from leading to an increase in CH4 emissions from manure management, and
- farmers choose the timing of manure spreading to minimise N2O emissions. This is because the uptake of nitrogen in pasture is higher at certain times of year.
However, moving livestock off-pastures in significant numbers is unlikely to be a cost-effective option and so is not included in the scenario analysis. Currently, manure management accounts for only 2-3 per cent of overall emissions from agriculture. The option also implies a significant shift in farm systems where implemented. Taken together, the capital investment required for housing and advanced manure management that ensures full capture and flaring of anaerobic CH4 suggests a high cost per tonne of emissions abated (Reisinger et al. 2016). Costs could be reduced if biogas is used to generate electricity either for on-farm use or if fed back into the national grid. However, this would also require a significant investment. Finally, N2O emissions could be managed through the application of DCD, although its efficacy is uncertain. DCD is a nitrification inhibitor which decreases leaching from urea- and ammonium-based fertilisers and from urine patches in grazed pastures. The key benefit of DCD use is the reduction in nitrogen leaching and associated improvements in water quality. Its overall effectiveness is uncertain however, especially as it is driven by differences in temperature, soil moisture, urine rate, and the timing of fertiliser application. Four studies using the same methodology in different parts of the country reported reductions in N2O agriculture emissions ranging from 18 per cent to 82 per cent (Cameron 2015, Doole & Paragahawewa 2011). A more recent study suggests that N2O emissions reductions of up to 60 per cent per paddock treated could be a reasonable assumption in the long term (Reisinger et al. 2016). However, the high cost and potentially limited applicability suggests that overall abatement would be limited. There are several challenges associated with DCD as an option: − It has been withdrawn from the market following discovery of residues in milk. Re-introduction requires
international food safety organisations to certify an agreed level of residues as safe, and for export markets to deem them acceptable.
− It is high cost. DCD costs about NZ$250/ha, or about is NZ$650/tCO2e for an average dairy farm and may be prohibitively high for use on sheep and beef farms given the extensive nature of these farm systems (Reisinger et al. 2016).

57 Net Zero in New Zealand: Scenarios to achieve domestic emissions neutrality in the second half of the century
Table 15. Reducing N2O emissions through the use of DCD
Dairy Beef Sheep Impact on N2O emissions per animal
-20% -20% -20%
Adoption rate 40% 0% 0%
Source: Vivid Economics
Assuming that DCD is found to be safe for use, it is one of the few options available to effectively reduce N2O emissions. Each scenario assumes DCD is certified as safe for use and, despite its high cost, it is applied in some dairy farm systems. This implementation is pursued despite the high mitigation cost because the main driver for its use would be to reduce nitrogen leaching and improve water quality. While estimates of impact vary, a reasonable assumption would be a 20 per cent reduction in animal emissions intensity, but the analysis assumes that uptake is 40 per cent in the dairy industry only, per Reisinger et al. (2016) and as indicated in Table 15. 3.1.1.5 Emerging technologies Two emerging technologies hold the promise to significantly reduce emissions intensities by reducing the production of CH4. Inhibitors and vaccines are currently being researched, and while they are not expected to be available until the 2020s, they may have a larger impact on emissions than any other option. CH4 inhibitors could reduce emissions from enteric fermentation by up to 30 per cent per animal, without altering overall production. CH4 inhibitors work either by killing the methanogens within animals which creates the GHG or by depriving them of the hydrogen they need to produce it. In theory, a CH4 inhibitor could be administered to all the cattle and sheep in New Zealand. One trial in the US indicated a 30 per cent decrease in emissions from enteric fermentation, with no impact on animal productivity and no decline in effectiveness over a 12-week period (Hristova et al. 2015). Indeed, there was some indication in the trial that the spared CH4 energy may be partially used for tissue synthesis leading to an increase in production. Inhibitors have been a major focus of research in New Zealand, with more than 100,000 compounds recently tested for their efficacy, five of which are subject of more detailed evaluation
(AgResearch 2015). There are practical challenges which make introduction in New Zealand unlikely before the 2020s. In particular:
1. the US trial involved administering the CH4 inhibitor in feedlots; doing so in a pasture-based system would be more difficult.
2. even if it could be introduced in pasture based systems, uptake rates will be limited by the need to frequently administer the inhibitor.

58 Net Zero in New Zealand: Scenarios to achieve domestic emissions neutrality in the second half of the century
However, given the current state of research into inhibitors, Off Track New Zealand and Resourceful New Zealand assume that inhibitors will be available for commercial use by 2050, but they are only used in the dairy sector. A high take up rate for dairy is assumed based on the expectation that, by 2050, inhibitors have been developed to the stage that they are effective in New Zealand’s semi intensive- pasture based system. Dairy remains the most suitable candidate for the use of inhibitors as milking ensures regular contact with livestock. As a result, Off Track New Zealand and Resourceful New Zealand assume uptake rates of 80 per cent in dairy, and zero in beef and sheep. An overview of methane inhibitor use across the scenarios is provided in Table 16.
Table 16. Methane Inhibitors are introduced for dairy cattle in the Off Track and Resourceful scenarios, resulting in emissions reductions as below
Dairy Beef Sheep
Impact on CH4 emissions per animal
-20% -20% -20%
Adoption rate 80% 0% 0%
Source: Vivid Economics
The second emerging technology is vaccines which generate antibodies that suppress methanogens, the CH4-producing microorganisms. Research efforts principally remain in the laboratory stage, although trials on live sheep are underway. New Zealand-based researchers are aiming to produce a vaccine that would reduce emissions from enteric fermentation by at least 20 per cent without any productivity penalty. Development of a vaccine could have the single greatest impact on agricultural emissions and Innovative New Zealand includes the combined impact of inhibitors and vaccines on all livestock. If a vaccine is successfully developed and demonstrated, with the right policy support for dissemination, it could have a major impact on New Zealand’s agricultural emissions profile. The administration of vaccines does not require frequent contact with livestock and, as such, there is the potential for a vaccine to be adopted as standard practice across the livestock industry. In Innovative New Zealand, uptake of the two new technologies rises to 100 per cent in dairy and 90 per cent for beef and sheep as indicated in Table 17.
Table 17. Vaccines are used alongside inhibitors in the Innovative scenario only but result in significant emission intensity reductions
Dairy Beef Sheep
Impact on CH4 emissions per animal
-30% -20% -20%
Adoption rate 100% 90% 90%
Source: Vivid Economics

59 Net Zero in New Zealand: Scenarios to achieve domestic emissions neutrality in the second half of the century
The eventual timing and mitigation potential of these technologies is uncertain. Costs are also uncertain, although there is reason to think that they may be low. Abatement in the New Zealand context is unknown until full proof-of-concept stage is reached using substances that are consistent with export market requirements and animal welfare. However, costs could be low or negative if there is no production penalty and especially if the reduction in energy used for the production of CH4 increases production. In 2050, assuming a emissions price of NZ$100/tCO2-e, a vaccine that reduces enteric fermentation emissions by 20 per cent could be valued at about NZ$42 per head of dairy cattle per year, NZ$30 per head of beef cattle per year, and NZ$6 per sheep per year.5
3.1.2 Total scenario outcomes
Reduction in emissions intensity in the agricultural sector is crucial to maintain food security while addressing climate change. The above discussion highlights the range of mitigation options that can reduce emissions from livestock. All scenarios in the analysis show significant declines in emissions. In the Off Track New Zealand and Resourceful New Zealand scenarios, agricultural emissions are reduced by 16 per cent and 28 per cent from 2014 levels respectively, with higher livestock numbers resulting in higher emissions in the Off Track New Zealand scenario. In the Innovative New Zealand scenario, a combination of reduced animal numbers, and the use of emerging technologies results in agricultural emissions 38 per cent lower than 2014 levels. The scenarios suggest that with lower rates of production growth, and ambitious, but realistic technological and farm practice changes, agricultural emissions can be substantially reduced. In recent years, increases in animal numbers have led to a significant growth in absolute emissions, though improvements in productivity have mitigated the rise somewhat. Our scenarios suggest that significant emissions reductions are possible with stable or declining animal numbers, improved farm practices and technological change. The implied changes in emissions per unit of production, however, are broadly consistent with historical experience. For instance, the Innovative New Zealand scenario results in large reductions in emissions, but its improvements in terms of CO2-e per unit produced for the beef and sheep industries are comparable to those that have occurred in the last 25 years. In the dairy industry, the improvement in emissions intensity is greater than in recent experience as a result of the greater array of mitigation options expected to become available, falling to 40 per cent below 2014 levels in the Innovative New Zealand scenario. An overview of these reductions across the different scenarios is provided in Figure 14.
5 Vivid Economics calculation based on the assumptions above.

60 Net Zero in New Zealand: Scenarios to achieve domestic emissions neutrality in the second half of the century
Figure 14. All scenarios suggest that significantly lower emissions are possible in agriculture
Source: Vivid Economics using data from the New Zealand Ministry for the Environment (2016)
Finally, this analysis does not consider mitigation options based on soil carbon content changes in the absence of land-use change. Given the relatively high existing soil carbon stock in New Zealand’s pastures and the scientific and technical difficulties in monitoring and verifying long-term systematic changes in soil carbon stocks, relying on increasing soil carbon may not appear to be a viable mitigation option in the near term, although further research could improve the evidence base and change this assessment (Box 4).
0
5
10
15
20
25
30
35
40
45
2014 Off track Innovative Resourceful
Agr
icul
ture
em
issi
ons
(Mt C
O2e
)
Dairy Beef Sheep Other livestock Crops

61 Net Zero in New Zealand: Scenarios to achieve domestic emissions neutrality in the second half of the century
Box 4. Mitigation options to improve soil carbon content
Soil is a vital reservoir of carbon, but measurement challenges exist due to complex soil carbon dynamics. Soils can lose carbon quickly and recover it only slowly, so it is important to protect current stock. In addition, small proportionate changes in the amount of carbon stored in soil could have significant effects on net GHGs. However, measurement is challenging because soil carbon can vary significantly from year to year in response to disturbances, such as drought, floods, and pasture renewal. Very few long-term representative datasets exist (Sims et al. 2016). Moreover, spatial variability is very high with soil carbon dynamics varying across regions and even within a single field. As a result, soil carbon changes are not accounted for in national inventories unless land use changes occur; a similar approach is taken in the scenario analysis in this report. While there is a reasonable understanding of changes in soil carbon stocks when land uses change, the default assumption in the New Zealand inventory is that soil carbon does not change when land use does not change. Based on this accounting approach, soils as a whole have been considered a net source of emissions since 1990, mainly due to net conversions from grassland (which generally holds more soil carbon than forest soils) to forest land (Pollock 2015). Some evidence suggests, however, that soil carbon stocks have changed in New Zealand even where there has been no land use change. In particular Pollock (2015) finds:
⎯ the carbon content of pastures on some pasture land soil orders may have declined, though in general pasture stocks have changed little over the past two to three decades;
⎯ intensive cropping systems may have caused carbon stocks to decrease due to repeated disturbance as crops are established during ploughing and sowing;
⎯ hill country stocks may have increased over the past 30 years, although it is unclear whether this is the result of pastures recovering after initial deforestation and soil perturbation.
Findings on the potential of soil carbon are mixed, and further research is required before it can be included as a permanent source of emissions reductions. The Parliamentary Commissioner for the Environment highlighted the challenges around incorporating soil changes into reporting or whether carbon reductions would be permanent (PCE 2016). Other authors suggest that these challenges can be overcome and that these techniques could contain significant potential for abatement (Toensmeier 2016). Further research in the New Zealand context of the costs and scope for roll out is required before this can be included in a robust assessment of abatement potential. Potential soil farming practices include:
⎯ In low-fertility grasslands, the addition of nitrogen fertiliser or through clover fixation might increase soil carbon stocks in the short term. However, in the long term, this approach suffers from diminishing returns. In addition, if synthetic fertilisers are used, N2O emissions and water quality issues may outweigh any benefit of extra carbon storage.
⎯ Optimised irrigation could increase plant growth and also improve inputs of carbon into soil. However, irrigation will also support greater soil microbial activity, converting soil carbon

62 Net Zero in New Zealand: Scenarios to achieve domestic emissions neutrality in the second half of the century
back into CO2 that would be released back into the atmosphere. The net effect of these competing processes on the storage of soil carbon in the long term remains uncertain.
⎯ Increasing the amount and turnover of roots should deposit more carbon into the soil. Evidence suggests the potential for soil carbon storage is very large if roots access deeper soil profiles. In the US, the Advanced Research Projects Agency recently modelled the potential for deep carbon storage if major commodity crops were able to double their root mass and shift this root mass deeper in the soil. Were these new crop breeds taken up across the 400 million acres of US cropland, the estimated carbon sequestration potential ranges from 0.25 to 1.2 Gt CO2 by mid-century (The White House 2016).
⎯ Management of intensive grazing and de-intensification could increase soil carbon storage on working pasture lands. Livestock is frequently rotated in small paddocks to prevent overgrazing and increase grass productivity. This can improve soil sequestration. It also provides unoccupied paddocks longer ‘rest’ periods for regrowth which can further aid this process. Further research is needed to better understand the scale of mitigation potential, although early results indicate positive outcomes (The White House 2016). De-intensification on overgrazed lands, avoiding grazing during drought conditions, and improving the timing and frequency of grazing can also increase soil carbon sequestration.
⎯ Finally, biochar could be an effective means of reducing several GHGs. Biochar is a highly porous charcoal that can be created from harvesting waste from plantation forests. There is good evidence that it is a very stable form of carbon, so it could be applied to soils to store more carbon. Specific biochars might also help reduce N2O emissions, although the exact mechanisms are not yet clear. However, the main challenge at present to any widespread use of biochar in a pastoral system remains its cost and the large area that would need to be covered (Pollock 2015).

63 Net Zero in New Zealand: Scenarios to achieve domestic emissions neutrality in the second half of the century
3.2 Forestry
Natural and plantation forests currently account for about 37 per cent of New Zealand’s total land cover, or about 9.9 million hectares (MfE 2016). While forests represent a significant land use, there has been a considerable loss of forest cover over the last few centuries. As indicated in Figure 15, before human settlement, New Zealand was principally covered in indigenous flora including tall kauri and kohekohe forests and rainforests, dominated by rimu, beech, tawa, matai and rata (Department of Conservation 2017). However, land use changes since then have led to a vast expansion in grassland, with an associated reduction in the amount of carbon sequestered in the landscape. Forests remain a key source of sequestration for New Zealand. The New Zealand national GHG inventory shows that forests and forest products significantly reduce the country’s net emissions: currently sequestering about 24Mt CO2-e per year. This is in large part due to the New Zealand’s well-developed plantation industry. Nearly all of New Zealand’s wood production (99.8 per cent) comes from plantation forests of exotic tree species, 89 per cent of this is Pinus radiata (Radiata Pine) while the remainder is a mix of exotic hardwoods such as Eucalypts, and softwoods such as Douglas Fir. The expansion of New Zealand’s forest industry in the 1990’s has contributed to current high rates of sequestration. However, these forests are soon due for harvest, which means that without a significant expansion of the forest estate, net sequestration from plantation forests will largely disappear over the next decade. Forestry provides the potential for significant mitigation at low cost. Planting new forests is the only technology currently known and implementable on a large scale that has the capability to remove large amounts of carbon dioxide from the atmosphere. Modest emissions prices are expected to drive significant investment in afforestation, for instance, a emissions price of NZ$50 per tonne CO2-e could drive new plantings of 50,000 hectares per year (Manley 2016). This means that forestry can provide New Zealand with an emissions buffer as it decarbonises its energy sector and invests in new technologies and management techniques to cut emissions from agriculture. The forest sector is of significant economic importance. In 2015, the export of forest products was valued at NZ$4.7 billion dollars (Statistics New Zealand 2016f). The importance of forestry is reflected in changed land use patterns, with the area devoted to the forest sector growing as the land area used for other primary production has declined. Since 1990, the land area used by plantation forestry has grown by 36 per cent while the amount of land used for other agricultural uses has fallen by 25 per cent.6 The economic activity from the forest sector is particularly important to Māori, with about 40 per cent of total forest land expected to be in Māori ownership following the conclusion of the Treaty of Waitangi settlements (Scion 2017). As well as commercial interests, the Māori have important cultural and spiritual connections to forested land. Forestry also provides significant co-benefits relative to alternative land uses. Forests provide ecosystem services and habitat for endangered species, while also reducing erosion and nitrogen leaching, thereby helping to improve water quality. Conversely though, the expansion of plantation forestry can reduce water
6 Vivid economics calculation based on Statistics New Zealand (2016b); MPI (2016).
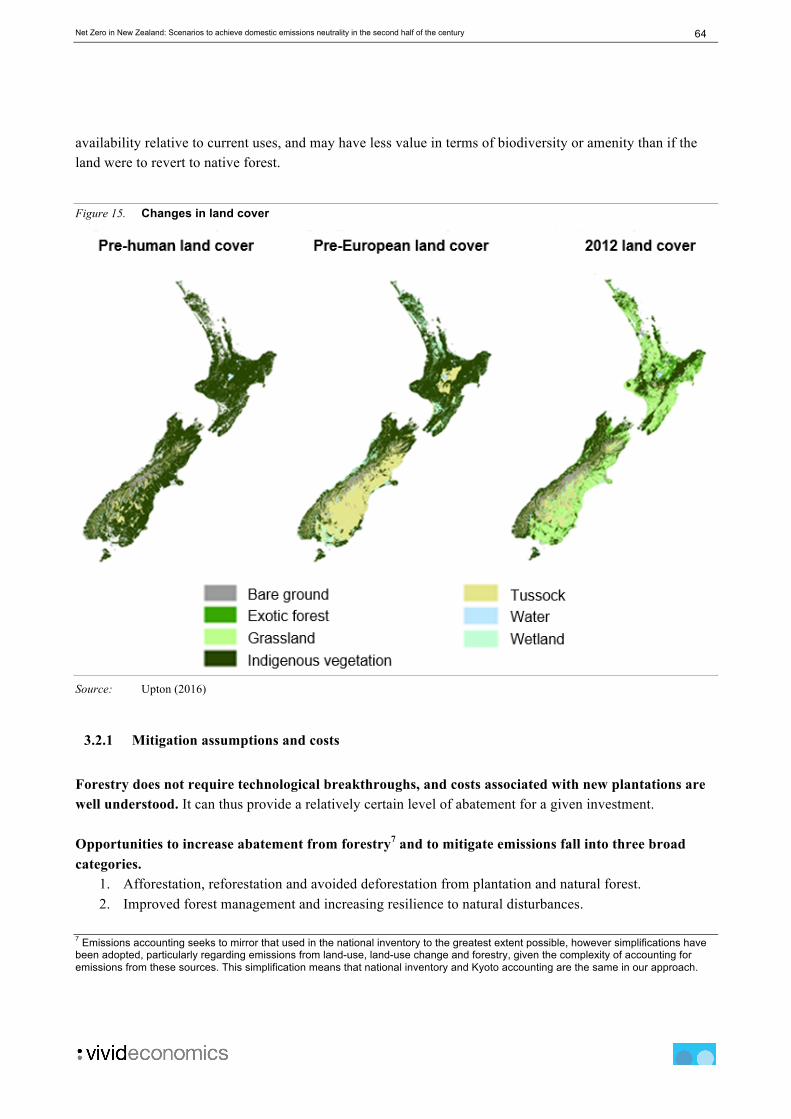
64 Net Zero in New Zealand: Scenarios to achieve domestic emissions neutrality in the second half of the century
availability relative to current uses, and may have less value in terms of biodiversity or amenity than if the land were to revert to native forest.
Figure 15. Changes in land cover
Source: Upton (2016)
3.2.1 Mitigation assumptions and costs
Forestry does not require technological breakthroughs, and costs associated with new plantations are well understood. It can thus provide a relatively certain level of abatement for a given investment. Opportunities to increase abatement from forestry7 and to mitigate emissions fall into three broad categories.
1. Afforestation, reforestation and avoided deforestation from plantation and natural forest. 2. Improved forest management and increasing resilience to natural disturbances.
7 Emissions accounting seeks to mirror that used in the national inventory to the greatest extent possible, however simplifications have been adopted, particularly regarding emissions from land-use, land-use change and forestry, given the complexity of accounting for emissions from these sources. This simplification means that national inventory and Kyoto accounting are the same in our approach.

65 Net Zero in New Zealand: Scenarios to achieve domestic emissions neutrality in the second half of the century
3. Changed product end-uses: with sequestration from increasing the carbon stock held in harvested wood products (HWP).
Our forest sector calculator estimates abatement from two of these three categories. It relates new forests plantings to estimates of sequestration and forest yields, and the attribution of biomass to final uses and associated carbon storage. Where possible our models utilises official government figures, such as estimates of sequestration rates and yields that are differentiated by forest type, age and location. Accounting for emissions from land-use, land-use change and forestry can be very complex, and we adopt a simplified Kyoto Protocol style approach that captures the key drivers of emissions and removals from the sector. In particular, we use an averaging approach for calculating forestry sequestration, and report only net carbon stock changes from new forests, without reference to a forest management reference level. Our analysis assumes no sequestration from improved forest management from native or plantation forests planted before 2015. This is a conservative assumption, as improved management may have a noticeable impact on sequestration in New Zealand. For instance, increased rotation lengths would increase the average carbon stock stored in existing forests. We also make no adjustment for emissions from natural disturbances as emissions from natural disturbances have been historically small relative to the forest carbon stock (MfE 2016). Emissions from plantation forests can vary significantly as forests grow and are harvested. This is a particular challenge in New Zealand, as rapid afforestation in the 1990’s resulted in an imbalance in the age profile of forests. The large-scale afforestation is responsible for New Zealand’s current high levels of forestry sequestration, however this also means that the forest sector may become a source of significant emissions in the next decade, as these forests are harvested. The variability in emissions from existing plantations creates a challenge for communicating the scenarios in this report, as it leads emissions to vary markedly across years, and between decades. To address this variability, an averaging approach is used for calculating forestry sequestration. An averaging approach accounts for emissions from a new plantation up to the point at which the forest reaches its long run average carbon stock (see Figure 16). This simplifies the estimates of abatement as it reduces the sensitivity of our model to forest harvests. Furthermore, because we assume that all land currently forested remains forested, under an averaging approach we can assume that they have no impact on net emissions, as they will have all reached their long-term average carbon stock by 2050.8 This approach has the further advantage of enabling us to account only for forestry abatement from actions taken after 2014. An alternative approach to emissions accounting would be to account for sequestration changes in real time. This would mean that emissions and sequestration from New Zealand’s existing forest stock, with its imbalanced age profile, would influence emissions outcomes and could provide a potentially misleading indication of progress towards a net zero outcome. A sensitivity check using a real-time accounting approach suggested that the impact of this on measured emissions is likely to be small over longer time periods.
8 Estimates of abatement from Harvested Wood Products (HWPs) is included in the section below rather than here.

66 Net Zero in New Zealand: Scenarios to achieve domestic emissions neutrality in the second half of the century
Over the 2013-2020 period for its international emission reduction commitment, New Zealand is accounting for carbon sequestration from pre-1990 forests relative to its forest management reference level (FMRL)9. The FMRL represents the level of sequestration likely to occur in pre-1990 forests, under business as usual forest management. This means that only additional sequestration, like plantation of new forests or changed management practices, is accounted for against a country’s target. The calculation of business as usual emissions from forests fluctuates year by year, and New Zealand’s FMRL for the second commitment period has changed substantially with the introduction of new accounting treatments and technical corrections. New Zealand’s current FMRL of 6.1 Mt CO2e net sequestration per annum for the 2013-2020 period compares to an initial FMRL of 11.2 Mt CO2e net emissions, a change of 17.3 Mt per annum (National Inventory p.466). An FMRL has not been adopted in this study given the significant uncertainty regarding its appropriate level across the time periods considered, and we assume no net sequestration from standing pre-1990 forests.10
Figure 16. Carbon stock in real time compared with emissions accounting under an averaging approach, for Radiata Pine in the North Island
Source: Vivid Economics, drawing on New Zealand Ministry for Primary Industries (2015a)
The use of an averaging approach, and the assumption that all land used for forestry remains in its current use, means that by 2050 we assume no net emissions or removals from pre-2014 forests. The forest types considered in our report reach their long-run average carbon stock within 24 years of planting.
9 New Zealand elected to take its emission reduction commitment for the period 2013-2020 under the UN Framework Convention on Climate Change rather than the second commitment period of the Kyoto Protocol; however, it is continuing to report under the Kyoto Protocol’s framework of rules.
10 For discussion, see Holdaway et al. (2014)
0
100
200
300
400
500
600
700
800
900
0 10 20 30 40 50 60 70 80 90 100
Car
bon
stoc
k (to
nnes
CO
2-e/
hect
are)
Age of new forest
Actual carbon stock Carbon stock accounted for under averaging
67 Net Zero in New Zealand: Scenarios to achieve domestic emissions neutrality in the second half of the century
This means that any sequestration from existing standing forests would be accounted for by 2038 at the latest. The use of forest products is an important factor in determining the amount of carbon they store. Calculating mitigation from sequestration in HWPs requires estimation of the total forest yield, and the attribution of this yield to different product types. When a forest is harvested, the carbon it stores may take some time to be released to the atmosphere. Indeed, some of the carbon may be stored in wood-based products for extended periods of time. We calculate sequestration from HWPs from plantation forests of all ages. As the harvest of plantation forests determines New Zealand’s total wood supply, changes in product end-use shares will result in an increase in the carbon stock stored in products from the harvest of forest lands planted prior to 2014. The harvest and use of forest products gives rise to the large year-on-year fluctuations in forest sector emissions, reflecting the skewed age distribution of New Zealand’s forest stock. To account for this, we focus on decadal and multi-decadal averages when reporting estimates of sequestration from the forest sector. We developed a range of scenarios regarding the use of New Zealand’s forest products, with forests end-use attributed to one of five broad categories:
− Paper products; − Solid wood products (including sawn timber products, wood panels and compressed-fibre products); − Biofuel; − Exported logs; and, − Other exports (including wood chips and pulp).
Using these product end-use scenarios, we calculate changes in carbon stocks using the standard approach used in New Zealand’s national greenhouse gas inventory. This approach is expanded to also account for sequestration from the storage of carbon exported in logs. Box 5 gives further detail on assumptions underpinning the sequestration rates in the scenarios.

68 Net Zero in New Zealand: Scenarios to achieve domestic emissions neutrality in the second half of the century
Box 5. Sequestration from forestry
The mitigation potential from afforestation depends on the area of suitable land and the trees that are planted. Eroded land, ranging in area from 0.8 to 3 million hectares depending on assessment criteria, could be suitable for plantation forestry. A large amount of grazing land may also be transitioned to forestry. Between 0.7 to 5.1 million hectares of grazing could be transitioned to forestry depending on the land classes available (Jack & Hall 2010). To retain carbon in each hectare of forest, the rotations would have to continue indefinitely, or an equivalent new area would need to be planted with replacement forests. A significant proportion of New Zealand’s plantation forest stock is due for harvest in the next decade, which will result in significant net emissions over this period. These emissions are permanent if this land is not replanted; however almost all forest stock is likely to be replanted if even moderate emissions prices apply. This study assumes that New Zealand’s plantation forestry estate increase substantially over the next 50 years. At present, about 1.7 million hectares is used for plantation forestry. Our scenarios expand this substantially. We assume that all land currently used for forestry continues in this use (that is, no deforestation). In addition, we assume an increase in plantation forestry in each of the three scenarios. These scenarios increase total plantation forestry areas by between 0.5 and 2.1 million hectares between now and 2100. Our scenarios imply an increase in annual plantings over the next 50 years, reaching a maximum of 55,000 ha/year in the Resourceful New Zealand scenario. While this rate is high by recent standards, it is comparable to the growth rate experienced in New Zealand in the 1990s (MPI 2016), and is realistic given a supportive policy regime.11 In all scenarios, new planting rates start at 3,000 hectares in 2015 and linearly increase to the maximum plantation rate, reached in 2030. The maximum plantation rate is 13,000 hectares in Off Track New Zealand, and 40,000 hectares and 55,000 hectares in Innovative and Resourceful New Zealand scenarios respectively. Planting rates remain stables at this rate until 2050, and then decline linearly to reach zero in 2070.
Table 18. The forest estate expands substantially in each scenario
Cumulative plantings (hectares) over period
Off Track Innovative Resourceful
2015-50 388,000 1,144,000 1,564,000 2015-2100 511,500 1,524,000 2,086,500
Source: Vivid Economics
11 This rate of planting is similar to the forest plantings induced under a $NZ50/tonne emissions price scenario (Manley 2016).

69 Net Zero in New Zealand: Scenarios to achieve domestic emissions neutrality in the second half of the century
Estimating sequestration from the forest sector requires consideration of the current and future forest estate. The key drivers of these results are assumptions regarding the total size of the forest estate, and its distribution. The calculator varies this across three main parameters:
- The type of forests, which can be Radiata Pine, Douglas Fir or Eucalypt; - The geographic distribution of forests, with growth and sequestration rates applying based on
whether the tree is located in the North Island or the South Island; and, - The harvest age, with different standard tree ages assumed based on tree type.
While it is possible to increase the specificity of the model regarding location and type of plantation, the calculator captures the key options and trade-offs in New Zealand’s forest sector. Our analysis assumes the distribution of tree species is slightly more diverse than present, with a greater proportion of Douglas Fir and Eucalypts. The distribution of species differs between the North and South Islands, although, as shown in Table 19, Radiata Pine remains the dominant species on both islands.
Table 19. Radiata Pine remains the dominant plantation forest species
Share of forest estate by location
Radiata Pine Douglas Fir Eucalypt
North Island 90% 0% 10% South Island 80% 15% 5%
Source: Vivid Economics
Our analysis assumes that planting is concentrated in the North Island in the lower afforestation scenarios, but begins to shift to the South Island as rates of afforestation become more ambitious. The extent of this shift across the scenarios is summarised in Table 20. Our assumptions regarding the location of new forest stock reflects current patterns of land use, alongside assessments of the environmental and commercial benefits of planting on eroded land, and the availability of land at low cost. At present, over 70 per cent of New Zealand’s plantation forest stock is located in the North Island (Watt et al. 2011), which has faster growth rates for the dominant plantation species, Radiata Pine.
Table 20. As afforestation increases a greater share occurs on the South Island
Share of new plantation forests by Island
Off track Innovative Resourceful
North Island 70% 60% 50% South Island 30% 40% 50%
Source: Vivid Economics

70 Net Zero in New Zealand: Scenarios to achieve domestic emissions neutrality in the second half of the century
One of the primary opportunities for afforestation in New Zealand is its use on less productive eroded land, which represents a significant source of water pollution. An assessment of eroded, non-arable land suitable for afforestation found that 78 per cent of the 0.7 million hectares of severely eroded land suitable for forestry was located in the North Island. When less eroded land was accounted for, about 3 million hectares of eroded land was identified, the majority of which is in the South Island (Watt et al. 2011). An earlier assessment of land availability which focused on the cost of land found that for the level of afforestation considered (up to 2 million hectares) land suitable for forestry is primarily located in the South Island (Hall & Jack 2009). While eroded land presents an attractive option for afforestation, this may not be feasible on all marginal hill land due to difficulties with road access and harvesting. Harvest dates are based on current industry practice, and are assumed to occur a fixed number of years after initial planting. In reality, harvesting patterns are likely to flatten out peaks in planting rates through early or delayed harvesting; for the purposes of this study however, this has not been modelled. We use a standard harvest age of:
− 30 years for Radiata Pine; − 45 years for Douglas Fir; and, − 25 years for Eucalypts.
These harvest ages are well within the range of current management approaches. The harvest age of Radiata Pine is slightly above the current average harvest age of 28 years, which is consistent with an industry that places an increased value on sequestration and higher added value production (as discussed in later sections). The harvest ages for Douglas Fir and Eucalypts are based on expert advice and are consistent with current forest management practices. Standard harvest ages are applied to both new and existing (pre-2015) plantation forest estate. For simplicity, existing forests of an age more than ten years past the standard harvest age are assumed to never be harvested12 while all other forests above the standard harvest age are assumed to be progressively harvested over the next ten years. This has only a small impact on our longer-term estimates. The calculator combines these assumptions with the carbon stock rates provided in the New Zealand ETS forestry look-up tables. These tables are used by small-scale producers to estimate changes in carbon stock from the growth and harvest of forests for the purpose of calculating credits and liabilities under the New Zealand ETS.13 The look-up tables calculate carbon stocks assuming standard industry practice regarding pruning and thinning regimes; however, the amount of carbon sequestration may be significantly higher under regimes that are optimised to maximise sequestration. Management to maximise sequestration may occur under high emissions prices as it may prove more profitable for foresters to pursue sequestration rather than other forest attributes like log yields. There is evidence that
12 For instance, a stand of Radiata Pine aged 40 years is assumed to be harvested, while a stand aged 41 years is not.
13 Sequestration from Eucalypts is estimated using the “exotic hardwoods” series. Remaining forest residues are assumed to decay linearly over a ten-year period in line with their treatment in the New Zealand ETS.
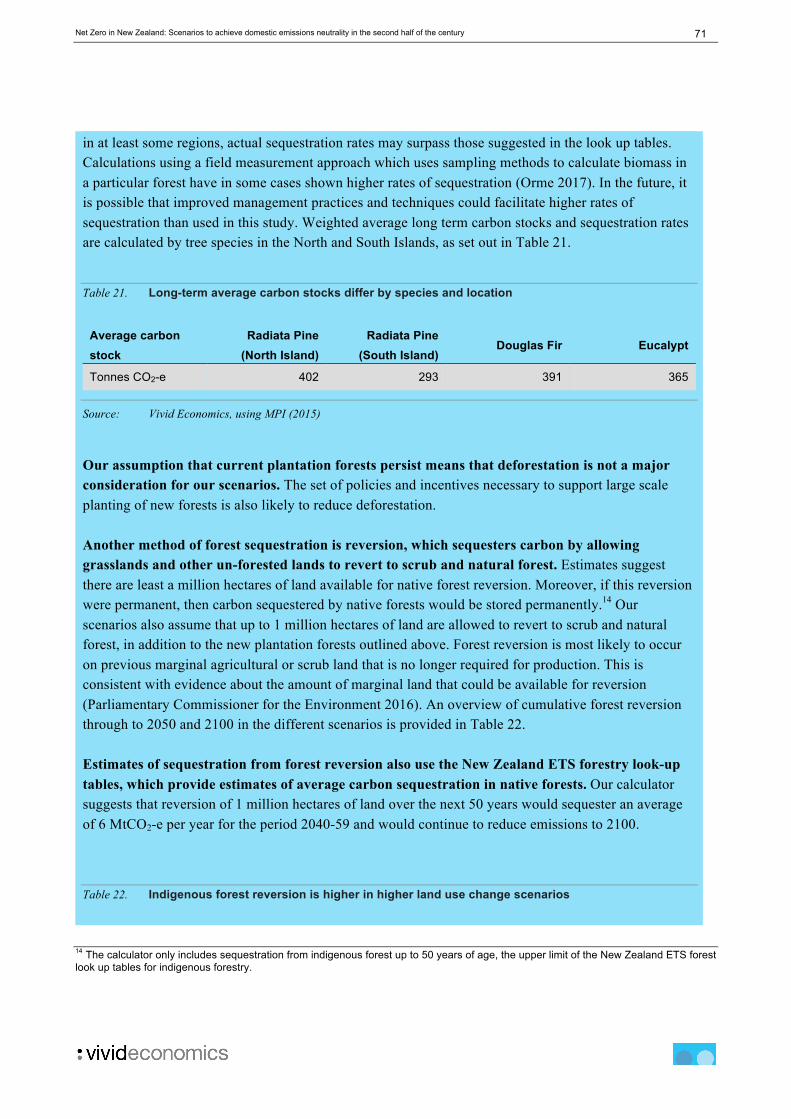
71 Net Zero in New Zealand: Scenarios to achieve domestic emissions neutrality in the second half of the century
in at least some regions, actual sequestration rates may surpass those suggested in the look up tables. Calculations using a field measurement approach which uses sampling methods to calculate biomass in a particular forest have in some cases shown higher rates of sequestration (Orme 2017). In the future, it is possible that improved management practices and techniques could facilitate higher rates of sequestration than used in this study. Weighted average long term carbon stocks and sequestration rates are calculated by tree species in the North and South Islands, as set out in Table 21.
Table 21. Long-term average carbon stocks differ by species and location
Average carbon stock
Radiata Pine (North Island)
Radiata Pine (South Island)
Douglas Fir Eucalypt
Tonnes CO2-e 402 293 391 365
Source: Vivid Economics, using MPI (2015)
Our assumption that current plantation forests persist means that deforestation is not a major consideration for our scenarios. The set of policies and incentives necessary to support large scale planting of new forests is also likely to reduce deforestation. Another method of forest sequestration is reversion, which sequesters carbon by allowing grasslands and other un-forested lands to revert to scrub and natural forest. Estimates suggest there are least a million hectares of land available for native forest reversion. Moreover, if this reversion were permanent, then carbon sequestered by native forests would be stored permanently.14 Our scenarios also assume that up to 1 million hectares of land are allowed to revert to scrub and natural forest, in addition to the new plantation forests outlined above. Forest reversion is most likely to occur on previous marginal agricultural or scrub land that is no longer required for production. This is consistent with evidence about the amount of marginal land that could be available for reversion (Parliamentary Commissioner for the Environment 2016). An overview of cumulative forest reversion through to 2050 and 2100 in the different scenarios is provided in Table 22. Estimates of sequestration from forest reversion also use the New Zealand ETS forestry look-up tables, which provide estimates of average carbon sequestration in native forests. Our calculator suggests that reversion of 1 million hectares of land over the next 50 years would sequester an average of 6 MtCO2-e per year for the period 2040-59 and would continue to reduce emissions to 2100.
Table 22. Indigenous forest reversion is higher in higher land use change scenarios
14 The calculator only includes sequestration from indigenous forest up to 50 years of age, the upper limit of the New Zealand ETS forest look up tables for indigenous forestry.
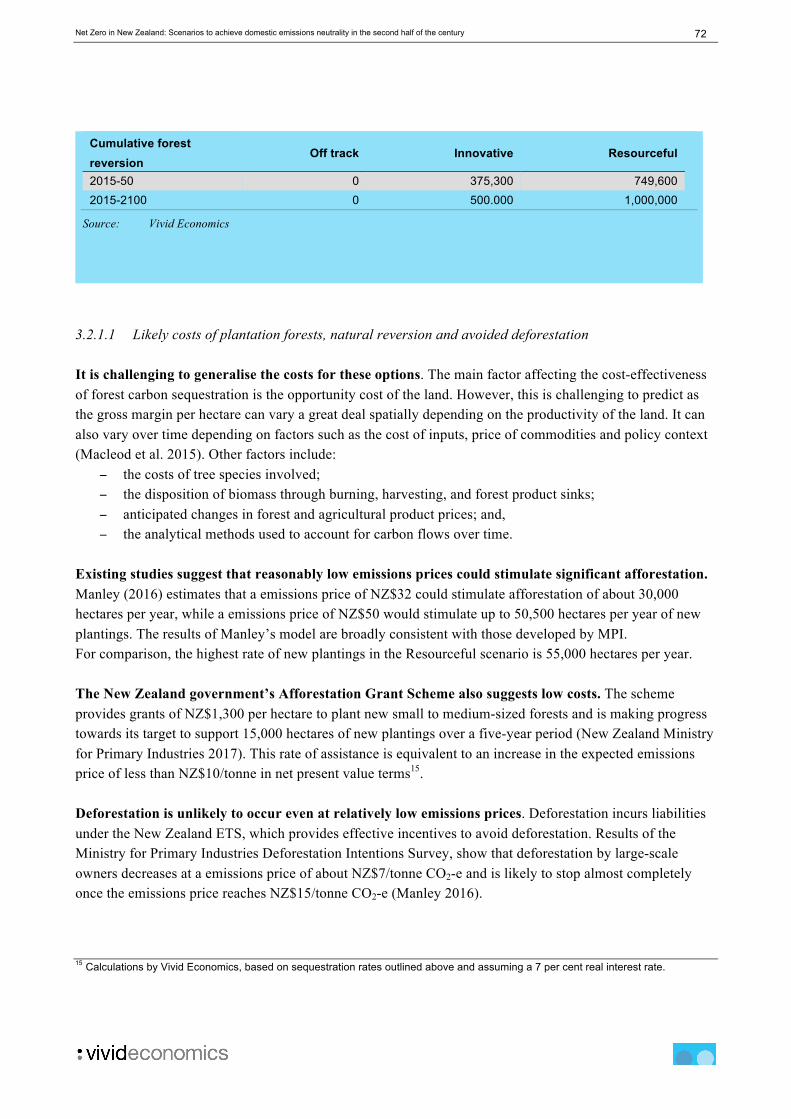
72 Net Zero in New Zealand: Scenarios to achieve domestic emissions neutrality in the second half of the century
Cumulative forest reversion
Off track Innovative Resourceful
2015-50 0 375,300 749,600 2015-2100 0 500.000 1,000,000
Source: Vivid Economics
3.2.1.1 Likely costs of plantation forests, natural reversion and avoided deforestation It is challenging to generalise the costs for these options. The main factor affecting the cost-effectiveness of forest carbon sequestration is the opportunity cost of the land. However, this is challenging to predict as the gross margin per hectare can vary a great deal spatially depending on the productivity of the land. It can also vary over time depending on factors such as the cost of inputs, price of commodities and policy context (Macleod et al. 2015). Other factors include:
− the costs of tree species involved; − the disposition of biomass through burning, harvesting, and forest product sinks; − anticipated changes in forest and agricultural product prices; and, − the analytical methods used to account for carbon flows over time.
Existing studies suggest that reasonably low emissions prices could stimulate significant afforestation. Manley (2016) estimates that a emissions price of NZ$32 could stimulate afforestation of about 30,000 hectares per year, while a emissions price of NZ$50 would stimulate up to 50,500 hectares per year of new plantings. The results of Manley’s model are broadly consistent with those developed by MPI. For comparison, the highest rate of new plantings in the Resourceful scenario is 55,000 hectares per year. The New Zealand government’s Afforestation Grant Scheme also suggests low costs. The scheme provides grants of NZ$1,300 per hectare to plant new small to medium-sized forests and is making progress towards its target to support 15,000 hectares of new plantings over a five-year period (New Zealand Ministry for Primary Industries 2017). This rate of assistance is equivalent to an increase in the expected emissions price of less than NZ$10/tonne in net present value terms15. Deforestation is unlikely to occur even at relatively low emissions prices. Deforestation incurs liabilities under the New Zealand ETS, which provides effective incentives to avoid deforestation. Results of the Ministry for Primary Industries Deforestation Intentions Survey, show that deforestation by large-scale owners decreases at a emissions price of about NZ$7/tonne CO2-e and is likely to stop almost completely once the emissions price reaches NZ$15/tonne CO2-e (Manley 2016).
15 Calculations by Vivid Economics, based on sequestration rates outlined above and assuming a 7 per cent real interest rate.

73 Net Zero in New Zealand: Scenarios to achieve domestic emissions neutrality in the second half of the century
We expect reversion to occur on marginal lands, which may include former agricultural land that has not been transitioned to plantation forestry. Given the sequestration from indigenous forest reversion, and the benefits it may provide through increased natural forest habitat, reversion may also be supported through policy, including earning emissions units in the New Zealand ETS. The cost of increasing the rate of reversion are unknown, however we expect it to be low, as the reduction in land used in agriculture, suggest that a significant amount of land would be available with a relatively small opportunity cost. All mitigation options from forestry sequestration are likely to be low cost. 3.2.1.2 Changed product end-use The use of forest products is an important factor in determining the amount of carbon they store. When a forest is harvested, the carbon stored may take some time to be released to the atmosphere. In 2014, an increase in the carbon content of New Zealand’s harvested wood products (HWPs) sequestered the equivalent of 8.5 MtCO2 – or over 10 per cent of New Zealand’s gross emissions (MfE 2016). Sequestration from HWPs is likely to remain an important source of sequestration for the foreseeable future. To calculate the potential carbon stock changes into the future, it is necessary to consider likely forest yields, and attribute these yields to potential product end-uses. Yields will differ according to forest attributes including forest type, location, age, and management regime. Even within individual stands yields will vary based on local climatic and geographic features. Table 23 provides a general summary of the differing yields from varied species age and location. The forest management regime used affects the characteristics of the yield. A regime which includes pruning and thinning16 will result in a harvest with less total biomass than an unpruned, unthinned regime, but may have a greater proportion of higher-value saw-logs. We use the Ministry for Primary Industries’ (2015) yield tables to estimate forestry production. These tables provide information on recoverable timber by age, location and management regime for Radiata Pine and Douglas Fir. These are then transformed into tonnes of wood using basic wood densities of 0.40 t/m3 for Radiata Pine and 0.42 t/m3 for Douglas Fir. We calculate an average yield for each tree type to apply in the North and South Island based on the current distribution of forest plantations. We assume no production thinning, and for Radiata Pine, pruning occurs in 59 per cent of stands while 41 per cent of stands are left unpruned, in line with current management practices for Radiata forests aged 11-30 (MPI 2016).
16 Thinning is the selective removal of trees to provide more space for other trees to grow
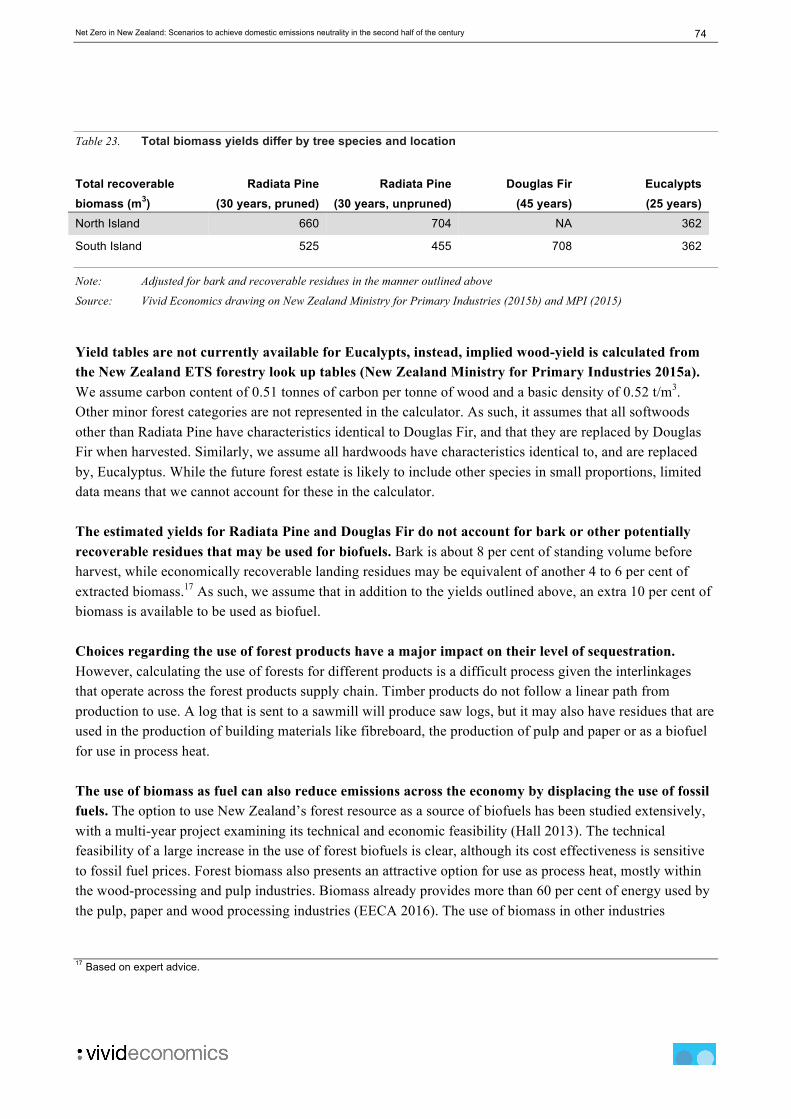
74 Net Zero in New Zealand: Scenarios to achieve domestic emissions neutrality in the second half of the century
Table 23. Total biomass yields differ by tree species and location
Total recoverable biomass (m3)
Radiata Pine (30 years, pruned)
Radiata Pine (30 years, unpruned)
Douglas Fir (45 years)
Eucalypts (25 years)
North Island 660 704 NA 362
South Island 525 455 708 362
Note: Adjusted for bark and recoverable residues in the manner outlined above
Source: Vivid Economics drawing on New Zealand Ministry for Primary Industries (2015b) and MPI (2015)
Yield tables are not currently available for Eucalypts, instead, implied wood-yield is calculated from the New Zealand ETS forestry look up tables (New Zealand Ministry for Primary Industries 2015a). We assume carbon content of 0.51 tonnes of carbon per tonne of wood and a basic density of 0.52 t/m3. Other minor forest categories are not represented in the calculator. As such, it assumes that all softwoods other than Radiata Pine have characteristics identical to Douglas Fir, and that they are replaced by Douglas Fir when harvested. Similarly, we assume all hardwoods have characteristics identical to, and are replaced by, Eucalyptus. While the future forest estate is likely to include other species in small proportions, limited data means that we cannot account for these in the calculator. The estimated yields for Radiata Pine and Douglas Fir do not account for bark or other potentially recoverable residues that may be used for biofuels. Bark is about 8 per cent of standing volume before harvest, while economically recoverable landing residues may be equivalent of another 4 to 6 per cent of extracted biomass.17 As such, we assume that in addition to the yields outlined above, an extra 10 per cent of biomass is available to be used as biofuel. Choices regarding the use of forest products have a major impact on their level of sequestration. However, calculating the use of forests for different products is a difficult process given the interlinkages that operate across the forest products supply chain. Timber products do not follow a linear path from production to use. A log that is sent to a sawmill will produce saw logs, but it may also have residues that are used in the production of building materials like fibreboard, the production of pulp and paper or as a biofuel for use in process heat. The use of biomass as fuel can also reduce emissions across the economy by displacing the use of fossil fuels. The option to use New Zealand’s forest resource as a source of biofuels has been studied extensively, with a multi-year project examining its technical and economic feasibility (Hall 2013). The technical feasibility of a large increase in the use of forest biofuels is clear, although its cost effectiveness is sensitive to fossil fuel prices. Forest biomass also presents an attractive option for use as process heat, mostly within the wood-processing and pulp industries. Biomass already provides more than 60 per cent of energy used by the pulp, paper and wood processing industries (EECA 2016). The use of biomass in other industries
17 Based on expert advice.

75 Net Zero in New Zealand: Scenarios to achieve domestic emissions neutrality in the second half of the century
requiring medium-grade heat (less than 300°C) is feasible with new capital investment. There is potential to use biomass in high-grade applications if it can be gasified. Our scenarios assume a gradual movement from short-lived to longer-lived forest products, and an expansion in the use of biomass for intermediate industrial heat. Across all scenarios, we assume a steady increase in the production of solid wood products, such as construction materials, furniture and fibreboards. These changes in the final product mix are consistent with the move to longer-lived forest products that would be expected in a 2°C world. This increase could be driven by use of more wood-based construction products in New Zealand, or abroad, or provision of economic incentives to switch to long-lived products. Our scenarios also feature increased use of forest products for biofuels. By 2050, the intermediate heat demand from the pulp and paper and wood products are fully met through the use of biofuels, as is three-quarters of the heat needed for processing dairy and other agricultural products18. Exports of logs and other exports are assumed to comprise the remainder of the forest stock, with logs comprising 85 per cent of this quantity – a similar proportion to today. A breakdown of forest product end use through to 2050 is provided below in Table 24.
Table 24. Production of paper remains at current levels while solid wood products expands
Growth in forest product end-use during 2014-50
Paper Solid wood products Biofuels
Off Track 0% 75% 35% Innovative 0% 100% 34% Resourceful 0% 150% 55%
Source: Vivid Economics and (Food and Agriculture Organization of the UN 2016)
Table 25 gives the production for each product category in 2015, compared with modelled results for 2015, and for each scenario on average over the 2040-59 period. Our calculator implied a lower total harvest for 2015 compared with what actually occurred. This is most likely to be due to our simplified assumption of a single harvest age for each forest type.
18 The treatment of biofuels is further discussed in the energy section of this report.
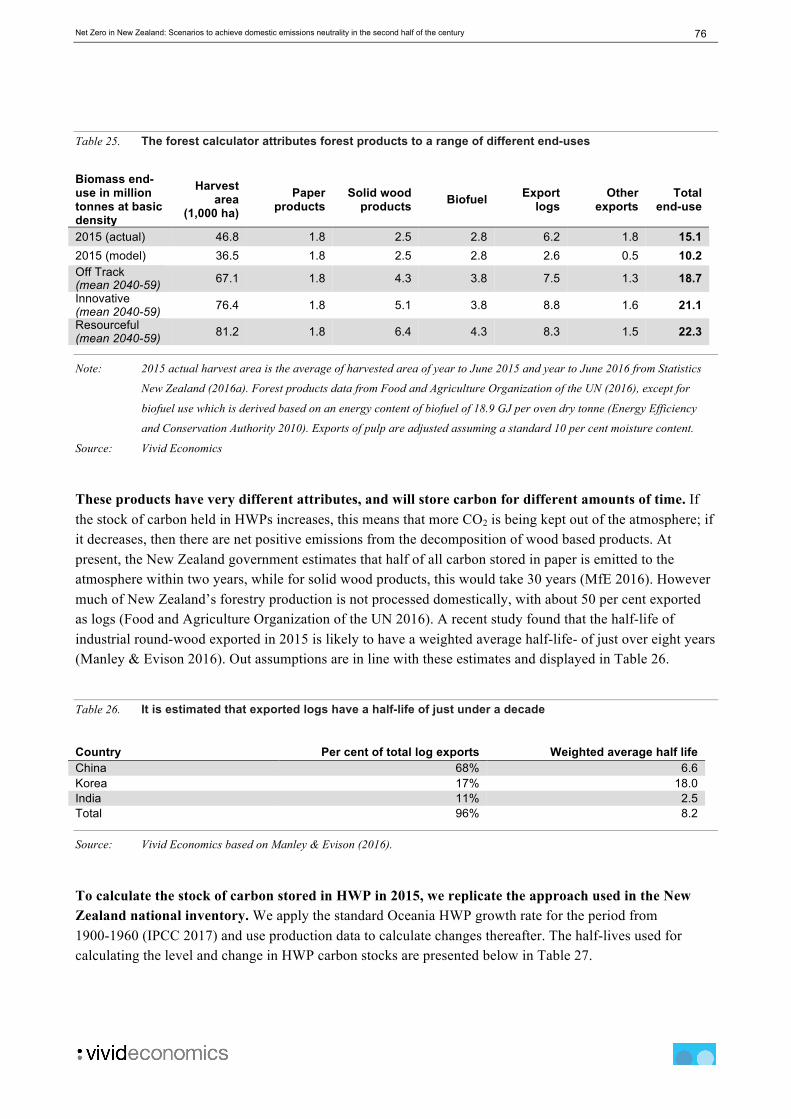
76 Net Zero in New Zealand: Scenarios to achieve domestic emissions neutrality in the second half of the century
Table 25. The forest calculator attributes forest products to a range of different end-uses
Biomass end-use in million tonnes at basic density
Harvest area
(1,000 ha) Paper
products Solid wood
products Biofuel Export logs
Other exports
Total end-use
2015 (actual) 46.8 1.8 2.5 2.8 6.2 1.8 15.1 2015 (model) 36.5 1.8 2.5 2.8 2.6 0.5 10.2 Off Track (mean 2040-59) 67.1 1.8 4.3 3.8 7.5 1.3 18.7 Innovative (mean 2040-59) 76.4 1.8 5.1 3.8 8.8 1.6 21.1 Resourceful (mean 2040-59) 81.2 1.8 6.4 4.3 8.3 1.5 22.3
Note: 2015 actual harvest area is the average of harvested area of year to June 2015 and year to June 2016 from Statistics
New Zealand (2016a). Forest products data from Food and Agriculture Organization of the UN (2016), except for
biofuel use which is derived based on an energy content of biofuel of 18.9 GJ per oven dry tonne (Energy Efficiency
and Conservation Authority 2010). Exports of pulp are adjusted assuming a standard 10 per cent moisture content.
Source: Vivid Economics
These products have very different attributes, and will store carbon for different amounts of time. If the stock of carbon held in HWPs increases, this means that more CO2 is being kept out of the atmosphere; if it decreases, then there are net positive emissions from the decomposition of wood based products. At present, the New Zealand government estimates that half of all carbon stored in paper is emitted to the atmosphere within two years, while for solid wood products, this would take 30 years (MfE 2016). However much of New Zealand’s forestry production is not processed domestically, with about 50 per cent exported as logs (Food and Agriculture Organization of the UN 2016). A recent study found that the half-life of industrial round-wood exported in 2015 is likely to have a weighted average half-life- of just over eight years (Manley & Evison 2016). Out assumptions are in line with these estimates and displayed in Table 26.
Table 26. It is estimated that exported logs have a half-life of just under a decade
Country Per cent of total log exports Weighted average half life China 68% 6.6 Korea 17% 18.0 India 11% 2.5 Total 96% 8.2
Source: Vivid Economics based on Manley & Evison (2016).
To calculate the stock of carbon stored in HWP in 2015, we replicate the approach used in the New Zealand national inventory. We apply the standard Oceania HWP growth rate for the period from 1900-1960 (IPCC 2017) and use production data to calculate changes thereafter. The half-lives used for calculating the level and change in HWP carbon stocks are presented below in Table 27.

77 Net Zero in New Zealand: Scenarios to achieve domestic emissions neutrality in the second half of the century
The costs of altering the end-use of wood products are uncertain. We do not have access to robust forecasts of production required to judge the likelihood or cost implications of moving to such a product mix. The scenarios presented are consistent with a world substituting towards low carbon products in building materials, energy, and other areas of consumption. These scenarios are more likely if supported by policies that take account of the sequestration value of HWPs. Nonetheless, the extent to which this would drive product switching to the level assumed is unclear.
Table 27. Half-lives, and therefore carbon stored in different forest products vary markedly
Variable Product half-life used in calculator (years) Paper 2 Solid wood products 30 Exported logs 8 Biofuel 0 Other exports 0
Source: Half-lives for paper and solid wood products (MfE 2016)
3.2.2 Total scenario outcomes
In all scenarios, the forest sector remains a major carbon sink. The Off Track New Zealand scenario sees sequestration from the forest sector of about 12 MtCO2-e per year during 2040-59, and this increases to 27 MtCO2-e in the Innovative New Zealand scenario and up to almost 36 MtCO2-e in the Resourceful New Zealand scenario. However, in all scenarios sequestration from the forest sector trends towards zero by 2100. This means that while the forest sector will prove an effective offset for emissions in the mid-century, over the second half of the century structural and technological change will be required to maintain low emissions. The role of forests is to give New Zealand society time to develop and implement the structural and technological changes necessary to attain emission neutrality by eliminating emissions from other sources. Figures 17-22 graphically depict both forestry sequestration and wood-product to the end of the century for each scenario.

78 Net Zero in New Zealand: Scenarios to achieve domestic emissions neutrality in the second half of the century
Figure 17. Forestry sequestration: Off Track New Zealand
Source: Vivid Economics
Figure 18. Wood product end-use: Off Track New Zealand
Source: Vivid Economics
-50
-40
-30
-20
-10
0
10
20
2015 2025 2035 2045 2055 2065 2075 2085 2095
Fore
stry
seq
uest
ratio
n (M
t CO
2e)
Sequestration (averaging) HWPs
0
10
20
30
40
50
60
2015 2025 2035 2045 2055 2065 2075 2085 2095
Mill
ion
tonn
es a
t bas
ic d
ensi
ty
Paper Solid wood products Biofuel Exported logs Other net exports
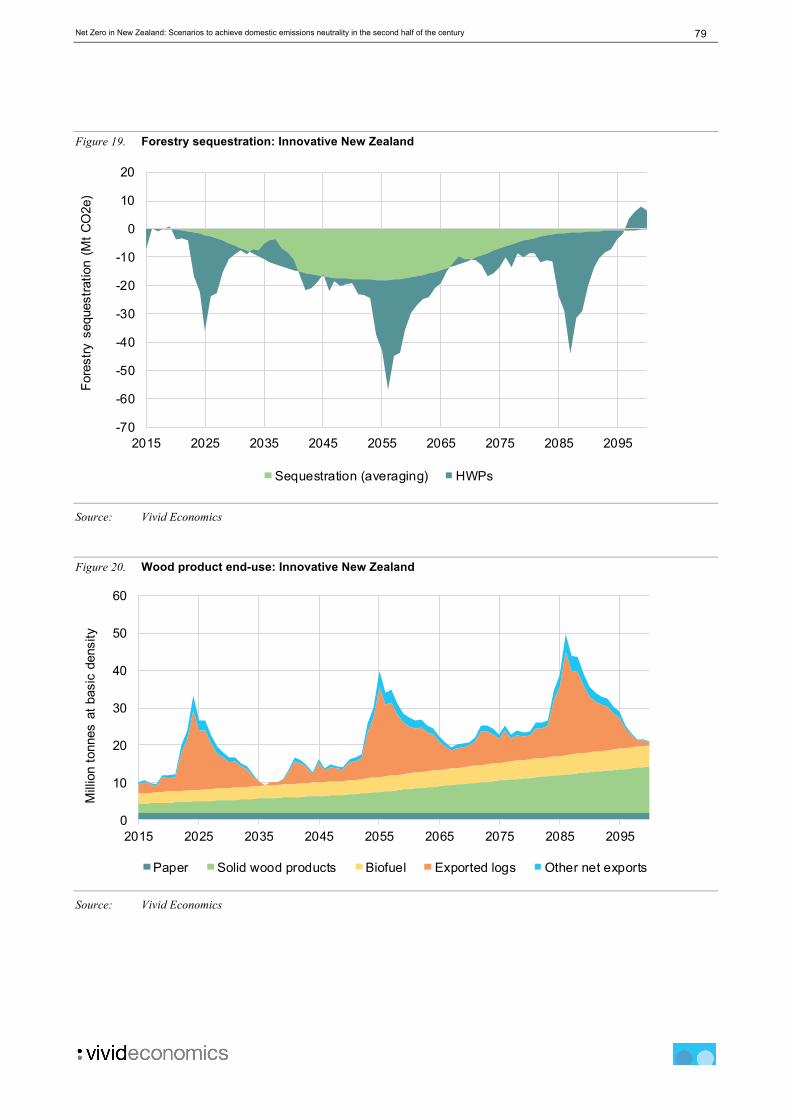
79 Net Zero in New Zealand: Scenarios to achieve domestic emissions neutrality in the second half of the century
Figure 19. Forestry sequestration: Innovative New Zealand
Source: Vivid Economics
Figure 20. Wood product end-use: Innovative New Zealand
Source: Vivid Economics
-70
-60
-50
-40
-30
-20
-10
0
10
20
2015 2025 2035 2045 2055 2065 2075 2085 2095
Fore
stry
seq
uest
ratio
n (M
t CO
2e)
Sequestration (averaging) HWPs
0
10
20
30
40
50
60
2015 2025 2035 2045 2055 2065 2075 2085 2095
Mill
ion
tonn
es a
t bas
ic d
ensi
ty
Paper Solid wood products Biofuel Exported logs Other net exports
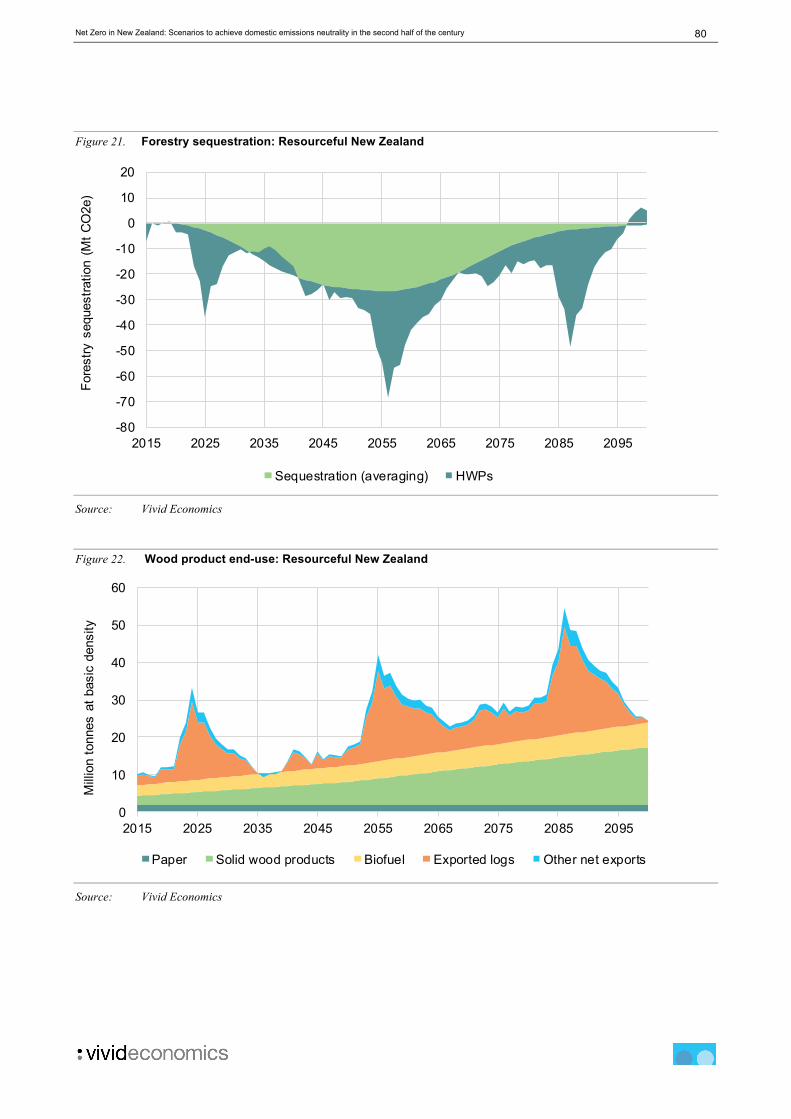
80 Net Zero in New Zealand: Scenarios to achieve domestic emissions neutrality in the second half of the century
Figure 21. Forestry sequestration: Resourceful New Zealand
Source: Vivid Economics
Figure 22. Wood product end-use: Resourceful New Zealand
Source: Vivid Economics
-80
-70
-60
-50
-40
-30
-20
-10
0
10
20
2015 2025 2035 2045 2055 2065 2075 2085 2095
Fore
stry
seq
uest
ratio
n (M
t CO
2e)
Sequestration (averaging) HWPs
0
10
20
30
40
50
60
2015 2025 2035 2045 2055 2065 2075 2085 2095
Mill
ion
tonn
es a
t bas
ic d
ensi
ty
Paper Solid wood products Biofuel Exported logs Other net exports

81 Net Zero in New Zealand: Scenarios to achieve domestic emissions neutrality in the second half of the century
3.3 Co-benefits and co-costs
Land mitigation options are associated with a range of co-benefits and co-costs. An assessment of the scale of each associated with a specific option is challenging, however. In particular (IPCC 2014a):
1. Co-benefits and co-costs for a given mitigation option depends on the farm context and the scale of the intervention: implementing the same mitigation measure in two different areas can have different socio-economic or environmental effects.
2. There is no agreement on attribution of co-benefits and co-costs to specific mitigation measures. 3. There are no standardised metrics for quantifying many of these effects.
A brief overview of possible co-benefits and co-costs is presented in Table 28.
Table 28. Land mitigation options are associated with a range of co-benefits and co-costs.
Mitigation action(s) Co-benefit Co-cost/barriers
- Precision agriculture - Supplementary feed through GM
ryegrass and maize silage - Application of DCD
Water and river quality improvements due to reduced nitrogen leaching with ancillary impacts on:
- Māori cultural identity and tribal obligations
- recreation (rowing swimming, wildlife viewing)
- health of aquatic life
Reputational risks associated with some options, for example GM ryegrass and DCD
- Efficiency improvements in lowest performing farms
- Low-emissions breeding - Vaccines and inhibitors
Sustainable food production with ancillary reputational benefits and price premium on food produce Possible increased attractiveness of New Zealand as a tourist destination
Reputational risks regarding animal welfare associated with some options, for example vaccines and inhibitors
Land use change from pastoral farming to horticulture
Reduced farm-level exposure to movements in commodity prices through diversification
Some market vegetables could be associated with higher nitrogen leaching, and impact water quality Risk of emissions leakage
Land use change from pastoral farming to forestry
Improved biodiversity and reduced risks to endangered species Soil erosion risk reduced Recreation and ecosystem services Improved water quality and quantity
Risk of monoculture from high levels of plantation forestry and economic risks in case of large-scale arboreal disease Changed economic structure and skills mismatch risks rural unemployment and disruption to communities Risk of emissions leakage
Source: Vivid Economics

82 Net Zero in New Zealand: Scenarios to achieve domestic emissions neutrality in the second half of the century
3.3.1 Co-benefits
It is likely that the co-benefits could be significant for mitigation options associated with reducing nitrogen intensity, which will reduce nitrogen leaching and hence improve groundwater quality. Current livestock rearing practices lead to significant amounts of nitrogen leaching into water, reducing water quality and potentially making it unsafe. Thus, reductions in livestock quantities or any measures to reduce nitrogen leaching could result in higher water quality especially in catchments where this has deteriorated. This is discussed in Box 6. Some agriculture mitigation options could also help to address farm-level economic risks. By diversifying land uses at farm-level, through increasing horticulture and forestry on the farm, producers could ensure that incomes losses from an adverse economic event are mitigated. These losses might be derived from the spread of a disease, such as foot and mouth, changes in demand away from pasture-based farm products or reductions in demand as a result of price competition from synthetic meats and milk. Land use change is associated with a range of co-benefits, especially if it involves increased afforestation. Forestry systems can enhance soil structure, soil carbon sequestration, biodiversity conservation as well as improve water quality, prevent sediment being washed into rivers, and support nutrient cycling. Agroforestry systems near crop fields can also improve air quality by capturing airborne soil particles. The soil erosion benefits of afforestation are particularly important. Soil erosion is irreversible and cumulative; vast areas of land have already been eroded as a result of clearing of scrub, particularly in the east of the North Island. Climate change is projected to lead to more intense and frequent heavy downpours, exacerbating these problems. An eroded area can tip into another state when plants cannot re-establish because so much fertility has been lost. Planting trees and supporting native forest regeneration on unstable hill country can help to slow erosion (Parliamentary Commissioner for the Environment 2013). An expansion of forestry can also help support biodiversity and endangered species. A total of 118 threatened species have been recorded or observed within plantation estates (Pawson et al. 2010). However, of these species, 54 were recorded within exotic forest stands and 44 species have only been observed in the managed indigenous forest remnants, wetlands, and frost flats that are embedded within plantation estates. The biodiversity benefits of increased forest cover are likely to increase in value as the climate changes, and habitat connectivity becomes more valuable for species adaptation (Bennett 2003). Finally, there is a value of recreation and ecosystem services in planted or native forests. Several studies have estimated recreational values based on willingness-to-pay estimates:
- Three economic valuation studies of individual planted forests showed that the value of recreation provided ranges between NZ$34 and NZ$67 per visit (Monge et al. 2015).
- Choice modelling used to estimate the value of improving water quality and quantity (and also biodiversity) in planted forests in Hawke’s Bay suggested that households would be willing to pay hundreds of dollars per year for improvements in the provision of these services (Palma 2008).
83 Net Zero in New Zealand: Scenarios to achieve domestic emissions neutrality in the second half of the century
Box 6. Water quality co-benefits associated with reduced nitrogen leaching
The main source of nitrogen in New Zealand’s waterways is urine from farm animals. Urine contains urea, which is rich in nitrogen. Particularly when paddocks are waterlogged in winter, nitrogen washes through the soil before plants can use it. Artificial fertilisers are a much smaller source of nitrogen than animal urine. However, their increased use has enabled herd intensification, increasing the quantity of urine and thus further contributing to nitrogen leaching in waterways (Parliamentary Commissioner for the Environment 2013). There are two main ways in which nutrients affect water quality (Parliamentary Commissioner for the Environment 2013): − Nitrate and ammonia toxicity – too much nitrogen (in the form of nitrate) can kill sensitive
organisms, and affect humans and animals that drink the water. In the Waikato region, about 31 per cent of groundwater samples collected from dairy farms had nitrate levels above the drinking standard limit (Monge et al. 2015)
− Excessive growth of unwanted plants – this occurs at lower nitrogen levels and results in growth in slime, algae and choking weeds. These degrade swimming, rowing, food-gathering, wildlife-viewing and fishing spots, and deplete oxygen in the water, resulting in loss of aquatic life.
Reductions in livestock production or nitrogen emissions intensities can thus mitigate or even reverse these adverse impacts on water. In general, use of land for pastoral dairy will result in relatively high levels of nitrogen loss. Sheep and beef farms are also sources of nitrogen loss, while the conversion of pastoral land to plantation forests or scrub will generally reduce nitrogen losses. Rates of nitrogen loss vary significantly according to geological and farm management practices. At the extremes, the rates of nitrogen loss from a dairy farm can range between 14 and 195 kgs of nitrogen per hectare each year (Parliamentary Commissioner for the Environment 2013). Other forms of agriculture, including vegetable cropping, have higher rates of nitrogen loss per hectare. The possible implications of an expanded horticulture and crops industry for leaching are discussed below. People value the conservation of native plants and animals in waterways, as well as the recreation opportunities these provide, and are willing to pay for proposed programmes that would conserve and sustain the provision of these services. For Māori, freshwater resources can be associated with a range of values extending to guardianship, genealogical connections, sacred and treasured sites and recreational interests, as well as affecting the commercial and economic interests of iwi (Henry 2014). Improved water quality and reduced environmental impacts could positively impact on many of these values. Combinations of mitigation techniques can have a significant impact on nitrogen leaching, although profitability may be affected. One case study in Waikato found that nitrogen losses were reduced by 40-50 per cent by using less nitrogen fertiliser, a lower stocking rate, and cattle that excrete less nitrogen in their urine and that are taken off pasture for defined periods (DairyNZ 2014). However, profitability also fell by 5 per cent suggesting that regulatory or market-based mechanisms

84 Net Zero in New Zealand: Scenarios to achieve domestic emissions neutrality in the second half of the century
may be required to unlock these co-benefits.
3.3.2 Co-costs and other barriers
However, land mitigation options present a range of co-costs and other barriers, especially given the production and emissions characteristics of agriculture. While all characteristics of agricultural emissions are shared by at least one other sector, the combination of characteristics makes the sector unusual (Kerr 2016):
⎯ New Zealand is unique among developed countries in its share of income from the agricultural sector; land use changes away from agriculture could result in balance of payments and fiscal challenges;
⎯ emissions are controlled by a large number of diffuse agents making choosing the point of regulation difficult, and;
⎯ administrative costs of some options could be high given biological complexity makes monitoring and verification of emissions challenging.
A corollary of New Zealand’s high share of income derived from agriculture is that the sector is strongly exposed to international competition, making emissions leakage a risk. This could be a particularly pertinent barrier given no other country has attempted to price biological emissions. The trade exposure of some farm products, means that farmers may not be able to pass on all of the costs of mitigation (or emissions liabilities if brought under the New Zealand ETS) to consumers. A net zero GHG emissions world implies mitigation of GHG in all of New Zealand’s major competitors, which would minimise the risk of leakage. Employment co-costs could occur from a switch away from pastoral agriculture. Modelling of the transition to higher levels of forestry in the Waikato region, suggests that the economic gains and losses resulting from such land use changes largely cancel each other out, and may be relatively minor at the regional scale (Huser et al. 2012). However, employment from forestry production is more concentrated in regional centres rather than rural areas. (Fairweather & Mayell 2000) A switch from pastoral farming and towards forestry could therefore be associated with reduced rural employment and incomes and community displacement. There could be reputational risks associated with several mitigation options. For instance, if DCD remnants are still found in milk products or GM ryegrasses are introduced, then this could undermine New Zealand’s ability to market the environmental sustainability of its products. There may also be environmental impacts from changed agricultural production patterns. A switch to certain types of horticulture, particularly vegetables, could result in higher nitrogen leaching and water quality issues as market vegetables do not absorb fertilisers as well as grassland. Estimates suggest that market gardening may result in almost three times as much nitrogen leaching per hectare as dairy, with other cropping losing nitrogen at a rate similar to dairy (Clothier et al. 2007; Menneer et al. 2004). There is likely to be a net reduction in leaching in the Off Track New Zealand and Resourceful New Zealand scenarios;
85 Net Zero in New Zealand: Scenarios to achieve domestic emissions neutrality in the second half of the century
however there is a risk that if not coupled with improved management practices, land use changes in an Innovative New Zealand scenario could lead to an increase nitrogen leaching. 3.4 Research agenda
Despite the potential for significant emissions reductions, the path to sustained, net zero emissions is far less clear for the land sector than for other sectors of the economy. In particular, by the end of the century significant technological advances and understanding of their implementation will be required in the pastoral agriculture sector if it is to limit its climate impacts. In order to facilitate these advances New Zealand has a role to play, alongside global efforts. Abatement options that are a priority for further research in the New Zealand context are:
⎯ Breakthrough technologies including vaccines and CH4 inhibitors. New Zealand devotes considerable resources to agriculture R&D, including through the Global Research Alliance, Pastoral Greenhouse Gas Research Consortium, New Zealand Agricultural Greenhouse Gas Research Centre and Crown Research Institutes. However further support may be required for research programmes on vaccines and CH4 inhibitors to demonstrate their technical viability and commercial case for use in non-feedlot pastoral systems. Given global interest in these technologies, there is scope for New Zealand to co-operate with other countries on such programmes.
⎯ Soil farming and biochar abatement potential and costs. Some authors focus on the difficulties to measure, monitor and verify savings from these options while others suggest that there is significant scope for rollout (Sims et al. 2016). Further research in the New Zealand context of the costs and scope for roll out is required before this can be included in a robust assessment of abatement potential. This research could focus on the need for better quantification on the effects of biochar on soil productivity and nitrogen leaching, along with the extent to which emissions reductions could be permanent.
Further development of tools for monitoring on-farm emissions can assist in the measurement of emissions and their management. OVERSEER, a nutrient budgeting and greenhouse gas management tool developed through a collaboration of government, research and industry, provides a good example of the types of tools necessary to tie farm practices with specific mitigation outcomes. Further development of OVERSEER and related tools could help support knowledge sharing and further research. For instance, knowledge sharing regarding feeding strategies and their impact on livestock productivity and nitrogen excretion could be used to optimise production while reducing emissions. Identifying the impacts of specific abatement activities at a farm level will enable better targeting of incentives in the agricultural sector. A better understanding of historic emissions and decomposition of efficiency trends can help to estimate the rebound effect and provide a better understanding of future mitigation options better. Improved farm- and animal-level efficiency may be reliable ways of decreasing emissions intensity, especially for low-efficiency systems. However, a more detailed examination of the relationship between performance and emissions intensity is required to help improve the understanding of the impact on total emissions due to an increase in the consumption of land-based services, and to design appropriate policy as a result.

86 Net Zero in New Zealand: Scenarios to achieve domestic emissions neutrality in the second half of the century
Understanding of the relationship between forest management regimes, yields and sequestration at the regional and local level can help improve decision making. Plantation forestry is already delivering significant levels of sequestration for New Zealand. Management regimes can have a major impact on the amount of sequestration derived from a plantation forest. Understanding these relationships can help foresters optimise their management regimes between total yield and sequestration. Finally, across all agricultural mitigation options, an absence of reliable estimates of costs and benefits is common. This is a common challenge for land-based mitigation. More funding could help account for differences in farm types, farm systems, soil qualities and temperatures, in addition to improved cost estimates for alternative land uses such as horticulture. While co-benefits from mitigation options are often site-specific making generalisations difficult, modelling frameworks are being developed that allow an integrated assessment of multiple outcomes at landscape, project and smaller scales (Reisinger et al. 2016). Such frameworks could be used to quantitatively estimate co-benefits in order to help inform evidence based policy.

87 Net Zero in New Zealand: Scenarios to achieve domestic emissions neutrality in the second half of the century
4 References
AEA, 2010. Potential for post 2030 emissions reduction from industry. , (1). Available at: https://www.theccc.org.uk/wp-content/uploads/2013/04/AEA-post-2030-industry-summary-report-version-1.0.pdf.
AgResearch, 2015. Shortlist of five holds key to reduced methane emissions from livestock. Available at: http://www.agresearch.co.nz/news/shortlist-of-five-holds-key-to-reduced-methane-emissions-from-livestock/.
Air Resources Board, 2015. Heavy Duty Technology and Fuels Assessment: Overview, Sacramento, US. Anastasiadis, S. & Kerr, S., 2013. Mitigation and Heterogeneity in Management Practices on New Zealand
Dairy Farms. , 13–11(October). Available at: http://www.motu.org.nz/publications/detail/mitigation_and_heterogeneity_WP.
Barnard, L.T. et al., 2011. The impact of retrofitted insulation and new heaters on health services utilisation and costs , pharmaceutical costs and mortality. Evaluation of Warm Up New Zealand: Heat Smart. Available at: http://www.healthyhousing.org.nz/wp-content/uploads/2012/03/NZIF_Health_report-Final.pdf
Bennett, A., 2003. Linkages in the Landscape: The Role of Corridors and Connectivity in Wildlife Conservation, Available at: http://books.google.com/books?hl=en&lr=&id=hkkXEpcWOOgC&oi=fnd&pg=PR9&dq=Linkages+in+the+Landscape+The+Role+of+Corridors+and+Connectivity+in+Wildlife+Conservation&ots=1-UvjYV2Ri&sig=reC408WOMYf1LHAZAkrh4w_VjKk.
Beukes, P.C. et al., 2010. Improving Production Efficiency as a Strategy to Mitigate Greenhouse Gas Emissions on Pastoral Dairy Farms in New Zealand. Ecosystems and Environment, pp.358–365.
Bloomberg New Energy Finance, 2016. New Energy Outlook 2016: Powering a Changing World.
Bryan, B. a. et al., 2016. Land-use and sustainability under intersecting global change and domestic policy scenarios: Trajectories for Australia to 2050. Global Environmental Change, 38, pp.130–152.
Bubeck, S., Tomaschek, J. & Fahl, U., 2016. Perspectives of electric mobility: Total cost of ownership of electric vehicles in Germany. Transport Policy, 50, pp.63–77.
Burr, L., 2017. KiwiRail’s diesel trains add 4700 cars worth of carbon. Newshub. Busines NZ Energy Council, 2015. New Zealand Energy Scenarios: Navigating energy futures to 2050,
Available at: http://www.bec.org.nz/__data/assets/pdf_file/0014/110309/BEC-Report.pdf Cameron, K.C., 2015. Dicyandiamide (DCD) effect on nitrous oxide emissions, nitrate leaching and pasture
yield in Canterbury, New Zealand. Available at: http://www.tandfonline.com/doi/abs/10.1080/00288233.2013.797914.
Camuzeaux, J., 2012. Mitigating Hydrofluorocarbons (HFCs), Available at: http://climate.columbia.edu/files/2012/04/GNCS-HFCs-Factsheet.pdf.
CarbonScape, 2017a. CarbonScape: Transforming Carbon.
CarbonScape, 2017b. CarbonScape: Transforming Carbon: Green Coke.
CCC, 2012. International Aviation and Shipping Review. Chapter 5. , pp.1–13. Available at: https://www.theccc.org.uk/archive/aws/IA&S/CCC_IAS_Tech-Rep_2050Target_Ch5_Industry.pdf.
CDP, 2015. Putting a Price on Risk: Carbon Pricing in the Corporate World, Available at: https://www.cdp.net/CDPResults/carbon-pricing-in-the-corporate-world.pdf.

88 Net Zero in New Zealand: Scenarios to achieve domestic emissions neutrality in the second half of the century
Chapman, R. et al., 2009. Retrofitting houses with insulation: a cost-benefit analysis of a randomised community trial. Journal of epidemiology and community health, 63, pp.271–277. Available at: http://jech.bmj.com/content/63/4/271.short.
Chapman, R., 2008. Transitioning to Low-Carbon Urban Form and Transport in New Zealand. Political Science, 60(1), pp.89–98.
ClimateWorks Australia, 2014. Pathways to Deep Decarbonisation in 2050. , (September), pp.1–49. Clothier, B. et al., 2007. Farm strategies for contaminant management. A report by SLURI, the sustainable
Land Use Research Initiative for Horizons Regional Council. , (June), p.67. Available at: http://www.horizons.govt.nz/assets/horizons/Images/one_plan/Farm Strategies for Contaminant Management June 2007.pdf.
Committee on Climate Change, 2015. Sectoral scenarios for the Fifth Carbon Budget: Technical Report, London, UK.
CommTrade Carbon, 2017. NZUs - Spot. Available at: https://www.commtrade.co.nz/.
Concept Consultancy, 2016a. Consumer Energy Options in New Zealand – 2016 Update, Concept Consultancy, 2016b. Electric cars , solar panels , and batteries in New Zealand Vol 2 : The benefits
and costs to consumers and society, Wellington. Concept Consultancy, 2016c. Electric cars , solar panels and batteries – how will they affect New Zealand ’
s greenhouse gas emissions ?, Available at: http://www.concept.co.nz/uploads/2/5/5/4/25542442/_new_technologies_emissions_report_final.pdf
DairyNZ, 2016. New Zealand Dairy Statistics 2015-16, Hamilton, NZ. Available at: http://www.dairyco.org.uk/non_umbraco/download.aspx?media=1438.
DairyNZ, 2014. Pastoral 21 - Profitable dairy systems, low footprint. Book chapter, (24), pp.1–915. Available at: papers://8640b87f-578d-4ea3-b2bb-2ffcc06c7806/Paper/p6910.
Dechezlepretre, A. & Sato, M., 2014. The Impacts of Environmental Regulations on Industrial Activity: Evidence, Journal of Political Economy Vol. 110 No. 6 pp. 1175-1219.
Denne, T. & Bond-Smith, S., 2012. Economic Factors of Waste Minimisation in New Zealand, Auckland.
Department of Conservation, 2017. Native Plants. Available at: http://www.doc.govt.nz/nature/native-plants/.
DOE, 2006. Environmental Impacts , Attributes , and Feasibility Criteria. In The Future of Geothermal. Washington D.C.: U.S Department of Energy.
Doole, G.J., 2014. Least-cost greenhouse gas mitigation on New Zealand dairy farms. Nutrient Cycling in Agroecosystems, 98(2), pp.235–251.
Doole, G.J. & Paragahawewa, U.H., 2011. Profitability of Nitrification Inhibitors for Abatement of Nitrate Leaching on a Representative Dairy Farm in the Waikato Region of New Zealand. Water, 3(4), pp.1031–1049. Available at: http://www.mdpi.com/2073-4441/3/4/1031/.
EECA, 2016. Energy end use database. Energy Efficiency and Conservation Authority. Available at: https://www.eeca.govt.nz/resources-and-tools/tools/energy-end-use-database/ [Accessed February 3, 2017].
EIA, 2016. Kigali amendment to the Montreal Protocol: A Crucial Step in the Fight Against Catastrophic Climate Change, London and Washington.
Energy Efficiency and Conservation Authority, 2010. Good Practice Guide Production of wood fuel from forest landings, p.44.
Ewing, R. et al., 2007. Growing Cooler: The Evidence on Urban Development and Climate Change.

89 Net Zero in New Zealand: Scenarios to achieve domestic emissions neutrality in the second half of the century
Fairweather, J.R. & Mayell, P.J., 2000. A Comparison of the Employment Generated by Forestry and Agriculture in New Zealand and Simon R . Swaffield Research Report No . 246
Food and Agriculture Organization of the UN, 2016. Forestry Production and Trade: New Zealand. Available at: http://www.fao.org/faostat/en/#data/FO.
Frykberg, E., 2016. Nova Energy plans gas-fired power plant. RadioNZ.
Fulton, L. & Miller, M., 2015. Strategies for Low-Carbon Emission Trucks in, Davis, US. Gillingham, K. & Leaver, J., 2008. Impact of Carbon Policy on the Composition of the Vehicle Fleet in New
Zealand. In Energy, Transport and Sustainability Symposium (NERI/IPS), pp. 1–7. Global CCS Institute, 2016. Global Status of CCS Special Report: Understanding Industrial CCS Hubs and
Clusters, Melbourne, Australia.
Government, N.Z., 2016. Managing New Zealand’s International and Domestic Aviation Emissions: New Zealand’s response to the International Civil Aviation Organisation 2010 Assembly Resolution A37-19 and 2013 Assembly Resolution A38-18, (September).
Graham, K., 2015. Climate Goals for New Zealand in 2030 : An Ambitious Domestic Emissions Target, Wellington.
Grimes, A. et al., 2012. Cost Benefit Analysis of the Warm Up New Zealand : Heat Smart Programme Ministry of Economic Development, Wellington.
Group, A., 2016. Briefing: Decarbonising heat in buildings, London, UK.
Hall, P., 2013. Bioenergy options for New Zealand: Key findings from five studies. WIREs Energy and Environment, 2(6), pp.587–601.
Hall, P. & Jack, M., 2009. Bio-energy options for NZ: Analysis of Large-Scale Bioenergy from Forestry, Available at: https://www.niwa.co.nz/sites/niwa.co.nz/files/imported/__data/assets/pdf_file/0007/95668/Large-scale-forestry-for-bioenergy.pdf.
Henry, J., 2014. Waikato and Waipa River Iwi values document review – Waikato Economic Joint Venture study.
Holdaway, R.. et al., 2014. Annual carbon emissions associated with natural disturbance in New Zealand's natural and planted forests.
Holm, A., Jennejohn, D. & Blodgett, L., 2012. Geothermal Energy and Greenhouse Gas Emissions, Washington D.C.
Horticulture New Zealand, 2016. Horticulture Statistics.
Hristova, A.N. et al., 2015. An inhibitor persistently decreased enteric methane emission from dairy cows with no negative effect on milk production. Proceedings of the National Academy of Sciences of the United States of America. Available at: http://www.pnas.org/content/112/34/10663.
Huser, B. et al., 2012. Land use change from pastoral farming to carbon forestry: Identifying trade-offs between ecosystem services using economic-ecological spatial modeling. iEMSs 2012 - Managing Resources of a Limited Planet: Proceedings of the 6th Biennial Meeting of the International Environmental Modelling and Software Society, pp.2219–2226. Available at: http://www.scopus.com/inward/record.url?eid=2-s2.0-84894220998&partnerID=tZOtx3y1.
IEA, 2016. Global EV Outlook 2016: Beyond one million electric cars.
IEA, 2017a. New Zealand 2017 Review, Available at: https://www.iea.org/publications/freepublications/publication/EnergyPoliciesofIEACountriesNewZealand2017.pdf.
IEA, 2017b. New Zealand 2017 Review, Available at:
90 Net Zero in New Zealand: Scenarios to achieve domestic emissions neutrality in the second half of the century
https://www.iea.org/publications/freepublications/publication/energy-policies-of-iea-countries---new-zealand-2017-review.html
IEA, 2007. World Energy Outlook 1st ed., OECD/IEA. Intergovernmental Panel on Climate Change (IPCC), 2017. Emission Factor Detail (ID: 517430). Available
at: http://www.ipcc-nggip.iges.or.jp/EFDB/ef_detail.php.
IPCC, 2014a. 2014: Agriculture, Forestry and Other Land Use (AFOLU). In: Climate Change 2014: Mitigation of Climate Change. Contribution of Working Group III to the Fifth Assessment Report of the Intergovernmental Panel on Climate Change.
IPCC, 2014b. Climate Change 2014: Mitigation of Climate Change. In Contribution of Working Group III to the Fifth Assessment Report of the Intergovernmental Panel on Climate Change. Cambridge, United Kingdom and New York, NY, USA.: Cambridge University Press.
IPCC, 2000. Summary for Policymakers: Emissions Scenarios. A Special Report of Working Group III of the Intergovernmental Panel on Climate Change.
IRENA, 2012. Renewable Energy Technologies: Cost Cost Analysis Series: Biomass for Power Generation, Bonn, Germany.
ITP, 2016. Solar Pv and Batteries in New Zealand – Consumer Centric Electricity, Canberra. Jack, M. & Hall, P., 2010. Large-scale forests for bioenergy: land-use, economic and environmental
implications. Unasylva, 61(234/235), pp.23–27. Available at: http://www.fao.org/docrep/012/i1507e/i1507e06.pdf.
Kear, G. & Chapman, R., 2013. “Reserving judgement”: Perceptions of pumped hydro and utility-scale batteries for electricity storage and reserve generation in New Zealand. Renewable Energy, 57, pp.249–261.
Kerr, S., 2016. Agricultural Emissions Mitigation in New Zealand : Answers to Questions from the Parliamentary Commisioner for the Environment, Wellington.
Kruger, P., Blakeley, J. & Leaver, J., 2003. Potential in New Zealand for use of hydrogen as a transportation fuel. International Journal of Hydrogen Energy, 28(8), pp.795–802.
Leaver, J.D. & Gillingham, K.T., 2009. Economic Impact of the Integration of Alternative Vehicle Technologies into the New Zealand Vehicle Fleet. Chemical Engineering Transactions, 18, pp.641–646.
Level, 2016. Minimising Waste. Lindsay, G., Macmillan, A. & Woodward, A., 2011. Moving urban trips from cars to bicycles: Impact on
health and emissions. Australian and New Zealand Journal of Public Health, 35(1), pp.54–60.
MacLean, K. et al., 2016. Managing Heat System Decarbonisation: Comparing the impacts and costs of transitions in heat infrastructure, London.
Macleod, M. et al., 2015. Cost-Effectiveness of Greenhouse Gas Mitigation Measures for Agriculture: A Literature Review, Paris, France.
Manley, B., 2016. Afforestation responses to carbon price changes and market certainties.
Manley, B.B. & Evison, D., 2016. Material flow and end-use of harvested wood products produced from New Zealand log exports (Prepared for the Ministry for Primary Industries).
Mason, I.G., Page, S.C. & Williamson, A.G., 2013. Security of supply, energy spillage control and peaking options within a 100% renewable electricity system for New Zealand. Energy Policy, 60, pp.324–333. Available at: http://dx.doi.org/10.1016/j.enpol.2013.05.032.
MBIE, 2016a. Electricity demand and generation scenarios: scenario and results summary, Wellington.

91 Net Zero in New Zealand: Scenarios to achieve domestic emissions neutrality in the second half of the century
MBIE, 2015a. Electricity graph and data tables. MBIE, 2016b. Energy Data Overview Tables, Wellington, NZ.
MBIE, 2015b. Energy in New Zealand 2015: Energy and Building Trends, Wellington. Available at: http://ci.nii.ac.jp/naid/40020762305/.
MBIE, 2016c. Greenhouse gas emissions- Annual emissions data table. Ministry of Business, Innovation and Employment.
MBIE, 2016d. New Zealand’s Energy Outlook: Electricity Insight, Wellington.
MBIE, 2017. New Zealand Smart Grid Forum: Architecting a future electricity system for all New Zealanders.
MBIE, 2016e. Unlocking our energy productivity and renewavle potential: draft New Zealand Energy Efficiency and Conservation Strategy 2017-2022, Wellington.
Menneer, J.C., Ledgard, S.F. & Gillingham, A.G., 2004. Land use impacts on nitrogen and phosphorus loss and management options for intervention.
MfE, 2015a. New Zealand’s Second Biennial Report Under the United Nations Framework Convention on Climate Change, Wellington.
MfE, 2013. New Zealand’s Sixth National Communication under the United Nations Framework Convention on Climate Change and the Kyoto Protocol, Wellington.
MfE, 2015b. Waste Assessments and Waste Management and Minimisation Planning: A Guide for Territorial Authorities, Wellington.
MfE, 2016. New Zealand’s Greenhouse Gas Inventory 1990-2014, Wellington.
Monge, J. et al., 2015. Identifying Complementarities for the Dairy and Forestry Industries in the Central North Island. Available at: https://www.waikatoregion.govt.nz/assets/PageFiles/40444/4.12%20-%203773177.pdf
MOT, 2011. Aging of the light vehicle fleet – May 2011, Wellington. MOT, 2015. Annual fleet statistics 2015, Wellington.
MOT, 2014a. Future Demand New Zealand transport and society: Trends and projections, Wellington. MOT, 2014b. National Freight Demand Study, Wellington.
MPI, 2015. Look-up Tables for Forestry in the Emissions Trading Scheme, Wellington. MPI, 2016. National Exotic Forest Description 2015. Ministry for Primary Industries. Available at:
https://www.mpi.govt.nz/news-and-resources/open-data-and-forecasting/forestry/new-zealands-forests/ [Accessed November 1, 2016].
Nair, N.K.C. & Zhang, L., 2009. SmartGrid: Future networks for New Zealand power systems incorporating distributed generation. Energy Policy, 37(9), pp.3418–3427. Available at: http://dx.doi.org/10.1016/j.enpol.2009.03.025.
NDRC, 2016. Money To Burn ? Its Coal Plants With Truly Clean Energy. , (October). Available at: https://www.nrdc.org/sites/default/files/uk-biomass-replace-coal-clean-energy-ib.pdf.
Nederhoff, E., 2009. Transport Energy and CO2 : Moving towards Sustainability - Books - OECD iLibrary.
New Zealand Ministry for Primary Industries, 2017. Afforestation Grant Scheme. Available at: https://www.mpi.govt.nz/funding-and-programmes/forestry/afforestation-grant-scheme/.
New Zealand Ministry for Primary Industries, 2015a. Look-up Tables for Forestry in the Emissions Trading Scheme,
New Zealand Ministry for Primary Industries, 2015b. National Exotic Forest Description 2015: Yield Tables.
92 Net Zero in New Zealand: Scenarios to achieve domestic emissions neutrality in the second half of the century
Available at: https://www.mpi.govt.nz/news-and-resources/open-data-and-forecasting/forestry/new-zealands-forests/.
New Zealand Ministry for the Environment, 2016. New Zealand’s Greenhouse Gas Inventory 1990–2014: CRF Tables. Available at: http://www.mfe.govt.nz/publications/climate-change/new-zealand-greenhouse-gas-inventory-1990-2014.
Nykvist, B. & Nilsson, M., 2015. Rapidly falling costs of battery packs for electric vehicles. Nature Climate Change, 5(4), pp.329–332.
NZ Geothermal Association, 2016. Geothermal Emissions.
O’Sullivan, K.C., Howden-Chapman, P.L. & Fougere, G.M., 2015. Fuel poverty, policy, and equity in New Zealand: The promise of prepayment metering. Energy Research and Social Science, 7, pp.99–107.
Orme, S., 2017. ETS matters Looking on the bright side of the Field Measurement Approach, Available at: http://woodnet.co.nz/ets-matters-looking-bright-side-field-measurement-approach/
Palma, R.R., 2008. Environmental and Social Values from Plantation Forests: A Study in New Zealand with Focus on the Hawke’s Bay Region by.
Parliamentary Commissioner for the Environment, 2016. Climate change and agriculture: Understanding the biological greenhouse gases, Wellington.
Parliamentary Commissioner for the Environment, 2013. Water quality in New Zealand: Land use and nutrient pollution, Wellington.
PCE, 2016. Climate change and agriculture: Understanding the biological greenhouse gases. (October). Available at: http://www.pce.parliament.nz/media/1678/climate-change-and-agriculture-web.pdf.
Pollock, C., 2015. Reducing New Zealand’s Agricultural Greenhouse Gases: Soil Carbon. Available at: http://dx.doi.org/10.1038/ngeo1145.
Porter, C.. et al., 2013. Effects of the Built Environment on Transportation: Energy Use, Greenhouse Gas Emissions, and Other Factors, Washington D.C.
Reisinger, A. et al., 2016. Modelling Agriculture’s Contribution to New Zealand’s Contribution to the Post-2020 Agreement, Wellington.
Robertson, M., 2010. Agricultural productivity in Australia and New Zealand: trends, constraints and opportunities. Proceedings of the New Zealand Grassland Association 72, (November), pp.LI–LXII.
Ronaldo Vibart et al., 2012. Dairy Cattle Efficiencies, Productivity, Nutrient Losses and Greenhouse Gas Emissions from New Zealand Dairy Farms Identified as High Production, Low Emission Systems, pp.1–7.
Rubenstein, M., 2012. Mitigating Emissions from Cement, Columbia, US. Scion, 2009. Woody Biomass.
Scion, 2017. Working with Māori. Available at: http://www.scionresearch.com/general/working-with-scion/working-with-maori.
Shafiei, E. et al., 2014. Potential impact of transition to a low-carbon transport system in Iceland. Energy Policy, 69, pp.127–142.
Siddiqui, O., 2009. Assessment of achievable potential from energy efficiency and demand response programs in the US (2010–2030). Electric Power and Research Institute, January, (January 2009). Available at: http://scholar.google.com/scholar?hl=en&btnG=Search&q=intitle:Assessment+of+Achievable+Potential+from+Energy+Efficiency+and+Demand+Response+Programs+in+the+U.S.+(2010–2030)#0.
Simounet, D., 2013. Gaining Traction: Six Technologies that are Driving Efficiency, Reliability and Cost Reduction in the Passenger Rail Transport Industry, Québec, Canada.
93 Net Zero in New Zealand: Scenarios to achieve domestic emissions neutrality in the second half of the century
Simounet, D., 2014. Going Electric: The Rail Industry Approaches an Inflection Point. Sims, R. et al., 2016. Transition to a Low-Carbon Economy for New Zealand, Wellington. Available at:
http://www.mfe.govt.nz/publications/climate-change/new-zealands-greenhouse-gas-inventory-1990-2013.
Smith, S. & Braathen, N.A., 2015. Monetary Carbon Values in Policy Appraisal: An Overview of Current Practice and Key Issues. OECD Environment Working Papers, No. 92, OECD Publishing, Paris.
Statistics New Zealand, 2016a. Agrictulture: Variable by total New Zealand. Available at: http://www.stats.govt.nz/infoshare/ViewTable.aspx?pxID=93f73aaa-3482-4d75-a43a-ecd6d956e185 [Accessed February 3, 2017].
Statistics New Zealand, 2016b. Agriculture: Variable by total New Zealand. Available at: http://www.stats.govt.nz/infoshare/ViewTable.aspx?pxID=93f73aaa-3482-4d75-a43a-ecd6d956e185.
Statistics New Zealand, 2016c. Gross domestic product, by region and industry (Annual-Mar). Available at: http://www.stats.govt.nz/infoshare/ViewTable.aspx?pxID=0007e0d6-69c1-4c50-88bf-a3e6c4e8a693.
Statistics New Zealand, 2015a. Land Cover. Available at: http://www.stats.govt.nz/browse_for_stats/environment/environmental-reporting-series/environmental-indicators/Home/Land/land-cover.aspx.
Statistics New Zealand, 2016d. Livestock numbers by regional council. Available at: http://nzdotstat.stats.govt.nz/wbos/Index.aspx?DataSetCode=TABLECODE7423 [Accessed November 1, 2016].
Statistics New Zealand, 2016e. Livestock slaughtering: Total New Zealand. Available at: http://www.stats.govt.nz/infoshare/ViewTable.aspx?pxID=93f73aaa-3482-4d75-a43a-ecd6d956e185 [Accessed February 3, 2017].
Statistics New Zealand, 2015b. Trends in nitrogen leaching from agriculture. Available at: http://www.stats.govt.nz/browse_for_stats/environment/environmental-reporting-series/environmental-indicators/Home/Fresh water/nitrogen-leaching-agriculture.aspx.
Statistics New Zealand, 2016f. Value of Exports (including re-exports) - fob - SF1 (Qrtly-Mar/Jun/Sep/Dec). Available at: http://www.stats.govt.nz/infoshare/ViewTable.aspx?pxID=b0d494b9-8700-4a69-ba1d-55c19ec9f61a [Accessed December 1, 2016].
Suckling, I., 2013. Biofuels from forest biomass moves toward commercial production. Scion.
Sun, X.Z. et al., 2012. Greenhouse gas emissions from sheep fed fresh brassicas compared to perennial ryegrass.
The White House, 2016. United States Mid-Century Strategy for Deep Decarbonization, Washington D.C.
Toensmeier, E., 2016. The Carbon Farming Solution: A Global Toolkit of Perennial Crops and Regenerative Agriculture Practices for Climate Change Mitigation and Food Security. Available at: https://www.amazon.com/Carbon-Farming-Solution-Regenerative-Agriculture/dp/1603585710.
Tonkin and Taylor, 2014. New Zealand Non-Municipal Landfill Database, Auckland. Trigg, T. et al., 2013. Global EV Outlook: Understanding the Electric Vehicle Landscape to 2020. Iea, pp.1–
41. Available at: http://www.iea.org/publications/freepublications/publication/name-37024-en.html%5Cnhttp://scholar.google.com/scholar?hl=en&btnG=Search&q=intitle:Global+EV+Outlook:+Understanding+the+Electric+Vehicle+Landscape+to+2020#0.
U.S. Department of Energy Federal Energy Management Program (FEMP), 2016. Biomass for Electricity Generation. Whole Building Design Guide.
Upton, S., 2016. Managing Biological Sources and Sinks in the Context of New Zealand’s Response to Climate Change. In Nelson.
94 Net Zero in New Zealand: Scenarios to achieve domestic emissions neutrality in the second half of the century
Vitalis, V., 2007. Agricultural subsidy reform and its implications for sustainable development: the New Zealand experience. Environmental Sciences, 4(1), pp.21–40. Available at: http://www.tandfonline.com/doi/abs/10.1080/15693430601108086.
Wagner, C., 2008. Transmission to Enable Renewables Economic wind resource study. Electricity Commission, Wellington, NZ.
Walmsley, M.R.W. et al., 2014. Minimising carbon emissions and energy expended for electricity generation in New Zealand through to 2050. Applied Energy, 135, pp.656–665. Available at: http://dx.doi.org/10.1016/j.apenergy.2014.04.048.
Waste Not Consulting, 2009. Household sector waste to landfill in New Zealand, Auckland. Watt, M.S., Palmer, D.J. & Höck, B.K., 2011. Spatial description of potential areas suitable for afforestation
within New Zealand and quantification of their productivity under Pinus radiata. New Zealand Journal of Forestry Science, 41, pp.115–129.
West, J.J. et al., 2013. Co-benefits of Global Greenhouse Gas Mitigation for Future Air Quality and Human Health. Nature climate change, 3(10), pp.885–889.
Williams, I.D. et al., 2007. Comparative environmental impacts of intensive all-grass and maize silage-supplemented dairy farm systems : a review. Proceedings of the New Zealand Grassland Association, 2, pp.137–143.
van Wyk, L., 2014. Towards Net-Zero Construction and Demolition Waste. In: Green Building Handbook, South Africa: Volume 6: The Essential Guide, pp 132-141
Yule, I. et al., 2013. Case studies which demonstrate the financial viability of precision dairy farming. Proceedings of the 22nd International Grassland Congress, pp.610–613. Available at: http://www.grassland.org.nz/publications/nzgrassland_publication_2601.pdf.
Contact us: Vivid Economics Limited T: +44 (0)844 8000 254 26-28 Ely Place E: [email protected] London EC1N 6TD United Kingdom
Company Profile Vivid Economics is a leading strategic economics consultancy with global reach. We strive to create lasting value for our clients, both in government and the private sector, and for society at large. We are a premier consultant in the policy-commerce interface and resource- and environment-intensive sectors, where we advise on the most critical and complex policy and commercial questions facing clients around the world. The success we bring to our clients reflects a strong partnership culture, solid foundation of skills and analytical assets, and close cooperation with a large network of contacts across key organisations.