NET PRIMARY PRODUCTIVITY DYNAMICS AND DRIVING FORCES …
24
Wu et al.: Net primary productivity dynamics and driving forces in Guangzhou City, China - 6667 - APPLIED ECOLOGY AND ENVIRONMENTAL RESEARCH 16(5):6667-6690. http://www.aloki.hu ● ISSN 1589 1623 (Print) ● ISSN 1785 0037 (Online) DOI: http://dx.doi.org/10.15666/aeer/1605_66676690 2018, ALÖKI Kft., Budapest, Hungary NET PRIMARY PRODUCTIVITY DYNAMICS AND DRIVING FORCES IN GUANGZHOU CITY, CHINA WU, Y. 1 – LUO, Z. 2 – WU, Z. 1* 1 School of Geographical Sciences/Guangdong Province Engineering Technology Research for Geographical Conditions Monitoring and Comprehensive Analysis, Guangzhou University 510006 Guangzhou, China 2 South China Institute of Environmental Science, Ministry of Environmental Protection 510535 Guangzhou, China *Corresponding author e-mail: [email protected] (Received 2 nd Jul 2018; accepted 22 nd Aug 2018) Abstract. Urban expansion and land use/land cover change (LULCC), driven primarily by human activities, have significant influences on the environment; in addition, the two factors, together with climate change, have an impact on urban vegetation. This study explored spatiotemporal dynamics of net primary productivity (NPP) and calculated relative contributions of driving factors from 2001 to 2013 in Guangzhou City, China. The effects of climate variables, urban expansion, and subsequent LULCC on interannual NPP variability were analyzed and compared. Results showed that NPP fluctuated and generally declined in Guangzhou over the 13-year study period, especially significant in inner suburbs (southern, eastern, and northern regions (p < 0.05), due to increasingly intensive human activities. LULCC, especially the reduction of cropland due to urban sprawl, resulted in significant NPP losses and positive relative impact index (RII) values, which indicated that LULCC played a negative role in NPP accumulation. More than 67.2% of NPP variability was controlled by LULCC in the whole area under study and mean RII values in all regions were higher than 50%, indicating that the influence of LULCC on NPP variability was greater than that of climate change. Particularly noteworthy is the fact that local climate change had a greater influence on NPP in forested areas (e.g. in the northeastern region), but it should not be ignored that RII kept increasing annually in this region and therefore more efforts paid in conservation were required. In conclusion, urban expansion and LULCC across the whole study area are resulted from human activities, and this, rather than climate change, was the primary driving force for the regional reduction in NPP. Keywords: net primary productivity, urban expansion, climate change, land use/land cover change (LULCC), human activities Introduction Net primary productivity (NPP), the amount of photosynthetically fixed carbon available to the first heterotrophic level in an ecosystem (Field et al., 1998), is a key component of energy and matter transformation in terrestrial ecosystems. NPP plays an important role in global change and carbon balance as a key regulator of ecological processes, and is often used to quantify ecosystem service values. A decline in vegetation productivity is the primary manifestation of vegetation degradation, and NPP is an important indicator of productivity. In recent years, many studies of NPP have conducted long-term monitoring of vegetation dynamics in terrestrial ecosystems on both local and global scales, and results showed that vegetated ecosystems are susceptible to the effects of climate conditions and human activities, or the combined effects of them (Fu et al., 2013; Zhang et al., 2016; Wu and Wu, 2018; Chao et al., 2018; Fang et al., 2017).
Transcript of NET PRIMARY PRODUCTIVITY DYNAMICS AND DRIVING FORCES …
Wu et al.: Net primary productivity dynamics and driving forces in Guangzhou City, China
- 6667 -
APPLIED ECOLOGY AND ENVIRONMENTAL RESEARCH 16(5):6667-6690.
http://www.aloki.hu ● ISSN 1589 1623 (Print) ● ISSN 1785 0037 (Online)
DOI: http://dx.doi.org/10.15666/aeer/1605_66676690
2018, ALÖKI Kft., Budapest, Hungary
NET PRIMARY PRODUCTIVITY DYNAMICS AND DRIVING
FORCES IN GUANGZHOU CITY, CHINA
WU, Y.1 – LUO, Z.
2 – WU, Z.
1*
1School of Geographical Sciences/Guangdong Province Engineering Technology Research for
Geographical Conditions Monitoring and Comprehensive Analysis, Guangzhou University
510006 Guangzhou, China
2South China Institute of Environmental Science, Ministry of Environmental Protection
510535 Guangzhou, China
*Corresponding author e-mail: [email protected]
(Received 2nd
Jul 2018; accepted 22nd
Aug 2018)
Abstract. Urban expansion and land use/land cover change (LULCC), driven primarily by human
activities, have significant influences on the environment; in addition, the two factors, together with
climate change, have an impact on urban vegetation. This study explored spatiotemporal dynamics of net
primary productivity (NPP) and calculated relative contributions of driving factors from 2001 to 2013 in
Guangzhou City, China. The effects of climate variables, urban expansion, and subsequent LULCC on
interannual NPP variability were analyzed and compared. Results showed that NPP fluctuated and
generally declined in Guangzhou over the 13-year study period, especially significant in inner suburbs
(southern, eastern, and northern regions (p < 0.05), due to increasingly intensive human activities. LULCC, especially the reduction of cropland due to urban sprawl, resulted in significant NPP losses and
positive relative impact index (RII) values, which indicated that LULCC played a negative role in NPP
accumulation. More than 67.2% of NPP variability was controlled by LULCC in the whole area under
study and mean RII values in all regions were higher than 50%, indicating that the influence of LULCC
on NPP variability was greater than that of climate change. Particularly noteworthy is the fact that local
climate change had a greater influence on NPP in forested areas (e.g. in the northeastern region), but it
should not be ignored that RII kept increasing annually in this region and therefore more efforts paid in
conservation were required. In conclusion, urban expansion and LULCC across the whole study area are
resulted from human activities, and this, rather than climate change, was the primary driving force for the
regional reduction in NPP.
Keywords: net primary productivity, urban expansion, climate change, land use/land cover change (LULCC), human activities
Introduction
Net primary productivity (NPP), the amount of photosynthetically fixed carbon
available to the first heterotrophic level in an ecosystem (Field et al., 1998), is a key
component of energy and matter transformation in terrestrial ecosystems. NPP plays an
important role in global change and carbon balance as a key regulator of ecological
processes, and is often used to quantify ecosystem service values. A decline in
vegetation productivity is the primary manifestation of vegetation degradation, and NPP
is an important indicator of productivity. In recent years, many studies of NPP have
conducted long-term monitoring of vegetation dynamics in terrestrial ecosystems on
both local and global scales, and results showed that vegetated ecosystems are
susceptible to the effects of climate conditions and human activities, or the combined
effects of them (Fu et al., 2013; Zhang et al., 2016; Wu and Wu, 2018; Chao et al.,
2018; Fang et al., 2017).
Wu et al.: Net primary productivity dynamics and driving forces in Guangzhou City, China
- 6668 -
APPLIED ECOLOGY AND ENVIRONMENTAL RESEARCH 16(5):6667-6690.
http://www.aloki.hu ● ISSN 1589 1623 (Print) ● ISSN 1785 0037 (Online)
DOI: http://dx.doi.org/10.15666/aeer/1605_66676690
2018, ALÖKI Kft., Budapest, Hungary
Climate change influences NPP variability by altering levels of photosynthesis,
respiration, and the decomposition of organic carbon in the soil (Gong et al., 2012; Pei
et al., 2013b, 2015; Wang et al., 2013). According to the study by Nemani et al. (2003),
the increase in global NPP from 1982 to 1999 was partly due to global climate change,
and this trend was observed in China over the same period (Piao et al., 2005). NPP
variability is highly sensitive to climate change, but the mechanisms involved are
complicated (Liang et al., 2014; Ahlström et al., 2012; Gu et al., 2017). Human-induced
change, especially urbanization, is another important influencing factor of NPP
variability with complex mechanisms (Buyantuyev and Wu, 2012; Zhang et al., 2015;
Peng et al., 2016). Growing evidence has shown that urban expansion has a great
influence on regional ecosystems due to increased levels of greenhouse gas in the
atmosphere, the destruction of the ozone layer, biodiversity loss due to deforestation
(Verburg et al., 2002), and the reduction in landscape-level photosynthetic activity
(Imhoff et al., 2000). In addition, urban expansion, together with land use/land cover
(LULC) change, has dramatically influenced hydrological systems, biogeochemical
cycles, and climate (Grimm et al., 2008). This has led to alterations in the distribution,
structure, and material cycling of terrestrial ecosystems, ultimately affecting carbon
storage and flux (Imhoff et al., 2000; Piao et al., 2009; Hutyra et al., 2011).
Urbanization often causes reductions in NPP due to land cover transformation and
carbon fixing potential drops greatly when the land converts from cultivated land or
forests to developed land, or when a region transforms from a suburban area into an
urban area (Zhao et al., 2012; Jiang and Wu, 2015; Chen et al., 2017). Therefore,
climate change and human activities are two of the most important driving forces of
NPP variability. With aggravating global climate change and increasing human
activities, quantifying the effects of different driving factors on vegetation dynamics has
become a critical issue for mitigation and management planning. To date, some studies
have attempted to quantify relative contributions of climate change or human-induced
LULCC to NPP within specific regions (Yan et al., 2016; Xu et al., 2011; Zhang et al.,
2016). However, such studies are often lack a spatial quantitative component relating to
climate change and LULCC, and they do not take the spatial differences in the impacts
of these different driving forces on NPP into account.
Guangzhou City is ideal for the study of climate change and human-induced impacts
on NPP because it has hot and humid subtropical monsoon climate that favors year-
round vegetation growth. The city has experienced dramatic urbanization and LULCC,
which have converted large patches of croplands and woodlands into built-up areas
within a matter of a decade or even a few years. Guangzhou’s urban development
strategy of “southern expansion, northern optimization, eastern advance, western union”
in its 11th
Five-year Plan will continue to accelerate urban sprawl, which may lead to
multiple ecological problems. Some studies have noted that climate variables and
human activities have led to a significant change in vegetation productivity in urban
areas over a short period, with clear spatial heterogeneity. Accordingly, the study of
NPP variability and the driving mechanisms in Guangzhou can be regarded as a
representative case for southern China. This paper attempts to achieve the following
goals: (1) to examine the spatiotemporal variability in NPP across five regions during
2001-2013; (2) to analyze the effects of climate variables, urban expansion, and
subsequent LULCC on NPP; and (3) to reveal the relative contribution of driving forces
on NPP accumulation and describe the spatial heterogeneity.
Wu et al.: Net primary productivity dynamics and driving forces in Guangzhou City, China
- 6669 -
APPLIED ECOLOGY AND ENVIRONMENTAL RESEARCH 16(5):6667-6690.
http://www.aloki.hu ● ISSN 1589 1623 (Print) ● ISSN 1785 0037 (Online)
DOI: http://dx.doi.org/10.15666/aeer/1605_66676690
2018, ALÖKI Kft., Budapest, Hungary
Material and methods
Study area
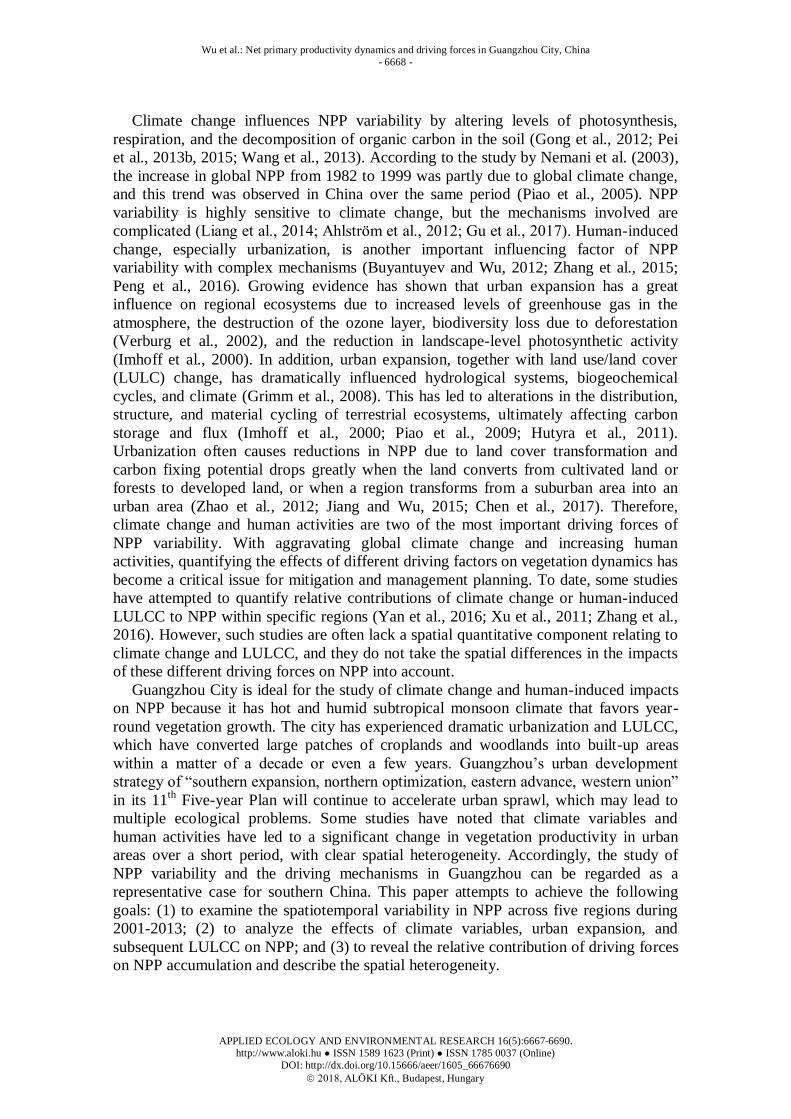
Guangzhou City (112°57’E~114°3’E and 22°26’N~23°56’N) is an important
political, economic, educational, scientific, and technological center within Guangdong
Province and South China (Fig. 1). It is located in the north end of the Pearl River Delta
region and adjoins the extension of the Nanling Mountains in the north and the South
China Sea in the south, with a total land area of 7,434.4 km2. The topography of
Guangzhou consists of hilly areas and plains, with elevation decreasing from northeast
to the southwest. It has a subtropical, marine monsoon climate with an annual average
temperature of 22 °C and annual precipitation of 1,982.7 mm. Guangzhou has
experienced dramatic urbanization due to China’s reform and opening up policies. In
recent decades, Guangzhou’s economy has developed fast, which supports a population
of over 12.9 million. Its regional Gross Domestic Product (GDP) has grown from
$268.48 billion in 2001 to $1,542.01 billion in 2013 (http://www.gzstats.gov.cn/).
According to urban planning (Urban Master Development Plan of Guangzhou (2001-
2010); the 10th
Five-year Plan (2001-2005) and the 11th
Five-year Plan (2006-2010)),
the development of Guangzhou was predominantly in five regions, namely the central
part, the south, the east, the north, and the northeast (Fig. 1). The central region mainly
includes old districts with overwhelming urbanization and significant economic
development. The southern, eastern, and northern regions are inner suburbs with rapid
urban development. The northeastern region is composed of outer suburbs which are
mainly dominated by forests and agricultural land, with relatively slower urban
development.
Figure 1. Location of study area, five regions and topography
Wu et al.: Net primary productivity dynamics and driving forces in Guangzhou City, China
- 6670 -
APPLIED ECOLOGY AND ENVIRONMENTAL RESEARCH 16(5):6667-6690.
http://www.aloki.hu ● ISSN 1589 1623 (Print) ● ISSN 1785 0037 (Online)
DOI: http://dx.doi.org/10.15666/aeer/1605_66676690
2018, ALÖKI Kft., Budapest, Hungary
Data collection and pre-processing
In this study, Terra MODIS data over the study area from 2001 to 2013 were selected
for the NPP simulation. Data included 16-day NDVI composites (MOD13Q1) at a
spatial resolution of 250 m, monthly land surface temperature (LST) (MOD11C3) at a
spatial resolution of 0.05° (5.55 km), and monthly evapotranspiration (ET) and potential
evapotranspiration (PET) (MOD16A2) at a spatial resolution of 1 km. All MODIS
datasets were downloaded from the National Aeronautics and Space Administration’s
(NASA) Earth Observation System. The monthly NDVI data were produced from the
MODIS 16-day products by using the maximum value composites (MVC) method,
which eliminated disturbances from clouds, the atmosphere, and altitude angle, and
minimized non-vegetation effects (Tucker et al., 1994). Other MODIS data were
aggregated to grid cells at a resolution of 250 m from their original Sinusoidal
Projection using the MODIS Reprojection Tool (MRT) to get the same spatial
resolution and projected coordinate system as the MODIS-NDVI data. All MODIS data
were checked using quality flags from the companion Quality Assurance (QA) images.
The MODIS LST products (MOD11C3) were used to estimate air temperature (Tair) for
the CASA model. Other studies have used this method to estimate Tair from MODIS
LST data, and confirmed that LST is highly correlated with Tair (Vancutsem et al., 2010;
Fu et al., 2011; Benali et al., 2012). In this study, Tair was estimated using LST data
based on cross validation across years (Fu et al., 2011). The results showed that the best
model had r2
values ranging from 0.82 to 0.90 and RMSE values ranging from 1.64 to
2.17 °C, for 2001-2013.
The climate data included monthly mean air temperature, total precipitation, and total
solar radiation data derived from 13 meteorological stations in and around Guangzhou.
These three weather variables were used to analyze the correlation with NPP and
simulate NPPp. and the percentage of sunlight was derived in order to calculate the total
solar radiation for simulating NPPp and NPP. These climate data were then interpolated
into raster format at 250 m spatial resolution by using the universal Kriging method to
match the MODIS NDVI data. All meteorological data were downloaded from the
Chinese National Metrological Information Center/China Meteorological
Administration (NMIC/CMA).
Finally, a time series of Landsat images were used to extract land cover over the
study areas. Data sources included Landsat Thematic Mapper (TM; bands 1-5 and 7)
images acquired on November 2005, December 2006, January 2009, October 2011;
Enhanced Thematic Mapper (ETM+; bands 1-5 and 7) images acquired on November
2001 and January 2003; and Operational Land Imager (OLI; bands 2-7) images
acquired on December 2013. These images were rectified to the Universal Transverse
Mercator (UTM) projection and World Geodetic System 1984 (WGS84) datum. After
Line-of-Sight Atmospheric Analysis of Spectral Hypercube (FLAASH) and image
mosaicking, the 2001 image was selected as the base image for automatic registration of
other images with Root Mean Square Errors (RMSE) of less than 0.5 pixels.
Subsequently, the images were masked using the boundary of the Guangzhou
Metropolitan area. A maximum likelihood supervised classification approach was used
to classify the Landsat images and they were combined with the actual land cover in
Guangzhou and the International Geosphere-Biosphere Program (IGBP) schemes.
Finally, land cover maps from seven years were classified into 12 categories (Table 1).
The overall accuracy of the classification results was higher than 82.5%.
Wu et al.: Net primary productivity dynamics and driving forces in Guangzhou City, China
- 6671 -
APPLIED ECOLOGY AND ENVIRONMENTAL RESEARCH 16(5):6667-6690.
http://www.aloki.hu ● ISSN 1589 1623 (Print) ● ISSN 1785 0037 (Online)
DOI: http://dx.doi.org/10.15666/aeer/1605_66676690
2018, ALÖKI Kft., Budapest, Hungary
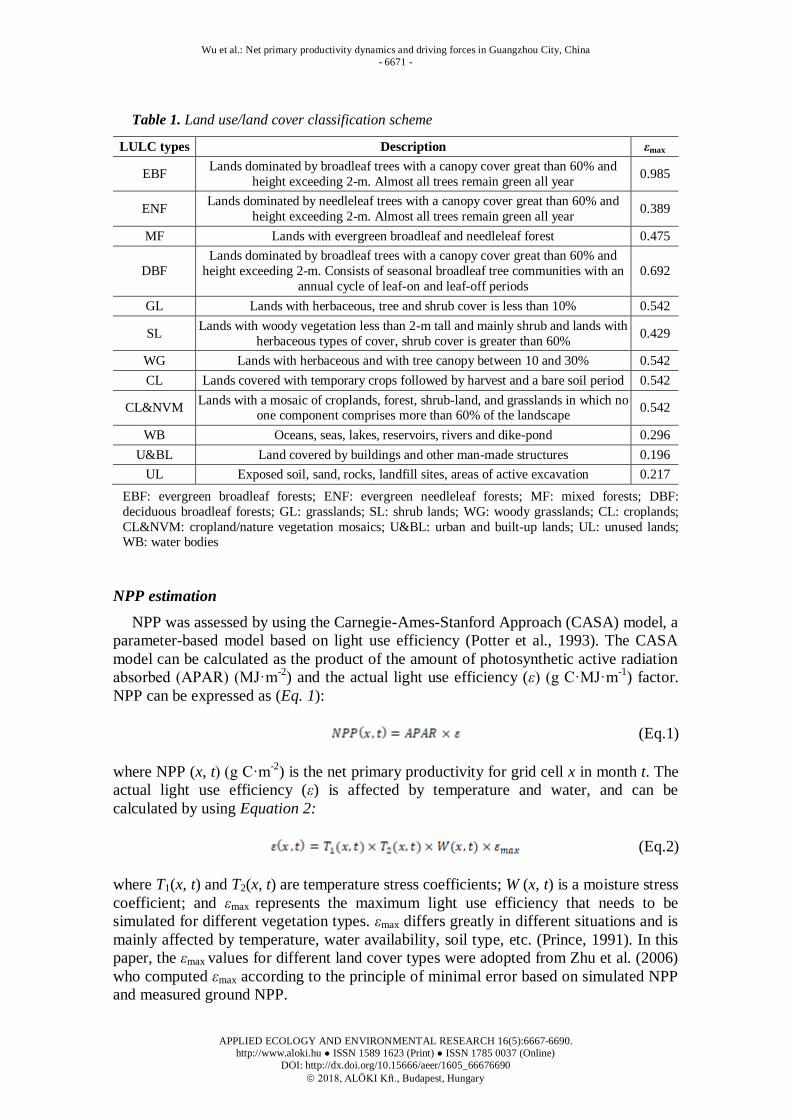
Table 1. Land use/land cover classification scheme
LULC types Description εmax
EBF Lands dominated by broadleaf trees with a canopy cover great than 60% and
height exceeding 2-m. Almost all trees remain green all year 0.985
ENF Lands dominated by needleleaf trees with a canopy cover great than 60% and
height exceeding 2-m. Almost all trees remain green all year 0.389
MF Lands with evergreen broadleaf and needleleaf forest 0.475
DBF
Lands dominated by broadleaf trees with a canopy cover great than 60% and
height exceeding 2-m. Consists of seasonal broadleaf tree communities with an
annual cycle of leaf-on and leaf-off periods
0.692
GL Lands with herbaceous, tree and shrub cover is less than 10% 0.542
SL Lands with woody vegetation less than 2-m tall and mainly shrub and lands with
herbaceous types of cover, shrub cover is greater than 60% 0.429
WG Lands with herbaceous and with tree canopy between 10 and 30% 0.542
CL Lands covered with temporary crops followed by harvest and a bare soil period 0.542
CL&NVM Lands with a mosaic of croplands, forest, shrub-land, and grasslands in which no
one component comprises more than 60% of the landscape 0.542
WB Oceans, seas, lakes, reservoirs, rivers and dike-pond 0.296
U&BL Land covered by buildings and other man-made structures 0.196
UL Exposed soil, sand, rocks, landfill sites, areas of active excavation 0.217
EBF: evergreen broadleaf forests; ENF: evergreen needleleaf forests; MF: mixed forests; DBF:
deciduous broadleaf forests; GL: grasslands; SL: shrub lands; WG: woody grasslands; CL: croplands;
CL&NVM: cropland/nature vegetation mosaics; U&BL: urban and built-up lands; UL: unused lands; WB: water bodies
NPP estimation
NPP was assessed by using the Carnegie-Ames-Stanford Approach (CASA) model, a
parameter-based model based on light use efficiency (Potter et al., 1993). The CASA
model can be calculated as the product of the amount of photosynthetic active radiation
absorbed (APAR) (MJ·m-2
) and the actual light use efficiency (ε) (g C·MJ·m-1
) factor.
NPP can be expressed as (Eq. 1):
(Eq.1)
where NPP (x, t) (g C·m-2
) is the net primary productivity for grid cell x in month t. The
actual light use efficiency (ε) is affected by temperature and water, and can be
calculated by using Equation 2:
(Eq.2)
where T1(x, t) and T2(x, t) are temperature stress coefficients; W (x, t) is a moisture stress
coefficient; and εmax represents the maximum light use efficiency that needs to be
simulated for different vegetation types. εmax differs greatly in different situations and is
mainly affected by temperature, water availability, soil type, etc. (Prince, 1991). In this
paper, the εmax values for different land cover types were adopted from Zhu et al. (2006)
who computed εmax according to the principle of minimal error based on simulated NPP
and measured ground NPP.
Wu et al.: Net primary productivity dynamics and driving forces in Guangzhou City, China
- 6672 -
APPLIED ECOLOGY AND ENVIRONMENTAL RESEARCH 16(5):6667-6690.
http://www.aloki.hu ● ISSN 1589 1623 (Print) ● ISSN 1785 0037 (Online)
DOI: http://dx.doi.org/10.15666/aeer/1605_66676690
2018, ALÖKI Kft., Budapest, Hungary
APAR is the product of PAR and the fraction of photosynthetically active radiation
(FPAR) (Wang et al., 2009), and PAR depends on the solar surface radiation (SOL)
(MJ·m-2
). Thus, NPP at location x and time t becomes (Eq. 3):
(Eq.3)
FPAR is defined as a linear function of NDVI and the simple ratio (SR) (Eq. 4):
(Eq.4)
where α is set to 0.5; FPARNDVI and FPARSR are FPAR estimated by the NDVI-FPAR
model (Eq. 5) and the SR-FPAR model (Eq. 6):
(Eq.5)
(Eq.6)
where NDVIi, max and NDVIi, min values correspond to 95% and 5% of the NDVI
population respectively, and i; SRi, max and SRi, min correspond to NDVIi,max and NDVIi, min
respectively. The relationship between NDVI and SR can therefore be expressed as
(Eq. 7):
(Eq.7)
SOL is the total solar radiation over time period (MJ·m-2
), can be calculated based on
the percentage of sunshine, namely (Eq. 8–12):
(Eq.8)
(Eq.9)
(Eq.10)
(Eq.11)
(Eq.12)
where Ra is the vertical incidence of solar radiation from the upper atmosphere; n/N is
the percentage of sunshine; a and b are set to 0.191 and 0.758, respectively, according
to Hou et al. (1993); S0 is a solar constant (0.082 MJ·m-2
·min-1
); d is a correction factor
for the relative distance between Earth and the Sun; δ is solar declination (unit: radians);
Wu et al.: Net primary productivity dynamics and driving forces in Guangzhou City, China
- 6673 -
APPLIED ECOLOGY AND ENVIRONMENTAL RESEARCH 16(5):6667-6690.
http://www.aloki.hu ● ISSN 1589 1623 (Print) ● ISSN 1785 0037 (Online)
DOI: http://dx.doi.org/10.15666/aeer/1605_66676690
2018, ALÖKI Kft., Budapest, Hungary
W0 is the hour angle between sunrise and sunset (unit: radian); is geographic latitude
(unit: radians), and is set to 0.540; and J is the number of days in a year.
Additionally, T1(x, t), T2(x, t) and W(x, t) are the temperature and moisture stress
coefficients, and can be calculated as (Eq. 13–15):
(Eq.13)
(Eq.14)
(Eq.15)
where Topt is the temperature at which NDVI reaches its maximum for the whole year,
and T2 falls to half its value at Topt at temperatures 10 °C or 13 °C below Topt. The
moisture stress coefficient (W) reflects the influence of the effective water condition of
plants and can be used for light utilization. It is determined by regional actual
evapotranspiration (ET) (mm) and potential evapotranspiration (PET) (mm), derived
from the MOD16A2 products.
Mann-Kendall trend analysis and Theil–Sen median slope estimator
In the present study, both spatial and temporal NPP change trends were analyzed
using a robust non-parametric Mann-Kendall (M-K) method, which is widely applied to
long-time series trend analysis of non-normal data (Prince, 1991; Wang et al., 2001,
2015b). It has been reported that the M-K test statistic Z is approximately normally
distributed with the sample size n ≥ 8 (Neeti and Eastman, 2011). A positive or a
negative of Z value indicates an increasing or a decreasing trend, which is monotonic
(Neeti and Eastman, 2011). The M-K test statistic S is calculated as (Eq. 16; Kendall,
1975):
(Eq.16)
where n is the number of data points; xi and xj are the data values in time series i and j
(j > i), respectively; and sgn(xj - xi) is the sine function expressed as (Eq. 17):
(Eq.17)
The variance is computed as (Eq. 18):
(Eq.18)
where n is the number of data points, m is the number of tied groups, and ti denotes the
number of ties with extent i. A tied group is a set of sample data that share the same
value. In cases where the sample size n > 8, the standard normal test statistic ZS is
calculated (Eq. 19) using Equation 18:
Wu et al.: Net primary productivity dynamics and driving forces in Guangzhou City, China
- 6674 -
APPLIED ECOLOGY AND ENVIRONMENTAL RESEARCH 16(5):6667-6690.
http://www.aloki.hu ● ISSN 1589 1623 (Print) ● ISSN 1785 0037 (Online)
DOI: http://dx.doi.org/10.15666/aeer/1605_66676690
2018, ALÖKI Kft., Budapest, Hungary
(Eq.19)
In this study, the Z score thresholds used for testing significance over time were 1.96
for the 5% significant level ( = 0.05), and 2.576 for the 1% significant level ( = 0.01),
which provided both the significance and direction of the trend.
The Theil–Sen median slope estimator for estimating the slope of the trend in a
sample with N pairs of data, which is appropriate for assessing the rate of change in a
short or noisy time series (Wang et al., 2015a), can be calculated as (Eq. 20):
(Eq.20)
where xj and xk are the data values at times j and k (j > k), respectively.
All analyses were conducted using ENVI 5.1 (Exelis Visual Information Solutions,
Boulder, CO, USA), ARCGIS 10.2 (ESRI, Redlands, CA, USA), and MATLAB
R2014a (The Mathworks, Inc., Natick, MA, USA).
Impacts assessment of LULCC on NPP
Based on the relative impact index (RII) from Wu et al. (2018), we applied RII to
assess the impact of LULCC driven by human activities on NPP. RII was calculated
based on NPPlulcc and NPPp, namely (Eq. 21):
(Eq.21)
where NPPlulcc is the NPP variability that is due to LULCC driven by human activities,
and NPPp is the NPP of potential vegetation. If RII > 0, it implies that there is a negative
impact of LULCC on NPP and vegetation activity, and if RII < 0, it implies that there is
either a limited human impact or more effective vegetation protection and management.
When |RII| > 50%, it indicates that LULCC is the primary driver of NPP change. For
more details about RII and the calculation of NPPp see Wu et al. (2018).
Relative contributions of climate and LULCC on NPP
The correlation between climatic variables (temperature, precipitation and solar
radiation) and annual NPP can be expressed as (Eq. 22):
(Eq.22)
where Rxy is the correlation coefficients between x and y, xi and yi is the value of NPP
and climatic variables in the ith year respectively; and is the mean value of NPP and
climatic variables from 2001 to 2013.
Wu et al.: Net primary productivity dynamics and driving forces in Guangzhou City, China
- 6675 -
APPLIED ECOLOGY AND ENVIRONMENTAL RESEARCH 16(5):6667-6690.
http://www.aloki.hu ● ISSN 1589 1623 (Print) ● ISSN 1785 0037 (Online)
DOI: http://dx.doi.org/10.15666/aeer/1605_66676690
2018, ALÖKI Kft., Budapest, Hungary
The method of Wu et al. (2014) was employed to compare the comprehensive impact
of climate change and LULCC on NPP on a spatial scale, using the variation slope of
NPP in different situations to quantify and compare the comprehensive impacts.
Assuming that the slope of NPP was K1 and K2 in the situation of constant climate and
constant LULCC respectively, the slope of actual NPP was K, so the impact of climate
change and LULCC on NPP can be expressed as ΔCli.NPP = K-K1 and
ΔLULCC.NPP = K-K2 respectively. The impact of other factors on NPP was
ΔInter.NPP = (K1 + K2)-K. Therefore, the contributions of climate change, LULCC and
other factors on NPP change can be described by Equations 23–25:
(Eq.23)
(Eq.24)
(Eq.25)
The sum of the contributions of climate change, LULCC and other factors on NPP
change is equal to 1. The contributions of the three impact factors can be mapped
individually at the pixel scale, and the synthesized impact image can be derived from
the three images using a Maxwell Triangle.
Results
NPP model validation
There was little field data on NPP available for validating the CASA model outputs.
We compared our simulated average annual NPP values over the period from 2001 to
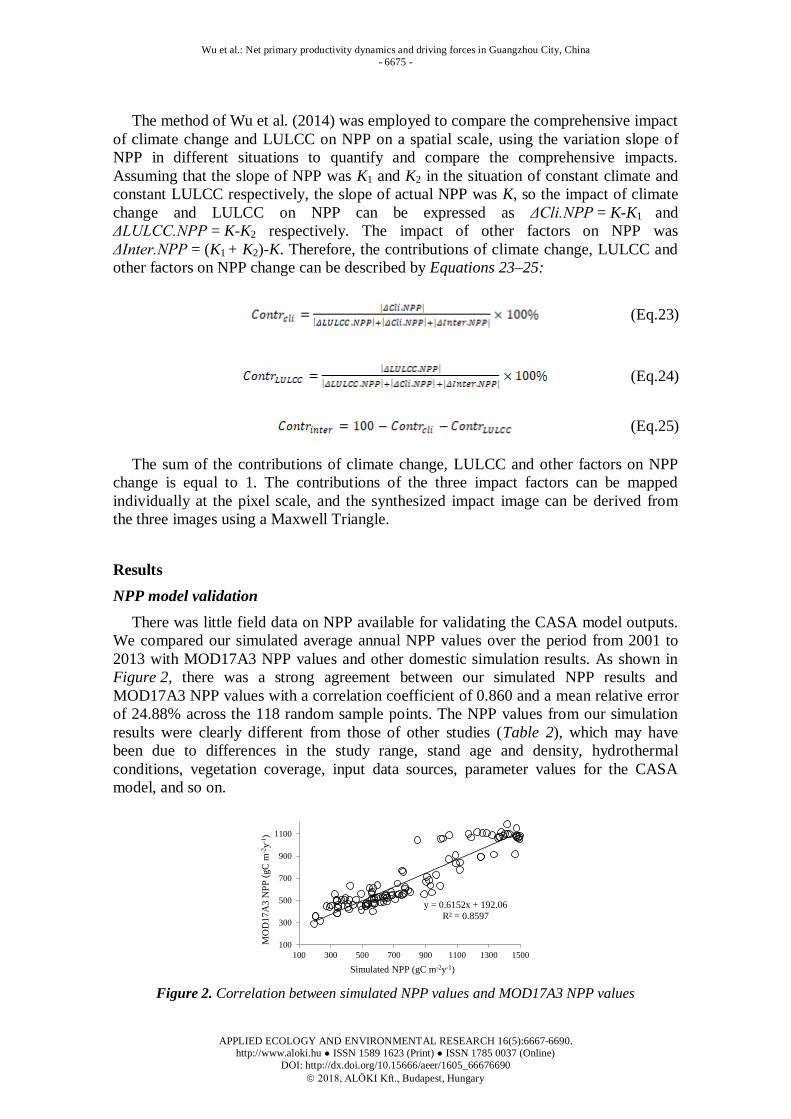
2013 with MOD17A3 NPP values and other domestic simulation results. As shown in
Figure 2, there was a strong agreement between our simulated NPP results and
MOD17A3 NPP values with a correlation coefficient of 0.860 and a mean relative error
of 24.88% across the 118 random sample points. The NPP values from our simulation
results were clearly different from those of other studies (Table 2), which may have
been due to differences in the study range, stand age and density, hydrothermal
conditions, vegetation coverage, input data sources, parameter values for the CASA
model, and so on.
y = 0.6152x + 192.06
R² = 0.8597
100
300
500
700
900
1100
100 300 500 700 900 1100 1300 1500
MO
D1
7A
3 N
PP
(gC
m-2
y-1
)
Simulated NPP (gC m-2y-1)
Figure 2. Correlation between simulated NPP values and MOD17A3 NPP values
Wu et al.: Net primary productivity dynamics and driving forces in Guangzhou City, China
- 6676 -
APPLIED ECOLOGY AND ENVIRONMENTAL RESEARCH 16(5):6667-6690.
http://www.aloki.hu ● ISSN 1589 1623 (Print) ● ISSN 1785 0037 (Online)
DOI: http://dx.doi.org/10.15666/aeer/1605_66676690
2018, ALÖKI Kft., Budapest, Hungary
Table 2 Comparison of the mean annual NPP (gC·m-2
) for different land covers and other
model output or datasets
Land cover
types*
This
study
Ni et al.,
2003
Zhu et al.,
2007b
Gao et al.,
2008
Jiang et al.,
2015 Hua, 2009 MOD17A3
EBF 1,327.22 1016.5 985.8 718.0 833.06 1,046.89 913.93
ENF 515.69 395.5 367.1 358.0 519.34 799.53 388.0
MF 595.68 - 347.1 707.0 533.49 874.36 456.0
DBF 827.43 671.8 642.9 472.0 744.7 818.28 622.02
GL 582.00 230.6 382.8 208.0 470.04 384.4 317.0
SL 483.08 364.2 367.7 700.0 524.25 603.94 415.0
WG 634.63 - 465.0 - - 657.13 398.32
CL 644.06 532.9 426.5 577.0 534.74 416.9 609.91
CL&NVM 661.62 - - - - - 566.02
WB 250.48 - - - 395.18 - -
U&BL 183.39 - - - 384.04 - -
UL 239.47 - - - 514.47 - -
The full names of the land types match those in Table 1
Spatial-temporal dynamics of NPP
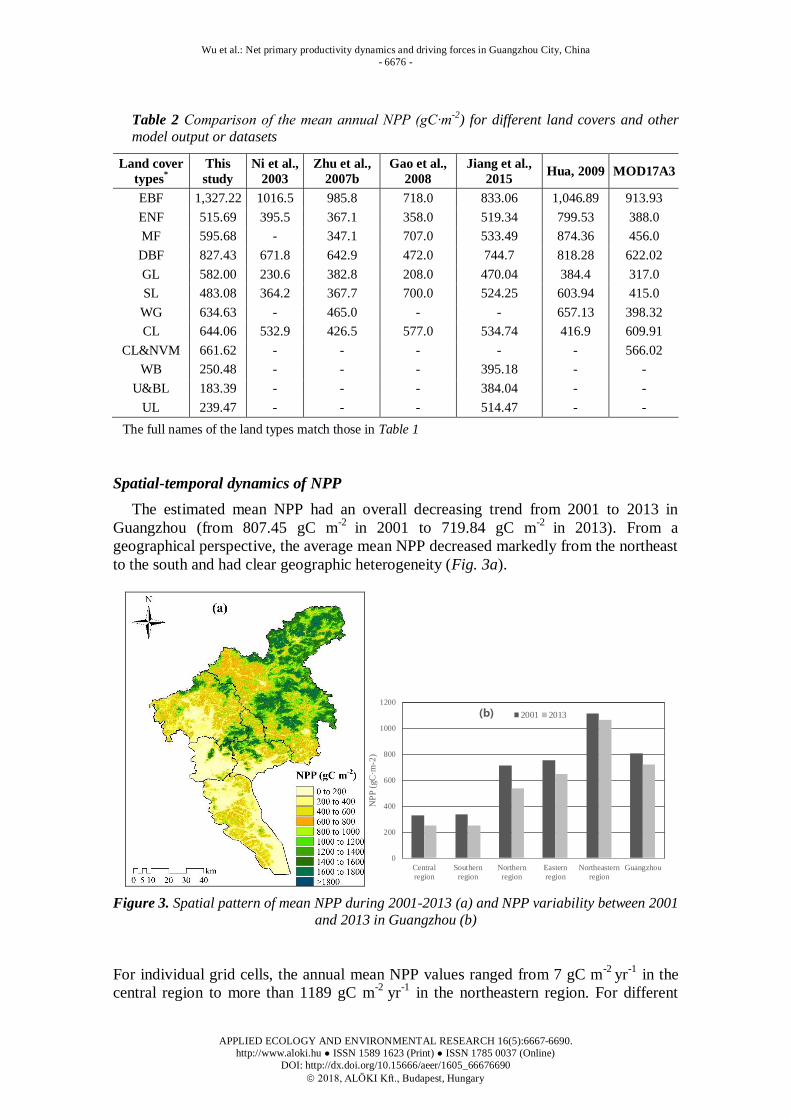
The estimated mean NPP had an overall decreasing trend from 2001 to 2013 in
Guangzhou (from 807.45 gC m-2
in 2001 to 719.84 gC m-2
in 2013). From a
geographical perspective, the average mean NPP decreased markedly from the northeast
to the south and had clear geographic heterogeneity (Fig. 3a).
0
200
400
600
800
1000
1200
Central
region
Southern
region
Northern
region
Eastern
region
Northeastern
region
Guangzhou
NP
P (
gC
·m-2
)
(b) 2001 2013
Figure 3. Spatial pattern of mean NPP during 2001-2013 (a) and NPP variability between 2001
and 2013 in Guangzhou (b)
For individual grid cells, the annual mean NPP values ranged from 7 gC m-2
yr-1
in the
central region to more than 1189 gC m-2
yr-1
in the northeastern region. For different
Wu et al.: Net primary productivity dynamics and driving forces in Guangzhou City, China
- 6677 -
APPLIED ECOLOGY AND ENVIRONMENTAL RESEARCH 16(5):6667-6690.
http://www.aloki.hu ● ISSN 1589 1623 (Print) ● ISSN 1785 0037 (Online)
DOI: http://dx.doi.org/10.15666/aeer/1605_66676690
2018, ALÖKI Kft., Budapest, Hungary
land cover types, the highest NPP values (greater than 850 gC m-2
) were found in
forests, which are mainly located in the northeast and the important conservation areas
within Guangzhou city. Low NPP values (less than 250 gC m-2
) were found in the areas
dominated by urban land cover with little green space, implying that NPP was closely
related to NDVI and the light use efficiency (ε) of the land cover type. Fig. 3b details
the changed in NPP from 2001 to 2013 in Guangzhou city and the five regions. Average
NPP values across Guangzhou and the five regions between 2001 and 2013 varied
significantly and declined sharply by 2013. Estimated NPP values in the northern region
decreased the most (175.47 gC m-2
), followed by the eastern and southern regions
(108.26 gC m-2
and 86.52 gC m-2
respectively). Values in the northern region also
decreased, and the lowest value was 46.90 gC m-2
. The pattern overall showed that the
order of dynamic changes in annual NPP ranked from high to low was inner suburbs,
inner city, and outer suburbs.
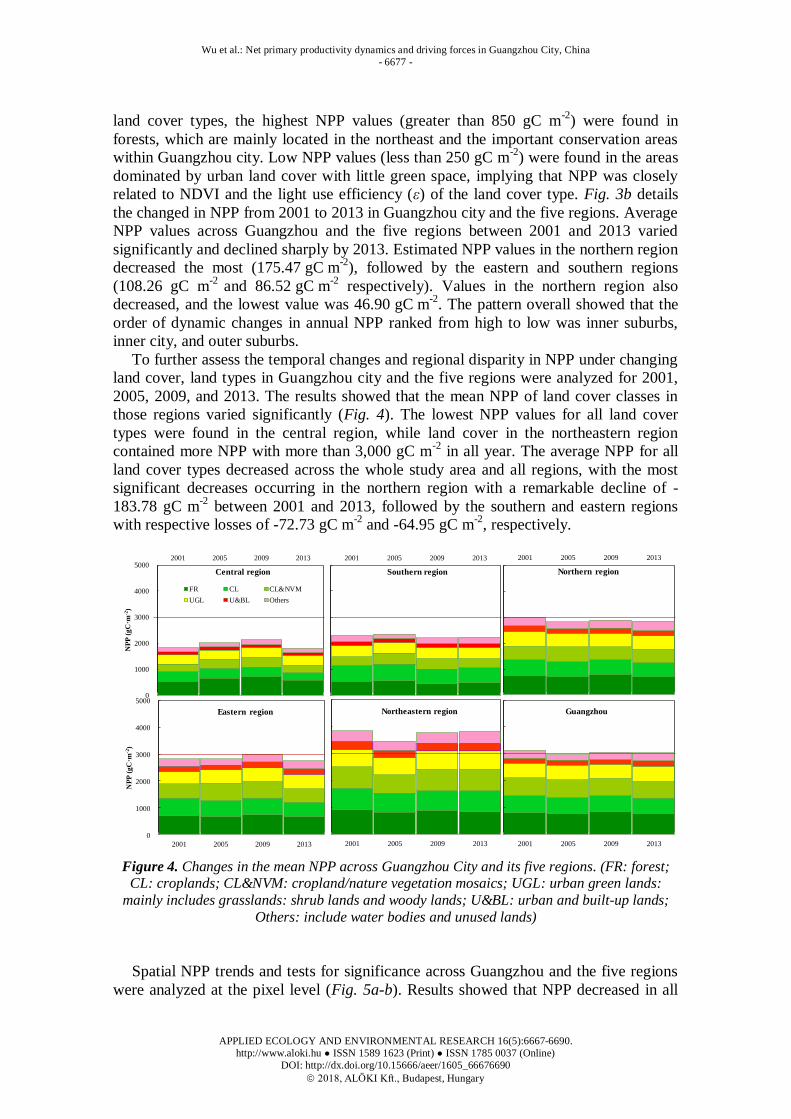
To further assess the temporal changes and regional disparity in NPP under changing
land cover, land types in Guangzhou city and the five regions were analyzed for 2001,
2005, 2009, and 2013. The results showed that the mean NPP of land cover classes in
those regions varied significantly (Fig. 4). The lowest NPP values for all land cover
types were found in the central region, while land cover in the northeastern region
contained more NPP with more than 3,000 gC m-2
in all year. The average NPP for all
land cover types decreased across the whole study area and all regions, with the most
significant decreases occurring in the northern region with a remarkable decline of -
183.78 gC m-2
between 2001 and 2013, followed by the southern and eastern regions
with respective losses of -72.73 gC m-2
and -64.95 gC m-2
, respectively.
0
1000
2000
3000
4000
50002001 2005 2009 2013
NP
P (
gC
·m-2
)
Central region
FR CL CL&NVM
UGL U&BL Others
2001 2005 2009 2013
Southern region
2001 2005 2009 2013
Northern region
0
1000
2000
3000
4000
5000
2001 2005 2009 2013
NP
P (
gC
·m-2
)
Eastern region
2001 2005 2009 2013
Northeastern region
2001 2005 2009 2013
Guangzhou
Figure 4. Changes in the mean NPP across Guangzhou City and its five regions. (FR: forest; CL: croplands; CL&NVM: cropland/nature vegetation mosaics; UGL: urban green lands:
mainly includes grasslands: shrub lands and woody lands; U&BL: urban and built-up lands;
Others: include water bodies and unused lands)
Spatial NPP trends and tests for significance across Guangzhou and the five regions
were analyzed at the pixel level (Fig. 5a-b). Results showed that NPP decreased in all
Wu et al.: Net primary productivity dynamics and driving forces in Guangzhou City, China
- 6678 -
APPLIED ECOLOGY AND ENVIRONMENTAL RESEARCH 16(5):6667-6690.
http://www.aloki.hu ● ISSN 1589 1623 (Print) ● ISSN 1785 0037 (Online)
DOI: http://dx.doi.org/10.15666/aeer/1605_66676690
2018, ALÖKI Kft., Budapest, Hungary
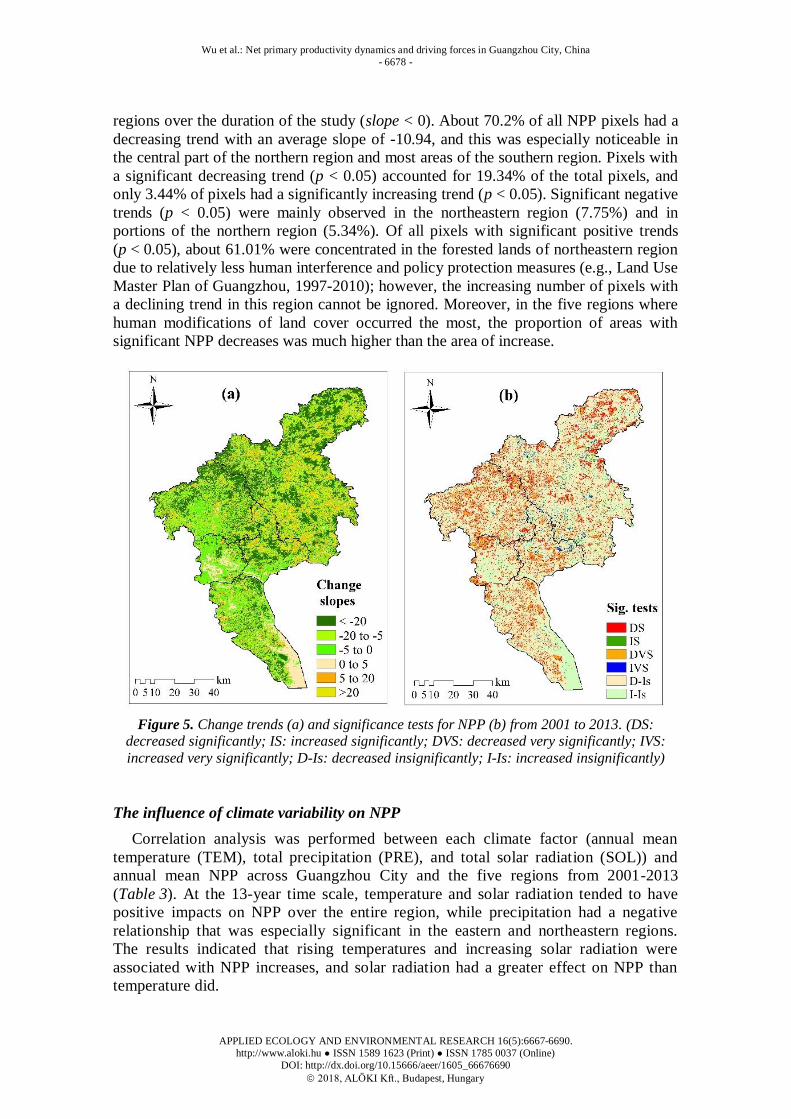
regions over the duration of the study (slope < 0). About 70.2% of all NPP pixels had a
decreasing trend with an average slope of -10.94, and this was especially noticeable in
the central part of the northern region and most areas of the southern region. Pixels with
a significant decreasing trend (p < 0.05) accounted for 19.34% of the total pixels, and
only 3.44% of pixels had a significantly increasing trend (p < 0.05). Significant negative
trends (p < 0.05) were mainly observed in the northeastern region (7.75%) and in
portions of the northern region (5.34%). Of all pixels with significant positive trends
(p < 0.05), about 61.01% were concentrated in the forested lands of northeastern region
due to relatively less human interference and policy protection measures (e.g., Land Use
Master Plan of Guangzhou, 1997-2010); however, the increasing number of pixels with
a declining trend in this region cannot be ignored. Moreover, in the five regions where
human modifications of land cover occurred the most, the proportion of areas with
significant NPP decreases was much higher than the area of increase.
Figure 5. Change trends (a) and significance tests for NPP (b) from 2001 to 2013. (DS: decreased significantly; IS: increased significantly; DVS: decreased very significantly; IVS:
increased very significantly; D-Is: decreased insignificantly; I-Is: increased insignificantly)
The influence of climate variability on NPP
Correlation analysis was performed between each climate factor (annual mean
temperature (TEM), total precipitation (PRE), and total solar radiation (SOL)) and
annual mean NPP across Guangzhou City and the five regions from 2001-2013
(Table 3). At the 13-year time scale, temperature and solar radiation tended to have
positive impacts on NPP over the entire region, while precipitation had a negative
relationship that was especially significant in the eastern and northeastern regions.
The results indicated that rising temperatures and increasing solar radiation were
associated with NPP increases, and solar radiation had a greater effect on NPP than
temperature did.
Wu et al.: Net primary productivity dynamics and driving forces in Guangzhou City, China
- 6679 -
APPLIED ECOLOGY AND ENVIRONMENTAL RESEARCH 16(5):6667-6690.
http://www.aloki.hu ● ISSN 1589 1623 (Print) ● ISSN 1785 0037 (Online)
DOI: http://dx.doi.org/10.15666/aeer/1605_66676690
2018, ALÖKI Kft., Budapest, Hungary
Table 3. Correlation coefficients between climate variables and NPP
Correlation Central
region
Southern
region
Northern
region
Eastern
region
Northeastern
region
Guang
zhou
RNPP-T 0.530 0.394 0.512 0.351 0.444 0.476
RNPP-P -0.301 -0.217 -0.166 -0.582* -0.645* -0.572*
RNPP-SOL 0.654* 0.440 0.644* 0.661* 0.779** 0.304
RNPP-T, RNPP-P and RNPP-SOL are the correlations between NPP and temperature, precipitation and solar radiation, respectively
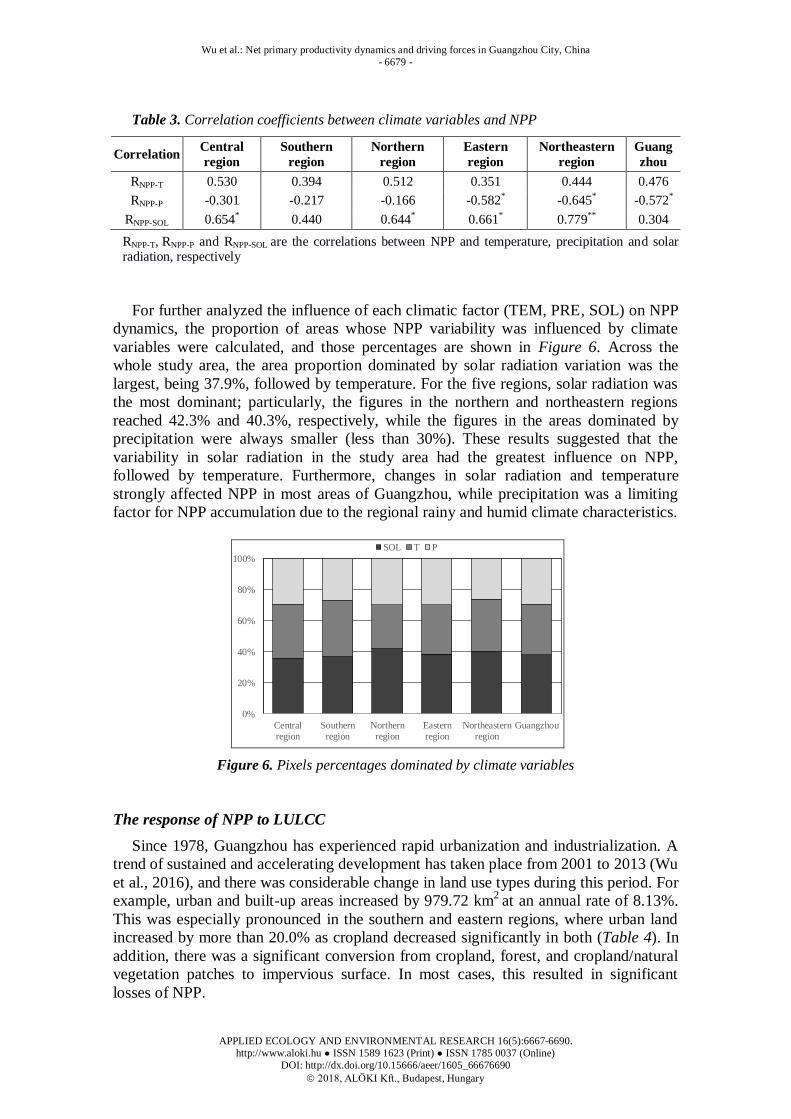
For further analyzed the influence of each climatic factor (TEM, PRE, SOL) on NPP
dynamics, the proportion of areas whose NPP variability was influenced by climate
variables were calculated, and those percentages are shown in Figure 6. Across the
whole study area, the area proportion dominated by solar radiation variation was the
largest, being 37.9%, followed by temperature. For the five regions, solar radiation was
the most dominant; particularly, the figures in the northern and northeastern regions
reached 42.3% and 40.3%, respectively, while the figures in the areas dominated by
precipitation were always smaller (less than 30%). These results suggested that the
variability in solar radiation in the study area had the greatest influence on NPP,
followed by temperature. Furthermore, changes in solar radiation and temperature
strongly affected NPP in most areas of Guangzhou, while precipitation was a limiting
factor for NPP accumulation due to the regional rainy and humid climate characteristics.
0%
20%
40%
60%
80%
100%
Centralregion
Southernregion
Northernregion
Easternregion
Northeasternregion
Guangzhou
SOL T P
Figure 6. Pixels percentages dominated by climate variables
The response of NPP to LULCC
Since 1978, Guangzhou has experienced rapid urbanization and industrialization. A
trend of sustained and accelerating development has taken place from 2001 to 2013 (Wu
et al., 2016), and there was considerable change in land use types during this period. For
example, urban and built-up areas increased by 979.72 km2
at an annual rate of 8.13%.
This was especially pronounced in the southern and eastern regions, where urban land
increased by more than 20.0% as cropland decreased significantly in both (Table 4). In
addition, there was a significant conversion from cropland, forest, and cropland/natural
vegetation patches to impervious surface. In most cases, this resulted in significant
losses of NPP.
Wu et al.: Net primary productivity dynamics and driving forces in Guangzhou City, China
- 6680 -
APPLIED ECOLOGY AND ENVIRONMENTAL RESEARCH 16(5):6667-6690.
http://www.aloki.hu ● ISSN 1589 1623 (Print) ● ISSN 1785 0037 (Online)
DOI: http://dx.doi.org/10.15666/aeer/1605_66676690
2018, ALÖKI Kft., Budapest, Hungary
Results showed that about 0.59 Tg C of NPP was lost due to the transformation from
vegetated to non-vegetated areas between 2001 and 2013, and 85.1% of that was due to
the conversion to urban land. In the five regions, the most significant losses in total NPP
due to the conversion from other land cover types to urban land occurred in the
northeastern region (a 42.5% loss), followed by the eastern region (18.6%) and northern
region (17.9%). The greatest NPP losses due to conversion to other land cover types,
especially urban land, occurred in cropland. This process reduced the carbon
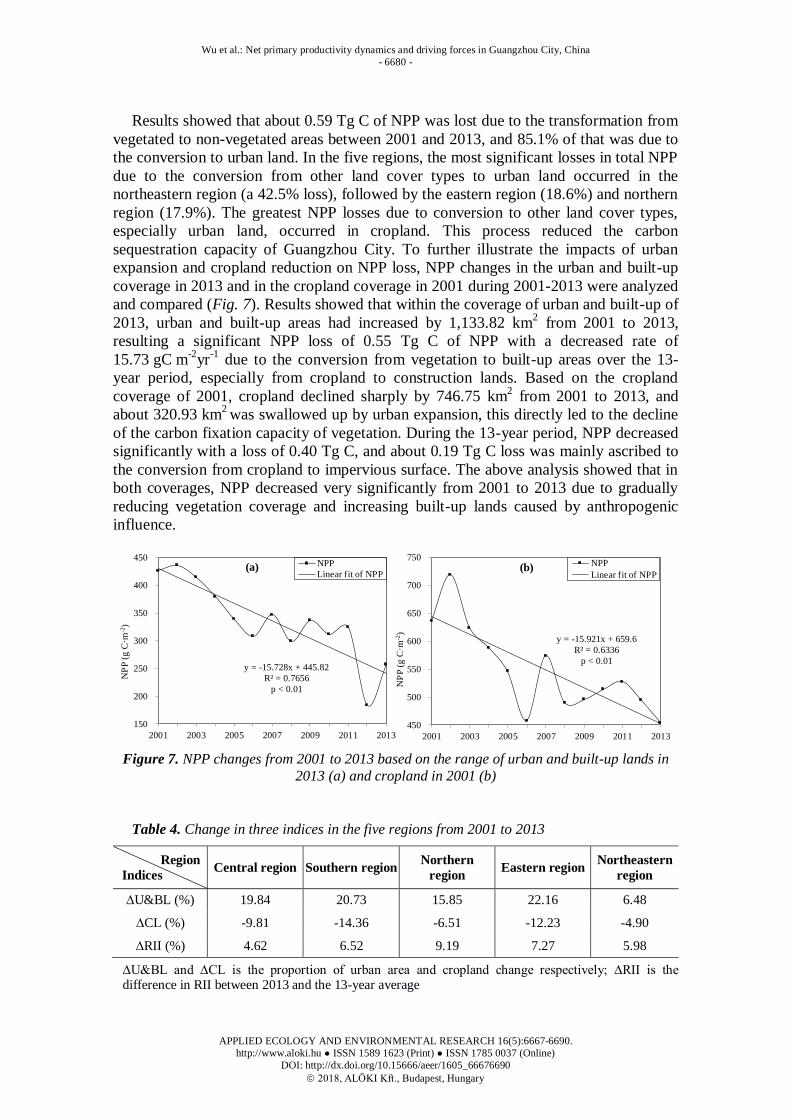
sequestration capacity of Guangzhou City. To further illustrate the impacts of urban
expansion and cropland reduction on NPP loss, NPP changes in the urban and built-up
coverage in 2013 and in the cropland coverage in 2001 during 2001-2013 were analyzed
and compared (Fig. 7). Results showed that within the coverage of urban and built-up of
2013, urban and built-up areas had increased by 1,133.82 km2 from 2001 to 2013,
resulting a significant NPP loss of 0.55 Tg C of NPP with a decreased rate of
15.73 gC m-2
yr-1
due to the conversion from vegetation to built-up areas over the 13-
year period, especially from cropland to construction lands. Based on the cropland
coverage of 2001, cropland declined sharply by 746.75 km2 from 2001 to 2013, and
about 320.93 km2 was swallowed up by urban expansion, this directly led to the decline
of the carbon fixation capacity of vegetation. During the 13-year period, NPP decreased
significantly with a loss of 0.40 Tg C, and about 0.19 Tg C loss was mainly ascribed to
the conversion from cropland to impervious surface. The above analysis showed that in
both coverages, NPP decreased very significantly from 2001 to 2013 due to gradually
reducing vegetation coverage and increasing built-up lands caused by anthropogenic
influence.
y = -15.921x + 659.6
R² = 0.6336
p < 0.01
450
500
550
600
650
700
750
2001 2003 2005 2007 2009 2011 2013
NP
P (g
C·m
-2)
(b)NPP
Linear fit of NPP
y = -15.728x + 445.82
R² = 0.7656
p < 0.01
150
200
250
300
350
400
450
2001 2003 2005 2007 2009 2011 2013
NP
P (g
C·m
-2)
(a) NPP
Linear fit of NPP
Figure 7. NPP changes from 2001 to 2013 based on the range of urban and built-up lands in
2013 (a) and cropland in 2001 (b)
Table 4. Change in three indices in the five regions from 2001 to 2013
Region
Indices Central region Southern region
Northern
region Eastern region
Northeastern
region
∆U&BL (%) 19.84 20.73 15.85 22.16 6.48
∆CL (%) -9.81 -14.36 -6.51 -12.23 -4.90
∆RII (%) 4.62 6.52 9.19 7.27 5.98
∆U&BL and ∆CL is the proportion of urban area and cropland change respectively; ∆RII is the difference in RII between 2013 and the 13-year average
Wu et al.: Net primary productivity dynamics and driving forces in Guangzhou City, China
- 6681 -
APPLIED ECOLOGY AND ENVIRONMENTAL RESEARCH 16(5):6667-6690.
http://www.aloki.hu ● ISSN 1589 1623 (Print) ● ISSN 1785 0037 (Online)
DOI: http://dx.doi.org/10.15666/aeer/1605_66676690
2018, ALÖKI Kft., Budapest, Hungary
The impacts of LULCC on NPP were further investigated by examining the RII over
the whole study area and the five regions from 2001 to 2013. Results showed that more
than 91.0% of pixels in whole area had positive RII values and the mean RII value was
greater than 50% across all regions, indicating LULCC driven by human activity had a
negative influence on NPP and was the primary cause for NPP losses. Moreover, there
was a clear increasing trend in RII across the five regions over the 13 years (Table 4)
that was especially significant in the northern region followed by the eastern and
southern regions, which suggested that intense human development radiated outward
from the central urban areas to the urban fringe, where the inner suburbs were the first
to be affected.
Comparison of the effects of LULC and climate change on NPP
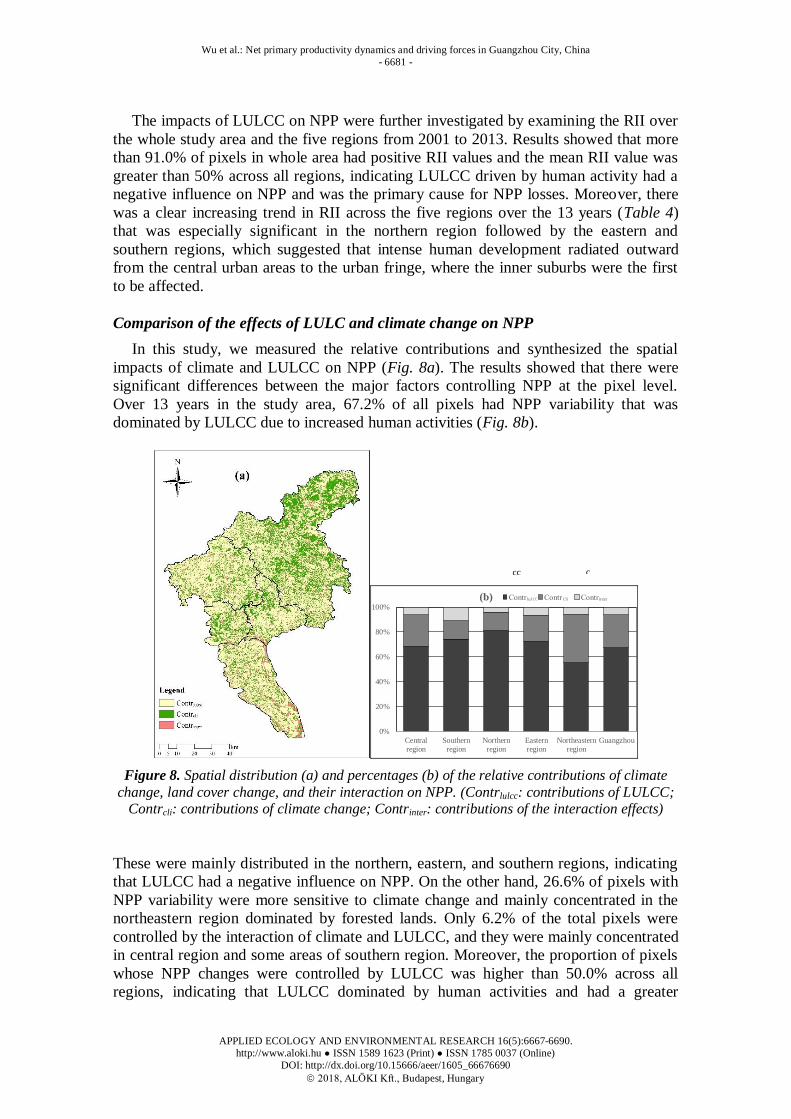
In this study, we measured the relative contributions and synthesized the spatial
impacts of climate and LULCC on NPP (Fig. 8a). The results showed that there were
significant differences between the major factors controlling NPP at the pixel level.
Over 13 years in the study area, 67.2% of all pixels had NPP variability that was
dominated by LULCC due to increased human activities (Fig. 8b).
ccc
0%
20%
40%
60%
80%
100%
Centralregion
Southernregion
Northernregion
Easternregion
Northeasternregion
Guangzhou
(b) Contrₗᵤₗ Contr ₗᵢ Contrᵢₙₜₑᵣ
Figure 8. Spatial distribution (a) and percentages (b) of the relative contributions of climate
change, land cover change, and their interaction on NPP. (Contrlulcc: contributions of LULCC; Contrcli: contributions of climate change; Contrinter: contributions of the interaction effects)
These were mainly distributed in the northern, eastern, and southern regions, indicating
that LULCC had a negative influence on NPP. On the other hand, 26.6% of pixels with
NPP variability were more sensitive to climate change and mainly concentrated in the
northeastern region dominated by forested lands. Only 6.2% of the total pixels were
controlled by the interaction of climate and LULCC, and they were mainly concentrated
in central region and some areas of southern region. Moreover, the proportion of pixels
whose NPP changes were controlled by LULCC was higher than 50.0% across all
regions, indicating that LULCC dominated by human activities and had a greater
c cc
Wu et al.: Net primary productivity dynamics and driving forces in Guangzhou City, China
- 6682 -
APPLIED ECOLOGY AND ENVIRONMENTAL RESEARCH 16(5):6667-6690.
http://www.aloki.hu ● ISSN 1589 1623 (Print) ● ISSN 1785 0037 (Online)
DOI: http://dx.doi.org/10.15666/aeer/1605_66676690
2018, ALÖKI Kft., Budapest, Hungary
influence on NPP variability than climate change, especially in the inner suburbs (about
76.66% of pixels with NPP variability were controlled by LULCC). Overall, results
showed that the influence of urban expansion and LULCC on NPP was much greater
than the influence of climate, and LULCC was the main cause of reduced NPP in most
of the areas under study.
Discussion
Uncertainties in NPP estimates
Compared with MODIS NPP, we found that our simulated NPP values for all land
cover types were higher than MOD17A3, which may be because the fact that MODIS
NPP is derived at the global scale with diverse climate and vegetation conditions and at
a relatively coarse spatial resolution (1 km). The NPP estimates in this study were also
very different from previous research studies of NPP change during China’s
urbanization (Table 2), which may be due to the fact that Guangzhou is a southern city
with a warmer climate, higher vegetation coverage, and better hydrothermal conditions
than that of other cities and the whole country.
In addition, there could be large uncertainties in this NPP estimation due to input
data, parameters, model structure, and the applicability of the model (Wu and Wu,
2018). Some parameters (e.g., εmax and FPAR) in the CASA model may not be
appropriate across all areas of China and the process parameters should be optimized
(Wang et al., 2013; Gong et al., 2012; Zhang et al., 2009). Furthermore, there was a
large disparity in the spatial resolution of meteorological data and MODIS products in
this study, which may have caused bias in NPP estimation. Although we reduced these
errors by resampling, further adjustment and higher resolution data may be needed.
Additionally, ground NPP data-based site observations of biomass within the study
would have been better for validation than MODIS NPP. Overall, there were still some
uncertainties in the NPP estimates due to the factors mentioned above, and in future
studies, optimization of model parameters and more multisource data validation will be
needed to enhance the accuracy of NPP estimation.
Correlation between climate variability and NPP
Climate variables are important factors affecting vegetation conditions, for example,
temperature, precipitation and solar radiation can affect the vegetation distribution and
NPP dynamics of various biomes at regional, and even local, scales (Dekker et al.,
2007; Hu et al., 2009; Zhu et al., 2007a). In this study, the effects of these three climate
variables on NPP variability were different, however, negative correlations with NPP
and precipitation, and positive correlations with NPP and temperature and solar
radiation occurred in all regions (Table 3), indicating that precipitation was unfavorable
for vegetation growth, while temperature and solar radiation benefited NPP
accumulation. This was consistent with Fu et al.’s (2013) study on Guangzhou where an
increase in precipitation caused a decrease in temperature and radiation, which reduced
the solar radiation exposure and for photosynthesis for photosynthesis in plants and may
have decreased the soil organic matter content (Mohamed et al., 2004; Eisfelder et al.,
2014; Zhang et al., 2016), resulting in less absorption of photosynthetically active
radiation and the accumulation of vegetation biomass (Piao et al., 2003).
Wu et al.: Net primary productivity dynamics and driving forces in Guangzhou City, China
- 6683 -
APPLIED ECOLOGY AND ENVIRONMENTAL RESEARCH 16(5):6667-6690.
http://www.aloki.hu ● ISSN 1589 1623 (Print) ● ISSN 1785 0037 (Online)
DOI: http://dx.doi.org/10.15666/aeer/1605_66676690
2018, ALÖKI Kft., Budapest, Hungary
Solar radiation serves as an important energy source for plant photosynthesis, and we
found it had a better regression coefficient with NPP than temperature and precipitation
across all regions (Table 3). This implied that the NPP distribution and production are
closely related to climatic variables and always dominated by a single climatic factor
(Zhao and Running, 2010; Wu et al., 2014), and in most areas of Guangzhou City, the
response of interannual NPP variability to solar radiation was the main controlling
factor (Fig. 6). The results also have been verified by other studies (Zhang et al., 2014;
Liang et al., 2014). Moreover, according to Zhu et al. (2007a), solar radiation had a
larger influence on vegetation NPP in the South China compared with temperature and
precipitation. Although other environmental factors may also affect NPP variability to
some extent, such as soil texture (Pan et al., 1996), topography (Gao et al., 2013),
drought (Pei et al., 2013a), CO2 concentration (Mu et al., 2008), and so on, their effects
on NPP were less climatic factors on carbon storage of vegetation (Sui et al., 2013; Gao
et al., 2013).
NPP dynamics and associated urbanization and LULCC
Urbanization and subsequent LULC driven by human activities are important factors
affecting vegetation dynamics, particularly in highly urbanized areas that are
characterized by extremely fragile ecosystems (Wu and Wu, 2018; Zhang et al., 2014;
Liu et al., 2018). In this study, NPP exhibited spatial heterogeneity across the whole
area under study and decreased in the five regions from 2001 to 2013. Similarity,
previous studies found that vegetation was degraded at different levels in Guangzhou in
recent decades (Fu et al., 2013; Hu et al., 2009; Wu and Wu, 2018). In our study, a
significant reduction in NPP was concentrated in the inner suburbs (southern, eastern,
and northern regions; Fig. 5), this was mostly because that the amount of urban sprawl
increased gradually from center to the periphery from 2001 to 2013 (Wu et al., 2016),
and urbanization “hot spots” have moved from the center to the suburbs, resulting in a
substantial reduction in vegetation areas and vegetation carbon fixation. Following
intense urban development, ecological degradation slows and new urban ecosystems
develop (Peng et al., 2016), which always leads to large losses in NPP. Moreover, the
significant increase in RII in the inner suburbs implied that vegetation productivity in
these areas was still subjected to disturbance by human activities. Most studies have
demonstrated that the urban fringe is gradually emerging as the most human-disturbed
area and this phenomenon has been observed in most urban areas during urbanization
(Xu et al., 2007; Wu et al., 2014; Wu and Wu, 2018). Conversely, increased NPP and
smaller RII values were widely distributed in the outer suburbs (northeastern region),
which are dominated by mountains and hills with higher elevations, and low population
density combined with conservation efforts that have effectively reduced the impacts of
humans on vegetation activity. This phenomenon has also been confirmed by other
studies (Peng et al., 2016; Hu et al., 2009).
Prior research has verified that different urbanization stages, finance aggregation,
and population growth may also be important factors affecting NPP variability (Peng et
al., 2016; Lu et al., 2010). Substantial environmental change occurs under increased
demand by city dwellers for green space and corresponding ecosystem services. Thus,
maintaining green spaces and adaptive urban planning could have benefits for the urban
ecosystem and a favorable impact on vegetation productivity. However, it should be
noted that growing human activity and urban sprawl are still a serious threat to
vegetation NPP accumulation, and more plausible adaptation strategies should be
Wu et al.: Net primary productivity dynamics and driving forces in Guangzhou City, China
- 6684 -
APPLIED ECOLOGY AND ENVIRONMENTAL RESEARCH 16(5):6667-6690.
http://www.aloki.hu ● ISSN 1589 1623 (Print) ● ISSN 1785 0037 (Online)
DOI: http://dx.doi.org/10.15666/aeer/1605_66676690
2018, ALÖKI Kft., Budapest, Hungary
employed to cope with the conflict between urban development and ecosystem carbon
balance.
Dominant driving forces of NPP variability
Over the 13-year study period, temperature and solar radiation were generally
favorable for vegetation growth, whereas human activities had a negative impact. As
shown by the absolute values of the contributions made by climate and LULCC, the
influence of LULCC on interannual NPP variability in most parts of the area under
study was always greater than climate. Notably, negative impacts of LULCC on NPP
were most significant in the inner suburbs due to the conversion from vegetated to non-
vegetated land, especially from cropland to new urban areas. This finding was in
agreement with several studies (Pei et al., 2013b; Fu et al., 2013; Wu et al., 2014; Yang
et al., 2015; Liu et al., 2018). A considerable proportion NPP change was undeniably
dominated by climate factors in some croplands and wooded areas (e.g. the northeastern
region; Fig. 8), where LULCC actually caused an increase in NPP. This was closely
related to regional land cover types, population and economic conditions, terrain,
conservation policies, and so on. In addition to the roles of regional population,
economic conditions, and terrain, the effects of protection policies must be
acknowledged. For example, the Land Use Master Plan of Guangzhou (1997-2010)
effectively prevented excessive losses of agricultural land in this region. The Urban
Master Development Strategic Plan of Guangzhou (2010-2020) defined Conghua and
Zengcheng (the two districts are mainly in northeastern region) as eco-agricultural and
eco-tourism zones, which further promoted the protection of agricultural and forested
lands in the northeastern region and contributed to forest carbon accumulation. This
limited the NPP reduction caused by climate change.
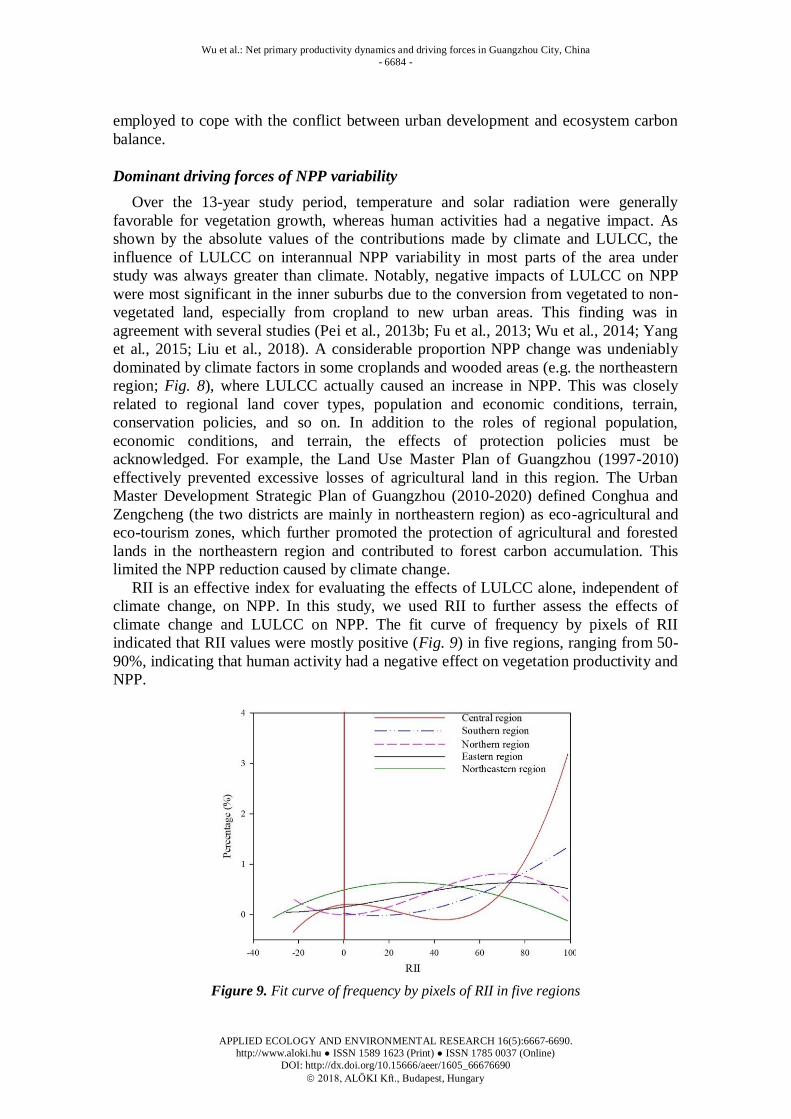
RII is an effective index for evaluating the effects of LULCC alone, independent of
climate change, on NPP. In this study, we used RII to further assess the effects of
climate change and LULCC on NPP. The fit curve of frequency by pixels of RII
indicated that RII values were mostly positive (Fig. 9) in five regions, ranging from 50-
90%, indicating that human activity had a negative effect on vegetation productivity and
NPP.
Figure 9. Fit curve of frequency by pixels of RII in five regions
Wu et al.: Net primary productivity dynamics and driving forces in Guangzhou City, China
- 6685 -
APPLIED ECOLOGY AND ENVIRONMENTAL RESEARCH 16(5):6667-6690.
http://www.aloki.hu ● ISSN 1589 1623 (Print) ● ISSN 1785 0037 (Online)
DOI: http://dx.doi.org/10.15666/aeer/1605_66676690
2018, ALÖKI Kft., Budapest, Hungary
In addition, mean RII values were greater than 50% in all regions and about 77.3% of
those pixels were concentrated in the inner suburbs, suggesting that NPP variability was
most affected by human activities. These findings were consistent with our results based
on the method of Wu et al. (2014). Especially, about 17.12% pixels in RII were less
than 0 in northeastern region, which was benefited by the protection policies of
agriculture and forested lands. Nonetheless, it is worth noting that the increase in RII
over the five regions (Table 4) meant that human impacts on NPP through LULCC also
increased, and vegetation productivity was affected by human disturbance, especially in
inner suburbs. Although the creation and protection of urban green spaces, forests, and
wetlands contributed to the increase in NPP, the effects of some protection projects
were less than satisfactory. The effectiveness of restoration projects and urban and
industrial land use plans should be adjusted to balance environmental conservation and
economic development, and more plausible adaptation strategies should be applied to
cope with climate change.
Conclusions
NPP is one of the most significant factors characterizing ecosystem structure and
function, and can be used to describe the spatiotemporal pattern of urban carbon storage
and its driving mechanisms. The current study estimated NPP change in Guangzhou and
its five regions from 2001 to 2013 and examined the effects of driving forces on NPP
variability in a spatially explicit way. Nonlinear NPP trends indicated that NPP
decreased across the study area and most significantly in the inner suburbs (southern,
eastern, and northern regions) due to rapid urbanization and human interference, while a
slight increase of NPP was concentrated in the western part of the northeastern region.
Solar radiation and temperature strongly influenced NPP increases, while precipitation
was a limiting factor. NPP reductions were correlated with urban sprawl combined with
land conversions from vegetated areas to impervious surface, especially cropland to
built-up land. More than 91.0% of pixels had positive RII values, implying that LULCC
played a negative role in NPP accumulation.
Comparatively, there were significant differences in the effects of climate change
and LULCC on NPP. More than 67.2% of pixels exhibited NPP trends that were
dominated by LULCC, and absolute average RII values further confirmed that LULCC
had a greater impact than climate change on NPP. The interacting effects of climate
change and LULCC led to slight NPP variability. In the northeastern region, about
38.1% of pixel NPP trends were dominated by climate change, but it cannot be ignored
that the influence of human activities on vegetation productivity is still increasing and
prolonged efforts will be needed to protect and expand environmental resources in this
region. The above results revealed that LULCC due to urban expansion, rather than
climate variability, was the main cause for regional NPP reductions in Guangzhou.
NPP variability can also be an indicator of urban development intensity and will
provide further insights into terrestrial carbon change resulting from urbanization. In
particular, the obvious spatial heterogeneity in the effects of LULCC and climate
change on NPP change can provide valuable decision support information for ecological
conservation and management in this region. Moreover, it is noteworthy that with the
increase in impervious surface and decrease in vegetation cover resulting from human
activities, the urban heat island effect will likely be intensified and the decline of
cultivated land and forest will threaten food security and ecosystem function. Future
Wu et al.: Net primary productivity dynamics and driving forces in Guangzhou City, China
- 6686 -
APPLIED ECOLOGY AND ENVIRONMENTAL RESEARCH 16(5):6667-6690.
http://www.aloki.hu ● ISSN 1589 1623 (Print) ● ISSN 1785 0037 (Online)
DOI: http://dx.doi.org/10.15666/aeer/1605_66676690
2018, ALÖKI Kft., Budapest, Hungary
work should aim to improve data resolution and delve further into the mechanisms
coupling land use change, climate change and the carbon cycle for a long time. And
further work is also needed to identify the mechanisms of cropland NPP and food
security to urban expansion.
Acknowledgements. This study was supported by the Natural Science Foundation of Guangdong
Province of China (2018A030310069) and the National Natural Science Foundation of China (61806059,
41671430).
REFERENCES
[1] Ahlström, A., Miller, P. A., Smith, B. (2012): Too early to infer a global NPP decline since 2000. – Geophysical Research Letters 39(15): 15403.
[2] Benali, A., Carvalho, A. C., Nunes, J. P., Carvalhais, N., Santos, A. (2012): Estimating
air surface temperature in Portugal using MODIS LST data. – Remote Sensing of Environment 124: 108–121.
[3] Buyantuyev, A., Wu, J. G. (2012): Urbanization diversifies land surface phenology in
arid environments: Interactions among vegetation, climatic variation, and land use
pattern in the Phoenix metropolitan region, USA. – Landscape and Urban Planning 105(1–2): 149–159.
[4] Chao, Z. H., Zhang, P. D., Wang, X. F. (2018): Impacts of urbanization on the net
primary productivity and cultivated land change in Shandong Province, China. – Journal of the Indian Society of Remote Sensing 46(2): 1–11.
[5] Chen, T., Huang, Q. H., Liu, M., Li, M. C., Qu, L. A., Deng, S. L., Chen, D. (2017):
Decreasing net primary productivity in response to urbanization in Liaoning Province, China. – Sustainability 9(2): 162.
[6] Dekker, S. C., Rietkerk, M., Bierkens Arc, F. P. (2007): Coupling microscale
vegetation, soil water and macroscale vegetation, precipitation feedbacks in semiarid
ecosystems. – Global Change Biology 13(3): 671–678. [7] Eisfelder, C., Klein, I., Niklaus, M., Kuenzer, C. (2014): Net primary productivity in
Kazakhstan, its spatio-temporal patterns and relation to meteorological variables. –
Journal of Arid Environments 103(8): 17–30. [8] Fang, X., Zhang, C., Wang, Q., Chen, X., Ding, J. L., Karamage, F. (2017): Isolating
and quantifying the effects of climate and CO2 changes (1980-2014) on the net primary
productivity in arid and semiarid China. – Forests 8(3): 1–19.
[9] Field, C. B., Behrenfeld, M. J., Randerson, J. T., Falkowski, P. (1998): Primary production of the biosphere: integrating terrestrial and oceanic components. – Science
281(5374): 237–40.
[10] Fu, G., Shen, Z. X., Zhang, X. L., Shi, P. L., Zhang, Y. J., Wu, J. S. (2011): Estimating air temperature of an alpine meadow on the Northern Tibetan Plateau using MODIS
land surface temperature. – Acta Ecologica Sinica 31(1): 8–13.
[11] Fu, Y. C., Lu, X. Y., Zhao, Y. L., Zeng, X. T., Xia, L. (2013): Assessment impacts of weather and land use/land cover (LULC) change on urban vegetation net primary
productivity (NPP) a case study in Guangzhou, China. – Remote Sensing 5(8): 4125–
4144.
[12] Gao, Q. Z., Wang, Y. F., Li, Y., Guo, Y. Q., Ganjurjav, Qin, X., Jiang, C. W., Wang, B. (2013): Effects of topography and human activity on the net primary productivity
(NPP) of alpine grassland in northern Tibet from 1981 to 2004. – International Journal
of Remote Sensing 34(6): 2057–2069. [13] Gao, Z. Q., Liu, J. Y. (2008): A comparative study of Chinese vegetation net
productivity. – Chinese Science Bulletin 53(3): 317–326.
Wu et al.: Net primary productivity dynamics and driving forces in Guangzhou City, China
- 6687 -
APPLIED ECOLOGY AND ENVIRONMENTAL RESEARCH 16(5):6667-6690.
http://www.aloki.hu ● ISSN 1589 1623 (Print) ● ISSN 1785 0037 (Online)
DOI: http://dx.doi.org/10.15666/aeer/1605_66676690
2018, ALÖKI Kft., Budapest, Hungary
[14] Gong, W., Wang, L. C., Lin, A. W., Zhang, M. (2012): Evaluating the monthly and
interannual variation of net primary production in response to climate in Wuhan during
2001 to 2010. – Geosciences Journal 16(3): 347–355. [15] Grimm, N. B., Faeth, S. H., Golubiewski, N. E., Redman, C. L., Wu, J., Bai, X., Briggs,
J. M. (2008): Global change and the ecology of cities. – Science 319(5864): 756–760.
[16] Gu, F. X., Zhang YD, Huang, M., Guo, Tao, B., Liu, Z. J., Hao, M., Guo, R. (2017):
Climate-driven uncertainties in modeling terrestrial ecosystem net primary productivity in China. – Agricultural and Forest Meteorology 246: 123–132.
[17] Hou, G. L., Li, J. Y., Zhang, Y. G. (1993): China Agricultural Climate Resources. –
China Renmin University Press, Beijing (in Chinese). [18] Hu, Y. H., Jia, G. S., Guo, H. D. (2009): Linking primary production, climate and land
use along an urban–wildland transect: a satellite view. – Environmental Research
Letters 4(4): 044009.
[19] Hua, X. B. (2009): Quantifying the human appropriation of net primary production and analysis of its multi-year changes in Guangdong. – Master Thesis, Sun Yat-sen
University (in Chinese).
[20] Hutyra, L. R., Yoon, B., Hepinstall-Cymerman, J., Alberti, M. (2011): Carbon consequences of land cover change and expansion of urban lands: A case study in the
Seattle metropolitan region. – Landscape and Urban Planning 103(1): 83–93.
[21] Imhoff, M. L., Tucker, C. J., Lawrence, W. T., Stutzer, D. C. (2000): The use of multisource satellite and geospatial data to study the effect of urbanization on primary
productivity in the united states. – IEEE Transactions on Geoscience and Remote
Sensing 38(6): 2549–2556.
[22] Jiang, C., Wu, Z. F. (2015): Impacts of urbanization on net primary productivity in the Pearl River Delta, China. – International Journal of Plant Production 9(4): 581–598.
[23] Kendall, M. G. (1975): Rank Correlation Methods. – Griffin, London, UK.
[24] Liang, L., Zhou, S. H., Qin, Z. H., He, K. X., Chen, C., Luo, Y. X., Zhou, X. D. (2014): Drought change trend using MODIS TVDI and its relationship with climate factors in
China from 2001 to 2010. – Journal of Integrative Agriculture 13(7): 1501–1508.
[25] Liu, H. Y., Mi, Z. R., Lin, L., Wang, Y. H., Zhang, Z. H., Zhang, F. W., Wang, H., Liu, L. L. (2018): Shifting plant species composition in response to climate change
stabilizes grassland primary production. – Proceedings of the National Academy of
Sciences 115(16): 4051–4056.
[26] Liu, S. S., Du, W., Su, H., Wang, S. Q., Guan, Q. F. (2018): Quantifying impacts of land-use/cover change on urban vegetation gross primary production: a case study of
Wuhan, China. – Sustainability 10(3): 714.
[27] Lu, D. S., Xu, X. F., Tian, H. Q., Moran, E., Zhao, M. S., Running, S. (2010): The effects of urbanization on net primary productivity in Southeastern China. –
Environmental Management 46(3): 404–410.
[28] Mohamed, M. A. A., Babiker, I. S., Chen, Z. M., Ikeda, K. Ohta, K., Kato, K. (2004):
The role of climate variability in the inter-annual variation of terrestrial net primary production (NPP). – Science of the Total Environment 332(1–3): 123–137.
[29] Mu, Q. Z., Zhao, M. S., Running, S. W., Liu, M. L., Tian, H. Q. (2008): Contribution of
increasing CO2 and climate change to the carbon cycle in China’s ecosystems. – Journal of Geophysical Research Biogeosciences 113(1): 1–15.
[30] Neeti, N., Eastman, J. R. (2011): A contextual Mann-Kendall approach for the
assessment of trend significance in image time series. – Transactions in GIS 15(5): 599–611.
[31] Nemani, R. R., Keeling, C. D., Hashimoto, H., Jolly, W. M. Piper, S. C., Tucker, C. J.,
Myneni, R. B., Running, S. W. (2003): Climate-driven increases in global terrestrial net
primary production from 1982 to 1999. – Science 300(5625): 1560–3.
Wu et al.: Net primary productivity dynamics and driving forces in Guangzhou City, China
- 6688 -
APPLIED ECOLOGY AND ENVIRONMENTAL RESEARCH 16(5):6667-6690.
http://www.aloki.hu ● ISSN 1589 1623 (Print) ● ISSN 1785 0037 (Online)
DOI: http://dx.doi.org/10.15666/aeer/1605_66676690
2018, ALÖKI Kft., Budapest, Hungary
[32] Ni, J. (2003): Net primary productivity in forests of China: scaling-up of national
inventory data and comparison with model predictions. – Forest Ecology and
Management 176(1–3): 485–495. [33] Pan, Y., Mcguire, A. D., Kicklighter, D. W., Melillo, J. (1996): The importance of
climate and soils for estimates of net primary production: a sensitivity analysis with the
terrestrial ecosystem model. – Global Change Biology 2(1): 5–23.
[34] Pei, F. S., Li, X., Liu, X. P., Lao, C. H. (2013a): Assessing the impacts of droughts on net primary productivity in China. – Journal of Environmental Management 114(2):
362–371.
[35] Pei, F. S., Li, X., Liu, X. P., Wang, S. J., He, Z. J. (2013b): Assessing the differences in net primary productivity between pre- and post-urban land development in China. –
Agricultural and Forest Meteorology 171–172(3): 174–186.
[36] Pei, F. S., Li, X., Liu, X. P., Lao, C. H., Xia, G. R. (2015): Exploring the response of
net primary productivity variations to urban expansion and climate change: A scenario analysis for Guangdong Province in China. – Journal of Environmental Management
150(150C): 92–102.
[37] Peng, J., Shen, H., Wu, W., Liu, Y., Wang, Y. (2016): Net primary productivity (NPP) dynamics and associated urbanization driving forces in metropolitan areas: a case study
in Beijing City, China. – Landscape Ecology 31(5): 1077–1092.
[38] Piao, S., Fang, J. Y., Zhou, L. M., Zhu, B., Tan, K., Tao, S. (2005): Changes in vegetation net primary productivity from 1982 to 1999 in China. – Global
Biogeochemical Cycles 19(2): 1605–1622.
[39] Piao, S. L., Fang, J. Y., Chen, A. P. (2003): Seasonal dynamics of terrestrial net
primary production in response to climate changes in China. – Acta Botanica Sinica 45(3): 269–275.
[40] Piao, S. L., Fang, J. Y., Ciais, P., Peylin, P., Huang, Y., Sitch, S., Wang, T. (2009): The
carbon balance of terrestrial ecosystems in China. – Nature 458(7241): 1009–1013. [41] Potter, C. S., Randerson, J. T., Field, C. B., Matson, P. A., Vitousek, P. M., Mooney, H.
A., Klooster, S. A. (1993): Terrestrial ecosystem production: A process model based on
global satellite and surface data. – Global Biogeochemical Cycles 7(4): 811–841. [42] Prince, S. D. (1991): A model of regional primary production for use with coarse
resolution satellite data. – International Journal of Remote Sensing 12(6): 1313–1330.
[43] Sui, X. H., Zhou, G. S., Zhuang, Q. L. (2013): Sensitivity of carbon budget to historical
climate variability and atmospheric CO2 concentration in temperate grassland ecosystems in China. – Climatic Change 117(1–2): 259–272.
[44] Tucker, C. J., Newcomb, W. W., Dregne, H. E. (1994): AVHRR data sets for
determination of desert spatial extent. – International Journal of Remote Sensing 15(17): 3547–3565.
[45] Vancutsem, C., Ceccato, P., Dinku, T., Connor, S. J. (2010): Evaluation of MODIS
land surface temperature data to estimate air temperature in different ecosystems over
Africa. – Remote Sensing of Environment 114(2): 449–465. [46] Verburg, P. H., Soepboer, W., Veldkamp, A., Limpiada, R., Espaldon, V., Mastura, S.
S. A. (2002): Modeling the spatial dynamics of regional land use: the CLUE-S model. –
Environmental Management 30(3): 391–405. [47] Wang, C. Z., Guo, H. D., Zhang, L., Liu, S. Y., Qiu, Y. B., Sun, Z. C. (2015a):
Assessing phenological change and climatic control of alpine grasslands in the Tibetan
Plateau with MODIS time series. – International Journal of Biometeorology 59(1): 11–2.
[48] Wang, H., Li, X. B., Long, H. L., Zhu, W. Q. (2009): A study of the seasonal dynamics
of grassland growth rates in Inner Mongolia based on AVHRR data and a light‐use
efficiency model. – International Journal of Remote Sensing 30(14): 3799–3815.
Wu et al.: Net primary productivity dynamics and driving forces in Guangzhou City, China
- 6689 -
APPLIED ECOLOGY AND ENVIRONMENTAL RESEARCH 16(5):6667-6690.
http://www.aloki.hu ● ISSN 1589 1623 (Print) ● ISSN 1785 0037 (Online)
DOI: http://dx.doi.org/10.15666/aeer/1605_66676690
2018, ALÖKI Kft., Budapest, Hungary
[49] Wang, J., Price, K. P., Rich, P. M. (2001): Spatial patterns of NDVI in response to
precipitation and temperature in the central Great Plains. – International Journal of
Remote Sensing 22(18): 3827–3844. [50] Wang, J., Wang, K. L., Zhang, M. Y., Zhang, C. H. (2015b): Impacts of climate change
and human activities on vegetation cover in hilly southern China. – Ecological
Engineering 81: 451–461.
[51] Wang, L. C., Gong, W., Ma, Y. Y., Zhang, M. (2013): Modeling regional vegetation NPP variations and their relationships with climatic parameters in Wuhan, China. –
Earth Interactions 17(4): 1–20.
[52] Wu, S. H., Zhou, S. L., Chen, D. X., Wei, Z. Q., Dai, L., Li, X. G. (2014): Determining the contributions of urbanisation and climate change to NPP variations over the last
decade in the Yangtze River Delta, China. – Science of the Total Environment 472:
397–406.
[53] Wu, Y. Y., Li, S. Y., Yu, S. X. (2016): Monitoring urban expansion and its effects on land use and land cover changes in Guangzhou city, China. – Environmental
Monitoring and Assessment 188(1): 54.
[54] Wu, Y. Y., Wu, Z. F. (2018): Quantitative assessment of human-induced impacts based on net primary productivity in Guangzhou, China. – Environmental Science and
Pollution Research 25(12): 11384–11399.
[55] Xu, C., Liu, M., An, S., Chen, J. M., Yan, P. (2007): Assessing the impact of urbanization on regional net primary productivity in Jiangyin County, China. – Journal
of Environmental Management 85(3): 597–606.
[56] Xu, D. Y., Li, C. L., Zhuang, D. F., Pan, J. J. (2011): Assessment of the relative role of
climate change and human activities in desertification: a review. – Journal of Geographical Sciences 21(5): 926–936.
[57] Yan, H., Zhan, J., Wu, F., Yang, H. (2016): Effects of climate change and LUCC on
terrestrial biomass in the Lower Heihe River Basin during 2001-2010. – Energies 9(4): 9–14.
[58] Yang, L. Y., Zhang, L. B., Li, Y., Wu, S. T. (2015): Water-related ecosystem services
provided by urban green space: A case study in Yixing city (China). – Landscape and Urban Planning 136: 40–51.
[59] Zhang, F. Y., Pu, L. J., Huang, Q. (2015): Quantitative assessment of the human
appropriation of net primary production (HANPP) in the coastal areas of Jiangsu,
China. – Sustainability 7(12): 15857–15870. [60] Zhang, J. H., Hu, Y. L., Xiao, X. M., Chen, P. S., Han, S. J., Song, G. Z., Yu, G. R.
(2009): Satellite-based estimation of evapotranspiration of an old-growth temperate
mixed forest. – Agricultural and Forest Meteorology 149(6–7): 976–984. [61] Zhang, W. T., Huang, B., Luo, D. (2014): Effects of land use and transportation on
carbon sources and carbon sinks: a case study in Shenzhen, China. – Landscape and
Urban Planning 122(2): 175–185.
[62] Zhang, Y., Zhang, C. B., Wang, Z. Q., Chen, Y. Z., Gang, C. C., An, R., Li, J. H. (2016): Vegetation dynamics and its driving forces from climate change and human
activities in the Three-River Source Region, China from 1982 to 2012. – Science of the
Total Environment 563–564: 210–220. [63] Zhang, Y. L., Song, C. H., Zhang, K. R., Cheng, X. L., Zhang, Q. F. (2014): Spatial-
temporal variability of terrestrial vegetation productivity in the Yangtze River Basin
during 2000-2009. – Journal of Plant Ecology 7(1): 10–23. [64] Zhao, M., Running, S. W. (2010): Drought-induced reduction in global terrestrial net
primary production from 2000 through 2009. – Science 329(5994): 940–943.
[65] Zhao, T. T., Brown, D. G., Fang, H. L., Theobald, D. M. Liu, T., Zhang, T. (2012):
Vegetation productivity consequences of human settlement growth in the eastern United States. – Landscape Ecology 27(8): 1149–1165.
Wu et al.: Net primary productivity dynamics and driving forces in Guangzhou City, China
- 6690 -
APPLIED ECOLOGY AND ENVIRONMENTAL RESEARCH 16(5):6667-6690.
http://www.aloki.hu ● ISSN 1589 1623 (Print) ● ISSN 1785 0037 (Online)
DOI: http://dx.doi.org/10.15666/aeer/1605_66676690
2018, ALÖKI Kft., Budapest, Hungary
[66] Zhu, W. Q., Pan, Y. Z., He, H., Yu, D. Y., Hu, H. B. (2006): Simulation of maximum
light use efficiency for some typical vegetation types in China. – Chinese Science
Bulletin 51(4): 457–463. [67] Zhu, W. Q., Pan, Y. Z., Yang, X. Q., Song, G. B. (2007a): Comprehensive analysis of
the impact of climatic changes on Chinese terrestrial net primary productivity. –
Chinese Science Bulletin 52(23): 3253–3260.
[68] Zhu, W. Q., Pan, Y. Z., Zhang, J. S. (2007b): Estimation of net primary productivity of Chinese terrestrial vegetation based on remote sensing. – Chinese Journal of Plant
Ecology 31(3): 413–424.