Net Lease Research Report Q4 2011
4
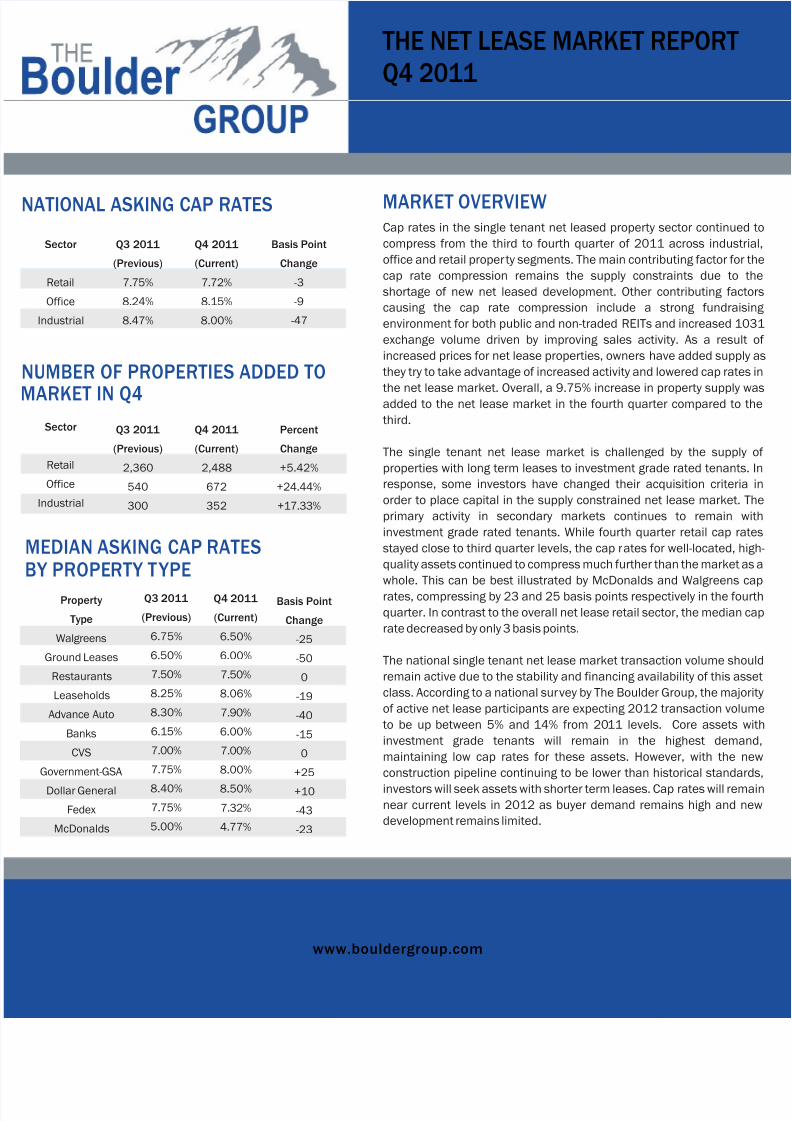
THE NET LEASE MARKET REPORT Q4 2011 www.bouldergroup.com Cap rates in the single tenant net leased property sector continued to compress from the third to fourth quarter of 2011 across industrial, office and retail proper ty segments. The main contributing factor for the cap rate compression remains the supply constraints due to the shortage of new net leased development. Other contributing factors causing the cap rate compression include a strong fundraising environment for both public and non-traded REITs and increased 1031 exchange volume driven by improving sales activity. As a result of increased prices for net lease properties, owners have added supply as they try to take advantage of increased activity and lowered cap rates in the net lease market. Overall, a 9.75% increase in property supply was added to the net lease market in the fourth quarter compared to the third. The single tenant net lease market is challenged by the supply of properties with long term leases to investment grade rated tenants. In response, some investors have changed their acquisition criteria in order to place capital in the supply constrained net lease market. The primary activity in secondary markets continues to remain with investment grade rated tenants. While fourth quarter retail cap rates stayed close to third quarter levels, the cap r ates for well-located, high- quality assets continued to compress much further than the market as a whole. This can be best illustrated by McDonalds and Walgreens cap rates, compressing by 23 and 25 basis points respectively in the fourth quarter. In contrast to the overall net lease retail sector, the median cap rate decreased by only 3 basis points. The national single tenant net lease market transaction volume should remain active due to the stability and financing availability of this asset class. According to a national sur vey by The Boulder Group, the majority of active net lease participants are expecting 2012 transaction volume to be up between 5% and 14% from 20 11 levels. Core assets with investment grade tenants will remain in the highest demand, maintaining low cap rates for these assets. However, with the new construction pipeline continuing to be lower than historical standards, investors will seek assets with shorter term leases. Cap rates will remain near current levels in 2012 as buyer demand remains high and new development remains limited. NUMBER OF PROPERTIES ADDED TO MARKET IN Q4 Sector Retail Office Industrial Q3 2011 (Previous) 2,360 540 300 Q4 2011 (Current) 2,488 672 352 Percent Change +5.42% +24.44% +17.33% MARKET OVERVIEW MEDIAN ASKING CAP RATES Property Type Walgreens Ground Leases Restaurants Leaseholds Advance Auto Banks CVS Government-GSA Dollar General Fedex McDonalds Q3 2011 (Previous) 6.75% 6.50% 7.50% 8.25% 8.30% 6.15% 7.00% 7.75% 8.40% 7.75% 5.00% Q4 2011 (Current) 6.50% 6.00% 7.50% 8.06% 7.90% 6.00% 7.00% 8.00% 8.50% 7.32% 4.77% Basis Point Change -25 -50 0 -19 -40 -15 0 +25 +10 -43 -23 BY PROPERTY T YPE NATIONAL ASKING CAP RATES Sector Retail Office Industrial Q3 2011 (Previous) 7.75% 8.24% 8.47% Q4 2011 (Current) 7.72% 8.15% 8.00% Basis Point Change -3 -9 -47
Transcript of Net Lease Research Report Q4 2011
8/3/2019 Net Lease Research Report Q4 2011
http://slidepdf.com/reader/full/net-lease-research-report-q4-2011 1/3
THE NET LEASE MARKET REPORT
Q4 2011
www.bouldergroup.com
Cap rates in the single tenant net leased property sector continue
compress from the third to fourth quarter of 2011 across indust
office and retail property segments. The main contributing factor for
cap rate compression remains the supply constraints due to
shortage of new net leased development. Other contributing fac
causing the cap rate compression include a strong fundrai
environment for both public and non-traded REITs and increased 1
exchange volume driven by improving sales activity. As a resul
increased prices for net lease properties, owners have added supp
they try to take advantage of increased activity and lowered cap rate
the net lease market. Overall, a 9.75% increase in property supply added to the net lease market in the fourth quarter compared to
third.
The single tenant net lease market is challenged by the suppl
properties with long term leases to investment grade rated tenants
response, some investors have changed their acquisition criteri
order to place capital in the supply constrained net lease market.
primary activity in secondary markets continues to remain
investment grade rated tenants. While fourth quarter retail cap ra
stayed close to third quarter levels, the cap rates for well-located, h
quality assets continued to compress much further than the market
whole. This can be best illustrated by McDonalds and Walgreens
rates, compressing by 23 and 25 basis points respectively in the fo
quarter. In contrast to the overall net lease retail sector, the median
rate decreased by only 3 basis points.
The national single tenant net lease market transaction volume sho
remain active due to the stability and financing availability of this as
class. According to a national survey by The Boulder Group, the majo
of active net lease participants are expecting 2012 transaction volu
to be up between 5% and 14% from 2011 levels. Core assets
investment grade tenants will remain in the highest dema
maintaining low cap rates for these assets. However, with the
construction pipeline continuing to be lower than historical standa
investors will seek assets with shorter term leases. Cap rates will remnear current levels in 2012 as buyer demand remains high and n
development remains limited.
UMBER OF PROPERTIES ADDED TO
MARKET IN Q4
Sector
Retail
Office
Industrial
Q3 2011
(Previous)
2,360
540
300
Q4 2011
(Current)
2,488
672
352
Percent
Change
+5.42%
+24.44%
+17.33%
MARKET OVERVIEW
MEDIAN ASKING CAP RATES
Property
Type
Walgreens
Ground Leases
Restaurants
Leaseholds
Advance Auto
Banks
CVS
Government-GSA
Dollar General
Fedex
McDonalds
Q3 2011
(Previous)
6.75%
6.50%
7.50%
8.25%
8.30%
6.15%
7.00%
7.75%
8.40%
7.75%
5.00%
Q4 2011
(Current)
6.50%
6.00%
7.50%
8.06%
7.90%
6.00%
7.00%
8.00%
8.50%
7.32%
4.77%
Basis Point
Change
-25
-50
0
-19
-40
-15
0
+25
+10
-43
-23
BY PROPERTY TYPE
ATIONAL ASKING CAP RATES
Sector
Retail
Office
Industrial
Q3 2011
(Previous)
7.75%
8.24%
8.47%
Q4 2011
(Current)
7.72%
8.15%
8.00%
Basis Point
Change
-3
-9
-47

8/3/2019 Net Lease Research Report Q4 2011
http://slidepdf.com/reader/full/net-lease-research-report-q4-2011 2/3
THE NET LEASE MARKET REPORT
Q4 2011
NET LEASED CAP RATE TRENDS
Q1
2004
Q2
2004
Q3
2004
Q4
2004
8.75%
8.35%
7.55%
6.75%
7.15%
7.95%
Q1
2005
Q2
2005
Q3
2005
Q4
2005
Q1
2006
Q2
2006
Q3
2006
Q4
2006
Q1
2007
Q2
2007
Q3
2007
Q4
2007
Q1
2008
Q2
2008
Q3
2008
Q4
2008
Q1
2009
Q2
2009
Q3
2009
Q4
2009
Q1
2010
Q2
2010
Q3
2010
Retail Office Ind
SELECTED SINGLE TENANT SALES COMPARABLES
Date
Dec-11
Oct-11
Oct-11
Nov-11
Nov-11
Nov-11
Nov-11
Oct-11
Dec-11
Dec-11
Sector
Office
Retail
Retail
Industrial
Retail
Retail
Retail
Retail
Retail
Retail
Tenant
United Technologies
Giant Eagle
BJ's Wholesale
Performance Food Group
Walgreens
Walgreens
Rite Aid
CVS
Hobby Lobby
Walgreens
City
Bradenton
Columbus
Voorhees
Santa Cruz
Maplewood
McKinney
Fairfax
Cherry Hill
Concord
Olive Branch
State
FL
OH
NJ
CA
NJ
TX
VA
NJ
NC
MS
Price
$20,100,000
$19,510,000
$15,900,000
$9,800,000
$8,200,000
$7,300,000
$7,300,000
$6,506,365
$5,800,000
$5,175,000
Per SF
$188
$168
$138
$98
$674
$493
$573
$427
$97
$350
Rate
7.17%
8.13%
7.91%
9.02%
6.86%
6.27%
7.70%
7.06%
7.76%
6.65%
Remain
10
10
13
5
25
22
22
25
13
22
Q4
2010
Q1
2011
Q2
2011 2
www.bouldergroup.com
Price Cap Lease TeSale

8/3/2019 Net Lease Research Report Q4 2011
http://slidepdf.com/reader/full/net-lease-research-report-q4-2011 3/3
THE NET LEASE MARKET REPORT
Q4 2011
2012. The Boulder Group. Information herein has been obtained from databases owned and maintained by The Boulder Group as well as third party sources. We have not verified the informatio
ke no guarantee, warranty or representation about it. This information is provided for general illustrative purposes and not for any specific recommendation or purpose nor under any circumstan
y of the above information be deemed legal advice or counsel. Reliance on this information is at the risk of the reader and The Boulder Group expressly disclaims any liability arising from the us
ormation. This information is designed exclusively for use by The Boulder Group clients and cannot be reproduced, retransmitted or distributed without the express written consent of The Boulder
www.bouldergroup.com
HOW WILL 2012 NET LEASE TRANSACTI
VOLUME COMPARE TO 2011?
NATIONAL BID - ASK CAP RATE SPREAD
Sector
Retail
Office
Industrial
Q3 2011
(Previous)
46
71
50
Q4 2011
(Current)
45
77
47
Basis Point
Change
-1
+6
-3
OR MORE INFORMATION
ohn Feeney | Research Director
UTHOR
ONTRIBUTORS
andy Blankstein | President
Jimmy Goodman | Partner
ARGEST FIVE MSA STATISTICS
MSA
New York
Los Angeles
Chicago
Dallas
Philadelphia
# ofProperties on
the Market
106
299
343
149
112
Retail
Median Cap
Rate
6.40%
6.45%
8.00%
8.00%
8.00%
Office
Median Cap
Rate
6.60%
7.04%
8.50%
9.00%
8.63%
Industrial
Median Cap
Rate
6.75%
7.00%
8.30%
8.00%
8.68%
Volume will be up
15% or more
Volume will be up
5% to 14%
Volume will be
between down 4%
and up 4%
Volume will be
down 5% to down
14%
Volume will be
down 15% or more
(10%)
(64
(21%)
(1%)
(0%)
Source: National survey of net lease participants by The Boulder Group via Link