Nepal OVID 19 Economic Vulnerability Index
21
Nepal COVID-19 Economic Vulnerability Index July 2020 Overview and Technical Guidance
Transcript of Nepal OVID 19 Economic Vulnerability Index

Nepal COVID-19 Economic Vulnerability Index
July 2020
Overview and Technical Guidance

2

3
NEPAL COVID-19
ECONOMIV VULNERABILITY INDEX
Technical Guidance, July 2020
For additional information, please contact:
Evidence, Policy and Innovation Unit
WFP Nepal
Cover page photo credits: Moctar Aboubacar
All rights reserved. The reproduction and dissemination of material in this information product for educational or other
non-commercial uses is authorized without any prior written permission from the copyright holders, provided the source
is fully acknowledged. Reproduction of material in this information product for resale or other commercial purposes is
prohibited without written permission.
© WFP 2020
World Food Programme
Patandhoka Road, Chakupat-10,
Lalitpur 44600, Nepal
www.wfp.org/nepal

CONTENTS
1. COVID-19 vulnerability in Nepal .............................................................................................. 2
COVID-19 effects ..................................................................................................................... 2
Vulnerability in Nepal ............................................................................................................. 2
2. Economic vulnerability index ................................................................................................... 4
Rationale ................................................................................................................................. 4
Framework .............................................................................................................................. 5
Weighting and aggregation .................................................................................................... 5
Robustness and sensitivity ..................................................................................................... 7
Validation ................................................................................................................................ 8
Results and discussion ............................................................................................................ 8
Applications .......................................................................................................................... 10
3. Results mapping .................................................................................................................... 12
Municipality-level vulnerability index .................................................................................. 12
District-level vulnerability index ........................................................................................... 13
Within-province vulnerability index ......................................................................................... 14

2
COVID-19 vulnerability in Nepal
COVID-19 effects
The COVID-19 pandemic is a multi-dimensional one,
affecting different parts of countries around the
world. As a medical crisis, it has stretched the
capacity of national healthcare systems, leading to
substantial loss of life; as an economic crisis, national
travel bans, shelter-in-place orders and the
subsequent widespread disruptions to normal
economic activity have worsened an already
precarious situation for the world’s poor, while work
stoppages have pushed millions of new people into
poverty and vulnerability. The crisis also has an
important food security dimension: food availability
is at a higher risk if countries restrict food exports,
while the loss of income and livelihood can affect
individuals’ ability to access food.1 The crisis is also a
societal one, as prolonged lockdowns have created
fundamental changes in working arrangements,
movement, and inter-household relations.
A UN report2 emphasizes that International actors’
responses to the COVID-19 crisis must, in addition to
being cross-sectoral, also work to support and
strengthen existing systems that contribute to
putting populations at risk in the first place: social
protection regimes and the labor sector, particularly
exposed industries, but also social inequality and
disfunctions, must all be addressed alongside the
immediate needs of those most affected.
Low income countries are particularly concerned by
the economic fallout, with their combination of large
populations living in poverty and limits on their
ability to engage in fiscal stimulus and social
protection measures. Responses must also be fast,
working to prevent a spiral of lower income leading
to low consumption, further weakening producers
and retailers and devastating national industries.
Vulnerability in Nepal
Nepal is expected to be among the hardest hit
countries economically, owing to its low-income
status and combination of high dependency on
imports of food and other essential commodities
with high dependency on the export of labor and
remittances.3 This multi-faceted vulnerability could
mean that Nepal faces a “double or triple burden”
from the economic impact of COVID-19.4
In Nepal’s case, a nationwide lockdown, starting on
the 24th of March and extended through July, has
placed large restrictions on the movement of people
and goods throughout the country. This has led to
work stoppages and barriers to the transportation of
essential items including food goods. Furthermore,
nationwide lockdown in India has resulted in work
stoppages and income losses for Nepal’s labor
migrants to India while also causing some disruptions
in the import of food goods and raw materials used
in other industries. Similar situations in other
countries have affected the ability of Nepali foreign
labor migrants to earn money and send remittances
home and have also had a direct impact on the
tourism sector in Nepal, as international travel has
been greatly restricted.
Economic shocks from these above factors are
touching a highly-exposed population. A majority of
Nepal’s labor force—62% or 4.4 million people—
works in the informal sector and 59% of enterprise
laborers are in micro-enterprises5, often with low or
nonexistent social insurance coverage. The effects of
the above factors may be worsened by large scale
returns of migrants abroad. An estimated 1.5 million
Nepalis are working in Gulf countries, a significant
1 World Food Programme, Food and Agriculture Organization, International Fund for Agriculture Development. “Joint Statement on COVID-19 Impacts on Food Security and Nutrition,” 21 April 2020. 2 UNSDG. “A UN Framework for the Immediate Socio-Economic Response to COVID-19,” April 2020. 3 World Food Programme. “Economic and food security implications of the COVID-19 outbreak. An update with insights from different regions,” 14 April 2020. 4 World Food Programme. “COVID-19 Targeting and Prioritization Paper,” 28 April 2020. 5Nepal Labor Force Survey. 2018-2019.

3
portion of which have not yet returned to Nepal.
Seasonal labor migrants to India are harder to count,
but an estimated several hundred thousand migrants
have already returned from India over since the start
of the national lockdown6, with additional returns
continuing through May as India’s lockdown has
eased. A large-scale repatriation of labor migrant
returns may put an additional strain on the
government’s emergency response, which includes
provisions for employment-based conditional cash/
food transfers, for example through the Prime
Minister’s Employment Programme. Other
demographic factors, including the entry of some
500,000 youth into the labor market each year, are
expected to further stretch the need.
Given the high levels of expected needs to ensure an
adequate economic response and recovery, as well
as the expediency of taking action in the short term,
there is a need to identify areas in the country that
are most vulnerable to the economic effects of
COVID-19. This will support actors (WFP, but also
other development partners and government) in (1)
directing resources and programmes in the response,
taking as reference a metric that considers multiple
often counter-balancing data, (2) estimating the
potential scale of the issue, people and households
most affected.
6 World Food Programme Nepal. Informal consultations with government, April 2020.

4
Economic Vulnerability Index
Rationale
Measures of poverty, deprivation, food insecurity do
exist in Nepal, measuring undernutrition, poverty,
household wealth and food consumption to name a
few. Despite the presence of related indicators
within the existing data toolbox, a new measure
which identifies and prioritizes the economically
vulnerable areas to COVID-19 in the country is
needed for the following reasons:
The COVID-19 crisis is revealing vulnerabilities
which are not always captured in existing
measures: fragility within the tourism industry, or
within certain groups of salaried employment,
are not generally considered in existing measures
of deprivation.
There are several dimensions to economic
vulnerability COVID-19 (mentioned above), which
may weigh against one another. It is important to
emphasize a consolidated approach that
considers and simultaneously accounts for
different dimensions to vulnerability, beyond the
for example the identification of particular
groups (ex. all migrants) as being vulnerable,
which may not simultaneously consider other
factors such as poverty, or access to relief and
support.
Constrained resource availability both within the
international community and Government of
Nepal underscores the importance of efficiently
allocating resources across the country, using a
single consistent measure to compare across
local governments. An index—with the caveats
that come with the use of such tools—can
provide such a measure.
Updated measures of vulnerability (for example
from household surveys obtained in the first
weeks/months of Nepal’s nationwide lockdown),
while relevant, are often only available at
national or provincial levels, and not suitable to
allocate resources across the country.
Geographic targeting can help to understand
larger trends in how communities are vulnerable,
including in terms of ecological belt, trade routes
and physical access and connectivity, and can
inform thinking around longer-term responses
and recovery.
This note proposes an index that ranks the
vulnerability of municipalities to the economic
effects tied to the COVID-19 crisis, as described
above. While ultimately we are interested in the
welfare of people, for practical purposes the
municipality is considered as the unit of analysis. It is
also important to note that this index advances a
relative ranking enabling hierarchies across
municipalities, for example for prioritizing a
response, but does not try to measure vulnerability
in absolute terms.
As with all composite indices, condensing multiple
sources of data into a single number necessarily
results in the loss of information. As such the results
of any such work need to be considered not in
isolation but together with other information:
qualitative data, data that is updated as time passes
and the situation changes, data that accounts for the
response of government and development partners,
and also information that is not as amenable to
objective measurement, such as political-economy
analysis.

5
Framework
The framework for this vulnerability index is rooted
in the conceptualization of vulnerability as a function
of three elements: exposure, sensitivity and adaptive
capacity, commonly adopted in the climate change
and emergency preparedness literature.7,8
Here, we consider exposure to be the degree to
which people in a given municipality are exposed to
the mechanisms which can cause poverty and food
insecurity, namely: job loss, loss of income, and the
prevalence of socially marginalized groups.
Sensitivity is the extent to which a municipality’s
people experience those adverse economic effects to
which they are exposed. It is assumed that high rates
of social deprivation mean that a municipality’s
people are more likely to experience additional
poverty and food insecurity, that the extent of that
poverty and food insecurity is likely to be higher than
for municipalities that have low baseline levels of
social deprivation. Adaptive capacity, finally, is the
ability of the municipality and those within it to take
steps to mitigate these negative economic effects—
by supporting its out-of-work population through
social protection schemes, by stabilizing market
prices, or other means. There are several ways of
defining the vulnerability function from these three
elements. Here we use the formula:
In which, for a given municipality i, V is denoted as
the corresponding vulnerability score, E as the
corresponding Exposure score, likewise S is the
corresponding Sensitivity score and AC is the
corresponding Adaptive Capacity score.9 Exposure
and Sensitivity combined are often referred to as the
‘potential impact’.
For this index, an initial review of over 50 potentially
relevant data sources was conducted, and an initial
framework put together. This draft framework was
then validated through initial consultations with
experts in the WFP Regional Bureau Bangkok,
followed by external consultations with UNICEF and
UNDP. The framework was subsequently
restructured to incorporate feedback received, its
variables revised down to 16. While multiple data
sources exist which could potentially fit in the
framework, there are very few which are both
updated and at a low-enough level of aggregation to
be used. Where possible, we make use of these.
Older data is also used where relevant, providing
they are relevant and can be reasonably considered
to still accurately rank municipalities on a measure.
The framework, with data sources incorporated, is in
the table below. It is comprised of 4 layers: the index,
three sub-indices, 9 dimensions and 16 indicators.
The makeup of each grouping (index, sub-index and
dimensions), is informed by two criteria: the
relevance of each indicator, individually to the
dimension (and of each dimension to the sub-index),
and the sufficiency of the indicators together to the
definition of the dimension (likewise with the
dimensions and sub-indices).
Weighting and aggregation
Indicators (represented by variables) are represented
by percentiles and summed within each dimension.
The sum of these variables is then converted into
percentiles to make up each dimension score.
Dimensions are then summed within each sub-index,
7 Brooks, N. Vulnerability, risk and adaptation: a conceptual framework. Tyndall Centre for Climate Change Working Paper 38 (University of East Anglia, Norwich, UK, 2003). IPCC. Climate change 2014: synthesis report. Contribution of Working Groups I, II and III to the Fifth Assessment Report of the Intergovernmental 8 Panel on Climate Change (eds. Pachauri, R. K. & Meyer, L. A.) (IPCC, Geneva, Switzerland, 2014). 9 Another common method is additive (V = E + S - AC). We prioritize a geometric relationship here mainly to emphasize the im-portance of high Exposure and Sensitivity measures occurring simultaneously.

6
the resulting figure turned into percentiles to make
up the score of each sub-index. Indicators are equally
weighted within each dimension, and dimensions are
equally weighted within each sub-index.
The assignment of equal weights is a common
practice in constructing composite indices10,11 though
there are many ways of calculating weights, including
by using expert rankings of variables’ relative
importance. Variables are assigned equal weighting
within each dimension here because: (1) weighting
based on expert ranking is generally is not advised
above 10 variables, yet we have 16 (2) there can
reasonably be disagreements on both which
indicators to give additional weight and how to
weight them. The complexity of weighting
methodologies can also impede the understanding
of, trust in and ultimately the use of the resulting
index. Instead we benchmark the straightforward
methodology used in the Surgo Foundation’s COVID-
19 Community Vulnerability Index of the United
States12 as well as the United States CDC’s
Community Vulnerability Index on which it is based13,
and make each dimension equally weighted within
its sub-index.
Equal weighting within dimensions means that for
the indicators, there is an implicit weighting applied
as there are different numbers of indicators within
each dimension. That is, given their equal weighting
within each dimension, each indicator within a large
dimension, such as that of Poverty and Food
Security, will influence that dimension’s score less
than indicators within dimensions with only one or
two indicators, such as Access to Basic Services or
Remittance Dependency.
This is not a significant concern as we are focused on
ensuring that the indicators which go into the
dimensions are (a) theoretically defensible as a
grouping (b) together, sufficient to represent the sub
-index. This same work was done with the sub-
indices when aggregating into the three measures (E,
S, AC), although fortuitously each sub-index is made
up of three dimensions.
Geometric aggregation14 (in the formula specified
1. Vulnerability Index Framework and Data Sources
10 Weis, S. W. M. et al. 2016. Assessing vulnerability: an integrated approach for mapping adaptive capacity, sensitivity, and exposure. Climate Change 136, p. 615–629. 11 Organization for Economic Cooperation and Development. 2008. Handbook on Constructing Composite Indicators. 12 https://precisionforcovid.org/ccvi 13 https://svi.cdc.gov/ 14 Nardo et. al. 2005. “Tools for Composite Indicators Building,” European Commission Joint Research Centre.

7
above) was chosen as the function to aggregate the
three sub-indices. This choice represents an
understanding of how we should consider tradeoffs
between variables (compensability). While linear
aggregation also allows for compensability across sub
-indices, we specifically want to limit the extent to
which either exposure or sensitivity alone can drive
variation in the vulnerability score, and emphasize
the fact that they need to come together. As an
illustration, an equivalent score of 50 out of 100 for
both exposure and sensitivity, when multiplied,
yields 2,500 and when added yields 100. In contrast a
highly skewed score of 10/100 for exposure and
90/100 for sensitivity will yield 900 when multiplied
and 100 when added. Linear aggregation rewards
both measures equally, but geometric aggregation
rewards the higher simultaneous presence of both
indicators.
For a COVID-19 response, we want to minimize the
extent to which the vulnerability index is simply
capturing existing economic deprivation (high
sensitivity scores) and highlight areas where both
measures are higher, and therefore more relevant to
our measure.
Sensitivity testing
It is important to understand to what extent the
results obtained with the data used are a product of
the methodological choices made. Sensitivity checks
can help isolate factors with a high contribution to
the final score and help rethink methodological
choices. Four basic sensitivity tests were run and
their results were each compared with the selected
vulnerability index:
1. Imputing variables with missing values with the
national median as opposed to the District mean;
2. Separating the migration remittance dimension
into two (India and non-India migration);
3. Using an equal weighting scheme where all
indicators (and not all dimensions) are equally
weighted;
4. Using a linear aggregation scheme instead of a
geometric one.
In the first two cases, the resulting quintile
categories largely overlapped with the vulnerability
index (the chosen measure)’s quintiles. There was
considerably less overlap for the third and fourth
results. In the third case, only 52% of municipalities
were in the same category according to both
measures (compared with 86% and 93% in the first
and second cases respectively).
A detailed look at the third case and the vulnerability
index’s comparison (see graph below) shows that
Provinces had scores that were consistently either
above (Province 5 and Sudurpaschim Province) or
below (Province 1, 2 and Bagmati Province) their
categories for the final vulnerability index. This is
because the plethora of variables chosen under the
Poverty and Food Security measure are placing
inflated value on high chronically food insecure
municipalities. Crucially however as these poverty

8
and food security variables are highly
correlated with one another, they are not
necessarily adding a significant amount of
new information to warrant being counted
separately. For this method to be chosen
instead of the one we have, the number of
variables used would have to be carefully
controlled to ensure that results are less
informed by the simple number of indicators
chosen to represent a dimension.
In the fourth case, additive aggregation
results in 71% of municipalities retaining the
same category. However a closer look (see
graph top left, the ‘flatter’ yellow and brown
lines) reveals that it is essentially Karnali and
Sudurpaschim Provinces which see changes:
many municipalities in these two provinces
are being pushed towards the middle of the
linear aggregation’s distribution. This could
mean that on one hand their low average
adaptive capacity when compared to the
national average is not penalizing them as
much, and originally higher-vulnerability
areas are scored as less vulnerable, while
also, the high-sensitivity / low exposure
municipalities towards the bottom of the
geometric aggregation’s distribution are
suddenly relatively more vulnerable and
pushed up toward the middle of the
distribution.
Using this method might then exaggerate
COVID-related vulnerability in places simply
because they have high sensitivity scores, or
particularly low adaptive capacity scores. As
the goal is to measure COVID-related
economic vulnerability and not simply
2. Sensitivity Analysis Confusion Matrices (number of municipalities)

9
existing vulnerability, this method shows the possible
dangers of imbuing value to either sensitivity or
exposure as opposed to valuing them when they are
simultaneously present.
Validation
True validation of this measure can only be done
through extensive field work, in consultation with
national and local government and partners. As this
is a necessarily an ongoing and lengthy process, we
propose to conduct a rolling validation of the index
with a focus on evaluating the most-vulnerable
quintile of municipalities, confirming or infirming
their status, and proceeding with adjustments from
there.
Validation of the initial framework and concept was
done through consultation with WFP’s Regional
Bureau Bangkok, with UNICEF Nepal and UNDP
Nepal, which resulted in a revised framework and
trimmed-down indicator list. Ultimately however
changes in the way we understand the economic
effects of COVID and how the crisis is unfolding in
Nepal will guide future adjustments to this measure
through a re-examination of the parts that make up
vulnerability and how they interact.
Results and discussion
Overall, vulnerability in the country is concentrated
in Karnali Province, Province 2 and Sudurpaschim
Province, with notable municipalities within Province
1, Gandaki Province and Province 5 specifically
classified among the most vulnerable. In many cases
(but with several important exceptions), the map of
vulnerability coincides in a general sense with that of
both chronic food insecurity and malnutrition.
In the Far West of the country, vulnerability is driven
by a combination of high sensitivity and low adaptive
capacity. Exposure to the economic effects of COVID-
19 is moderate to low in most of these locations,
though many locations in the Far Western Province
of Sudurpaschim are very highly dependent on
migrant labor. Initial municipality assessments and
tallies of ‘most-affected’ households (used as a
variable in the framework under the Sensitivity
index, Job/income loss dimension) identified the
middle of the country and many parts of Province 2
as having highly affected households—however as
additional labor migrants continue to flow into the
country, especially in the Far West this may create an
additional burden on districts like Doti in
Sudurpaschim Province, and may call for a revision of
the methodology.
Province 2 municipalities’ vulnerability is among the
highest in the country. Unlike in the West of Nepal,
the lowland Terai areas of Province 2 are all
considered highly exposed, with a unique
combination of high proportions of marginalized
caste households and proportion of work in high-
exposure industries.
Decisively Province 2 has a very high population
concentration, and relatively lower rates of local
funds generation, along with a low District-level HDI
compared to the national average, which work to
push down the extent to which Province 2 could deal
with large-scale COVID-related economic downturns.
The pockets of low-access municipalities in the mid-
North and North-East of the country represent
underserved areas where access constraints
underscore many of the development challenges
faced. The isolated nature of these locations can
create market distortions, driving up the price of
10
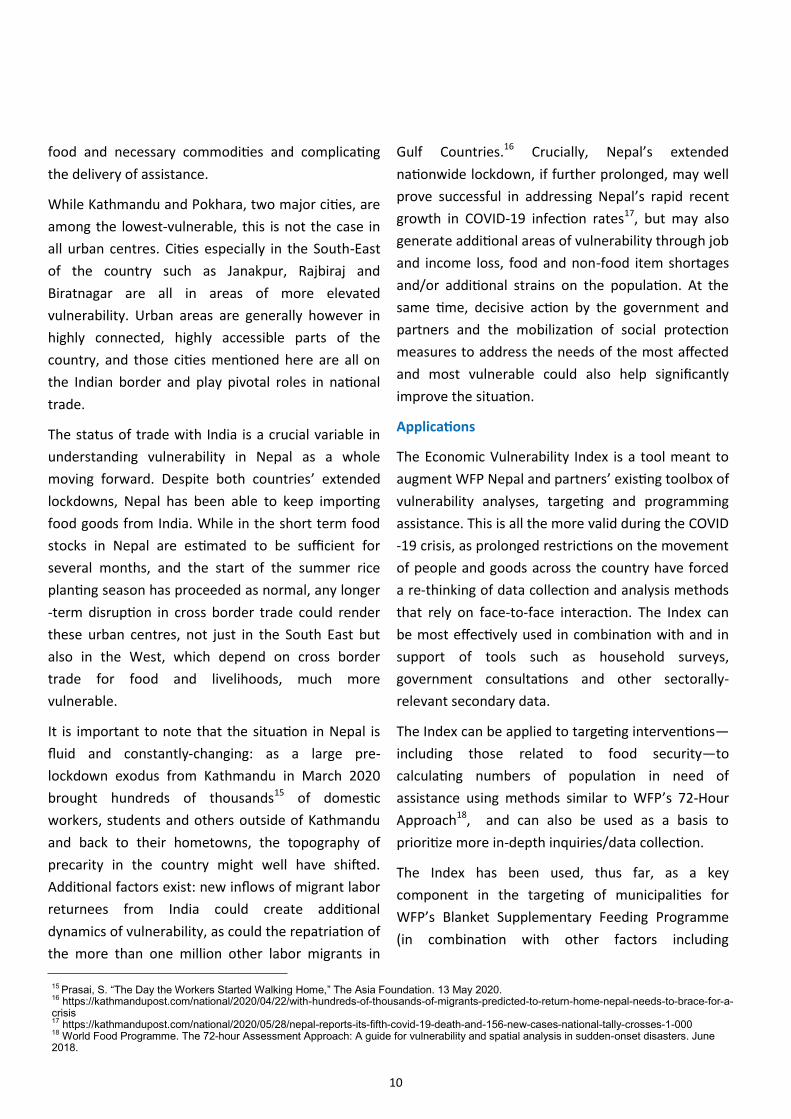
food and necessary commodities and complicating
the delivery of assistance.
While Kathmandu and Pokhara, two major cities, are
among the lowest-vulnerable, this is not the case in
all urban centres. Cities especially in the South-East
of the country such as Janakpur, Rajbiraj and
Biratnagar are all in areas of more elevated
vulnerability. Urban areas are generally however in
highly connected, highly accessible parts of the
country, and those cities mentioned here are all on
the Indian border and play pivotal roles in national
trade.
The status of trade with India is a crucial variable in
understanding vulnerability in Nepal as a whole
moving forward. Despite both countries’ extended
lockdowns, Nepal has been able to keep importing
food goods from India. While in the short term food
stocks in Nepal are estimated to be sufficient for
several months, and the start of the summer rice
planting season has proceeded as normal, any longer
-term disruption in cross border trade could render
these urban centres, not just in the South East but
also in the West, which depend on cross border
trade for food and livelihoods, much more
vulnerable.
It is important to note that the situation in Nepal is
fluid and constantly-changing: as a large pre-
lockdown exodus from Kathmandu in March 2020
brought hundreds of thousands15 of domestic
workers, students and others outside of Kathmandu
and back to their hometowns, the topography of
precarity in the country might well have shifted.
Additional factors exist: new inflows of migrant labor
returnees from India could create additional
dynamics of vulnerability, as could the repatriation of
the more than one million other labor migrants in
Gulf Countries.16 Crucially, Nepal’s extended
nationwide lockdown, if further prolonged, may well
prove successful in addressing Nepal’s rapid recent
growth in COVID-19 infection rates17, but may also
generate additional areas of vulnerability through job
and income loss, food and non-food item shortages
and/or additional strains on the population. At the
same time, decisive action by the government and
partners and the mobilization of social protection
measures to address the needs of the most affected
and most vulnerable could also help significantly
improve the situation.
Applications
The Economic Vulnerability Index is a tool meant to
augment WFP Nepal and partners’ existing toolbox of
vulnerability analyses, targeting and programming
assistance. This is all the more valid during the COVID
-19 crisis, as prolonged restrictions on the movement
of people and goods across the country have forced
a re-thinking of data collection and analysis methods
that rely on face-to-face interaction. The Index can
be most effectively used in combination with and in
support of tools such as household surveys,
government consultations and other sectorally-
relevant secondary data.
The Index can be applied to targeting interventions—
including those related to food security—to
calculating numbers of population in need of
assistance using methods similar to WFP’s 72-Hour
Approach18, and can also be used as a basis to
prioritize more in-depth inquiries/data collection.
The Index has been used, thus far, as a key
component in the targeting of municipalities for
WFP’s Blanket Supplementary Feeding Programme
(in combination with other factors including
15 Prasai, S. “The Day the Workers Started Walking Home,” The Asia Foundation. 13 May 2020. 16 https://kathmandupost.com/national/2020/04/22/with-hundreds-of-thousands-of-migrants-predicted-to-return-home-nepal-needs-to-brace-for-a-crisis 17 https://kathmandupost.com/national/2020/05/28/nepal-reports-its-fifth-covid-19-death-and-156-new-cases-national-tally-crosses-1-000 18 World Food Programme. The 72-hour Assessment Approach: A guide for vulnerability and spatial analysis in sudden-onset disasters. June 2018.

11
government consultation and child malnutrition
rates) in Province 2. It has also been used in WFP’s
Joint Proposal for COVID-19 Livelihood and Economic
Recovery in Nepal, prepared with UNDP Nepal, to
target areas of intervention. As the COVID-19 crisis
continues to affect every part of life in Nepal, this
tool may be adopted for further use within
government and among partners to guide support to
those most in need in a consistent, evidence-driven
manner.

12
Results Mapping
Municipality-level vulnerability index
The continuous-variable vulnerability index and the three sub-indices are cut into quintiles at the
national level and visualized below.

13
District-level vulnerability index
District-level measures were produced by population-weighted aggregation of municipality scores
and ordering by quintiles.

14
Within-Province vulnerability index
A within-Province ranking was also done to prioritize municipalities within each Province. The result
ranks municipalities by priority in comparison only with other municipalities in the same province .

15

16

17

World Food Programme
Patandhoka Road Chakupat-10,
Lalitpur 44600, Nepal
wfp.org