
Needham & Co Investors Conference
24
Needham & Co Investors Conference NYSE: NPTN January 2020
Transcript of Needham & Co Investors Conference

Needham & Co Investors ConferenceNYSE: NPTNJanuary 2020

2
Forward Looking Statements and Other Important CautionsThis presentation includes statements that qualify as forward-looking statements under the Private Securities Litigation Reform Act of 1995. These forward-looking statements include statements aboutthe following topics: future financial results, the Company’s market position and industry trends.
Forward-looking statements are subject to certain risks and uncertainties that could cause the actual results to differ materially. These forward-looking statements include statements about the followingtopics: future financial results, demand for the Company’s high-speed products, and the Company’s market position. Forward-looking statements are subject to certain risks and uncertainties that couldcause the actual results to differ materially. Those risks and uncertainties include, but are not limited to, such factors as: the Company’s reliance on a small number of customers for a substantial portionof its revenues; market growth in China and other key countries; possible reduction in or volatility of customer orders or delays in shipments of products to customers; timing of customer drawdowns ofvendor-managed inventory; potential governmental trade actions; possible disruptions in the supply chain or in demand for the Company’s products due to industry developments; the ability of theCompany's vendors and subcontractors to supply or manufacture the Company's products in a timely manner; ability of the Company to meet customer demand; volatility in utilization of manufacturingoperations and manufacturing costs; reductions in the Company’s rate of new design wins, and/or the rate at which design wins go into production, and the rate of customer acceptance of new productintroductions; potential pricing pressure that may arise from changing supply or demand conditions in the industry; the impact of any previous or future acquisitions or divestitures of assets and relatedproduct lines; challenges involving integration of acquired businesses and utilization of acquired technology; the discontinuance or end of life of certain other products; market adoption, revenue growthand margins of acquired products; changes in demand for the Company's products; the impact of competitive products and pricing and alternative technological advances; the accuracy of estimatesused to prepare the Company's financial statements and forecasts; the timely and successful development and market acceptance of new products and upgrades to existing products; the difficulty ofpredicting future cash needs; the nature of other investment opportunities available to the Company from time to time; the Company’s operating cash flow; changes in economic and industry projections;a decline in general conditions in the telecommunications equipment industry or the world economy generally; and the effects of seasonality.
For further discussion of these risks and uncertainties, please refer to the documents the Company files with the SEC from time to time, including the Company's Annual Report on Form 10-K for theyear ended December 31, 2018 and its Form 10-Q for the three months ended September 30, 2019. All forward-looking statements are made as of the date of this presentation, and the Companydisclaims any duty to update such statements.
You may obtain these documents for free by visiting EDGAR on the SEC website at www.sec.gov.
Non-GAAP and Adjusted EBITDA Measures vs. GAAP Financial Measures
The Company’s non-GAAP and adjusted EBITDA measures exclude certain GAAP financial measures. A reconciliation of the Non-GAAP and Adjusted EBITDA financial measures to the most directlycomparable GAAP financial measures is provided in the financial schedules portion of its press release issued on October 31, 2019 and available in the Investor Relations section of the NeoPhotonicswebsite. Non-GAAP financial measures differ from GAAP measures with the same captions and may differ from non-GAAP financial measures with the same or similar captions that are used by othercompanies. As such, these non-GAAP measures should be considered as a supplement to, and not as a substitute for, or superior to, financial measures calculated in accordance with GAAP.
The Company uses these non-GAAP financial measures to analyze its operating performance and future prospects, develop internal budgets and financial goals, and to facilitate period-to-periodcomparisons. NeoPhotonics believes that these non-GAAP financial measures reflect an additional way of viewing aspects of its operations that, when viewed with its GAAP results, provide a morecomplete understanding of factors and trends affecting its business.

3
NeoPhotonics: World leader in the highest speed optoelectronics
Financial and Operational Scale• TTM Revenues as of Q3’19 of ~$340 million• Growth with expanding margins despite Huawei denial
order• ~1,300 employees (USA, China, Japan, Canada)• ~500 Issued Patents
Deep Technology for Highest Speed Solutions• 64 Gbaud / 600Gbps coherent suite is shipping in volume • Unique ultra-narrow linewidth tunable laser enables highest speed and
farthest distance transmission• Completed initial shipments of 400G/400ZR coherent DCO modules• Enabled by silicon photonics modulator/receiver integration
For Network Equipment Transport | Metro | Data Center
SystemsLine Card | Daughter Card | Transponder
Telco Carriers/Mega Data Centers
Central Office / WebscaleData Center
Components & Modules
Market Ecosystem
Components and Transceivers
Optical ICs
Lasers, Drivers, Amplifiers, Modulators
SemiFabs
Products Customers
4
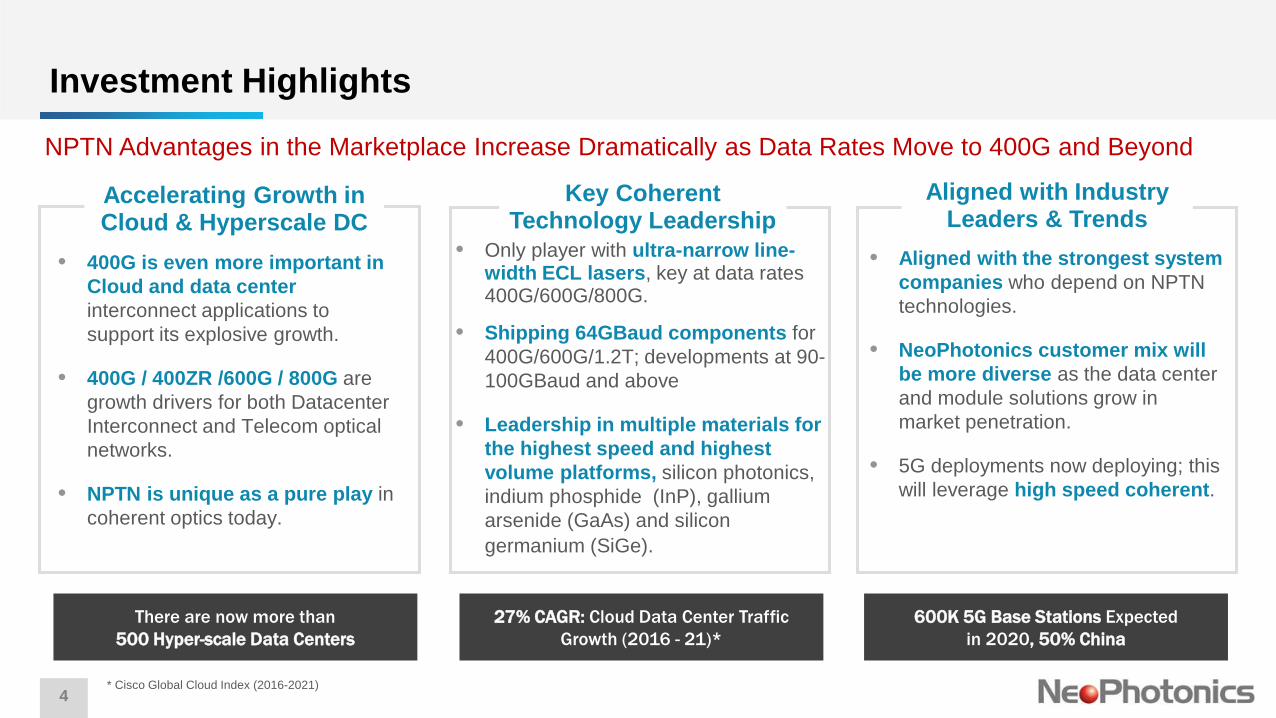
Investment Highlights
Aligned with Industry Leaders & Trends
• Aligned with the strongest system companies who depend on NPTN technologies.
• NeoPhotonics customer mix will be more diverse as the data center and module solutions grow in market penetration.
• 5G deployments now deploying; this will leverage high speed coherent.
Key Coherent Technology Leadership
• Only player with ultra-narrow line-width ECL lasers, key at data rates 400G/600G/800G.
• Shipping 64GBaud components for 400G/600G/1.2T; developments at 90-100GBaud and above
• Leadership in multiple materials for the highest speed and highest volume platforms, silicon photonics, indium phosphide (InP), gallium arsenide (GaAs) and silicon germanium (SiGe).
Accelerating Growth in Cloud & Hyperscale DC
• 400G is even more important in Cloud and data center interconnect applications to support its explosive growth.
• 400G / 400ZR /600G / 800G are growth drivers for both Datacenter Interconnect and Telecom optical networks.
• NPTN is unique as a pure play in coherent optics today.
NPTN Advantages in the Marketplace Increase Dramatically as Data Rates Move to 400G and Beyond
27% CAGR: Cloud Data Center Traffic Growth (2016 - 21)*
600K 5G Base Stations Expected in 2020, 50% China
There are now more than500 Hyper-scale Data Centers
* Cisco Global Cloud Index (2016-2021)

5
Coherent Optics has Broad ApplicationsNPTN is Sampling Coherent Optics Solutions in Medical, Industrial and Automotive Markets
Coherent Telecom / DCI (25% CAGR)2019: $2.9B2023: $6.2B
Optics for 5G (72% CAGR)2019: $0.4B2023: $3.0B
Cloud Data Centers (20% CAGR) 2019: $3.1B2023: $6.0B
Coherent Medical Imaging2024: $1.8B
Coherent LIDAR for Autonomous Vehicles
2023: $1.2B
Coherent Industrial Metrology2023: $13B
Source: Various third-party industry reports and company estimates
Coh
eren
t Com
mC
oher
ent S
ensi
ng

6
OPTICAL PORTS(2020 Market: 630K ports)
Coherent Optical Ports Define Our Business
• NeoPhotonics’ tunable lasers have narrowest line width (ultra pure color)• High performance receivers decode phase and polarization
The Optics The Electronics
TRANSMITTERLaser Modulator
RECEIVERICR
Digital signal processor converts analog signals
to digital
DSP
Sold integrated, as modules, or as components

7
100G Remains A Substantial Market As Edge 10G100G
400G+ Port Growth Takes Off As DCI 100G400G+
400G+ Transceiver Revenue Grows Rapidly With DCI
Data Rates Trending
10G 100G at the Edge 100G 400G for Telco Metro/ LH distances of 400-2000km
400G 600G 800G for DCI distances of 80 km
Source: Company
0
100
200
300
400
500
20162017201820192020202120222023
Coherent 100G Ports
u
0
500
1000
1500
2000
2500
3000
3500
4000
20162017201820192020202120222023
Coherent 400G+ Revenue
Source: Company Source: Company
Ports
(K)
Ports
(K)
Rev
enue
($M
)
0
100
200
300
400
500
600
700
20162017201820192020202120222023
Coherent 400G+ Ports
High speed coherent will outpace other technologies to deliver highest growth over the next five years

8
China Provincial 100G and Mobile 5G Roll-Outs
2020 China high speed port growth is forecast to be >15%; 5G roll-out accelerates
Huawei on “Entities List”• Huawei is on the “Entities List” as of May 21, 2019, prohibiting
shipment of goods subject to US EAR to Huawei and affiliates.• Our shipments are for non-EAR products only with EAR content
below de minimis limits.
• New tenders have been anticipated to continue buildout of China national backbone. These are now in process.– China Mobile’s phase-13 interprovincial backbone network new-build
tender includes 26K ports. Due Jan 2020.– Additional China Mobile tenders include new provincial buildouts for
28 provinces/cities.
• 5G wireless deployments are underway with additional cities; backhaul will be a driver for next several years.
EAR Actions• NeoPhotonics is committed to rigorously complying with United
States Export Regulations. We have implemented processes for ongoing full compliance to EAR
• To date, we have received a license for limited, not material, volumes of U.S. origin lasers.

9
NPTN Competitive Advantage In NLW Lasers Is Key for Highest Speeds
Laser Silicon
DESIGN• NeoPhotonics: A formidable
competitor in silicon• Less expensive• Silicon requires our high
power lasers
• Architecturally superiorlaser design
• Low phase noise / distortion• Narrow line width
No Need for Distorting Amplification
INTEGRATION
10
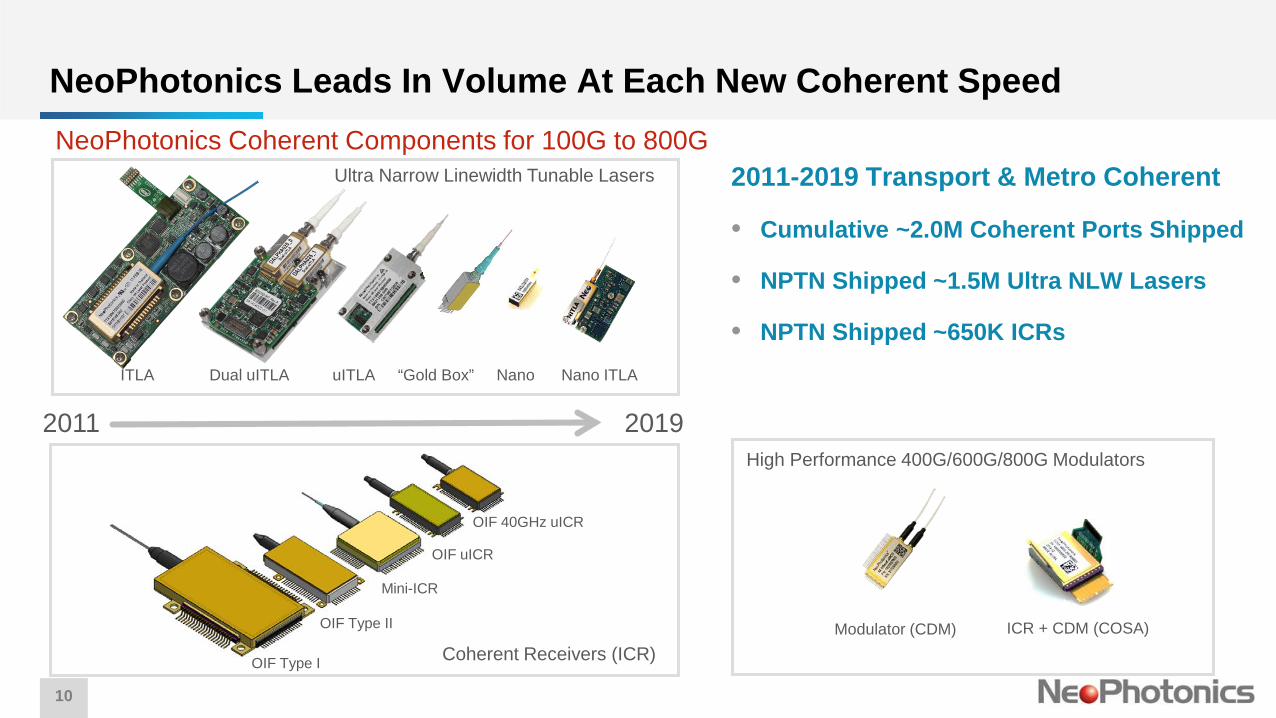
NeoPhotonics Leads In Volume At Each New Coherent Speed
ITLA Dual uITLA uITLA
NeoPhotonics Coherent Components for 100G to 800G
“Gold Box” Nano Nano ITLA
OIF Type I
OIF Type II
Mini-ICR
OIF uICR
OIF 40GHz uICR
Modulator (CDM) ICR + CDM (COSA)
2011-2019 Transport & Metro Coherent
• Cumulative ~2.0M Coherent Ports Shipped
• NPTN Shipped ~1.5M Ultra NLW Lasers
• NPTN Shipped ~650K ICRs
2011 2019
Ultra Narrow Linewidth Tunable Lasers
Coherent Receivers (ICR)
High Performance 400G/600G/800G Modulators

11
Leading with First Customer Shipments of New High Performance 400G / 400ZR Pluggable Modules
400ZR &800G OSFP
400ZRCFP2-DCO
400ZRQSFP-DD
400G/400ZR Module Solutions
Volume
Ultra-Narrow Linewidth Tunable Laser
64 GBaud Driver Modulator (CDM)
64 GBaud Micro ICR
Shipping
Nano-ITLA
64 GBaud COSA
Modulator+
Receiver
COMPONENT EVOLUTION
Sampling
Integrated COSA in SiPho plus Nano TL
DSPDSPDSP

12
DATADATA
C++ LASERTM and ModuleIllustration of Capacity Benefits
50GHz channel spacing
FEATURESWider bandwidth = more pipes (THz)Broader channel spacing = bigger pipes (GHz)→ C++ LaserTM enables more, bigger pipes
BENEFITSAllows data center or carrier to better leverage fiber plant investment Maximize capacity in existing cable / terminal equipment investment→ C++ TransceiversTM allow higher capacity per fiber
75GHz or 100GHz channel spacing
CAP
ACIT
YSP
ECTR
UM
1524nm 1572nm
Expanded C++TM Band6.0-6.5 THz
…C-Band
4 THz Width
1530nm 1562nm
…
1530nm 1568nm
…Extended C-Band
4.8 THz Width
More data flows at 400 Gbps requiring a “bigger pipe” (75 GHz or 100 GHz)
50 GHz bandwidth “pipes” are standard for 100/200Gbpsbut restrict data flow at 400Gbps

13
• High speed optical growth is driven by hyper-scale data center, metro and transition to coherent
• NPTN InP and SiPho high performance platforms are key for 400ZR, 600G and 800G
• Hyper-scale data centers are driving 400ZR, 600G, and 800G markets
• Coherent is the chosen technology for 80km and beyond optical networks
• 400G/400ZR is critical to Cloud and hyperscale data center interconnect with exploding data growth
• In three years time, coherent transceivers will be used inside data centers at 800G on single wavelengths
Key Trends

FINANCIAL UPDATENYSE: NPTN
As of December 2019

15
• Q3’19 showed continued strong execution, results were atthe high end of the range across all metrics.
• Revenue up 13% year-over-year, with strong DCI & Metroand continued good demand in China.
• Huawei demand for non-EAR products holding at 37% ofrevenue, but down from 46% in 2018.
• Non-GAAP gross margin at high end of estimate, on goodexecution and continued cost reductions
• Earnings per share of $0.11/share• $0.07 on ongoing business, at the high end of forecast,• $0.04 for unusual FX good news.
Q3’19 Financial Summary
Note: Q3’19 Non-GAAP gross margin excludes: stock-based compensation expense of $0.4M, amortization of $0.1M
0%
5%
10%
15%
20%
25%
30%
35%
$-
$20
$40
$60
$80
$100
Q4'17 Q1'18 Q2'18 Q3'18 Q4'18 Q1'19 Q2'19 Q3'19 Q4'19Mid Est
Mill
ion
($)
Revenue & Gross Margin
Revenue Gross Margin %

16
Q3’19 P&L Performance (Non-GAAP)
(% of Revenue) Q2’18 Q3’18 Q4’18 Q1’19 Q2’19 Q3’19 Target Model
Revenue $ $81.1M $81.7M $91.1M $79.4M $81.7M $92.4M 100%
Product Margin % 30% 32% 32% 27% 32% 34%
Mfg. Inefficiencies (7)% (6)% (1)% (2)% (5)% (4)%
Other COGS (3)% (2)% (2)% (3)% (1)% (1)%
Gross Margin % 20% 24% 29% 22% 26% 29% 35%
R&D 15% 15% 14% 17% 16% 14%
S&M 4% 4% 4% 5% 4% 3%
G&A 8% 8% 7% 8% 7% 7%
TOTAL OPEX 27% 27% 25% 30% 27% 24% 25%
Operating Margin (7)% (3)% 4% (8)% (1)% 5% 10%
EBITDA 4% 8% 12% (1)% 8% 15% 15%
Q3’19 Non GAAP Financial Measures do not include ($M): Stock-based compensation expense $3.0, Amortization $0.2

17
Q3’19 Balance Sheet
($ Millions) Q2’18 Q3’18 Q4’18 Q1’19 Q2’19 Q3’19
Cash & Equivalents $68 $65 $77 $79 $74 $80
Working Capital 106 112 117 111 108 114
Total Assets $360 $333 $341 $344 $319 $325
Total Debt 68 57 58 56 48 48
Total Liabilities 190 172 180 192 171 175
Shareholders’ Equity 170 161 160 153 148 150
18
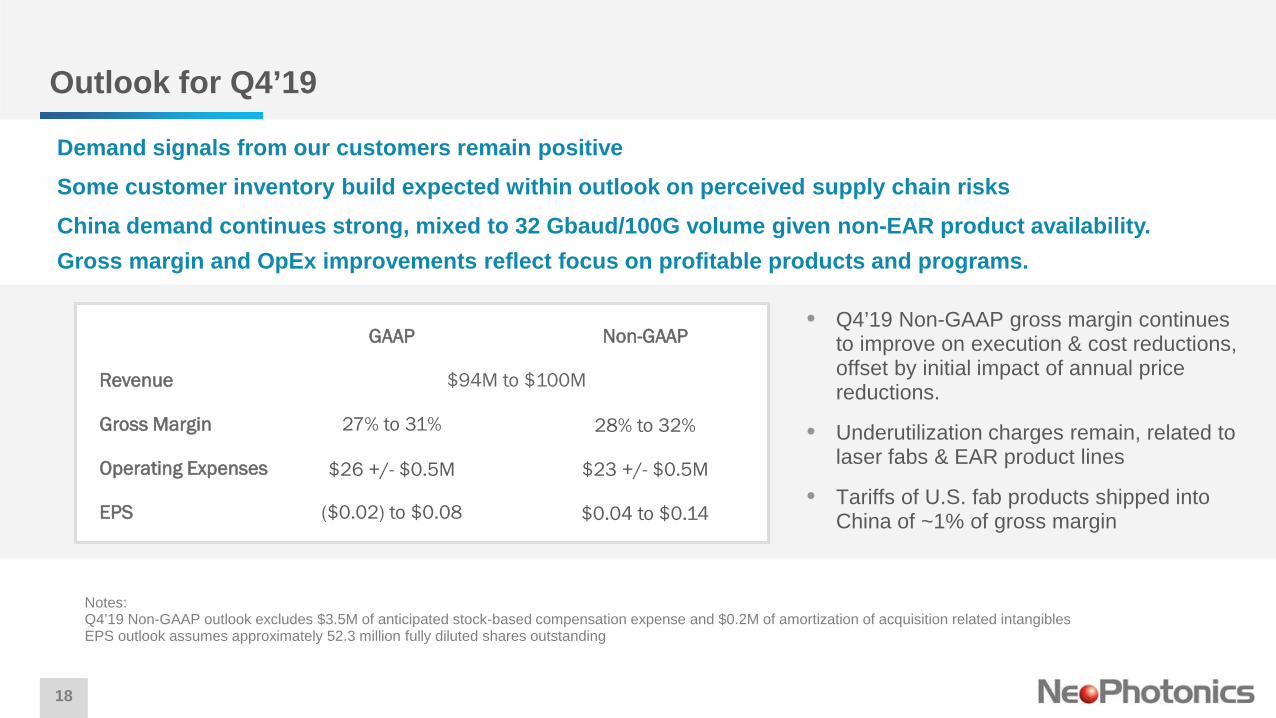
Outlook for Q4’19
• Q4’19 Non-GAAP gross margin continues to improve on execution & cost reductions, offset by initial impact of annual price reductions.
• Underutilization charges remain, related to laser fabs & EAR product lines
• Tariffs of U.S. fab products shipped into China of ~1% of gross margin
Notes: Q4’19 Non-GAAP outlook excludes $3.5M of anticipated stock-based compensation expense and $0.2M of amortization of acquisition related intangiblesEPS outlook assumes approximately 52.3 million fully diluted shares outstanding
GAAP Non-GAAP
Revenue $94M to $100M
Gross Margin 27% to 31% 28% to 32%
Operating Expenses $26 +/- $0.5M $23 +/- $0.5M
EPS ($0.02) to $0.08 $0.04 to $0.14
Demand signals from our customers remain positiveSome customer inventory build expected within outlook on perceived supply chain risksChina demand continues strong, mixed to 32 Gbaud/100G volume given non-EAR product availability.Gross margin and OpEx improvements reflect focus on profitable products and programs.
19
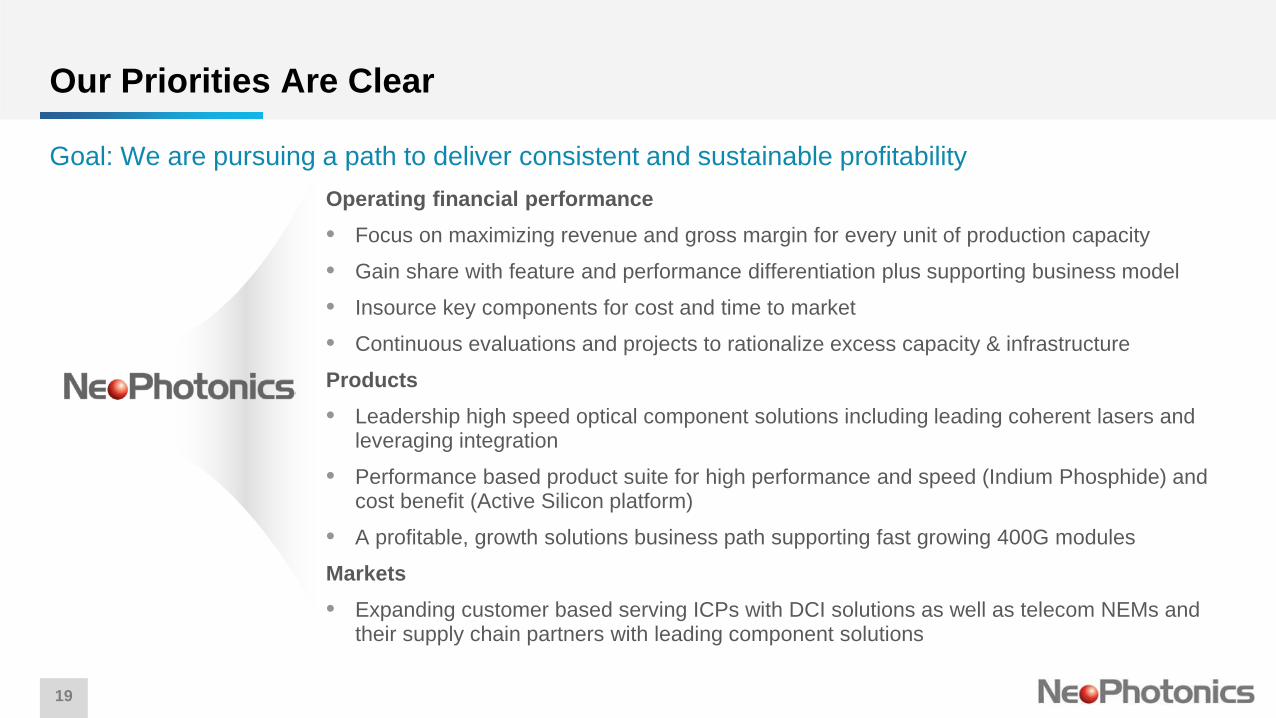
Our Priorities Are Clear
Operating financial performance• Focus on maximizing revenue and gross margin for every unit of production capacity
• Gain share with feature and performance differentiation plus supporting business model
• Insource key components for cost and time to market
• Continuous evaluations and projects to rationalize excess capacity & infrastructure
Products• Leadership high speed optical component solutions including leading coherent lasers and
leveraging integration
• Performance based product suite for high performance and speed (Indium Phosphide) and cost benefit (Active Silicon platform)
• A profitable, growth solutions business path supporting fast growing 400G modules
Markets• Expanding customer based serving ICPs with DCI solutions as well as telecom NEMs and
their supply chain partners with leading component solutions
Goal: We are pursuing a path to deliver consistent and sustainable profitability

See also:www.neophotonics.com/blog/andir.neophotonics.com
Reference
21
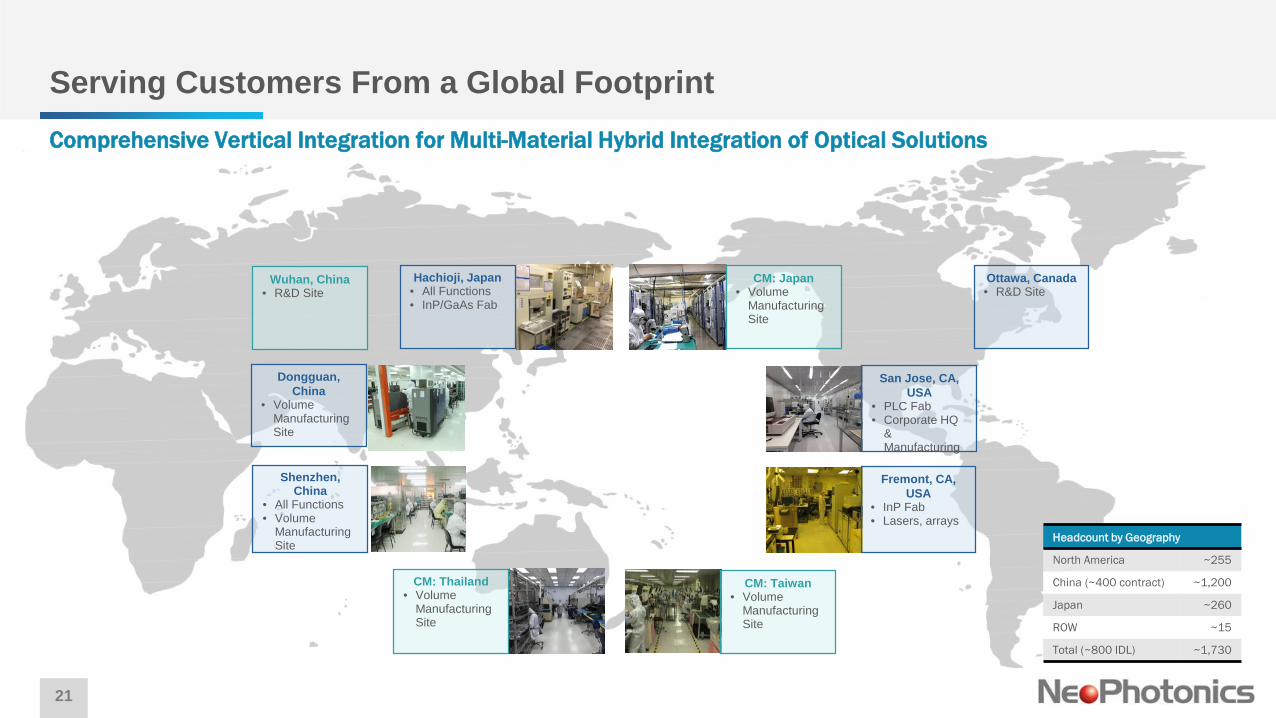
Serving Customers From a Global Footprint
Headcount by Geography
North America ~255
China (~400 contract) ~1,200
Japan ~260
ROW ~15
Total (~800 IDL) ~1,730
Comprehensive Vertical Integration for Multi-Material Hybrid Integration of Optical Solutions
San Jose, CA, USA
• PLC Fab• Corporate HQ
& Manufacturing
Fremont, CA, USA
• InP Fab• Lasers, arrays
Hachioji, Japan• All Functions• InP/GaAs Fab
Dongguan, China
• Volume Manufacturing Site
Shenzhen, China
• All Functions• Volume
Manufacturing Site
CM: Thailand• Volume
Manufacturing Site
CM: Taiwan • Volume
Manufacturing Site
CM: Japan• Volume
Manufacturing Site
Ottawa, Canada• R&D Site
Wuhan, China• R&D Site

22
Q3’19 P&L Performance (Non-GAAP)
($ Millions) Q2’18 Q3’18 Q4’18 Q1’19 Q2’19 Q3’19
Revenue $ $81.1 $81.7 $91.1 $79.4 $81.7 $92.4
Product Margin $ 24.0 26.5 28.8 21.5 26.3 31.8
Mfg. Inefficiencies 3.0 2.1 1.9 2.7 4.4 3.5
Other COGS 4.8 4.8 0.9 1.0 1.0 1.5
Gross Margin $ 16.3 19.6 26.0 17.8 20.9 26.8
R&D 12.4 12.1 12.5 13.8 13.0 12.9
S&M 3.2 3.4 3.6 3.9 3.0 3.2
G&A 6.2 6.6 6.2 6.6 6.1 6.2
TOTAL OPEX 21.8 22.1 22.3 24.2 22.1 22.3
Operating Margin ($5.6) ($2.5) 3.7 ($6.5) ($1.2) $4.4
Adj. EBITDA $3.0 $6.2 $10.5 ($0.8) $6.8 $14.2
Q3’19 GAAP Financial Measures to Non-GAAP Reconciliation
GAAP Net Income $2.3M
Stock-based compensation expense 3.0
Amortization 0.2
Income tax effect of Non-GAAP
Adjustment & others ($0.1)
Non-GAAP Net Income $5.4M

23
Q3’19 P&L Performance (GAAP)
($ Millions) Q2’18 Q3’18 Q4’18 Q1’19 Q2’19 Q3’19
Revenue $ $81.1 $81.7 $91.1 $79.4 $81.7 $92.4
Product Margin $ 24.0 26.5 28.8 21.5 26.3 31.8
Mfg. Inefficiencies (5.8) (5.1) (1.0) (1.4) (4.4) (3.5)
Period Costs (2.0) (1.7) (1.8) (2.4) (1.0) (1.5)
Other Charges (0.8) (0.7) (3.4) (2.0) (5.2) (0.6)
Gross Margin $ 15.5 18.9 22.6 15.7 15.7 26.2
R&D 13.2 13.2 13.5 14.7 13.8 13.7
S&M 3.9 4.4 4.4 4.6 3.6 3.8
G&A 7.3 8.1 7.3 7.8 7.2 7.4
OtherCharges 0.8 2.0 3.9 0.6 (0.7) -
TOTAL OPEX 25.2 27.6 29.2 27.7 23.9 24.9
Operating Margin $(9.8) $(8.7) $(6.6) $(11.9) $(8.2) $1.3

www.neophotonics.com