NC LiDAR (1999-2003) Success in other States – (Zsolt Nagy – AECOM) 1.What was the business...
21
NC LiDAR (1999-2003) Success in other States – (Zsolt Nagy – AECOM) 1.What was the business driver for NC LiDAR? 2.What was the coordination approach? 3.How was the project funded? 4.How is the data managed and distributed? 5.How is the data being used? 6.Suggestions for success (do’s/don’ts) in TN
-
Upload
rhoda-miller -
Category
Documents
-
view
213 -
download
0
Transcript of NC LiDAR (1999-2003) Success in other States – (Zsolt Nagy – AECOM) 1.What was the business...
NC LiDAR (1999-2003)
Success in other States – (Zsolt Nagy – AECOM)
1.What was the business driver for NC LiDAR?2.What was the coordination approach?3.How was the project funded?4.How is the data managed and distributed?5.How is the data being used?6.Suggestions for success (do’s/don’ts) in TN

Hurricane EventsSpecifically in North Carolina, there were 35 deaths; 7000 homes destroyed; 17,000 homes uninhabitable; 56,000 homes damaged; most roads east of I-95 flooded; Tar River crests 24 feet above flood stage; over 1500 people rescued from flooded areas; over 500,000 customers without electricity at some point; 10,000 people housed in temporary shelters; much of Duplin and Greene Counties under water; severe agricultural damage throughout eastern NC; "Nothing since the Civil War has been as destructive to families here," says H. David Bruton, the state's Secretary of Health and Human Services...."The recovery process will be much longer than the water-going-down process"; Wilmington reports new 24-hour station rainfall record (128 year record) with 13.38 inches and over 19 inches for the event. Carolina alone had damage over $3 billion,

Precipitation – A Rain Event

What was the Business Driver(Needs / Limitations Identified)
• Hurricane Floyd revealed data and map limitations
• FEMA program – North Carolina receives on average one updated Flood Study for one county per year
• Only 10-25% of flood hazards in county are evaluated
• ~ 55% of NC FIRMs are at least 10 years old

What was the Business Driver(Needs / Limitations Identified)
• ~ 75% of NC FIRMs are at least 5 years old
• Many up-to-date maps are using 15-20 year old studies
• Many counties and communities have indicated that they do not have resources to take on responsibility
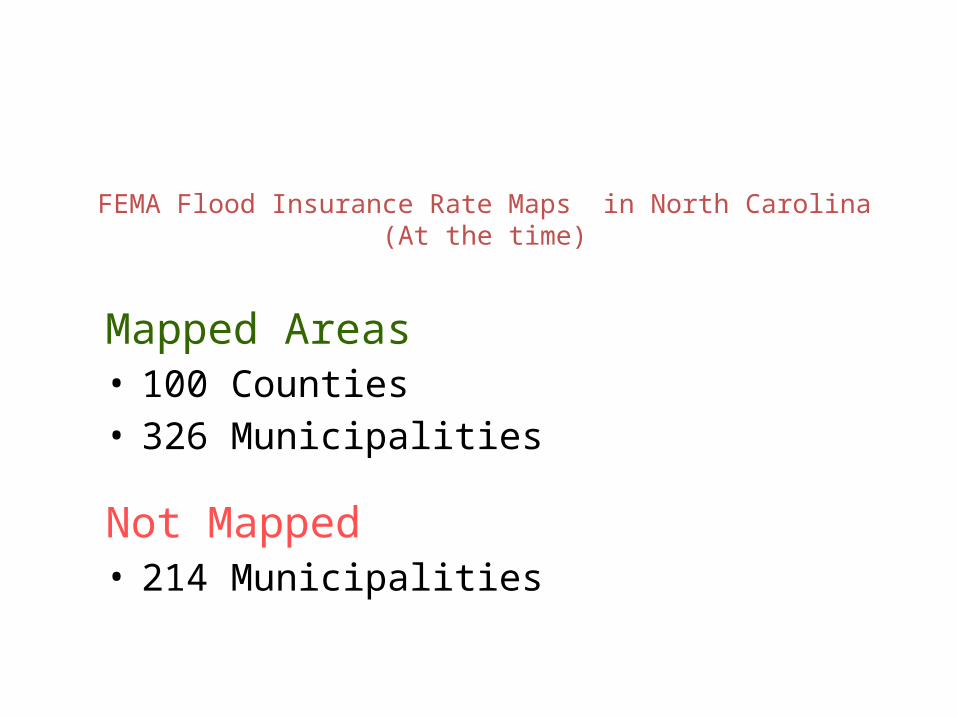
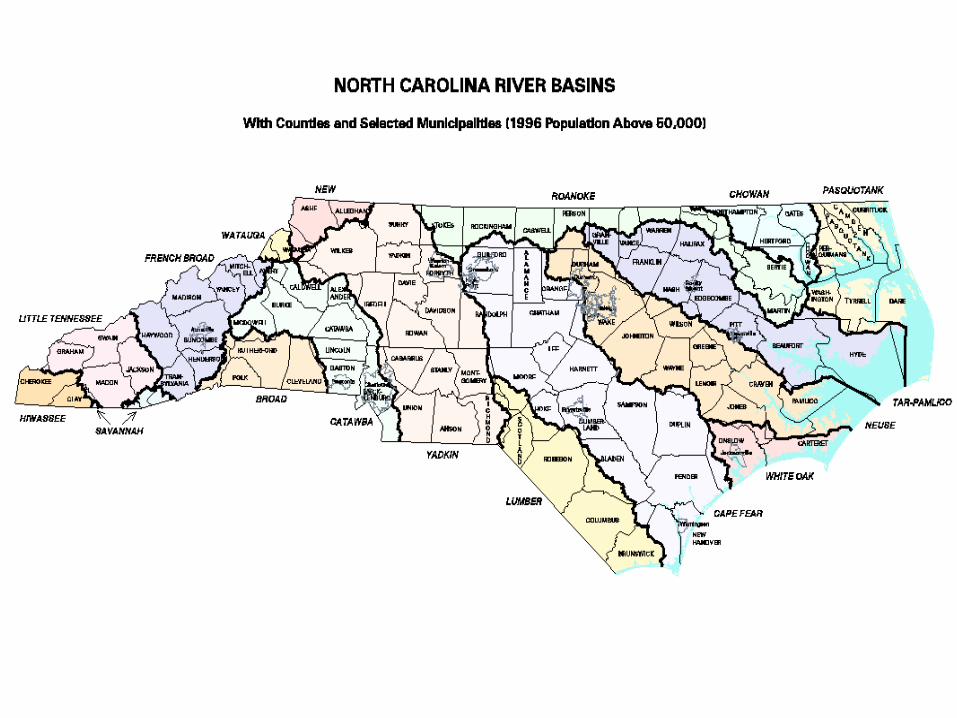
FEMA Flood Insurance Rate Maps in North Carolina(At the time)
Mapped Areas• 100 Counties• 326 Municipalities
Not Mapped• 214 Municipalities
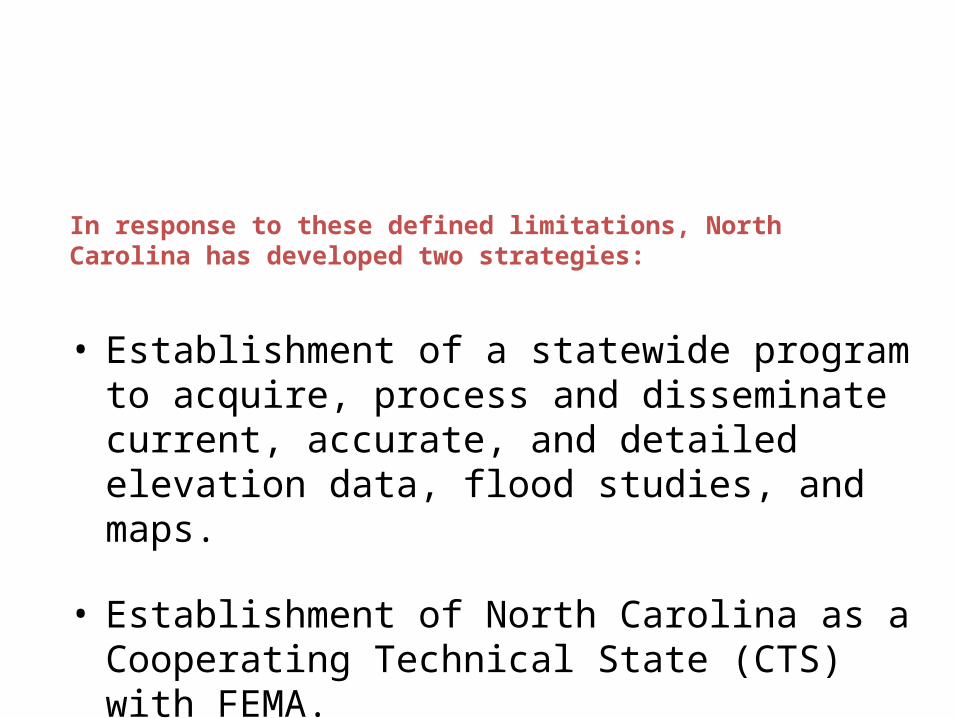
In response to these defined limitations, North Carolina has developed two strategies:
• Establishment of a statewide program to acquire, process and disseminate current, accurate, and detailed elevation data, flood studies, and maps.
• Establishment of North Carolina as a Cooperating Technical State (CTS) with FEMA.
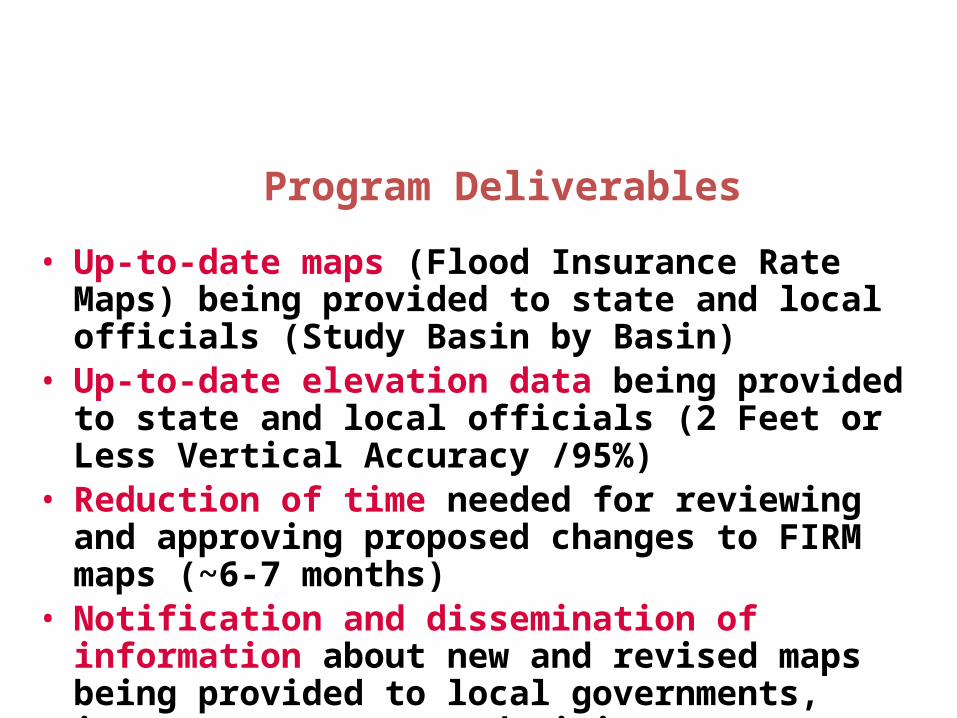
Program Deliverables
• Up-to-date maps (Flood Insurance Rate Maps) being provided to state and local officials (Study Basin by Basin)
• Up-to-date elevation data being provided to state and local officials (2 Feet or Less Vertical Accuracy /95%)
• Reduction of time needed for reviewing and approving proposed changes to FIRM maps (~6-7 months)
• Notification and dissemination of information about new and revised maps being provided to local governments, insurance agents, and citizens

Program Deliverables (continued)
• On-going program for updating and maintaining FIRMs • Post-event mitigation activities being better equipped
and supported with timely updates to flood risk maps• Interoperable GIS• Dissemination of data and maps via the Internet• Next generation information architecture• E-gov• Develop real time prediction of flooding

Project Schedule
• 5 year statewide program• 6 river basins completed by August 2002• 3 river basins before September 2001• State approval of program August 2000

Program Management
• Office of State Budget, Planning and Management– Center for Geographic Information & Analysis– Geodetic Survey
• NC Division of Emergency Management• Federal Emergency Management Agency• Other External: NCBELS, Industry, Communities,
NCLM, NCACC, Community of Coordination Est.

Estimated Project Costs
Component Priority Basins Statewide
Elevation and Base Data $9,000,000 $18,000,000
Flood Modeling and Maps 22,500,000 42,000,000
Project Management 1,500,000 1,500,000
TOTAL $33,000,000 $61,500,000
Non-recurring Management Costs 600,000
Recurring Management Costs 900,000

Elevation Deliverables
• LiDAR Bare Earth• LiDAR DEM 20m• LiDAR DEM Hydro Corrected• Mass Points
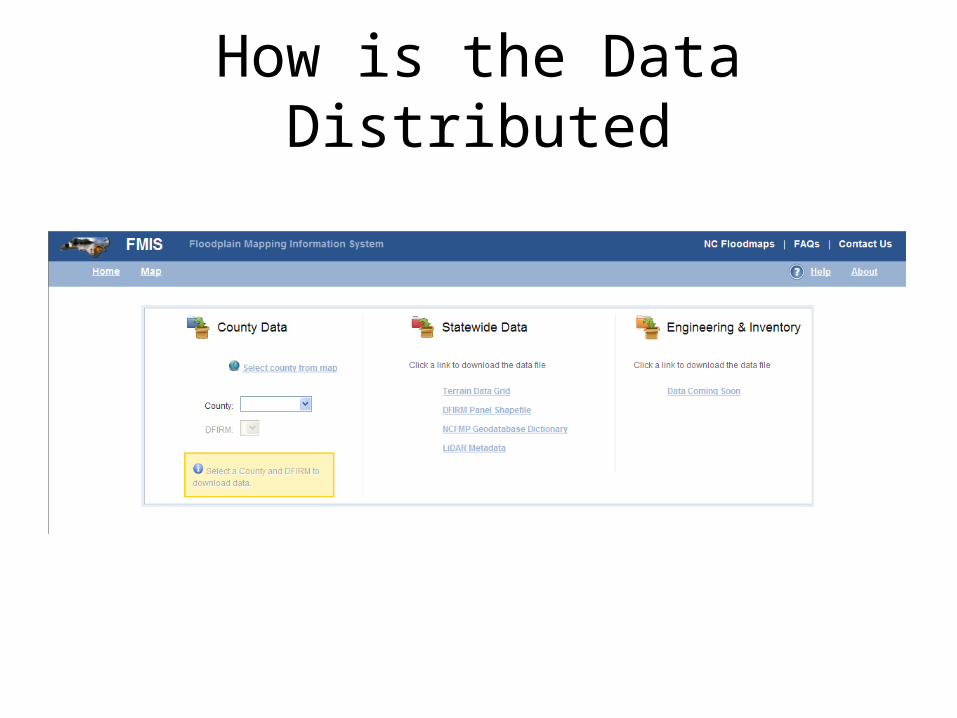
How is the Data Distributed

Elevation Grid
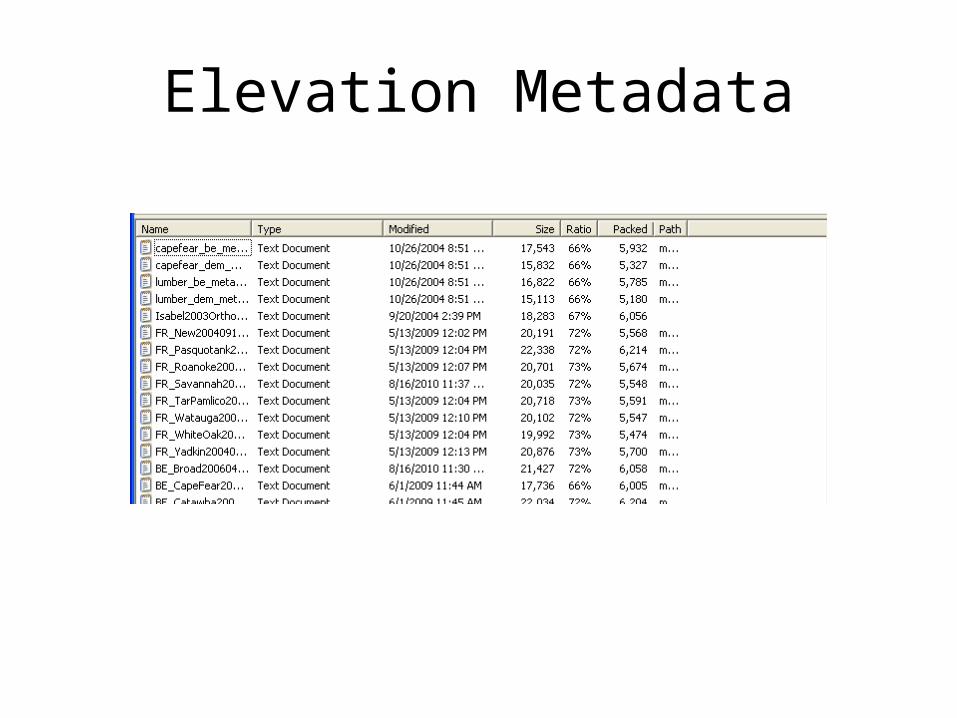
Elevation Metadata
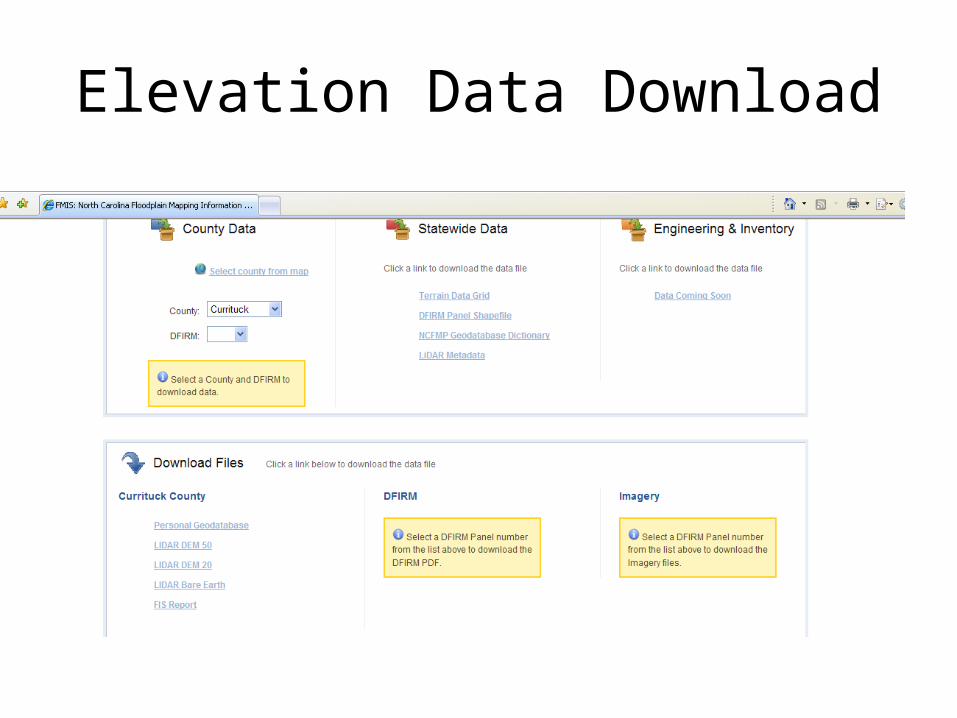
Elevation Data Download
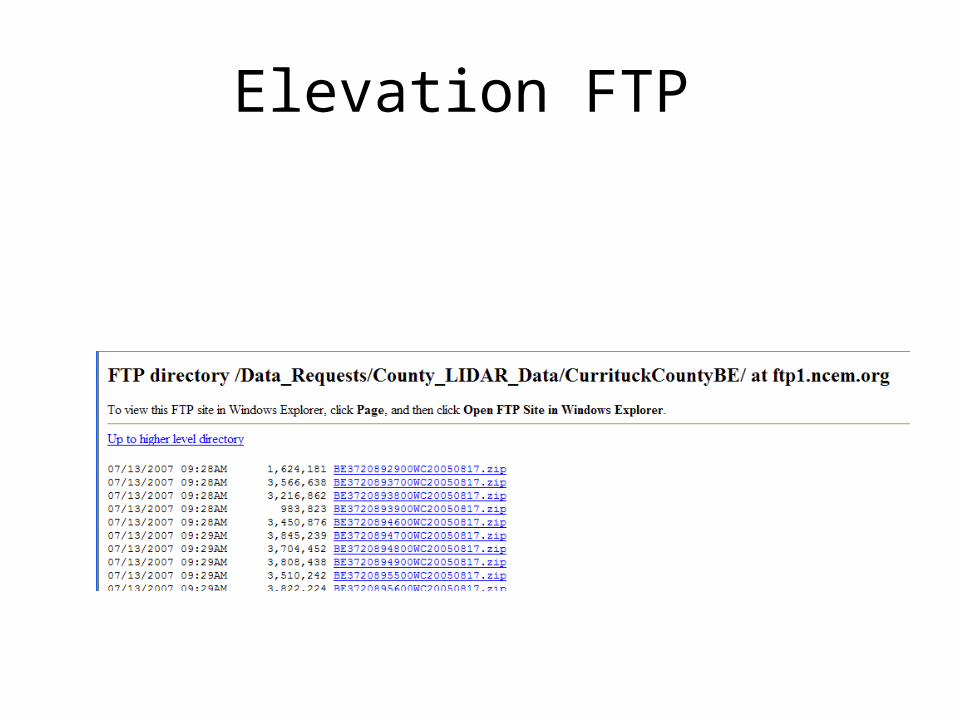
Elevation FTP
Suggestions for Success
• Business Plan• Political Champion, State and Congress• Applied Outcomes – tie the product into high
profile meaningful business processes• Build on stakeholder needs, cumulative benefits• Community engagement• Outreach (example: LiDAR symposium)• Advocacy from the outside
Suggestions for Success
• Jobs, including an eye to unintended outcomes• Public Safety• Long Term Cost Considerations of FHL and Good Planning and Budgeting with Good Data – Equitable and accurate approach and consequences of poor planning• Technology