NBER WORKING PAPER SERIES THE … · 2001-10-24 · TECHNOLOGY TRANSFER: COMPARING CITATIONS AND...
40
NBER WORKING PAPER SERIES THE GEOGRAPHIC REACH OF MARKET AND NON-MARKET CHANNELS OF TECHNOLOGY TRANSFER: COMPARING CITATIONS AND LICENSES OF UNIVERSITY PATENTS David C. Mowery Arvids A. Ziedonis Working Paper 8568 http://www.nber.org/papers/w8568 NATIONAL BUREAU OF ECONOMIC RESEARCH 1050 Massachusetts Avenue Cambridge, MA 02138 October 2001 Authors listed in alphabetical order. This paper builds on earlier research by Michael Barnes, David Mowery, and Arvids Ziedonis. Research support was generously provided by the Alfred P. Sloan Foundation, the Andrew Mellon Foundation, the California Policy Seminar, the U.S. Air Force Office of Scientific Research, and the Mack Center for Technological Innovation at the Wharton School of the University of Pennsylvania. We are indebted to Dr. Suzanne Quick and Lynn Fissell of the University of California Office of Technology Transfer, Michael Barnes of the University of California Office of the President, and Sandra Bradford of the Stanford University Office of Technology Licensing for generous access to data at their respective universities. We also thank Bhaven Sampat for data from Columbia University. Bronwyn Hall, Richard Nelson, Bhaven Sampat, Scott Stern, Rosemarie Ziedonis, and seminar participants at UC Berkeley, University of Pennsylvania, the University of Maryland, the University of Reading, and the Federal Reserve Bank of Philadelphia gave us many helpful comments. The views expressed herein are those of the authors and not necessarily those of the National Bureau of Economic Research. © 2001 by David C. Mowery and Arvids A. Ziedonis. All rights reserved. Short sections of text, not to exceed two paragraphs, may be quoted without explicit permission provided that full credit, including © notice, is given to the source.
Transcript of NBER WORKING PAPER SERIES THE … · 2001-10-24 · TECHNOLOGY TRANSFER: COMPARING CITATIONS AND...

NBER WORKING PAPER SERIES
THE GEOGRAPHIC REACH OF MARKET AND NON-MARKET CHANNELS OFTECHNOLOGY TRANSFER: COMPARING CITATIONS AND LICENSES OF
UNIVERSITY PATENTS
David C. MoweryArvids A. Ziedonis
Working Paper 8568http://www.nber.org/papers/w8568
NATIONAL BUREAU OF ECONOMIC RESEARCH1050 Massachusetts Avenue
Cambridge, MA 02138October 2001
Authors listed in alphabetical order. This paper builds on earlier research by Michael Barnes, David Mowery, and ArvidsZiedonis. Research support was generously provided by the Alfred P. Sloan Foundation, the Andrew Mellon Foundation,the California Policy Seminar, the U.S. Air Force Office of Scientific Research, and the Mack Center for TechnologicalInnovation at the Wharton School of the University of Pennsylvania. We are indebted to Dr. Suzanne Quick and LynnFissell of the University of California Office of Technology Transfer, Michael Barnes of the University of CaliforniaOffice of the President, and Sandra Bradford of the Stanford University Office of Technology Licensing for generousaccess to data at their respective universities. We also thank Bhaven Sampat for data from Columbia University.Bronwyn Hall, Richard Nelson, Bhaven Sampat, Scott Stern, Rosemarie Ziedonis, and seminar participants at UCBerkeley, University of Pennsylvania, the University of Maryland, the University of Reading, and the Federal ReserveBank of Philadelphia gave us many helpful comments. The views expressed herein are those of the authors and notnecessarily those of the National Bureau of Economic Research.
© 2001 by David C. Mowery and Arvids A. Ziedonis. All rights reserved. Short sections of text, not to exceed twoparagraphs, may be quoted without explicit permission provided that full credit, including © notice, is given to thesource.

The Geographic Reach of Market and Non-Market Channels of Technology Transfer:Comparing Citations and Licenses of University PatentsDavid C. Mowery and Arvids A. ZiedonisNBER Working Paper No. 8568October 2001JEL No. O31, O32, R12
ABSTRACT
The growth of high-technology clusters in the United States suggests the presence of strong
regional agglomeration effects that reflect proximity to universities or other research institutions. Using
data on licensed patents from the University of California, Stanford University, and Columbia University,
this paper compares the geographic “reach” of knowledge flows from university inventions through two
important channels: non-market “spillovers” exemplified by patent citations and market contracts
(licenses). We find that knowledge flows through market transactions to be more geographically
localized than those operating through non-market “spillovers.” Moreover, the differential effects of
distance on licenses and citations are most pronounced for exclusively licensed university patents. We
interpret these findings as reflecting the incomplete nature of licensing contracts and the need for licensees
to maintain access to inventor know-how for many university inventions. Such access appears to be less
important for inventions that are non-exclusively licensed (e.g. “research tools”).
David C. Mowery Arvids A. ZiedonisHaas School of Business The Wharton SchoolUniversity of California, Berkeley University of Pennsylvaniaand NBER 2000 Steinberg Hall - Dietrich Hall
University of PennsylvaniaPhiladelphia, PA 19104-6370Email: [email protected]

2
1. Introduction
A substantial body of recent research has examined the contributions of university
research to regional economic development and technological innovation (Jaffe 1989; Jaffe,
Trajtenberg, and Henderson 1993; Acs, Audretsch, and Feldman 1992, 1994; Audretsch and
Stephan 1996; Zucker, Darby, and Armstrong 1998; Agrawal 2000; Adams 2001). Interest in
this topic has been sparked by the extensive historical and anecdotal evidence of links between
U.S. university research and the growth of high-technology industries such as semiconductors,
computer software, and biotechnology. The growth of these high-technology clusters in the
United States suggests the presence of strong regional agglomeration effects that reflect
proximity to universities or other research institutions. Accordingly, much of the literature on
the economic contributions of university research has focused on the extent to which these
contributions are localized.
This literature suggests that the channels through which university-based research affects
regional economic or innovative activity may be divided into two broad categories: knowledge
“spillovers” (i.e., positive externalities from university research that affect the performance of
nearby firms) and “market-based” channels such as technology licensing or various types of
employment relationships between academic scientists and firms. Most of this empirical
research suggests that the economic or innovative contributions of university-based research tend
to be geographically concentrated, but little or no empirical research has yet compared the
geographic “incidence” of these market and nonmarket channels of interaction. This paper
undertakes such an analysis, comparing the localization of outflows of university-based research
through citations to university patents and through licenses that involve these same patents.
We conduct this analysis at the regional rather than the state level, disaggregate among
broad technological areas, and control for inter-regional differences in industrial composition and

3
population. Our empirical analysis contains important limitations. The data are drawn from a
small set of research universities that may not be representative of all U.S. universities. In
addition, our comparative analysis of knowledge flows in patent citations and licensing
agreements excludes other potential channels of interaction. Nevertheless, the opportunity to
consider multiple avenues of technology transfer for the same set of inventions allows us to
address questions that thus far have been overlooked in the literature.
A finding that the geographic “reach” of knowledge spillovers differs from those of
market-based channels has significant implications for industrial managers and university
administrators. Managerial decisions on the location of R&D and other knowledge-intensive
activities often are influenced by beliefs about the characteristics of the channels through which
academic knowledge is transferred to industrial practice. And for university administrators,
especially those in public universities, the renewed concern of federal and state policymakers
with the level of economic returns from university-based research is matched only by these
policymakers’ concerns with the national and regional distribution of these returns.
Immediately below, we consider the reasons for the observed localization of the effects of
university research and discuss some of the prior literature on geographic localization. This
section is followed by an explanation of our data sources and methodology. Section 4 presents
and discusses our empirical findings, and Section 5 concludes the paper.
2. Why Are the Effects of University Research Localized?
The extensive literature on technology management and the economics of innovation
argues that virtually all technologies contain important “tacit” elements such as aspects of know-
how, performance, operations, etc., that cannot be easily codified in a blueprint, a published
article, or a contractual document. Oral communication of tacit knowledge over long distances

4
may be ineffective or infeasible. As a result, technology transfer is frequently described as a
“contact sport,” in which the transfer or exchange of personnel is essential. The limited
geographic reach of such channels for the exchange of information and know-how is widely
cited as one of the leading causes of regional agglomeration economies. Marshall (1896) pointed
out in his celebrated discussion of this topic that in such areas, “the mysteries of the industry are
in the air,” and therefore presumably more accessible to local participants or would-be entrants.
Despite the enormous outpouring of literature on “industrial districts” and regional high-
technology complexes such as Silicon Valley in Northern California or Route 128 in
Massachusetts, the mechanisms that create and sustain these regional concentrations are not well
understood. Knowledge “spillovers,” which are widely believed to be important to these
localized economic and innovative effects, are defined by economists to be “externalities,” for
which the source of the spillover is not fully compensated. For example, technical knowledge
acquired through the trade press or by participation in industry conferences constitutes a
knowledge spillover. In other words, pure knowledge “spillovers” operate through non-market
mechanisms. But many other channels for technology transfer that sustain regional
concentrations of industry are market-based. For example, the extensive regional high-
technology infrastructures in the Boston or San Francisco areas of lawyers, venture capitalists,
consultants, equipment suppliers, and the like all operate within markets for labor, services, and
information. At the same time, however, contracts for new or complex technologies frequently
are incomplete, markets for such technologies are often thin and subject to “small-numbers”
problems, and contracts rarely can codify all knowledge necessary for the exploitation of the
technology (Arrow 1962, Williamson 1975, Mowery 1983). There are strong reasons to suspect

5
that these and other factors limit the geographic reach of market mechanisms for the transfer of
relatively new technologies.
The literature on universities’ regional economic effects also reaches a mixed verdict on
the relative importance of market and non-market-based channels in the realization of these
effects. Jaffe, Trajtenberg and Henderson (1993) examine the extent to which “spillovers” of
university-based research are locally concentrated using citations to university patents to
measure spillovers. These scholars measure the localization of these spillovers by examining the
relative proportions of university patents and a “control sample” of patents from the same years
and technology classes that are cited by inventors in the same state and in the same “standard
metropolitan statistical area” (SMSA).1 They find significant localization effects; inventors of
patents that cite university patents are more likely to be in the same state or SMSA than are
inventors that cite patents from their control sample.
No attempt is made to compare the strength of localization effects by technological area,
although Jaffe, Trajtenberg, and Henderson do note that these localization effects are similar for
patent citations that span patent classes and those within patent classes. Although their analysis
excludes self-citations, their data do not enable Jaffe, Trajtenberg, and Henderson to control for
the potential existence of market relationships (e.g., licenses) between firms citing university
patents and the universities or inventors whose patents are cited. To the extent that these market
relationships exist, these scholars’ findings of localization may reflect the operation of market
and non-market channels of knowledge transfer, rather than a pure knowledge spillover.
Indeed, recent research by Lynne Zucker and Michael Darby and their co-authors
(Zucker, Darby, and Armstrong 1998; and Zucker, Darby, and Brewer 1999) suggests that a

6
significant fraction of knowledge transfer between universities and biotechnology firms can be
attributed to market-mediated interactions between a relatively small number of “star”
university-based scientists and biotechnology firms.2 Rather than spillovers, Zucker and
colleagues argue that knowledge flows from universities to industry through these “star”
academic scientists’ industrial roles as principals, consultants, employees, or members of
scientific advisory boards. Their analysis shows that co-authorship between industry scientists
and academic “stars” has a significant and positive effect on the number of new products being
developed by biotechnology firms. Related (less robust) results suggest that knowledge transfer
between university scientists and firms is enhanced further by contractual affiliations between
the scientists and the firms in the sample. These results suggest that the geographic “knowledge
networks” that link academic researchers and industrial innovators operate largely through
market channels.
Zucker and Darby’s results contrast with those of Audretsch and Stephan (1996), who
examined interactions between university-based scientists and firms based on disclosures in
biotechnology firms’ initial public offering (IPO) documents about academic researchers’ roles
in the firms. Audretsch and Stephan find that “approximately 70 percent of the links between
biotechnology companies and university-based scientists are non-local” (p. 649), and conclude
that “While proximity matters in establishing formal ties between university-based scientists and
companies, the influence is anything but overwhelming” (p. 650). The Audretsch-Stephan
results introduce yet another interpretation of the channels of interaction between universities
1 The “control sample” of patents provides a means of controlling for regional variations in industry composition, since the citation of patents in the same year and technology class as those from local universities is (other things equal) likely to reflect local industrial concentration. 2 Zucker, Darby, Armstrong, and Brewer define “star” scientists as those active researchers at the “leading edge” of basic science research. In biotechnology, they identified 327 scientists worldwide who reported

7
and industry. Like Zucker and Darby, Audretsch and Stephan argue that university-industry
knowledge interactions operate primarily through market channels. But Audretsch and Stephan
find that proximity is not essential to the operation of these market channels:
“…geographic proximity matters when knowledge spillovers are informal. But an important conclusion of this paper is that when knowledge is transmitted through formal ties between researchers and firms, geographic proximity is not necessary, since face to face contact does not occur by chance but instead is carefully planned.” (p. 651)
Agrawal (2000) examines the role of geography in university-industry interaction for a
sample of 124 electrical, mechanical, and software technologies licensed from the Massachusetts
Institute of Technology (MIT). Although geographic proximity is positively associated with the
likelihood and extent of product commercial success (measured by probability of product
introduction and level of licensing royalties) for these technologies, this significant effect
vanishes when Agrawal controls for the intensity of university researchers’ involvement with the
licensee.3 Although it is apparent from the analysis that for many university-invented
technologies, which are often at an early stage of development, inventor interaction is important,
geographic localization effects may still be important. The sample in the Agrawal study is
selected from licensed technologies only, and these technologies may be licensed by nearby
at least 40 genetic sequencing discoveries in the Genebank database or published a minimum of 20 genetic sequencing discoveries. 3 Zucker, Darby, and Armstrong, and Brewer operationalized firm-scientist interaction as article co-authorship and Audretch and Stephan categorized scientist roles from information in IPO documents. Agrawal measures the intensity of interaction between university researchers and licensees as the number of hours that university researchers devote to direct collaboration with the licensee firm to solve technical and development problems after the invention is licensed from MIT, but before revenues are generated. Interestingly, although the licensing agreement represents a market-based instrument for interaction, interaction between the firm and university researchers may or may not be governed by contractual agreements. For example, some MIT faculty may maintain consulting, employment, or founding relationships with the firms in Agrawal’s sample of licensees. Likewise, involvement by graduate student researchers with licensee firms may occur through employment or thesis research. Nevertheless, it is clear from the analysis that collaboration with MIT researchers aided the commercial success of licensees, no matter how these collaborations were organized.

8
firms because of the ability to interact with university researchers that geographic proximity may
afford.4
Taken together, the findings of these four studies suggest that geographic proximity to
university research is important not only for non-market spillovers, but also for market channels
of interaction and knowledge exchange.5 But none of these studies directly compares
localization of market and non-market channels of technology transfer for the same set of
inventions. That issue is the focus of our empirical investigation.
3. Data and Methods
The primary sources of data for our empirical analysis are the technology transfer offices
at Columbia University, the University of California, and Stanford University. According to a
recent licensing survey by the Association of University Technology Managers’ (AUTM 2000),
these three universities were among the top five recipients of gross licensing income from patent
licenses among U.S. universities in fiscal year 1999 ($96 million, $81 million, and $40 million,
respectively). The University of California has been a licensor of faculty-invented technology
since at least the 1950s, while Stanford established its Office of Technology Licensing (OTL) in
1970. Columbia established its technology transfer office in 1981, shortly after passage of the
Bayh-Dole Act, which simplified the process by which universities could retain and license
intellectual property resulting from federally funded research. Our sample includes inventions
from the Stanford and Columbia campuses, plus all nine University of California campuses
4 In a survey of sixty-two university technology transfer offices, Jensen and Thursby (2001) found that 48% of licensed technologies were at only the “proof of concept” stage of development, and that for an additional 29% only a lab-scale prototype existed at time of licensing. These findings suggest that many licensed university technologies are characterized by substantial uncertainty and require sizeable development efforts. In light of these characteristics of the university inventions, it is not surprising that personal interaction between researcher and firm often is necessary for commercial success.

9
(Berkeley, Davis, Irvine, Los Angeles, Riverside, San Diego, San Francisco, Santa Barbara, and
Santa Cruz), or eleven inventing locations in all.
Internal records at these three university technology transfer offices contain a wealth of
information on the inventions of faculty, students, and research staff. University policies require
that researchers “disclose” new inventions through a formal invention disclosure document.
“Invention disclosures” from these universities enable one to trace (1) whether a patent
application was filed in the U.S. and other industrial economies; (2) whether a patent was issued
for the invention; (3) whether the patent was licensed to private firms, the general terms (e.g.,
exclusive or nonexclusive) of the license, and the identity and location of the licensee; and (4)
the amount if any of license fees and royalties for each license. The University of California data
cover more than 10,000 invention reports dating back to the 1950s, the Columbia University data
contain information on 1,600 inventions disclosed since 1981, and the Stanford University data
contain over 3,000 invention disclosures.
Our analysis compares the extent of localization of two channels through which
university inventions may affect innovative firms or individuals: (1) a non-market channel
represented by citations to university patents in the patent applications filed by these firms or
individuals, and (2) a market channel represented by licensing agreements of various types.
Locational information associated with each of these channels enables us to identify the extent of
localization of each channel for technology outflow.
Much previous work on the regional effects of academic research has employed a variant
of the “knowledge production function” developed by Griliches (1979). In Jaffe, Trajtenberg,
and Henderson (1993), patterns of localization are analyzed for a sample of academic patents and
5 Recent studies of federal research labs (Jaffe, Fogarty, and Banks 1998) and the semiconductor industry (Podolny and Shepard 1996 and Almeida and Kogut 1999) suggest that non-market spillovers are

10
a “control population” of non-cited patents of similar vintage and industrial classification. This
general procedure is less well-suited to the concerns of this paper, however, which seeks to
compare the regional patterns of citations to academic patents with the regional distribution of
licenses for these patents. A “control population” of patents can be constructed, but there is no
obvious “control population” for licenses. Instead, we use the Census Bureau’s Metropolitan
Statistical Area data to formulate two dependent variables: (1) the number of patents from a
given campus that are linked to that geographic region through citations to those patents, and (2)
the number of licenses to entities in that region from that campus for patented inventions. We
base these dependent variables on patents issued during 1975-88; for each patent, we include
only citations or licenses during the 8 years following the patent’s issue.
We separately analyze patents that are licensed exclusively and nonexclusively. We also
disaggregate our analysis by technological “area,” producing a campus-technology-region
“triple” as our unit of analysis. Our dependent variables represent the “intensity” of licensing or
citing activity to campus i’s patents in technology area j (defined below), accounted for by
geographic region k (defined below).
Patent citations have been used in previous studies as measures of technological
knowledge “spillovers,” i.e., the use of knowledge by an inventor of the work of a previous
inventor where no contractual agreement is necessary and where in many cases no compensation
is paid. When the U.S. Patent and Trademark Office grants a patent, the granting officer
includes a list of all previous patents on which the granted patent is based. This list is made
public as part of the publication of the patent at the time it issues. The patent officer is aided in
compiling a list of previous patents by the patent applicant, who is legally bound to provide with
geographically mediated in these settings as well.

11
the application a list of all patents that constitute relevant “prior art.”6 Citations of prior patents
thus serve as an indicator of the technological lineage of new patents, much as bibliographic
citations indicate the intellectual lineage of academic research.
Our use of licenses and patent citations as indicators of market and non-market
technology transfer introduces an interesting measurement issue. A license clearly signifies a
market transaction between licensor and licensee, but a patent citation may not indicate a
knowledge spillover. For example, a patent attorney or patent examiner at the USPTO may add
citations during the patent application process. If the inventor were not aware of such prior art,
these citations would overstate the level of non-market knowledge spillover. Jaffe, Fogarty, and
Banks (1998) found that up to one-third of all citations to patents issued to a sample of patents
assigned to the National Aeronautics and Space Administration appeared not to represent
knowledge spillovers. Similarly, a survey of patent holders by Jaffe, Trajtenberg, and Fogarty
(2000) suggests that up to one-half of all citations may not constitute spillovers. Nevertheless,
the authors of these two studies conclude that patent citations, while “noisy,” are valid measures
of knowledge spillovers.7
Citations to patents typically peak in applications filed 4–5 years after the date of issue of
the cited patent. As a result, data on citations to patents issued during 1975–96 will be “right-
truncated,” i.e., more recent patents will be underrepresented in the citations data. For this
reason, we examined citations to patents issued during 1975–1988 (for these three universities, a
total of 840 patents), and for each year’s cohort of patents, analyzed only citations made in
6 In addition to the legal requirement, it is in the applicant's interest to be forthcoming in this list because a more complete description of prior art is likely to reduce the prospects of an interference being declared during processing of a patent application. 7 To the extent that the likelihood that a citation does not represent a non-market spillover is related to the distance between the inventors of the citing and cited patents, our citation equation results could be

12
applications appearing during the 8 years following that year. Since our geographic analysis is
limited to the United States, we exclude citations made by patents that list only inventors in non-
US locations. In order to make our patent citation and licensing samples as comparable as
possible, we also exclude citations by those entities that are not likely to be licensees:
universities, non-profit foundations, non-profit hospitals, and governmental agencies (although
we include citations by patents jointly assigned to a university or governmental agency and a
private firm or individual).8 Similarly, we exclude patents that are not cited by another US
patent and licensed in the US. Table 1 presents the total numbers of patents, licenses, and
citations generated by the Columbia, Stanford, and California samples, and the number of
patents, licenses, and citations that remain after these exclusions.
*** Table 1 Here ***
Geographic Regions and Distance: We employ the Metropolitan Statistical Areas (MSAs) used
by the U.S. Bureau of the Census to define economically distinct geographic regions in the
United States. MSAs are defined to be an “integrated economic and social unit with a large
population nucleus.” MSAs with a population of at least 1 million are disaggregated into sub-
units called Primary Metropolitan Statistical Areas (PMSA). PMSAs in these regions combine
to form a Consolidated Metropolitan Statistical Area (CMSA).9 In 1999, the Census Bureau
biased. But Jaffe, Fogarty, and Banks (1998) and Jaffe, Trajtenberg, and Fogarty (2000) find no evidence of such bias in their analyses of citations and spillovers. 8 We include citations to university patents made by three “foundations:” The Battelle Institute, The Gas Research Institute, and the Electric Power Research Institute. These three foundations, while nominally non-profit, have large industrial clienteles and therefore could conceivably represent potential licensees. 9 For example, the San Francisco CMSA is composed of seven PMSAs: San Francisco and San Mateo Counties, Santa Clara County, Santa Cruz County, Alameda and Contra Costa Counties, Marin County, Solano and Napa Counties, and Sonoma County. In contrast, the San Diego region constitutes one MSA. Four of our eleven campuses are located within the San Francisco CMSA (University of California campuses at Berkeley, San Francisco, and Santa Cruz, and Stanford University). One of our campuses is located within the San Diego MSA (University of California at San Diego).

13
defined 18 CMSAs and 258 MSAs in the United States. In this paper we consider only CMSAs
and MSAs, and restrict our analysis to the largest fifty regions, based on “manufacturing value-
added” attributed to each region in the 1987 Economic Census. Table 2 lists these geographic
areas, their share of total US manufacturing value-added, and their shares of sample licenses and
patent citations.
*** Table 2 Here ***
We obtained the zipcodes for each university campus and for the central business district
for the largest city of each of the fifty metropolitan regions in our analysis. For each of the
campusi-CMSA/MSAk pairs in our analysis, we computed distance as the number of miles
between their respective zipcodes, ,i kDIST . We also included a variable for the square of
distance, ,i kDISTSQ in order to capture non-linearity in the distance relationship to licensing or
citing activity. In cases where multiple inventors were listed in the citing patent, we used the
city and state location of the first listed inventor.10 We also include a variable, ,i kSAMEREG ,
that equals 1 if the campus is located in the citing or licensing CMSA/MSA.
Industry Location and Population: We control for the regional composition of industrial activity
by Standard Industrial Classification (SIC) in each region in order to avoid confounding pure
“distance” effects with those resulting from high concentrations of potential user firms in
different industries. Using data from the US Census Bureau’s 1987 Census of Manufactures, we
10 In cases where both foreign and U.S. inventors were listed, we use the location of the first listed U.S. inventor.

14
compute the “manufacturing value added” reported in the two digit SIC a that “owns” three digit
SIC j in CMSA/MSA k, as a share of US manufacturing value added in the two digit SIC:11
( - )| ,| , ( - )|
1987 Manufacturing Value Addeda j kVALADDa j k 1987 US Manufacturing Value Addeda j= (1)
Note that we are not assuming that the location of industry is exogenous with respect to
the location of Columbia, Stanford, or the University of California campuses. Instead, we
assume only that there is no difference in the locational “pull” exerted by these campuses for
firms seeking to exploit university inventions through citing their patents and those seeking to
exploit university inventions through licensing these patents.
To further control for the substantial differences among our regions in size and economic
“pull,” we also include the log of the population count for each CMSA/MSAk from the 1990
census, kLNPOP .
Technology Classification: Patents are classified by the US Patent and Trademark Office into
“fields of invention” at the time of issue. Unfortunately, the USPTO fields of invention are not
compatible with the structure of the SIC system. We therefore employ a concordance developed
by Silverman (1996) to aggregate the sample patents into 3-digit Standard Industrial
Classifications (SICs), and report results for the 25 three-digit SICs accounting for the majority
of patents in our sample.12 This concordance produces non-integer “counts” of licenses and
citations generated by each SICj-CMSA/MSAk pair, and we use these counts as the dependent
variables in our analysis.
11 The US Census Bureau does not consistently report CMSA/MSA level data on manufacturing value added at the 3-digit SIC level, because such disclosure would make it possible to identify firm-specific output in some regions. 12 For a patent assigned by the USPTO to a particular international patent class (IPC), the Silverman concordance calculates the likelihood that this patent would be employed in a particular “SIC of use” and

15
Other Controls: Differences in the importance of patents as a means for appropriating the returns
to invention in different technology fields affect the probability that inventors are scanning
patented “prior art” assiduously and influence the importance of formal licensing agreements for
the exploitation of university inventions. Where patent protection is of great importance, patent
citations are likely to be a more reliable guide to intellectual antecedents of patented invention
and licensing agreements are likely to be economically significant. We utilize data from the
original Yale Survey of Technological Opportunity and Appropriability (Levin, Klevorick,
Nelson, and Winter 1987), which represents the assessment by senior industrial R&D managers
(circa 1983) of the importance of formal instruments of intellectual property protection for
capturing the returns to industrial innovation in their 3-digit SIC. Several questions in the survey
address the issue of the ability of patents to enable the innovator to appropriate the returns to
innovation. Our measure of the importance of formal patent protection uses the mean scores on
a 7-point Likert scale for responses to the following question (I.B.1): “In this line of business,
how effective are patents in preventing competitors from duplicating an improved product?”
Survey responses are reported at the 4-digit SIC level. Since our analysis is at the 3-digit SIC
level, we aggregate the responses for each 4-digit SIC sub-level to its “parent” 3-digit level,
weighting each 4-digit mean response by its corresponding manufacturing value-added from the
1987 Census of Manufactures.
We also include indicator variables for the top five SICs that account for the bulk of our
licensing activity: SIC 283 (drugs), 382 (measuring and controlling devices), 367 (electronic
components), 366 (communications equipment), and 384 (medical instruments). Finally, we
assigns “weights” to each SIC equal to its likelihood. For a detailed description of the construction and validity of this concordance, see Silverman 1996.

16
include indicator variables identifying Stanford patents and Columbia patents (with UC patents
as the left-out category).
Table 3 summarizes the definitions and notation for our variables.
*** Table 3 Here ***
Our university patents are contained in 9 2-digit SICs: 23 (textiles), 28 (chemical
products), 30 (rubber), 32 (stone, clay, and glass products), 34 (fabricated metal products), 35
(non-electrical industrial equipment), 36 (electrical and electronic equipment), 38 (scientific and
measurement instruments), and 39 (miscellaneous manufacturing industries). Our CMSA/MSA
sample accounts for 59% of total US manufacturing value-added, 81% of all citations within 8
years of our sample patents, and 93% of all licenses within 8 years (Table 2).
The potential number of observations in each of our specifications equals the number of
campuses (11) times the number of selected SICs (25) times the number of selected
CMSA/MSAs (50), yielding a possible 13,750 “observations.” But this maximum is reduced by
several factors. First, although the University of California campuses of Santa Barbara and Santa
Cruz have patents that are licensed and cited during the 1975-96 time period, none of these
campuses’ patents are cited by industrial firms, nor are they licensed by industrial firms on an
exclusive or non-exclusive basis. We therefore exclude these campuses from the analysis. The
UC Riverside campus reports no exclusively licensed patents that are cited, and the UC Irvine
campus data contain no non-exclusively licensed patents that are cited; these campuses also were
excluded from the appropriate regressions.
Second, our data on the importance of patents as a means of capturing the returns from
innovation do not cover three of the SICs included in this study (SICs 239, 307, and 385). Since
jPATIMP could not be calculated for these three SICs, they were dropped from the sample.

17
The structure of the resulting cross-sectional dataset consists of 9,900 observations for
our analyses of overall licensing and citing activity and 8,800 observations when we
disaggregate our sample into citations and licensing agreements for exclusively and non-
exclusively licensed patents (due to the exclusion of UC Riverside and UC Irvine, respectively).
Table 4 displays the descriptive statistics for the primary independent variables for the
overall patent sample, the subset of exclusively licensed patents, and the subset of
nonexclusively licensed patents.
*** Table 4 Here ***
Our empirical strategy is to conduct separate regressions for licensing and citing activity
and compare the magnitude and direction of the corresponding coefficients in those equations.
The regression specifications for licenses and citations accordingly contain the same set of
observations, corresponding to the number of campuses, regions, and industries in the sample.
The independent variables in each of these equations are also identical. The dependent variables
measure licensing or citing activity and are described more fully in Table 3. We construct
similar variables for the exclusively licensed and non-exclusively licensed patent sub-samples.
The analysis is complicated by several factors. First, we are unable to observe much of
the substantial heterogeneity among regions and among industries located within each region.
For example, transportation costs between regions and campuses may depend on the location of
airline hubs (a factor that affects flight schedules and travel time) and airfares between cities.
The presence of venture capital that could facilitate the commercialization of university
technology varies by region. The presence of other research universities from which a firm may
license or cite patents also varies by region, and is unrelated to distance from our campuses.
Moreover, different types of industrial facilities (e.g., manufacturing plants, design centers, and

18
headquarters offices) may be concentrated in different regions. In order to account for our
ignorance of many of these differences, we use random-effects regression equations with SICj-
CMSA/MSAk (industry-region) specific effects. We also control for the left truncation at zero of
our dependent variables by using a tobit formulation of the random-effects model.13 A
representative model is defined below:
'ijk ijk ijky Xα β ε= + + if 0ijk ijkXβ ε+ > (2a)
0ijky = otherwise (2b)
ijk i jk jku v wε = + + (2c)
where jky is the level of citing or licensing activity represented by each SICj-CMSA/MSAk pair,
α is the y-intercept, ' ijkXβ are the coefficients and independent variable vectors, and ijkε is the
residual. ijkε is further decomposed into a cross sectional error component, iu , jkv , (a residual
specific to each SICj-CMSA/MSAk pair), and a combined error component, jkw . Each of these
error components is assumed to be normally distributed around a mean of zero. We further
assume that individual error components are uncorrelated with each other and are not correlated
with the independent variables. More specifically, we assume that SICj-CMSA/MSAk pair
residuals, jkv , are uncorrelated with our independent variables that measure distance, population,
and industrial activity.15
13 We are unable to use Poisson or negative-binomial “count” data models because our derived “counts” of licenses and citations are not uniformly integers. 14 Our “share” dependent variables are also theoretically right truncated at one by construction. However, inspection of the data in Table 2 shows that no individual SICj-CMSA/MSAk pair generates all of the licensing or citing activity in our sample, so we do not observe right truncation. Therefore, since incorporating right truncation into the model would not affect our results, we account for left truncation only. 15 Although a “fixed-effects” model does not make this assumption, the left truncation of the dependent variable produces biased estimates. Another alternative would be to employ a two-stage Heckman

19
We first report the results of regressions for all licensed and cited patents in our sample,
then separately report results for licenses covering exclusively and nonexclusively licensed
patents and the citations to the patents associated with each type of agreement. We compare the
results of specifications for the geographic distribution of citations to patents that are licensed
exclusively with those for the geographic distribution of the licensees signing exclusive licensing
agreements, and compare citations to patents that are licensed on a nonexclusive basis with the
geographic distribution of nonexclusive licensees. Separating licensed patents by type enables
us to analyze the effects of distance on several different forms of market transactions and
compare these with the effects of distance on “spillovers” associated with a reasonably
comparable set of inventions.
The licensing and citation specifications measure the impact of geographic localization
on different dependent variables. Therefore, we cannot directly compare coefficients between
these two sets of regressions. Instead, we convert our coefficient estimates to “standardized” or
“beta” coefficients and use these coefficients as a basis for comparison.16 A representative
standardized coefficient and its standard error are shown below:
*ˆ ˆxx x
y
ss
β β= (3)
selection model. The selection equation requires that we specify independent variables that affect the probability that we would observe licensing or citing activity, but not the level of licensing activity estimated in the regression equation (conditional on a non-zero observation). We do not use the Heckman model because we lack a theory that would suggest such variables. Instead, we assume that our independent variables affect both the incidence and the level of licensing or citing activity. (In this case, the Heckman model reduces to a tobit specification (Heckman 1979).) 16 A standardized coefficient is generated by multiplying the coefficient estimate for a regressor X by its standard deviation and dividing by the standard deviation of the dependent variable Y. Since the original coefficient is a slope, multiplying by the ratio of the standard deviations removes both the units of Y and X. Such a variable can thus be interpreted as measuring the effect (in standard deviations) on the dependent variable by a one standard deviation change in the value of the independent variable, enabling direct comparison of the influence of different independent variables on a dependent variable.

20
* ˆˆxx
x
y
ss ss ββ = (4)
Since standardized coefficients are normalized and free of scale, we can use these
coefficients to compare the relative influence of corresponding independent variables in the
licensing and citation equations on their respective dependent variables (number of licenses or
citations). Thus, we can compare the influence of the same independent variable on different
channels of technology transfer. To determine whether these effects are significantly different,
we test the null hypothesis that the licensing and citation standardized coefficients are equal:
* *ˆ ˆ: 0o xL xCH β β− = (5)
* *ˆ ˆ: 0A xL xCH β β− ≠ (6)
using the following derived test statistic:17
* *
* * * *
ˆ ˆ
ˆ ˆ ˆ ˆ( ) ( ) 2 ( , )xL xC
xL xC xL xC
ZVAR VAR COV
β ββ β β β
−=+ + ×
(7)
and conducting a two-tailed test assuming that * *ˆ ˆxL xCβ β− is distributed normally.
4. Results and Discussion
A comparison of the numbers of patent citations and license agreements accounted for by
leading CMSA/MSAs (Table 2) suggests that the market-mediated licensing agreements are
17 The denominator in equation (6) is the standard deviation (square root of the variance) of the combined licensing and citation standardized coefficients in the random effects models and can be expressed in terms of the underlying coefficients using the basic definition of the variance of two jointly distributed
variables:
22
ˆ ˆ ˆ ˆ( ) ( ) 2 ( , )S SS SxL xC xL xCVAR VAR COVxL xLxC xCS S S SyL yLyC yC
β β β β+ + × × ×
. ( SxL , SxC ,
S yL , and S yL are conditional on the sample and are assumed to be constants in this calculation.) The
covariance term accounts for the correlation between corresponding variables in these equations. We

21
somewhat more “localized” than the knowledge spillovers captured through patent citations.
Column 3 in Table 2, corresponding to the number of citations among regions to our sample of
patents, shows that almost all of the 50 leading regions are home to citers of our university
patents (the lone exception being the Lancaster, PA MSA). Column 6 reports the incidence of
licensing among the top 50 regions and indicates that licensing activity is more concentrated –
only 27 of the 50 regions are locations of licensees of the patents in our sample, and these
regions tend to be those with the largest manufacturing value-added.
These regional statistics nonetheless mask considerable inter-industry variation.
Moreover, the aggregate data for both patent citations and license agreements display a strong
“bicoastal” pattern: New York, Boston, San Francisco, and Los Angeles account for significant
shares of both citations and license agreements, while Chicago, Houston, Minneapolis, and other
large metropolitan areas distant from the coasts account for much smaller numbers of licenses
and citations. This pattern of exploitation of inventions from our three universities complicates a
simple “distance-decay” interpretation of university economic effects. We expect the “distance
squared” variable, ,i kDISTSQ , in our regression equations to account for the bi-coastal patterns
present in the data.
Table 5 contains the results of our random-effects tobit analysis of the entire sample of
university patents, Tables 6 and 7 respectively contain results for exclusively licensed and non-
exclusively licensed patent sub-samples. In each table, the first four models consider the effects
of the independent variables on the number of licenses accounted for by each observation, and
the last four models consider the effects of these same variables on the number of citations to the
same set of patents. In each table, the basic specification (L1 and C1) reports the influence of
estimate the covariance of the underlying coefficients, ˆ ˆ( , )COV xL xCβ β , by regressing the licensing and

22
population, manufacturing value-added, patent importance, and whether the campus is located in
the CMSA/MSA, on licensing and citing activity. We then add measures for distance and the
square of distance in equations L2 and C2. The third set of equations (L3 and C3) controls for
university differences by including indicator variables for Stanford and Columbia observations.
Finally, the fourth set of equations (L4 and C4) adds additional controls for technology by
including indicator variables for the five leading SICs in our sample (SICs 283, 382, 367, 366,
and 384).
Table 8 contains standardized coefficients that are analogous to the coefficients
for kLNPOP , | ,a j kVALADD , jPATIMP , ,i kSAMEREG , and ,i kDIST in the licensing and citation
specifications in which we add distance measures to the basic controls (models L2 and C2 in
Tables 5–7). Table 8 also reports the results of our tests of the hypothesis that the standardized
coefficients generated from the licensing and citation equations are equal (columns 3 and 4 of
Table 8).
We turn first to the results for the overall patent sample (Table 5).
*** Table 5 Here ***
The coefficients for the regional population and industrial activity variables, kLNPOP
and | ,a j kVALADD , are generally positive and significant for all eight specifications (with the
single exception of the lack of significance for the | ,a j kVALADD coefficient in equation 5C2).
This result is not surprising, as we expect more populous and industrially active regions to more
intensively license or cite university inventions, ceteris paribus.
citation equations jointly using the “seemingly unrelated regression” (SUR) technique (Zellner 1962).

23
At first glance it appears that overall population affects licensing and citing activity
differently than does regional industrial activity. The coefficients for kLNPOP in licensing
equations 5L1–5L4 are consistently smaller than the coefficients in the citation equations 5C1–
5C4, while the comparable coefficients for the corresponding | ,a j kVALADD coefficients are
larger in the licensing equations compared to the coefficients in the citation equations. When we
consider the licensing standardized coefficients for kLNPOP and | ,a j kVALADD in Table 8,
however, we see that both population and industrial activity affect licensing more than citations.
This difference in the standardized coefficients for kLNPOP is consistent with the patterns
exhibited in Table 2 that licenses tend to be more concentrated among the larger metropolitan
areas, while citations are distributed more evenly among all sizes of regions in our sample.
Moreover, the significant difference in size of the standardized coefficients for industry location
effects reported in Table 8 supports the argument that knowledge flows through licensing
agreements are more sensitive to regional industry composition than are citation-based
spillovers, which reflect a generalized information dissemination process.
The coefficient for jPATIMP is also positive and significant in equations 5L1–5L3,
suggesting that licensing contracts are more important in accessing university inventions for the
technology classes in which patent protection is judged to be an important mechanism for
appropriating the returns to innovation. (We omitted jPATIMP in equations 5L4 and 5C4 due to
collinearity with the SIC indicator variables in those equations). But differences among
technologies in the importance of patents as mechanisms for capturing the returns to invention
should have a smaller effect on citation than on licensing, a hypothesis that is supported by the
ratio of the standardized coefficients for licensing and citations in Column 5 in Table 8 . This

24
ratio for jPATIMP is 2.5, suggesting that patent appropriability influences licensing activity to a
much greater extent than it influences citing activity, consistent with our expectation.
In equations 5L2 and 5C2, we introduce the variables of particular interest in our
analysis, the distance variables ,i kDIST and ,i kDISTSQ . In these and subsequent equations,
,i kDIST is consistently negative and significant, while ,i kDISTSQ is positive and significant. The
negative coefficients on ,i kDIST suggest that greater distance is associated with lower licensing
or citing activity. Conversely, the positive coefficients for ,i kDISTSQ indicate that beyond some
distance from our universities, licensing and citation begin to increase again, revealing an
upwardly concave relationship between distance and the share of citations or agreements
accounted for by a given CMSA/MSA-SIC pair. This result reflects the “bicoastal” distribution
of licensees and citers of university patents visible in Table 2.
The ,i kDIST coefficients for patent citations (equations 5C2–5C4) are smaller than for
licensing agreements (equations 5L2–5L4), indicating that citation-based “spillovers” decline
less sharply as distance from the patent-holding university increases than does the market-based
channel of licensing. Moreover, the difference between the corresponding standardized
coefficients for licensing and citations (column 4 of Table 8) is highly significant. Table 8
provides further evidence that distance affects licensing activity more heavily than it does
citations. First, the ratio of the standardized coefficients for DIS in the licensing and citations
equations exceeds two (column 5), suggesting that this decline is twice as rapid for licensing.
Furthermore, in the licensing equation (column 1), the standardized coefficient for distance (-
2.39) is more than twice as large as the next largest standardized coefficient (1.13 for kLNPOP ).
This difference is much smaller (-1.03 compared to 0.79) for the citation equation (column 2). In

25
other words, increasing distance has a much greater marginal effect on licensing activity than
does a change in the next most influential variable, population. For citation activity, by contrast,
the marginal effects of distance and population differ by much less. These results all suggest that
distance has a stronger effect on licensing than on citation activity, and they support the
argument that the incomplete nature of licensing contracts limits the ability of more distant firms
to exploit such advances, contradicting the conclusions of Audretsch and Stephan (1996).
The positive and significant coefficient for ,i kSAMEREG in all eight equations indicates
that the presence of a Columbia, Stanford, or University of California campus within a region is
associated with a higher level of licensing or citing activity, implying that geographic
localization is important for both citing and licensing activity. But the difference in the
corresponding standardized coefficients is not statistically significant (Column 4 of Table 8),
suggesting that firms located close to one of our university campuses benefit from both market
and non-market channels of technology transfer.
The variables identifying Columbia and Stanford patents, DUMCU and DUMST , are
inserted in equations 5L3 and 5C3 to control for differences among our three universities. The
positive and significant coefficients indicate that patents issued to Stanford and Columbia are
more intensively licensed and cited than are University of California patents.18 Equations 5L4
and 5C4 also control for industry effects associated with the five largest industries in the sample.
The insertion of indicator variables to control for campus and 3-digit SIC effects does not change
the coefficient estimates for kLNPOP , | ,a j kVALADD , jPATIMP , ,i kSAMEREG , ,i kDIST , and
18 These differences do not persist completely when the patent samples are disaggregated by those licensed exclusively and nonexclusively (see Tables 6 and 7). While Stanford patents are associated with higher levels of licensing and citation for both exclusively and non-exclusively licensed patents, licensing intensity (but not citing intensity) of Columbia’s exclusively licensed patents is below UC’s.

26
,i kDISTSQ , although the significance of the coefficients for most of these variables suggests the
presence of strong industry-specific and university-specific effects.
Table 5 reports the results of two tests of the validity of each model. The Wald statistic
tests the null hypotheses that all coefficients in each model are jointly equal to zero. The positive
and significant Wald statistics allow us to reject this hypothesis for all eight models. ρ
represents the contribution to the total variance of the SICj-CMSA/MSAk variance component,
jkv :
2
2 2v
vε
σρσ σ
=+
(8)
When 0ρ = , the variance component jkv is unimportant, and the random effects estimator is not
significantly different from a pooled tobit estimator. The 0vσ = test compares the random
effects estimator with the pooled tobit estimator, and the results of this test are also reported in
Table 5. The test statistic is significant for all equations, supporting our use of the random
effects models rather than the standard tobit technique.
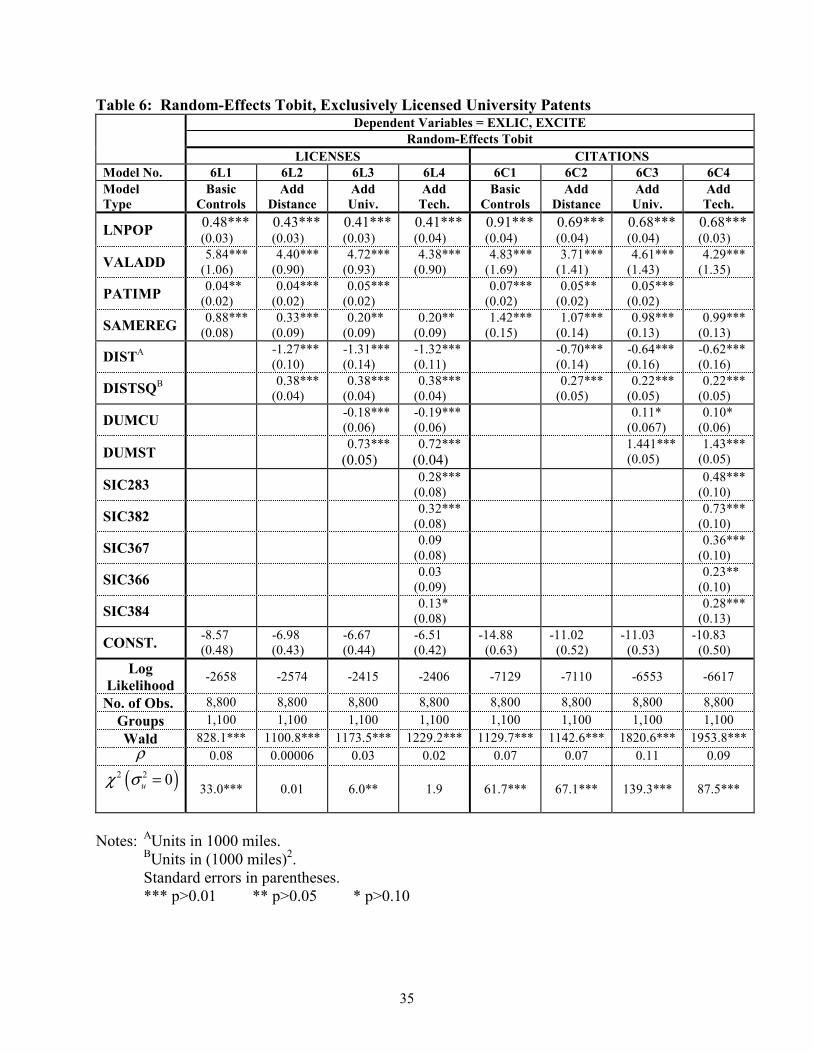
Table 6 reports results for the subsample of exclusively licensed patents.
*** Table 6 Here ***
These results are broadly similar to those reported for the overall sample of patents.
,i kDIST is negative and significant and ,i kDISTSQ is positive and significant in licensing models
6L2–6L4 and citation models 6C2–6C4. The hypothesis test results in Table 8 (column 3)
indicate that distance has a significantly greater effect on licensing than on citation to these
exclusively licensed patents as well. The ,i kDISTSQ standardized coefficient ratio in Table 8 for
the sub-sample of exclusively licensed patents is twice the corresponding ratio for the overall

27
sample, however (*
*
ˆˆ
xL
xC
ββ
for distance equals 4.7 for exclusively licensed patents compared to
2.3 for the overall sample). This suggests that for exclusively licensed inventions, the greater
influence of proximity on licensing, by comparison with its influence on citations, is particularly
pronounced.
Wald statistics are significant for all of our regressions using data for exclusively licensed
patents. Likewise, test statistics for the difference between the random-effects and pooled tobit
estimators are also significant, with the exception of equations 6L2 and 6L4. For these models,
unreported pooled tobit regressions produced similar estimates.
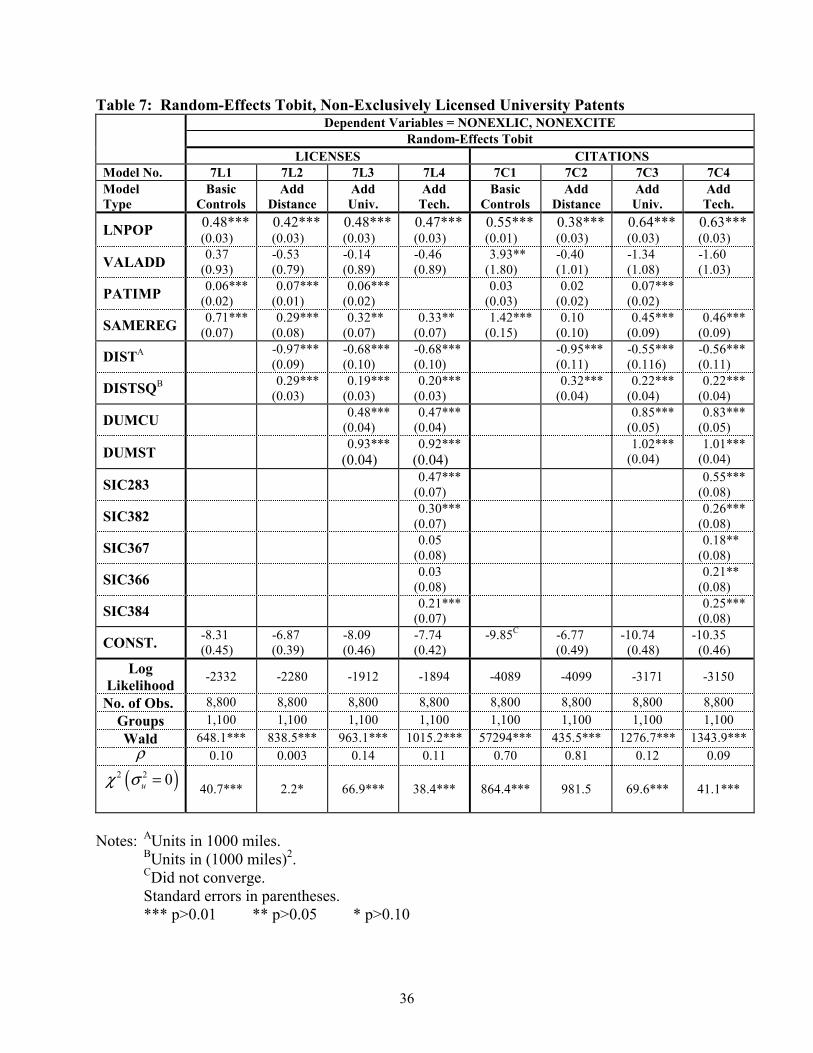
The evidence provided in Tables 5 and 6 of greater localization for licensing agreements
compared to citation-based spillovers receives further support from the last set of regression
specifications in Table 7, which cover non-exclusive licensing agreements and patent citations
for the patents associated with these agreements.
*** Table 7 Here ***
Coefficients for ,i kDIST and ,i kDISTSQ , remain statistically significant (and continue to
exhibit the upwardly concave U-shape) for nonexclusively licensed patents. Moreover, the
negative coefficients for ,i kDIST are slightly larger in the licensing specifications 7L1–7L4
relative to the corresponding coefficients in the citation specifications 7C1–7C4. The results for
nonexclusive licenses reported in Table 8 indicate that the influence of distance on licensing is
significantly greater than its influence on citations, consistent with the findings for the overall
sample and the subsample of exclusively licensed patents reported earlier. Comparing the ratio
of ,i kDISTSQ standardized coefficients for licensing and citation (column 5 of Table 8) reveals
that the difference in market/non-market geographic localization is smaller for non-exclusively

28
licensed patents than it is for exclusively licensed patents by almost a factor of three.
(*
*
ˆˆ
xL
xC
ββ
equals 1.6 for nonexclusively licensed patents and 4.7 for exclusively licensed patents).
This result is consistent with our earlier finding that the greater influence of proximity on
licensing, relative to citations, is particularly large for exclusively licensed inventions.
Wald statistics for the regressions in Table 7 are significant. The statistics for the test
0vσ = are not significant for three of the eight models, which may reflect the smaller number of
patents for this set of inventions. We conducted pooled tobit estimates for these three models
and found little difference between those estimates and the random-effects estimates reported in
Table 7.
5. Conclusion
Previous studies have found that knowledge-intensive economic interactions tend to
benefit from geographic proximity, but have said little about the effects of distance on the flow
of knowledge through different channels. This paper compares the geographic “reach” of
knowledge flows from university inventions through two important channels: non-market
“spillovers” exemplified by patent citations and market contracts centered on licensing. We find
a consistent tendency for knowledge flows through market transactions (in the narrow sense
defined above) to be more geographically localized than those operating through non-market
“spillovers,” contradicting some previous research. This result seems to reflect the necessarily
incomplete nature of licensing contracts, as well as the need for licensees to maintain access to
know-how that is difficult to transmit through documents, faxes, or even phone or e-mail
communication.

29
The differential effects of distance on licensing and citations are most pronounced for
exclusively licensed university patents. This finding may reflect other, unobserved differences
between the characteristics of university inventions that are licensed exclusively and non-
exclusively. Our interviews with university technology transfer managers suggest that firms
seek exclusive licenses for inventions with uncertain commercial potential that require
considerable investments in development. Such inventions more closely conform to the “proofs
and prototypes” that require the transfer of complementary know-how, as analyzed by Jensen
and Thursby (2001) and Arora (1995). But the transfer of such know-how may be less critical
for inventions such as research tools that are licensed non-exclusively. These types of inventions
tend to require less transfer of tacit know-how from the original inventor and are therefore less
constrained by geographic distance.
Universities are an important source of technology and knowledge for firms in many
industries. Our study highlights the importance of additional research on how firms manage the
acquisition of these technologies through contractual agreements and through spillovers.
Knowledge flows embodied in patent licenses and citations co-exist within a broader
environment of technology outflows from universities through other channels that include the
dissemination of research findings through publication and conferences, sponsorship of research,
employment of university graduates, and faculty consulting. Moreover, knowledge flows
between universities and industry, particularly in the life sciences, are increasingly governed by
“materials transfer agreements” (MTAs). The channels we examine in this study undoubtedly
are affected by and simultaneously affect this broader environment. The interaction of these
various channels of market and non-market technology transfer suggests fruitful areas of future
research, and we look forward to further investigation in this area.

30
Table 1: Licenses and Citations to Sample University Patents, 1975-1988 Columbia
UniversityStanford
University University
of California Total
Sample Sample University Patents Issued Patents 41 310 498 849 Cited Patents 41 309 489 839 Licensed Patents 21 208 182 411 Patents Licensed Exclusively 13 155 114 282 Patents Licensed Non-Exclusively 8 29 24 61 Cited and Licensed Patents 21 207 174 402
Licenses to Sample University Patents Total Licenses within 8 Years 63 335 204 602 Less Non-Top 50 MSA Licenses 2 27 16 45 Less Licenses to Non-Cited Patents 0 1 8 9 Total Licenses Remaining in Sample 61 307 180 548
Citations to Sample University Patents Total Citations within 8 Years 486 3804 4142 8432 Less University Citations 112 683 700 1495 Less Non-US Citations 86 1030 1002 2118 Less US Government Citations 6 144 89 239 Less Other Institution/
Foundation Citations 16 69 134 219
Less Citations by Licensees 18 224 75 317 Less Non-Top 50 MSA Citations 43 266 355 664 Less Citations to Non-Licensed
Patents 51 487 1217 1755
Total Citations Remaining in Sample 154 901 570 1625

31
Table 2: Top 50 CMSA/MSA Shares of Value Added, Patent Citations, and Licenses Column 1 Column 2 Column 3 Column 4 Column 5 Column 6 MSA/CMSA
1987 Manuf.
Value Added ($)
% of US 1987 Manuf.
Value Added
US Patent
Citations in 8 Years
% of All US
Patent Citations
US Licenses in 8 Years
% of All US Licenses
New York CMSA 81,959.2 7.0% 588 9.4% 73 12.1% Los Angeles CMSA 72,520.5 6.2% 535 8.5% 117 19.4% Chicago CMSA 49,773.3 4.3% 151 2.4% 12 2.0% San Francisco CMSA 38,913.2 3.3% 1255 20.0% 169 28.1% Detroit CMSA 31,043.7 2.7% 81 1.3% 1 0.2% Boston CMSA 29,713.5 2.5% 602 9.6% 27 4.5% Philadelphia CMSA 28,940.8 2.5% 156 2.5% 24 4.0% Dallas CMSA 19,641.4 1.7% 67 1.1% 2 0.3% Houston CMSA 18,596.9 1.6% 114 1.8% 1 0.2% Cleveland CMSA 17,262.2 1.5% 101 1.6% 1 0.2% Minneapolis MSA 15,732.2 1.3% 118 1.9% 9 1.5% St. Louis MSA 14,115.0 1.2% 48 0.8% 11 1.8% Atlanta MSA 13,345.7 1.1% 26 0.4% 0 0.0% Cincinnati CMSA 12,831.7 1.1% 22 0.4% 0 0.0% Rochester, NY MSA 12,409.0 1.1% 67 1.1% 2 0.3% Milwaukee CMSA 11,609.4 1.0% 67 1.1% 17 2.8% Greensboro, NC MSA 10,910.7 0.9% 11 0.2% 0 0.0% Seattle CMSA 10,895.9 0.9% 112 1.8% 5 0.8% Baltimore MSA 9,675.6 0.8% 68 1.1% 3 0.5% Kansas City MSA 9,124.0 0.8% 11 0.2% 4 0.7% Louisville MSA 8,320.8 0.7% 4 0.1% 0 0.0% Phoenix MSA 8,179.8 0.7% 44 0.7% 1 0.2% Charlotte MSA 8,153.6 0.7% 3 0.0% 0 0.0% Denver CMSA 8,037.3 0.7% 51 0.8% 5 0.8% Hartford, CT MSA 7,596.9 0.7% 29 0.5% 0 0.0% Columbus, OH MSA 7,079.1 0.6% 15 0.2% 0 0.0% Buffalo MSA 7,025.5 0.6% 15 0.2% 0 0.0% Richmond, VA MSA 6,833.0 0.6% 8 0.1% 0 0.0% Indianapolis MSA 6,806.0 0.6% 32 0.5% 7 1.2% Washington, DC CMSA 6,788.0 0.6% 217 3.5% 9 1.5% Portland, OR CMSA 6,445.4 0.6% 43 0.7% 0 0.0% San Diego MSA 6,426.8 0.6% 212 3.4% 42 7.0% Pittsburgh MSA 6,322.8 0.5% 23 0.4% 4 0.7% Dayton MSA 6,284.6 0.5% 13 0.2% 0 0.0% Grand Rapids MSA 5,967.7 0.5% 2 0.0% 0 0.0% Miami, FL CMSA 5,700.2 0.5% 43 0.7% 4 0.7% Providence, RI MSA 5,493.1 0.5% 8 0.1% 0 0.0% Nashville, TN MSA 4,989.5 0.4% 3 0.0% 0 0.0% Greenville, SC MSA 4,967.5 0.4% 2 0.0% 0 0.0% Toledo MSA 4,925.1 0.4% 14 0.2% 0 0.0% Raleigh-Durham MSA 4,728.5 0.4% 36 0.6% 5 0.8% Allentown, PA MSA 4,693.8 0.4% 3 0.0% 1 0.2% New Orleans MSA 4,314.7 0.4% 37 0.6% 0 0.0% Norfolk, VA MSA 4,285.3 0.4% 9 0.1% 0 0.0% Tampa MSA 4,139.8 0.4% 8 0.1% 0 0.0% Wichita MSA 4,122.8 0.4% 1 0.0% 0 0.0% Memphis MSA 4,114.2 0.4% 7 0.1% 1 0.2% Lancaster, PA MSA 3,883.7 0.3% 0 0.0% 0 0.0% Oklahoma City MSA 3,653.4 0.3% 4 0.1% 0 0.0% Springfield, MA MSA 3,542.1 0.3% 2 0.0% 0 0.0% TOTAL 682,834.9 58.6% 5088 81.1% 557 92.5% US Total 1,165,746.8 100.0% 6272 100.0% 602 100.0%

32
Table 3: Variable Definitions Variable Definition Dependent Variables LICENSEi,j,k “Number” of licenses to inventing campus i’s patents in SIC j from
CMSA/MSA k. CITEi,j,k “Number” of citations to inventing campus i’s patents in SIC j from
CMSA/MSA k. EXLICi,j,k “Number” of licenses to inventing campus i’s exclusively licensed patents
in SIC j from CMSA/MSA k. NONEXLICi,j,k “Number” of licenses to inventing campus i’s non-exclusively licensed
patents in SIC j from CMSA/MSA k. EXCITEi,j,k “Number” of citations to inventing campus i’s exclusively licensed
patents in SIC j from CMSA/MSA k. NONEXCITEi,j,k “Number” of citations to inventing campus i’s non-exclusively licensed
patents in SIC j from CMSA/MSA k. Independent Variables DISTi,k Distance (in thousand mile units) between inventing campus i and
licensing or citing CMSA/MSA k. DISTSQi,k Square of distance between inventing campus i and licensing or citing
CMSA/MSA k. POPk, LNPOPk Total population in 1990 of CMSA/MSA k ; natural log of POPk. VALADDa|j,k Share of US manufacturing value-added in 1987 in 2-digit SIC “owner”
of 3-digit SIC j, accounted for by CMSA/MSA k. PATIMPj Reported importance of formal patent protection in 3-digit SIC j.
SAMEREGi,k Indicator variable equal to 1 if campus i is located in licensing or citing CMSA/MSA k.
SIC283 Indicator variable equal to 1 if SIC j = 283, 0 otherwise.
SIC366 Indicator variable equal to 1 if SIC j = 366, 0 otherwise.
SIC286 Indicator variable equal to 1 if SIC j = 286, 0 otherwise.
SIC349 Indicator variable equal to 1 if SIC j = 349, 0 otherwise.
SIC382 Indicator variable equal to 1 if SIC j = 382, 0 otherwise.
DUMCU Indicator variable equal to 1 if campus i is Columbia University, 0 otherwise.
DUMST Indicator variable equal to 1 if campus i is Stanford University, 0 otherwise.

33
Table 4: Descriptive Statistics Variable Minimum
Maximum
Mean
Standard Deviation
Independent Variables DISTi,k 0 2.70 1.72 0.74 POPk 422,822 19,800,000 2,731,237 3,461,290 VALADDa|j,k 0 14,826.70 1,052.14 0.019 PATIMPj 1.50 6.53 4.12 1.15 Dependent Variables Overall University Patent Sample, N=9,900 LICENSEi,j,k 0 20.95 0.05 0.46 CITEi,j,k 0 36.12 0.15 1.01 Exclusively Licensed Patent Sample, N=8,800 LICENSEi,j,k 0 17.86 0.03 0.31 CITEi,j,k 0 29.75 0.13 0.80 Nonexclusively Licensed Patent Sample, N=8,800 LICENSEi,j,k 0 10.54 0.02 0.23 CITEi,j,k 0 12.37 0.04 0.37

34
Table 5: Random-Effects Tobit, Overall University Patent Sample Dependent Variables = LICENSE, CITE Random-Effects Tobit LICENSES CITATIONS
Model No. 5L1 5L2 5L3 5L4 5C1 5C2 5C3 5C4 Model Type
Basic Controls
Add Distance
Add Univ.
Add Tech.
Basic Controls
Add Distance
Add Univ.
Add Tech.
LNPOP 0.69*** (0.04)
0.59*** (0.03)
0.65*** (0.04)
0.65*** (0.04)
0.91*** (0.04)
0.92*** (0.04)
0.92*** (0.04)
0.91*** (0.04)
VALADD 4.90*** (1.45)
3.43*** (1.06)
4.31*** (1.43)
3.99*** (1.39)
4.83*** (1.69)
2.25 (1.74)
3.50** (1.76)
3.19* (1.67)
PATIMP 0.06*** (0.02)
0.08*** (0.02)
0.07*** (0.02)
0.07*** (0.02)
0.07*** (0.02)
0.08*** (0.02)
SAMEREG 0.90*** (0.10)
0.29*** (0.11)
0.29*** (0.10)
0.29*** (0.10)
1.42*** (0.15)
0.96*** (0.16)
1.09*** (0.15)
1.10*** (0.15)
DISTA -1.50*** (0.12)
-1.11*** (0.14)
-1.11*** (0.14)
-1.42*** (0.0005)
-1.00*** (0.16)
-0.98*** (0.16)
DISTSQB 0.43*** (0.05)
0.31*** (0.05)
0.31*** (0.05)
0.52*** (0.06)
0.38*** (0.06)
0.37*** (0.06)
DUMCU 0.48*** (0.06)
0.47*** (0.06)
0.60*** (0.07)
0.59*** (0.07)
DUMST 1.29*** (0.05)
1.28*** (0.05)
1.91*** (0.06)
1.90*** (0.06)
SIC283 0.49*** (0.11)
0.74*** (0.12)
SIC382 0.39*** (0.11)
0.79*** (0.12)
SIC367 0.07 (0.12)
0.43*** (0.13)
SIC366 0.04 (0.12)
0.33*** (0.13)
SIC384 0.22** (0.11)
0.37*** (0.13)
CONST. -11.82 (0.62)
-9.40 (0.48)
-10.81 (0.62)
-10.50 (0.60)
-14.88 (0.63)
-14.28 (0.64)
-14.85 (0.66)
-14.52 (0.62)
Log Likelihood -4055 -4007 -3617 -3607 -8687 -8643 -8123 -8087
No. of Obs. 9,900 9,900 9,900 9,900 9,900 9,900 9,900 9,900 Groups 1,100 1,100 1,100 1,100 1,100 1,100 1,100 1,100 Wald 803.0*** 1329.8*** 1276.7*** 1320.5*** 1201.4*** 1223.0*** 2001.0*** 2138.6***
ρ 0.15 0.003 0.17 0.16 0.07 0.08 0.11 0.09
( )2 2 0uχ σ =
148.6***
5.0**
153.6***
122.2***
74.6***
85.1***
163.7***
104.7***
Notes: AUnits in 1000 miles. BUnits in (1000 miles)2.
Standard errors in parentheses. *** p>0.01 ** p>0.05 * p>0.10
35
Table 6: Random-Effects Tobit, Exclusively Licensed University Patents Dependent Variables = EXLIC, EXCITE Random-Effects Tobit LICENSES CITATIONS
Model No. 6L1 6L2 6L3 6L4 6C1 6C2 6C3 6C4 Model Type
Basic Controls
Add Distance
Add Univ.
Add Tech.
Basic Controls
Add Distance
Add Univ.
Add Tech.
LNPOP 0.48*** (0.03)
0.43*** (0.03)
0.41*** (0.03)
0.41*** (0.04)
0.91*** (0.04)
0.69*** (0.04)
0.68*** (0.04)
0.68*** (0.03)
VALADD 5.84*** (1.06)
4.40*** (0.90)
4.72*** (0.93)
4.38*** (0.90)
4.83*** (1.69)
3.71*** (1.41)
4.61*** (1.43)
4.29*** (1.35)
PATIMP 0.04** (0.02)
0.04*** (0.02)
0.05*** (0.02)
0.07*** (0.02)
0.05** (0.02)
0.05*** (0.02)
SAMEREG 0.88*** (0.08)
0.33*** (0.09)
0.20** (0.09)
0.20** (0.09)
1.42*** (0.15)
1.07*** (0.14)
0.98*** (0.13)
0.99*** (0.13)
DISTA -1.27*** (0.10)
-1.31*** (0.14)
-1.32*** (0.11)
-0.70*** (0.14)
-0.64*** (0.16)
-0.62*** (0.16)
DISTSQB 0.38*** (0.04)
0.38*** (0.04)
0.38*** (0.04)
0.27*** (0.05)
0.22*** (0.05)
0.22*** (0.05)
DUMCU -0.18*** (0.06)
-0.19*** (0.06)
0.11* (0.067)
0.10* (0.06)
DUMST 0.73*** (0.05)
0.72*** (0.04)
1.441*** (0.05)
1.43*** (0.05)
SIC283 0.28*** (0.08)
0.48*** (0.10)
SIC382 0.32*** (0.08)
0.73*** (0.10)
SIC367 0.09 (0.08)
0.36*** (0.10)
SIC366 0.03 (0.09)
0.23** (0.10)
SIC384 0.13* (0.08)
0.28*** (0.13)
CONST. -8.57 (0.48)
-6.98 (0.43)
-6.67 (0.44)
-6.51 (0.42)
-14.88 (0.63)
-11.02 (0.52)
-11.03 (0.53)
-10.83 (0.50)
Log Likelihood -2658 -2574 -2415 -2406 -7129 -7110 -6553 -6617
No. of Obs. 8,800 8,800 8,800 8,800 8,800 8,800 8,800 8,800 Groups 1,100 1,100 1,100 1,100 1,100 1,100 1,100 1,100 Wald 828.1*** 1100.8*** 1173.5*** 1229.2*** 1129.7*** 1142.6*** 1820.6*** 1953.8***
ρ 0.08 0.00006 0.03 0.02 0.07 0.07 0.11 0.09
( )2 2 0uχ σ =
33.0***
0.01
6.0**
1.9
61.7***
67.1***
139.3***
87.5***
Notes: AUnits in 1000 miles. BUnits in (1000 miles)2.
Standard errors in parentheses. *** p>0.01 ** p>0.05 * p>0.10
36
Table 7: Random-Effects Tobit, Non-Exclusively Licensed University Patents Dependent Variables = NONEXLIC, NONEXCITE Random-Effects Tobit LICENSES CITATIONS
Model No. 7L1 7L2 7L3 7L4 7C1 7C2 7C3 7C4 Model Type
Basic Controls
Add Distance
Add Univ.
Add Tech.
Basic Controls
Add Distance
Add Univ.
Add Tech.
LNPOP 0.48*** (0.03)
0.42*** (0.03)
0.48*** (0.03)
0.47*** (0.03)
0.55*** (0.01)
0.38*** (0.03)
0.64*** (0.03)
0.63*** (0.03)
VALADD 0.37 (0.93)
-0.53 (0.79)
-0.14 (0.89)
-0.46 (0.89)
3.93** (1.80)
-0.40 (1.01)
-1.34 (1.08)
-1.60 (1.03)
PATIMP 0.06*** (0.02)
0.07*** (0.01)
0.06*** (0.02)
0.03 (0.03)
0.02 (0.02)
0.07*** (0.02)
SAMEREG 0.71*** (0.07)
0.29*** (0.08)
0.32** (0.07)
0.33** (0.07)
1.42*** (0.15)
0.10 (0.10)
0.45*** (0.09)
0.46*** (0.09)
DISTA -0.97*** (0.09)
-0.68*** (0.10)
-0.68*** (0.10)
-0.95*** (0.11)
-0.55*** (0.116)
-0.56*** (0.11)
DISTSQB 0.29*** (0.03)
0.19*** (0.03)
0.20*** (0.03)
0.32*** (0.04)
0.22*** (0.04)
0.22*** (0.04)
DUMCU 0.48*** (0.04)
0.47*** (0.04)
0.85*** (0.05)
0.83*** (0.05)
DUMST 0.93*** (0.04)
0.92*** (0.04)
1.02*** (0.04)
1.01*** (0.04)
SIC283 0.47*** (0.07)
0.55*** (0.08)
SIC382 0.30*** (0.07)
0.26*** (0.08)
SIC367 0.05 (0.08)
0.18** (0.08)
SIC366 0.03 (0.08)
0.21** (0.08)
SIC384 0.21*** (0.07)
0.25*** (0.08)
CONST. -8.31 (0.45)
-6.87 (0.39)
-8.09 (0.46)
-7.74 (0.42)
-9.85C
-6.77 (0.49)
-10.74 (0.48)
-10.35 (0.46)
Log Likelihood -2332 -2280 -1912 -1894 -4089 -4099 -3171 -3150
No. of Obs. 8,800 8,800 8,800 8,800 8,800 8,800 8,800 8,800 Groups 1,100 1,100 1,100 1,100 1,100 1,100 1,100 1,100 Wald 648.1*** 838.5*** 963.1*** 1015.2*** 57294*** 435.5*** 1276.7*** 1343.9***
ρ 0.10 0.003 0.14 0.11 0.70 0.81 0.12 0.09
( )2 2 0uχ σ =
40.7*** 2.2* 66.9*** 38.4*** 864.4*** 981.5 69.6*** 41.1***
Notes: AUnits in 1000 miles. BUnits in (1000 miles)2. CDid not converge.
Standard errors in parentheses. *** p>0.01 ** p>0.05 * p>0.10

37
Table 8: Standardized Coefficients and Hypothesis Tests: * *ˆ ˆ: 0o xL xCH β β− =
Standardized Coefficient LICENSES
*ˆ( )xLβ
Standardized Coefficient
CITATIONS *ˆ( )xCβ
* *ˆ ˆxL xCβ β−
Z-Statistic
*
*
ˆˆ
xL
xC
ββ
(1) (2) (3) (4) (5) Overall University Sample
LNPOP 1.13 (0.06)
0.79 (0.04) 0.34 4.54*** 1.4
VALADD 0.14 (0.04)
0.04 (0.03) 0.10 1.76** 3.5
PATIMP 0.20 (0.04)
0.08 (0.03) 0.12 2.14** 2.5
SAMEREG 0.08 (0.03)
0.13 (0.02) -0.05 -1.02 0.6
DIST -2.39 (0.19)
-1.03 (0.12) -1.36 -5.93*** 2.3
Exclusively Licensed Patents
LNPOP 1.21 (0.08)
0.74 (0.04) 0.47 5.24*** 1.6
VALADD 0.27 (0.06)
0.09 (0.03) 0.18 2.75*** 3.0
PATIMP 0.16 (0.06)
0.06 (0.03) 0.10 1.53* 2.7
SAMEREG 0.14 (0.04)
0.17 (0.02) -0.03 -0.75 0.8
DIST -3.02 (0.25)
-0.64 (0.13) -2.38 -8.40*** 4.7
Non-Exclusively Licensed Patents
LNPOP 1.56 (0.10)
0.88 (0.08) 0.68 5.57*** 1.8
VALADD -0.04 (0.06)
-0.02 (0.05) -0.02 -0.27 2.0
PATIMP 0.32 (0.07)
0.06 (0.05) 0.26 3.14*** 5.3
SAMEREG 0.16 (0.04)
0.03 (0.05) 0.13 2.27** 5.3
DIST -3.07 (0.30)
-1.90 (0.23) -1.17 -3.12*** 1.6
Notes: Standard errors in parentheses.
*** p>0.01 ** p>0.05 * p>0.10

38
Bibliography:
Acs, Z.J., D.B. Audretsch, and M.P. Feldman (1992). “Real Effects of Academic Research: Comment,” American Economic Review 82: 363-367.
Acs, Z.J., D.B. Audretsch, and M.P. Feldman (1994). “R&D Spillovers and Innovative Activity,” Managerial and Decision Economics 15: 131-138.
Adams, J.D. (2001). “Comparative Localization of Academic and Industrial Spillovers,” NBER Working Paper #8292.
Almeida, P. and B. Kogut (1999). “Localization of Knowledge and the Mobility of Engineers in Regional Networks,” Management Science 45(July): 905-917.
Agrawal, A. (2000). “Economic Issues Concerning the Mobility of Scientific Inventions,” Unpublished PhD Dissertation, University of British Columbia.
Arora, A. (1995). “Licensing Tacit Knowledge: Intellectual Property Rights and the Market for Know-How,” Economics of Innovation and New Technology 4:41-59.
Arrow, K.J. (1962). “Economic Welfare and the Allocation of Resources of Invention,” in R.R. Nelson, ed., The Rate and Direction of Inventive Activity: Economics and Social Factors. (Princeton, NJ: Princeton University Press): 609-25.
Association of University Technology Managers, Inc. (2000). AUTM Licensing Survey, Fiscal Year 1999. (Norwalk, CT: Association of University Technology Managers).
Audretsch, D.B., and M.P. Feldman (1996). “R&D Spillovers and the Geography of Innovation and Production,” American Economic Review 86: 630-640.
Audretsch, D.B., and P.E. Stephan (1996). “Company-Scientist Locational Links: The Case of Biotechnology,” American Economic Review 86: 641-652.
Griliches, Z. (1979). “Issues in Assessing the Contribution of R&D to Productivity Growth,” Bell Journal of Economics 10: 92-116.
Heckman, J. (1979). “Sample Selection Bias as a Specification Error,” Econometrica 47: 153-161.
Henderson, R., M. Trajtenberg, and A.B. Jaffe (1998). “Universities as a Source of Commercial Technology: A Detailed Analysis of University Patenting, 1965-88,” Review of Economics and Statistics 80(1): 119-127.
Jaffe, A.B. (1989). “Real Effects of Academic Research,” American Economic Review 79: 957-970.

39
Jaffe, A.B., M.S. Fogarty, and B.A. Banks (1998). “Evidence from Patents and Patent Citations on the Impact of NASA and Other Federal Labs on Commercial Innovation,” The Journal of Industrial Economics 46(2): 183-205.
Jaffe, A.B., M. Trajtenberg, and M.S. Fogarty (2000). “The Meaning of Patent Citations: Report on the NBER/Case-Western Reserve Survey of Patentees,” NBER Working Paper #7631.
Jaffe, A.B., M. Trajtenberg, and R. Henderson (1993). “Geographic Localization of Knowledge Spillovers as Evidenced by Patent Citations,” Quarterly Journal of Economics: 577-598.
Jensen, R. and M. Thursby (2001). “Proofs and Prototypes for Sale: The Tale of University Licensing,” American Economic Review 91: 240-259.
Levin, R.C., A.K. Klevorick, R.R. Nelson, and S.G. Winter (1987). “Appropriating the Returns from Industrial Research and Development,” Brookings Papers on Economic Activity 3: 783-820.
Marshall, A. (1896). Industry and Trade. (London: Macmillan Publishing Company).
Mowery, D.C. (1983). “Economic Theory and Government Technology Policy,” Policy Sciences 16: 27-44.
Mowery, D.C., R.R. Nelson, B.N. Sampat, and A.A. Ziedonis (2001). “The Growth of Patenting and Licensing by U.S. Universities: An Assessment of the Effects of the Bayh-Dole Act of 1980,” Research Policy 30: 99-119.
Podolny, J. and A. Shepard (1996). “When are Technological Spillovers Local? Patent Citation Patterns in the Semiconductor Industry,” Working Paper, Stanford University.
Silverman, B.S. (1996). “Technical Assets and the Logic of Corporate Diversification,” Unpublished Ph.D. Dissertation, Haas School of Business, University of California, Berkeley.
Stata Corp. (2001). Stata Statistical Software: Release 7.0. (College Station, TX: Stata Corporation).
Williamson, O.E. (1975). Markets and Hierarchies. (New York: Free Press).
Williamson O.E. (1985). The Economic Institutions of Capitalism. (New York: Free Press).
Zellner, A. (1962) “An Efficient Method of Estimating Seemingly Unrelated Regressions and Tests for Aggregation Bias,” Journal of the American Statistical Association 57(June): 348-368.
Zucker, L.G., M.B. Darby, and J. Armstrong (1998). “Intellectual Capital and the Firm: The Technology of Geographically Localized Knowledge Spillovers,” Economic Inquiry 36(January): 65-86.
Zucker, L.G., M.B. Darby, and M. Brewer (1999). “Intellectual Capital and the Birth of U.S. Biotechnology Enterprises,” American Economic Review 88(1): 290-306.