Navneet Publications (India) Ltd. - Power Your Trade...
18
Navneet Publications (India) Ltd. BUY - 1 of 18 - Wednesday 20 th March, 2013 This document is for private circulation, and must be read in conjunction with the disclaimer on the last page. STOCK POINTER Target Price `79 CMP `59 FY15 PE 10.0x Index Details We initiate coverage on Navneet Publications (India) Limited (NPIL) with a BUY and a Price Objective of `79 representing a potential upside of ~34.4% over a period of 24 months. At the CMP of `59, the stock is trading at 12.2x and 10.0x its estimated earnings for FY14 & FY15 respectively. On the back of multiple growth drivers viz. proposed common curriculum, geographic expansion and improved visibility of e-learning business, we expect revenues to grow at a CAGR of 17.5% to `1,022.2 crore by FY15E from `630 crore in FY12. Further, EBITDA margins are expected to improve from 20.8% to 23.2% by FY15E as the incremental revenues from eSense business will flow directly to EBITDA. We expect PAT to grow at a CAGR of 21.5% to `139.9 crore in FY15E from `78.0 crore in FY12. Further, we have cautiously not factored `750 crore digital learning order received by NPIL from Directorate of Primary Education, Maharashtra and remains a substantial upside risk to our estimates. On the most conservative basis, we expect ~64% upside to our FY15 EPS estimate of `5.9 per share. Publication business to witness robust growth on the back of multiple drivers On an average, NPIL has witnessed ~19-20% revenue growth during the syllabus change phase. With proposed change in school syllabus by state boards of Maharashtra and Gujarat, we expect the revenues from curriculum-based segment to continue to report robust growth during FY12-14E. Further, proposed common curriculum, which is to be implemented pan India, should provide further impetus to the publication business revenues even beyond FY14. NPIL also plans to extend its reach Pan India. Over the next 3-4 years, we expect a complete rollout of its offerings in AP. We expect this stream to grow at a CAGR of 19.6% over FY12-15E to `606.2 crore on the back of multiple drivers. Sensex 18,884 Nifty 5,694 BSE 100 5,693 Industry Publishing Scrip Details Mkt Cap (` cr) 1,389 BVPS (`) 15.2 O/s Shares (Cr) 23.8 Av Vol (Lacs) 0.4 52 Week H/L 52/70 Div Yield (%) 2.3 FVPS (`) 2.0 Shareholding Pattern Shareholders % Promoters 61.8 DIIs 9.2 FIIs 6.2 Public 22.8 Total 100.0 NPIL vs. Sensex Key Financials (` in Cr) Y/E Mar Net Revenue EBITDA PAT EPS EPS Growth (%) RONW (%) ROCE (%) P/E (x) EV/EBITDA (x) 2012 630.0 131.4 78.0 3.3 16.8 21.6 25.1 18.0 11.7 2013E 763.9 165.3 94.8 4.0 21.5 23.0 26.2 14.8 9.3 2014E 884.1 198.3 115.3 4.8 21.7 24.4 28.5 12.2 7.8 2015E 1,022.2 236.8 139.9 5.9 21.3 25.5 30.4 10.0 6.5
Transcript of Navneet Publications (India) Ltd. - Power Your Trade...

Navneet Publications (India) Ltd.
BUY
- 1 of 18 - Wednesday 20th
March, 2013
This document is for private circulation, and must be read in conjunction with the disclaimer on the last page.
ST
OC
K P
OIN
TE
R
Target Price `79 CMP `59 FY15 PE 10.0x
Index Details We initiate coverage on Navneet Publications (India) Limited
(NPIL) with a BUY and a Price Objective of `79 representing a potential upside of ~34.4% over a period of 24 months. At the CMP of `59, the stock is trading at 12.2x and 10.0x its estimated earnings for FY14 & FY15 respectively. On the back of multiple growth drivers viz. proposed common curriculum, geographic expansion and improved visibility of e-learning business, we expect revenues to grow at a CAGR of 17.5% to `1,022.2 crore by
FY15E from `630 crore in FY12. Further, EBITDA margins are expected to improve from 20.8% to 23.2% by FY15E as the incremental revenues from eSense business will flow directly to
EBITDA. We expect PAT to grow at a CAGR of 21.5% to `139.9
crore in FY15E from `78.0 crore in FY12. Further, we have
cautiously not factored `750 crore digital learning order received by NPIL from Directorate of Primary Education, Maharashtra and remains a substantial upside risk to our estimates. On the most conservative basis, we expect ~64% upside to our FY15 EPS
estimate of `5.9 per share. Publication business to witness robust growth on the back of
multiple drivers
On an average, NPIL has witnessed ~19-20% revenue growth during the syllabus change phase. With proposed change in school syllabus by state boards of Maharashtra and Gujarat, we expect the revenues from curriculum-based segment to continue to report robust growth during FY12-14E. Further, proposed common curriculum, which is to be implemented pan India, should provide further impetus to the publication business revenues even beyond FY14. NPIL also plans to extend its reach Pan India. Over the next 3-4 years, we expect a complete rollout of its offerings in AP. We expect this stream to grow at a CAGR of 19.6% over FY12-15E to `606.2 crore on the back of multiple drivers.
Sensex 18,884
Nifty 5,694
BSE 100 5,693
Industry Publishing
Scrip Details
Mkt Cap (` cr) 1,389
BVPS (`) 15.2
O/s Shares (Cr) 23.8
Av Vol (Lacs) 0.4
52 Week H/L 52/70
Div Yield (%) 2.3
FVPS (`) 2.0
Shareholding Pattern
Shareholders %
Promoters 61.8
DIIs 9.2
FIIs 6.2
Public 22.8
Total 100.0
NPIL vs. Sensex
Key Financials (` in Cr)
Y/E Mar Net
Revenue EBITDA PAT EPS
EPS Growth (%)
RONW (%)
ROCE (%)
P/E (x)
EV/EBITDA (x)
2012 630.0 131.4 78.0 3.3 16.8 21.6 25.1 18.0 11.7
2013E 763.9 165.3 94.8 4.0 21.5 23.0 26.2 14.8 9.3
2014E 884.1 198.3 115.3 4.8 21.7 24.4 28.5 12.2 7.8
2015E 1,022.2 236.8 139.9 5.9 21.3 25.5 30.4 10.0 6.5
- 2 of 18 - Wednesday 20th
March, 2013
This document is for private circulation, and must be read in conjunction with the disclaimer on the last page.
Digital learning business to attain breakeven in FY13
The key differentiator of NPIL‟s eSense products is its one-to-one mapping with state board textbooks as against competitors‟ focus on advanced learning beyond school textbooks. We expect revenues from this stream to grow multifold to ~`46
crore by FY15E on the back of increased penetration. Moreover, with the likely breakeven in the current year coupled with its low and fixed cost model, majority of the incremental revenues will flow to EBITDA. Further, NPIL has received digital learning order of `750 crore from Directorate of
Primary Education, Maharashtra in Dec 2012. The orders are likely to be allocated in phases over the period of three years. Since its allocation is yet to be announced by the government, we have cautiously not factored them in our model as the awarding of the order will solely depend on the availability of funds with the department.
After the recent lull, Stationery business is all set for steady
growth
NPIL‟s stationery business witnessed muted growth from `230 crore in FY09 to `249
crore in FY12 (~2.8% CAGR) due to severe domestic competition and de-growth in exports. However, owing to the demonstrated revival in the export business, we expect revenues from stationery business to grow at a healthy CAGR of 12.9% to `359 crore by FY15E. The company will not be undertaking any fresh capex as it has adequate capacities. In case of capacity constraints, company has the option of outsourcing.
Valuation
We initiate coverage on Navneet Publications (India) Ltd (NPIL) as a BUY with a Price Objective of `79 representing a potential upside of ~34.4% over a period of 24 months. At a CMP of `59, the stock is trading at 12.2x and 10.0x its one year
forward earnings for FY14 and FY15 respectively. Historically, the company has traded at an average of 13.5x its one year forward earnings and we have assigned a similar multiple for the valuation purpose. However, we believe that these estimates are conservative given the upside risks that the stock holds which are enumerated below: 1) Probable re-rating due to:
a. Strong visibility of common curriculum implementation b. Increased emphasis on supplementary books by state government c. Increased demand for NPIL‟s stationery in the export market d. Consistent Dividend P/O ratio of above 40% (~2.3% dividend yield) coupled
with consistent ROE of 21% and higher. 2) Specific allocation of digital learning orders to boost EPS substantially
- 3 of 18 - Wednesday 20th
March, 2013
This document is for private circulation, and must be read in conjunction with the disclaimer on the last page.
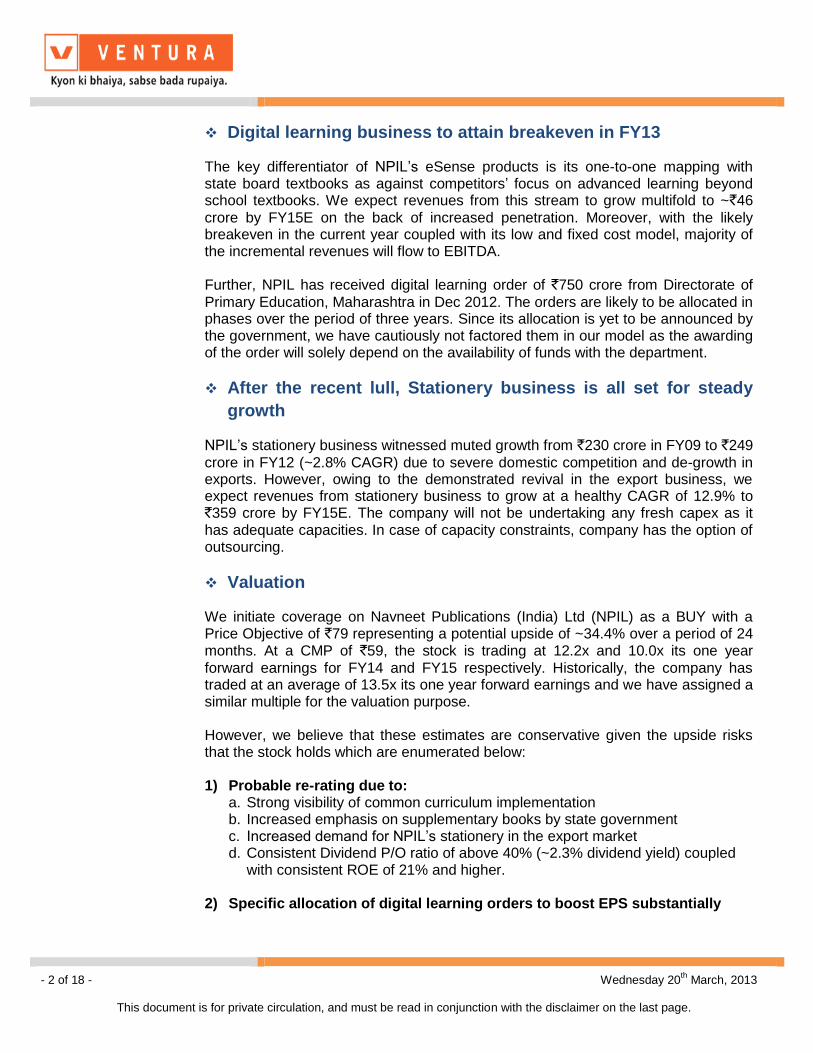
Company Background
Navneet Publications (India) Limited (NPIL) is in the business of curriculum and non-curriculum based publications, scholastic paper and non-paper stationery products. It has presence in Maharashtra and Gujarat with ~65% market share. In line with its strategy to expand its presence, it has forayed into new geographies of Andhra Pradesh and Delhi with an objective to target the students from CBSE and ICSE Boards as well. In 2011, NPIL ventured into the School Management Business by acquiring ~24% stake in K-12 Techno Services Pvt. Ltd (Andhra Pradesh) which is backed by Sequoia Capital. This company oversees ~93 schools (~65,000 students) under the brand „Gowtham Model Schools‟. NPIL is one of the largest paper stationery brand in India and it enjoys leading position in the premiere stationery markets of the Middle East, parts of Africa, U.S.A. and Europe. In 2008, NPIL ventured into Digital Learning (eSense) by creating a digitalized version of the textbook based on state level curriculum. Till December 2012, e-Sense has been installed in 1,600+ institutions canvassing over 9,600 classes. As a part of its B2C initiative, in July 2012, NPIL soft launched its first retail product "UTOP" (tablet for students) in Maharashtra and Gujarat.
NPIL’s structure
Source: NPIL, Ventura Research

- 4 of 18 - Wednesday 20th
March, 2013
This document is for private circulation, and must be read in conjunction with the disclaimer on the last page.
Key Investment Highlights
Publication business to witness robust growth on the back of
multiple drivers
Publication business continues to be the mainstay for NPIL given that this stream contributes ~58% to its total revenues with EBIT contribution even higher at ~82% of the total EBIT. Of the total publication business in FY12, 92% revenue was realised from school publication business. Of this revenue, Workbooks, Guides and 21 Question Sets contributed 45%, 40% and 15%. Revenues from publication business have grown at a healthy CAGR of 10.7% over FY07-12 from `213.2 crore to `354 crore majorly due to change in syllabus across state level boards of Maharashtra and Gujarat. We expect this stream to grow at a CAGR of 19.6% over FY12-15E to `606.2 crore which would be driven by:
Cyclical changes in syllabus,
Proposed common curriculum across the country,
Greater focus on supplementary books by government,
New market opportunities i.e. Andhra Pradesh and Delhi,
Inorganic foray in school management business.
Cyclical changes in syllabus continue to be publication business’ conventional growth driver Primary growth driver for any publisher in curriculum-based segment is the changes in syllabus while its major competitor is its own books from the second hand market. In order to make syllabus contemporary, the syllabus is changed which ensures growth opportunities for publishers. The education publication industry is, thus, subject to a 6-year cycle wherein the syllabus of few subjects of a few grades is changed in a staggered manner of over 4 years. Therefore, the publishing business
Publication business revenue Curriculum business revenue continue to be mainstay
270 277299
354
437
517
606
0
100
200
300
400
500
600
700
FY09 FY10 FY11 FY12 FY13E FY14E FY15E
Rs.Crore
242 252274
327
408
488
576
0
100
200
300
400
500
600
700
FY09 FY10 FY11 FY12 FY13E FY14E FY15E
Rs.Crore
Source: NPIL, Ventura Research Source: NPIL, Ventura Research
- 5 of 18 - Wednesday 20th
March, 2013
This document is for private circulation, and must be read in conjunction with the disclaimer on the last page.
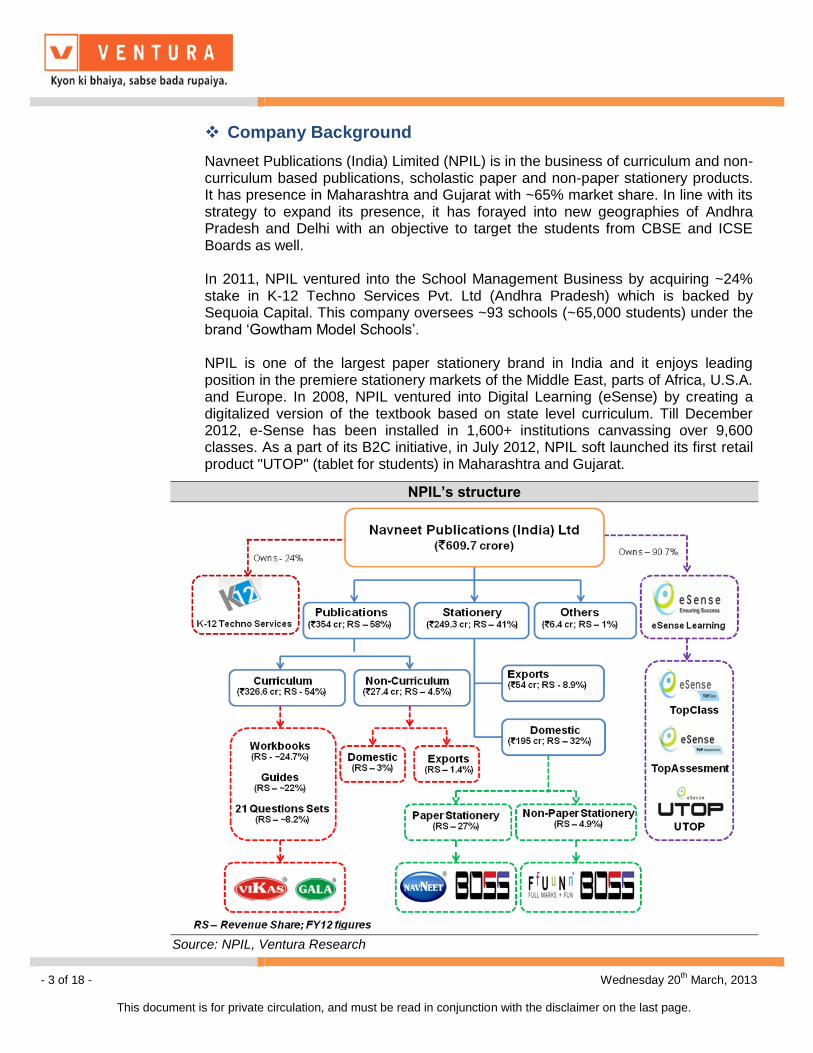
experiences a flourishing business for 4 years followed by a lean phase for the next 2 years. But due to the common curriculum proposed by HRD ministry, NPIL anticipates that the syllabus change cycle that started in FY12 will not only continue upto FY15 but upto FY17-18. On an average, NPIL has witnessed ~19-20% revenue growth (~12-13% volume growth; ~7-8% price growth) during the syllabus change phase. State boards of Maharashtra and Gujarat had proposed a change in school syllabus in FY12, which is expected to complete by FY15E. As NPIL is currently in the middle of growth phase, we expect the revenues from curriculum-based segment to continue to report robust growth during FY12-15E.
Common curriculum to propel next level of growth With an intention to align the content quality to the CBSE pattern, the HRD ministry has proposed a common curriculum for maths and science (100%) and social science (~60-70% alignment) pan India by FY14 end. This is being done by the ministry to raise the education standards and eliminate disparities amongst different education board levels. While a delay of a couple of years is expected, we believe, adoption of common curriculum is inevitable. The ministry‟s serious intention is clearly visible from the fact that it has asked state governments to adopt common curriculum in order to get budgetary support via schemes like Sarva Shiksha Abhiyan. According to the management, the new curriculum that Maharashtra / Gujarat is bringing out is almost along the lines of the CBSE pattern indicating push in the right direction. With the content already being prepared for Maharashtra and Gujarat, NPIL would be best placed to benefit from the upcoming opportunities. Thus, NPIL‟s revenue from publication business is likely to continue its momentum even beyond FY14.
Tentative Syllabus Changes in FY14
Standard Subjects Standard Subjects
I All Subjects VIAll subjects
(English and Hindi Medium)
II All Subjects VIIAll subjects
(English and Hindi Medium)
X
History & Political Science
Geography & Economics
All Languages
Science - Environment
VIIIAll subjects
(English and Hindi Medium)
XIIAll subjects except Science
stream
Maharashtra Gujarat
Source: NPIL, Ventura Research

- 6 of 18 - Wednesday 20th
March, 2013
This document is for private circulation, and must be read in conjunction with the disclaimer on the last page.
Finally…greater focus on supplementary books by government opens up new avenues for growth
NPIL markets its supplementary books only in private schools in Maharashtra and Gujarat. Recently, NPIL proposed various state government bodies to provide its supplementary books to government school going children so as to get benefit of quality education like students of private schools. This efforts has started paying off as schools under certain departments‟ viz. Tribal, Women and Child Development in Maharashtra have started availing supplementary books from the company. NPIL received orders worth ~`12 crore in FY12 which would be ~`35 crore in FY13. Moreover, it is important to note that there is no dilution in profitability on account of these orders, as the terms are similar to those in the regular publication business. However, the orders from state education department, that holds a significantly large number of public schools, continue to be elusive. Given the current strength of state owned/supported public schools (~62,000 in Maharashtra; 35,000 in Gujarat), any optimistic improvement in order procurement from state education department would result into significant upside to our estimates.
Geographical expansion on cards
Currently, there are no private publishers that have a pan-India presence as the curriculum, languages and evaluation pattern styles are different across states. With the common curriculum initiative on the anvil, NPIL selected Andhra Pradesh (~`120
crore market) as it has the highest proportion of English medium schools in India
NPIL is well placed as compared to its peers in the publication arena
NPIL caters to private state board students covering ~24 mn students every year; 1,50,000+ schools with ~24000 schools physically covered by its 300+ canvassers.
~185+ authors on a royalty program.
Competitive Landscape
Company Titles Revenue
(Rs. cr)Key differentiation
Navneet 5000+ 354 Focus on Supplementary books
MBD Group 2500+ 125 Focus in text books (all subjects)
Ratna Sagar P. Ltd 1500+ 95Focus on CCE editions books (Continuous and
Comprehensive Evaluation)
S. Chand 2000+ 90 Focused player in text books (all subjects)
Jeevandeep Prakashan 1500+ 60Focused player in Textbooks, Workbooks,
Practice Books
Chetana 1000+ 50Focused player in Self study materials and text
books
Oxford 800+ 50Focused player in Academics and General
books under CBSE
Source: NPIL, Ventura Research
- 7 of 18 - Wednesday 20th
March, 2013
This document is for private circulation, and must be read in conjunction with the disclaimer on the last page.
(40%). Over the next 2-3 years, NPIL expects to provide complete list of offering for this region. Also, in Delhi, it caters to the schools of private state boards (Standard I to VII) that follow the CBSE-linked curriculum.
Inorganic foray in school management business
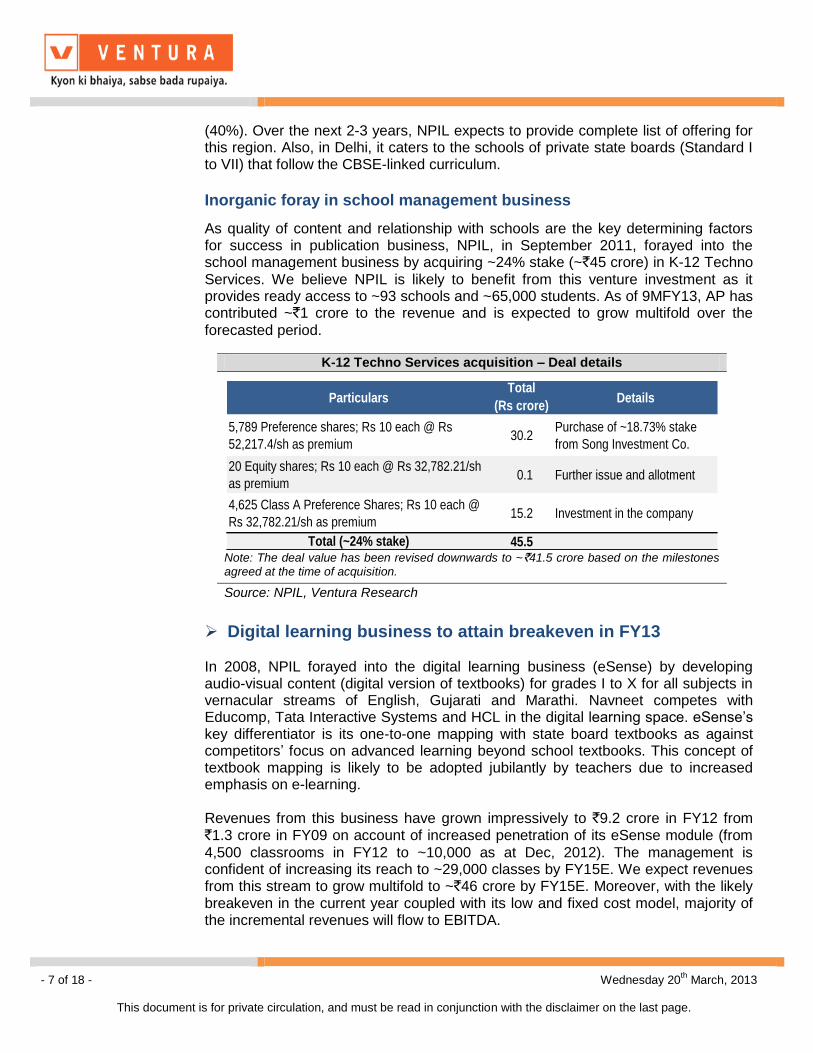
As quality of content and relationship with schools are the key determining factors for success in publication business, NPIL, in September 2011, forayed into the school management business by acquiring ~24% stake (~`45 crore) in K-12 Techno
Services. We believe NPIL is likely to benefit from this venture investment as it provides ready access to ~93 schools and ~65,000 students. As of 9MFY13, AP has contributed ~`1 crore to the revenue and is expected to grow multifold over the
forecasted period.
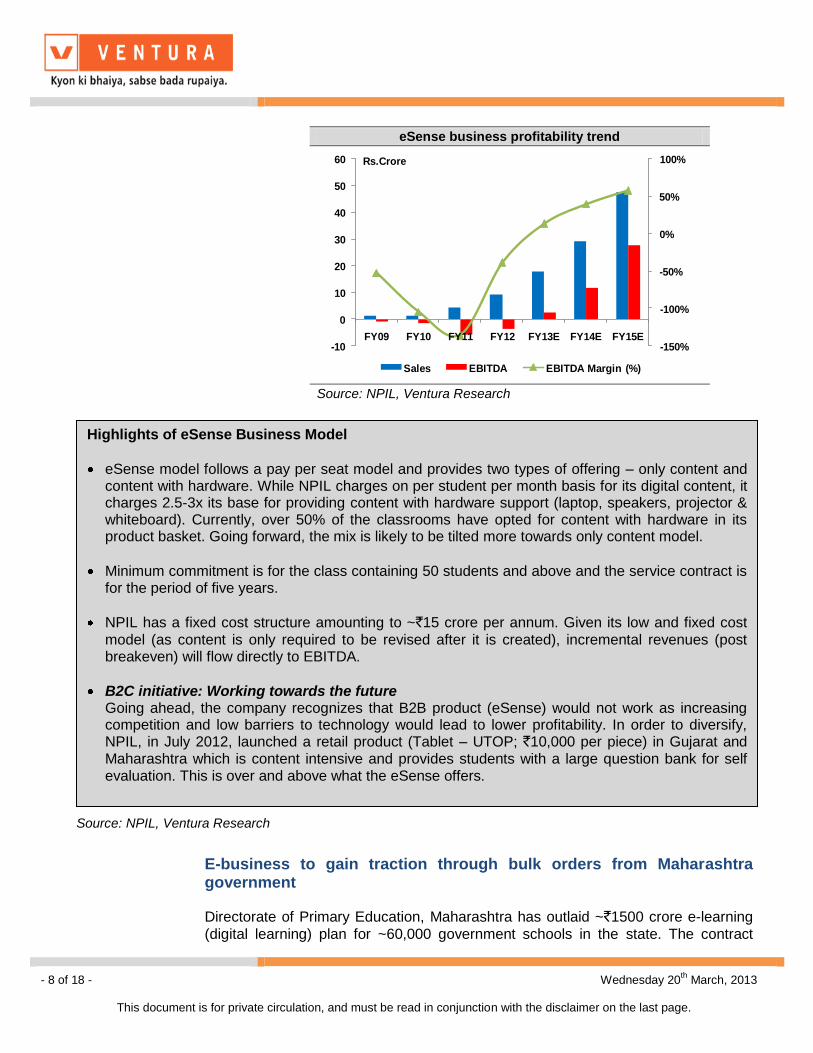
Digital learning business to attain breakeven in FY13 In 2008, NPIL forayed into the digital learning business (eSense) by developing audio-visual content (digital version of textbooks) for grades I to X for all subjects in vernacular streams of English, Gujarati and Marathi. Navneet competes with Educomp, Tata Interactive Systems and HCL in the digital learning space. eSense‟s key differentiator is its one-to-one mapping with state board textbooks as against competitors‟ focus on advanced learning beyond school textbooks. This concept of textbook mapping is likely to be adopted jubilantly by teachers due to increased emphasis on e-learning. Revenues from this business have grown impressively to `9.2 crore in FY12 from `1.3 crore in FY09 on account of increased penetration of its eSense module (from
4,500 classrooms in FY12 to ~10,000 as at Dec, 2012). The management is confident of increasing its reach to ~29,000 classes by FY15E. We expect revenues from this stream to grow multifold to ~`46 crore by FY15E. Moreover, with the likely breakeven in the current year coupled with its low and fixed cost model, majority of the incremental revenues will flow to EBITDA.
K-12 Techno Services acquisition – Deal details
ParticularsTotal
(Rs crore)Details
5,789 Preference shares; Rs 10 each @ Rs
52,217.4/sh as premium30.2
Purchase of ~18.73% stake
from Song Investment Co.
20 Equity shares; Rs 10 each @ Rs 32,782.21/sh
as premium0.1 Further issue and allotment
4,625 Class A Preference Shares; Rs 10 each @
Rs 32,782.21/sh as premium15.2 Investment in the company
Total (~24% stake) 45.5 Note: The deal value has been revised downwards to ~`41.5 crore based on the milestones agreed at the time of acquisition.
Source: NPIL, Ventura Research
- 8 of 18 - Wednesday 20th
March, 2013
This document is for private circulation, and must be read in conjunction with the disclaimer on the last page.
E-business to gain traction through bulk orders from Maharashtra government Directorate of Primary Education, Maharashtra has outlaid ~`1500 crore e-learning
(digital learning) plan for ~60,000 government schools in the state. The contract
Highlights of eSense Business Model
eSense model follows a pay per seat model and provides two types of offering – only content and content with hardware. While NPIL charges on per student per month basis for its digital content, it charges 2.5-3x its base for providing content with hardware support (laptop, speakers, projector & whiteboard). Currently, over 50% of the classrooms have opted for content with hardware in its product basket. Going forward, the mix is likely to be tilted more towards only content model.
Minimum commitment is for the class containing 50 students and above and the service contract is for the period of five years.
NPIL has a fixed cost structure amounting to ~`15 crore per annum. Given its low and fixed cost
model (as content is only required to be revised after it is created), incremental revenues (post breakeven) will flow directly to EBITDA.
B2C initiative: Working towards the future Going ahead, the company recognizes that B2B product (eSense) would not work as increasing competition and low barriers to technology would lead to lower profitability. In order to diversify, NPIL, in July 2012, launched a retail product (Tablet – UTOP; `10,000 per piece) in Gujarat and Maharashtra which is content intensive and provides students with a large question bank for self evaluation. This is over and above what the eSense offers.
eSense business profitability trend
-150%
-100%
-50%
0%
50%
100%
-10
0
10
20
30
40
50
60
FY09 FY10 FY11 FY12 FY13E FY14E FY15E
Rs.Crore
Sales EBITDA EBITDA Margin (%)
Source: NPIL, Ventura Research
Source: NPIL, Ventura Research

- 9 of 18 - Wednesday 20th
March, 2013
This document is for private circulation, and must be read in conjunction with the disclaimer on the last page.
which is to be allocated in phases over three years will be equally split between NPIL and Sundaram Multi Pap entailing ~`750 crore to each party concerned.
NPIL has already received the letter of acceptance from the government. The contract entails 90% of the bill amount to be received in 90 days of billing date. We believe that NPIL will tend to have low working capital requirement as only one third of the cost (involving hardware) will require working capital funding. Moreover, recent experience of NPIL with government provides comfort as far as collection is concerned (collection in 60-65 days as against 90 days credit).
The orders are likely to be allocated in phases over the period of three years. Since its allocation is yet to be announced by the government, we have cautiously not factored them in our model as the awarding of the order will solely depend on the availability of funds with the department. However, we have mulled various scenarios of order receipts and its impact on our earnings estimates which has been detailed in the “Valuation” section below.
After the recent lull, Stationery business is all set for steady growth
NPIL‟s stationery business witnessed muted growth from `230 crore in FY09 to `249
crore in FY12 (~2.8% CAGR) due to severe domestic competition and de-growth in exports. However, owing to the demonstrated revival in the export business, we expect revenues from stationery business to grow at a healthy CAGR of 12.9% to `359 crore by FY15E. Moreover, the company will not be undertaking any fresh capex as it has adequate capacities. In case of capacity constraints, the company has option of outsourcing.
Digital Learning order tendered by Directorate of Primary education
60,000 Schools
having 80,000
classrooms
~Rs 1,500 crore
Tender
40,000 Primary (I-IV)
(1 installation per school)
Directorate of Primary
Education, Maharashtra
20,000 Upper Primary (V-VII)
(2 installation per school)
Source: NPIL, Ventura Research

- 10 of 18 - Wednesday 20th
March, 2013
This document is for private circulation, and must be read in conjunction with the disclaimer on the last page.
Export business to lead the growth in stationery business
Revenues over the period FY09-12 had stagnated due to sequential removal (in FY08 and re-imposition (in FY09) of anti-dumping duty on Indian exports to the US markets. Further, there were delays in procuring orders from giant US retailers due to variety of reasons such as approvals, certifications, etc. However, post satisfaction that the Indian stationery players were not indulging into anti competitive business, the duty got reduced to 4%. Further, the delayed order flows came through leading to a surge in export revenues in FY13. We expect export revenues to grow at a CAGR of 29.5% from `54 crore in FY12 to `118 crore by
FY15E. We have taken a conservative stance and have estimated NPIL to grow at 13% in FY14-15E as against management‟s guidance of above 20%.
Stationery business revenue to grow at a steady pace
230240 244 249
302
329
359
0
50
100
150
200
250
300
350
400
FY09 FY10 FY11 FY12 FY13E FY14E FY15E
Rs.Crore
Source: NPIL, Ventura Research
Exports to sustain momentum on the high base
71 70
54 54
92
104
118
0
20
40
60
80
100
120
140
FY09 FY10 FY11 FY12 FY13E FY14E FY15E
Rs.Crore
Source: NPIL, Ventura Research

- 11 of 18 - Wednesday 20th
March, 2013
This document is for private circulation, and must be read in conjunction with the disclaimer on the last page.
Domestic business continues to face stiff competition On the domestic front, NPIL faces stiff competition from ITC and Camlin in its paper stationery and non paper stationery segment respectively on the back of backward integration advantage with ITC and the aggressive new management of Camlin. NPIL‟s domestic revenues have grown at a CAGR of 17.9% over FY07-12. Owing to continued competitive intensity, we expect revenues from this stream to grow at a 7.3% CAGR to `241.2 crore by FY15E.
Domestic business to grow at a tepid pace
159170
178195
210225
241
0
50
100
150
200
250
300
FY09 FY10 FY11 FY12 FY13E FY14E FY15E
Rs.Crore
Source: NPIL, Ventura Research

- 12 of 18 - Wednesday 20th
March, 2013
This document is for private circulation, and must be read in conjunction with the disclaimer on the last page.
Financial Performance
NPIL‟s revenues grew by a whopping 53.4% to `125 crore in Q3FY13 from `81.5
crore in Q3FY12 primarily led by publication business (+72.8% YoY). Despite seasonally weak quarter, the sharp surge in publication revenue was due to Gujarat state board switching to a semester-based system in which supplementary books were to be sold in two batches – one in Q1FY13 and the other in Q3FY13. This indicated that the growth momentum witnessed in Q1FY13 from publications stream (+17.4% YoY) was stronger than expected. Stationery business grew at a healthy pace of 14.7% YoY to `39.8 crore.
On account of increased scale, EBITDA grew by 308% to `22.8 crore (v/s `7.4
crore) and margins doubled to 18.2% (v/s 9.1% YoY). During the quarter, tax provision was higher at `6.8 crore as against `0.9 crore and as a result grew slower
than EBIT. PAT and PAT margins were at `11.2 crore (v/s `4 crore; +280% YoY) and 9% (+410 bps YoY) respectively.
Quarterly Financial Performance (` in crore)
Particulars Q3FY13 Q3FY12 FY12 FY11
Net Sales 125 81.5 620.2 545.6
Growth % 53.4 13.7
Total Expenditure 102.2 74.1 481.3 420.2
EBIDTA 22.8 7.4 138.9 125.4
EBDITA Margin % 18.2 9.1 22.4 23.0
Depreciation 4.9 3.5 15.1 11.4
EBIT (EX OI) 17.9 3.9 123.8 114.0
Other Income 1 1.9 8.6 8.3
EBIT 18.9 5.8 132.4 122.3
Margin % 15.1 7.1 21.3 22.4
Interest 0.9 0.9 6.9 4.3
Exceptional items 0 0 3.3 0.0
PBT 18.0 4.9 122.2 118.0
Margin % 14.4 6.0 19.7 21.6
Provision for Tax 6.8 0.9 42.0 40.4
PAT 11.2 4.0 80.2 77.6
PAT Margin (%) 9.0 4.9 12.9 14.2
Source: NPIL, Ventura Research

- 13 of 18 - Wednesday 20th
March, 2013
This document is for private circulation, and must be read in conjunction with the disclaimer on the last page.
Financial Outlook
Backed by multiple drivers in publication business, steady growth in stationery business and breakeven in e-Sense, we believe, NPIL is all set to post healthy numbers over the forecasted period. We expect NPIL‟s revenues to grow at a CAGR of 17.5% to `1,022.2 crore in FY15 from `630 crore in FY12. Further, EBITDA
margins are expected to improve from 20.8% to 23.2% by FY15E owing to the expected improvement in e-learning‟s economics. We expect PAT to grow at a CAGR of 21.5% to `139.9 crore in FY15E from `77.4 crore in FY12. PAT margins are expected to improve by 130 bps to 13.7% by FY15E from 12.4% in FY12.
Valuation We initiate coverage on Navneet Publications (India) Ltd (NPIL) as a BUY with a Price Objective of `79 representing a potential upside of ~34.4% over a period of 24 months. At a CMP of `59, the stock is trading at 12.2x and 10.0x its one year
forward earnings for FY14 and FY15 respectively. Historically, the company has traded at an average of 13.5x its one year forward earnings and we have assigned a similar multiple for the valuation purpose. However, we believe that these estimates are conservative given the upside risks that the stock holds which are enumerated below:
1) Probable re-rating due to:
a. Strong visibility of common curriculum implementation b. Increased emphasis on supplementary books by state government c. Increased demand for NPIL‟s stationery in the export market d. Consistent Dividend P/O ratio of above 40% (~2.3% dividend yield) coupled
with consistent ROE of 21% and higher.
NPIL’s revenue & profitability trend
561630 764 884
1022
20.7 20.8 21.6 22.4 23.2
11.9 12.4 12.4
13.0 13.7
-
5.0
10.0
15.0
20.0
25.0
0
200
400
600
800
1000
1200
FY11 FY12 FY13E FY14E FY15E
(%)
Rs.Crore
Revenue EBITDA Margin (RHS) PAT Margin (RHS)
Source: NPIL, Ventura Research

- 14 of 18 - Wednesday 20th
March, 2013
This document is for private circulation, and must be read in conjunction with the disclaimer on the last page.
2) Specific allocation of digital learning orders to boost EPS substantially
While the digital learning order from Maharashtra government (~`750 crore) is spread over the period of 3 years i.e. ~`250 crore p.a., its confirmation/execution
is largely based on the availability of the funds with the state government and therefore we have mulled various scenarios of order allocations over the forecasted years. Given the increased emphasis on education and digital learning, an order receipt of ~`150 crore p.a. could be a possibility (keeping in
mind that the letter of acceptance has already obtained). Considering this probability along with ~10% PAT margin, we expect incremental upside of 3.8 per share in EPS (i.e. 64% above the estimated EPS of `5.9 per share), giving a significant upside of `135 over a period of 24 months which is ~70.3% above our
current target of `79.
Scenario Analysis of Maharashtra Government order and its impact on our estimates
50.0 100.0 150.0 200.0 250.0
Incremental EPS 1.3 2.5 3.8 5.0 6.3
FY14E EPS 4.8 4.8 4.8 4.8 4.8
Revised EPS 6.1 7.4 8.6 9.9 11.1
Upside Risk (%) 26% 52% 78% 104% 130%
FY14EGovt. Order
(Rs cr)
50.0 100.0 150.0 200.0 250.0
Incremental EPS 1.3 2.5 3.8 5.0 6.3
FY15E EPS 5.9 5.9 5.9 5.9 5.9
Revised EPS 7.1 8.4 9.6 10.9 12.2
Upside Risk (%) 21% 43% 64% 86% 107%
FY15EGovt. Order
(Rs cr)
7.1 8.4 9.6 10.9 12.2
12x 85.5 100.6 115.7 130.8 145.9
13x 92.7 109.0 125.4 141.7 158.0
14x 99.8 117.4 135.0 152.6 170.2
15x 106.9 125.8 144.6 163.5 182.3
16x 114.1 134.2 154.3 174.4 194.5
Tg
t P
/E
FY15ERevised
EPS
Source: NPIL, Ventura Research

- 15 of 18 - Wednesday 20th
March, 2013
This document is for private circulation, and must be read in conjunction with the disclaimer on the last page.
P/E
0
20
40
60
80
100
120
140
Mar-03 Mar-05 Mar-07 Mar-09 Mar-11 Mar-13
CMP 7X 10.25X 13.5X 16.75X 20X
Source: NPIL, Ventura Research
P/B
0
10
20
30
40
50
60
70
80
90
100
Mar-03 Mar-05 Mar-07 Mar-09 Mar-11 Mar-13
CMP 1.6X 2.2X 2.8X 3.4X 4X
Source: NPIL, Ventura Research
EV/EBITDA
0
500
1000
1500
2000
2500
3000
Mar-03 Mar-05 Mar-07 Mar-09 Mar-11 Mar-13
EV 5 6.1X 8X 9.9X 11.8X
Source: NPIL , Ventura Research
- 16 of 18 - Wednesday 20th
March, 2013
This document is for private circulation, and must be read in conjunction with the disclaimer on the last page.
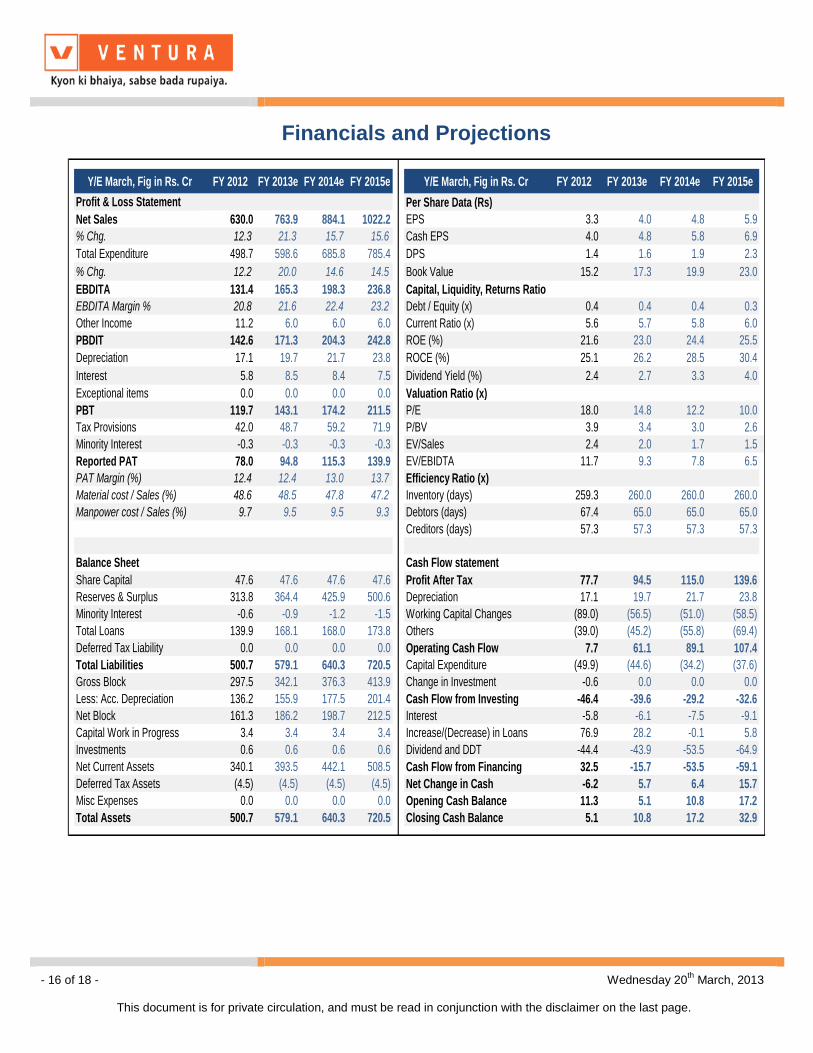
Financials and Projections
Y/E March, Fig in Rs. Cr FY 2012 FY 2013e FY 2014e FY 2015e Y/E March, Fig in Rs. Cr FY 2012 FY 2013e FY 2014e FY 2015e
Profit & Loss Statement Per Share Data (Rs)
Net Sales 630.0 763.9 884.1 1022.2 EPS 3.3 4.0 4.8 5.9
% Chg. 12.3 21.3 15.7 15.6 Cash EPS 4.0 4.8 5.8 6.9
Total Expenditure 498.7 598.6 685.8 785.4 DPS 1.4 1.6 1.9 2.3
% Chg. 12.2 20.0 14.6 14.5 Book Value 15.2 17.3 19.9 23.0
EBDITA 131.4 165.3 198.3 236.8 Capital, Liquidity, Returns Ratio
EBDITA Margin % 20.8 21.6 22.4 23.2 Debt / Equity (x) 0.4 0.4 0.4 0.3
Other Income 11.2 6.0 6.0 6.0 Current Ratio (x) 5.6 5.7 5.8 6.0
PBDIT 142.6 171.3 204.3 242.8 ROE (%) 21.6 23.0 24.4 25.5
Depreciation 17.1 19.7 21.7 23.8 ROCE (%) 25.1 26.2 28.5 30.4
Interest 5.8 8.5 8.4 7.5 Dividend Yield (%) 2.4 2.7 3.3 4.0
Exceptional items 0.0 0.0 0.0 0.0 Valuation Ratio (x)
PBT 119.7 143.1 174.2 211.5 P/E 18.0 14.8 12.2 10.0
Tax Provisions 42.0 48.7 59.2 71.9 P/BV 3.9 3.4 3.0 2.6
Minority Interest -0.3 -0.3 -0.3 -0.3 EV/Sales 2.4 2.0 1.7 1.5
Reported PAT 78.0 94.8 115.3 139.9 EV/EBIDTA 11.7 9.3 7.8 6.5
PAT Margin (%) 12.4 12.4 13.0 13.7 Efficiency Ratio (x)
Material cost / Sales (%) 48.6 48.5 47.8 47.2 Inventory (days) 259.3 260.0 260.0 260.0
Manpower cost / Sales (%) 9.7 9.5 9.5 9.3 Debtors (days) 67.4 65.0 65.0 65.0
Creditors (days) 57.3 57.3 57.3 57.3
Balance Sheet Cash Flow statement
Share Capital 47.6 47.6 47.6 47.6 Profit After Tax 77.7 94.5 115.0 139.6
Reserves & Surplus 313.8 364.4 425.9 500.6 Depreciation 17.1 19.7 21.7 23.8
Minority Interest -0.6 -0.9 -1.2 -1.5 Working Capital Changes (89.0) (56.5) (51.0) (58.5)
Total Loans 139.9 168.1 168.0 173.8 Others (39.0) (45.2) (55.8) (69.4)
Deferred Tax Liability 0.0 0.0 0.0 0.0 Operating Cash Flow 7.7 61.1 89.1 107.4
Total Liabilities 500.7 579.1 640.3 720.5 Capital Expenditure (49.9) (44.6) (34.2) (37.6)
Gross Block 297.5 342.1 376.3 413.9 Change in Investment -0.6 0.0 0.0 0.0
Less: Acc. Depreciation 136.2 155.9 177.5 201.4 Cash Flow from Investing -46.4 -39.6 -29.2 -32.6
Net Block 161.3 186.2 198.7 212.5 Interest -5.8 -6.1 -7.5 -9.1
Capital Work in Progress 3.4 3.4 3.4 3.4 Increase/(Decrease) in Loans 76.9 28.2 -0.1 5.8
Investments 0.6 0.6 0.6 0.6 Dividend and DDT -44.4 -43.9 -53.5 -64.9
Net Current Assets 340.1 393.5 442.1 508.5 Cash Flow from Financing 32.5 -15.7 -53.5 -59.1
Deferred Tax Assets (4.5) (4.5) (4.5) (4.5) Net Change in Cash -6.2 5.7 6.4 15.7
Misc Expenses 0.0 0.0 0.0 0.0 Opening Cash Balance 11.3 5.1 10.8 17.2
Total Assets 500.7 579.1 640.3 720.5 Closing Cash Balance 5.1 10.8 17.2 32.9

- 17 of 18 - Wednesday 20th
March, 2013
This document is for private circulation, and must be read in conjunction with the disclaimer on the last page.
Appendix
Curriculum-based Publishers’ business cycle
Quarter Activities during the quarter Effect on P&L and Balance Sheet
Oct–Dec (Q3)
1) Enters into paper purchase contracts
2) Printing activity starts
3) Sales - ~14%
1) Huge manufacturing exp
2) Inventory rises
Jan–Mar (Q4)
1) Printing activity continues
2) Marketing activity starts for next academic year
3) Sales - ~15%
1) Huge marketing expenses
2) Inventory at its peak
3) ST borrowings from banks
Apr–June (Q1)
1) Printing activity continues
2) Sales - ~50-55%
1) Highest revenue amongst all quarters
2) Major profits realized
Jul–Sep (Q2)1) Major debtors realized
2) Sales - ~16-18%
1) Thin Balance Sheet
Source: NPIL, Ventura Research
- 18 of 18 - Wednesday 20th
March, 2013
This document is for private circulation, and must be read in conjunction with the disclaimer on the last page.
Ventura Securities Limited Corporate Office: C-112/116, Bldg No. 1, Kailash Industrial Complex, Park Site, Vikhroli (W), Mumbai – 400079 This report is neither an offer nor a solicitation to purchase or sell securities. The information and views expressed herein are believed to be reliable, but no responsibility (or liability) is accepted for errors of fact or opinion. Writers and contributors may be trading in or have positions in the securities mentioned in their articles. Neither Ventura Securities Limited nor any of the contributors accepts any liability arising out of the above information/articles. Reproduction in whole or in part without written permission is prohibited. This report is for private circulation.