Navigating the Market
48
NOVEMBER 18, 2013 A comparison of spending on financial education and financial marketing Navigating the Market
Transcript of Navigating the Market
NOVEMBER 18, 2013
A comparison of spending on financial education and financial marketing
Navigating the Market
2 CONSUMER FINANCIAL PROTECTION BUREAU
Table of contents Executive summary ..................................................................................................... 3
1. Background ........................................................................................................... 4
2. Scope of the study ................................................................................................ 5
3. Findings ................................................................................................................. 8
3.1 Annual financial education spending ....................................................... 8
3.2 Financial services industry marketing spending .................................... 17
4. Conclusion .......................................................................................................... 24
Appendix A: SUMMARY OF METHODOLOGY .................................................... 25
3 CONSUMER FINANCIAL PROTECTION BUREAU
Executive summary The Consumer Financial Protection Bureau (the CFPB) looked at the information sources consumers are exposed to when they make financial decisions. Empowering
consumers to make the financial decisions that will help them meet their own life goals is a
critical part of the mission of the CFPB. To understand the wide range of information sources
consumers could be exposed to in making financial decisions, the CFPB commissioned a study
of the size and scope of the financial information field.* The results give an overall indication of
the relative amounts spent in the U.S. on financial education and on the marketing of certain
types of financial products. Though the results should not be treated as precise measures of
spending, we hope the study encourages further research and stimulates discussion on the scope
and role of financial education.
In the U.S. economy, billions of dollars are spent on financial industry marketing efforts, about 25 times more than is spent on financial education. The study found
that approximately $670 million is spent annually on providing financial education by federal,
state, and local governments, financial institutions, nonprofit organizations, charitable
foundations, and others. At the same time, the financial services industry spends approximately
$17 billion annually marketing consumer financial products and services (not counting
marketing of products related to retirement, college loans, and other investments). While the
study does not explore the effect of this spending disparity on consumer decisions, it provides a
meaningful comparison when we consider consumers’ financial educational needs.
As a nation, we spend about two dollars per person per year on financial education. The $670 million in spending translates to a little more than $2 per person per
year on financial education in the U.S. (Note that this figure should be treated as a general order
of magnitude of spending rather than a precise estimate, as this number is derived from a
modeling methodology with specific assumptions detailed below). In comparison, the $17
billion in financial services marketing translates to about $54 per person per year.
* The research and analysis described in this report was conducted by the Boston Consulting Group
under contract with the Consumer Financial Protection Bureau.
4 CONSUMER FINANCIAL PROTECTION BUREAU
1. Background The Dodd-Frank Wall Street Reform and Consumer Protection Act of 2010 established the
Consumer Financial Protection Bureau (the CFPB) to regulate the offering and provision of
consumer financial products or services under federal consumer financial laws. The Act also
established the Office of Financial Education within the CFPB, which is responsible for
developing and implementing initiatives intended to educate and empower consumers to make
better informed financial decisions.
The Office of Financial Education works to promote effective and high-quality financial
education for American consumers. To do this, it is helpful to understand the size and scope of
today’s financial information marketplace in order to calibrate financial education efforts in the
context of the broad array of financial information consumers receive.
Financial information comes to the U.S. public from many sources, including nonprofit
organizations, financial institutions, governmental agencies, and others. Before this study, we
had limited data about the scope and scale of the efforts put forth through these sources,
especially the total dollar amount spent to reach consumers.
Beyond just the amount of information received, an important consideration from the
consumer’s perspective is the information’s purpose. Some information is intended to educate
consumers, and some is intended to drive a purchase decision. To better understand the
influences on consumer behavior, we examined and compared these information sources.
5 CONSUMER FINANCIAL PROTECTION BUREAU
2. Scope of the study We have investigated the size and scope of financial information provided to consumers in the
United States by estimating how much is spent on providing financial information. We divided
financial information into two categories: financial education and financial services marketing.
We defined financial education for the purposes of this study as follows:
Financial Education represents a process of lifelong knowledge and skills development required to achieve financial literacy, learn to mitigate financial risks, protect assets and ensure on-going effective management of one's savings, credit, debt, housing and other resources to maximize financial well-being of individuals and society.
We took a one-year snapshot of spending in the United States on financial education. We
included services such as housing counseling, credit counseling, school-based financial
education, financial counseling and coaching, and community-based financial education.
We excluded spending related to investments, insurance, retirement assets and planning, and
college loans, aid, and planning. We also excluded financial education that is directly paid for by
the consumer, such as money spent on fee-based financial planning, fee-based credit counseling,
and books on financial topics. And, we excluded fixed costs, such as the salaries of
schoolteachers who provide financial education as part of the courses that they teach.
In addition, the study separated out spending that directly supports the provision of financial
education to consumers from spending that supports the financial education field. Direct
provision of financial education includes costs associated with services that directly serve
consumers, such classes and workshops, one-on-one coaching and counseling, informational
website and brochures for consumers, and the like. Supporting services include services such as
funding to other organizations (including those that directly provide financial education),
technical assistance, training, research and evaluation services, conferences, etc., that help
financial education service providers do their work. The delineation between these two types of
financial education services is not always completely crisp, and in some cases these services
cannot be easily separated in practice. For example, it is sometimes not possible to get data that
6 CONSUMER FINANCIAL PROTECTION BUREAU
separates the cost of developing a financial education curriculum from the cost of using it with
consumers. As such, the estimates documented here are necessarily imprecise, but we think it is
a useful analytic framework to distinguish between direct service and supporting services.
In this analysis, we focused primarily on estimating the spending on direct provision of financial
education. We do not provide a detailed estimate of the total amount of spending on support
services or a total estimate of direct services and support services together, in part due to the
difficulty of getting an estimate that accurately separates out funding from other types of
supporting services. If funding is not separated out, it will be double-counted in both direct and
supporting services, leading to an erroneous estimate.
However, the limited focus in this report on supporting services does not imply that these
services are unimportant. Both of these types of activities – the direct provision of financial
education to consumers and the funding, technical assistance, training, research and evaluation,
conferences, etc., that help financial education service providers do their work – are crucial
components of effectively assisting consumers manage their financial lives.
First, the study looked at providers and funders of financial education, including:
Federal government
State governments
Local governments
School districts
Nonprofit organizations
Financial institutions
Private philanthropies
Because comprehensive data sources on financial education do not currently exist, we estimated
the amount each of these sources spent on financial education by using a methodology that
included interviews with experts, public data, 990 tax form data, and other sources to create
models to estimate spending by sector. (See the Appendix for a full description of the
methodology). Because this is an estimate based on a modeling methodology, the findings
should be treated as a general order of magnitude of spending rather than as a precise number.
Next, the study estimated the amount spent by the financial services industry on marketing
products and services to consumers. The team further analyzed spending by channel (for
example, television, radio, and newspapers) and product type (for example, credit cards). As

7 CONSUMER FINANCIAL PROTECTION BUREAU
with the financial education estimate, the marketing analysis excluded spending related to
investments, insurance, retirement assets and planning, and college loans, aid, and planning.
We found it was relatively straightforward to analyze spending on marketing, since the industry
has established standard measurement techniques. We examined awareness advertising and
direct marketing. Awareness advertising tends to reach audiences through traditional channels,
such as television, radio and newspapers, while direct marketing spend includes such efforts as
Internet advertising, direct mail, and other methods aimed at prompting individuals to make an
immediate purchase or at generating leads. The total of these two types gives us an estimate of
the overall dollar amount spent by financial institutions on promoting consumer financial
products.
Note that the spending estimates across all sectors are not drawn from the same calendar year,
due to limitations in data sources. For example, the federal government spending data is 2010
data, drawn from a U.S. General Accounting Office report that gathered data from 2010. The
nonprofit data is primarily from tax year 2011, as that is the most recent data available from the
Internal Revenue Service. The financial services marketing data is primarily 2012 data. Data
from other sectors are drawn from a range of several years, in all cases using the most recent
data available. Because the data by sector is not all from the same year, caution should be used
in comparing the annual spending sources presented below.

8 CONSUMER FINANCIAL PROTECTION BUREAU
3. Findings
3.1 Annual financial education spending Using the methodology discussed above and further detailed in the appendix, we found that
annual spending on direct provision of financial education in the U.S. totaled approximately $670 million. This number provides a sense of the order of magnitude of
financial education spending in the United States, not a precise measure.
There are many thousands of individual providers of financial education, and there is currently
no straightforward way to uncover and aggregate their budgets and spending. Therefore, as part
of the study, we developed assumptions and a model to estimate the total spending from the
nation’s many financial education providers. (See the Appendix for a full description of the
methodology). We hope that further investigation and discussion can refine the estimate and
provide a deeper understanding of financial education spending.
Spending on financial education comes from multiple sources, as detailed below.
FEDERAL GOVERNMENT The federal government spends approximately $230 million on financial education; of this total, approximately $130 million is spent on direct provision of financial education. The remaining $100 million is spent on supporting services around
financial education, including services such as grants and contracts to other organizations
(including those that directly provide financial education), technical assistance, training, and
research.

9 CONSUMER FINANCIAL PROTECTION BUREAU
To estimate the federal government's contribution to the overall financial education market in
the United States, we relied on a 2012 U.S. General Accounting Office (GAO)1 report that
provided spending estimates for the majority of federal agencies with presence in this area of
work. To preserve data consistency and comparability of baseline results, we utilized the 2012
GAO Report spending levels, with two key caveats:
The 2012 GAO Report relied on FY 2010 data; thus, the numbers reported do not reflect
changes in agency spending since then.
The Report provided estimates based on assessments by federal agency staff, which were
not always consistent across different agencies. For examples, agencies took different
approaches as to whether staff time, costs of contracts, printing, etc. were included.
In addition to 2012 GAO Report estimates, we added the CFPB contribution to financial
education of approximately $26 million based on the FY2013 budget. (As the CFPB was not in
existence in 2010, we could not use a 2010 figure to be comparable to the GAO numbers).
We estimated the breakdown of federal spending into direct service and supporting services
categories by examining publically available program descriptions and interviews with agency
staff.
Our research found that the federal spending on financial education is heavily concentrated on
housing-related services, such as housing counseling and foreclosure mitigation. Some of the
federal housing-related support included in the estimate is time-limited in nature; for example,
the National Foreclosure Mitigation Counseling Program is a time-limited program.
1 GAO, Report to Congressional Committees on Financial Literacy – Overlap of Programs Suggests There May Be
Opportunities for Consolidation. GAO-12-588 (Washingt0n, DC: Jul. 23, 2012). Note that in its April 2013 report
on duplication of federal programs, GAO did not include financial literacy. The report noted that its overall
assessment of the two financial literacy areas is that they have been “addressed, meaning all actions needed in that
area were addressed.” GAO, 2013 Annual Report: Actions Needed to Reduce Fragmentation, Overlap, and Duplication and Achieve Other Financial Benefits. GAO-13-279SP (Washington, DC: April 2013).
10 CONSUMER FINANCIAL PROTECTION BUREAU
STATE GOVERNMENT State governments spend approximately $67 million on financial education. Of this total, approximately $7 million is spent on direct provision of financial education. The remaining $60 million is spent on supporting services around financial
education, including services such as funding to other organizations (including those that
directly provide financial education), technical assistance, training, and research.
We conducted analysis to identify spending on financial education in all 50 states as well as the
District of Columbia. For each state, a database-driven search of recent news reports was
supplemented with more detailed research on state budgets and legislative updates. A state-by-
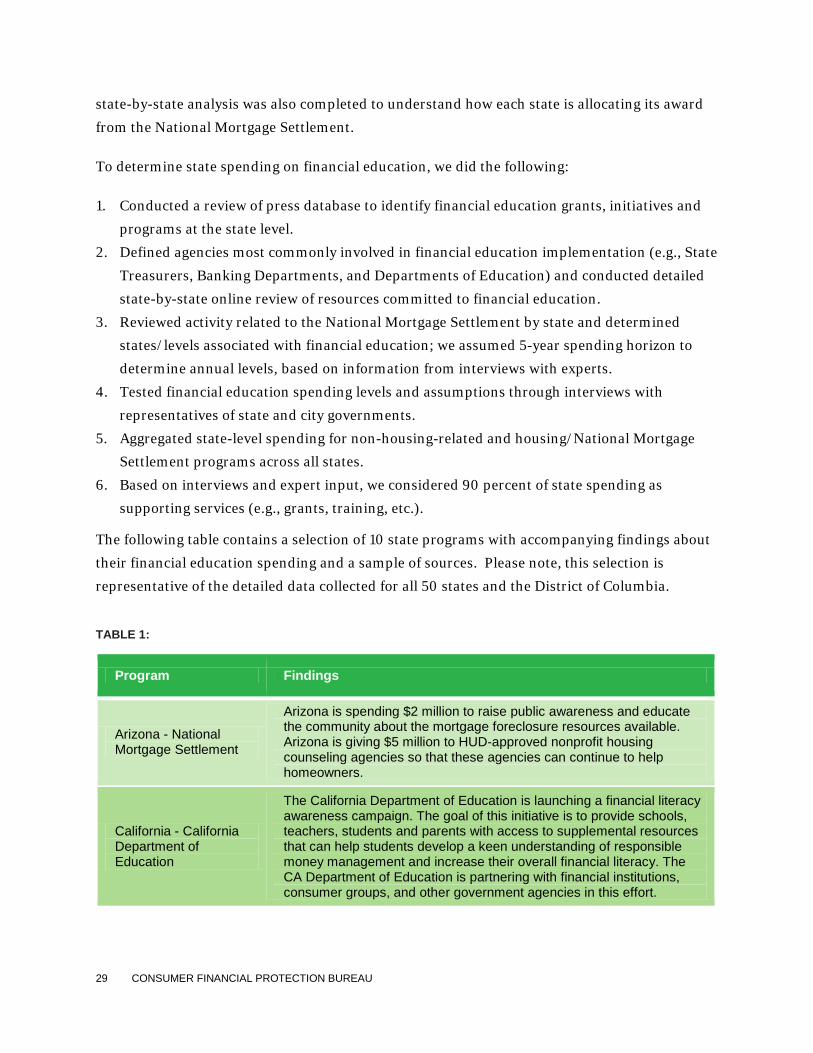
state analysis was also completed to understand how each state is allocating its award from the
National Mortgage Settlement. In addition, we supplemented this data through interviews with
a small group of state and city government officials. Based on interviews and expert input, we
considered 90 percent of state spending as supporting services (e.g., grants, training, etc.).
A significant portion of state spending is derived from the National Mortgage Settlement funds
that many states have been using for housing-related financial education, including housing
counseling and foreclosure mitigation counseling. For the purposes of this study, the funding
was assumed to be spread over a five-year period, as interviews and expert input suggested that
many states would be spending these funds over this length of time. Thus, one-fifth of states’
spending on financial education from this source was considered the annual spending. As these
resources represent a one-time source of funding, states’ funding of financial education after
this five-year investment may be significantly lower.
MUNICIPAL AND SCHOOL DISTRICT FUNDING Municipal governments and school districts together spend approximately $46 million on financial education. Of this total, approximately $31 million is spent on direct provision of financial education. The remaining $19 million is spent on supporting
services around financial education, such as funding to other organizations (including those that
directly provide financial education), technical assistance, training, and research.
Municipal government To assess local government investments in financial education, we conducted interviews with
representatives of city governments across the country. Findings from these interviews

11 CONSUMER FINANCIAL PROTECTION BUREAU
suggested notable disparities in levels of attention and resources devoted to financial education
among cities.
New York City provided an example of a high level of local government support for financial
education supported by a stable funding stream through a dedicated levy, raising approximately
$2,500,000 per year for the city of 8.2 million inhabitants. However, even at this level of
funding, per capita local government expenses for financial education amount to approximately
thirty cents per person annually.
Our analysis suggested that New York City level of expenditures represents the upper bound for
local government support provided to financial education. If New York's funding level of
approximately thirty cents is extrapolated to the United States population of 313 million, total
local government funding available across the country could reach as high as $94 million.
To estimate the lower bound of local government resources devoted to financial education, we
assumed that every township/town, municipality and county invests $1,000 per year. With
38,917 local government entities across the country, this assumption yielded the nation-wide
lower bound local government spending for financial education of $39 million.
Overall, we estimate that local government funding for financial education amounts to $39-94
million per year. We have opted to use the lower boundary for our overall municipal estimate,
as our analysis suggests that New York City is an outlier in providing significant spending on
financial education because of its dedicated levy, and spending levels across other cities appears
to be much lower.
Using this lower boundary, based on expert interviews, we estimated that $31 million of the $39
million was used for direct provision of financial education by local governments.
School districts To assess additional funding available for financial education and provided through individual
school districts, we conducted a series of interviews with secondary school education
professionals representing school systems, academia, city governments and the non-profit
community. The interviews aimed to identify a range of funding levels, with the following
caveats:
Teachers' salaries and other personnel expenses are out-of-scope.
12 CONSUMER FINANCIAL PROTECTION BUREAU
The study does not account for portions of textbooks and other materials that may
contain financial education components (e.g. economics textbooks containing financial
education concepts).
Thus, we are estimating spending on school-based financial education beyond the important
efforts teachers may be making in a classroom setting in many places.
In general, the interviews revealed that only minimal funding, beyond funds spent on teacher
salaries or textbooks that include financial education, is available for financial education at the
school district level. Interviews also revealed that some financial education in schools is
provided or enabled by nonprofit organizations, financial institution staff, or others. As this is
not paid for by the school districts, those efforts are not captured in this section but appear in
the relevant spending estimates for other sectors.
However, we identified examples of financial education funding at the school district level that
supported professional development opportunities around financial education for teachers.
Typically this entails covering travel, registration fees, stipends, substitute teacher expenses and
other related items to support teachers attending financial education training. Based on what
we heard in interviews, we made several assumptions to estimate the amount of these financial
education expenses available through school districts:
The average financial education teacher training costs about $500/teacher.
The average school district sends 1-3 teachers to these trainings per district/year.
Thus, the average spending on financial education teacher training amounts to $500-
1,500 per district/year. All of this spending is considered to be supporting services.
Based on 2012 Digest of Education Statistics, there are currently 13,588 school districts across
the United States. With $500-1,500 invested in financial education teacher training by every
district, the total financial education spending by school districts amounts to $7-21 million per
year.
FINANCIAL INSTITUTIONS Financial institutions spend approximately $160 million on financial education. Of this total, approximately $31 million is spent on direct provision of financial education. The remaining $129 million is spent on supporting services around financial
education, such as funding to other organizations (including those that directly provide financial
education), technical assistance, training, and research.
13 CONSUMER FINANCIAL PROTECTION BUREAU
Financial institutions, typically through their charitable foundations, contribute funding to
other organizations that directly provide financial education to consumers. In addition, many
financial institutions provide some financial education directly; for example, their staff may
participate in community financial education sessions, or they may create financial education
materials for consumers. While we did not count the monetary value of in-kind staff time, we
did include other costs associated with such efforts, such as tools and materials used by staff in
directly providing financial education.
To estimate spending on financial education by financial institutions, we gathered information
via interviews with representative firms and supplemented this with data gathered from publicly
available sources. We then extrapolated from the spending by representative firms to estimate
spending for the broader sector. Specific steps included the following:
We interviewed banks among the top 15 largest in the U.S. and captured specific
information on the expenditures and reach of their financial education initiatives.
We reviewed press coverage, annual reports, and Corporate Social Responsibility reports
for financial education-related initiatives of other financial institutions including banks,
audit and advisory firms, and credit card companies.
Based on these sources, we isolated actual spending on financial education from other
contributions such as labor hours and in-kind donations.
We estimated bank spending on financial education based on the known investments of
eight of the top 15 banks using the proportion of their assets to the total assets in the U.S.
banking sector as a basis for extrapolation.
We estimated financial education spending in the audit/advisory sector based on known
commitments from the Big 4 audit/advisory firms using their share of overall U.S.
market to extrapolate.
We captured spending of large credit card companies without having to engage in
extrapolation.
From data gathered in interviews, we estimated that 20% of financial institution
spending on financial education is allocated to direct provision of services with the
remaining 80% allocated to supporting services.
14 CONSUMER FINANCIAL PROTECTION BUREAU
PRIVATE PHILANTHROPIES Philanthropic giving related to financial education exceeds $40 million. All of this
funding falls into the category of supporting services for financial education, as opposed to
direct provision of services.
Private philanthropic foundations contribute to the cause of financial education over and above
resources provided by foundations linked to banks and other financial institutions. To develop
an estimate of private foundation giving to financial education, we reviewed 2012 grant-making
data for all foundations included in the list of the top 50 largest foundations by size of their asset
base. Our review of 2012 data at the level of individual grants and associated descriptions of
purpose and intent enabled the team to suggest that the top 50 foundations provide at least $40
million of contributions to financial education. Funding levels are likely higher if private
foundations outside of the top 50 are taken into account.
Note that philanthropic giving is considered supportive services; thus, this estimate is not
included in the overall direct spending estimate above. The philanthropic funding that
supports direct provision of financial education by non-profit organizations is captured in the
spending estimates for non-profit organizations (see below).
NON-PROFIT ORGANIZATIONS Non-profit organizations spend approximately $550 million on financial education; of this total, approximately $472 million is spent on direct provision of financial education. The remaining $78 million is spent on supporting services around
financial education, such as grants, training, research, and other services.
Our analysis of non-profit organizations included the following four categories:
National/state-level non-profit organizations
Industry/trade associations and coalitions
Community-based groups and clubs
Faith-based organizations
To analyze financial education spending by all four categories of non-profit organizations, we
conducted a top-down assessment of financial education spending, created a comprehensive
database of non-profit spending data, and classified each non-profit organization along several
dimensions. We created assumptions for each classification and applied them to the database in
15 CONSUMER FINANCIAL PROTECTION BUREAU
order to estimate total non-profit spending on financial education as well as breakdowns for
direct service provision vs. supporting functions. Specific steps included the following:
We identified an initial list of approximately 30 leading non-profit organizations in the
financial education field based on CFPB staff knowledge and contacts.
We searched a database of Form 990 tax filings using National Taxonomy of Exempt
Entities (NTEE) codes applicable to financial education, and also using selected key
words. (A list of these NTEE codes and key words can be found in the Appendix). Most
of this data is from tax year 2011, although in some cases tax data is from a previous
year.
By combining the list of approximately 30 key organizations with the list generated by
the 990 tax filing search, we created a list of approximately 1,200 entities with over $30
billion in combined annual expenses. This list included both large and small non-profit
organizations.
Based on information gathered via interviews with CFPB and other organizations, we
reviewed the full list to remove out-of-scope organizations. We also combined
organizational families and national associations into a single parent entity.
We then categorized non-profits on this list into organization types
National or State Level Trade Associations & Coalitions Community-Based Faith-Based
We then classified each organization based on mission focus on financial education and
created assumptions for each category to determine the estimated portion of total
spending allocated to financial education. (More details on this process are included in
the full methodology included as an Appendix).
We used a modified classification scheme for credit counseling organizations. Since a
significant proportion of the budgets of some of these organizations are raised through
client fees, and self-funded financial education is out of scope for this study, we removed
from the list the credit counseling agencies that receive almost all of their revenue from
fees. For credit counseling agencies that also provide other types of free financial
education services, we estimated, based on interviews and other data sources, that 15%
of their overall budgets were not generated by client fees.
16 CONSUMER FINANCIAL PROTECTION BUREAU
Combining all of the above data into one model, we estimate that the collective annual
spending on financial education by nonprofit organizations is approximately $550
million.
We reviewed the full list of entities on an organization-by-organization basis to
determine distributions of spending by service type (i.e., direct versus supporting
services).
SUMMARY OF FINANCIAL EDCUATION SPENDING We then summed up the spending on direct provision of financial education by all of these
sectors – federal government, state government, municipal government, school districts,
nonprofits, and financial institutions. (Private philanthropies and school districts were not
included as all of their spending is considered supporting services).
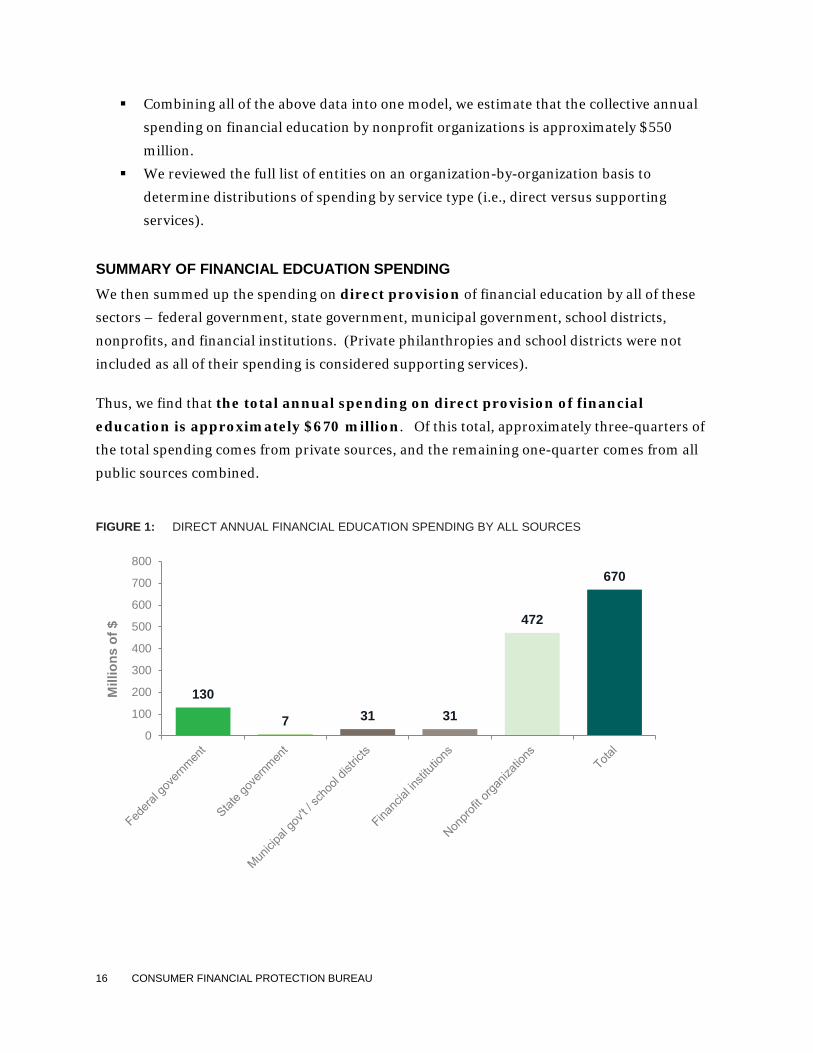
Thus, we find that the total annual spending on direct provision of financial education is approximately $670 million. Of this total, approximately three-quarters of
the total spending comes from private sources, and the remaining one-quarter comes from all
public sources combined.
FIGURE 1: DIRECT ANNUAL FINANCIAL EDUCATION SPENDING BY ALL SOURCES
130
7 31 31
472
670
0
100
200
300
400
500
600
700
800
Mill
ions
of $
17 CONSUMER FINANCIAL PROTECTION BUREAU
Note that the total spending across all sectors cannot be added to get an accurate total of both
direct service and supporting services for financial education. The supporting service
component of this analysis includes funding that is given to other organizations, and that
spending may then also be captured in the direct service budgets for those organizations, or in
the supporting services provided by those organizations. Thus, summing the overall direct
provision spending and the support service spending would contain a very significant amount of
double counting. Removing double-counting from the supporting services spending category
would require significant additional analysis that is beyond the scope of this study.
Looking at annual spending on financial education on a per capita basis, the nation spends just
above two dollars per person per year on financial education from both public and
private sources (based on our $670 million estimate of annual spending and the current U.S.
population of approximately 314 million people).2
3.2 Financial services industry marketing spending
We then turned to the spending by financial service providers to market their products. This
marketing constitutes another source of information that consumers are exposed to when
making financial decisions. We found that the total amount spent annually by financial institutions and other financial service providers on consumer financial products and services, including both awareness advertising and direct marketing, is approximately $17 billion.
2 We augmented the estimates with a detailed study of the financial education infrastructure in two cities, Baltimore
and New York City. We selected these cities as they represent examples of cities that have strong financial education
providers and services. Looking at the budgets of the major providers of financial education (funded by a
combination of all the sectors listed above, including funds from multiple levels of government, financial institutions,
etc.), we found that spending on financial education in these cities was between $1 and $2.40 per person per year. The additional detail from the city level provides validation of the national total, as the order of magnitude of financial
education spending at the city level ($1 to $2.40) is in the same range as the national estimate of financial education
spending (just above $2).
18 CONSUMER FINANCIAL PROTECTION BUREAU
The marketing spending analysis followed the same scope guidelines used for the financial
education spending analysis above (i.e., spending related to investments, insurance, retirement
assets and planning, and college loans, aid, and planning were excluded).
We obtained comprehensive data and developed robust assumptions covering the full scope of
the analysis for a single year (2012). All channel-specific and product-specific findings pertain
to the full calendar year 2012.
Using methods detailed below and in the Appendix, we developed an estimate of the dollar
amount spent by the financial services industry on marketing consumer financial products. We
further analyzed the marketing spending and delineated spending by channel (e.g., TV, radio,
newspapers) and product type (e.g., credit cards).
We segmented the analysis into general awareness advertising spending and direct marketing
spending. Awareness advertising tends to reach audiences through traditional channels, such as
television, radio and newspapers, while direct marketing includes such channels as Internet
display advertising, direct mail and other methods aimed at prompting individuals to make an
immediate purchase or generate a lead.
AWARENESS ADVERTISING SPENDING Financial services providers spend approximately $5.5 billion on awareness advertising annually. Based on the methodology detailed below and in the Appendix, we
found that the financial service providers spent approximately $5.5 billion on awareness
advertising per year (based on a one-year sample). Awareness advertising includes delivering
general promotional messages not intended for immediate sales of products, through channels
such as television, radio, newspapers, and the like.
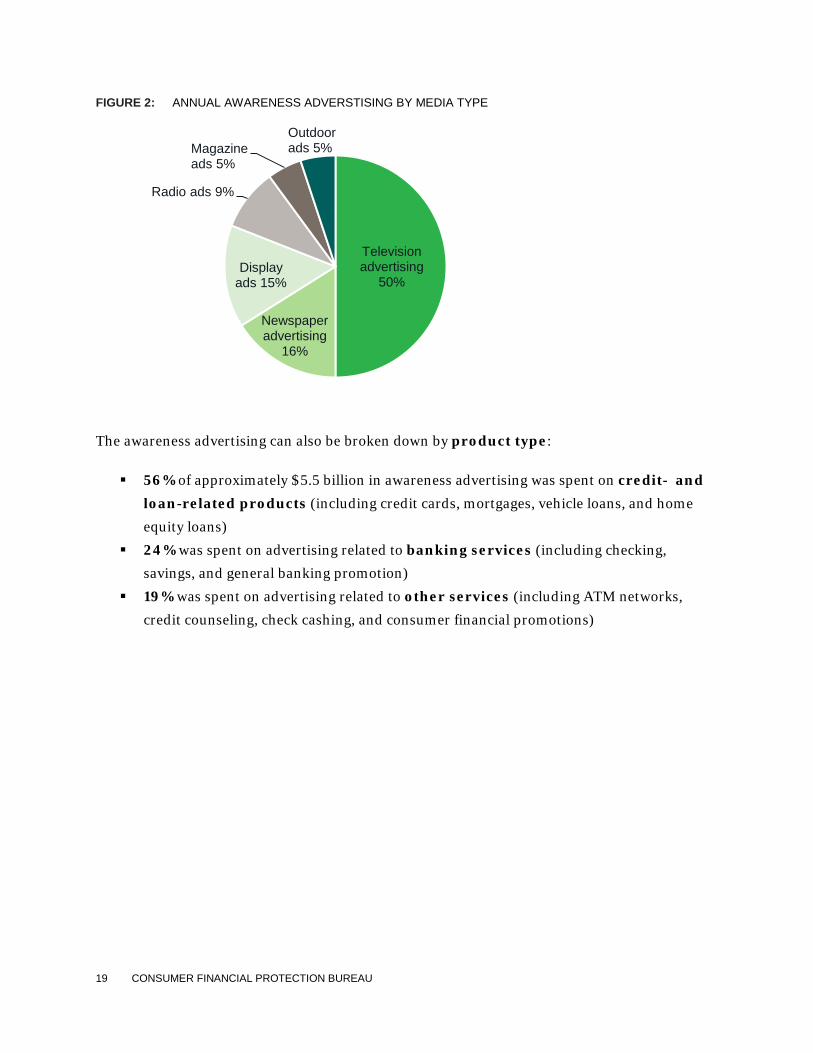
We found that awareness advertising spending on financial products and services broke down
by media type in the following way:
50% of the $5.5 billion was spent on television advertising
16% was spent on newspaper advertising
15% was spent on display ads
9% was spent on radio ads
5% was spent on magazine ads
5% was spent on outdoor ads (for example, billboards)
19 CONSUMER FINANCIAL PROTECTION BUREAU
FIGURE 2: ANNUAL AWARENESS ADVERSTISING BY MEDIA TYPE
The awareness advertising can also be broken down by product type:
56% of approximately $5.5 billion in awareness advertising was spent on credit- and loan-related products (including credit cards, mortgages, vehicle loans, and home
equity loans)
24% was spent on advertising related to banking services (including checking,
savings, and general banking promotion)
19% was spent on advertising related to other services (including ATM networks,
credit counseling, check cashing, and consumer financial promotions)
Television advertising
50%
Newspaper advertising
16%
Display ads 15%
Radio ads 9%
Magazine ads 5%
Outdoor ads 5%

20 CONSUMER FINANCIAL PROTECTION BUREAU
FIGURE 3: ANNUAL AWARENESS ADVERSTISING BY PRODUCT TYPE
FIGURE 4: COMPARISON OF ANNUAL AWARENESS ADVERTISING BY PRODUCT CATEGORY
More than 40% of the approximately $5.5 billion spent on awareness advertising is spent on
marketing credit cards. When the marketing of other products such as mortgages and vehicle
loans are added, more than half of awareness advertising spending is devoted to credit products,
as opposed to other banking and financial services.
To develop the estimates presented above, we took the following steps:
We obtained granular campaign-specific data for awareness advertising campaigns
conducted by financial institutions across the U.S. in 2012.
2.1
0.3 0.1 0.1
0.5
0.1 0.1
0.6 0.6 0.6
0.2 0.0
0.2
0.0
0.5
1.0
1.5
2.0
2.5
Other services spending
Bill
ions
of $
Credit and loan related spending
Banking services spending
3.1
1.4
0.1
5.5
0.0
1.0
2.0
3.0
4.0
5.0
6.0
Credit and loanspending total
Bankingservices total
Other servicestotal
Total of allannual
awarenessadvertising
Bill
ions
of $
21 CONSUMER FINANCIAL PROTECTION BUREAU
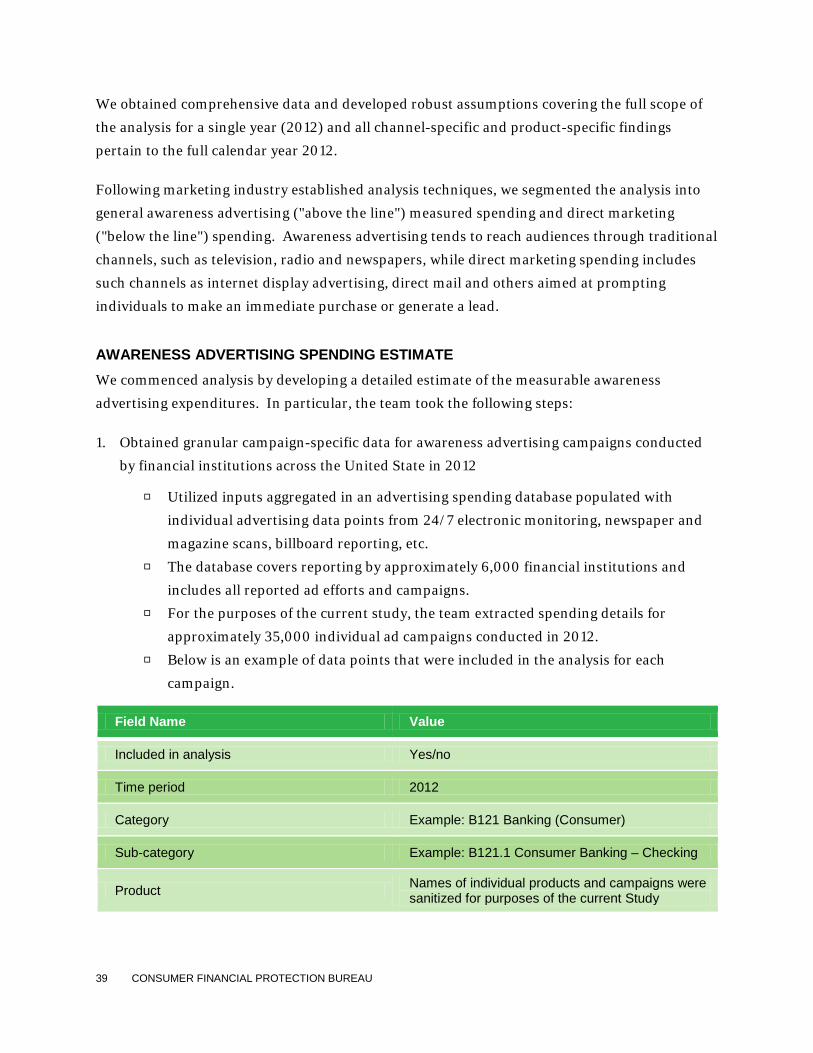
We utilized data aggregated in an advertising spending database populated with
individual advertising data points from 24/7 electronic monitoring, newspaper and
magazine scans, billboard reporting, etc. The database covers reporting by approximately 6,000 financial institutions and
includes all reported ad efforts and campaigns. For purposes of the current study, the team extracted spending details for
approximately 35,000 individual ad campaigns conducted in 2012.
We removed business product spending items (e.g., corporate credit card ads), and spot
checked and correlated with AdAge reporting for key financial institutions
We aggregated individual campaign entries for key general advertising channels:
TV Magazines Newspapers Radio Display Outdoor
We developed full year 2012 total estimates for each channel and a grand total for all
awareness advertising.
We delineated awareness advertising data by product type (e.g., mortgage loans, vehicle
loans, home equity loans, general banking services).
We reviewed marketing expense patterns for 100 Top U.S. advertisers and financial
institutions appearing on the Top 100 list and determined that awareness advertising
accounts for 30-50% of the spending with the remaining portion captured through direct
marketing expenses.
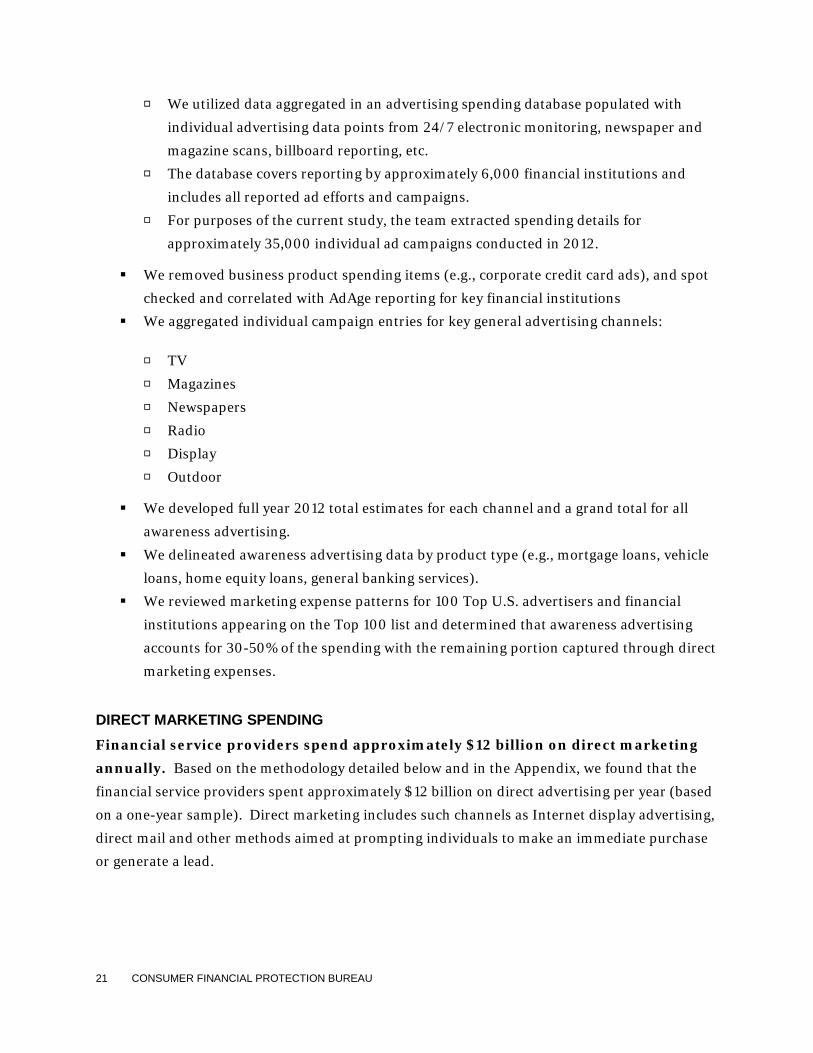
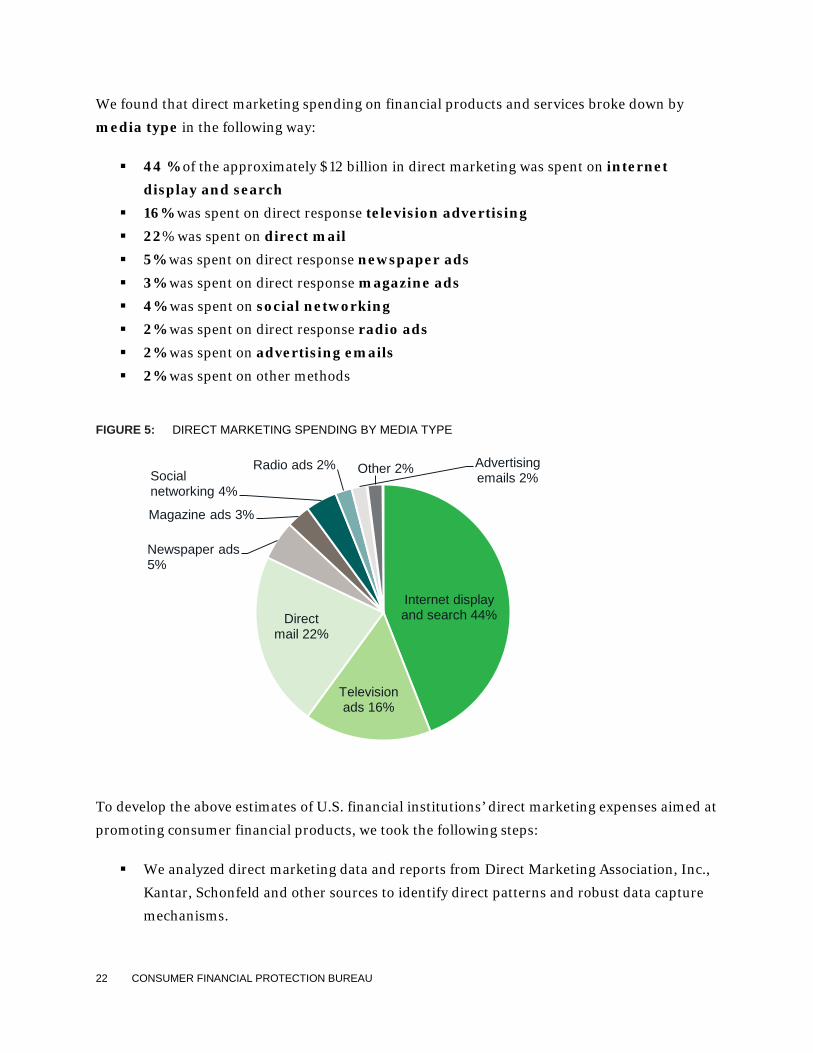
DIRECT MARKETING SPENDING Financial service providers spend approximately $12 billion on direct marketing annually. Based on the methodology detailed below and in the Appendix, we found that the
financial service providers spent approximately $12 billion on direct advertising per year (based
on a one-year sample). Direct marketing includes such channels as Internet display advertising,
direct mail and other methods aimed at prompting individuals to make an immediate purchase
or generate a lead.
22 CONSUMER FINANCIAL PROTECTION BUREAU
We found that direct marketing spending on financial products and services broke down by
media type in the following way:
44 % of the approximately $12 billion in direct marketing was spent on internet display and search
16% was spent on direct response television advertising
22% was spent on direct mail 5% was spent on direct response newspaper ads
3% was spent on direct response magazine ads
4% was spent on social networking
2% was spent on direct response radio ads
2% was spent on advertising emails
2% was spent on other methods
FIGURE 5: DIRECT MARKETING SPENDING BY MEDIA TYPE
To develop the above estimates of U.S. financial institutions’ direct marketing expenses aimed at
promoting consumer financial products, we took the following steps:
We analyzed direct marketing data and reports from Direct Marketing Association, Inc.,
Kantar, Schonfeld and other sources to identify direct patterns and robust data capture
mechanisms.
Internet display and search 44%
Television ads 16%
Direct mail 22%
Newspaper ads 5%
Magazine ads 3%
Social networking 4%
Radio ads 2% Advertising emails 2%
Other 2%

23 CONSUMER FINANCIAL PROTECTION BUREAU
We confirmed the level of spending typical for financial institutions.
We also used direct marketing spending data reported in The Power of Direct Marketing,
2011-2012 Edition.
We grouped data to capture spending on key direct marketing channels:
Direct response components of TV, radio, newspapers and magazines Direct mail Internet display, search, social networking, commercial e-mail
We applied spending proportions to break out direct marketing spend by channel for
each product type (e.g., mortgages, vehicle loans, credit cards, home equity loans).
SUMMARY OF FINANCIAL SERVICES INDUSTRY MARKETING SPENDING By combining the assessments (detailed above) of the two marketing spending components –
about $5.5 billion in awareness advertising and $12 billion in direct marketing – we
created an estimate of the overall dollar amount spent by financial institutions on promoting
consumer financial products. We found that the total amount spent annually by financial
institutions and other financial service providers is approximately $17 billion.
Looking at this spending on marketing on a per capita basis, financial services providers spend approximately $54 per person per year on marketing of consumer financial products and services (based on our $17 billion estimate of annual spending and the current
U.S. population of approximately 314 million people).
24 CONSUMER FINANCIAL PROTECTION BUREAU
4. Conclusion Combined, financial institutions and financial educators provide a vast amount of information
to the public. This means that for each decision in their financial lives, consumers are probably
relying on varying sources of information, each developed with different purposes. This study
found a disparity in spending levels on education and marketing—$670 million annually for
financial education compared to $17 billion for financial services marketing. This finding
indicates that more than 25 times as much is spent on marketing financial products and services
to consumers each year than on providing them with financial education. (Note that these
estimates do not include spending on financial education or financial service product marketing
related to retirement, insurance, college loans, and other investments).
The challenges facing consumers in managing their finances are significant, and the current
spending on financial education is very low compared to the amounts spent on marketing
financial products. This raises the importance of providing high-quality sources of unbiased
financial information. This includes school-based financial education to prepare youth to be
able to navigate their financial lives as adults. While many school districts have included
financial education in the curriculum, and many teachers do extraordinary work in this area
with limited resources, it is important to consider options to expand the opportunity for kids to
build the skills that they will need throughout their lives for financial decision-making early and
continuously during the K-12 years.
The significant disparity in the magnitude of resources devoted to financial education as
opposed to marketing of financial services also suggests the need for financial education and
financial skill building opportunities to be provided to Americans in their homes, workplaces,
libraries, and through community organizations where they may receive other types of services.
This study suggests that financial educators should further enhance efforts to identify and
promote innovative, scalable methods for providing financial education to consumers.
Collectively, we need to make financial education resources as effective and innovative as
possible in order to maximize our impact in helping American consumers make good financial
decisions for themselves and their families.
25 CONSUMER FINANCIAL PROTECTION BUREAU
APPENDIX A: SUMMARY OF METHODOLOGY
DEFINITION OF FINANCIAL EDUCATION In developing a definition of financial education for the purposes of this study, we relied on
comparative analysis of existing definitions for "financial education", "financial literacy", and
"financial capability". In particular, we reviewed definitions utilized by the President's Council
on Financial Literacy, Financial Literacy Education Commission, Government Accountability
Office, Organization for Economic Cooperation and Development, as well as other reputable
entities.
Upon review of several options, we agreed on the following language for purposes of the study:
Financial Education represents a process of lifelong knowledge and skills development required to achieve financial literacy, learn to mitigate financial risks, protect assets and ensure ongoing effective management of one's savings, credit, debt, housing and other resources to maximize financial well-being of individuals and society.
To facilitate execution of the study, the team also agreed on an extensive list of definitions,
inclusions and exclusions for financial education providers, service types, consumers and
supporting organizations. The full listing of definitions is included at the end of this Appendix.
PURPOSE AND OBJECTIVES OF THE STUDY The study focused on helping the Consumer Financial Protection Bureau's (CFPB) Office of
Financial Education (OFE) to increase understanding of the scope, scale, and funding of
providers of financial education and the marketing dollars spent by providers of consumer
financial products in the United States. (The research and analysis described in this report was
conducted by the Boston Consulting Group under contract with the CFPB).
Design of the study included three task areas defined to achieve the following key objectives:
Define, delineate and enumerate the types of financial education providers, services and
supporting organizations across the United States
Develop an estimate of the types, funding models, and funding dollar amounts
supporting these providers and services
Develop an estimate of the dollar amount spent by the financial services industry on
marketing consumer financial products
26 CONSUMER FINANCIAL PROTECTION BUREAU
The study relied upon publicly available research, IRS Form 990 filings, studies and reports, as
well as more than 40 interviews with federal and state government officials, non-profit
organizations, financial institutions, local governments, public schools, and other leading
experts in the field.
The scope of the study encompassed:
U.S. market only
One-year market snapshot
Financial education market size estimate by provider, type and service type (topics and
selected targets)
Financial service industry marketing spend for consumer financial products by channel
as feasible
We defined the following items to be out-of-scope for the current study:
Services related to securities trading (e.g., stocks and bonds), insurance, retirement
assets and planning, and college loans, aid and planning
Financial education or consumer financial products demand
Quality measures, consumer satisfaction metrics
Sales efforts of financial institutions (e.g., call centers, retail sales efforts)
Financial education strategy
International efforts/collaboration
Allocation of fixed costs (e.g., teachers' salaries), except for portions of salaries and fixed
costs included in the GAO 2012 Report on Financial Literacy, where these expenses were
included in numbers for federal agencies as available
No costs were estimated for general curriculum textbooks that may contain financial
education components, chapters or exercises
Services paid for by consumers (e.g., counseling fees)
FINANCIAL EDUCATION MARKET SIZING METHODOLOGY In line with the financial education definition, purpose and scope of the Study, we developed
and aligned with CFPB on a detailed typology of financial education providers, service types,
consumer types and supporting organizations (please see detailed definitions in this Appendix).
Defined categories provided the foundation for the financial education market sizing estimate
methodology – analysis of the dollar amounts dedicated to financial education by each provider

27 CONSUMER FINANCIAL PROTECTION BUREAU
category overall and by service type (e.g., General Financial Education, Housing, Credit
Counseling, and Microfinance).
We started by focusing on the following key financial education provider/supporting
organization categories:
Federal government
State governments
Non-profit organizations
Financial institutions
School districts
Local governments
Private philanthropies
For each category, the team determined whether entities within the category serve as financial
education providers, supporting organizations or both. For example, federal government
agencies fulfill both provider and supporting organization roles, while private philanthropies
exclusively serve as supporting organizations.
All categories of entities that provide financial education services exclusively or as a part of their
operations underwent further analysis to delineate financial education services by type and
determine proportions of funding dedicated to specific consumer types.
Analytic techniques and methodology varied by entity category due to data availability, number
of entities in each category and other factors. Below are details of analysis steps, assumptions
and sources utilized to assess all key provider and supporting organization categories.
FEDERAL GOVERNMENT To estimate the federal government's contribution to the overall financial education market in
the United States, we relied on a 2012 U.S. General Accounting Office (GAO) report.3 The GAO
3 GAO, Report to Congressional Committees on Financial Literacy – Overlap of Programs Suggests There May Be
Opportunities for Consolidation. GAO-12-588 (Washingt0n, DC: Jul. 23, 2012). Note that in its April 2013 report
on duplication of federal programs, GAO did not include financial literacy. The report noted that its overall
assessment of the two financial literacy areas is that they have been “addressed, meaning all actions needed in that

28 CONSUMER FINANCIAL PROTECTION BUREAU
Report provided financial education spending estimates for the majority of federal agencies with
presence in this area of work.
To preserve data consistency and comparability of baseline results, we utilized the 2012 GAO
Report spending levels, clearly defining two key caveats:
The 2012 GAO Report relied on FY 2010 data.
The 2012 GAO Report provided estimates based on staff assessments and portions of
staff time, costs of contracts, printing, etc. were included, where available.
In addition to the 2012 GAO Report estimates, the team obtained and added the CFPB’s
contribution to financial education based on the FY2013 budget for financial education of
approximately $26 million.
We also examined, but deemed to be out of scope contributions to financial education spending
provided by the following entities:
U.S. Small Business Administration – financial education spending was fragmented
across programs and delivered in partnerships with other government and non-profit
entities; it was assumed to be captured in other programs included in the study.
U.S. Commodity Futures Trading Commission – the primary focus is on investor
education and fraud prevention, and thus out of scope for the study.
We estimated the breakdown of federal spending into direct service and supporting services
categories by examining publically available program descriptions and interviews with agency
staff.
STATE GOVERNMENT We conducted a thorough analysis to identify spending on financial education in all 50 states as
well as the District of Columbia. For each state, a database-driven search of recent news reports
was supplemented with more detailed research on state budgets and legislative updates. A
area were addressed.” GAO, 2013 Annual Report: Actions Needed to Reduce Fragmentation, Overlap, and Duplication and Achieve Other Financial Benefits. GAO-13-279SP (Washington, DC: April 2013).
29 CONSUMER FINANCIAL PROTECTION BUREAU
state-by-state analysis was also completed to understand how each state is allocating its award
from the National Mortgage Settlement.
To determine state spending on financial education, we did the following:
1. Conducted a review of press database to identify financial education grants, initiatives and
programs at the state level.
2. Defined agencies most commonly involved in financial education implementation (e.g., State
Treasurers, Banking Departments, and Departments of Education) and conducted detailed
state-by-state online review of resources committed to financial education.
3. Reviewed activity related to the National Mortgage Settlement by state and determined
states/levels associated with financial education; we assumed 5-year spending horizon to
determine annual levels, based on information from interviews with experts.
4. Tested financial education spending levels and assumptions through interviews with
representatives of state and city governments.
5. Aggregated state-level spending for non-housing-related and housing/National Mortgage
Settlement programs across all states.
6. Based on interviews and expert input, we considered 90 percent of state spending as
supporting services (e.g., grants, training, etc.).
The following table contains a selection of 10 state programs with accompanying findings about
their financial education spending and a sample of sources. Please note, this selection is
representative of the detailed data collected for all 50 states and the District of Columbia.
TABLE 1:
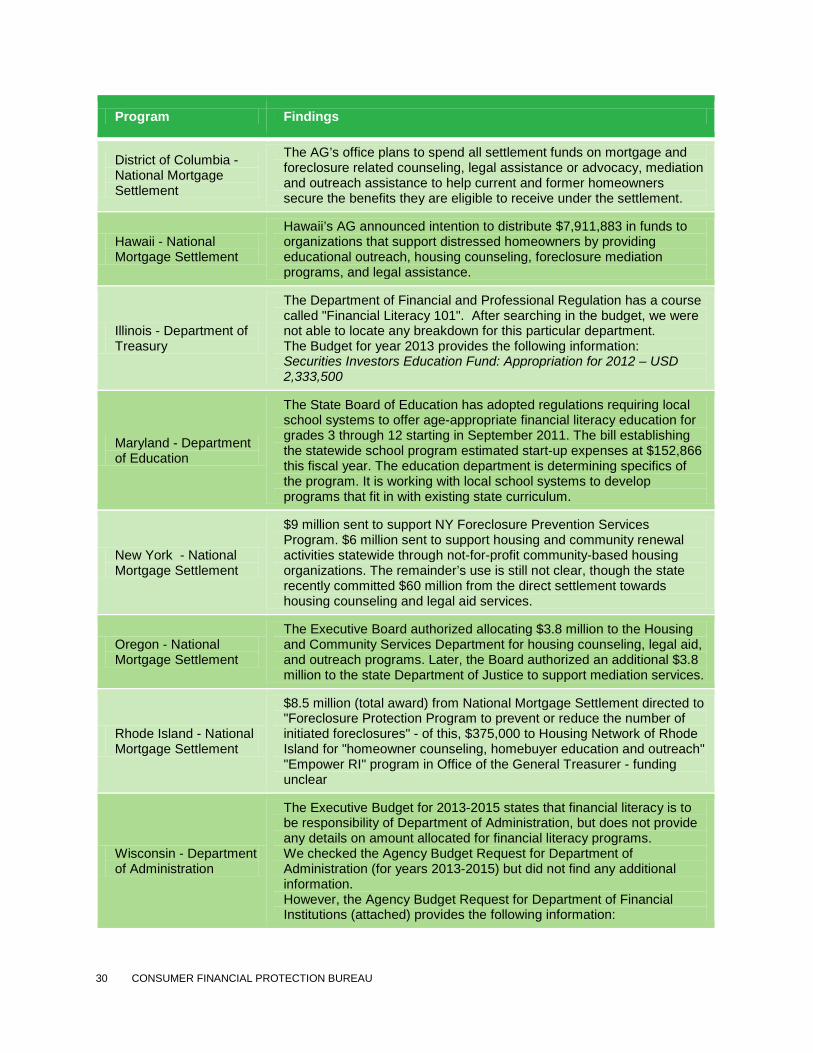
Program Findings
Arizona - National Mortgage Settlement
Arizona is spending $2 million to raise public awareness and educate the community about the mortgage foreclosure resources available. Arizona is giving $5 million to HUD-approved nonprofit housing counseling agencies so that these agencies can continue to help homeowners.
California - California Department of Education
The California Department of Education is launching a financial literacy awareness campaign. The goal of this initiative is to provide schools, teachers, students and parents with access to supplemental resources that can help students develop a keen understanding of responsible money management and increase their overall financial literacy. The CA Department of Education is partnering with financial institutions, consumer groups, and other government agencies in this effort.
30 CONSUMER FINANCIAL PROTECTION BUREAU
Program Findings
District of Columbia - National Mortgage Settlement
The AG’s office plans to spend all settlement funds on mortgage and foreclosure related counseling, legal assistance or advocacy, mediation and outreach assistance to help current and former homeowners secure the benefits they are eligible to receive under the settlement.
Hawaii - National Mortgage Settlement
Hawaii’s AG announced intention to distribute $7,911,883 in funds to organizations that support distressed homeowners by providing educational outreach, housing counseling, foreclosure mediation programs, and legal assistance.
Illinois - Department of Treasury
The Department of Financial and Professional Regulation has a course called "Financial Literacy 101". After searching in the budget, we were not able to locate any breakdown for this particular department. The Budget for year 2013 provides the following information: Securities Investors Education Fund: Appropriation for 2012 – USD 2,333,500
Maryland - Department of Education
The State Board of Education has adopted regulations requiring local school systems to offer age-appropriate financial literacy education for grades 3 through 12 starting in September 2011. The bill establishing the statewide school program estimated start-up expenses at $152,866 this fiscal year. The education department is determining specifics of the program. It is working with local school systems to develop programs that fit in with existing state curriculum.
New York - National Mortgage Settlement
$9 million sent to support NY Foreclosure Prevention Services Program. $6 million sent to support housing and community renewal activities statewide through not-for-profit community-based housing organizations. The remainder’s use is still not clear, though the state recently committed $60 million from the direct settlement towards housing counseling and legal aid services.
Oregon - National Mortgage Settlement
The Executive Board authorized allocating $3.8 million to the Housing and Community Services Department for housing counseling, legal aid, and outreach programs. Later, the Board authorized an additional $3.8 million to the state Department of Justice to support mediation services.
Rhode Island - National Mortgage Settlement
$8.5 million (total award) from National Mortgage Settlement directed to "Foreclosure Protection Program to prevent or reduce the number of initiated foreclosures" - of this, $375,000 to Housing Network of Rhode Island for "homeowner counseling, homebuyer education and outreach" "Empower RI" program in Office of the General Treasurer - funding unclear
Wisconsin - Department of Administration
The Executive Budget for 2013-2015 states that financial literacy is to be responsibility of Department of Administration, but does not provide any details on amount allocated for financial literacy programs. We checked the Agency Budget Request for Department of Administration (for years 2013-2015) but did not find any additional information. However, the Agency Budget Request for Department of Financial Institutions (attached) provides the following information:

31 CONSUMER FINANCIAL PROTECTION BUREAU
Program Findings
“Investor education and training fund – Total Expenditures: USD 84,500” “Payday loan database and financial literacy – Total Expenditures: USD 900,000”
LOCAL GOVERNMENT Similar to financial education funding by school districts, a round of interviews also launched
assessment of local government investments in financial education. Interviews with
representatives of city governments across the country suggested notable disparities in levels of
attention and resources devoted to financial education as illustrated by the sampling of quotes
obtained via individual interviews:
“Little happening at the city level. A fair amount integrated in city services by non-profit and other partnerships.”
— Director of regional financial education, non-profit organization
“Cities tend to develop relationships with funders and sometimes identify small pools of money to match.”
—Program leader at a city-focused coalition
“New York's Office for Financial Empowerment is funded by a public levy ... of $2.5M a year.”
—NYC city government representative
“Office of the City Treasurer plans to raise $120,000 (same as last year).” —Office of the City Treasurer in a major metro area
“City Treasurers across the country do their own things, but are primarily active in major metro areas and locations hard hit by the recent crisis.”
—Programs manager at a national network organization
New York City provided an example of high level of local government support for financial
education supported by a stable funding stream through a dedicated levy (raising approximately
$2.5 million per year for the metro area of 8.2 million inhabitants). However, even at this level
of funding per capita local government expenses for financial education amount to thirty cents.

32 CONSUMER FINANCIAL PROTECTION BUREAU
The team suggested that New York City’s level of expenditures represents the upper bound for
local government support provided to financial education. If New York's funding level of thirty
cents is extrapolated to the United States population of 313 million, total local government
funding available across the country may reach $94 million.
To estimate the lower bound of local government resources devoted to financial education, the
team assumed that every township/town, municipality and county invests $1,000 per year.
With 38,917 local government entities across the country, this assumption yielded the nation-
wide lower bound local government spending for financial education of approximately $39
million.
Overall, we estimates that local government funding for financial education amounts to $39-94
million per year.
SCHOOL DISTRICTS To assess additional funding available for financial education and provided through individual
school districts, we conducted a series of interviews with secondary education professionals
representing school systems, academia, city governments and the non-profit community. The
interviews aimed to identify a range of funding levels, accounting for the following caveats
defined in the scope of the Study:
Teachers' salaries and other personnel expenses are out-of-scope.
The Study does not account for portions of textbooks and other materials that may
contain financial education components (e.g. economics textbooks containing financial
education concepts).
Across the board, the team established that minimal additional funding is available for financial
education at the school district level as illustrated by the following examples of statements
obtained through interviews:
“For school districts to kick in any money is quite rare.” —CEO of a national youth-focused non-profit organization
“School budgets are shrinking and schools are struggling to maintain financial education programs.”
—CEO of a national financial education coalition
33 CONSUMER FINANCIAL PROTECTION BUREAU
“Stock Market Game charges fees that get covered through private donations. Local credit unions provide 1-10K grants.”
—former state Director in the Office of Financial Education
“Minimal additional funding is expected from schools to roll out financial literacy guide.”
—City administration in a major metro area
“Very limited school district resources available across the country. Mandates are basically unfunded.”
—Academic researcher and curriculum development expert
However, we identified examples of financial education funding at the school district level
primarily directed at professional education opportunities for financial education teachers.
Typical expense categories included travel, registration fees, stipends, substitute teacher
expenses and other related items. Based on interview insights the team established key
assumptions to estimate the amount of additional financial education -related funds available
through school districts:
Average financial education professional development training cost of $500
Average teacher training commitment of 1-3 teachers per district/year
Corresponding training budgets amounting to $500-1,500 per district/year
Based on 2012 Digest of Education Statistics, there are currently 13,588 school districts across
the United States. With $500-1,500 invested in financial education by every district, additional
financial education spending amounts to $7-21 million per year.
FINANCIAL INSTITUTIONS Based on the definition of financial institutions agreed upon in the study typology, a varied but
rigorous approach was used to estimate spending on financial education by financial
institutions. Information gathered via interviews with representative firms was supplemented
with data gathered from publicly available sources. Once a fact base was established for a
suitable number of entities, extrapolations were performed to estimate spending for the broader
sector.

34 CONSUMER FINANCIAL PROTECTION BUREAU
To determine financial institution spending on financial education, we did the following:
1. Interviewed banks among the top 15 largest in the U.S. and captured specific
information on the expenditures and reach of their financial education initiatives.
2. Reviewed press coverage, annual reports, and Corporate Social Responsibility
reports for financial education -related initiatives of other financial institutions
including banks, audit and advisory firms, and credit card companies.
3. Isolated actual spending on financial education from other contributions such as
labor hours and in-kind donations.
4. Estimated bank spending on financial education based on the known investments of
eight of the top 15 banks using the proportion of their assets to the total assets in the
U.S. banking sector as a basis for extrapolation.
5. Estimated financial education spending in the audit/advisory sector based on known
commitments from the Big 4 audit/advisory firms using their share of overall U.S.
market to extrapolate.
6. Captured spending of key credit card companies without extrapolation.
7. From data gathered in interviews, estimated that 20% of financial institution
spending on financial education is allocated to direct provision of service with the
remaining 80% allocated to support.
8. Based on known financial education initiatives, allocated financial institution
spending across service offerings and consumer segments.
PRIVATE PHILANTHROPIES Private philanthropic foundations contribute to the cause of financial education over and above
resources provided by foundations linked to banks and other financial institutions. To develop
an estimate of private foundation giving to financial education, we reviewed 2012 grant-making
data for all foundations included in the list of top 50 largest foundations by size of their asset
base. Data for 2012 reviewed at the level of individual grants and associated descriptions of
purpose and intent enabled us to suggest that top 50 foundations provide at least $40 million of
35 CONSUMER FINANCIAL PROTECTION BUREAU
contributions to financial education. Funding levels are likely higher if private foundations
outside of the top 50 are taken into account.
NON-PROFIT ORGANIZATIONS A component of the study focusing on non-profit organizations included analysis of four non-
profit categories:
National/state-level non-profit organizations
Industry/trade associations and coalitions
Community-based groups and clubs
Faith-based organizations
To analyze financial education spending by all four categories of non-profit organizations, we
conducted a top-down assessment of financial education spending, created a comprehensive
database of non-profit spending data, and classified each non-profit organization along several
dimensions. Assumptions were created for each classification and applied to the database in
order to estimate total non-profit spending on financial education as well as breakdowns for
service provision vs. support, consumer segments, and service offerings.
To determine non-profit spending on financial education, we did the following:
1. Identified initial list of approximately 30 leading non-profit organizations in the financial
education field.
2. Determined NTEE (National Taxonomy of Exempt Entities) codes applicable to financial
education:
P51: Financial Counseling, Money Management S02: Management & Tech. S31: Urban, Community S43: Mgmt. Services for Small Business/Entrepreneurs B03: Prof. Societies & Associates B30: Vocational Technical B60: Audit, Continuing Education B90: Educational Services O53: Business, Youth Development V22: Economics

36 CONSUMER FINANCIAL PROTECTION BUREAU
3. Searched database of Form 990 tax filings using NTEE codes listed above along with
selected key words (note that most of this data is from tax year 2011, although in some cases
tax data is from a previous year):
Financial literacy Financial education Financial counseling Money management Microfinance Small business management Housing counseling Housing education
4. Generated initial list of approximately 1,200 entities with over $30 billion in combined
annual expenses. Augmented list with organizations identified by CFPB, interviewees, and
research. List included both large and small non-profit organizations.
5. Based on information gathered via interviews with CFPB and other organizations, reviewed
the full list to remove out-of-scope organizations and true-up expenses for in-scope
organizations.
6. Combined organizational families and national associations into a single parent entity.
7. Categorized non-profits into organization types
National or State Level Trade Associations & Coalitions Community-Based Faith-Based Credit Counselors
8. Classified each organization based on mission focus on financial education and created
assumptions for each category to determine the estimated portion of total spending allocated
to financial education
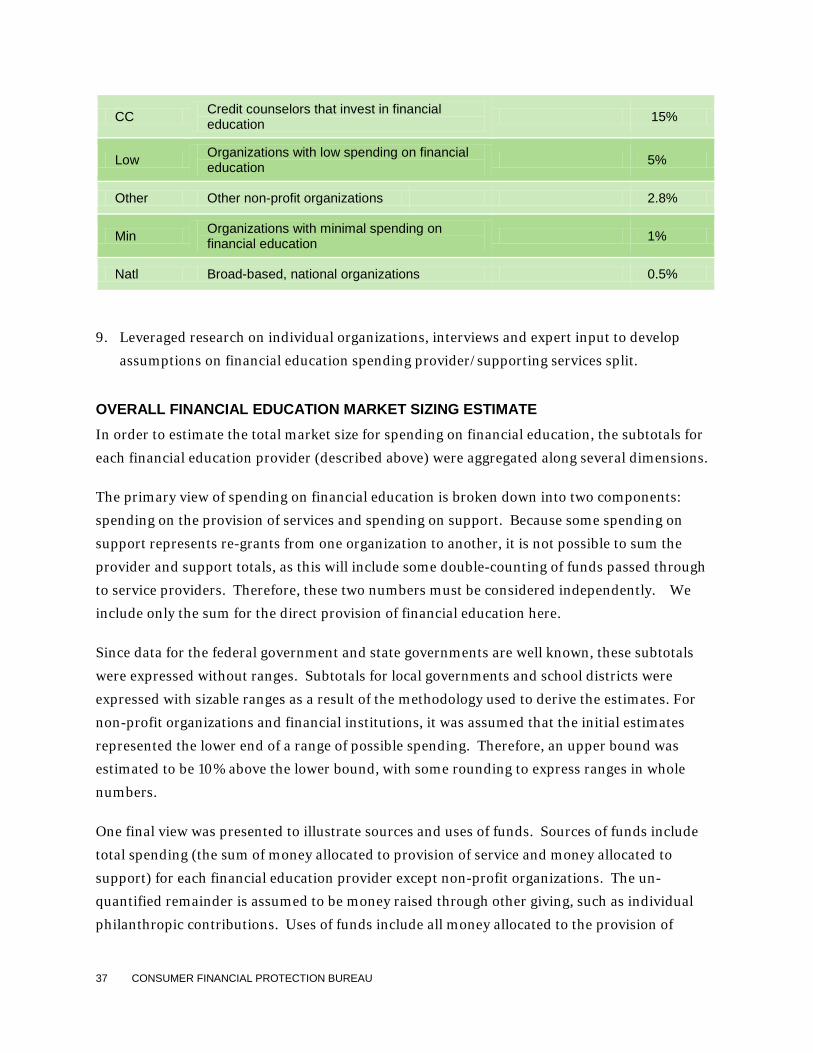
TABLE 2: PORTION OF TOTAL EXPENSES ALLOCATED TO FINANCIAL EDUCATION
Code Description Value
High Organizations that devote significant spending to financial education 90%
Med Organizations with meaningful spending on financial education 30%
37 CONSUMER FINANCIAL PROTECTION BUREAU
CC Credit counselors that invest in financial education 15%
Low Organizations with low spending on financial education 5%
Other Other non-profit organizations 2.8%
Min Organizations with minimal spending on financial education 1%
Natl Broad-based, national organizations 0.5%
9. Leveraged research on individual organizations, interviews and expert input to develop
assumptions on financial education spending provider/supporting services split.
OVERALL FINANCIAL EDUCATION MARKET SIZING ESTIMATE In order to estimate the total market size for spending on financial education, the subtotals for
each financial education provider (described above) were aggregated along several dimensions.
The primary view of spending on financial education is broken down into two components:
spending on the provision of services and spending on support. Because some spending on
support represents re-grants from one organization to another, it is not possible to sum the
provider and support totals, as this will include some double-counting of funds passed through
to service providers. Therefore, these two numbers must be considered independently. We
include only the sum for the direct provision of financial education here.
Since data for the federal government and state governments are well known, these subtotals
were expressed without ranges. Subtotals for local governments and school districts were
expressed with sizable ranges as a result of the methodology used to derive the estimates. For
non-profit organizations and financial institutions, it was assumed that the initial estimates
represented the lower end of a range of possible spending. Therefore, an upper bound was
estimated to be 10% above the lower bound, with some rounding to express ranges in whole
numbers.
One final view was presented to illustrate sources and uses of funds. Sources of funds include
total spending (the sum of money allocated to provision of service and money allocated to
support) for each financial education provider except non-profit organizations. The un-
quantified remainder is assumed to be money raised through other giving, such as individual
philanthropic contributions. Uses of funds include all money allocated to the provision of
38 CONSUMER FINANCIAL PROTECTION BUREAU
services by each financial education provider along with an un-quantified sum attributed to
evaluation, research, assessment, and other types of support, except re-granting.
CROSS-CHECKS Throughout the study, a number of cross-checks were employed to re-validate the reasonable
nature of presented estimates. A sampling of key cross-check mechanisms included:
Bottom-up estimates of non-profit spending Interviews were conducted with key financial education representatives in New York City and
Baltimore. Based on these interviews, a list of non-profits was developed and systematized for
each city. Spending data was gathered from the Forms 990, and the organizations were
categorized according to the study typology. Total spending for each city was then calculated
and divided by the city's population in order to estimate financial education spending per capita.
These values formed the basis for extrapolation to the overall population of the United States,
and the resulting values were used to validate that the top-down estimate of non-profit spending
was sound.
Verifying bank donations to major non-profits After estimating financial education spending by financial institutions based on the
methodology described above, the resulting data was cross checked against known donations to
major non-profit organizations involved in financial education. It was determined that the
financial institution estimates were sufficiently large to cover both known donations and other
programs mentioned in annual financial and Corporate Social Responsibility reports.
FINANCIAL SERVICES INDUSTRY MARKETING SPENDING METHODOLOGY Relying on leading industry methods, we developed an estimate of the dollar amount spent by
the financial services industry on marketing consumer financial products. We further analyzed
the marketing spending and delineated spending by channel (e.g., TV, radio, newspapers) and
product type (e.g., credit cards). We determined that analysis by consumer segment would not
be practical and would not add value in the current context.
Marketing spending analysis followed scope guidelines established for the overall project. For
example, retirement planning, insurance, college savings products, and other investments were
excluded.
39 CONSUMER FINANCIAL PROTECTION BUREAU
We obtained comprehensive data and developed robust assumptions covering the full scope of
the analysis for a single year (2012) and all channel-specific and product-specific findings
pertain to the full calendar year 2012.
Following marketing industry established analysis techniques, we segmented the analysis into
general awareness advertising ("above the line") measured spending and direct marketing
("below the line") spending. Awareness advertising tends to reach audiences through traditional
channels, such as television, radio and newspapers, while direct marketing spending includes
such channels as internet display advertising, direct mail and others aimed at prompting
individuals to make an immediate purchase or generate a lead.
AWARENESS ADVERTISING SPENDING ESTIMATE We commenced analysis by developing a detailed estimate of the measurable awareness
advertising expenditures. In particular, the team took the following steps:
1. Obtained granular campaign-specific data for awareness advertising campaigns conducted
by financial institutions across the United State in 2012
Utilized inputs aggregated in an advertising spending database populated with
individual advertising data points from 24/7 electronic monitoring, newspaper and
magazine scans, billboard reporting, etc. The database covers reporting by approximately 6,000 financial institutions and
includes all reported ad efforts and campaigns. For the purposes of the current study, the team extracted spending details for
approximately 35,000 individual ad campaigns conducted in 2012. Below is an example of data points that were included in the analysis for each
campaign.
Field Name Value
Included in analysis Yes/no
Time period 2012
Category Example: B121 Banking (Consumer)
Sub-category Example: B121.1 Consumer Banking – Checking
Product Names of individual products and campaigns were sanitized for purposes of the current Study

40 CONSUMER FINANCIAL PROTECTION BUREAU
Television: Network TV, Spot TV, SLN TV, Cable TV, Syndication Spending for each category in thousands $US
Magazines: General magazines, Sunday magazines, Hispanic magazines, local magazines
Spending for each category in thousands $US
Newspapers: National newspapers, other newspapers, Hispanic newspapers Spending for each category in thousands $US
Radio: Network radio, National spot radio, local radio Spending for each category in thousands $US
Display Spending for each category in thousands $US
Outdoor Spending for each category in thousands $US
2. Removed business product spending items (e.g. corporate credit card ads); spot checked and
correlated with AdAge reporting for key financial institutions.
3. Aggregated individual campaign entries for key general advertising channels:
TV, Magazines, Newspapers, Radio, Display, Outdoor
4. Developed full-year 2012 total estimates for each channel and a grand total for all general
advertising.
5. Delineated awareness advertising data by product type (e.g. mortgage loans, vehicle loans,
home equity loans, general banking services).
6. Reviewed marketing expense patterns for 100 top U.S. advertisers and financial institutions
appearing on the top 100 list and determined that awareness advertising accounts for 30-
50% of the spending, with the remaining portion captured through direct marketing
expenses.
DIRECT MARKETING SPENDING ESTIMATE To estimate direct marketing expenses of U.S. financial institutions aimed at promoting
consumer financial products, we:
1. Analyzed direct marketing data and reports from Direct Marketing Association, Inc., Kantar,
Schonfeld and other sources to identify direct marketing patterns and most robust data
capture mechanisms.
2. Confirmed level of direct marketing spending typical for financial institutions.
3. Decided to use direct marketing spending results reported in The Power of Direct Marketing,
2011-2012 Edition.

41 CONSUMER FINANCIAL PROTECTION BUREAU
4. Grouped data to capture spending on key direct marketing channels:
Direct response components of TV, radio, newspapers and magazines Direct mail Internet display, search, social networking, commercial e-mail
5. Applied awareness spending proportions to break out direct marketing spending by channel
for each product type (e.g., mortgages, vehicle loans, credit cards, home equity loans).
TOTAL FINANCIAL SERVICES INDUSTRY MARKETING SPENDING ESTIMATE By combining assessments of the two marketing spending components – awareness advertising
and direct marketing – we developed an estimate of the overall dollar amount financial
institutions spent on promoting consumer financial products.
The following channels contain both awareness advertising and direct marketing spending
elements: television, magazines, newspapers, radio. Display and outdoor channels utilize only
awareness advertising resources. Exclusively direct marketing channels include social
networking, Internet display, search and other Internet-related advertising options, as well as
commercial e-mail, direct mail and others (e.g., insert media).
TYPOLOGY AND DEFINTIONS Through a series of workshops, we reviewed, refined and agreed on typology categories for
providers and supporting organizations to guide execution of the study. We further agreed on
definitions, inclusions and exclusions for each typology category (please see details below).
Note: in the course of analysis execution, some provider categories (e.g., Certified Financial
Planners, or CFPs) were de-prioritized based on initial data analysis and limited scope of
financial contributions to financial education market.
PROVIDER DEFINITIONS
TABLE 3: PUBLICLY-FUNDED
Provider type Definition Included in category Excluded from category
Federal government
Includes all federal agencies offering financial education to consumers
Agencies of the Federal government administering programs in scope of the current project (e.g., as defined in GAO 2012 Report + CFPB + FEMA)
Agencies and programs focusing on securities trading, college aid, retirement savings and planning
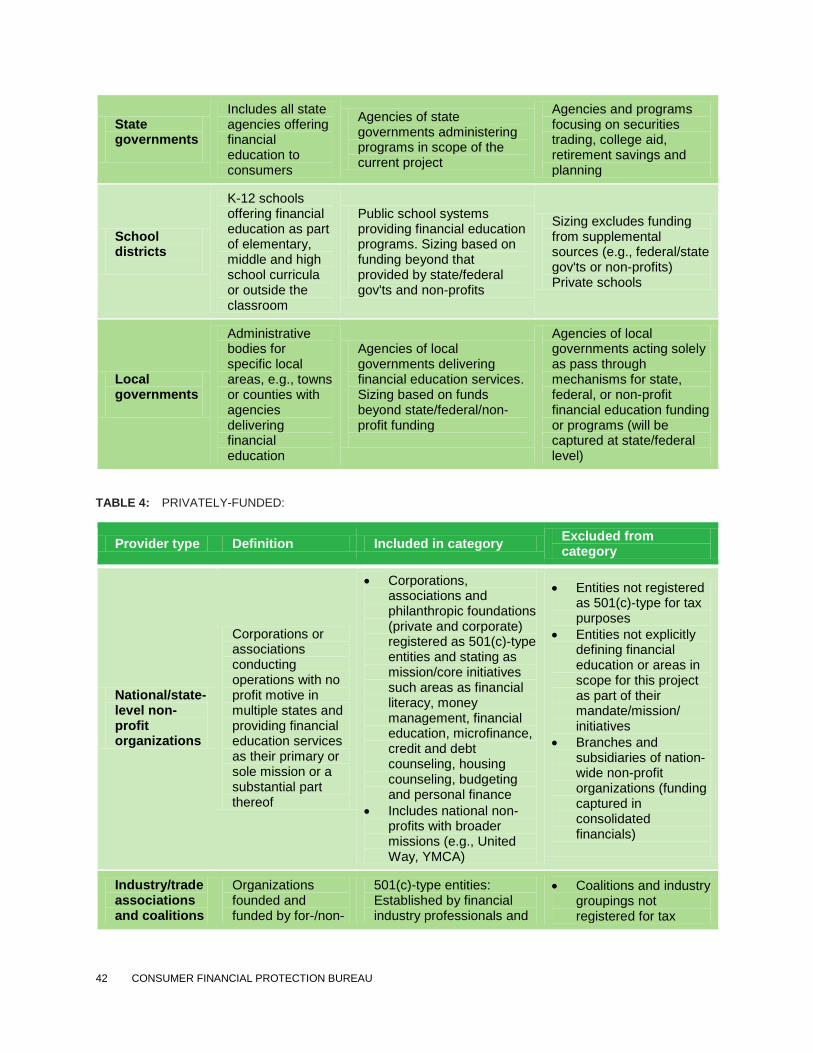
42 CONSUMER FINANCIAL PROTECTION BUREAU
State governments
Includes all state agencies offering financial education to consumers
Agencies of state governments administering programs in scope of the current project
Agencies and programs focusing on securities trading, college aid, retirement savings and planning
School districts
K-12 schools offering financial education as part of elementary, middle and high school curricula or outside the classroom
Public school systems providing financial education programs. Sizing based on funding beyond that provided by state/federal gov'ts and non-profits
Sizing excludes funding from supplemental sources (e.g., federal/state gov'ts or non-profits) Private schools
Local governments
Administrative bodies for specific local areas, e.g., towns or counties with agencies delivering financial education
Agencies of local governments delivering financial education services. Sizing based on funds beyond state/federal/non-profit funding
Agencies of local governments acting solely as pass through mechanisms for state, federal, or non-profit financial education funding or programs (will be captured at state/federal level)
TABLE 4: PRIVATELY-FUNDED:
Provider type Definition Included in category Excluded from category
National/state-level non-profit organizations
Corporations or associations conducting operations with no profit motive in multiple states and providing financial education services as their primary or sole mission or a substantial part thereof
• Corporations, associations and philanthropic foundations (private and corporate) registered as 501(c)-type entities and stating as mission/core initiatives such areas as financial literacy, money management, financial education, microfinance, credit and debt counseling, housing counseling, budgeting and personal finance
• Includes national non-profits with broader missions (e.g., United Way, YMCA)
• Entities not registered as 501(c)-type for tax purposes
• Entities not explicitly defining financial education or areas in scope for this project as part of their mandate/mission/ initiatives
• Branches and subsidiaries of nation-wide non-profit organizations (funding captured in consolidated financials)
Industry/trade associations and coalitions
Organizations founded and funded by for-/non-
501(c)-type entities: Established by financial industry professionals and
• Coalitions and industry groupings not registered for tax
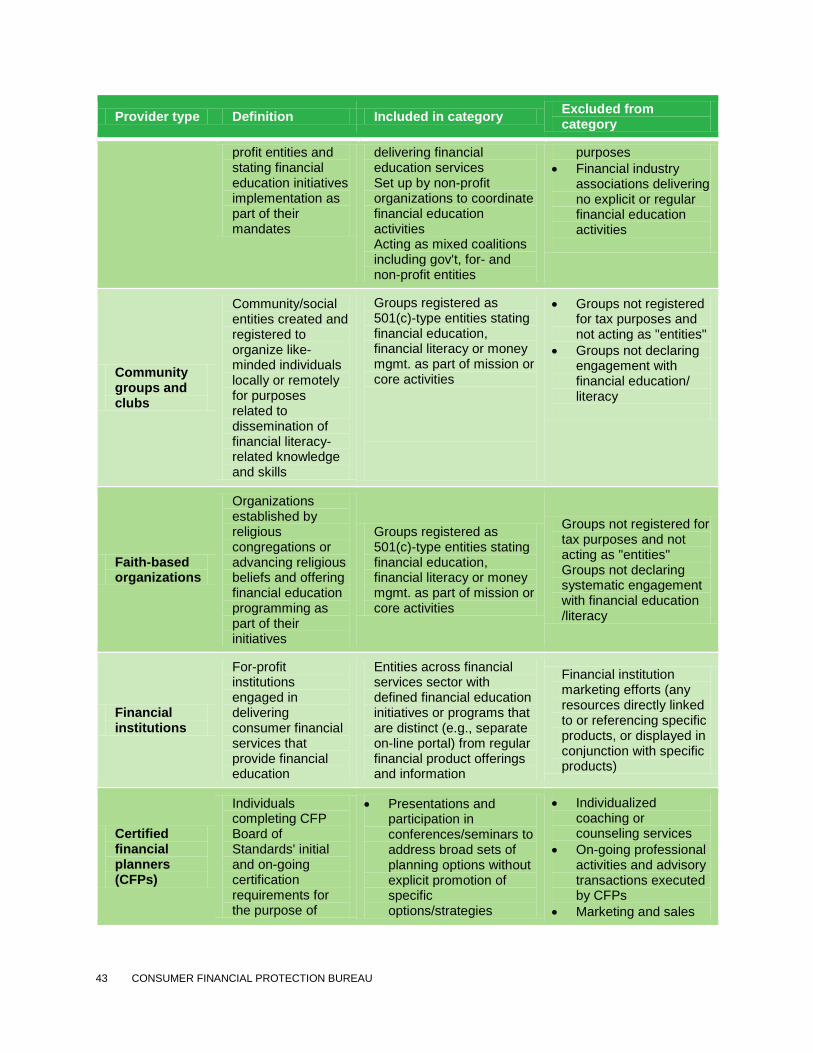
43 CONSUMER FINANCIAL PROTECTION BUREAU
Provider type Definition Included in category Excluded from category
profit entities and stating financial education initiatives implementation as part of their mandates
delivering financial education services Set up by non-profit organizations to coordinate financial education activities Acting as mixed coalitions including gov't, for- and non-profit entities
purposes • Financial industry
associations delivering no explicit or regular financial education activities
Community groups and clubs
Community/social entities created and registered to organize like-minded individuals locally or remotely for purposes related to dissemination of financial literacy-related knowledge and skills
Groups registered as 501(c)-type entities stating financial education, financial literacy or money mgmt. as part of mission or core activities
• Groups not registered for tax purposes and not acting as "entities"
• Groups not declaring engagement with financial education/ literacy
Faith-based organizations
Organizations established by religious congregations or advancing religious beliefs and offering financial education programming as part of their initiatives
Groups registered as 501(c)-type entities stating financial education, financial literacy or money mgmt. as part of mission or core activities
Groups not registered for tax purposes and not acting as "entities" Groups not declaring systematic engagement with financial education /literacy
Financial institutions
For-profit institutions engaged in delivering consumer financial services that provide financial education
Entities across financial services sector with defined financial education initiatives or programs that are distinct (e.g., separate on-line portal) from regular financial product offerings and information
Financial institution marketing efforts (any resources directly linked to or referencing specific products, or displayed in conjunction with specific products)
Certified financial planners (CFPs)
Individuals completing CFP Board of Standards' initial and on-going certification requirements for the purpose of
• Presentations and participation in conferences/seminars to address broad sets of planning options without explicit promotion of specific options/strategies
• Individualized coaching or counseling services
• On-going professional activities and advisory transactions executed by CFPs
• Marketing and sales
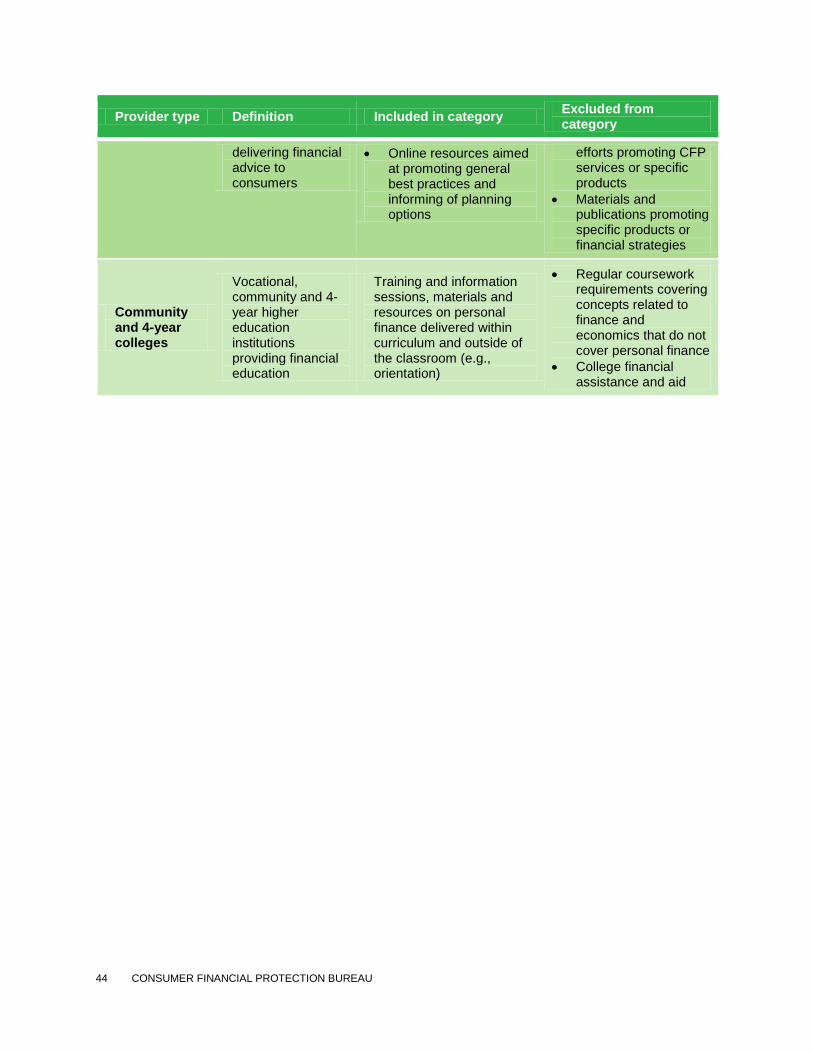
44 CONSUMER FINANCIAL PROTECTION BUREAU
Provider type Definition Included in category Excluded from category
delivering financial advice to consumers
• Online resources aimed at promoting general best practices and informing of planning options
efforts promoting CFP services or specific products
• Materials and publications promoting specific products or financial strategies
Community and 4-year colleges
Vocational, community and 4- year higher education institutions providing financial education
Training and information sessions, materials and resources on personal finance delivered within curriculum and outside of the classroom (e.g., orientation)
• Regular coursework requirements covering concepts related to finance and economics that do not cover personal finance
• College financial assistance and aid
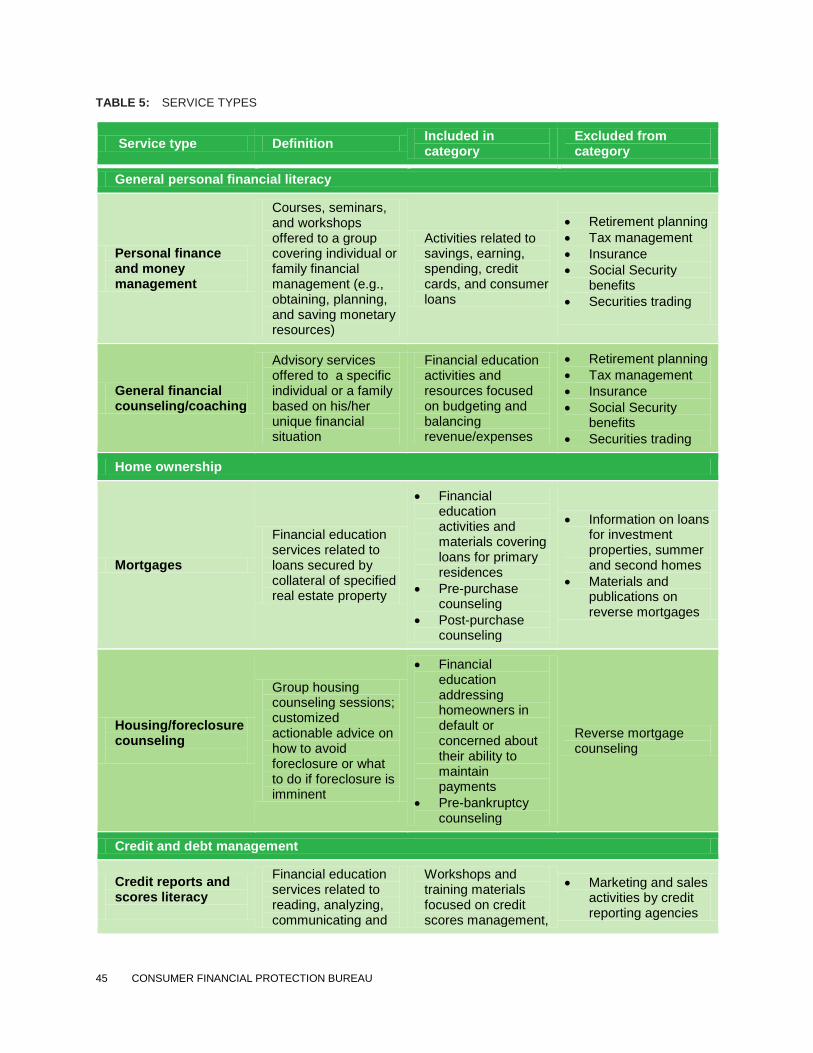
45 CONSUMER FINANCIAL PROTECTION BUREAU
TABLE 5: SERVICE TYPES
Service type Definition Included in category
Excluded from category
General personal financial literacy
Personal finance and money management
Courses, seminars, and workshops offered to a group covering individual or family financial management (e.g., obtaining, planning, and saving monetary resources)
Activities related to savings, earning, spending, credit cards, and consumer loans
• Retirement planning • Tax management • Insurance • Social Security
benefits • Securities trading
General financial counseling/coaching
Advisory services offered to a specific individual or a family based on his/her unique financial situation
Financial education activities and resources focused on budgeting and balancing revenue/expenses
• Retirement planning • Tax management • Insurance • Social Security
benefits • Securities trading
Home ownership
Mortgages
Financial education services related to loans secured by collateral of specified real estate property
• Financial education activities and materials covering loans for primary residences
• Pre-purchase counseling
• Post-purchase counseling
• Information on loans for investment properties, summer and second homes
• Materials and publications on reverse mortgages
Housing/foreclosure counseling
Group housing counseling sessions; customized actionable advice on how to avoid foreclosure or what to do if foreclosure is imminent
• Financial education addressing homeowners in default or concerned about their ability to maintain payments
• Pre-bankruptcy counseling
Reverse mortgage counseling
Credit and debt management
Credit reports and scores literacy
Financial education services related to reading, analyzing, communicating and
Workshops and training materials focused on credit scores management,
• Marketing and sales activities by credit reporting agencies
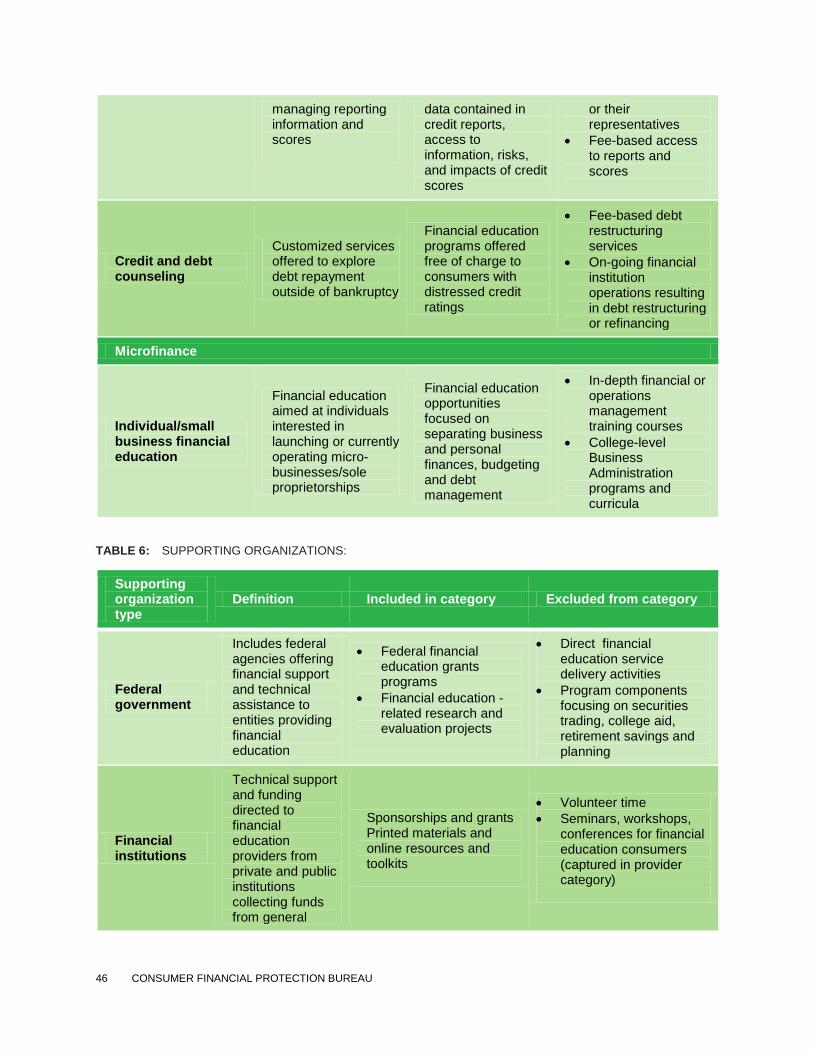
46 CONSUMER FINANCIAL PROTECTION BUREAU
managing reporting information and scores
data contained in credit reports, access to information, risks, and impacts of credit scores
or their representatives
• Fee-based access to reports and scores
Credit and debt counseling
Customized services offered to explore debt repayment outside of bankruptcy
Financial education programs offered free of charge to consumers with distressed credit ratings
• Fee-based debt restructuring services
• On-going financial institution operations resulting in debt restructuring or refinancing
Microfinance
Individual/small business financial education
Financial education aimed at individuals interested in launching or currently operating micro-businesses/sole proprietorships
Financial education opportunities focused on separating business and personal finances, budgeting and debt management
• In-depth financial or operations management training courses
• College-level Business Administration programs and curricula
TABLE 6: SUPPORTING ORGANIZATIONS:
Supporting organization type
Definition Included in category Excluded from category
Federal government
Includes federal agencies offering financial support and technical assistance to entities providing financial education
• Federal financial education grants programs
• Financial education -related research and evaluation projects
• Direct financial education service delivery activities
• Program components focusing on securities trading, college aid, retirement savings and planning
Financial institutions
Technical support and funding directed to financial education providers from private and public institutions collecting funds from general
Sponsorships and grants Printed materials and online resources and toolkits
• Volunteer time • Seminars, workshops,
conferences for financial education consumers (captured in provider category)
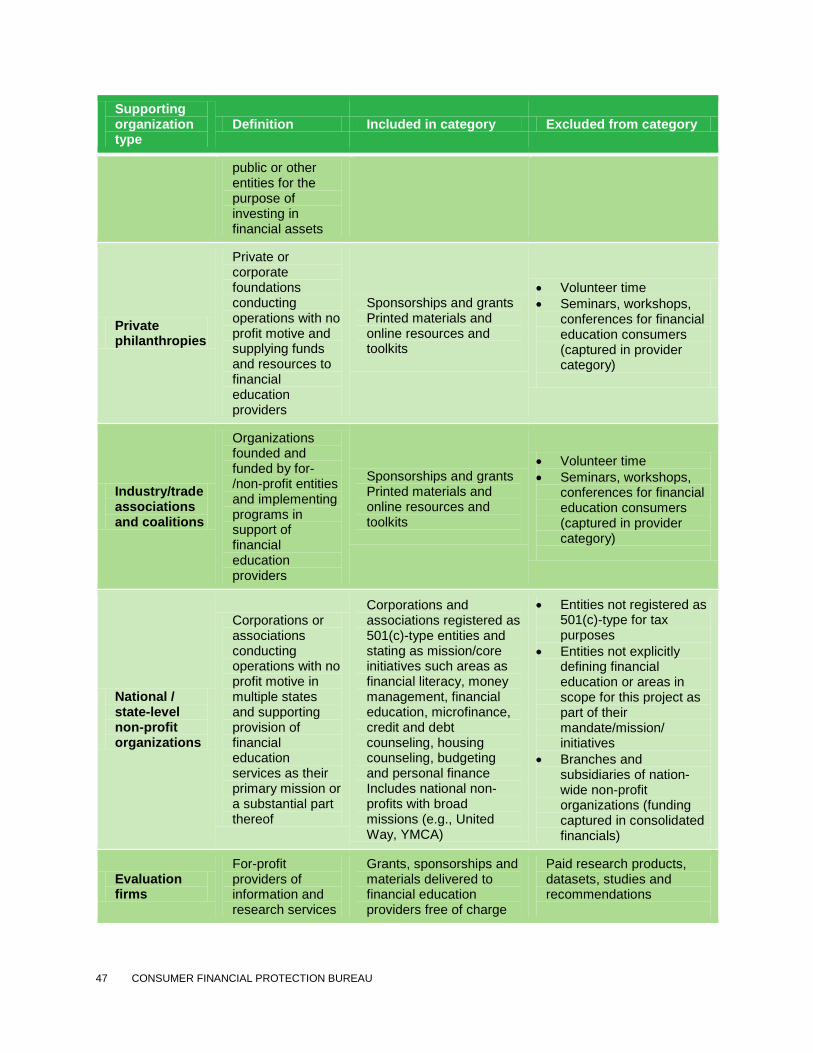
47 CONSUMER FINANCIAL PROTECTION BUREAU
Supporting organization type
Definition Included in category Excluded from category
public or other entities for the purpose of investing in financial assets
Private philanthropies
Private or corporate foundations conducting operations with no profit motive and supplying funds and resources to financial education providers
Sponsorships and grants Printed materials and online resources and toolkits
• Volunteer time • Seminars, workshops,
conferences for financial education consumers (captured in provider category)
Industry/trade associations and coalitions
Organizations founded and funded by for-/non-profit entities and implementing programs in support of financial education providers
Sponsorships and grants Printed materials and online resources and toolkits
• Volunteer time • Seminars, workshops,
conferences for financial education consumers (captured in provider category)
National / state-level non-profit organizations
Corporations or associations conducting operations with no profit motive in multiple states and supporting provision of financial education services as their primary mission or a substantial part thereof
Corporations and associations registered as 501(c)-type entities and stating as mission/core initiatives such areas as financial literacy, money management, financial education, microfinance, credit and debt counseling, housing counseling, budgeting and personal finance Includes national non-profits with broad missions (e.g., United Way, YMCA)
• Entities not registered as 501(c)-type for tax purposes
• Entities not explicitly defining financial education or areas in scope for this project as part of their mandate/mission/ initiatives
• Branches and subsidiaries of nation-wide non-profit organizations (funding captured in consolidated financials)
Evaluation firms
For-profit providers of information and research services
Grants, sponsorships and materials delivered to financial education providers free of charge
Paid research products, datasets, studies and recommendations

48 CONSUMER FINANCIAL PROTECTION BUREAU
Supporting organization type
Definition Included in category Excluded from category
as part of partnership efforts
University-based researchers
University-based (typically non-profit) providers of information and research services
Research products, information and other support provided free of charge as part of partnerships with financial education providers
• Academic research • University/college-level
academic curricula and associated materials
Consumer protection groups
Non-profit entities advancing consumer rights, accuracy of information about products and services, and fair competition
Consumer organizations Self-regulating business organizations, e.g., Better Business Bureaus
Government entities