NATIONAL TRANSPORTATION SAFETY · PDF filedocket no. sa 516 exhieutno. 8j national...
14
DOCKET NO. SA 516 EXHIEUTNO. 8J NATIONAL TRANSPORTATION SAFETY BOARD WASHINGTON, D.C. ASTM STANDARD D86: “STANDARD TEST METHOD FOR DISTILLATION OF PETROLEUM PRODUCTS.” Gordon J. Hookey
Transcript of NATIONAL TRANSPORTATION SAFETY · PDF filedocket no. sa 516 exhieutno. 8j national...

DOCKET NO. SA 516
EXHIEUTNO. 8J
NATIONAL TRANSPORTATION SAFETY BOARD
WASHINGTON, D.C.
ASTM STANDARD D86: “STANDARD TEST METHOD FORDISTILLATION OF PETROLEUM PRODUCTS.”
Gordon J. Hookey
#Tb Designation: D 86 - 95 An American National Standard
Standard Test Method for Distillation of Petroleum Products’
This standard is issued under the fixed designation D 86, the number immediately following the designation indicates the year of original adoption or, in the case of revision, the year of last revision. A number in parentheses indicates the year of last reapproval. A superscript epsilon (t) indicates an editorial change since the last revision or reapproval.
This standard has been approved for use by agencies of the Department of Defense. Consult the DOD inde? of Specijications and Standards for the specific year of issue which has been adopted by the Department of Defense.
1. Scope I .l This test method covers the distillation of natural
gasolines, motor gasolines, aviation gasolines, aviation tur- bine fuels, special boiling point spirits, naphthas, white spirit, kerosines, gas oils, distillate fuel oils, and similar petroleum products, utilizing either manual or automated equipment.
1.2 In cases of dispute, the referee test method is the manual test method prepared as directed for the indicated group.
1.3 The values stated in SI units are to be regarded as the standard. The values given in parentheses are provided for in formation only.
1.4 This standard does not purport to address all of the ,sufety concerns, if any, associated with its use. It is the responsibility of the user of this standard to establish appro- priate safety and health practices and determine the applica- bility of regulatory limitations prior to use.
2. Referenced Documents
2.1 ASTM Standards: D 323 Test Method for Vapor Pressure of Petroleum
Products (Reid Method)2 D 396 Specification for Fuel Oils2 D 850 Test- Method for Distillation of Industrial Aromatic
Hydrocarbons and Related Materials3 D 975 Specification for Diesel Fuel Oils2 D 1078 Test Method for Distillation Range of Volatile
Organic Liquids3 D 2892 Test Method for Distillation of Crude Petroleum
( 1%Theoretical Plate Column)4 D 4057 Practice for Manual Sampling of Petroleum and
Petroleum Products4 D 4 177 Practice for Automatic Sampling of Petroleum and
Petroleum Products4 D 4953 Test Method for Vapor Pressure of Gasoline and
Gasoline Oxygenate Blends (Dry Method)s D 5 190 Test Method for Vapor Pressure of Petroleum
Products (Automatic Method)s
1 This test method is under the jurisdiction of ASTM Committee D-2 on l’crr~~leum Products and Lubricants and is the direct responsibility of Subcom- tnittee DO2.08 on Volatility.
In the IP. this test method is under the jurisdiction of the Standardization (‘ummittee.
(‘urrenl edition approved Jan. 15, 1995. Published March 1995. Originally l~ublkhed as D 86 - 21. Last previous edition D 86 - 93.
2 .+tnual Book of ASTM Standards, Vol 05.01. ’ .4nntrol Book of ASTM Standards, Vol 06.04. 4 .~tmual Book o/ASTM Standards, Vol 05.02. ’ annual Book of ASTM Standards, Vol 05.03.
D 5 19 1 Test Method for Vapor Pressure of Petroleum Products (Mini Method)5
D5482 Test Method for Vapor Pressure of Petroleum Products (Mini Method-Atmospheric)5
E 1 Specification for ASTM Thermometer@ E 77 Test Method for Inspection and Verification of
Thermometer@ E 133 Specification for Distillation Equipment’ ’ E 220 Method for Calibration of Thermocouples by Com-
parison Technique@ IP 69 Determination of Vapour Pressure-Reid Method8 IP 17 1 Vapour Pressure Micro Method9
3. Terminology 3.1 Descriptions of Terms Specific to This Standard: 3.1.1 decomposition point-the thermometer reading that
coincides with the first indications of thermal decomposition of the liquid in the flask.
DlscussroN-Characteristic indications of thermal decomposition are an evolution of fumes, and erratic thermometer readings that usually decrease after any attempt is made to adjust the heat.
3.1.2 dry point-the thermometer reading that is observed at the instant the last drop of liquid evaporates from the lowest point in the flask. Any drops or film of liquid on the side of the flask or on the thermometer are disregarded.
DIscussroN-The end point (final boiling point), rather than the dry point, is intended for general use. The dry point can be reported in connection with special purpose naphthas, such as those used in the paint industry. Also, it is substituted for the end point (final boiling point) whenever the sample is of such a nature that the precision of the end point (final boiling point) cannot consistently meet the require- ments given in the Precision Section.
3.1.3 end point or fmal boiling point-the maximum thermometer reading obtained during the test. This usually occurs after the evaporation of all liquid from the bottom of the flask. The term maximum temperature is a frequently used synonym.
3.1.4 initial boiling point-the thermometer reading that is observed at the instant that the first drop of condensate falls from the lower end of the condenser tube.
3.1.5 percent evaporated-the sum of the percent recov- ered and the percent loss.
6 Annual Book of ASTM Standards, Vol 14.03. r 7 Annual Book of ASTM Standards, Vol 14.02. * Available from The Institute of Petroleum, 6 I New Cavendish St., London,
W 1 M 8AR, England. 9 Withdrawn 1992, contact The Institute of Petroleum for availability,
1 6 i refe
E 1. con
6. Spec
r: as sl 1 (of:
6. and
6.. E 13
6.: E 13
6.f Boar (2-in.
6.7
!
3.1.6 percent loss-one hundred minus the percent total recovery.
3.1.7 percent recovered-the volume in millilitres of con- densate observed in the receiving graduate, in connection with a simultaneous thermometer reading.
3.1.8 percent recovery-the maximum percent recovered, as observed in accordance with 9.10.
3.1.9 percent residue-the volume of residue in millilitres measured in accordance with 9.11.
3.1.10 percent total recovery-the combined percent re- covery and residue in the flask, as determined in accordance with 9.12.
3.1.11 thermometer reading-the temperature of the sat- urated vapor measured in the neck of the ‘flask below the vapor tube.
4. Summary of Test Method 4.1 A 100 mL sample is distilled under prescribed condi-
tions that are appropriate to its nature. Systematic observa- tions of thermometer readings and volumes of condensate are made, and from these data, the results of the test are calculated and reported.
5. Significance and Use 5.1 The distillation (volatility) characteristics of hydrocar-
bons often have an important effect .on their safety and performance, especially in the case of fuels and solvents. Volatility is the major determinant of the tendency of a hydrocarbon to produce potentially explosive vapors. It is also critically important for both automotive and aviation gasolines, affecting starting, warmup, and tendency to vapor lock at high operating temperature or at high altitude, or both. The presence of high boiling point components in these and other fuels can significantly affect the degree of formation of solid combustion deposits. ’ 5.2 Volatility, as it affects rate of evaporation, is also an
important factor in the application of many solvents, partic- ularly those used in paints.
5.3 Petroleum product specifications generally include distillation limits to assure products of suitable volatility performance.
6. Apparatus ,,6.1 Unless noted otherwise, all of the section and tigure
reference numbers in 6.2 through 6.8 refer to Specification E.133, the specification to which all the items Listed shall conform.
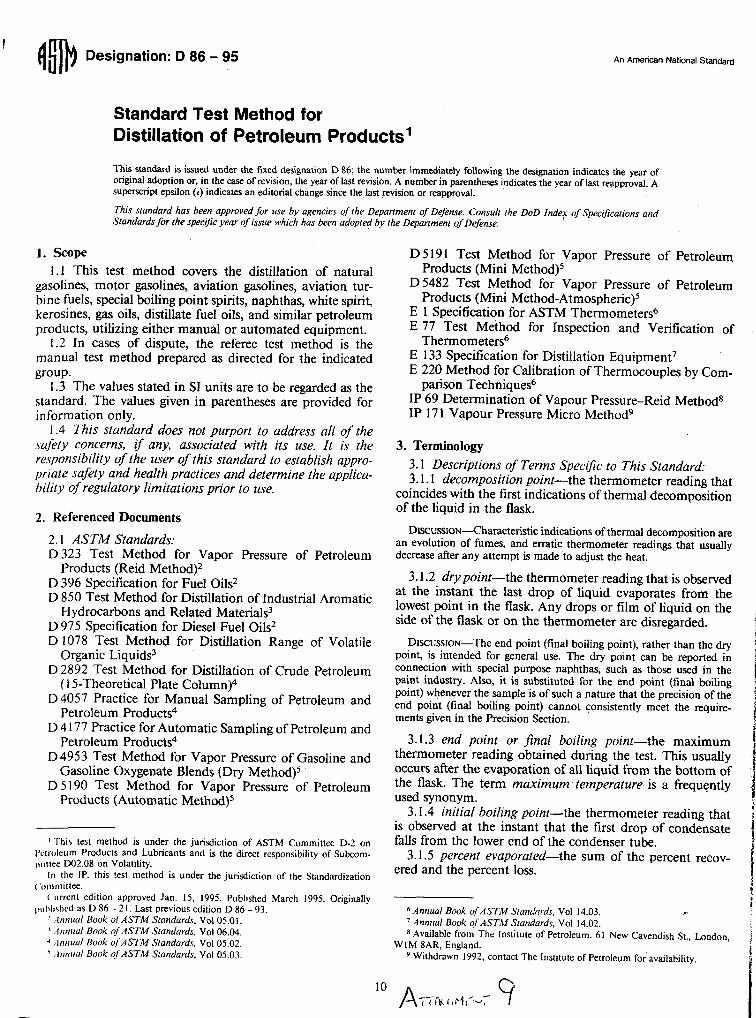
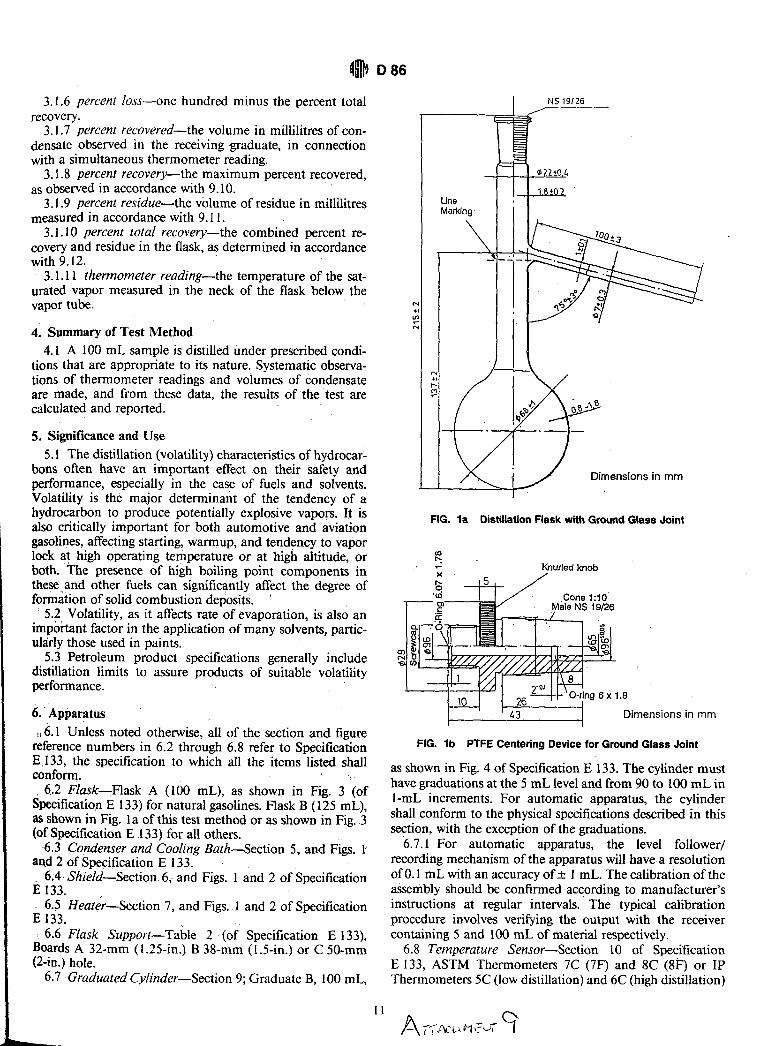
6..2 Flask-Flask A (100 mL), as shown in Fig. 3 (of Specification E 133) for natural gasolines. Flask B ( 125 mL), aS shown in Fig. la of this test method or as shown in Fig. 3 (Of Specification E 133) for all others.
.6.3 Condenser and Cooling Bath-Section 5, and Figs. l an-d 2 of Specification E 133.
6;4’Shield-Section. 6$ and Figs. 1 and 2 of Specification E133.
6.5 Heater-Section 7, and Figs. 1 and 2 of Specification Ii 133.
6.6 Flask Support-Table 2 (of Specification E 133) Boards A 32-mm ( 1.25-in.) B 38-mm (1.5-in.) or C 50-mm (2-m.) hole.
6.7 ,Graduated Cylinder-Section 9; Graduate B, 100 mL,
Line Marking-
‘\ ‘( --
Dimensions in m m
FIG. la Distillation Flask with Ground Glass Joint
R Knurled knob
.a
Dimensions in m m
FIG. lb PTFE Centering Device for Ground Glass Joint
as shown in Fig. 4 of Specification E 133. The cylinder must have graduations at the 5 mL level and from 90 to 100 mL in I-mL increments. For automatic apparatus, the cylinder shall conform to the physical specifications described in this section, with the exception of the graduations.
6.7.1 For automatic apparatus, the level follower/ recording mechanism of the apparatus will have a resolution of 0.1 mL with an accuracy off 1 mL. The calibration of the assembly should be confirmed according to manufacturer’s instructions at regular intervals. The typical calibration procedure involves verifying the output with the receiver containing 5 and 100 mL of material respectively.
6.8 Temperature Sensor-Section 10 of Specification E 133, ASTM Thermometers 7C (7F) and SC (SF) or IP Thermometers 5C (low distillation) and 6C (high distillation)

Thermometer Rudy or PT-100 +
I
c--l--L Compression Nut L / 1 )
Compression O-Ring
PTFE Body
gjp
Double O-Rings Won or Perfluoro Elastomer.
Precision Bore
FIG. 2 Centering Device for Straight-Bore Neck
Flask
conforming to the IP Specifications for Standard Thermom- eters. Under certain test conditions the bulb of the thermom- eter can be 28°C (50°F) above the temperature indicated, and at an indicated temperature of 371°C (700°F) the tempera- ture of the bulb is approaching a critical range in the glass. Thermometers that have been exposed to such conditions are not to be reused without checking their ice point to verify calibration as prescribed in Specification E 1 and Test Method E 77.
6.8.1 Temperature measurement systems using thermo- couples or resistance thermometers must exhibit the same temperature lag and accuracy as the equivalent mercury in glass thermometer. Confirmation of the calibration of these temperature sensors is to be made on a regular basis. This can be accomplished as described in Method E 220, potentiometrically by the use of standard precision resis- tance, depending on the type of probe. Another technique is to distill pure toluene in accordance with Test Method D 850 and compare the temperature indicated with that shown by the above mentioned mercury in glass thermometers when carrying out a manual test under the same conditions.
NOTE I-When running the test by the manual method, products with a low initial boiling point may have one or more readings obscured by the centering device.
NOTE 2-Toluene is shown in reference manuals as boiling at I 10.6’C under the conditions of Test Method D 1078 that uses a partial immersion thermometer. Because this test method uses total immersion thermometers the results will be lower and different with each. The approximate figures are Thermometer 7C (7F) or IP 5C at 109°C (228’F), and Thermometer 8C (8F) or IP 6C at 110°C (230°F).
6.8.2 The temperature sensor shall be mounted through a snug-fitting device designed to mechanically center the
sensor in the neck of the flask. The use of a cork or silicone stopper with a hole drilled through the center is not acceptable for this purpose. Examples of acceptable centering devices are shown in Figs. 1 and 2.
7. Sampling 7.1 Determine the GROUP characteristics that corre-
spond to the sample to be tested (see Table 1). Where the procedure is dependent upon the group the section headings will be so marked.
7.2 Sampling shall be done in accordance with Practice D 4057 or Test Method D 4177 and as described in Table 2.
7.2.1 GROUP O-Collect the sample in a bottle previ- ously cooled to 0 to 4.5”C (32 to 40°F) preferably by immersing the bottle in the liquid, where possible, and discarding the first sample. Where immersion is not possible, the sample shall be drawn off into the previously cooled bottle in such a manner that agitation is kept at a minimum. Close the bottle immediately with a tight-fitting stopper and place the sample in an ice bath or refrigerator to maintain the sample at that temperature.
7.2.2 GROUPS 1 and 2-Collect and maintain the sample as described in 7.2.1 at a temperature of 0 to 10°C (32 to 50°F).
7.2.3 GROUPS 3 and 4-Maintain the sample at am- bient temperature. If sample is not fluid at ambient temper- ature, it is to be maintained at a temperature of 11°C (20°F) above its pour point.
7.3 Samples of materials that visibly contain water are not suitable for testing.
7.3.1 GROUPS 0, 1, and 2-If the sample is not dry, obtain another sample that is free from suspended water for the test.
7.3.2 GROUPS 3 and 4--In cases where a water free sample is not practical, the suspended water can be removed by shaking the sample with anhydrous sodium sulfate or other suitable drying agent and separating it from the drying agent by decanting.
8. Preparation of Apparatus 8.1 Refer to Table 3 and prepare the apparatus as directed
for the indicated group. Bring the temperature of the graduate, the flask, the temperature sensor, and the cooling bath to the indicated temperature.
8.2 Make any necessary provisions so that the tempera- ture of the cooling bath and the graduate will be maintained at their respective temperatures. The cooling bath must have a liquid level above the highest point of the condenser. If necessary, make suitable provision for circulation, stirring, or air blowing to provide a uniform temperature throughout the bath. The graduate must be in a bath such that either the liquid level is at least as high as the 100 mL mark, or the entire graduate is surrounded by an air circulation chamber.
8.2.1 GROUPS 0, 1, 2, and 3-Suitable media for low temperature baths include chopped ice and water, refriger- ated brine, and refrigerated ethylene glycol.
8.2.2 GROUP 4-Suitable media for ambient and higher bath temperatures can include cold water, hot water, or heated ethylene glycol.
8.3 Remove any residual liquid in condenser tube by
II
F A IF FI
L TC
-
SW CO
prt rul an, inc
: tra
ig 8
de\ of cenl levr oft resi: tier.
8. well con{ that dist2 flask flask
8.;

4# D86
Sample Characteristics: Distillate Type:
Vapor pressure at 37.8’C, kPa 1 OO’F, psi
(Test Methods D 323, D 4953, D 5190, 05191. D5482. IP 690r IP 171)
TABLE 1 Group Characteristics Group 0 Group 1 Group 2
Natural Gasdine 2 65.5 < 65.5 2 9.5 -=c 9.5
Group 3
< 65.5 < 9.5
Group 4
< 65.5 < 9.5
Distillation, IPB ‘C OF
5 100 > 100 5 212 >212
EP ‘=C 5 250 5 250 > 250 > 250 OF 5 402 5 482 > 482 > 402
TABLE 2 Sampling
Temperature of Sample Bottle: ‘C OF
T~pWttuE! of Stored Sample: “C
OF
If sample is wet:
Group 0
0 to 4.5 32 to 40
0 to 4.5
32 to 40
Resample
Group 1
oto10 32 to 50
oto10
32 to 50
Resample
Group 2
oto10
32 to 50
Resample
Group 3 Group 4
Ambient Ambient 11 OC above pour point
Ambient Ambient 20°F above pour point
Dry in accordance Dry in Accordance with 7.3.2 with 7.3.2
TABLE 3 Preparation of Apparatus
F&k, mL ASTM Distillation Thermometer IP Distillation Thenometer Flask Support
Diameter of hole, mm (in.) Temperature at start of Test:
Flask and thermometer, “C OF
Flask support and shield
Graduate and 100 mL charge, ‘C OF
Group 0
100 7C (7F) 5c A 32 (1.25)
Grout 1
125 7C (7F) 5c B 30 (1.5)
0 to 4.5 13 to 18 32 to 40 55 to 65 Not above Not above ambient ambient 0 to 4.5 13 to 18 32 to 40 55 to 65
Grout 2
125 7C (7F) 5c
:8 (1.5)
13 to 18 55 to 65 Not above ambient 13 to 18 55 to 65
Group 3 Group 4
125 125 7C (7F) 8C @F) 5c 6c
Eo (2.0) C 50 (2.0)
13to18 55 to 65 Not above ambient 13to18 55 to 65
Not above ambient . . .
13 to ambient 55 to srnbient
swabbing with a piece of soft, lint-free cloth attached to a cord or copper wire.
8.4 GROUPS 0, 1, 2, and 3-Fit a thermometer 7C (7F), provided with a snug-fitting, well-rolled cork or silicone- rubber stopper, tightly into the neck of the sample container and bring the temperature of the sample to the temperature indicated in Table 3.
8.5 Measure 100 mL of sample in the graduate and transfer as completely as practical the contents of the graduate to the distillation flask, taking care that none of the Liquid flows into the vapor tube.
charge, without drying, into its bath under the lower end of the condenser tube so that the end of the condenser tube is centered in the graduate and extends therein for a distance of at least 25 mm (1 in), but not below the lOO-mL mark. Cover the graduate closely with a piece of blotting paper, or similar material, that has been cut to tit the condenser tube snugly.
8.9 Record the room temperature and prevailing baro- metric pressure. Proceed at once with the distillation. as given in the Procedure Section.
8.6 Fit the temperature sensor through a snug-fitting device designed to mechanically center the sensor in the neck of the flask. In the case of a thermometer, the bulb is centered in the neck and the lower end of the capillary is Level with the highest point on the bottom of the inner wall Of the vapor tube (see Fig. 3). In the case of thermocouple/ resistance thermometer, follow the manufacturer’s instruc- tions as to placement.
8.7 Fit the flask vapor tube, provided with a snug-fitting, well-rolled cork or silicone rubber stopper, tightly into the condenser tube. Adjust the flask in a vertical position and so that the vapor tube extends into the condenser tube for a distance of 25 to 50 mm (1 to 2 in). Raise and adjust the flask support board to tit snugly against the bottom of the flask.
8.8 Place the graduate that was used to measure the FIG. 3 Position of Thermometer in Distillation Flask
13 ’ c1

9. Procedure 9.1 Apply heat to the distillation flask and contents. The
heating at this stage must be so regulated that the time interval between the first application of heat and the initial boiling point is as indicated in Table 4.
9.2 Observe and record the initial boiling point. If a receiver deflector is not being used, immediately move the graduate so that the tip of the condenser touches its inner Wall.
9.3 Regulate the heating so that the time from initial boiling point to 5 or 10 % recovered is as indicated in Table 4.
9.4 Continue to regulate. the heating so that the uniform average rate of condensation from 5 or 10 % recovered to 5 mL residue in the flask is 4 to 5 mL per min.
9.5 Repeat any distillation that did not meet the foregoing conditions.
9.6 If a decompositioh point is observed, discontinue the heating and proceed as -directed in 9.10.
9.7 In the interval between the initial boiling point and the end of the distillation, observe and record data necessary for the calculation and reporting of the results of the test as required ‘by the specification involved, or as previously established for the sample -under test. These observed data can include thermometer.readings at prescribed percentages recovered, or percentages recovered at prescribed thermom- eter readings, or both. Record all volumes in the graduate to the nearest 0.5 or 0.1 mL, and all thermometer readings to the nearest 0.5”C (l.o”F) or 0. 1°C (O.l”F) as appropriate to the apparatus being used.
9.7.1 GROUP O-In cases in which no specific data requirements have been indicated, record the initial boiling point, the end point (final boiling point) and thermometer readings at each 10 % multiple of volume recovered from 10 to 90, inclusive.
9.7.2 GROUP 1, 2, 3, and 4-In cases in which no specific data requirements have been indicated, record the initial boiling point, the end point (final boiling point) or dry point, or both, and thermometer readings at 5, 15, 85 and 95 % recovered, and at each 10 % multiple of volume recovered from 10 to 90, inclusive.
9.8 When the residual liquid in the flask is approximately 5 mL, make a final adjustment of the heat so that the time from the 5 mL of liquid residue in the flask to the end point (final boiling point) shall be within the limits prescribed ih Table 4. If this condition is not satisfied, repeat the test, with appropriate modification of the final heat adjustment.
9.9 Observe and record the end point (final boiling point) or dry point, or both, as required, and discontinue the heating.
9.10 While the condenser tube continues to drain into the graduate, observe the volume of condensate at 2 min intervals until two successive observations agree. Measure this volume accurately, and record it, to the nearest 0.5 or 0.1 mL as appropriate to the apparatus being used, as percent recovery. If the distillation was previously discontinue’d under the conditions of a decomposition point, deduct the percent recovery from 100, report this difference as percent residue and loss, and omit the procedure given in 9.11.
9.11 After the flask has cooled, pour its contents into a 5 mL graduated cylinder, and with the flask suspended over the 5 mL graduate, allow the flask to drain until no appreciable increase in the volume of liquid in the 5 mL graduate is observed.
9.11.1 GROUP O-Cool the graduate to 0 to 4.5”C (32 tcr 40°F). Record the volume in the graduate, to the nearest 0.1, mL, as percent residue.
9.11.1 GROUPS 1, 2, 3, and 4-Record the volume in the graduate, to the nearest 0.1 mL, as percent residue.
9.12 The sum of the percent recovery (see 9.10) and the percent residue (see 9.11) is the percent total recovery. Deduct the percent total recovery from 100 to obtain the percent loss.
10. Calculations and Report 10.1 For each test, calculate and report whatever data are
required by the specification involved, or as previously established for the sample under test (see 9.7). Report all percentages to the nearest 0.5 or 0.1, and all thermometer readings to the nearest 0.5”C (l.o”F’) or O.l”C (O.l”F) as appropriate to the apparatus being used. Report the baro- metric pressure to the nearest 0.1 kPa (1 mm Hg).
Temperature of cooling bathA, “C OF
Temperature of bath around graduate, OC OF
TABLE 4 Conditions During Test Procedure
Group 0 Group 1 Group 2
0 to 1 0 to 1 oto 4 32 to 34 32 to 34 32to 40 0 to 4 13toie 13 to 16 32 to 40 55to 65 55to 65
Group 3
oto 4 32 to 40 13 to 16 55 to 65
Group 4
0 to 60 32 to 140 +3 +5 of charge
Time from first applimtion of heat to initial boiling ooint. minutes
2to 5 5to10 51010 5to10 temperature 5to15
Time frti initial boiling point * to 5 % recovered, seconds to 10 % recovered, minutes
Uniiorm average rate of condensation from 5 a recovered to 5 mL residue in flask, mL/min
Time rea&ed from 5 mL residue to end point, min
i’tb 4 4 to 5
3to 5
60 to 75 6oto75
4 to 5 4to5
3 to 5 3to 5
4to 5
5 max
. ,
4to 5
5max
’ The proper condenser bath temperature will depend upon the wax content of the sample and of its distillation fractions. The minimum temperature that permits satisfactoq operation shall be used. In general, a bath temperature in the 0 to 4°C (32 to 4O’F) range is suitable for kerosine and products meeting the specifications for Grade No. 1 fuel oil as prescribed in Specification D 396, and those meeting the specific&ins for Grade No. 1-D diesel fuel oil as prescribed in Specification D 975. In some cases involving Grade No.2 fuel oil (see Specification D 396), Grade No. 2-D diesel fuel oil (see Specification D 975), gas oils and similar diitillates, it may be necessary to hold the condenser bath temperature at some point in the 36 to 60% (100 to 14OV) range, in order to avoid the condensation of solid waxy materials in the condenser tube.
F
W
c
pk
P
Af the
-
1 1 1 1 1 2 2 2 2 2! 3. 3: 3c 3i 30
A Tc be subt
5 :r
it
CO .l
in
he Y- he
tre sly all
:ter as
.ro-
-
- erm Insi Isof ;ary 3en!
W
10.2 GROUP 4-When ASTM Thermometer SC (8F) or IP Thermometer 6C is used in testing aviation turbine fuels and similar products, pertinent thermometer readings can be obscured by the cork; To provide the desired data, a second distillation according to Group 3 may have to be performed. In such cases, reading from ASTM thermometer 7C (7F) or IP Thermometer 5C can be reported in place of the obscured ASTM Thermometer 8C (8F) or IP Thermometer 6C readings, and the test report shall so indicate. If, by agree- ment, the obscured readings are waived, the test report shall so indicate.
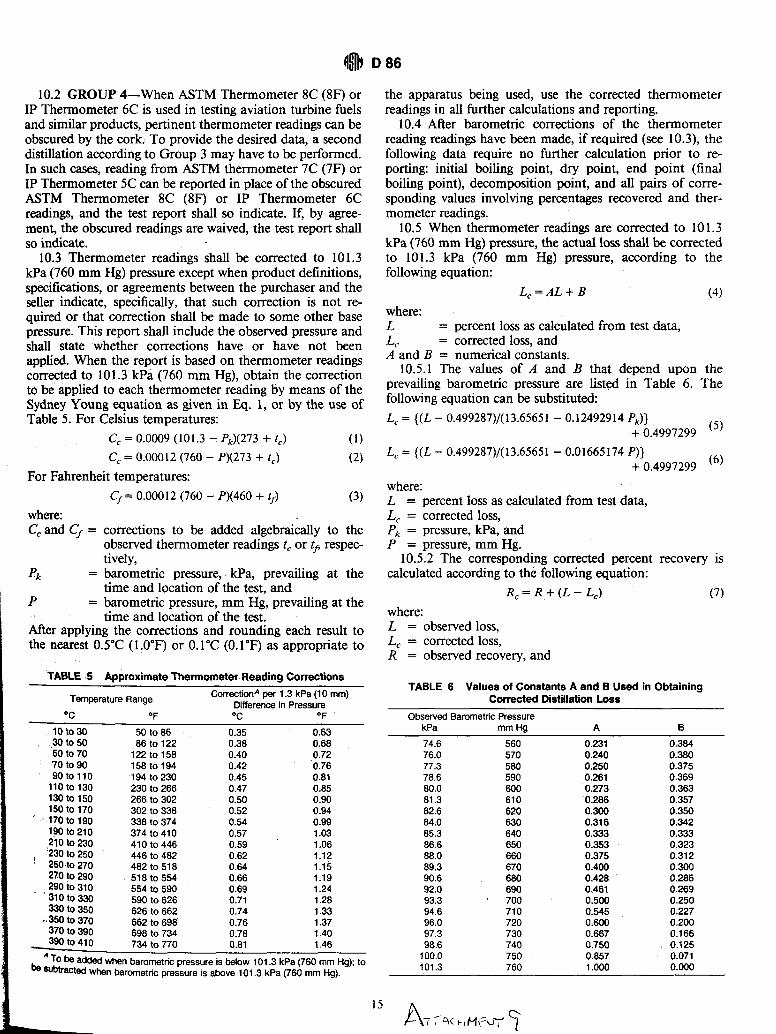
10.3 Thermometer readings shall be corrected to 101.3 kPa (760 mm Hg) pressure except when product definitions, specifications, or agreements between the purchaser and the seller indicate, specifically, that such correction is not re- quired or that correction shall be made to some other base pressure. This report shall include the observed pressure and shall state whether corrections have or have not been applied. When the report is based on thermometer readings corrected to 101.3 kPa (760 mm Hg), obtain the correction to be applied to each thermometer reading by means of the Sydney Young equation as given in Eq. 1, or by the use of Table 5. For Celsius temperatures:
Cc = 0.0009 (101.3 - PJ(273 + t,) (1) Cc = 0.00012 (760 - PM273 + t,) (2)
For Fahrenheit temperatures: C,= 0.00012 (760 - P)(460 + 9) (3)
where: C, and C, = corrections to be added algebraically to the
observed thermometer readings t, or trj respec- tively,
pk = barometric pressure, kPa, prevailing at the time and location of the test, and
P = barometric pressure, mm Hg, prevailing at the time and location of the test.
After applying the corrections and rounding each result to the nearest 0.5”C (1 .o”F) or 0. 1°C (O.l”F) as appropriate to
TABLE .5 Approximate Thermometer. Reading Corractions
Temperature flange CorrectionA per 1.3 kPa (10 mm) Difference in Pressure
T OF OC OF
1oto30 50 to 86 0.35 0.63 30 to 50 86 to 122 0.38 0.68 50 to 70 122 to 158 0.40 0.72 7oto90 158 to 194 0.42 0.76 9Oto110 194 to 230 0.45 0.81
110t0130 230 to 266 0.47 0.85 130 to 150 286 to 302 0.50 0.90 15oto170 302 to 338 0.52 0.94
’ 170t0190 338 to 374 0.54 0.99 Igo to 210 374 to 410 0.57 1.03 210 to 230 !230 to 410 to 446 0.59 1.06
/ 250 446 to 482 0.82 1.12 %@to 270 482 to 518 0.64 1.15 270 to 230 518 to 554 0.66 1.19 290 to 310
*31oto330 554 to 590 0.69 1.24 590 to 828 0.71 1.28
330 to 350 626 to 662 0.74 1.33 .a350 to 370 662
370 to 390 to 698 0.76 1.37
698 to 734 39Oto410
0.76 1.40 734 to 770 0.81 1.46
A To be added when barometric pressure is below 101.3 kPa (760 mm Hg); to bs subtracted when barometric pressure is above 101.3 kPa (760 mm Hg).
the apparatus being used, use the corrected thermometer readings in all further calculations and reporting.
10.4 After barometric corrections of the thermometer reading readings have been made, if required (see 10.3), the following data require no further calculation prior to re- porting: initial boiling point, dry point, end point (final boiling point), decomposition point, and all pairs of corre- sponding values involving percentages recovered and ther- mometer readings.
10.5 When thermometer readings are corrected to 101.3 kPa (760 mm Hg) pressure, the actual loss shall be corrected to 101.3 kPa (760 mm Hg) pressure, according to the following equation:
L,=AL+B (4) where: L = percent loss as calculated from test data, L = corrected loss, and A and B = numerical constants.
10.5.1 The values of A and B that depend upon the prevailing barometric pressure are listed in Table 6. The following equation can be substituted: Lc = {(L - 0.499287)/(13.65651 - 0.12492914 Pk))
+ 0.4997299 (5)
L, = ((L - 0.499287)/(13.65651 - 0.01665174 P)} + 0.4997299 (6)
where: L = percent loss as calculated from test data, L, = corrected loss, Pk = pressure, kPa, and P = pressure, mm Hg.
10.5.2 The corresponding corrected percent recovery is calculated according to the following equation:
R,=R +(L-L,) (7) where: L = observed loss, L, = corrected loss, R = observed recovery, and
TABLE 6 Values of Constants A and B Used in Obtaining Corrected Distillation Loss
Observed Barometric Pressure kPa mm Hg
74.6 560 76.0 570 77.3 560 78.6 590 80.0 600 81.3 610 82.6 620 84.0 830 85.3 840 86.6 650 88.0 860 89.3 870 90.6 680 92.0 690 93.3 700 94.6 710 96.0 720 97.3 730 98.6 740
100.0 750 101.3 760
A B
0.231 0.384 0.240 0.380 0.250 0.375 0.261 0.369 0.273 0.363 0.286 0.357 0.300 0.350 0.316 0.342 0.333 0.333 0.353 0.323 0.375 0.312 0.400 0.300 0.428 0.286 0.461 0.269 0.500 0.250 0.545 0.227 0.600 0.200 0.667 0.166 0.750 / 0.125 0.857 0.071 1.000 0.000
R,. = corrected recovery. 10.5.3 When the thermometer readings have not been
corrected to 101.3 kPa (760 mm Hg) pressure, the percent residue and percent loss are to be reported as observed in accordance with 9.11 and 9.12 respectively.
10.5.4 When reporting data, state whether the corrections have or have not been applied.
10.5.5 The corrected loss shall not be used in the calcula- tion of percentages evaporated.
10.6 It is advisable to base the report on relationships between thermometer readings and percentages evaporated in any case in which the sample is a gasoline, or any other product classed under GROUP 1, or in which the percent loss is greater than 2.0. Otherwise, the report can be based on relationships between thermometer readings and percentages evaporated or recovered. Every report must indicate clearly which basis has been used.
10.7 To report percentages evaporated at prescribed ther- mometer readings, add the percent observed loss to each of the observed percentages recovered at the prescribed ther- mometer readings, and report these results as the respective percentages evaporated, that is:
P, = P, + L (8) where: L = observed loss, P, = percentage evaporated, and P, = percentage recovered.
10.8 To report thermometer readings at prescribed per- centages evaporated, use either of the two following proce- dures, and indicate on the report whether the graphical procedure or the arithmetical procedure has been used.
10.8.1 Arithmetical Procedure-Deduct the observed dis- tillation loss from each prescribed percentage evaporated in order to obtain the corresponding percentage recovered. Calculate each required thermometer reading as follows:
T=T +(*H-*,)(R-R,) L
&r-R,
(9)
where: R = percent recovered corresponding to the prescribed
percent evaporated, R, = percent recovered adjacent to, and higher than R, R, = percent recovered adjacent to, and lower than R, T = thermometer reading at the prescribed percent evap-
orated. TH = thermometer reading recorded at R, and TL = thermometer reading recorded at R,. Values obtained by the arithmetical procedure are affected by the extent to which the distillation graphs are nonlinear. Intervals between successive data points can, at any stage of the test, be no wider than the intervals indicated in 9.7. In no case shall a calculation be made that involves extrapolation.
10.8.2 Graphical Procedure-Using graph paper with uni- form subdivisions, plot each thermometer reading corrected for barometric pressure, if required (see 10.3), against its corresponding percent recovered. Plot the initial boiling point at 0 % recovered. Draw a smooth curve connecting the points. For each prescribed percent evaporated, deduct the distillation loss, in order to obtain the corresponding percent recovered, and take from the graph the thermometer reading which this percent recovered indicates. Values obtained by
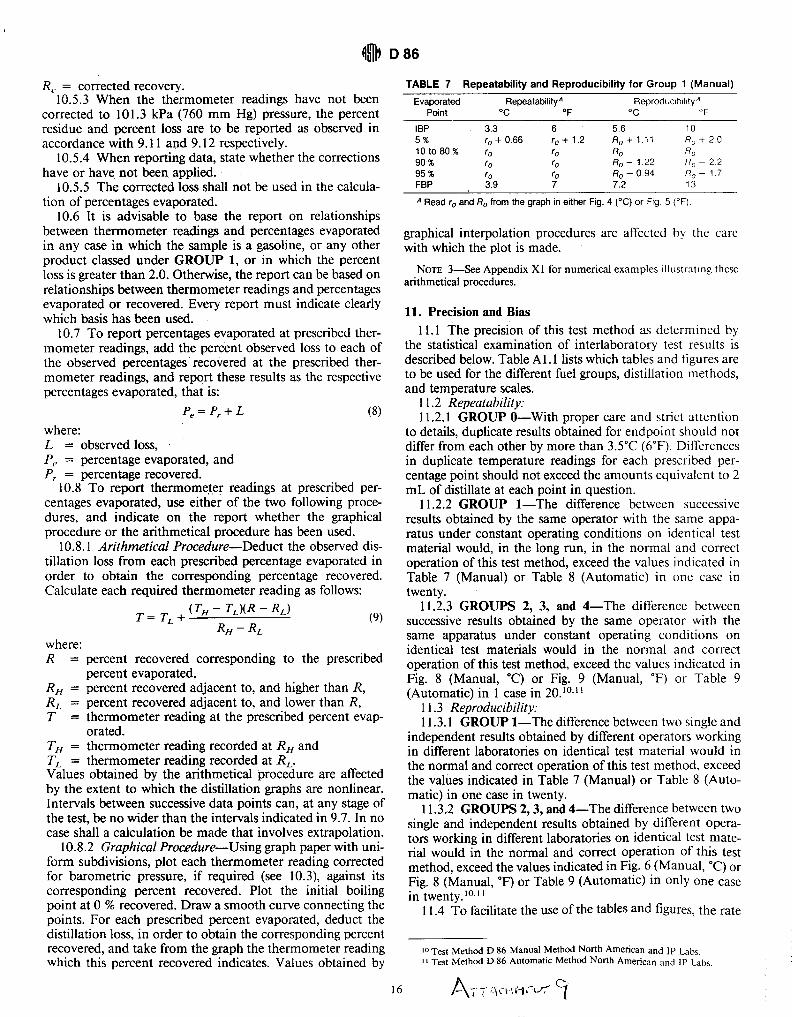
TABLE 7 Repeatability and Reproducibility for Group 1 (Manual) Evaporated RepeatabilityA Reproduc~b~l~tyA
Point “C OF “C “F
IBP 3.3 6 5.6 10 5% r. + 0.66 r, + 1.2 R, + 1.11 &A20 lOto80W r0 ro Ro Ro 90% r. r. R, - 1.22 R-22 95 % r. r. R, - 0.94 R, - 1.7 FBP 3.9 7 7.2 13
1 Read r. and R, from the graph in either Fig. 4 (“C) or Fig 5 (“F).
graphical interpolation procedures are affected by the care with which the plot is made.
NOTE 3-See Appendix Xl for numerical examples illustrating these arithmetical procedures.
11. Precision and Bias 11.1 The precision of this test method as determined by
the statistical examination of interlaboratory test results is described below. Table Al. 1 lists which tables and figures are to be used for the different fuel groups, distillation methods, and temperature scales.
11.2 Repeatability: 11.2.1 GROUP O-With proper care and strict attention
to details, duplicate results obtained for endpoint should not differ from each other by more than 3.5”C (6°F). Differences in duplicate temperature readings for each prescribed per- centage point should not exceed the amounts equivalent to 2 mL of distillate at each point in question.
11.2.2 GROUP l-The difference between successive results obtained by the same operator with the same appa- ratus under constant operating conditions on identical test material would, in the long run, in the normal and correct operation of this test method, exceed the values indicated in Table 7 (Manual) or Table 8 (Automatic) in one case in twenty.
11.2.3 GROUPS 2, 3, and 4-The difference between successive results obtained by the same operator with the same apparatus under constant operating conditions on identical test materials would in the normal and correct operation of this test method, exceed the values indicated in Fig. 8 (Manual, “C) or Fig. 9 (Manual, “F) or Table 9 (Automatic) in 1 case in 20.‘“*‘i
11.3 Reproducibility: 11.3.1 GROUP l-The difference between two single and
independent results obtained by different operators working in different laboratories on identical test material would in the normal and correct operation of this test method, exceed the values indicated in Table 7 (Manual) or Table 8 (Auto- matic) in one case in twenty.
11.3.2 GROUPS 2,3, and 4-The difference between two single and independent results obtained by different opera- tors working in different laboratories on identical test mate- rial would in the normal and correct operation of this test method, exceed the values indicated in Fig. 6 (Manual, “C) or Fig. 8 (Manual, OF) or Table 9 (Automatic) in only one case in twenty. lo,’ ’
I I .4 To facilitate the use of the tables and figures, the rate
IO =est Method D 86 Manual Method North American and ]p ~~~~~ I I lest Method D 86 Automatic Method North Am&can and [p ~~~~
-
I -
;z
bet the abc poi rep.

4# D86
re
se
'Y is re iss,
Ml ot :es :r- I2
ve 3a- est xt in in
:en the on -ect i in : 9
and kg i in .eed Ato
twc ,era .ate 7; cas
P 0
B 0
e 4
3
2
t
0
“C/V%
NOTE- r, = 0.864 (“C/V 9) + 1.214 (14) R, = 1.736 (“C/V W) + 1.994 (15)
FIG. 4 GROUP l-Repeatability, r,, and Reproducibility, &lo
NOTE- r,, = 0.864 (OF/V W) + 2.186 (16) R. = 1.736 (OF/V %a) + 3.589 (17)
FIG. 5 GROUP l-Repeatability, r, and Reproducibility, R,‘O
TABLE 8 Repeatability and Reproducibility for Group 1 (Automatic)
Evaporated Repeatability” ReproducibilityA Point “C OF “C OF
IBP 3.9 7 7.2 13 5% r. f 1.0 r,, + 1.8 R. + 1.78 R. f 3.2 10% r. + 0.56 r. + 1 .o R, f 0.12 fl,+ 1.3 20 % r. ‘0 R, f 0.72 R,+ 1.3 30 to 70% r, r. Ro % 80 % r. r. R, - 0.94 R, - 1.7 90% r0 r. R. - 1.9 R. - 3.5 95% r, + 1.4 r, + 2.5 Ro Ro FBP 4.4 8 8.9 16
* Read r, and R. from the graph in either Fig. 6 (“C) or Fig. 7 (OF).
of change in thermometer readings in degrees Celsius (Fahrenheit) per the percentage recovered, at any point between the 10 and 90 % point, is assumed to be the same as the average rate between two data points that are equidistant above and below the point in question. The span from the point in question to either of the other data points does not represent more than 10 % recovered in any case, nor more
e 5
4
.l
2
1 ’ I I I I I I I I I
0 , I 1 I ! 0.0 1.0 l.0 zo 20 3.0 3.0 4.0 42
“C/V%
NOTE- r. = 0.673 (“C/V X) + 1 ,131 (18) R. = 1.998 (“C/V %) + 2.617 (19)
FIG. 6 GROUP l-Repeatability, r, and Reproducibility, Rol’
22
20
18
16
141 c)
& F
10
I I I I - I 8 I /
6----t’ I I
4-. -y
2-, 4 r0
NOTE- r, = 0.673 (OF/V %) + 2.036 (20) R, = 1.998 (‘F/V %) + 4.711 (21)
FIG. 7 GROUP l-Repeatability, r, and Reproducibility, Roql
TABLE 9 Repeatability and Reproducibility for Groups 2,3, and +l (Automatic)
% RepeatabilityA ReproducitMiiA Collected OC OF YZ OF
IBP 3.5 6.3 8.5 15.3 2% 3.5 6.3 2.6 + 1.92 S 4.7 + 1.92 S 5% 1.1 + 1.08s 2.0 + 1.08s 2.0 + 2.53 S 3.6 + 2.53 S 10% 1.2 + 1.42 S 2.2 + 1.42s 3.0 + 2.64 s 5.4 + 2.64 s 2oto70% 1.2+1.42s 2.2 + 1.42 S 2.9 + 3.97 s 5.2 + 3.97 S 80 W 1.2 + 1.42 S 2.2 -I- 1.42 S 3.0 + 2.64 s 5.4 + 2.64 s 9Oto95X 1.1 +l.O8S 2.0 + 1.08 s 2.0 + 2.53 S 3.6 + 2.53 S FBP 3.5 6.3 10.5 18.9
* S is the average slope calculated in accordance with 11.4.
than 5 % if the point in question is the 5 % point. Precision values for typical values of slope for GROUPS 2, 3, and 4 (Automatic) are given in Table 10.
11.4.1 The equations that follow are used as guidelines in calculating C/V % (F/V%). In the event the distillation end point occurs prior to the 95 % point, then appropriate modifications to the use of these equations must be made.

RE 'c
t m
t 2.0
t I.5
t
4
t 23
t 2
t 1.3
t.
I
I E TP I ET P
REPR
t 7
t 8.5
t 6
t 3.5
t 5
t 4.5
t 4
t 5.5
t
i
llClBll T
I
t 73
t 7
t 63
t 8
t 5.5
t s
t 4.5 t 4
t 3.5
t
t 2s t :
-5’
I-4.
-S’
- 2.
-1.
-0
NOTE- I = initial boiling point, “C, E = end point (final boiling point) or dry point, “C, 7 = thermometer reading at prescribed percent evaporated or
recovered, OC, and P = percent evaporated or recovered at prescribed thermometer
reading, ‘C.
FIG. 8 Groups 2, 3, 4-Manual Method-Celsius Precision of Distillation Test Method D 66 - IP 123
11.4.2 For Group 1 in the manual method and for all groups in the automatic method, the initial boiling point and end point do not require C/V% (F/V%).
11.4.3 For Groups 2, 3, and 4 in the manual method, the rate of change in thermometer readings in degrees Celsius per percentage recovered should be calculated from the nearest reading (5 % in the case of the IBP, and either 90 or 95 % in the case of FBP) and the corresponding IBP or FBP.
11.4.4 5 % recovered is calculated as follows: C/V%, F/V% = O.l(T,, - T,& (10)
11.4.5 10 to 80 % recovered is calculated as follows: C/V%, F/V% = O.OW,,,, - Ttv-& (11)
11.4.6 90 % recovered is calculated as follows: C/V %, F/V % = 0. 1( T,, - T,,) (12)
11.4.7 95 % recovered is calculated as follows: C/V %, F/V % = 0.2( Tg5 - T,,) (13)
where:
EPEATAI OF
4
i 3
I 2
i 1 I
BlLl OF
I 5
t 4
t 3
i 2
I I E T P I ET P
‘R !!E OF
I 1
f 11
t to
t 9
t e
t 7
t
1
:
Cl6lLl1 OF
t 1
f 1
-F 11
t 10
t
3 8
t 7
t
i 5
t 4
8
I
6
5
4
3
,2
NOTE-/ = initial boiling point, OF, E = end point (final boiling point) or dry point, OF. 7 = thermometer reading at prescribed percent evaporated cf
recovered, OF, and P = percent evaporated or recovered at prescribed thermometer
reading, OF. FIG. 9 Groups 2,3,4-Manual Method-Fahrenheit Precision of
Distlllatlon Test Method D 86 - IP 123
C/V % = rate of change in temperature at the volume percent in question, “C,
F/V % = rate of change in temperature at the volume percent in question, “F, and
T = temperature at the percent volume recovered indicated by the subscript, “C or “F,
subscripts: V = volume percent recovered in question, v- 10 = 10 % less than volume percent in question, V + 10 = 10 % more than volume percent in question, and IBP, 5, 10, 80, 90, 95 = appropriate volume percent
indicated. 11.5 Bias: 11.5.1 Absolute Bias-Due to the use of total immersion
thermometers or temperature sensing systems designed to emulate them, the distillation temperatures in this test method are somewhat lower than the true temperature. The amount of absolute bias has not been determined.
11.5.2 Relative Bias-There exists a bias between the empirical results of distillation properties obtained by this

; 12.1 distillates; distillation; petroleum products
5
4
3
-2
-1 (Mandatory Information)
-0
TABLE Al.1 Summary of Aids for Definition of Repeatability and Reproducibility
Group
0
1
1
234
2.W
Distillation Method
ne
Manual or Automatic Manual
Automatic
Manual
Automatic
.ne
-ed
md ent
iion 1 to test The
the thti
test method and the true boiling point distillation curve obtained by Test Method D 2892. The amount of relative bias between the two test methods has not been determined.
11.5.2. I Groups I, 2, 3, and &-Refer to Tables Al.2 A1.3, and Al .4 for the statement of bias between automatic and manual apparatus.
12. Keywords
TABLE 10 Observed Precision Values for Typical Values of Slope Groups 2, 3, and 4 (Automatic)
% Collf2cted slope Repeatability Reproducibility “Cl %V “F/%V ‘=C OF ‘C OF
20 to 70 % 0.5 0.9 1.5 2.7 4.5 a.1 1.0 i .a 2.5 4.5 6.5 11.7 1.5 2.7 3.0 5.4 a.5 15.3 2.0 3.6 4.0 7.2 10.5 18.9 2.5 4.5 4.5 8.1 12.5 22.5
10 and 80 % 0.5 0.9 1 ..?I 2.7 4.0 7.2 1.0 1.0 2.5 4.5 5.5 9.9 1.5 2.7 3.0 5.4 7.0 12.6 2.0 3.6 4.0 7.2 8.0 14.4 2.5 4.5 4.5 8.1 9.5 17.1
5,90, and 95 % 1 .o i .a 2.0 3.6 4.5 a.1 2.0 3.6 3.0 5.4 7.0 12.6 3.0 5.4 4.0 7.2 9.5 17.1 4.0 7.2 5.0 9.0 12.0 21.6
2% 2.0 3.6 3.5 6.3 6.0 10.8 3.0 5.4 3.5 6.3 8.0 14.4 4.0 7.2 3.5 6.3 10.0 18.0 5.0 9.0 3.5 6.3 12.0 21.6
IBP 3.5 6.3 a.5 15.3 FBP , 3.5 6.3 10.5 la.9
ANNEX
Temperature Table, Section, and Scale Figure to Use
11.2.1 ‘C or OF
*C OF T OF “C OF “C OF
Table 7 and Fig. 4 Table 7 and Fig. 5 Table 8 and Fig. 6 Table 8 and Fig. 7 Fig. 8 Fig. 9 Tables 9 or 10 Tables 9 or 10

TABLE Al.2 Condensed Summary of Comparative Manual and Automatic Distillation Results NOTE-All thermometer readings were corrected to 101.3 kPa (760 mm Hg) pressure. The left-hand figures were manually obtained, and the right-hand figures represent
corresponding results from the automatic apparatus. -
Max Min Average
Max Min
Gasdine-Twenty six laboratories and fourteen samples (see Table Al .3) Kercsine-Eight tests in four laboratories for manual, and six tests in three laboratories for automatic
176.5, 174.5 1935,193 215.5, 215.5 248. 248.5 171.5. 172 191, 190.5 213.5, 214 245.5, 246.5 174.5, 173.5 191.5,191.5 214.5, 214.5 246, 247
Diesel Fuel-Ten tests in five laboratories for manual and for automatic 190.5, 189 215, 218 268.5, 269 322,323 179.5. 179.5 208.5. 208.5 264.264 318. 316
268, 268.5 264, 285 265.5, 266.5
341.5, 343 337. 338.5
Average 165.5; 184.4 213, ‘214 266; 286 319.5, 318.5 340. 340.5
Fahrenheit
Max Min Average
Max Min Average
Gasoline-Twenty six laboratories and fourteen samples (Bea Table Al .4) Initial Boiling 10% 50% 90 %
Point Evaporated Evaporated Evaporated Kerosine--Eight tests in four laboratories for manual, and six tests in three labcratcries for automatic
350.346 380,379 420,420 478,479 341,342 376.375 416,417 474,476 346,344 377,377 418,418 475.477
Diesel Fuels Ten tests in five laboratories for manual and for automatic 375,372 419, 424 515, 516 612.613 355,355 407,407 507,507 604,601 366,364 415.417 511.511 607.605
End Point (Final Boiling Point)
514,515 507,509 510, 512
647,649 639,641 644,645
TABLE Al.3 Bias Between Methods (ADA-Manual) OC (Based on Averages of ASTM and IP Data)
samde IBP 5% 10 % 20 % 30 % 40 % 50 % 60% 70% 80% 90% 95 % FBP 8amofe
1 +1 .l +1.9 +2.2 +1.6 +1.4 io.7 +0.8 +0.7 +0.7 +0.1 +0.4 +0.7 -0.4 1 2 (+0.9) (0.0) +0.8 +0.5 +0.4 +0.6 +0.2 +0.1 +0.1 +0.4 (+4.7)e (+1.3)a (-1.2)s 2 3 +0.7 +1.4 +I .6 +1 .o +o.a +0.6 +0.3 +0.1 +0.2 +0.9 +0.5 +0.1 -0.8 3 4 +0.3 +0.6 +0.8 +0.8 +0.3 +0.7 +0.6 +o.a +1 .l +1.2 +0.8 +0.5 -0.9 4 5 +0.5 +1.3 +1.3 +1.3 +1.2 +1 .o +0.9 +0.6 +0.8 +1 .o +0.4 +0.4 -0.9 5 6 ii .2 +1.2 +1.6 +1.2 +1.2 fl .l +0.8 +1 .I +1.2 +0.2 -0.1 +0.2 -0.3 6 7 +0.3 +0.8 +o.a +0.7 +0.8 +o.a +1.0 +1.5 +I.6 +1.6 +1.5 +1.7 -0.7 7 8 +0.3 +0.5 +0.7 +0.6 +0.7 fl.2 +1.2 +1 .l +1.3 +1.9 +1 .l +1.2 -0.8 8 9 +1.7 +2.0 -Il.8 +1.5 fl.5 fl.5 +1.2 +0.9 +1.3 +0.6 -0.4 +0.4 -1.2 9
10 +1.5 +1.5 +1.2 +0.7 f0.4 +0.6 +0.9 +1.0 +1.4 +1.9 +0.9 +0.1 -2.1 10 11 +0.9 +1 .l +1.2 +0.0 +0.7 +0.6 +1.1 +1 .o +0.4 +0.5 -0.4 +0.1 -0.8 11 12 +1.0 (+2.4)e +2.3 +1.2 fl.2 +1.2 +1.2 +0.9 +1 .l +0.2 -0.7 (-o.sy -0.9 12 13* +0.3 +0.3 +0.4 +0.3 +0.2 +0.9 +1.4 +1.0 +0.1 +1 .I +1.2 +1 .o -1.2 134 144 +0.5 +0.4 +0.7 +0.5 +0.8 +1.1 +1.7 +1.7 +1 .o iO.8 +0.3 0.0 -0.8 144
* Gesohols. e ( ) Points not incfuded in the precision analysis.
TABLE Al.4 Bias Between Methods (ADA-Manual) OF (Based on Averages of ASTM and IP Data)
-pie IBP 5% 10 % 20 % 30 % 40 % 50 % 60% 70 % 80% 90% 95 % FBP Sample
: +1.9 +3.4 +4.0 t2.9 +2.5 +1.2 +1.4 +1.2 +1.3 +0.1 +o.a +1.2 -0.7 1
(+1.6)a (0.0)6 +1.5 +0.9 +0.7 +1.1 +0.4 +0.2 +0.1 +0.7 (+8.4)e (+2.3)a (-2.2)8 2 3 ii .2 +2.5 +2.8 +1.7 +1.4 +1 .o +0.5 +0.1 +0.4 +1.6 +0.9 +0.1 -1.4 3 4 +0.5 +1 .l +1.5 +1.4 +0.6 +1.2 +1.1 +1.4 +1.9 +2.1 +1.4 +0.9 -1.7 4 5 +0.9 +2.3 +2.3 +2.3 +2.1 +1.7 +1.6 +1.0 +1.4 +1.8 +0.7 +o.a -1.7 5 6 +2.1 +2.2 +2.a +2.2 +2.1 +2.0 +1.4 +2.0 +2.1 +0.4 -0.1 +0.4 -0.5 6 7 +0.6 +1.4 +1.4 +1.3 +1.5 +1.5 +I .6 +2.6 +2.8 +2.a +2.6 +3.1 -1.3 7 8 +0.6 +0.9 +1.3 +1 .o +1.2 +2.1 +2.1 +2.0 +2.4 +3.4 +2.0 +2.1 -1.4 8 9 +3.1 +3.5 +3.2 +2.7 +2.6 i2.7 +2.1 +I .6 +2.3 +1 .I -0.7 +0.8 -2.1 9
10 +2.7 -12.7 +2.1 +1.2 +o.a +1.0 +1.6 +1.7 +2.5 +3.4 +1.6 +0.2 -3.8 10 11 +1.6 +2.0 +2.1 +1.4 +1.2 +1.0 +1.9 +1.7 +o.a +0.9 -0.7 +0.2 -1.4 11 12 +1.0 (+4.2)* +4.1 +2.1 +2.2 +2.1 +2.1 fl.6 +1.9 +0.4 -1.2 -1.7 12 13A +0.5 +0.5 +0.7 +0.5 +0.3 +I.6 +2.5 +1.7 +0.2 +2.0 +2.1
‘;;:;P -2.2 138
14” +0.9 +0.7 +1.2 +0.9 +1.4 +2.0 +3.0 +3.0 +1 .a +1.5 +0.6 0.0 -1.4 148
A Gasohols. * ( ) Points not induded in the precision analysis.
f
n
(:
El
Rt T*-
T,
20
nt
d# D 86
APPENDIXES
(Nonmandatory Information)
Xl. EXAMPLES ILLUSTRATING CALCULATIONS FOR REPORTING OF DATA
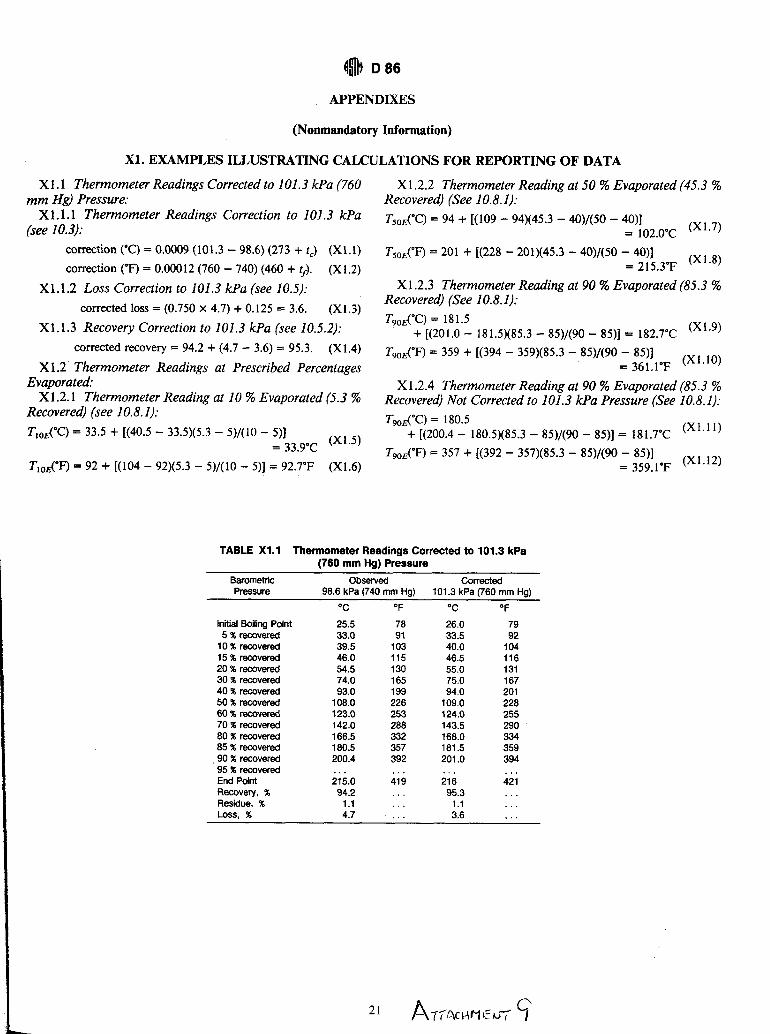
X 1.1 Thermometer Readings Corrected to 101.3 kPa (760 mm Hg) Pressure:
Xl .I.1 Thermometer Readings Correction to 101.3 kPa (see 10.3):
correction (“C) = 0.0009 (101.3 - 98.4) (273 + tc) (X1.1)
correction (‘F) = 0.00012 (760 - 740) (460 + 9). (X1.2)
X1.1.2 Loss Correction CO 101.3 kPa (see 10.5): corrected loss = (0.750 x 4.7) + 0.125 = 3.6. (X1.3)
X1.1.3 Recovery Correction to 101.3 kPa (see 10.5.2): corrected recovery = 94.2 + (4.7 - 3.6) = 95.3. (X1.4)
X 1.2 Thermometer Readings at Prescribed Percentages Evaporated:
X1.2.1 Thermometer Reading at 10 % Evaporated (5.3 % Recovered) (see 10.8.1): T&T) = 33.5 + K40.5 - 33.5)(5.3 - 5)/(10 - 5)]
= 33*9’C (X1-5)
T,,,$F) = 92 + [(lo4 - 92)(5.3 - 5)/(10 - 5)] = 92.7’F (X1.6)
X 1.2.2 Thermometer Reading at 50 % Evaporated (45.3 % Recovered) (See 10.8.1): T,,fgC) = 94 + [(lo9 - 94)(45.3 - 40)/(50 - 4O)]
= 102.o”c (X1.7)
T,,xF) = 201 + [(228 - 201)(45.3 - 4O)/(50 - 4O)] = 215.3’~ (‘la8)
X1.2.3 Thermometer Reading at 90 % Evaporated (85.3 % Recovered) (See 10.8.1): T,,,$C) = 18 1.5
+ [(201.0 - 181.5)(85.3 - 85)/(90 - 85)] = 182.7’C (x1’g)
T,,,,fF) = 359 + [(394 - 359)(85.3 - 85)/(90 - 85)] = 361,l’F (x’*‘o)
X 1.2.4 Thermometer Reading at 90 % Evaporated (85.3 % Recovered) Not Corrected to 101.3 kPa Pressure (See 10.8.1): T&T) = 180.5
+ [(200.4 - 180.5M85.3 - 85)/(90 - 85)] = 181.7’C (““‘)
TgOE(OF) = 357 + [(392 - 357)(85.3 - 85)/(90 - SS)] = 359.l’F (X1-12)
TABLE X1.1 Thermometer Readings Corrected to 101.3 kPa (760 mm Hg) Pressure
Barometric Pressure
Initial Boiling Point 5%rawverad
10% recovered 15% recovered 20% recovered 3O%recovered 4O%recovered 5O%racovered 6O%racovered 70% recovered 80% recovered 85% recovered
,90% recovered 95%raaxarad End Point Recovery, % Residue. % Loss, %
Observed cotTected 98.6kPa(740mm Hg) 101.3 kPa(760 mm Hg)
-2 OF T OF
25.5 78 26.0 79 33.0 91 33.5 92 39.5 103 40.0 104 46.0 115 46.5 116 54.5 130 55.0 131 74.0 165 75.0 167 93.0 199 94.0 201
108.0 226 109.0 228 123.0 253 124.0 255 142.0 288 143.5 290 166.5 332 168.0 334 180.5 357 181.5 359 200.4 392 201.0 394
. . ". .'. 215.0 419 216 ii; 94.2 95.3 . .
1.1 . 1.1 . 4.7 . . . 3.6 . . .
4B D86
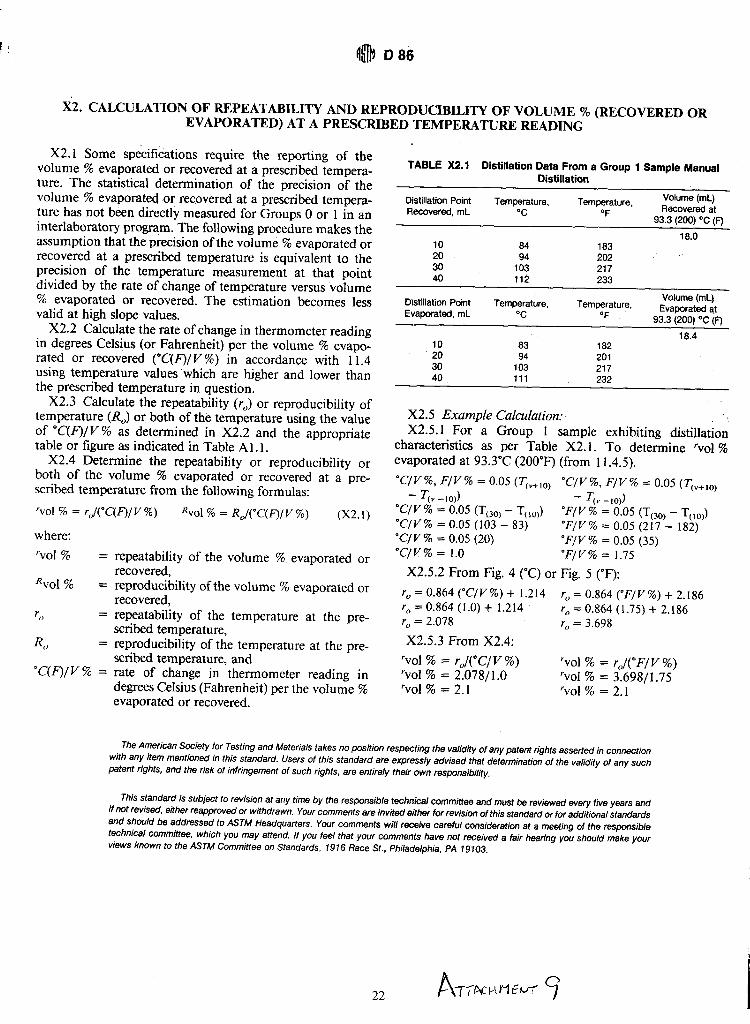
&. CALCULATION OF REPEATABILITY AND REPRODUCIBILITY OF VOLUME ‘3% (RECOVERED OR EVAPORATED) AT A PRESCRIBED TEMPERATURE READING
X2.1 Some specifications require the reporting of the volume % evaporated or recovered at a prescribed tempera- ture. The statistical determination of the precision of the volume % evaporated or recovered at a prescribed tempera- ture has not been directly measured for Groups 0 or 1 in an interlaboratory program. The following procedure makes the assumption that the precision of the volume % evaporated or recovered at a prescribed temperature is equivalent to the precision of the temperature measurement at that point divided by the rate of change of temperature versus tiolume % evaporated or recovered. The estimation becomes less valid at high slope values.
X2.2 Calculate the rate of change in thermometer reading in degrees Celsius (or Fahrenheit) per the volume % evapo- rated or recovered (“C(fl/V %) in accordance with 11.4 using temperature values which are higher and lower than the prescribed temperature in question.
X2.3 Calculate the repeatability (I;) or reproducibility of temperature (I?,) or both of the temperature using the value of “C(F)IV % as determined in X2.2 and the appropriate table or figure as indicated in Table A 1.1.
X2.4 Determine the repeatability or reproducibility or both of the volume % evaporated or recovered at a pre- scribed temperature from the following formulas: ‘~01 % = rJ(“C(F)/V %) Rvol % = RJ(“C(F)/ v %) (X2.1)
where: ‘vol % = repeatability of the volume % evaporated or
Rvol % recovered, .
= reproduclbllity of the volume % evaporated or recovered,
r,> = repeatability of the temperature at the pre- scribed temperature,
4, = reproducibility of the temperature at the pre- scribed temperature, and
“C’(F)/Y % = rate of change in thermometer reading in degrees Celsius (Fahrenheit) per the volume % evaporated or recovered.
TABLE X2.1 Distillation Data From a Group 1 Sample Manual Distillatian -
Distillation Point Temperature, Recovered, mL “C
Temperature, OF
Volume (ml) Recovered at
93.3 (200) OC (F)
18.0 10 a4 183 20 94 202 30 103 217 40 112 233
Distillation Point Temperature, Evaporated. mL
Temperature, OC OF
Volume (ml) Evaporated at
93.3 (200) oc (F)
18.4 10 83 182 20 94 201 30 103 217 40 111 232
X2.5 Example Calculation: X2.5.1 For a Group 1 sample exhibiting distillation
characteristics as per Table X2.1. To determine ‘vol % evaporated at 93.3”C (200°F) (from 11.4.5). “C/V%, F/V% = 0.05 (Tc,+,oj
- q” 40)) “C/V%, F/V% = 0.05 (Tt,+,o,
“C/V% = 0.05 (Too, - T& - q” -10))
“C/V% = 0.05 (103 - 83) ‘F/V% = 0.05 (Too, - Tt,o,)
“C/V% = 0.05 (20) “F/V% = 0.05 (217 - 182) “F/V% = 0.05 (35)
TfV% = 1.0 “F/V% = 1.75
X2.5.2 From Fig. 4 (“C) or Fig. 5 (OF): r, = 0.864 (“C/V%) + 1.214 r. = 0.864 (“F/V%) + 2.186 r. = 0.864 (1.0) + 1.214 r, = 0.864 (1.75) + 2.186 r. = 2.078 r, = 3.698
X2.5.3 From X2.4: ‘vol % = r,/(“C/V %) ‘vol % = 2.078/1.0
‘vol % = r,l(“F/V W)
‘vol % = 2.1 ‘vol % = 3.698/1.75 ‘vol % = 2.1
The American Society for Testing and Materials takes no position respecting the validity of any patent rights asserted in connection with any item mentioned in this standard. Users of this standard are expressly advised that determination of the validity of any such patent rights, and the risk of infringement of such rights, are entirely their own responsfbility.
This standard is subject to revision at any time by the responsible technical committee and must be reviewed every five years and if not revised, either reapproved or withdrawn. Your comments are invited either for revision of this standard or for additional standards and should be addressed to ASTM Headquarters. Your comments will receive careful consideration at a meeting of the responsible technical committee. which you may attend. If you feel that your comments have not received a fair hearing you should make your views known to the ASTM Committee on Standards, 7916 Race St., Philadelphia, PA 19103.
1
1
I F
PI m
cc
PU