National Transport Commission annual report
92
Leading national transport reform Annual Report 2014 –15
-
Upload
bridget-cull -
Category
Documents
-
view
292 -
download
3
Transcript of National Transport Commission annual report

Leading nationaltransport reformAnnual Report 2014 – 15

Letter to ministers
Corporate Plan2015-19
Level 15/628 Bourke StreetMelbourne, VIC 3000
P: (03) 9236 5000
ISBN: XXX-X-XXXXXX-XX-X
Strategic plan2015-16 to 2017-18
Level 15/628 Bourke StreetMelbourne, VIC 3000
P: (03) 9236 5000
ISBN: 978-1-921604-75-1
Strategic Plan
Our Strategic Plan sets out our directions, goals and priorities from 2015 – 19.
Corporate Plan
Our Corporate Plan details the objectives and strategies we will pursue to achieve the priorities in our Strategic Plan from 2015 – 19.
www.ntc.gov.au 3
Corporate plan2015-16 to 2017-18
Level 15/628 Bourke StreetMelbourne, VIC 3000
P: (03) 9236 5000
ISBN: 978-1-921604-76-8
Strategic Plan2015-19
Level 15/628 Bourke StreetMelbourne, VIC 3000
P: (03) 9236 5000
ISBN: XXX-X-XXXXXX-XX-X
Work Program
Our Work Program sets out the projects and programs we will undertake from 2015 – 19.
Work program2015-16 to 2017-18
Level 15/628 Bourke StreetMelbourne, VIC 3000
P: (03) 9236 5000
ISBN: 978-1-921604-74-4
Work Program2015-19
Level 15/628 Bourke StreetMelbourne, VIC 3000
P: (03) 9236 5000
ISBN: XXX-X-XXXXXX-XX-X
15 September 2015The Hon. Warren Truss, MP The Hon. Jamie Briggs, MP The Hon. Andrew Constance, MP The Hon. Duncan Gay, MLC The Hon. Jacinta Allan, MP The Hon. Luke Donnellan, MP The Hon. Jackie Trad, MP The Hon. Mark Bailey, MP The Hon. Dean Nalder, MLA The Hon. John Day, MLA The Hon. Stephen Mullighan, MHA The Hon. Rene Hidding, MP The Hon. Peter Chandler, MLA Mr Shane Rattenbury, MLA The Hon. Simon Bridges, MP Mayor Troy Pickard
Dear ministers,
In accordance with the National Transport Commission Act 2003 (Cwlth), I am pleased to submit the National Transport Commission (NTC) Annual Report for the year ended 30 June 2015.
This document reports on the NTC’s activities in pursuing national reforms for the Australian land transport sector during the 2014 – 15 financial year, in partnership with government, industry and the Australian community.
I would like to thank you for leading the development of national transport reform. I look forward to continuing to work with you to ensure the best transport outcomes for Australia.
David Anderson, PSM Chairman

3www.ntc.gov.au
Contents
Chairman’s report
Chief Executive’s report
About the NTC
Why transport reform?
Where we fit in
Highlights
Consultation and planning
Leading national transport reform
Improving transport productivity
Improving system safety
Improving environmental outcomes
Improving regulatory efficiency
Transport and Infrastructure Council and committee
Transport and Infrastructure Council members
Human resources management
NTC organisational structure
Our people
Corporate governance
Financial statements
Appendix A: Report under the Freedom of Information Act 1982
Appendix B: Report under the National Disability Strategy
Appendix C: Report under the Environment Protection and Biodiversity Conservation Act 1999
Appendix D: Report under the Commonwealth Electoral Act 1918
Appendix E: Transport and Infrastructure Council submissions
Appendix F: Reports released during 2014 – 15
Appendix G: Annual adjustment of heavy vehicle charges
Glossary
Compliance index
Index
4
5
6 – 7
8
9
10 –11
12 – 14
15 – 29
16 – 19
20 – 23
24 – 25
26 – 29
30 – 31
32 – 33
34 – 37
34
35 – 37
38 – 42
43 – 75
76
76
77
78
78
79
80 – 84
85 – 87
88
89 – 91

4 NTC Annual Report 2014 – 15
Chairman’s reportIn my first full financial year as Chairman of the National Transport Commission (NTC), I am pleased to report on a productive year for the organisation, which included a greater commissioner emphasis on organisational improvements and stakeholder engagement.
The Board of Commissioners is accountable to achieve a clear set of objectives as outlined in the Statement of Expectations provided by Deputy Prime Minister and Minister for Infrastructure and Regional Development, the Honourable Warren Truss, MP, for the period of 1 January 2014 to 31 December 2016.
Stakeholder engagement is a key part of our work and staff at all levels spend much time with our stakeholders to help identify and deliver the best transport reforms possible. It is integral to the success of our projects, which ultimately aim to provide the best transport systems for Australia’s growing economy.
Commissioners’ relationships and expertise are increasingly being used to ensure stakeholder involvement at a strategic level.
A stakeholder survey, commissioned during the year, identified opportunities for commissioners to do more of this, and also provided a valuable progress check on our most important relationships.
This research showed we are respected by our key stakeholders in the main, however there is room for improvement and we are by no means taking these pleasing results as a ticket to complacency.
On this note, I am pleased to report that we strengthened ties with three key national partners during the year – the National Heavy Vehicle Regulator, Austroads and the Office of the National Rail Safety Regulator.
We also held a Rail Industry Advisory Group workshop, which brought rail stakeholders together to identify issues and challenges for Australia’s rail industry. This helped inform our strategic planning and was a significant step towards working more effectively with the rail industry.
The Board of Commissioners also helped implement several organisational improvements during the year, in particular a new risk-based approach to decision making. This approach now underpins all management decisions and ensures risks are analysed and mitigated in a consistent way, allowing the NTC to move forward with even greater confidence.
We are now ready to implement the recommendations of the scheduled six-yearly review of our operations, as required under the National Transport Commission Act 2003 (Cwlth), and I look forward to receiving the review panel’s report and the resulting government decisions.
Finally, I would like to thank my fellow commissioners, including Norm McIlfatrick whose appointment ended in August 2014, and NTC staff for their hard work and dedication during the year. Particular thanks go to Chief Executive and Commissioner Paul Retter for his tireless leadership in all respects.
I look forward to continuing to work closely with these colleagues and with our stakeholders to lead national transport reform into the future.
David Anderson, PSM Chairman

5www.ntc.gov.au
Chief Executive’s report
Ultimately, our goal is to lead national surface transport reform by developing practical, evidence-based reform proposals in close consultation with our stakeholders.
Quality national reform proposals take time to develop. A year is not a long time in the life cycle of policy reform, so it was very fulfilling to see some of our projects come to fruition this year and to watch others reach significant milestones.
In particular, I was pleased to see our work in helping truck operators maximise loads on tri-axle vehicle combinations take effect this year via changes to the Heavy Vehicle National Law.
We released the telematics framework during the year. The framework sets the regulatory landscape for telematics adoption by the heavy vehicle industry into the future.
Other major reforms in our work program reached significant milestones during the year, including:
• completion of our 7-axle truck and dog trailer project, which will allow operators to carry payloads up to 20 per cent larger once implemented
• in-principle support from transport ministers for our proposed reforms to chain of responsibility laws, following years of consultation and work
• reform options developed to improve heavy vehicle roadworthiness by proposing a more consistent national approach to inspections and the clearance of defects, as well as improvements to compliance requirements and roadworthiness-related data collection
• stakeholder consultation and workshops to begin reviewing the Load Restraint Guide, which is expected to bring many safety benefits
• holding an Alertness Summit to begin a major piece of work around driver fatigue and the impact it has on heavy vehicle safety and productivity.
Looking ahead, we are focusing on three main areas of work: continuing what we have started; increasing our focus on productivity; and embracing new technology as a key component of national reform.
Increasing the reform focus on productivity and technology is imperative when considered in the context of Australia’s unique transport challenges. While we look internationally for ideas on reform options, our work must be carefully tailored to our own country.
Our own expertise, plus the knowledge and experience of our many stakeholders, allows us to do this effectively and I would like to take this opportunity to thank them for the significant time and effort they contributed to transport reform this year – we simply would not be able to do our work without you.
I would also like to sincerely thank my fellow commissioners and our staff, whose commitment, diligence and expertise underpins our organisation. I look forward to continuing to deliver our work program in 2015 – 16 and beyond.
Paul Retter, AM Chief Executive and Commissioner
The NTC’s performance in 2014 – 15 demonstrates our ongoing commitment to improve the safety, environmental impact, productivity and regulatory efficiency of Australia’s transport networks.

6 NTC Annual Report 2014 – 15
The NTC is an inter-governmental agency charged with improving the productivity, safety, regulatory efficiency and environmental performance of Australia’s road, rail and intermodal transport systems.
About the NTC
State and territory governments contribute 65 per cent of our funding while the Commonwealth Government provides 35 per cent. We have about 40 staff in our Melbourne office and are led by six commissioners.
Our vision
Australia’s prosperity and community liveability is enhanced by the movement of people and goods.
Our mission
To champion and facilitate changes to improve productivity, safety and environmental outcomes.
Strategic objectives
We work to improve:
• transport productivity
• transport system safety
• environmental outcomes
• regulatory efficiency.
Our role
We develop national reforms for road, rail and intermodal transport systems. We also play an important role in implementation planning to ensure reform outcomes are realised on the ground, and in maintaining and updating relevant laws and regulations.
Our work is based on facts and evidence, which helps us identify reforms that benefit Australia as a whole. It includes four main types of projects:
1. Policy – projects aimed at solving a unique problem and which usually require a change of law.
2. Research – projects that investigate an issue and which may be an initial step towards reform.
3. Recurring – maintaining or monitoring reforms.
4. Assistance – assisting other agencies that request our expertise for projects or reforms.
Targetedconsultation
(jurisdictions, regulators, industry,
community)
Issuesanalysis
Transport andInfrastructure
Senior Officials’Commitee
(TISOC) paper
Issuespaper
(if required)
Transport andInfrastructureCouncil paper
Publicconsultation Implementation
Final regulatoryimpact statement
Policypaper
Publicconsultation
Draft regulatoryimpact statement
Discussionpaper
Optionsanalysis
Businesscase Or Or
Our process for policy projects

7www.ntc.gov.au
Our guiding principles
Only lead activities where we can make a difference nationally – focus resources on projects that will deliver real national impact.
Apply an integrated approach – reflect the complexity and diversity of transport systems, including factors affecting regional and remote areas.
Collaborate with reform partners – understand before acting, involve before deciding, discuss before implementing and share before announcing.
We follow structured processes for our projects to ensure appropriate research, development and consultation occurs before proposing reforms. Many of our projects are policy focused and follow the steps outlined below. Variations of this are used when progressing research, maintenance or monitoring projects.
Targetedconsultation
(jurisdictions, regulators, industry,
community)
Issuesanalysis
Transport andInfrastructure
Senior Officials’Commitee
(TISOC) paper
Issuespaper
(if required)
Transport andInfrastructureCouncil paper
Publicconsultation Implementation
Final regulatoryimpact statement
Policypaper
Publicconsultation
Draft regulatoryimpact statement
Discussionpaper
Optionsanalysis
Businesscase Or Or

8 NTC Annual Report 2014 – 15
Why transport reform?
Transport laws National challenges
projected increasein freight task between2010 and 2030.2
projected increasein freight task between2010 and 2030.2
80%
people to live inAustralia by 2030.4
30MILLION
1162road deaths in 2014.1road deaths in 2014.1
economic costfrom congestioneach year.3
$15BILLION
Make laws nationally consistent, risk-based and outcomes focused.Make laws nationally consistent, risk-based and outcomes focused.
Continue to reduce road deaths and serious injuries via the National Road Safety Strategy and action plans.Continue to reduce road deaths and serious injuries via the National Road Safety Strategy and action plans.
Develop a national surface transport productivity framework to identify key areas for improving productivity.Develop a national surface transport productivity framework to identify key areas for improving productivity.
MANY STATE ANDTERRITORY TRANSPORT LAWS
1 https://bitre.gov.au/publications/ongoing/road_deaths_australia_monthly_bulletins.aspx2 The Economic Significance of the Australian Logistics Industry, ALC, 2014, p.3
3 Trends, Infrastructure and Transport to 2030, Dept Infrastructure and Regional Development, 2014, p.104 Freightline 1, Dept Infrastructure and Regional Development, 2014, p.9
+
=The need to

9www.ntc.gov.au
The NTC was established in 2004 to develop and coordinate regulatory reform for Australia’s road, rail and intermodal transport systems. It was established under the National Transport Commission Act 2003 (Cwlth) and replaced the former National Road Transport Commission.
Where we fit in
We work closely with many organisations throughout the country, including the National Heavy Vehicle Regulator (NHVR) and the Office of the National Rail Safety Regulator (ONRSR), both formally established in 2012.
During their initial establishment, we provided support to the regulators where it made sense – in areas of our expertise. While we continue to do this where necessary or requested, our focus is shifting from addressing operational issues back to national strategic policy and new reforms.
For example, over the coming years the NHVR and ONRSR will propose minor legislative amendments to the national laws that they enforce, to assist business process within current policy settings. We will continue to lead the development of larger scale reforms and amendments to these laws.
In addition to the regulators, we also work closely with Austroads and the Rail Industry Safety and Standards Board.
These organisations’ roles and responsibilities, as well as our own, are summarised on the right.
National Transport Commission
• Drive national transport reform
• Develop policy, regulatory and operational reform for Australia’s road, rail and intermodal transport systems
• Maintain and update model laws and the Heavy Vehicle National Law and Rail Safety National Law
• Evaluate implementation of reforms
National Heavy Vehicle Regulator
• Administer Heavy Vehicle National Law (HVNL)
• Monitor, investigate and enforce compliance with HVNL
• Provide the NTC with advice on ways to improve heavy vehicle legislation and regulations
Office of the National Rail Safety Regulator
• Administer Rail Safety National Law (RSNL)
• Monitor, investigate and enforce compliance with RSNL
• Provide the NTC with advice on ways to improve rail safety legislation and regulations
Rail Industry Safety and Standards Board
• Develop and manage nationally applied rail industry standards, rules, codes of practice and guidelines
• Promote a unified approach to rail industry practices
Austroads
• Improve the practices and capability of Australasian road transport and traffic agencies
• Promote operational consistency
• Provide expert technical input to national policy development

Better freight productivity will be essential to ensure we can meet the increasing demand for transport from a growing, ageing and more urbanised population.
Highlights10 NTC Annual Report 2014 – 15
2014 – 15
Improving heavy vehicle productivity
Truck operators will soon be able to tap into the productivity benefits of the Performance Based Standards (PBS) scheme much faster following an NTC project completed during the year.
The project explored how to make the PBS productivity benefits accessible to the popular 7-axle truck and dog trailer combination, without having to go through the PBS approvals process.
This combination can carry loads of up to 20 per cent more under the PBS scheme but Australia’s transport industry told us the administrative time and cost involved in applying for PBS approval was preventing many operators from participating.
The project established a better way to access these productivity benefits safely.
For more information on the project, turn to page 16.
Major roadworthiness program on track
Unsafe heavy vehicles on our roads contribute to many safety and productivity issues, including crashes, fatalities, serious injuries, breakdowns and congestion.
Recognising the heavy social and economic costs of these problems, the NTC and National Heavy Vehicle Regulator are working together on a major program to improve heavy vehicle roadworthiness.
The management of roadworthiness varies between states and territories and the program is working towards a more national approach for heavy vehicles, based on the best available practice.
Three of the four program phases were completed during the 2014 – 15 year.
For more information about the program, turn to page 20.
Vital safety reform much closer
Reforming Australia’s chain of responsibility laws is a complex but vital job.
Chain of responsibility laws are included within the Heavy Vehicle National Law and specify the safety responsibilities for each person in the transport industry supply chain.
The NTC’s project took a major step towards completion during the year with Australia’s transport ministers providing in-principle support for our significant reforms, which include establishing a more outcomes-based approach for all parties in the supply chain.
For more information about the project, turn to page 23.
20%
larger payloads for approved 7-axle combinations in future.
1
heavy vehicle roadworthiness system nationwide proposed.
3
year reform close to law change.

www.ntc.gov.au 11
Supporting in-vehicle technology use
The NTC has launched a framework to support the use of telematics in heavy vehicles.
Telematics includes technology in vehicles that is used as part of a system that captures and sends information electronically.
Telematics is an evolving technology which, if used appropriately, has the ability to make Australia’s roads safer and more productive.
The framework establishes principles to govern the regulatory use of telematics technology into the future, helping provide certainty to governments and industry to realise the technology’s benefits.
For more information about the framework, turn to page 23.
Improved processes for better performance
The NTC has introduced two new processes to streamline and improve project and risk management.
A new project management framework and supporting processes provides greater consistency and transparency to help stakeholders have a better understanding of proposed reforms, among other benefits.
In addition, a new risk-based approach now underpins all management decisions to keep the organisation focused on achieving our strategic objectives with greater certainty.
For more information about the project management framework, turn to page 19 and for more on the risk-based approach, turn to page 37.
Load Restraint Guide update underway
The NTC embarked on an important project to review the Load Restraint Guide during the year, following widespread support to update it to reflect the latest load restraint technologies and provide more specific guidance on best practice.
The guide provides the road transport industry and enforcement authorities with guidance material for the safe carriage of loads on and in road vehicles.
Industry and government feedback on the project so far has shown the need to update the guide to assist with consistent enforcement practices between states and territories, thereby contributing to a safer transport system.
We began the project by holding stakeholder workshops during the year.
For more information about the project, turn to page 29.
10
clear principles established for telematics use.
NEW internal processes in place.
10 year old guide under review.

12 NTC Annual Report 2014 – 15
Consultation and planning
Increased consultation
Stakeholder consultation is an essential aspect of what we do at the NTC.
To be effective, we must work closely with stakeholder organisations – transport agencies, industry and representative associations, national regulators, governments and others – to understand their issues and aspirations, and to work together to find the best solutions for Australia.
Over the past 12 months, we have increased our focus on stakeholder engagement and fine-tuned our approach.
Formal meetings, such as industry workshops, government agency meetings and bi-annual industry advisory group (IAG) meetings continue to be important and the May 2015 IAG meeting was our largest so far.
The group focused on our work program, and current and future stakeholder projects. Some of the organisations in attendance were: the Australian Trucking Association, the Australian Logistics Council, the Australian Rail Track Corporation, Linfox, Toll Group, the Australian Road Transport Suppliers Association, ARRB Group, the National Road Transport Association, the Chartered Institute of Logistics and Transport, Roads Australia, the Australian Livestock and Rural Transporters Association, the National Road Freighters Association, ITS Australia and the Australasian Railway Association.
We also increased our focus on personal consultation with stakeholders at several levels throughout the year. This included our commissioners. In particular, Chairman David Anderson, Deputy Chair Carolyn Walsh and Commissioner Nola Bransgrove engaged key stakeholders at senior levels, helping build support for projects and identify issues early on.
We also continued the NTC Insight Series. This program brings high-profile members of our stakeholder organisations into the NTC to present to staff about their work, share their knowledge and discuss any issues they face. This has been very well received by both our staff and our stakeholders.
Speakers this year included chief executives or senior managers from Asixa, National Transport Insurance, the Australian Logistics Council, the Australian Trucking Association and Victoria Police.
The year included an important step towards working more closely with the rail industry via a special Rail Industry Advisory Group meeting held in November 2014.
The group raised several issues, including maintenance of the rail safety law and how to increase rail sector productivity. It provided a useful forum to prioritise issues and challenges, which also helped inform our strategic planning.

Working with Austroads
Michelle Hendy NTC Chief Planning Officer
The NTC built a closer working relationship with an important national transport partner this year – Austroads.
NTC Chief Planning Officer Michelle Hendy said working closely with other national transport bodies was essential to the NTC’s success as a champion of national transport reform.
‘When we identified the opportunity to strengthen ties with Austroads, we jumped at the chance,’ Michelle said.
‘Austroads is the association of road transport and traffic agencies in Australasia. In its capacity as a research organisation, it is well-placed to provide technical input to inform our national transport sector reforms. In turn, we can facilitate information sharing between Austroads and other organisations to help transition Austroads’ research into action.’Michelle said the closer working relationship involved placing NTC project directors on Austroads’ various taskforces and programs, and sharing strategic planning and work program material between the two organisations. This also allowed the organisations to avoid potential duplication of activities.
‘We recently identified an opportunity to facilitate an outcome, following a request by the Australian Trucking Association (ATA) to investigate increasing axle mass limits when using a wide single tyre,’ she said.
‘Following consultation with state transport departments we concluded that such a change would require pavement tyre testing. We also identified that Austroads was running a research project involving relevant testing, so we were able to connect the dots for the ATA to continue following this up with Austroads.’
13
Strategic planning
The NTC’s co-design approach to strategic planning went through its second cycle in 2014 – 15. The approach involves stakeholder input to identify challenges and opportunities, develop and prioritise proposals to address them, and develop the best of those proposals into business cases and ultimately, projects.
This approach was implemented following the review of the NTC in 2012 by the then Standing Council on Transport and Infrastructure.
This year we also turned our attention to a challenge we identified during the first cycle of the co-design approach – the need for better coordination and collaboration with other national transport government organisations, such as Austroads, as explained on the right.
We also established a Strategic Planning Liaison Group to strengthen communication and engagement with government transport departments and road agencies in each state and territory. This brings a greater jurisdictional focus to our planning and promotes more of a national focus. The group involves government officers who are responsible for briefing chief executives of the departments and road agencies on national reform issues.
www.ntc.gov.au

14 NTC Annual Report 2014 – 15
Global exchange
Below: NTC Chief Executive Paul Retter (right) at the Australian Logistics Council (ALC) Forum in March 2015, along with National Heavy Vehicle Regulator CEO Sal Petroccitto (middle) and ALC CEO Michael Kilgariff (left).
We took several opportunities to learn from other organisations’ experiences around the globe during the year and to share our own.
This included a workshop on intelligent transport systems, held at our office in April 2015 and involving speakers from Europe and the United States.
We also continued a webinar series with the United States Federal Highway Administration agency aimed at sharing information with industry stakeholders, and established working relationships with New Zealand and European transport agencies in recognition of the need to share knowledge and experience among developed countries facing similar transport challenges.
In late May 2015 our Chief Executive attended the 2015 International Transport Forum summit held in Leipzig, Germany.
The summit’s theme was Transport, Trade and Tourism (mobility for a connected world) and it included sessions on the likely growth in all transport modes over the next decade and the need to invest in modernising and upgrading our transport networks to facilitate greater mobility. The increased use of technology, such as intelligent transport systems, was seen as offering enormous potential for more efficient mobility flows.

15www.ntc.gov.au
Leading national transport reform
a reform that improves transport
productivity
a reform that improves transport
system safety
a reform that improves environmental
outcomes
a reform that improves regulatory
efficiency
Symbols used throughout pages 16 – 29
The NTC’s reforms often deliver against more than one of our strategic objectives. The symbols below are used throughout the following section to show how our projects are linked to our objectives.
The NTC is committed to leading national transport reform by improving the productivity, safety, environmental performance and regulatory efficiency of Australia’s transport systems. As part of this, we regularly report on the progress and outcomes of our work.

16 NTC Annual Report 2014 – 15
Improving transport productivity
Unlocking productivity gains for popular truck-trailer combination
During the year, the NTC completed a project with the potential to increase productivity for more than 95 per cent of a popular vehicle combination on Australia’s roads – the 7-axle truck and dog trailer.
The project looked at ways to allow truck operators to access the higher load limits allowed for this vehicle combination under the Performance Based Standards (PBS) scheme without having to go through the PBS application process.
We established the PBS scheme in 2007 to improve the safety and productivity of the road transport industry through innovative truck and bus design. Industry feedback in recent years has revealed a desire to simplify the PBS approval process where possible, saving time and administrative costs and therefore making it accessible to more operators.
In consultation with industry and government stakeholders, we chose to explore this for the 6 and 7-axle truck and dog trailer combinations because they have accounted for more than 40 per cent of applications to the PBS scheme so far and because, if feasible, a streamlined approach would allow operators to carry payloads of up to 20 per cent more.
To achieve this, we developed specification envelopes involving prescriptive-style mass and dimension limits for 7-axle truck and dog trailer combinations, limiting them to safe configurations as previously defined by the PBS scheme while allowing them to carry payloads up to 20 per cent larger than non-PBS compliant vehicles.
The project found it was not possible to do this for the 6-axle combination because a feasible specification envelope could not be developed that both met with the PBS standards and covered a range of vehicles using this combination.
The 18-month project involved developing the specification envelopes, releasing a discussion paper for industry and government feedback, holding workshops in states and territories, and obtaining agreement on the envelope approach.
Next steps
The specification envelopes will be implemented by the National Heavy Vehicle Regulator (NHVR). We have recommended an implementation method involving issuing national notices, similar to the current Class 3 Truck and Trailer notice, to enable use of the envelopes in the first instance, and then considering including them in the Heavy Vehicle National Law after that.
To date, less than 5 per cent of 7-axle truck and dog trailer designs have gone through the PBS scheme and are accessing the productivity benefits of carrying larger payloads. Once implemented, this project unlocks these possible productivity benefits for all other designs of this popular truck-and-trailer combination.
The project will also reduce the regulatory and administrative burden for the NHVR, state and territory road agencies, trailer body builders and transport operators.
Following this project, in May 2015 Australia's transport ministers approved an addition to our work program for 2016–17, which will see us assess the effectiveness of the PBS marketplace and identify barriers to vehicle design and innovation.

Why transport productivity?
As Australia’s population increases, so do our transport needs.
Between 2010 and 2030, truck traffic is predicted to increase by 50 per cent and rail freight by more than 60 per cent (BITRE).
Without nationwide transport productivity improvements, Australia’s current congestion costs of $15 billion each year (BITRE) will increase rapidly. On the flipside, better productivity will help manage this and should also improve safety – because fewer trips should mean fewer crashes – and deliver environmental outcomes by improving fuel efficiency and reducing pollution.
Furthermore, improvements in rail sector efficiency will address growing consumer and industry demand for improved connectivity to places and markets.
17Improving transport productivity

18 NTC Annual Report 2014 – 15
Heavy vehicle loading made easier
Changes to the Heavy Vehicle National Law that were developed to make loading certain heavy vehicle combinations easier came into effect on 29 September 2014.
The NTC developed the 1-Tonne Tri-Axle Mass Transfer Allowance (1TMTA) following industry feedback about the previous mass loading laws, established in 1993.
The old rules meant that for many types of truck and trailer combinations to be able to carry the maximum legal load, the load needed to be perfectly distributed across all axle groups of the vehicle. This was time-consuming and difficult to achieve, preventing many operators from maximising their loads.
The new system allows up to one tonne to be moved between certain axle groups in a particular heavy vehicle combination, so long as the overall gross mass is within its legal limit.
The 1TMTA applies to all roads in the Australian Capital Territory, New South Wales, South Australia, Tasmania and Victoria, excluding roads restricted by load-limiting road signs, and to declared routes or areas in Queensland. More information is available on the National Heavy Vehicle Regulator’s website – www.nhvr.gov.au.
Reforming dangerous goods transport
Dangerous goods are transported throughout Australia every day, regulated by the Australian Code for the Transport of Dangerous Goods by Road and Rail and laws in each state and territory, which bring the code into effect.
These instruments help prevent accidents or damage to people, property or the environment from the unsafe transport of dangerous goods.
The code is modelled on the United Nations Recommendations on the Transport of Dangerous Goods – Model Regulations and covers a large range of substances and products from highly flammable toxic or corrosive substances to household items such as cosmetics and cleaning products.
During the 2014 – 15 year, the NTC began reviewing the rules around transporting limited quantities of dangerous goods, including:
• cosmetics and personal care products
• household cleaning products
• home, garden and pest products
• paint, coatings and related products.
Stakeholders identified the need for review, reporting that the current code was placing an unnecessary regulatory burden on businesses, thereby restricting transport system productivity.
So far the project has involved: a workshop; further targeted consultation with stakeholders who include transporters, retailers, industry bodies, regulators and emergency services organisations; and a regulatory impact statement (RIS) released for public comment in June 2015.
The RIS looked at ways to reform the transport of limited quantity dangerous goods via amendments to the code. It assessed three reform options that aim to reduce current compliance costs and allow flow-on productivity benefits while maintaining high levels of safety.
The reform options included:
1. addressing problems with aspects of the code by creating a new exemption for transporting some or all types of limited quantity dangerous goods
2. amending the code to adopt the standards used in Europe for transporting limited quantities of dangerous goods
3. as above but to adopt the standards in the United Nations model regulations.
Next steps
At the time of writing, the RIS was open for public comment. Following that, we plan to conduct further consultation with key stakeholders before developing final recommendations for the Transport and Infrastructure Council to consider in November 2015.
Regulation maintenance
We are responsible for maintaining the code and model laws that apply to dangerous goods transport, including updating them to ensure they meet best practice and evolving community needs.
During the 2014 – 15 year, we submitted an amendment package to the Transport and Infrastructure Council, which included updating the regulations to:
• align with international best practice in the 18th amendment package to the United Nations model regulations (excluding standards relating to transporting limited quantities of dangerous goods)
• provide consistency with air and sea requirements
• incorporate minor changes to improve clarity and useability.
The council approved the amendment package in May 2015.

19
Heavy vehicle charging
The NTC undertook a routine consultation process during the year to help inform the Australian Government in setting the annual road user charge on heavy vehicle fuel use for 2015 – 16.
The Road User Charge (RUC) applies to diesel used by heavy vehicles on public roads and is reviewed annually. Revenue generated from it contributes to road infrastructure spending by the Commonwealth, state and territory governments.
As requested by the Deputy Prime Minister, the Honourable Warren Truss, MP, we released a draft recommendation for public comment in February 2015, calculated using a formula within the Model Heavy Vehicle Charges Act.
Following a 60-day consultation period, we then formally recommended that the RUC remain unchanged at the existing rate of 26.14 cents per litre of diesel as of 1 July 2015. The Deputy Prime Minister announced his decision to do this on 25 June 2015.
Turning the tables to reform our own processes
Geoff Allan NTC Chief Operating Officer
Improving transport productivity
While the NTC’s work focuses on national transport system reform, Chief Operating Officer Geoff Allan explains how we began reforming our own project management processes during the year as well.
‘We saw the need to implement a more structured project management framework and processes, tailored to our organisational needs and designed to maximise efficient project delivery,’ Geoff said.
‘Our new framework will provide greater consistency and transparency for projects. This has so many benefits, including helping stakeholders gain a better understanding of proposed reforms and engagement with our projects, and keeping us on track to deliver projects in line with their original purpose and scope.
‘Ultimately, this will improve our engagement and communication throughout the life of each project with state and territory governments as well as industry and community stakeholders who could be affected by any proposed reforms.’
Geoff said the framework had been drawn from several sources, including the Productivity Commission’s process and best-practice guidelines from the Australian National Audit Office. It also recognised our obligations under relevant legislation.
‘It has been tailored to best meet our unique requirements. It has also been customised for the different types of work we do so we have slightly different processes for our research, policy, maintenance and monitoring projects,’ Geoff said.
‘We do a significant amount of work assisting other agencies either with implementing reforms or by providing our specialised knowledge in particular areas. In the past, this work was not always documented or formalised. Our new processes aim to fully account for it and allow us to deliver the best value to our stakeholders.’The new project management framework and processes were introduced during the year and will be fully implemented in 2015 – 16.

20 NTC Annual Report 2014 – 15
Improving system safety
National program to improve heavy vehicle safety
A major program to improve heavy vehicle roadworthiness reached some key milestones during the year.
The National Heavy Vehicle Roadworthiness Program is the first major project that the NTC and the National Heavy Vehicle Regulator have worked on together from inception.
It aims to reduce the risks and safety concerns associated with unroadworthy heavy vehicles.
Unsafe heavy vehicles on the road contribute to many safety and productivity issues, including crashes, fatalities, serious injuries, breakdowns and congestion.
The management of roadworthiness varies between states and territories, and there are broad differences in approaches and standards. The program is working towards a more national approach and aims to:
• provide consistent standards and operational procedures
• standardise vehicle inspections nationally
• encourage accreditation systems with robust governance
• improve compliance with vehicle standards.
During the 2014 – 15 year, three of the four program phases were completed, consisting of:
1. a review of current roadworthiness systems, practices and compliance throughout Australia
2. an assessment of how current practice supports transport objectives of road safety, productivity and efficiency
3. development of a regulatory impact statement (RIS) providing reform options available for public comment.
The RIS assessed four reform options, each including potential changes to inspection processes and procedures, education and training, scheduled inspections, accreditation schemes and chain of responsibility laws. The options also provided potential mechanisms to identify and target the highest-risk vehicles on the road.
To date there has been extensive consultation throughout the program with government, industry and community stakeholders, including: trucking companies, owners, operators and drivers; peak industry bodies; heavy vehicle safety experts; remote area communities; local, state, territory and Commonwealth governments; and emergency services.
Next steps
The fourth phase of the program involved providing final recommendations about the structure and implementation of a national roadworthiness program to Australia’s transport ministers.
Ministers will consider the recommendations in November 2015.

Why transport system safety?
Every year, thousands of people are killed or injured using Australia’s road and rail systems.
BITRE reports that 1162 people lost their lives on Australian roads in 2014 and the Australian Transport Safety Bureau reports that 350 people died on rail networks between 2002 and 2012.
As well as the terrible social costs to the community, the annual cost of the road toll to the Australian economy is estimated to be $27 billion (Department of Infrastructure and Regional Development).
Australia’s growing population coupled with increasing demand for freight and transport heightens the need to make Australia’s transport networks safer.
Without safety improvements, road and rail users remain at risk of injury or death.
21Improving system safety

Medical standards review
During the year, the NTC began a review of the medical criteria that apply to Australia’s vehicle drivers and rail safety workers.
The criteria are set out in the Assessing Fitness to Drive (AFTD) and National Standard for Health Assessment of Rail Safety Workers publications.
The AFTD provides medical criteria for doctors to use when assessing the health of drivers for licensing, while the rail safety standard provides medical criteria for determining the fitness for duty of rail safety workers throughout Australia.
Both publications were last reviewed in 2012 and are due for routine review to ensure they are accurate and reflect current medical practices.
The reviews take into account:
• advances in medical knowledge and practice
• changes to relevant operating environments and policies
• stakeholder feedback on the current publications
• findings from any relevant recent inquiries
• any other new issues affecting medical standards.
During the year, we released issues papers on the reviews and sought stakeholder feedback on the need for any changes to the criteria and the potential impacts of these. We also appointed Project Health – a specialist health consultancy – to provide medical expertise for the reviews.
Next steps
This work involves complex medical issues that require specialist expertise. Recognising this, we have consulted broadly on the AFTD review, involving medical and health professionals, licensing authorities, regulators, industry representatives and road users. We plan to do the same for the rail safety standard.
We will continue to work through specific medical issues with stakeholders and experts and will also invite public consultation on draft changes to the two publications before preparing final publications for the Transport and Infrastructure Council to consider in 2016.
Electronic work diaries
The NTC continued work during the year to ensure the Australian transport industry can realise the many benefits of using electronic work diaries (EWDs).
An EWD is an electronic system that can record work and rest times for heavy vehicle drivers as an alternative to a written work diary. EWDs can make compliance with fatigue management obligations easier, offering significant safety benefits and cost savings by reducing the amount of time operators and enforcement agencies spend on administration.
Last year we developed a legal framework to support the voluntary use of EWDs to ensure it was appropriately regulated, including with privacy protections for people and data. This year we developed the legislation to cement that framework in law. This was approved by Australia’s transport ministers in November 2014 and was passing through parliamentary approval processes at the time of writing.
The National Heavy Vehicle Regulator will lead the work needed to implement the voluntary use of EWDs.
In June 2015, the NTC co-hosted the Alertness Summit 2015 as part of a project to better understand driver fatigue.
The summit was held in Canberra in collaboration with the Cooperative Research Centre for Alertness, Safety and Productivity. It brought together scientists and alertness monitoring technology providers with heavy vehicle operators, industry associations, road agencies, police and the National Heavy Vehicle Regulator.
Participants were briefed on the latest technology developments and took part in valuable discussions about how the evidence base and data collection could be improved and used to support potential reforms of fatigue laws in the future.
The summit was a unique opportunity to share different perspectives on the challenges of fatigue policy and data collection. We plan to use these views when developing a discussion paper about a national fatigue data framework in late 2015.
Alertness Summit
Above: NTC Chief Operating Officer Geoff Allan at the Alertness Summit in June 2015.
22 NTC Annual Report 2014 – 15

Chain of responsibility
A vital project to improve heavy vehicle road safety came much closer to fruition during the year with the completion of a major piece of work.
The project involves changes to the chain of responsibility laws, which are included within the Heavy Vehicle National Law.
Chain of responsibility laws specify the safety responsibilities for each person in the transport and logistics industry supply chain and are fundamentally concerned with improving the safety of drivers and the community.
Chain of responsibility reform is a complex undertaking partly because of the large number of parties in the supply chain, such as corporations, employers, company directors, exporters and importers, drivers, contractors, schedulers, people who load or unload goods and people who receive goods.
The NTC began leading the project in mid-2014 after an independent taskforce recommended to Australia’s transport ministers that further work was needed on the reform.
We then developed reform options, released a discussion paper and consulted with stakeholders before providing reform recommendations to Australia’s transport ministers to consider in May 2015. Ministers gave in-principle support to the proposed reforms – a major step forward in the process.
The proposed reforms include a more outcomes-based approach, placing a primary duty on operators, prime contractors and employers to ensure the safety of their operations. They also establish detailed duties for specific roles within the supply chain where appropriate, and restructure and consolidate existing requirements towards a performance-based approach rather than a prescriptive one.
By moving away from prescriptive obligations, the reforms would allow operators to work out the best way to manage chain of responsibility obligations for their businesses, safely and cost-effectively.
The reforms are also an opportunity to better align chain of responsibility laws with Australian workplace health and safety laws to reduce duplication and inconsistencies for the heavy vehicle industry.
Next steps
Australia’s transport ministers provided in-principle support for the proposed reforms in May 2015.
We subsequently released a discussion paper detailing the proposed reforms for public comment, and plan to provide final recommendations to transport ministers in November 2015.
Innovative framework for telematics
The use of telematics in heavy vehicles is now supported by clear guidelines after the NTC released a national framework in November 2014.
We developed the Compliance and Enforcement Framework for Heavy Vehicle Telematics to provide policy certainty and consistency on using telematics for compliance and enforcement purposes. We did this following industry feedback that the lack of clear and consistent policies on how telematics data could be used had slowed the uptake of telematics technology.
Telematics is the term used to describe in-vehicle devices that capture and send information electronically. Telematics can be used to monitor speed, location, time, load, mass, engine performance and more, and can also include electronic work diaries (EWDs) to record work and rest hours for drivers.
Telematics is an evolving technology which, if used appropriately, has the ability to make Australia’s roads safer and the transport industry more productive.
The framework establishes 10 clear principles to govern the regulatory use of telematics technology, balancing the opportunities to realise safety and productivity benefits with the need to regulate data access and protect individual privacy. It also explains the data dictionary, developed by Transport Certification Australia, to ensure regulatory applications of telematics are consistent with international standards and compatible with other systems.
The framework distinguishes between telematics applications used for enforcement, such as EWDs; compliance, such as satellite navigation technology; and purely commercial applications, with higher standards of performance and security required for enforcement-focused telematics.
It enables telematics systems to separate commercial and regulatory data so that authorised officers undertaking enforcement activities can only access relevant information. For example: a telematics device might be developed that integrates EWD and payroll features. Under fatigue laws, a heavy vehicle driver must present EWD information to an authorised roadside enforcement officer so the system could be designed in such a way that the officer could access only the EWD, and not the payroll records.
Our approach is innovative in that it provides a framework for telematics in general, rather than making rules and regulations specific to one technology or application.
Next steps
With the framework now in place, we look forward to supporting transport and road agencies throughout Australia in using it to implement new telematics applications into the future.
23Improving system safety

24 NTC Annual Report 2014 – 15
Improving environmental outcomes
Decade of data released
During the year, the NTC published annual data on vehicle carbon dioxide emissions intensity. This included an inaugural 10-year trend analysis providing key insights for manufacturing and other industries.
The Carbon Dioxide Emissions Intensity for New Australian Light Vehicles 2014 report was released in April 2015, using data from the Federal Chamber of Automotive Industries.
The report looked at emissions intensity for new passenger and light commercial vehicles sold in Australia in 2014 and showed a 22 per cent drop in the average carbon emissions intensity for new cars sold in Australia between 2005 and 2014.
It also showed the following occurred during the decade:
• the average emissions intensity of Australian-made vehicles fell by between 18 and 28 per cent
• the greatest reductions in average emissions intensities were in the sports and SUV segments, which fell by 32 and 29 per cent respectively, and petrol powered vehicles, which fell by 26 per cent
• the number of low-emission car models on the market has increased from three to 59.
The report breaks data down by vehicle make, model, segment, fuel and buyer type, providing current and valuable information to many industries and organisations to use in their business and in environmental planning. This information also helps car buyers choose vehicles that are cheaper to run and are better for our environment.
* from new passenger and light commercial vehicles in Australia.
Australia’s average carbon emissions intensity in 2013 was higher than the European Union’s by
43%
Compared with 2013, average carbon emissions intensity* decreased by
2.3%
The average carbon emissions intensity* dropped between 2005 and 2014 by
22%

Transport and the environment
Transport contributes about 15 per cent of Australia’s total greenhouse gas emissions, mainly in the form of carbon dioxide (Department of the Environment).
Historically, Australia has been reliant on roads to transport people and goods and our growing population is placing greater demand on our road networks to do this. By 2020, greenhouse gas emissions from road transport are predicted to be more than two-thirds higher than their 1990 levels (BITRE).
This has the potential to affect climate change, making improving environmental outcomes a priority for business, government and Australia’s communities.
25Improving environmental outcomes

Improving regulatory efficiency
A new approach to maintenance
As well as developing national transport reform, the NTC is responsible for monitoring and maintaining a range of national and model laws and associated regulations and instruments relating to road, rail and intermodal transport.
This is important to ensure laws and regulations are current and reflect evolving community needs. Updating laws and regulations also allows us to remove unnecessary legal barriers to productivity and means we can improve clarity so that laws can be more easily understood and applied.
This year we began revising our maintenance program and procedures, focusing on formalising processes and introducing tools to improve stakeholder consultation. The aim of the improved program is to create consistent and transparent maintenance cycles to ensure work is targeted and timely. It also allows sufficient opportunity for input from state and territory governments and national transport regulators.
To that end, we have established a structured maintenance program for each of the laws and instruments we maintain, including:
• Heavy Vehicle National Law, Rail Safety National Law and model laws for vehicle standards – annual review
• Australian Road Rules and transport of dangerous goods laws – for review every two years
• Australian Defence Force Road Transport Exemption Framework – for review every three years or as needed
• Assessing Fitness to Drive and the National Standard for Health Assessment of Rail Safety Workers publications – for review every three years.
While the new program is structured, there is room for us to progress maintenance items outside these timings if required.
The right tools
We are introducing several tools to support the new maintenance program, including developing a template for stakeholders to use when describing new issues and potential solutions. The template helps clearly define issues, identify and compare potential policy responses, and prepare appropriate supporting materials.
We also facilitate regulatory maintenance advisory groups as a key forum for early stakeholder consultation on maintenance issues. The groups involve senior officers from state and territory governments and national transport regulators, and some also include industry and community stakeholder representatives.
Heavy vehicle penalties tools
As part of our role in maintaining and updating the Heavy Vehicle National Law (HVNL), the NTC has developed two tools to help ensure that penalties and demerit points for new or amended offences are consistent with the law’s intention.
The tools are:
1. a penalties matrix to help set maximum penalties
2. a demerit point assessment process to analyse the suitability of demerit point penalties.
As well as ensuring that new and amended penalties and demerit point settings reflect the HVNL’s intent, the tools will also help keep them consistent with existing penalties in the HVNL and in other state and territory laws.
Both tools will be used as guides in consultation with governments, agencies and other stakeholders when setting or amending penalties and demerit points in future.
26 NTC Annual Report 2014 – 15

Why regulatory efficiency?
Regulation is needed to help provide a safe and equitable transport system.
However, the nature of any regulation means it imposes a burden on the businesses and people who use that system.
By focusing on regulatory efficiency we can minimise that burden, allowing transport system users to operate as productively as possible while keeping safety paramount.
27Improving regulatory efficiency

28 NTC Annual Report 2014 – 15
Maintenance work 2014 – 15
The NTC’s regulatory maintenance program has two main purposes regarding the national laws, model laws, regulations and other instruments that we are responsible for.
The first is to ensure the regulatory framework remains contemporary, nationally consistent, efficient, effective
and aligned with agreed policy. This was achieved for the projects detailed below during 2014 – 15.
The second is to amend laws and regulations to align with the policy decisions of ministers. The table below indicates what this involved in 2014 – 15.
Project Specific purpose NTC recommendations approved by ministers during 2014 – 15
Heavy Vehicle National Law Amendment Package No. 4
Included amendments to:
• redefine ‘modification’, so that potentially unsafe modifications must be inspected and cleared
• reduce the burden on operators and drivers when dealing with minor vehicle defects
• implement policy relating to electronic work diaries
• improve regulatory efficiency.
Schedule of infringement penalties and demerit points for heavy vehicles
Specified new and revised penalties under the Heavy Vehicle National Law.
Heavy Vehicle (Vehicle Standards) National Regulation project
Updated and aligned in-service heavy vehicle standards across Australia.
Australian Vehicle Standards Rules Ministers agreed to revise the rules to structurally improve the alignment of in-service vehicle standards across Australia, as well as reduce the complexity of state and territory implementation.
Rail Safety National Law Amendment Package No. 1
Delivered a range of amendments to support more efficient regulation.
Model Subordinate Law on the Transport of Dangerous Goods by Road or Rail
and
Australian Code for the Transport of Dangerous Goods by Road and Rail
Harmonised Australian road and rail transport of dangerous goods law with the 18th amendment package to the United Nations model regulations, and delivered local priority improvements to the code.
Australian Defence Force Road Transport Exemption Framework
Updated routes and added new vehicle types.

29Improving regulatory efficiency
Rail Safety National Law
Changes to the Rail Safety National Law were made during the year to reduce regulatory burden and provide greater clarity.
The NTC developed the amendments following feedback from the Office of the National Rail Safety Regulator (ONRSR) and other stakeholders on how to improve administration of the law.
Intelligent Access Program review completed
An NTC review of the heavy vehicle Intelligent Access Program (IAP) has recommended making more information about the program available in several ways.
The IAP uses satellite navigation and communications technology to track a vehicle’s location. This facilitates truck access to certain areas of the road network that would not have been possible otherwise and ensures trucks only use roads that provide adequate safety.
The IAP was launched by Austroads in 2009 and its regulatory framework has since been incorporated within the Heavy Vehicle National Law. The use and disclosure of information gathered by the program is governed by privacy legislation.
The review involved submissions from government and industry stakeholders and recommended several changes to the IAP, including:
• greater reporting of usage statistics
• making a version of the program specification publicly available
• reviewing the recertification process to provide more certainty to service providers regarding timelines
• providing clarity to operators about the information they are able to obtain from service providers.
In November 2014, the Transport and Infrastructure Council endorsed the recommendations for implementation by Transport Certification Australia.
Next steps
We will report on the implementation progress of the IAP review recommendations in our annual National Reform Implementation Monitoring Report.
Load Restraint Guide update underway
The NTC began an important review of a critical road safety guide during the year.
The Load Restraint Guide provides the road transport industry and enforcement authorities with legal obligations and guidance material for the safe carriage of loads on and in road vehicles.
The guide is due for a significant update to reflect current user needs and technologies. We are undertaking this review as part of assisting the National Heavy Vehicle Regulator (NHVR) in its early years of establishment. Future reviews will be managed by the NHVR.
We began the review during the year by holding government and industry workshops, which showed widespread support for it and helped identify four main areas of focus:
1. load restraint technology – the guide needs to reflect current technologies which have evolved since it was developed
2. presentation – updating the guide’s language and presentation to make it easier to use and more accessible
3. updating the guide in light of the Heavy Vehicle National Law
4. bringing the guide up-to-date with current heavy vehicle sizes, power and braking capacities, load restraint technologies and the freight task.
The review is expected to bring a range of benefits that will contribute to a safer transport system and will help deliver more consistent enforcement and clarity for operators throughout Australia.
Next steps
Following the workshops, we developed a detailed project plan to use in further consultation with the transport industry, enforcement officers, load restraint experts, the National Heavy Vehicle Regulator and other stakeholders.
The review will involve significant work and stakeholder consultation over the coming 18 months before we provide recommendations to Australia’s transport ministers in November 2016.
We aim to release the updated guide in 2017.
The amendments involved removing barriers to the ONRSR in performing its functions; increasing the ONRSR’s discretion to waive industry fees; and requiring managers of private sidings to give the ONRSR information about railway operations and risk management processes.
The Transport and Infrastructure Council approved our reform recommendations, which were then included in legislation passed by the South Australian Parliament on 12 May 2015.

30 NTC Annual Report 2014 – 15
Transport and Infrastructure Council and committee
NationalTransport
Commission
Transport andInfrastructure
Senior O�cials’Committee
Transport and Infrastructure
Council
Endorse work program and activities
Consult on national reform recommendations
Submit national reform recommendations
Advice on reformrecommendations

Council and committee
The Transport and Infrastructure Council brings together Commonwealth, state, territory and New Zealand ministers who have responsibility for transport and infrastructure issues. It also includes the Australian Local Government Association.
The council is advised and assisted by the Transport and Infrastructure Senior Officials' Committee, also known as TISOC.
The NTC develops and submits reform recommendations to the council for approval, and also works with the committee to ensure projects are aligned with council priorities and to keep members informed on progress.
www.ntc.gov.au 31

Transport and Infrastructure Council members
32 NTC Annual Report 2014 – 15
As at 30 June 2015
The Hon. Warren Truss, MP
Deputy Prime Minister; Minister for Infrastructure and Regional Development
The Hon. Stephen Mullighan, MHA
Minister for Transport and Infrastructure
The Hon. Andrew Constance, MP
Minister for Transport and Infrastructure
The Hon. Rene Hidding, MP
Minister for Infrastructure; Police and Emergency Management
The Hon. Jackie Trad, MP
Deputy Premier; Minister for Transport; Infrastructure, Local Government and Planning; Trade
The Hon. Jamie Briggs, MP
Assistant Minister for Infrastructure and Regional Development
The Hon. Duncan Gay, MLC
Minister for Roads, Maritime and Freight
The Hon. Mark Bailey, MP
Minister for Main Roads, Road Safety and Ports; Energy and Water Supply
Mr Shane Rattenbury, MLA
Minister for Justice; Territory and Municipal Services; Sport and Recreation; Minister assisting the Chief Minister on Transport Reform
Commonwealth ACT
South Australia
Tasmania
New South Wales
Queensland

33www.ntc.gov.au
The Hon. Dean Nalder, MLA
Minister for Transport
The Hon. Simon Bridges, MP
Minister of Transport; Energy and Resources
The Hon. Jacinta Allan, MP
Minister for Public Transport; Employment
The Hon. John Day, MLA
Minister for Planning; Culture and the Arts
Mayor Troy Pickard
President, Australian Local Government Association
The Hon. Luke Donnellan, MP
Minister for Roads and Road Safety; Ports
The Hon. Peter Chandler, MLA
Minister for Police, Fire and Emergency Services; Education; Transport; Infrastructure; Veterans Support
Western Australia Northern Territory
New ZealandVictoria
Australian Local Government Association

34 NTC Annual Report 2014 – 15
Human resources management
Corporate services
Commission secretariat
Finance
Governance
Human resources
Information technology and knowledge management
Public affairs and communication
Strategy, monitoring and review
Strategic planning
Business case development for new reforms
Reform monitoring
Reviews of existing reforms
Work programs
Project coordination
Heavy vehicle pricing
Reform maintenance
Productivity, safety and environment
Heavy vehicle compliance and technology
Chair David Anderson,
PSM
Deputy Chair Carolyn Walsh
Commissioner Nola Bransgrove,
OAM
Commissioner Neil Scales
OBE
Commissioner Mike Mrdak
Chief Executive and Commissioner
Paul Retter, AM
Chief Corporate Officer
Joanne Olsen
Chief Operating Officer
Geoff Allan
Chief Planning Officer
Michelle Hendy
NTC organisational structureAs at 30 June 2015

35www.ntc.gov.au
The NTC develops and sustains a culture of performance, which helps our staff work effectively with available resources, expertise and systems. This ensures that we deliver outcomes in accordance with our approved work program and our strategic and corporate plans, and have the flexibility to respond and adapt to the needs of our stakeholders and ministers.
Our people
Building a culture of performance
Over the 2014 – 15 reporting period we have continued to focus on a number of important areas designed to build and consolidate a culture of performance.
Effective stakeholder engagement underpins the successful execution of our work program from the initial stages of reform development right through to the delivery, implementation and maintenance of agreed reforms. In 2014 – 15, we developed and implemented new stakeholder engagement and communication strategies to support the delivery of our work program, and our corporate and strategic plans. This included our first annual stakeholder survey, which provided valuable feedback including on our co-design approach to strategic planning.
To further strengthen our engagement with stakeholders, we launched our redeveloped website in August 2014. Further website work followed to improve the website’s structure and functionality in response to stakeholder feedback, including the usability of the site’s submissions process.
During the year, we continued to implement a rigorous recruitment and selection process for new staff using specialist search and recruitment agencies and psychometric assessments. Involving our executive in all appointment decisions also helped ensure the best skill and cultural fit for our organisation.
At the same time we remained committed to identifying internal opportunities where possible to use and develop our in-house capabilities and provide career development opportunities for our staff.
We addressed requirements for unique specialist skills by engaging industry and subject matter experts on either fixed-term contracts or through the use of specialist consultants.
Meanwhile, our people continued to benefit from the opportunity to learn and collaborate with colleagues from state jurisdictions and regulators such as Transport for NSW and the National Heavy Vehicle Regulator as we worked with these organisations on a number of projects.
We also continued to focus on leadership development in order to build a culture of performance. We held two leadership team days during the year, focused on forward planning, risk management, governance and the development of a unified leadership culture. The composition of our leadership team remained constant during the year, providing an ongoing platform for consistent and effective management of our people, teams and work program.
Our first three-year enterprise agreement expired on 31 March 2014. Negotiations were underway at the time of writing, including with staff and union representatives, to develop a new agreement in accordance with the requirements of the Australian Government Public Sector Workplace Bargaining Policy.
The year marked the first complete cycle of our new performance and development framework, which was launched in August 2014. The new framework has three assessable components that provide an overall performance rating for each staff member: individual commitments, values and behaviours, and core responsibilities.
The new framework saw us refresh our corporate values and behaviours. These are now also known as our TRAITS, representing the following values and behaviours that make up the acronym:
• Teamwork – working together
• Respect – value every perspective
• Accountability – own your actions
• Integrity – do what is right
• Trust – deliver on commitments
• Safety – speak up to ensure a safe environment for everyone.

36 NTC Annual Report 2014 – 15
The NTC places great emphasis on providing a safe and healthy work environment for our staff in accordance with government legislation, policy and recognised best practice. Our Work Health and Safety (WHS) policy and management system formally outline our ongoing commitment to workplace safety and our adherence to legal obligations.
In 2014 – 15, work was completed on the policy and management system in order to meet the requirements specified in the Work Health and Safety Act 2011 (Cwlth) and comply with Australian Standard AS4801. This included internal investigations for the prevention of incidents, and was accompanied by awareness training for commissioners and the NTC’s leadership team regarding their duties and obligations as officers under the relevant legislation.
WHS initiatives undertaken in the 2014 – 15 financial year included:
• annual WHS plan approved by our Chief Executive
• WHS quarterly certification reports developed to the satisfaction of the Risk and Audit Committee and Board of Commissioners
• due diligence officer duties for commissioners reviewed
• Working Alone or in Isolation Policy developed
• working from home arrangements changed to include WHS requirements
• emergency response procedures reviewed and implemented
• WHS management system reviewed in accordance with legislated requirements and to the satisfaction of our Chief Executive
• risk assessments completed for identified WHS hazard areas
• ongoing emergency trial evacuation exercises
• staff health and safety representatives, fire wardens and first aid officers appointed and trained
• quarterly workplace safety assessments and adjustments
• periodic workstation ergonomic assessments
• workplace safety inductions for all new staff and contractor appointments
• online compliance training in equal opportunity, anti-harassment and anti-bullying legislation, WHS, Code of Conduct and social media for managers and staff.
Staff were consulted on a number of WHS initiatives during the year, including education on WHS duties and responsibilities for all staff when working alone or in isolation, and reinforcing WHS hazard identification and reporting processes. As a result, we saw any potential WHS issues promptly reported.
Health and wellbeing initiatives continued to centre on a comprehensive Employee Assistance Program and our annual flu vaccination campaign.
The effect of these ongoing workplace safety initiatives and associated program has been a consistently safe work environment for staff and visitors to our office.
There were no notifiable incidents during the year. There were no investigations undertaken by an inspector appointed under Part 9 of the Work Health and Safety Act, and we did not receive any notices under Part 10 of the Act.
Work health and safety
Code of Conduct
The NTC Code of Conduct applies to all staff members. The code is reviewed and aligned with best-practice standards periodically and it, along with our corporate values and behaviours, sets the standard for professional conduct expected of every staff member. The code emphasises honesty, confidentiality, professionalism, diligence and the
need to uphold our integrity and reputation. We provide all new employees with a copy of the code and our values and behaviours during our induction process and also require all staff to complete annual online compliance training related to the code and its principles.
Below: NTC staff in 2015.

New risk management approach delivers benefits
Joanne Olsen NTC Chief Corporate Officer
Sound risk management is an important part of organisational governance and the NTC has refreshed its risk management approach to align with best-practice and realise the many benefits this can bring.
NTC Chief Corporate Officer Joanne Olsen said the approach involved a new risk management framework to ensure risks were managed consistently and effectively throughout the organisation.
‘At a time of increasing pressure on the public sector to display better governance, a sound risk management methodology is critical to maintaining and enhancing our performance,’ Joanne said.
‘Effective and transparent risk management can lead to better decision making and planning, and better identification of opportunities as well as threats.
‘It is also about developing a risk culture – a sound awareness of risk among all our staff – so that everyone has the confidence to ask questions and challenge assumptions. This is vital in allowing us to pursue sustainable policies and business practices.’
The framework was based on the latest Australian/New Zealand ISO risk management standard and provided a rigorous and systematic way to identity, assess and respond to risks that could affect the NTC’s ability to achieve its organisational objectives.
The framework comprised four areas of risk – financial, operational, project and reputational – and stipulated regular reviews, including quarterly reviews of identified risks and annual reviews of the framework itself.
Jo said the NTC’s commissioners, particularly those on the Risk and Audit Committee, had tapped into their extensive risk management experience from Australia’s transport industry and the public sector when developing the framework.
‘Our commissioners, and increasingly all of our people, understand that effective risk management is good business practice, creates value and is integral to sound corporate governance,’ Jo said.
Developing organisational capability
Our commitment to organisational capability development continued in 2014 – 15, with the implementation of an annual learning and development strategy accompanied by increased funding for training and development initiatives.
The NTC has adopted the widely held principle that learning takes place through a combination of formal and informal situations, and that opportunities for learning and development can occur every day and not solely at formal training events.
Our focus in 2014 – 15 was centred on improving our individual and organisational capability in project management, professional writing, stakeholder engagement and personal efficiency. A new project management framework and methodology were introduced, accompanied by in-house training and individual coaching led by the leadership team and the newly established project management office.
The new methodology has streamlined work program reporting; enabled a more rapid response to resource shortfalls or work program changes; and enabled more effective issues and risk management. The new methodology also included developing new stakeholder engagement and communication plan tools and templates, and associated staff training.
Formal training for all staff during the year included:
• the Plain English Foundation’s Getting to the Point writing workshop to improve writing skills
• CMA's Influencing for Outcomes workshop to improve stakeholder engagement capability
• PEPworldwide's Personal Efficiency Program to improve day-to-day personal efficiency and effectiveness.
In addition, staff participated in a range of industry visits, meetings, workshops and conferences with stakeholders; partook in secondments, formal mentoring and coaching programs; and presented at international and Australian conferences.
In 2015 – 16, our learning and development strategy will focus on formal training in policy development and the preparation of regulatory impact statements as well as continuing to build our organisational capability in leadership, project management, stakeholder engagement and change management.
www.ntc.gov.au 37

Carolyn Walsh Deputy ChairCarolyn commenced as Deputy Chair and Commissioner of the NTC on 1 January 2014.
Carolyn is also a Commissioner of the Australian Transport Safety Bureau and is a member of several Audit and Risk Committees for government agencies in New South Wales. She also provides consultancy services in safety and risk management.
Her past roles with the NSW Government have included Chief Executive of the Independent Transport Safety and Reliability Regulator and Executive Director, Office of the Coordinator General of Rail. She has also held several positions within the Commonwealth Department of Industry, Science and Resources.
David Anderson, PSM Chair David commenced as Chair and Commissioner of the NTC on 1 January 2014.
David is an independent consultant on transport and infrastructure issues and has worked on projects for private companies, Australian transport jurisdictions and the Prime Minister and senior ministers of East Timor.
His roles include or have included: Chairman, Centre for Pavement Engineering Education; Chief Executive Officer of VicRoads; independent Chair of the National Heavy Vehicle Regulator’s Performance Based Standards Review Panel; consultant on East Timor’s Infrastructure Plan 2009–2020; and expert panellist on rail safety and heavy vehicle policy.
David was awarded a Public Service Medal in 2000 for outstanding public service to road development, particularly road safety programs.
Paul Retter, AM Chief Executive and Commissioner Paul commenced as Chief Executive and Commissioner of the NTC on 8 July 2013.
Paul has extensive knowledge of transport and logistics, having held the position of Executive Director of the Office of Transport Security at the Department of Infrastructure and Transport from 2006 to 2013.
Prior to this, Paul was a senior member of the Australian Defence Force. His 34-year army career included appointments as Director General of Preparedness and Plans, and Deputy Force Commander of the United Nations’ Peacekeeping Force in East Timor.
Paul was appointed a Member of the Order of Australia in 2006 and was awarded the Australian Security Medal (Australian Security Industry Award) for Conspicuous Service in 2012.
38 NTC Annual Report 2014 – 15
Corporate governanceNTC Commissioners

Nola Bransgrove, OAM Commissioner Nola commenced as a Commissioner of the NTC on 1 January 2014.
Nola is joint owner of Branstrans Pty Ltd – a Victorian-based transport company – and chair of two industry bodies: Transport & Distribution Training and Women in Supply Chain.
Her previous roles have included: Municipal Councillor of Traralgon Shire, Commissioner of the Latrobe Regional Commission, Trustee Director of Transport Industry Superannuation Fund, and Councillor of the Victorian Freight and Logistics Council.
Nola had an instrumental role in the development of the industry accreditation program TruckSafe. She was awarded a Medal of the Order of Australia in 2012 for services to the transport and logistics industry, women and the community.
Mike Mrdak CommissionerMike commenced as a Commissioner of the NTC on 1 January 2014.
Mike is also Secretary of the Commonwealth Department of Infrastructure and Regional Development. His past roles have included senior positions across this portfolio and within the Department of the Prime Minister and Cabinet.
He is also the Australian Government’s representative on the Board of the Foundation for Rural and Regional Renewal.
Neil Scales, OBE CommissionerNeil commenced as a Commissioner of the NTC on 10 September 2014.
Neil is Director-General of Queensland’s Department of Transport and Main Roads. His career has also included roles as Chief Executive for TransLink in Queensland, and several senior positions in England’s transport industry, including as Chief Executive of Merseytravel.
Neil was awarded an Officer of the Order of the British Empire in 2005 for services to public transport. He was also awarded an honorary fellowship from Liverpool John Moores University in 2011 for services to the region.
39www.ntc.gov.au

Role of the NTC Board of Commissioners
The board operates under the National Transport Commission Act 2003 (Cwlth) and the Public Governance, Performance and Accountability Act 2013 (Cwlth).
The board, in conjunction with the Transport and Industry Council, is responsible for the strategic direction and performance of the NTC. It comprises six commissioners, including our Chief Executive, and meets regularly throughout the year.
The board considers a Statement of Expectations in its operations. The statement was issued by the Chair of the council – Deputy Prime Minister and Minister for Infrastructure and Regional Development, the Honourable Warren Truss, MP – to outline the council’s expectations of our operations and performance from 1 January 2014 until 31 December 2016. The Statement of Expectations is available from our website and is reflected in our strategic plan.
An essential part of the board’s responsibility is establishing a sound, risk-based system of controls to provide reasonable assurance that our objectives will be met within an acceptable degree of risk.
The board also plays a tactical role in maintaining a watching brief over external and internal environments, and Chief Executive performance. While it does not have a day-to-day management role, the board has authority to determine all matters related to our policies, practices, management and operations. The board is required to take all action necessary to achieve our objectives.
Commissioners
The current Board of Commissioners was appointed on 1 January 2014 by the Honourable Warren Truss, MP, for a three-year term. NTC Chief Executive and Commissioner Paul Retter, AM, was appointed on 8 July 2013 under a five-year contract.
Commission meetings
The following table sets out the number of commission meetings and Risk and Audit Committee meetings held during 2014 – 15, and the number of meetings each commissioner attended. During the reporting period, five commission meetings and four Risk and Audit Committee meetings were held.
Commissioners Commission meetings Risk and Audit Committee meetings
No. eligible to attend
No. attendedNo. eligible to attend
No. attended
David Anderson – Chairman 5 5 0 4 (by invitation)
Carolyn Walsh – Deputy Chair 5 5 4 4
Nola Bransgrove 5 5 4 4
Mike Mrdak 5 3 0 0
Neil Scales1 4 2 2 1
Paul Retter – Chief Executive and Commissioner 5 5 0 4 (by invitation)
1 Neil Scales OBE was appointed as an NTC Commissioner in September 2014 to replace Norm McIlfatrick. Mr Scales subsequently became a member of the Risk and Audit Committee in February 2015.
40 NTC Annual Report 2014 – 15

41www.ntc.gov.au
Risk and Audit Committee
The committee’s primary focus is to independently assess our risk management policies and procedures, internal control systems and governance, and to provide relevant reports and advice to the board on a regular basis.
It works to ensure:
• all major organisational risks have been identified and are subject to periodic risk assessment by staff, with appropriate mitigation measures put in place where necessary
• all government policies and legislated requirements in relation to WHS and financial management are being met
• all mandated external reports to government are accurate before being submitted to the board
• financial accounts are independently audited in accordance with government legislated requirements.
Committee members during 2014 – 15 were:
• Carolyn Walsh (Chair)
• Nola Bransgrove OAM
• Neil Scales OBE1.
Other commissioners may attend meetings either by invitation or as observers.
Risk management
The NTC’s risk management framework provides instructions to the Board of Commissioners, management and staff for the implementation of consistent risk management practices. The framework provides a structured, consistent and ongoing process to identify, assess, respond and report on risks that may prevent us from achieving our organisational objectives.
The framework comprises four risk categories – financial, operational, project and reputational – which are reflected in a risk register. The Risk and Audit Committee reviews the register quarterly before reporting to the board. The committee also presents a full reassessment of risks, controls, mitigations and strategies annually to the board.
In addition, the board is regularly advised of significant risk mitigation activities, including the status of our business continuity plan, and is provided with assurances that risk management plans are in place for each significant enterprise risk and that satisfactory mitigation is being undertaken for all other enterprise risks.
Compliance
The NTC has a comprehensive compliance management plan, which includes fraud management. The plan is updated and reviewed regularly by our management team and the Risk and Audit Committee. Staff undertake training in both fraud awareness and our Code of Conduct.
The Fraud Management Plan’s main objectives are to:
• ensure employees are aware of and responsible for establishing controls and procedures for the prevention and detection of fraud, corruption and misconduct
• ensure employees and management are accountable for reporting suspicions of fraud, corruption and misconduct within the workplace
• build an organisational culture that supports employees to report conduct they suspect may be fraudulent, corrupt or improper
• ensure appropriate action is taken if fraudulent conduct is detected
• provide a clear statement to employees that fraudulent or corrupt conduct is not acceptable and will not be tolerated.
There were no instances of fraud recorded during 2014 – 15.
The Risk and Audit Committee is a sub-committee of the Board of Commissioners. The committee has delegated responsibility for monitoring and reporting on risk, control and compliance frameworks.
1 Neil Scales OBE was appointed as an NTC Commissioner in September 2014 to replace Norm McIlfatrick. Mr Scales subsequently became a member of the Risk and Audit Committee in February 2015.

42 NTC Annual Report 2014 – 15
Business planning
Each year, the NTC is required to develop a four-year strategic plan, corporate plan and work program for approval by the Transport and Infrastructure Council. This is in accordance with the National Transport Commission Act 2003 (Cwlth), the Public Governance, Performance and Accountability Act 2013 (Cwlth), and the Inter-Governmental Agreement for Regulatory and Operational Reform in Road, Rail and Intermodal Transport.
The strategic plan, corporate plan and work program are prepared under the guidance of our commissioners, with valuable input from government and industry stakeholders.
Indemnities and insurance
For the reporting period ending June 2015, no indemnity claims were made against the NTC or any of our officers. We ensure adequate insurance cover is obtained each year to cover all areas of the organisation, including professional indemnity, directors and officers, general business, travel, and workers compensation.
External scrutiny
During the 2014 – 15 financial year, there were no reports by the Auditor-General (other than the report on financial statements), parliamentary committees or the Commonwealth Ombudsman that referred to the NTC.
No judicial decisions were made in 2014 – 15 that had, or may have, an impact on our operation, the National Transport Commission Act 2003 (Cwlth) or the inter-governmental agreement.
On 7 November 2014, the Transport and Infrastructure Council announced it had agreed to terms of reference for the scheduled six-yearly review of the NTC under s.51 of the National Transport Commission Act. A copy of the terms of reference is available on the Department of Infrastructure and Regional Development website. The review was underway at the time of writing this annual report.
There have been no other key activities or changes that affected our operations or structure during the 2014 – 15 financial year.

Financial statements 2014 – 15
43Financial statements

44 NTC Annual Report 2014 – 15
Table of contents
Statement by the Commissioners, Chief Executive and Manager Finance
Auditor’s report
Statement of comprehensive income
Statement of financial position
Statement of changes in equity
Cash flow statement
Schedule of commitments
Note 1: Summary of significant accounting policies
Note 2: Events after the reporting period
Note 3: Expenses
Note 4: Own source income
Note 5: Fair value measurements
Note 6: Financial assets
Note 7: Non-financial assets
Note 8: Payables
Note 9: Provisions
Note 10: Cash flow reconciliation
Note 11: Related party disclosures
Note 12: Senior executive remuneration
Note 13: Financial instruments
Note 14: Financial assets reconciliation
Note 15: Reporting of outcomes
Note 16: Budgetary reports and explanations of major variances
45
46 – 47
48
49
50
51
52
53 – 58
58
59
60
60 – 61
62
63 – 64
65
65
66
66
67
68 – 71
71
71
72 – 75

45Financial statements
In our opinion, the attached financial statements for the year ended 30 June 2015 comply with subsection 42(2) of the Public Governance, Performance and Accountability Act 2013 (PGPA Act), and are based on properly maintained financial records as per subsection 41(2) of the PGPA Act.
In our opinion, at the date of this statement, there are reasonable grounds to believe that the National Transport Commission will be able to pay its debts as and when they fall due.
This statement is made in accordance with a resolution of the commissioners.
Statement by the commissioners, Chief Executive and Manager Finance
Statement by the Commissioners, Chief Executive and Manager Finance
Auditor’s report
Statement of comprehensive income
Statement of financial position
Statement of changes in equity
Cash flow statement
Schedule of commitments
Note 1: Summary of significant accounting policies
Note 2: Events after the reporting period
Note 3: Expenses
Note 4: Own source income
Note 5: Fair value measurements
Note 6: Financial assets
Note 7: Non-financial assets
Note 8: Payables
Note 9: Provisions
Note 10: Cash flow reconciliation
Note 11: Related party disclosures
Note 12: Senior executive remuneration
Note 13: Financial instruments
Note 14: Financial assets reconciliation
Note 15: Reporting of outcomes
Note 16: Budgetary reports and explanations of major variances
David Anderson, PSM
Chairman
Date: 21 August 2015
Paul Retter, AM
Chief Executive and Commissioner
Date: 21 August 2015
Duminda Senanayake
Manager Finance
Date: 21 August 2015

Auditor’s report
46 NTC Annual Report 2014 – 15

47Financial statements

48 NTC Annual Report 2014 – 15
Statement of comprehensive incomeFor the period ended 30 June 2015
2015 2014
Notes $ $
ExPENSES
Employee benefits 3A 5,574,979 5,699,050
Suppliers 3B 3,141,621 3,004,003
Depreciation and amortisation 3C 207,351 185,892
Total expenses 8,923,951 8,888,945
LESS:
OWN-SOURCE INCOME
Own-source revenue
Sale of goods and rendering of services – external parties 98 17,669
Interest on deposits 42,051 40,051
Total own-source revenue 42,149 57,720
Net cost of services 8,881,802 8,831,225
Revenue from government 4A 9,259,000 9,095,000
Surplus/(deficit) attributable to the Australian Government 377,198 263,775
OTHER COMPREHENSIVE INCOME
Total comprehensive income attributable to the Australian Government 377,198 263,775
The above statement should be read in conjunction with the accompanying notes.

49Financial statements
Statement of financial position As at 30 June 2015
2015 2014
Notes $ $
ASSETS
Financial assets
Cash and cash equivalents 1.10 2,286,228 1,737,286
Trade and other receivables 6A 74,317 74,901
Total financial assets 2,360,545 1,812,187
Non-financial assets
Buildings 7A,C 127,047 184,650
Plant and equipment 7B,C 512,355 512,279
Prepayments 7D 80,216 110,187
Total non-financial assets 719,618 807,116
Total assets 3,080,163 2,619,303
LIABILITIES
Payables
Suppliers 8A 304,057 311,849
Other payables 8B 7,094 3,409
Total payables 311,151 315,258
Provisions
Employee provisions 9A 788,726 700,957
Total provisions 788,726 700,957
Total liabilities 1,099,877 1,016,215
Net assets 1,980,286 1,603,088
EQUITy
Reserves 119,607 119,607
Retained surplus 1,860,679 1,483,481
Total equity 1,980,286 1,603,088
The above statement should be read in conjunction with the accompanying notes.

50 NTC Annual Report 2014 – 15
Statement of changes in equityFor the period ended 30 June 2015
Asset revaluation
Retained earnings Reserve Total equity
2015 2014 2015 2014 2015 2014
$ $ $ $ $ $
Opening balance Balance carried forward from previous period
1,483,481 1,219,706 119,607 119,607 1,603,088 1,339,313
Surplus/(deficit) for the period 377,198 263,775 - - 377,198 263,775
Closing balance as at 30 June 1,860,679 1,483,481 119,607 119,607 1,980,286 1,603,088
The above statement should be read in conjunction with the accompanying notes.

51Financial statements
Cash flow statement For the period ended 30 June 2015
2015 2014
Notes $ $
OPERATING ACTIVITIES
Cash received
Receipts from government
Sale of goods and rendering of services 9,259,094 9,123,248
Interest 42,051 40,051
Net GST received 241,447 343,612
Other 98 17,669
Total cash received 9,542,690 9,524,580
Cash used
Employees 5,322,083 5,666,749
Suppliers 3,521,841 3,841,780
Total cash used 8,843,924 9,508,529
Net cash (used by) operating activities 10 698,766 16,051
INVESTING ACTIVITIES
Cash used
Purchase of plant and equipment 149,824 412,789
Total cash used 149,824 412,789
Net cash (used by) investing activities (149,824) (412,789)
Net increase / (decrease) in cash held 548,942 (396,738)
Cash and cash equivalents at the beginning of the reporting period 1,737,286 2,134,024
Cash and cash equivalents at the end of the reporting period 2,286,228 1,737,286
The above statement should be read in conjunction with the accompanying notes.

52 NTC Annual Report 2014 – 15
Schedule of commitmentsAs at 30 June 2015
2015 2014
$ $
By TyPE
Commitments receivable
Net GST recoverable on commitments (158,687) (214,621)
Total commitments receivable (158,687) (214,621)
Commitments payable
Other commitments
Operating leasesi 1,497,846 2,122,577
Other 247,709 238,248
Total other commitments 1,745,555 2,360,825
Net commitments by type 1,586,869 2,146,204
By MATURITy
Commitments receivable
Other commitments receivable
Within 1 year (91,395) (84,663)
Between 1 and 5 years (67,292) (129,958)
Total other commitments receivable (158,687) (214,621)
Commitments payable
Operating lease commitments
Within 1 year 757,631 693,041
Between 1 and 5 years 740,215 1,429,536
Total operating lease commitments 1,497,846 2,122,577
Other commitments
One year or less 247,709 238,248
Total other commitments 247,709 238,248
Net commitments by maturity 1,586,869 2,146,204
NB: Commitments are GST inclusive where relevant.
i Operating leases included are effectively non-cancellable and comprise: leases for office accommodation. Lease payments are subject to annual increase in accordance with agreed upwards movements of 4.5% per annum. The existing lease is fixed term for five years with no option to extend attached. The current lease is due to expire in May 2017.
The above schedule should be read in conjunction with the accompanying notes.

53Financial statements
Note 1: Summary of significant accounting policies1.1 Objectives of the commission
The National Transport Commission (the commission) is an independent body established under Commonwealth legislation and funded jointly by the Commonwealth, states and territories. Its principal objectives are to improve transport productivity, efficiency, safety and environmental performance and regulatory efficiency in a uniform or nationally consistent manner. The principal objectives are achieved through the effective implementation (by others) of transport reforms based on nationally consistent policy and regulation developed by the commission. The commission is required to work with states, territories and the Commonwealth to develop implementation plans, and monitor implementation, maintain and review agreed reforms. The commission works in co-operation with transport agencies, industry and other stakeholders and reports to the Transport and Infrastructure Council, a council of transport, infrastructure and roads ministers from all jurisdictions.
The continued existence of the commission in its present form and with its present programs is dependent on the commission’s periodic review (in accordance with the NTC Act) and on continuing funding by the Commonwealth, states and territories.
1.2 Basis of preparation of the financial statements
The financial statements are general purpose financial statements and are required by section 42 of the Public Governance, Performance and Accountability Act 2013.
The financial statements have been prepared in accordance with:
• Financial Reporting Rule (FRR) for reporting periods ending on or after 1 July 2014; and
• Australian Accounting Standards and Interpretations issued by the Australian Accounting Standards Board (AASB) that apply for the reporting period.
The financial statements have been prepared on an accrual basis and are in accordance with historical cost convention, except for certain assets and liabilities at fair value. Except where stated, no allowance is made for the effect of changing prices on the results or the financial position.
The financial statements are presented in Australian dollars and values are rounded to the nearest dollar unless otherwise specified.
Unless an alternative treatment is specifically required by an accounting standard or the FRR, assets and liabilities are recognised in the statement of financial position when and only when it is probable that future economic benefits will flow to the commission or a future sacrifice of economic benefits will be required and the amounts of the assets or liabilities can be reliably measured. However, assets and liabilities arising under executor contracts are not recognised unless required by an accounting standard. Liabilities and assets that are unrecognised are reported in the schedule of commitments or the contingencies note.
Unless alternative treatment is specifically required by an accounting standard, income and expenses are recognised in the Statement of Comprehensive Income when, and only when, the flow, consumption or loss of economic benefits has occurred and can be reliably measured.
1.3 Significant accounting judgements and estimates
In the process of applying the accounting policies listed in this note, the commission has made the following judgements that have the most significant impact on the amounts recorded in the financial statements:
• The fair value of leasehold improvements has been taken to be the market value of similar leasehold improvements as determined by an independent valuer. Management view that there is no material difference between fair value and carrying value since the last valuation due to refurbishment carried out during 2013 – 14.
Notes to and forming part of the financial statements For the period ended June 2015

54 NTC Annual Report 2014 – 15
Notes to and forming part of the financial statements (continued) For the period ended June 2015
1.4 New Australian Accounting Standards
Adoption of New Australian Accounting Standard requirements
No accounting standard has been adopted earlier than the application date as stated in the standard.
The following new standard issued prior to the signing of the statement by the Chairman, Chief Executive and Manager Finance, was applicable to the current reporting period and required additional disclosures on the commission’s financial statements.
Standard Nature of disclosure
AASB 1055 Budgetary Reporting With effect from annual reporting periods beginning on or after 1 July 2014, explanations of major variances between the actual amounts presented in the financial statements and the corresponding original budget amounts.
Future Australian Accounting Standard Requirements
New standards, amendments to standards or interpretations have been issued by the Australian Accounting Standards Board but are effective for future reporting periods. It is estimated that the impact of adopting these pronouncements when effective will have no material financial impact on future reporting periods.
1.5 Revenue
Revenue from the sale of goods is recognised when:
• the risks and rewards of ownership have been transferred to the buyer;
• the commission retains no managerial involvement or effective control over the goods;
• the revenue and transaction costs incurred can be reliably measured; and
• it is probable that the economic benefits associated with the transaction will flow to the commission.
Revenue from rendering of services is recognised by reference to the stage of completion of contracts at the reporting date. The revenue is recognised when:
• the amount of revenue, stage of completion and transaction costs incurred can be reliably measured; and
• the probable economic benefits with the transaction will flow to the commission.
Service revenues are government contributions approved by the Transport and Infrastructure Council and other government project funding. Revenues are recognised as revenue to the extent that they have been received or when it is highly probable that amounts are likely to be received.
The stage of completion of contracts at the reporting date is determined by reference to the proportion that costs incurred to date bear to the estimated total costs of the transaction.
Receivables for goods and services, which have 30 day terms, are recognised at the nominal amounts due less any impairment allowance account. Collectability of debts is reviewed at end of the reporting period. Allowances made when collectability of the debt is no longer probable.
Interest revenue is recognised using the effective interest method as set out in AASB 139 Financial Instruments: Recognition and Measurement.

55Financial statements
Revenue from government
Government contributions are recognised as revenue from government when the entity gains control of the contribution, except for certain amounts that relate to activities that are reciprocal in nature, in which case revenue is recognised only when it has been earned. Contributions receivable are recognised at their nominal amounts.
Funding received or receivable from non-corporate Commonwealth entities (appropriated to the non-corporate Commonwealth entity as a corporate Commonwealth entity payment item for payment to the commission) is recognised as revenue from government unless they are in the nature of an equity injection or a loan.
Parental Leave Payments Scheme
Amounts received by the commission not yet paid to employees would be presented as gross cash and a liability (payable). The total amount received under this scheme was $6,455.16. (2014: Nil)
1.6 Employee benefits
Liabilities for ‘short-term employee benefits’ (as defined in AASB 119 Employee Benefits) and termination benefits due within 12 months of end of reporting period are measured at their nominal amounts.
The nominal amount is calculated with regard to the rates expected to be paid on settlement of the liability.
Other long-term employee benefits are measured as net total of the present value of the defined benefit obligation at the end of the reporting period minus the fair value at the end of the reporting period of plan assets (if any) out of which the obligations are to be settled directly.
Leave
The liability for employee benefits includes provision for annual leave and long service leave. No provision has been made for sick leave as all sick leave is non-vesting and the average sick leave taken in future years by employees of the commission is estimated to be less than the annual entitlement for sick leave.
The leave liabilities are calculated on the basis of employees’ remuneration at the estimated salary rates that will be applied at the time the leave is taken, including the commission’s employer superannuation contribution rates to the extent that the leave is likely to be taken during service rather than paid out on termination.
The liability for long service leave has been determined by reference to staff members’ years of service at the commission. The estimate of the present value of the liability takes into account attrition rates and pay increases through promotion and inflation.
Superannuation
Contributions are made by the commission to employee superannuation funds and are charged as expenses when incurred. The liability for superannuation recognised at 30 June 2015 represents outstanding contributions for the final month of the year.
1.7 Leases
A distinction is made between finance leases and operating leases. Finance leases effectively transfer from the lessor to the lessee substantially all the risks and rewards incidental to ownership of leased assets. An operating lease is a lease that is not a finance lease. In operating leases, the lessor effectively retains substantially all such risks and benefits.
The discount rate used is the interest rate implicit in the lease. Leased assets are amortised over the period of the lease. Lease payments are allocated between the principal component and the interest expense.
Operating lease payments are expensed on a straight line basis which is representative of the pattern of benefits derived from the leased assets.
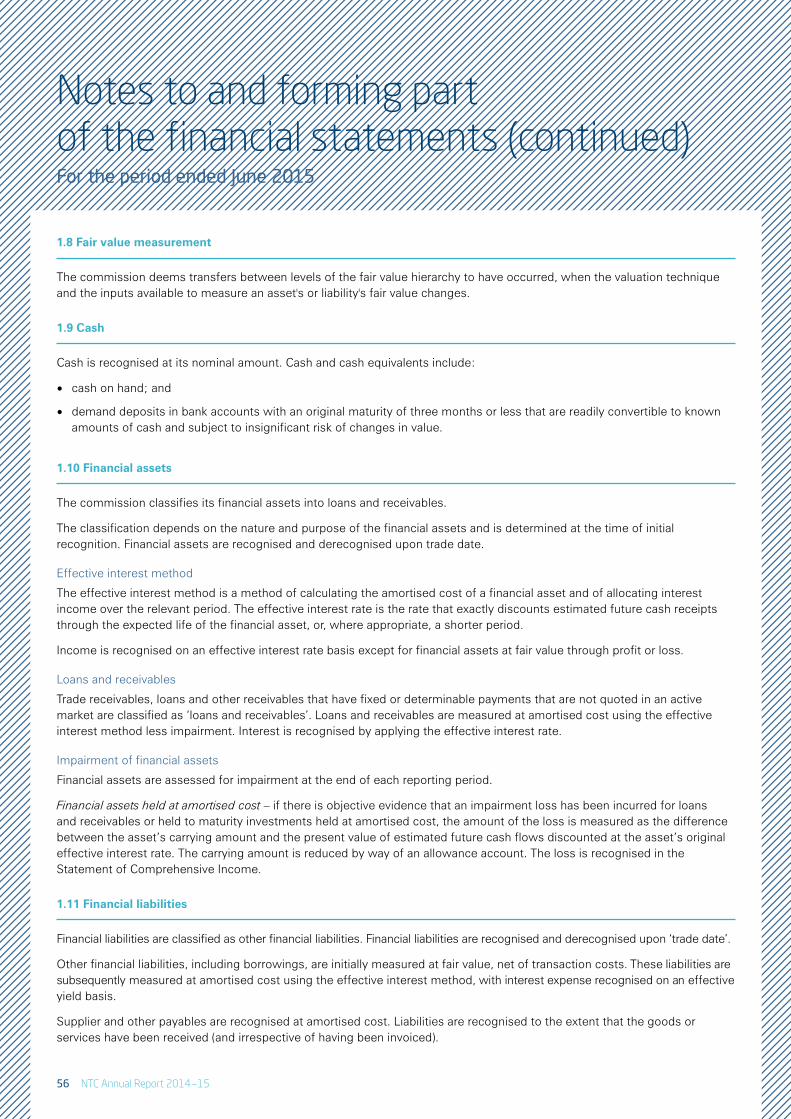
56 NTC Annual Report 2014 – 15
Notes to and forming part of the financial statements (continued) For the period ended June 2015
1.8 Fair value measurement
The commission deems transfers between levels of the fair value hierarchy to have occurred, when the valuation technique and the inputs available to measure an asset's or liability's fair value changes.
1.9 Cash
Cash is recognised at its nominal amount. Cash and cash equivalents include:
• cash on hand; and
• demand deposits in bank accounts with an original maturity of three months or less that are readily convertible to known amounts of cash and subject to insignificant risk of changes in value.
1.10 Financial assets
The commission classifies its financial assets into loans and receivables.
The classification depends on the nature and purpose of the financial assets and is determined at the time of initial recognition. Financial assets are recognised and derecognised upon trade date.
Effective interest method
The effective interest method is a method of calculating the amortised cost of a financial asset and of allocating interest income over the relevant period. The effective interest rate is the rate that exactly discounts estimated future cash receipts through the expected life of the financial asset, or, where appropriate, a shorter period.
Income is recognised on an effective interest rate basis except for financial assets at fair value through profit or loss.
Loans and receivables
Trade receivables, loans and other receivables that have fixed or determinable payments that are not quoted in an active market are classified as ‘loans and receivables’. Loans and receivables are measured at amortised cost using the effective interest method less impairment. Interest is recognised by applying the effective interest rate.
Impairment of financial assets
Financial assets are assessed for impairment at the end of each reporting period.
Financial assets held at amortised cost – if there is objective evidence that an impairment loss has been incurred for loans and receivables or held to maturity investments held at amortised cost, the amount of the loss is measured as the difference between the asset’s carrying amount and the present value of estimated future cash flows discounted at the asset’s original effective interest rate. The carrying amount is reduced by way of an allowance account. The loss is recognised in the Statement of Comprehensive Income.
1.11 Financial liabilities
Financial liabilities are classified as other financial liabilities. Financial liabilities are recognised and derecognised upon ‘trade date’.
Other financial liabilities, including borrowings, are initially measured at fair value, net of transaction costs. These liabilities are subsequently measured at amortised cost using the effective interest method, with interest expense recognised on an effective yield basis.
Supplier and other payables are recognised at amortised cost. Liabilities are recognised to the extent that the goods or services have been received (and irrespective of having been invoiced).

57Financial statements
1.12 Contingent liabilities and contingent assets
Contingent liabilities and contingent assets are not recognised in the balance sheet but are reported in the relevant schedules and notes. They may arise from uncertainty as to the existence of a liability or asset or represent an asset or liability in respect of which the amount cannot be reliably measured. Contingent assets are disclosed when settlement is probable but not virtually certain and contingent liabilities are recognised when settlement is greater than remote.
The commission has no contingent liabilities, assets or any significant contingencies for the year ended 30 June 2015. (2014: Nil)
1.13 Acquisition of assets
Assets are recorded at cost on acquisition except as stated below. The cost of acquisition includes the fair value of assets transferred in exchange and liabilities undertaken. Financial assets are initially measured at their fair value plus transaction costs where appropriate.
Assets acquired at no cost, or for nominal consideration, are initially recognised as assets and income at their fair value at the date of acquisition, unless acquired as a consequence of restructuring of administrative arrangements. In the latter case, assets are initially recognised as contributions by owners at the amount at which they were recognised in the transferer’s accounts immediately prior to the restructuring.
1.14 Leasehold improvements, plant and equipment
Asset recognition threshold
Purchases of leasehold improvements, plant and equipment are recognised initially at cost in the balance sheet, except for purchases costing less than $1,000, which are expensed in the year of acquisition (other than where they form part of a group of similar items which are significant in total).
The initial cost of an asset includes an estimate of the cost of dismantling and removing the item and restoring the site on which it is located.
Revaluations
Following initial recognition at cost, property, plant and equipment were carried at fair value less subsequent accumulated depreciation and accumulated impairment losses. Valuations are conducted with sufficient frequency to ensure that the carrying amounts of assets do not differ materially from the assets’ fair values as at the reporting date. The regularity of independent valuations depends upon the volatility of movements in market values for the relevant assets.
Revaluation adjustments are made on a class basis. Any revaluation increment is credited to equity under the heading of asset revaluation reserve except to the extent that it reverses a previous revaluation decrement of the same asset class that was previously recognised in surplus/deficit. Revaluation decrements for a class of assets are recognised directly in surplus/deficit to the extent that they reverse a previous revaluation increment for that class.
Any accumulated depreciation as at the revaluation date is eliminated against the gross carrying amount of the asset and the asset restated to the revalued amount.
Depreciation
Depreciable leasehold improvements, plant and equipment assets are written-off to their estimated residual values over their estimated useful lives to the commission using, in all cases, the straight line method of depreciation.
Depreciation rates (useful lives), residual values and methods are reviewed at each reporting date and necessary adjustments are recognised in the current, or current and future reporting periods, as appropriate.

58 NTC Annual Report 2014 – 15
Notes to and forming part of the financial statements (continued) For the period ended June 2015
Depreciation rates applying to each class of depreciable asset are based on the following useful lives:
2015 2014
Leasehold improvements Lease term Lease term
Plant and equipment 2 to 9 years 2 to 9 years
Impairment
All assets were assessed for impairment at 30 June 2015. Where indications of impairment exist, the asset receivable amount is estimated and an impairment adjustment made if the asset’s recoverable amount is less than its carrying amount.
The recoverable amount of an asset is the higher of its fair value less costs to sell and its value in use. Value in use is the present value of the future cash flows expected to be derived from the asset. Where the future economic benefit of an asset is not primarily dependent on the asset’s ability to generate future cash flows, and the asset would be replaced if the commission were deprived of the asset, its value in use is taken to be its depreciated replacement cost.
1.15 Taxation
The commission is exempt from all forms of taxation except Fringe Benefits Tax (FBT) and the Goods and Services Tax (GST).
Revenues, expenses and assets are recognised net of GST except:
• where the amount of GST incurred is not recoverable from the Australian Taxation Office; and
• for receivables and payables.
Note 2: Events after the reporting periodThere were no events subsequent to the reporting period that have or will materially affect the ongoing structure and financial activities of the commission.

59Financial statements
Note 3: Expenses
2015 2014$ $
Note 3A: Employee benefits
Wages and salaries 5,052,395 5,287,943
Superannuation:
Defined contribution plans 434,815 440,345
Leave and other entitlements 87,769 (29,238)
Total employee benefits 5,574,979 5,699,050
Note 3B: Supplier
Goods and services supplied or rendered
Consultants 1,694,441 1,548,814
Travel 394,581 338,723
Other 414,173 495,869
Total goods and services supplied or rendered 2,503,195 2,383,406
Goods and services supplied in connection with
Provision of goods - external parties 808,754 834,592
Rendering of services - external parties 1,694,441 1,548,814
Total goods and services 2,503,195 2,383,406
Other suppliers
Operating lease rentals in connection with
External parties:Minimum lease payments 612,339 595,900
Auditor’s remuneration 18,500 16,600
Workers compensation expenses 7,587 8,097
Total other suppliers 638,426 620,597
Total suppliers 3,141,621 3,004,003
Note 3C: Depreciation
Depreciation:
Plant & equipment 146,094 137,172
Buildings 61,257 48,721
Total depreciation 207,351 185,893
No other services were provided by the auditor of the financial statements.

60 NTC Annual Report 2014 – 15
Notes to and forming part of the financial statements (continued) For the period ended June 2015
Note 4: Own source income
2015 2014
$ $
REVENUE FROM GOVERNMENT
Note 4A: Revenue from government
Federal Government contribution approved by Transport and Infrastructure Council – related entities
3,242,000 3,169,000
State and Territory Government contributions approved by Transport and Infrastructure Council – external parties
6,017,000 5,896,000
Government revenue based on specific project funding – related entities - 30,000
Total revenue from government 9,259,000 9,095,000
Note 5: Fair value measurementsThe following tables provide an analysis of assets and liabilities that are measured at fair value.
The different levels of the fair value are defined below.
Level 1: Quoted prices (unadjusted) in active markets for identical assets or liabilities that the entity can access at measurement date.Level 2: Inputs other than quoted prices included within Level 1 that are observable for the asset or liability, either directly or indirectly.Level 3: Unobservable inputs for the asset or liability.
Note 5A: Fair value measurements, valuation techniques and inputs used
Fair value measurements at the end of the reporting period
2015 2014 Category Valuation Technique
Inputs Used Range (weighted average)
$ $
Non-financial assets
Leasehold improvements 127,047 184,650 Level 3 Depreciated replacement cost
Index from Rawlinsons Australian Construction Handbook
Useful life
Plant and equipment 512,355 512,279 Level 3 Depreciated replacement cost
Independent research
Useful life
Total non-financial assets 639,402 696,929
Total fair value measurements of assets in the statement of financial position 639,402 696,929

61Financial statements
Recurring and non-recurring level 3 fair value measurements – valuation processes
Leasehold improvements and plant and equipment are held at fair value. When leasehold improvements and plant and equipment are specialised in use, such that it is rarely sold other than as part of a going concern, fair value is determined using the depreciated replacement cost method.
There were no changes in valuation techniques throughout the period to 30 June 2015.
Recurring level 3 fair value measurements – sensitivity of inputs
A significant increase or decrease in the estimated useful life of the asset would result in a significantly higher or lower valuation.
Note 5B: Reconciliation for recurring level 3 fair value measurements
Recurring level 3 fair value measurements – reconciliation for assets
Non-financial assets
Leasehold improvements
Plant and equipment
Leasehold improvements
Plant and equipment
Total Total
2015 2015 2014 2014 2015 2014
$ $ $ $ $ $
Opening balance 184,650 512,279 75,060 335,068 696,929 410,128
Purchases 3,660 146,164 158,311 314,380 149,824 472,691
Depreciation (61,263) (146,088) (48,721) (137,171) (207,351) (185,892)
Closing balance 127,047 512,355 184,650 512,279 639,402 696,929
The entity’s policy for determining when transfers between levels deemed to have occurred can be found in Note 1.

62 NTC Annual Report 2014 – 15
Notes to and forming part of the financial statements (continued) For the period ended June 2015
Note 6: Financial assets
2015 2014
$ $
Note 6A: Trade and other receivables
Goods and services receivables in connection with
External parties 3,149 4,025
Total goods and services receivables 3,149 4,025
Other receivables:
GST receivable from the Australian Taxation Office 71,168 70,876
Total other receivables 74,317 74,901
Total trade and other receivables 74,317 74,901
Receivables are expected to be recovered in:
No more than 12 months 74,317 74,901
More than 12 months - -
Total trade and other receivables (net) 74,317 74,901
Receivables are aged as follows:
Not overdue 74,317 74,901
Overdue by:
0 to 30 days - -
31 to 60 days - -
61 to 90 days - -
More than 90 days - -
Total receivables (gross) 74,317 74,901
Credit terms for goods and services were within 30 days (2014: 30 days)

63Financial statements
Note 7: Non-financial assets
2015 2014
$ $
Note 7A: Buildings
Leasehold improvements
Fair value 907,369 903,709
Accumulated depreciation (780,322) (719,059)
Total buildings - leasehold improvements 127,047 184,650
No indicators of impairment were found for buildings. No buildings are expected to be sold or disposed of within the next 12 months.
Note 7B: Plant and equipment
Plant and equipment:
Fair value 1,245,389 1,099,225
Accumulated depreciation (733,034) (586,946)
Total plant and equipment 512,355 512,279
No indicators of impairment were found for plant and equipment. No plant or equipment is expected to be sold or disposed of within the next 12 months. Asset valuation was carried out in May 2010. The net increase to fair value equated to $76,762. Management views that there is no material difference between fair value and carrying value as IT equipment, which forms the majority of the plant and equipment, is on a replacement cycle.
Note 7C: Reconciliation of the opening and closing balances of property, plant and equipment 2015
Building Plant & Equipment
Total
$ $ $
As at 1 July 2014
Gross book value 903,709 1,099,225 2,002,934
Accumulated depreciation and impairment (719,059) (586,946) (1,306,005)
Total as at 1 July 2014 184,650 512,279 696,929
Additions:
by purchase 3,660 146,164 149,824
Depreciation expense (61,263) (146,088) (207,351)
Total as at 30 June 2015 127,047 512,355 639,402
Total as at 30 June 2015 represented by:
Gross book value 907,369 1,245,389 2,152,758
Accumulated depreciation and impairment (780,322) (733,034) (1,513,356)
Total as at 30 June 2015 127,047 512,355 639,402

64 NTC Annual Report 2014 – 15
Notes to and forming part of the financial statements (continued) For the period ended June 2015
Note 7C (cont’d): Reconciliation of the opening and closing balances of property, plant and equipment 2014
Building Plant &
Equipment Total
$ $ $
Total as at 1 July 2013
Gross book value 745,398 844,746 1,590,144
Accumulated depreciation and impairment (670,338) (509,678) (1,180,016)
Total as at 1 July 2013 75,060 335,068 410,128
Additions:
by purchase 158,311 314,382 472,693
Net write-down - (59,903) (59,903)
Depreciation expense (48,721) (137,171) (185,892)
Depreciation on write-down - 59,903 59,903
Total as at 30 June 2014 184,650 512,279 696,929
Total as at 30 June 2014 represented by:
Gross book value 903,709 1,099,225 2,002,934
Accumulated depreciation and impairment (719,059) (586,946) (1,306,005)
Total as at 30 June 2014 184,650 512,279 696,929
Note 7D: Other non-financial assets
2015 2014
$ $
Prepayments
No more than 12 months
More than 12 months
80,216
-
60,187
50,000
Total other non-financial assets 80,216 110,187
No indicators of impairment were found for other non-financial assets.

65Financial statements
Note 8: Payables
2015 2014
$ $
Note 8A: Suppliers
Trade creditors and accruals 153,836 115,645
Operating lease rental 150,211 196,204
Total suppliers 304,047 311,849
Supplier payables expected to be settled:
No more than 12 months – external parties 222,051 161,628
More than 12 months – external parties 81,996 150,221
Total suppliers 304,047 311,849
Total suppliers payable 304,047 311,849
Settlement was usually made within 30 days.
Note 8B: Other payables
GST payable - 20
Other 7,094 3,389
Total other payables 7,094 3,409
Other payables expected to be settled
No more than 12 months 7,094 3,409
Total other payables 7,094 3,409
Note 9: Provisions
2015 2014
$ $
Note 9A: Employee provisions
Leave 788,726 700,957
Total employee provisions 788,726 700,957
Employee provisions expected to be settled
No more than 12 months 564,936 433,762
More than 12 months 223,790 267,195
Total employee provisions 788,726 700,957

66 NTC Annual Report 2014 – 15
Notes to and forming part of the financial statements (continued) For the period ended June 2015
Note 10: Cash flow reconciliation
2015 2014
$ $
Reconciliation of cash and cash equivalents as per Statement of Financial Position to Cash Flow Statement
Cash and cash equivalents as per:
Cash flow statement 2,286,228 1,737,286
Statement of financial position 2,286,228 1,737,286
Difference - -
Reconciliation of net cost of services to net cash from operating activities:
Net cost of services (8,881,802) (8,831,225)
Revenue from government 9,259,000 9,095,000
Adjustment for non-cash items
Depreciation / amortisation 207,351 185,892
Net write-down of non-financial assets - (59,903)
Movements in assets and liabilities
(Increase) / decrease in trade and other receivables 584 (9,205)
(Increase) / decrease in prepayments 29,971 (95,948)
Increase / (decrease) in employee provisions 87,769 (13,977)
Increase / (decrease) in supplier payables (7,792) (154,418)
Increase / (decrease) in other payables 3,685 (100,165)
Net cash from (used by) operating activities 698,766 16,051
Note 11: Related party disclosuresThere were no related party transactions during the year.

67Financial statements
Note 12: Senior executive remunerationNote 12A: Senior executive remuneration expense for the reporting period
2015 2014
$ $
Short-term employee benefits:
Salary 2,023,177 1,901,112
Annual leave accrued 43,450 (2,699)
Total short-term employee benefits 2,066,627 1,898,413
Post-employment benefits:
Superannuation 189,083 172,768
Total post-employment benefits 189,083 172,768
Other long-term benefits:
Long-service leave 31,334 (77,195)
Total other long-term benefits 31,334 (77,195)
Total senior executive remuneration expense 2,287,044 1,993,986
The total number of senior management personnel that are included in the above table are 11 (2014 : 11). There were no termination benefits paid.

68 NTC Annual Report 2014 – 15
Notes to and forming part of the financial statements (continued) For the period ended June 2015
Note 13: Financial instruments
2015 2014
$ $
13A Categories of financial instruments
Financial assets
Loans and receivables
Cash and cash equivalents 2,286,228 1,737,286
Receivables for goods and services 3,149 4,025
Carrying amount of financial assets 2,289,377 1,741,311
Financial liabilities
Suppliers payable 304,057 311,849
Other payables 7,094 3,409
Carrying amount of financial liabilities 311,151 315,258
13B Net income and expense from financial assets
Loans and receivables
Interest revenue (Note 4B) 42,051 40,051
Net gain from loans and receivables 42,051 40,051
Net gain from financial assets 42,051 40,051
13C Fair value of financial instruments
Carrying amount
Fair value
Carrying amount
Fair value
2015 2015 2014 2014
$ $ $ $
FINANCIAL ASSETS
Cash and cash equivalents 2,286,228 2,286,228 1,737,286 1,737,286
Receivables for goods and services 3,149 3,149 4,025 4,025
Total 2,289,377 2,289,377 1,741,311 1,741,311
FINANCIAL LIABILITIES
Suppliers payable 304,057 304,057 311,849 311,849
Total 304,057 304,057 311,849 311,849

69Financial statements
13D Credit risk
Credit risk is the risk of financial loss as a result of failure by a client or counterpart to meet its contractual obligations. The finance department is responsible for the analysis and monitoring of its credit risk exposure. All credit exposures are monitored regularly against allowed limits. To mitigate credit risk, letters of credit and terms of trade are introduced where appropriate. The commission’s total exposure to credit risks is limited to its trade receivables.
The average credit period for trade receivables is 30 days. The commission holds no collateral to mitigate against credit risk.
The following table illustrates the commission’s gross exposure to credit risk, excluding any collateral or credit enhancements.
2015 2014
$ $
Financial assets
Cash and cash equivalents 2,286,228 1,737,286
Trade and other receivables 74,317 74,901
Total 2,360,545 1,812,187
Financial liabilities
Suppliers payable 304,057 311,849
Other payables 7,094 3,409
Employee provisions 788,726 700,957
Total 1,099,877 1,016,215
Ageing of financial assets that were past due but not impaired for 2015
0 to 30 days
$
31 to 60 days
$
61 to 90 days
$
90+ days
$
Total
$
Trade and other receivables 74,317 - - - 74,317
Total 74,317 - - - 74,317
Ageing of financial assets that were past due but not impaired for 2014
0 to 30 days
$
31 to 60 days
$
61 to 90 days
$
90+ days
$
Total
$
Trade and other receivables 74,901 - - - 74,901
Total 74,901 - - - 74,901

70 NTC Annual Report 2014 – 15
Notes to and forming part of the financial statements (continued) For the period ended June 2015
Credit quality of financial instruments not past due or individually determined as impaired.
Not past due nor impaired
Not past due nor impaired
Past due or impaired
Past due or impaired
2015 2014 2015 2014
$ $ $ $
Receivables for goods and services 3,149 4,025 - -
Total 3,149 4,025 - -
13E Liquidity risk
Liquidity risk is the risk that the commission is unable to meet its financial obligations as they fall due, which could arise due to mismatches in cash flows. Funding and liquidity management is performed by the finance department on a weekly basis and regular reports are provided to management and commissioners. Payments take place once a week, which ensures all suppliers are paid within the established terms of trade. The average credit period for supplier payments is 30-60 days.
Maturities for non-derivative financial liabilities 2015
On demand
Within 1 year
1 to 2 years
2 to 5 years
> 5 years
Total
2015 2015 2015 2015 2015 2015
$ $ $ $ $ $
Suppliers payable 304,057 - - - - 304,057
Total 304,057 - - - - 304,057
Maturities for non-derivative financial liabilities 2014
On demand
Within 1 year
1 to 2 years
2 to 5 years
> 5 years
Total
2014 2014 2014 2014 2014 2014
$ $ $ $ $ $
Suppliers payable 311,849 - - - - 311,849
Total 311,849 - - - - 311,849
The commission holds no derivative financial liabilities in the current or prior year.
13F Market risk
The commission is not exposed to currency risk or other price risk.
The 40 basis points used for 2015 is as stipulated in the “Standard Parameters for use in Financial Statements for Financial Reporting Periods ending 30 June 2015” issued by the Department of Finance and Deregulation.

71Financial statements
Sensitivity analysis of the risk that the commission is exposed to for 2015
Risk variable Change in risk variable
Effect on profit and loss
Effect on equity
2015 2015
% $ $
Interest rate risk Interest rate 0.4 8,047
Interest rate risk Interest rate -0.4 (8,047)
Sensitivity analysis of the risk that the commission is exposed to for 2014
Risk variable Change in risk variable
Effect on profit and loss
Effect on equity
2014 2014
% $ $
Interest rate risk Interest rate 0.6 11,613 -
Interest rate risk Interest rate -0.6 (11,613) -
Note 14: Financial assets reconciliation
2015 2014
$ $
Financial assets
Total financial assets as per balance sheet 2,360,545 1,812,187
Less: non-financial instrument components - -
Total non-financial instrument components - -
Total financial assets as per financial instruments note 2,360,545 1,812,187
Note 15: Reporting of outcomesThe National Transport Commission (the commission) is an independent body established under Commonwealth legislation and funded jointly by the Commonwealth, states and territories. The commission has one outcome which is to improve the efficiency, safety and administration of land transport in Australia, and to reduce its environmental impact. The principal objective is achieved through the effective implementation (by others) of transport reforms based on nationally consistent policy and regulation developed by the commission. All expenses, revenue, assets and liabilities are related to one outcome and cover the net cost of services.

72 NTC Annual Report 2014 – 15
Notes to and forming part of the financial statements (continued) For the period ended June 2015
Note 16: Budgetary reports and explanations of major variancesThe following tables provide a comparison of the original budget as presented in the 2014 – 15 Portfolio Budget Statements (PBS) to the 2014 – 15 final outcome as presented in accordance with Australian Accounting Standards. The budget is not audited. Any variance of more than 10% and over $50,000 is considered a major variance. However, qualitative judgements may also require variance explanations
Note 16A: Departmental budgetary reports
Statement of comprehensive income
Actual Budget estimate
Original Variance
2015 2015 2015
$’000 $’000 $’000
NET COST OF SERVICES
Expenses
Employee benefits 5,575 5,966 (391)
Suppliers 3,142 3,127 15
Depreciation and amortisation 207 202 5
Total expenses 8,924 9,295 (371)
Own-source income
Own-source revenue
Interest 42 38 4
Funding from states and territories 6,017 6,015 2
Total own-source revenue 6,059 6,053 6
Total own-source income 6,059 6,053 6
Net cost of (contribution by) services 3,242 3,242 -
Revenue from government 3,242 3,242 -
Surplus (Deficit) attributable to the Australian Government
377 - 377
Total comprehensive income (loss) attributable to the Australian Government
377 - 377

73Financial statements
Statement of financial position
Actual Budget estimate
Original Variance
2015 2015 2015
$’000 $’000 $’000
ASSETS
Financial assets
Cash and cash equivalents 2,286 1,894 392
Trade and other receivables 75 65 10
Total financial assets 2,361 1,959 402
Non-financial assets
Land and buildings 127 117 10
Property, plant and equipment 512 533 (21)
Prepayments 80 14 66
Total non-financial assets 719 664 55
Total assets 3,080 2,623 457
LIABILITIES
Payables
Suppliers 304 97 207
Other payables 7 472 (465)
Total payables 311 569 (258)
Provisions
Employee provisions 789 715 74
Total provisions 789 715 74
Total liabilities 1,100 1,284 (184)
Net assets 1,980 1,339 641
EQUITy
Reserves 119 119 -
Retained surplus (accumulated deficit) 1,861 1,220 641
Total equity 1,980 1,339 641
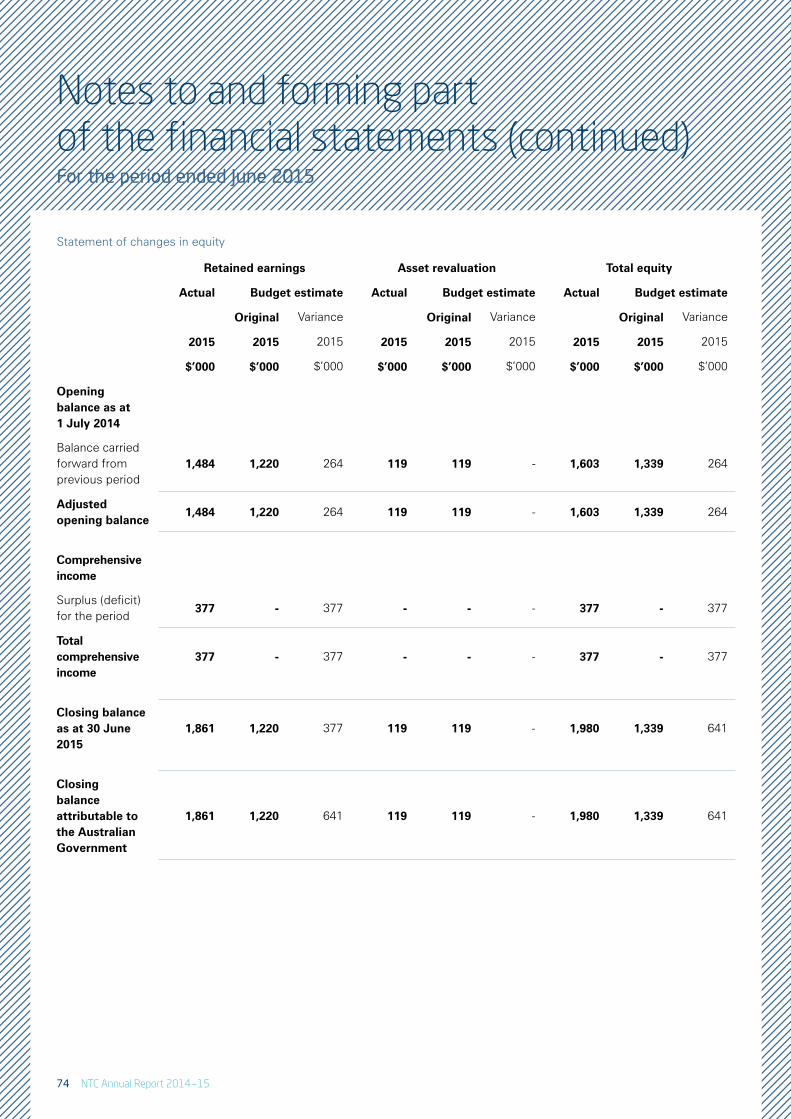
74 NTC Annual Report 2014 – 15
Notes to and forming part of the financial statements (continued) For the period ended June 2015
Statement of changes in equity
Retained earnings Asset revaluation Total equity
Actual Budget estimate Actual Budget estimate Actual Budget estimate
Original Variance Original Variance Original Variance
2015 2015 2015 2015 2015 2015 2015 2015 2015
$’000 $’000 $’000 $’000 $’000 $’000 $’000 $’000 $’000
Opening balance as at 1 July 2014
Balance carried forward from previous period
1,484 1,220 264 119 119 - 1,603 1,339 264
Adjusted opening balance
1,484 1,220 264 119 119 - 1,603 1,339 264
Comprehensive income
Surplus (deficit) for the period
377 - 377 - - - 377 - 377
Total comprehensive income
377 - 377 - - - 377 - 377
Closing balance as at 30 June 2015
1,861 1,220 377 119 119 - 1,980 1,339 641
Closing balance attributable to the Australian Government
1,861 1,220 641 119 119 - 1,980 1,339 641

Cash Flow Statement
Actual Budget estimate
Original Variance
2015 2015 2015
$’000 $’000 $’000
OPERATING ACTIVITIES
Cash received
Appropriations 3,242 3,242 -
Interest 42 38 4
Other 6,259 6,015 244
Total cash received 9,543 9,295 248
Cash used
Employees 5,322 5,966 (644)
Suppliers 3,522 3,127 395
Other - - -
Total cash used 8,844 9,093 (249)
Net cash from (used by) operating activities 699 202 497
INVESTING ACTIVITIES
Cash used
Purchase of property, plant and equipment tangibles 150 220 (70)
Total cash used 150 220 (70)
Net cash from (used by) investing activities (150) (220) 70
Net increase (decrease) in cash held 549 (18) 567
Cash and cash equivalents at the beginning of the reporting period
1,737 1,912 (175)
Cash and cash equivalents at the end of the reporting period 2,286 1,894 392
Note 16B: Departmental major budget variances for 2015
Explanations of major variances Affected line items (and statement)
Surplus not anticipated in budget. Financial assets in Statement of Financial Position.
Scheduling of training programs for 2015 – 16 required prepayment which was not anticipated.
Non-financial assets in Statement of Financial Position.
Lease payable categorised as suppliers in financials as against other payables in budget. Invoices payable at year end greater than budgeted.
Payables in Statement of Financial Position.
Annual leave balance of staff higher than anticipated. Provisions in Statement of Financial Position.
Reflect the surpluses of 2013 – 14 and 2014 – 15. Equity in Statement of Financial Position.
Changes in level of activity beyond control and unforeseen delays in planned implementation.
Cash used in the Cash Flow Statement.
Delay in commissioning of work to improve building access, security and audio visual equipment.
Investing activities in Cash Flow Statement.
Arises due to timing of preparation of the original budget. Statement of changes in Equity
75Financial statements

76 NTC Annual Report 2014 – 15
Appendix A: Report under the Freedom of Information Act 1982 (Cwlth)
Appendices
Freedom of information requests during 2014 –15
No requests for documents were made under the Freedom of Information Act during the period 1 July 2014 to 30 June 2015.
Freedom of information enquiries
All enquiries concerning access to documents under the Freedom of Information Act should be directed to:
FOI Contact Officer
National Transport Commission Level 15/628 Bourke Street Melbourne, Victoria 3000
Phone: 03 9236 5000 Fax: 03 9642 8922 Email: [email protected]
Information required by the Freedom of information Act
The information that the NTC is required to publish under Part 2 of the Freedom of Information Act can be found on our website.
Appendix B: Report under the National Disability StrategyThe NTC is an equal opportunity employer and is committed to ensuring all staff, including those with disability, are able to fully participate in the workplace. We recognise that people with disability have the right to participate in the development of our reforms and we strive to make consultation processes inclusive.
The Commonwealth Government’s National Disability Strategy 2010 – 20 provides a national policy framework for improving life for Australians with disability, their families and carers. The Department of Social Services produced a report on the strategy’s implementation and evaluation framework in 2012. This report is available online at dss.gov.au
The Commonwealth Government’s Social Inclusion Measurement and Reporting Strategy will also include some reporting on disability matters in its regular How Australia is Faring report and, if appropriate, in strategic change indicators in agency annual reports.

77www.ntc.gov.au
Appendix C: Report under the Environment Protection and Biodiversity Conservation Act 1999 (Cwlth)The NTC is committed to developing reforms that uphold the principles of ecologically sustainable development, as detailed in section 516A of the Environment Protection and Biodiversity Conservation Act.
Our mission is to develop reforms that deliver safe, efficient and sustainable transport for Australia. The impacts of all our reforms are objectively assessed against our policy objectives, one of which is to protect the environment.
Environmental performance
We are committed to reducing the impact of our office operations on the environment through actions such as the following
• recycling paper, plastic, bottles and toner cartridges
• recycling unwanted computer equipment such as monitors, hard drives, cabling and keyboards
• installing equipment that has energy-saving features, such as laptops (which are more energy-efficient than desktop computers), photocopiers and printers
• ensuring double-sided printing is the default setting on all printers
• encouraging staff to use public transport by offering discounted yearly tickets
• switching off all office lights at the end of the working day
• encouraging staff to use teleconferencing where possible to avoid unnecessary road or air travel
• providing a battery recycling program for staff
• installing paper recycling bins at workstations
• providing additional recycling bins around the office
• using only energy and water-efficient appliances across the workplace
• installing blinds and tinting windows to reduce the demand on air-conditioning systems.
We have also entered into a green lease program along with our building manager, Investa. This aims to implement improvements towards providing a greener and more energy-efficient environment for all building occupants.
We will continue to monitor our environmental impact and make changes as required.
2014 – 15 2013 – 14
Electricity
Total electricity used (kilowatt hours)
66,440 65,125
Green energy source (per cent)
25 25
Total greenhouse gas emissions (tonnes)
118 118
Travel
Air Travel*
Domestic flights (kilometres)
623,044 763,658
International flights (kilometres)
23,709 15,595
Total greenhouse gas emissions (tonnes)
214 256
Road travel
Taxi (km) 19,950 16,519
Total greenhouse gas emissions (tonnes)
256 214
Other
Total estimated copy paper used (reams)
505 475
Total water consumption (litres per person)
12,150 12,135
Total greenhouse gas emissions (tonnes)
445 475
*Air travel information is supplied by the NTC’s travel provider

78 NTC Annual Report 2014 – 15
Appendix D: Report under the Commonwealth Electoral Act 1918 (Cwlth)The NTC did not make any payments to market research agencies, advertising agencies, polling organisations, direct mail organisations or media advertising organisations of over $10,000 during 2014 – 15.
Appendix E: Transport and Infrastructure Council submissions
Number Submission Date issued
Council 15/01 Heavy Vehicle National Law – Chapter 2 (Registration) Commencement Provision and Other Imperative Items
March 2015

79www.ntc.gov.au
Appendix F: Reports released during 2014 – 15
Report title ISBN Prepared by DateOpportunities for information technology systems to improve port-related supply chain performance information paper
978-1-921604-64-5 NTC July 2014
Heavy Vehicle Roadworthiness Review Phase One – Report of Current Practice
978-1-921604-59-1 NTC and NHVR July 2014
Access to PBS mass limits for truck and trailer combinations discussion paper
N/A NTC August 2014
Heavy Vehicle Roadworthiness Review Phase 2 – Integrity Review of the National Heavy Vehicle Roadworthiness System
N/A NTC and NHVR August 2014
Transport of Dangerous Goods: Limited quantities and retail distribution loads issues scoping paper
N/A NTC October 2014
Counting Time and Residual Fatigue Risk Final Report 978-1-921604-67-6 NTC October 2014
Assessing Fitness to Drive 2014 Review Issues Paper 978-1-921604-68-3 NTC October 2014
Australian Defence Force Road Transport Exemption Framework
N/A NTC and Department of Infrastructure and Regional Development
November 2014
Compliance and enforcement framework for heavy vehicle telematics
978-1-921604-65-2 NTC November 2014
Annual Report 2014 978-1-921604-63-8 NTC November 2014
Chain of Responsibility: Duties Review Discussion Paper N/A NTC November 2014
National Standard for Health Assessment of Rail Safety Workers 2014 Review Issues Paper
978-1-921604-70-6 NTC November 2014
National Transport Reform Implementation Monitoring Report 978-1-921604-71-3 NTC December 2014
Heavy Vehicle Roadworthiness Program Consultation Regulatory Impact Statement
N/A NTC and Frontier Economics
January 2015
Explanation of Transport of Dangerous Goods Laws Amendment Package No. 3
N/A NTC February 2015
Heavy vehicle road user charge annual adjustment: Consultation report
N/A NTC February 2015
Carbon Dioxide Emissions Intensity for New Australian Light Vehicles 2014: Information paper
978-1-921604-73-7 NTC April 2015
Transporting Limited Quantities of Dangerous Goods: Regulatory Impact Statement
978-1-921604-79-9 NTC June 2015
Heavy Vehicle National Law Penalties Matrix Process and Demerit Point Assessment Process
978-1-921604-78-2 NTC June 2015
Chain of Responsibility: Duties Review 978-1-921604-77-5 NTC June 2015

80 NTC Annual Report 2014 – 15
Appendix G: Annual adjustment of heavy vehicle chargesThe annual adjustment of heavy vehicle charges started in 2002. Heavy vehicle registration charges were adjusted in line with increases in road expenditure and expected changes in road use. The adjustment occurred automatically in July each year and the extent of the adjustment was capped at the consumer price index (CPI) figure for the preceding financial year, with a floor of zero per cent.
The annual adjustment procedure was reviewed by the NTC as part of the 2007 Heavy Vehicle Charges Determination. The review recommended that the annual adjustment factor no longer be kept to between zero per cent and the CPI figure. This meant that future changes in road expenditure and road use would be more accurately represented in the charge adjustments that resulted. In addition, it was recommended that the heavy vehicle registration charge annual adjustment factor also be applied annually to the fuel-based road user charge. These recommendations were unanimously approved by transport ministers in February 2008.
On 30 April 2010, transport ministers approved a technical adjustment to the annual adjustment formula for calculating heavy vehicle charges. This was to ensure that the over- or under-recovery of road costs is minimised. This technical adjustment was introduced in setting the 2010–11 charges, and applies to both the registration and (fuel-based) road user charges. It better aligns the annual adjustment with changes in road use, including the fleet mix. The figures in Tables G1, G2 and G3 have been prepared using the amended methodology approved by ministers on 30 April 2010.
In February 2012, transport ministers asked us to conduct a new heavy vehicle charges determination. We completed this in mid-February 2014 and subsequently presented recommendations to transport ministers.
On 9 May 2014, ministers decided that new charges would be implemented from 1 July 2016, based on our recommendations. In the interim, annual adjustments to registration charges will apply on 1 July 2014 and 1 July 2015, as outlined in the formula in the Model Heavy Vehicle Charges Act. The Deputy Prime Minister decided that no annual adjustments would apply to the road user charge (RUC) on 1 July 2014 or 1 July 2015.
Total rural and urban arterial and local road expenditure
The road expenditure data in Table G1 is split into rural and urban road expenditure. This table is used in calculating the annual adjustment to apply for the year beginning 1 July 2016. Figures shown for arterial roads are based on the most recent data provided by state and territory road authorities in accordance with the agreed expenditure reporting categories. Only expenditure in those categories relevant to the annual adjustment procedure is included. Estimates of local council spending on roads were obtained from unpublished government finance statistics provided by the Australian Bureau of Statistics (ABS). These figures are the most accurate and recent available.
2014–15 road construction and maintenance expenditure
To enable us to meet our reporting requirements under Clause 5.1(j) of the Inter-Governmental Agreement for Regulatory and Operational Reform in Road, Rail and Intermodal Transport, we obtain road construction and maintenance expenditure estimates from states and territories for the most recent financial year. This data is used in the annual adjustment procedure for heavy vehicle charges. The figures presented in Table G2 are the road construction and maintenance expenditure estimates provided by each state and territory for the 2014 – 15 financial year, excluding Commonwealth-funded National Disaster Relief and Recovery Arrangements road expenditure and insurance-related expenditure as approved by transport ministers.

81www.ntc.gov.au
Table G1 Arterial and local road expenditure
Estimated arterial road expenditure – nominal ($ million)
2007 – 08 2008 – 09 2009 – 10 2010 – 11 2011 – 12 2012 – 13 2013 – 14 2014 – 15
Rural arterial 4,049 4,752 5,000 4,439 4,526 5,036 5,075 4,818
Urban arterial 5,157 6,338 6,037 6,390 7,092 5,983 5,888 5,553
Estimated local road expenditure – nominal ($ million)
2006 – 07 2007 – 08 2008 – 09 2009 – 10 2010 – 11 2011 – 12 2012 – 13 2013 – 14
Rural local 1,890 2,092 2,314 2,278 2,502 2,989 3,296 3,534
Urban local 3,015 3,508 3,965 3,592 3,928 4,104 4,206 4,281
Note: Adjustments have been made to historical road expenditure figures published in our 2014 Annual Report due to revisions to local council road expenditure provided by the ABS.
Adjustments to urban arterial road expenditure have also been made for the 2009 – 10 to 2012 – 13 period due to the addition of Victorian road expenditure not previously reported to us. The previous expenditure reporting guidelines did not provide guidance on the treatment of expenditure related to roads built under a public-private partnership arrangement where the road is not funded by tolls. The addition of this expenditure is consistent with the approach recommended following a review and consultation with jurisdictions in May and June 2015. The adoption of this approach has resulted in the following increases in urban road expenditure:
• 2009 – 10: $80 million
• 2010 – 11: $265 million
• 2011 – 12: $269 million
• 2012 – 13: $56 million.

82 NTC Annual Report 2014 – 15
Table G2 Road construction and maintenance expenditure, 2014 –15 ($ million)
Expenditure category ACT NSW NT Qld SA Tas Vic WA Total
A Servicing and operating expenses 16 320 21 110 57 4 174 193 895
B Road pavement and shoulder maintenance
B1 Routine maintenance 3 221 37 198 44 20 67 112 701
B2Periodic surface maintenance of sealed roads
5 176 13 118 2 23 93 72 502
C Bridge maintenance & rehabilitation 1 82 0 64 3 8 60 21 238
D Road rehabilitation 4 485 18 245 24 6 119 100 1,000
E Low-cost safety & traffic improvements 10 337 9 231 29 8 171 65 859
F Asset extension/improvements
F1 Pavement improvements 107 402 45 328 59 58 94 304 1,398
F2 Bridge improvements 1 455 34 118 20 2 146 85 861
F3Land acquisition, earthworks, other extensions / improvement expenditure
48 1,400 11 560 128 16 352 480 2,996
G Other miscellaneous activities
G1 Corporate services 19 411 5 214 7 12 21 86 774
G2 Heavy vehicle regulatory costs 1 68 3 14 22 3 21 13 145
G3 Vehicle registration 8 98 8 90 42 9 107 88 451
G4 Driver licensing 1 101 3 34 11 6 68 50 274
G5 Loan servicing - 36 - 59 - - 91 0 186
Totals 225 4,592 208 2,380 450 174 1,583 1,670 11,281
H Other road-related payments
H1 Financial assistance to councils for work on council managed arterials
- 307 - - 1 - - 128 436
H2 Payments to councils for contract work on state managed roads
- 202 0 378 - - 21 10 611
H3 Spending on local access roads in unincorporated areas
- 5 0 - - - - 1 6
H4Direct spending on council managed local access roads
- 46 3 - 8 3 44 131 234
H5Any other direct state spending on local access roads
- - 22 77 - - 0 2 101
- = not applicable; ACT = Australian Capital Territory; NSW = New South Wales; NT = Northern Territory; Qld = Queensland; SA = South Australia; Tas = Tasmania; Vic = Victoria; WA = Western Australia
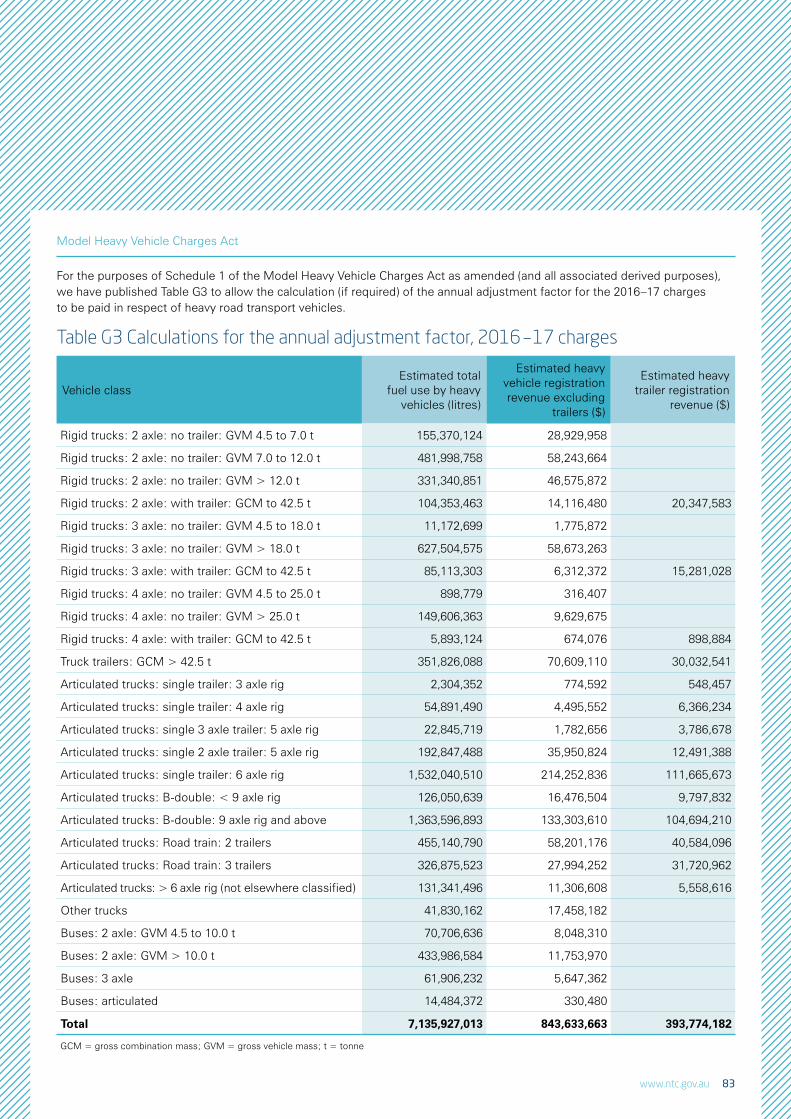
83www.ntc.gov.au
Table G3 Calculations for the annual adjustment factor, 2016 – 17 charges
Vehicle classEstimated total
fuel use by heavy vehicles (litres)
Estimated heavy vehicle registration revenue excluding
trailers ($)
Estimated heavy trailer registration
revenue ($)
Rigid trucks: 2 axle: no trailer: GVM 4.5 to 7.0 t 155,370,124 28,929,958
Rigid trucks: 2 axle: no trailer: GVM 7.0 to 12.0 t 481,998,758 58,243,664
Rigid trucks: 2 axle: no trailer: GVM > 12.0 t 331,340,851 46,575,872
Rigid trucks: 2 axle: with trailer: GCM to 42.5 t 104,353,463 14,116,480 20,347,583
Rigid trucks: 3 axle: no trailer: GVM 4.5 to 18.0 t 11,172,699 1,775,872
Rigid trucks: 3 axle: no trailer: GVM > 18.0 t 627,504,575 58,673,263
Rigid trucks: 3 axle: with trailer: GCM to 42.5 t 85,113,303 6,312,372 15,281,028
Rigid trucks: 4 axle: no trailer: GVM 4.5 to 25.0 t 898,779 316,407
Rigid trucks: 4 axle: no trailer: GVM > 25.0 t 149,606,363 9,629,675
Rigid trucks: 4 axle: with trailer: GCM to 42.5 t 5,893,124 674,076 898,884
Truck trailers: GCM > 42.5 t 351,826,088 70,609,110 30,032,541
Articulated trucks: single trailer: 3 axle rig 2,304,352 774,592 548,457
Articulated trucks: single trailer: 4 axle rig 54,891,490 4,495,552 6,366,234
Articulated trucks: single 3 axle trailer: 5 axle rig 22,845,719 1,782,656 3,786,678
Articulated trucks: single 2 axle trailer: 5 axle rig 192,847,488 35,950,824 12,491,388
Articulated trucks: single trailer: 6 axle rig 1,532,040,510 214,252,836 111,665,673
Articulated trucks: B-double: < 9 axle rig 126,050,639 16,476,504 9,797,832
Articulated trucks: B-double: 9 axle rig and above 1,363,596,893 133,303,610 104,694,210
Articulated trucks: Road train: 2 trailers 455,140,790 58,201,176 40,584,096
Articulated trucks: Road train: 3 trailers 326,875,523 27,994,252 31,720,962
Articulated trucks: > 6 axle rig (not elsewhere classified) 131,341,496 11,306,608 5,558,616
Other trucks 41,830,162 17,458,182
Buses: 2 axle: GVM 4.5 to 10.0 t 70,706,636 8,048,310
Buses: 2 axle: GVM > 10.0 t 433,986,584 11,753,970
Buses: 3 axle 61,906,232 5,647,362
Buses: articulated 14,484,372 330,480
Total 7,135,927,013 843,633,663 393,774,182
GCM = gross combination mass; GVM = gross vehicle mass; t = tonne
Model Heavy Vehicle Charges Act
For the purposes of Schedule 1 of the Model Heavy Vehicle Charges Act as amended (and all associated derived purposes), we have published Table G3 to allow the calculation (if required) of the annual adjustment factor for the 2016–17 charges to be paid in respect of heavy road transport vehicles.

84 NTC Annual Report 2014 – 15
The data sets in Table G3 are used to calculate the annual adjustment factor for charges. These data sets are no longer gathered on an annual basis. As a result we use a trending method to estimate the data in those years where actual data is unavailable. When undertaking this trending method we use at least four actual data points to ensure that the resulting estimates have a high degree of accuracy.
We had planned to include the latest vehicle fleet and fuel usage data from the ABS in Table G3, however the ABS has delayed the release of this data. As a result, we have used the ABS Survey of Motor Vehicle Use data from 2006, 2007, 2010 and 2012 as part of the trending method to estimate the latest annual adjustment figures.

85www.ntc.gov.au
Glossary
7-axle truck and dog trailer A heavy vehicle truck and trailer combination consisting of a rigid truck with three or four axles, towing a dog trailer with three or four axles (totalling seven axles when the truck and trailer are combined). See also dog trailer.
Australian Defence Force Road Transport Exemption Framework
A framework that provides nationally uniform exemptions for the use of Australian Defence Force (ADF) vehicles and equipment on public roads.
Australian Road Rules (ARR) A national set of rules that apply to vehicle drivers, passengers, cyclists and pedestrians.
Australian Transport Safety Bureau (ATSB) Australia’s national transport safety investigator.
Austroads The association of Australasian road transport and traffic agencies.
Bureau of Infrastructure, Transport and Regional Economics (BITRE)
BITRE is part of the federal Department of Infrastructure and Regional Development (DIRD). It provides economic analysis, research and statistics on infrastructure, transport and regional development issues to inform Commonwealth Government policy development and assist wider community understanding.
Carbon dioxide (CO2) emissions In respect of a motorised vehicle: the discharge of carbon dioxide, formed as part of the process of catalytic conversion within the engine. Such discharge is considered a form of pollution in Australia.
Carbon emissions intensity In respect of a motorised vehicle: grams of carbon dioxide (CO2) emitted per kilometre (g/km) travelled.
Chain of responsibility Chain of responsibility stipulates that specified parties within the supply chain and transport industry can be held legally accountable for behaviour that impacts on-road heavy vehicle compliance with laws.
Council of Australian Governments (COAG) The main intergovernmental forum in Australia. It initiates, develops and monitors the implementation of policy reforms of national significance that require cooperative action by Australian governments.
Department of Infrastructure and Regional Development (DIRD)
An Australian Government department charged with designing and implementing the government’s infrastructure, transport and regional development policies and programs.
Department of the Environment An Australian Government department responsible for policies and programs for the protection and conservation of the environment, including natural and cultural heritage sites.
Dog trailer A heavy vehicle trailer with:
one axle group or single axle at the front that is steered by connection to the towing vehicle by a drawbar; and
one axle group or single axle at the rear.
An NTC reform that improves the environmental outcomes of the transport sector.

86 NTC Annual Report 2014 – 15
Electronic work diary (EWD) An electronic recording system that can record work and rest hours for fatigue-regulated heavy vehicle drivers.
Heavy Vehicle National Law (HVNL) A law to underpin the National Heavy Vehicle Regulator (NHVR) and which consolidates existing legislation to achieve national consistency.
Industry Advisory Group (IAG) In respect of the NTC: A forum that brings together road or rail industry stakeholders on a regular basis to discuss progress on NTC projects and share insights on industry issues.
Inter-Governmental Agreement (IGA) In respect of the NTC: an agreement between the Australian states, territories and the Commonwealth Government relating to the establishment and role of the NTC to progress regulation and operational reform for road, rail and intermodal transport in order to deliver and sustain uniform or nationally consistent outcomes.
Light commercial vehicle (LCV) A light vehicle which is also registered as a commercial vehicle.
National Heavy Vehicle Regulator (NHVR) The NHVR administers one set of laws for heavy vehicles under the Heavy Vehicle National Law (HVNL).
National Reform Implementation Monitoring Report
A report prepared by the NTC annually to report on the progress of transport reforms agreed upon by Australia’s transport ministers.
National Road Transport Commission The predecessor to the NTC, established in 1992 to lead regulatory reform for nationally consistent road transport policies and laws.
National Transport Commission (NTC) An independent statutory body that develops and submits reform recommendations to the Transport and Infrastructure Council for approval. A more comprehensive description of the NTC is provided on pages 6 and 7 of this annual report.
See also Transport and Infrastructure Council.
Office of the National Rail Safety Regulator (ONRSR)
Established in 2012 to encourage and enforce safe railway operations and to promote and improve national rail safety.
An NTC reform that improves transport productivity.
Performance Based Standards (PBS) The PBS scheme has been in operation since 2007 and was administered by the NTC until January 2013 when it was transferred to the NHVR. PBS vehicles are designed to perform their tasks as productively, safely and as sustainably as possible. These trucks and buses are tested against 16 stringent safety standards and four infrastructure standards.
An NTC reform that improves transport regulatory efficiency.

87www.ntc.gov.au
Rail Industry Advisory Group In respect of the NTC: A forum that brought together rail industry stakeholders to discuss industry issues and share insights and experiences.
Rail Industry Safety and Standards Board (RISSB)
A not-for-profit company responsible for the development and management of rail industry standards, rules, codes of practice and guidelines, all of which have national application.
Rail Safety National Law (RSNL) A nationally consistent rail safety law, administered by the ONRSR.
Regulatory impact statement (RIS) A RIS is required for all regulatory proposals that are likely to have an impact on business or the not-for-profit sector. It aims to improve the government decision-making processes by ensuring that all relevant information is presented to the decision-maker upon the creation of a policy.
Road User Charge (RUC) A charge by the federal government on diesel used by heavy vehicles on public roads. Also known as the fuel charge.
An NTC reform that improves safety in the transport sector.
Standing Council on Transport and Infrastructure (SCOTI)
The predecessor to the Transport and Infrastructure Council.
Telematics The term used to describe an in-vehicle device, which forms part of a system that captures and sends information electronically. Telematics can be used to monitor speed, location, time, load, mass, engine performance and more.
Transport and Infrastructure Council A council of Commonwealth, state, territory and New Zealand ministers, and the Australian local Government Association, with responsibility for transport and infrastructure issues.
Transport and Infrastructure Senior Officials' Committee (TISOC)
A committee that provides support and advice to ministers on the Transport and Infrastructure Council regarding strategic policy, reform priorities and reform implementation at a national level. Its membership comprises the chief executive officers of state and territory transport and/or infrastructure departments, the Australian Local Government Association and the NTC.
Transport Certification Australia (TCA) A national government body responsible for providing assurance in the use of telematics and related intelligent technologies, to support the current and emerging needs of Australian governments.
Transport for NSW The New South Wales government department responsible for improving the customer experience, planning, program administration, policy, regulation, and procuring of transport services, infrastructure and freight.
Tri-axle A trailer or articulated lorry with three axles.

88 NTC Annual Report 2014 – 15
Compliance index
The table below shows how this report complies with the Commonwealth Authorities and Companies (Annual Reporting) Orders 2011 issued by the Minister for Finance and Deregulation on 22 September 2011.
Requirement PageLetter of transmittal 2
Enabling legislation and responsible ministers 2
Table of contents 3
Review of operations and future prospects 4–29, 48–75
Organisational structure 34
Report under the Work Health and Safety Act 2011 (Cwlth), parts 9 and 10 36–37
Directors 38 –39
Statement on governance 40–42
Commonwealth Fraud Control Guidelines 41
Indemnities and insurance premiums for officers 42
Judicial decisions and reviews by outside bodies 42
Key activities and changes affecting the organisation 42
Financial statements 43–75
Certification by directors 45
Report under the Freedom of Information Act 1982 (Cwlth), subsection 8 (1) 76
National Disability Strategy 76
Report under the Environment Protection and Biodiversity Conservation Act 1999 (Cwlth), section 516A
77
Report under the Commonwealth Electoral Act 1918 (Cwlth), section 311A 78
Annual adjustment of heavy vehicle charges 80 –84
Glossary 85– 87
Index 89– 91
Location of major activities and facilities Back cover
Effects of ministerial directions There were no relevant ministerial directions to report
89www.ntc.gov.au
Index
A
Alertness Summit 5, 22
Allan, Geoff 19, 22, 34
amendments to laws and amendment packages 9, 18, 28, 29, 54, 79
Anderson, David, PSM 2, 4, 12, 34, 38, 40
annual adjustment of heavy vehicle charges 19, 81, 83
ARRB Group 12
arterial and local road expenditure 80–81, 82
Asixa 12
Australasian Railway Association 12
Australian Capital Territory participation 18, 82
Australian Code for the Transport
of Dangerous Goods see Dangerous Goods Code
Australian Dangerous Goods Code 18, 26, 28, 79
Australian Defence Force Road Transport Exemption Framework 26, 28, 79, 85
Australian Livestock and Rural Transporters Association 12
Australian Logistics Council 12, 14, 39
Australian Rail Track Corporation 12
Australasian Railway Association 12
Australian Road Rules 26, 85
Australian Road Transport Suppliers Association 12
Australian Transport Safety Bureau 38, 85
Australian Trucking Association 12, 13
Australian Vehicle Standards 20, 26, 28
Australian Vehicle Standards Rules 28
Austroads 4, 9, 13, 29, 85
B
benefits, economic 53, 54
benefits, productivity 10, 16, 18, 23
benefits, safety 5, 22, 23, 29
best practice 11, 18, 19, 36, 37
BITRE see Bureau of Infrastructure, Transport and Regional Economics
Board of Commissioners 4, 36, 38–9, 40, 41
Bransgrove, Nola OAM 12, 34, 39, 40, 41
building a performance culture 35, 37
Bureau of Infrastructure, Transport and Regional
Economics (BITRE) 8, 17, 21, 25, 85
buses 83
business case 6, 13, 34
business planning 42
C
carbon / carbon dioxide 24, 79, 85
carbon emissions intensity 24, 85
Cash flow statement 51
Chain of responsibility 5, 10, 20, 23, 79, 85
charges, annual adjustment factor 2015–16 79, 80, 83–4
Chartered Institute of Logistics and Transport 12
code of conduct 36, 41
co-design process, NTC 13, 35
commissioners 4, 6, 12, 34, 36, 37, 38–9, 40, 41, 42
commission meetings 40
Commonwealth Electoral Act 1918 (Cwlth) 78
compliance 5, 9, 18, 20, 22, 23, 34, 36, 41, 79
Compliance and Enforcement Framework for Heavy Vehicle Telematics 23, 79
compliance index 88
compliance management plan 41
consultation and collaboration, stakeholder 5, 12–13, 16, 18, 20, 26, 29
consultation and planning 6–7, 12–13
consultation, government 6–7, 12–13, 19, 20, 26
consultation, increased 12
consultation, public 6–7, 18, 19, 20, 22–3
corporate governance 20, 34, 35, 38–42, 53
corporate plan 2, 35, 42
corporate services, organisational structure 34
corporate values 35
Council of Australian Governments (COAG) 85
D
Dangerous Goods Code 18, 26, 28, 79
demerit points, heavy vehicle 28
Department of Infrastructure and Regional Development 21, 38, 39, 42, 79, 85
Department of the Environment 25, 85
discussion paper 6, 16, 22, 23
dog trailer 5, 10, 16, 85
E
economic benefits 53, 54
efficiency, regulatory 26–9
electronic work diaries (EWDs) 22–4, 28, 86
emissions 24, 25, 77, 79
enforcement 11, 22–3, 28, 29, 79
environmental outcomes, improving 24–5
Environment Protection and Biodiversity Conservation Act 1999 (Cwlth) 77
evidence-based reform 5
external scrutiny 42

90 NTC Annual Report 2014 – 15
F
fatigue management 5, 22, 23, 86
financial statements 43–75
framework, Australian Defence Force Road Transport Exemption 26, 28, 79
framework, national fatigue data 22
framework, national surface transport productivity 8
framework, performance and development 35
framework, project management 11, 19, 37
framework, regulatory 28, 29
framework, risk, control and compliance 41, 79
framework, risk management 37
framework, telematics 5, 11, 23
framework, voluntary use of EWDs 22
fraud management 41
Freedom of information Act 1982 (Cwlth) 76
fuel-based road user charge 80
fuel efficiency 17
G
global exchange 14
glossary 85–7
governance see corporate governance
greenhouse gas emissions 25, 77
H
Heavy Vehicle Charges Determination 80
heavy vehicle charging 19
heavy vehicle demerit points 28
heavy vehicle driver fatigue reform see fatigue management
heavy vehicle Intelligent Access Program (IAP) 29
Heavy Vehicle National Law 5, 9, 16, 18, 23, 26, 28, 86
Heavy Vehicle National Law Amendment Package 28
heavy vehicle penalties tools 26, 28, 79
heavy vehicle productivity see benefits, productivity
heavy vehicle roadworthiness see roadworthiness
heavy vehicle telematics see telematics
heavy vehicles, loading 18
Hendy, Michelle 13, 34
highlights, NTC 2014–15 10–11
human resources management 34–7
I
implementation planning 6
indemnities and insurance 42
induction, staff 36
Industry Advisory Group 4, 12, 86
industry workshops 12
Intelligent Access Program review 29
intelligent transport systems 14
Inter-Governmental Agreement 42, 80, 86
International Transport Forum summit 14
issues analysis 6
issues paper 6, 22, 79
ITS Australia 12
J
jurisdictional focus 13
L
laws 5, 6, 8–9, 10, 12, 16, 18, 20, 22–3, 26, 28, 29, 78–9
light commercial vehicles 24, 86
Linfox 12
Load Restraint Guide 5, 11, 29
local road expenditure 80–82
M
McIlfatrick, Norm 4, 40
maintenance 7, 12, 18, 19, 26
maintenance program, new approach to 26
mass limits 13, 79
medical standards review 22
Model Heavy Vehicle Charges Act 19, 80, 83
Model Subordinate Law on the Transport
of Dangerous Goods by Road or Rail 28
Mrdak, Mike 34, 40
N
National Disability Strategy 76
National Heavy Vehicle Regulator (NHVR) 4, 9, 10, 14, 16, 18, 20, 22, 29, 35,
38, 86
National Heavy Vehicle Regulator website 18
national laws see laws
national penalties tools 26, 28, 79
National Reform Implementation Monitoring Report 29, 86
National Road Freighters Association 12
National Road Safety Strategy 8
National Road Transport Association 12
National Road Transport Commission 9, 86
National Standard for Health Assessment of Rail Safety Workers 22, 26, 79
National Transport Commission Act 2003 (Cwlth) 2, 4, 9, 40, 42
National Transport Insurance 12
notes to and forming part of the financial statements 53–75
NTC co-design process 13, 35
NTC Corporate Plan see corporate plan
NTC, developing organisational capability 37
NTC guiding principles 7, 35
NTC Insight Series 12
NTC, new risk management approach 11, 37
NTC objectives, symbols for 15
NTC organisational structure 34
NTC policy projects process 6–7
NTC reports released during 2014–15 5, 18, 19, 22, 23, 24, 79
NTC strategic objectives 6
NTC Strategic Plan 2, 4, 9, 11, 13, 34–5, 40, 42
NTC Work Program 2, 5, 12, 13, 16, 30, 34, 35, 37, 42

O
Office of the National Rail Safety Regulator (ONRSR) 4, 9, 29, 86
Olsen, Jo 34, 37
options analysis 6
organisational structure 34
P
penalties see heavy vehicle penalties tools
performance-based framework 35
Performance Based Standards (PBS) 10, 16, 79, 86
policy paper 7
policy principles for heavy vehicle telematics see telematics
policy projects process 6–7
pollution 17
privacy protection 22, 23, 29
productivity 4–6, 8, 10–11, 12, 16–19, 20, 22, 23, 26, 34, 53
public consultation see consultation, public
R
rail, dangerous goods see Dangerous Goods Code
rail freight 17
Rail Industry Advisory Group 12, 87
Rail Industry Safety and Standards Board 9, 87
Rail Safety National Law (RSNL) 9, 26, 28, 29, 87
Rail Safety National Law Amendment Package 28
rail sector productivity 12
reform, as NTC role 6
reform focus 5
reform, maintaining and monitoring 6
reform options 5
reform partners see consultation and collaboration, stakeholder
reform, policy 5
reform, transport 5
registration charges 78, 80
registration revenue 83
regulatory efficiency, improving 26–9
regulatory impact statement (RIS) 6–7, 18, 20, 37, 79, 87
reports released during 2014–15 5, 18, 19, 22, 23, 24, 79
Report under National Disability Strategy see National Disability Strategy
Retter, Paul AM 5, 14, 34, 38, 40
rigid trucks 83
RIS see regulatory impact statement
Risk and Audit Committee 36, 37, 40–41
risk management 11, 29, 35, 41
road congestion 8, 10, 17, 20
road construction and maintenance expenditure 80–82
road, dangerous goods see Dangerous Goods Code
road fatalities 10, 20
road safety 8, 20, 23
Roads Australia 12
road user charge/s 19, 79, 80, 87
roadworthiness 5, 10, 20, 79
rural and urban arterial and local road expenditure 80–82
S
safer vehicles see road safety
safety and electronic work diaries 22–3
safety, system 20–23
Scales, Neil OBE 34, 39, 40, 41
schedule of infringement penalties and demerit points for heavy vehicles 28
SCOTI see Standing Council on Transport and Infrastructure
seven-axle truck and dog trailer 5, 10, 16, 85
stakeholder collaboration and consultation see consultation and
collaboration, stakeholder
Standing Council on Transport and Infrastructure (SCOTI) 13, 87
strategy, monitoring and review, and organisational structure 34
strategic planning / strategic plan 2, 4, 9, 11, 13, 34–5, 40, 42
Strategic Planning Liaison Group 12
system safety, improving 20–23
T
technology 5, 10–11, 14, 22, 23, 29, 34, 79
telematics 5, 11, 23, 79, 87
telematics framework 5, 11, 23
TISOC see Transport and Infrastructure
Senior Officials’ Committee
Toll Group 12
TRAITS corporate values framework 35
Transport and Infrastructure Council 6, 18, 22, 29, 30–33, 42, 53, 54, 60, 78, 87
Transport and Infrastructure Council members 32–3
Transport and Infrastructure Council paper 7
Transport and Infrastructure Council submissions 78
Transport and Infrastructure Senior Officials’ Committee 30, 31, 87
Transport Certification Australia 23, 29, 87
Transport for NSW 35, 87
transport productivity 6, 8, 15–19, 53
transport reform see reform
tri-axle 5, 18, 87
trucks, articulated 83
trucks, penalties see heavy vehicle penalties tools
trucks, rigid 83
U
United Nations 18, 28
United States Federal Highway Administration 14
use of different vehicle combinations 5, 18
V
Victoria Police 12
W
Walsh, Carolyn 12, 34, 38, 40, 41
work health and safety 36
Work Health and Safety Act 2011 (Cwlth) 36
Work Program 2, 5, 12, 13, 16, 30, 34, 35, 37, 42
91www.ntc.gov.au

National Transport CommissionLevel 15/628 Bourke Street Melbourne, VIC 3000Tel: (03) 9236 5000 Fax: 03 9642 8922
ISBN: 978-1-921604-80-5
Printed in Australia on an environmentallyresponsible paper sourced from sustainablymanaged forests.
National Transport CommissionLevel 15/628 Bourke Street Melbourne, VIC 3000Tel: (03) 9236 5000 Fax: (03) 9642 8922
ISBN: 978-1-921604-80-5
Printed in Australia on an environmentallyresponsible paper sourced from sustainablymanaged forests.