Fred. Olsen Cruise Lines 2016 brochure launch | Fred.\ Holidays

NATIONALLIVESTOCK CENSUS2002-2003
AFGHANISTAN
FINAL REPORT 2006

Cover page photos: Reynolds

AFGHANISTAN
NATIONALLIVESTOCK CENSUS
2002-2003
OSRO/AFG/212/AFG
FINAL REPORT
FOOD AND AGRICULTURE ORGANIZATION OF THE UNITED NATIONSROME, 2008

The designations employed and the presentation of material in this information product do not implythe expression of any opinion whatsoever on the part of the Food and Agriculture Organization of theUnited Nations (FAO) concerning the legal or development status of any country, territory, city or areaor of its authorities, or concerning the delimitation of its frontiers or boundaries. The mention of specificcompanies or products of manufacturers, whether or not these have been patented, does not imply thatthese have been endorsed or recommended by FAO in preference to others of a similar nature that arenot mentioned.
The views expressed in this information product are those of the authors and do not necessarily reflectthe views of FAO.
ISBN 978-92-5-105950-0
All rights reserved. Reproduction and dissemination of material in this information product foreducational or other non-commercial purposes are authorized without any prior written permissionfrom the copyright holders provided the source is fully acknowledged. Reproduction of material in thisinformation product for resale or other commercial purposes is prohibited without written permissionof the copyright holders.Applications for such permission should be addressed to:ChiefElectronic Publishing Policy and Support BranchCommunication DivisionFAOViale delle Terme di Caracalla, 00153 Rome, Italyor by e-mail to:[email protected]
© FAO 2008
II

III
CONTENTS
1. ACKNOWLEDGEMENTS 1
2. EXECUTIVE SUMMARY 3
3. BACKGROUND 7
4. ACTIVITIES 94.1. Organisation and Planning 9
4.2. Recruitment and Training 10
4.3. Data Collection 10
4.4. Data Entry and Checking 11
4.5. Data Analysis 11
5. RESULTS 135.1. Census Data Summaries (Level 1 Census) 13
5.1.1. Districts 135.1.2. Villages, communities and families 135.1.3. Livestock Numbers 165.1.4. Herd Structures 235.1.5. Changes in Livestock Ownership 26
5.2. Regional Production System Characteristics (Level 2 Census) 285.2.1. Forage Production and Feeding Situation 31
5.2.1.1. Types of forages used 315.2.1.2. Preferences for feeds and feed supply 32
5.2.2. Production Calendar 365.2.3. Livestock Species, Numbers, and Demography 43
5.3. Producer Characteristics (Level 2 Census) 465.3.1. Livestock Wealth Distribution 465.3.2. Livestock Management 52
5.3.2.1. Age structure 525.3.2.2. Livestock performance characteristics 545.3.2.3. Culling reasons 555.3.2.4. Livestock herd management and sales policy 56
5.3.3. Markets 595.3.3.1. Livestock sales – priority categories and reasons 595.3.3.2. Trading partners for farmers 595.3.3.3. Distance to markets 595.3.3.4. Sales decisions 60
5.4. Women Livestock Survey 625.4.1. Introduction 625.4.2. Work Responsibility 65
5.4.2.1. Cattle 655.4.2.2. Sheep 675.4.2.3. Goats 69
5.4.3. Decision Making 715.4.3.1. Cattle 715.4.3.2. Sheep 735.4.3.3. Goats 755.4.3.4. Graphical Summaries 77

5.4.4. Goals and Preferences 805.4.4.1. Preferred livestock species for herd expansion 80
5.4.4.1.1. Cattle 805.4.4.1.2. Poultry 815.4.4.1.3. Sheep 825.4.4.1.4. Goats 835.4.4.1.5. Summary of goals and preferences 84
5.4.5. Improvements and Problems 865.4.5.1. Problems identified for cattle production 865.4.5.2. Desired improvements in cattle production 885.4.5.3. Problems identified for sheep production 905.4.5.4. Desired improvements in sheep production 925.4.5.5. Problems identified for goat production 945.4.5.6. Desired improvements for goat production 965.4.5.7. Summary 98
5.5. Karakul Survey 1025.5.1. Introduction 1025.5.2. Flock Size and Distribution of Colour Types 1035.5.3. Pelt Production 1055.5.4. Markets 108
5.5.4.1. Returns from pelts and wool 1085.5.4.2. Market opportunities 109
6. DISCUSSION 1136.1. Census Data Summaries 113
6.2. Regional Production Systems and Producer Characteristics 114
6.3. Women Survey 116
6.4. Karakul Survey 116
7. METHODS 1197.1. Survey Design 119
7.2. Analysis Methodology 120
7.3. Data Consistency 120
7.4. Key Lessons 125
8. ANNEX (ONLY AVAILABLE ON CD) 1298.1. District Naming Comparisons and Explanations 129
8.2. Tabular Summary Statistics Level 1 146
8.3. Tabular Summary Statistics Level 2 173
8.4. Tabular Summary Statistics Women Livestock Survey 178
8.5. Tabular Summary Statistics Data Consistency 261
8.6. Maps 264
IV

V
FOREWORDThis report provides the analysis of the four separate surveys conducted under the 2003 LivestockCensus.
Livestock plays a fundamental role in Afghan economy and livelihoods. It has been accorded one ofthe highest priorities in the Master Plan of the Ministry of Agriculture, Irrigation and Livestock (MAIL).Over the past 30 years livestock population has fluctuated due to insecurity and drought in thecountry. Reliable, updated information and data on livestock numbers, products and productionsystem of the country are scanty. Such data are needed for the appraisal, formulation andimplementation of livestock development programmes and projects.
The 2003 Afghanistan National Livestock Census conducted by the Food and AgricultureOrganization of the United Nations (FAO) and MAIL aimed to narrow the data and information gapon livestock. The census programme was designed by Professor Wolfgang Pittroff, University ofCalifornia, Davis, United States of America and Dr Olaf Thieme, FAO. Census enumeration andassessment as well as data processing were done by FAO and MAIL staff. Fieldwork was supervisedand managed by Dr Len Reynolds and the FAO national team.
My heartiest thanks are due to all institutions and persons involved in the conduct of the survey andin production of its results. First and foremost, I would like to thank the farmers and the villagers whoprovided data and information for the survey. The census would not have been successful withouttheir wholehearted support. My special thanks are due to staff of FAO and MAIL for the questionnairedesign, survey enumeration and assessment. I should like to acknowledge the financial supportprovided by the Government of Italy for this important activity through the Italian voluntarycontribution to ITAP 2002/2003 in Afghanistan project (OSRO/AFG/212/ITA). This work would nothave been possible without FAO's technical assistance and operational support.
H.E. Obaidullah Ramin Minister of Ministry of Agriculture, Irrigation and Livestock (MAIL)
Kabul, AfghanistanJanuary 2008


1
1. ACKNOWLEDGEMENTSThis work was made possible thanks to the help of many diverse groups including the Government ofItaly through the Italian Cooperation Fund, the Afghanistan Ministry of Agriculture and AnimalHusbandry (MAAH), the Afghanistan Ministry of Interior (MoI), the Central Statistical Office (CSO) inKabul, the Dutch Committee for Afghanistan, Oxfam (UK) and the University of Kabul. Assistance andcooperation was gratefully received from many staff in the MAAH including Mr. Jawat, DeputyMinister of MAAH, Dr Hanif, General President of Animal Husbandry, and Dr Raufi, General Presidentof Veterinary Services. Supervision of fieldwork would not have been possible without the enthusiasticsupport of many staff from the MAAH, the Emergency Operations and Rehabilitation Division (TCE) ofFAO, the University of Kabul, the Dutch Committee for Afghanistan and Oxfam UK. Fieldwork wasdependant upon the conscientious attention of almost 900 staff, mainly from Veterinary Field Unitswho visited villages and collected the data. A concentrated period of data entry and checking wasundertaken by a small group of hard working young staff.
Clarification of district names and locations was undertaken with assistance from the MoI, the CSOand Dr Pinney from the Afghanistan Ministry of Reconstruction and Rural Development. Assistancefrom UN personnel across diverse projects in Afghanistan and Rome is acknowledged, includingparticularly Dr Majok, Dr Favre, Dr Crowley, Mr. Mack and Mr. Miagostovich.
The Afghanistan National Livestock Census was designed by Prof Wolfgang Pittroff, University ofCalifornia, Davis, and Dr Olaf Thieme, FAO. Field work was managed by Dr Len Reynolds and DrHabib Nawroz.
Data were analysed by Prof Wolfgang Pittroff (University of California, Davis), Dr Olaf Thieme (FAO)and Prof Fred Dahm (Texas A&M University, College Station, United States of America).
The preliminary report was published in 2003. A long period of in-depth analysis of the massiveamounts of data collected in the census followed, especially focusing on Level 2 and WomenLivestock Resources Surveys. Data analysis iterated in numerous rounds with post-hoc data clean-upand clarification for all Levels and Surveys. Particularly important was a comparative analysis of Level 1and Level 2 data using advanced statistical methods. Given the need for a reliable base line data setand the enormous logistical demands faced by nation-wide census operations in Afghanistan, thisextraordinary additional effort seemed to be well justified. Some minor modifications of certainsummary statistics published in the preliminary report resulted, but all conclusions remained the same.
The final report was written by Prof Wolfgang Pittroff and Dr Olaf Thieme, assisted by Dr LenReynolds, Dr Nawroz and Mr. Haroon Nessar.
The project team hopes that the hard work of nearly a thousand people summarized in this reportwill contribute to the reconstruction of Afghanistan.

2
East
Cen
tre-
East
Cen
tre
No
rth
Wes
t
Ag
ro-e
colo
gic
al r
egio
ns

2. EXECUTIVE SUMMARY1. After decades of warfare and a devastating drought it was reported that the numbers of livestock
in Afghanistan had fallen dramatically. In early 2002, the Ministry of Agriculture and AnimalHusbandry of the Transitional Islamic State of Afghanistan requested FAO to organise a nationallivestock census.
2. The work started in Afghanistan in October 2002 with funding from the Government of Italy andfield work was completed by April 2003. Every village in Afghanistan was visited, with theexception of Barmal District in Paktika Province because of insecurity, and parts of Ghor Provincebecause of lack of accessibility over the winter period.
3. A team of 28 supervisors, 24 female surveyors and 821 enumerators were employed for datacollection; 14 data entry personnel and 10 data checkers undertook data entry and proofing.
4. Livestock numbers, limited herd structure data and change in ownership during drought weredetermined by total enumeration in Level 1 of the census. Total enumeration was conducted atthe community level in every village in Afghanistan (with the exceptions mentioned above).
5. Level 2 of the Census consisted of a detailed production system analysis designed to survey arepresentative cross-section of Afghan livestock producers. These data were collected bysupervisors from 1 284 selected representative households in randomly chosen villages. The datagive detailed information about production practices, production calendars, key productionbottlenecks, and suggestions for interventions.
6. In order to ascertain the role of women in livestock production in Afghanistan, a detailed surveyfocusing on gender role in work responsibility, decision making and producer goals wasconducted by female enumerators interviewing 2 899 women in livestock producer households.The data give a detailed picture of gender role in livestock production in Afghanistan, and inaddition to Level 2 data, show where successful interventions for livestock development shouldbe directed.
7. Given the historic significance and current potential for value-added livestock production, a surveywas conducted to gather information specific to the Karakul sector. Detailed information onKarakul sheep production systems was collected from 132 producers. The data are a snapshot ofcurrent production practices and provide, for the first time, background information about thispotentially important value-added sector. It should be followed up by a market analysis.
8. The collected data covered 3 044 670 families in 53 214 communities across 36 724 villages.Some communities were unable to state the number of existing families.
9. The total number of cattle in Afghanistan was 3.72 million, and there were 8.77 million sheep,7.28 million goats, 1.59 million donkeys, 0.18 million camels, 0.14 million horses, 12.16 millionchicken, 0.42 million ducks and 0.60 million turkeys.
10. The number of cows kept per family was low, with only Khost, Kunar, Laghman and NuristanProvince reporting more than 1.5 cows per family. The data on number of calves suggests that inmany areas, restocking of depleted cattle herds would not be possible at the current reproductionrates.
11. Similarly in many areas reported numbers of young sheep and goats appear low and rebuilding ofherds will be slow.
12. The numbers of families without livestock have increased during the years of drought from 11.4families to 14.4 families per community. However, at the same time numbers of family percommunity has increased
13. There are no pre-drought livestock census data which could be used for direct comparisons.However, earlier survey results combined with the information from the present census indicatethat stock holding per family have decreased sharply.
14. Information from the Level 2 and Women Surveys clearly show that feed and forage productionare the major bottleneck for livestock production development in Afghanistan. Future livestockdevelopment activities should fully consider these findings and make fodder production anintegral part. There is also an urgent need for projects that integrate crop production andlivestock development and further animal health programs must be evaluated and planned inconjunction with interventions that are aimed at improving the feed situation.
15. Generally, the farmers’ responses after the drought broke in 2003 indicated an optimistic outlook.It was also the time when the new Government took office which might have partly influenced
3

the positive views about the future. However, Afghanistan is part of the largest drought-proneregion in the world and drought will remain a recurring phenomenon. Watershed rehabilitationand drought preparedness must accompany the reconstruction of the Afghan livestock sector tomake it more resilient in the future.
16. Three areas in livestock production appear to be most relevant for interventions: Forageproduction, dairy production, and poultry production. Clearly, cattle are the livestock specieswhich is most important to farmers, and dairy cows are their most important animals. The biggesteffect on increased production, improved livelihoods and more food security could be achieved byhelping farmers with suitable forage production, ideally well integrated into field crop rotationschemes. Farmers are keenly interested in market integration with dairy products – the potentialbenefits for small scale commercial dairy development appear to be substantial. Further, a largeproportion of women surveyed reported a keen interest in poultry production with a clear focuson egg sales. This seems to be the most effective intervention directly benefiting women in ruralAfghanistan, but also in urban centres and should receive appropriate attention by developmentworkers.
17. Wealth distribution data show that Afghan livestock producers are extremely poor byinternational standards. However, social stratification exists and is regionally differentiated. Theregional differentiation is also a result of the 1998-2002 drought, which was of variable severityin different parts of the country. The census shows that the western region has the highestnumber of farmers with no livestock at all. This was the region most affected by the drought.
18. There appears to be potential for income generation from intensified small ruminant, especiallysheep production. Most settled owners of small ruminants have cattle as well and often belongto the wealthier part of the population. The nomadic Kuchi population who keeps a large part ofthe small ruminants was not included in the present surveys but pre-drought information existsfrom another FAO (1999) study. Opportunities to develop sheep production are more promisingfor farmers with access to irrigated land supporting greatly improved forage production. Furtheranalysis of the sheep sector seems indicated, since opportunities for value-added, possiblystratified production appear to exist.
19. Level 2 surveys on feed supply and problems and constraints faced by producers provided muchinsight into the state of natural resources supporting livestock production in Afghanistan.Livestock owners make substantial efforts to supplement the feeding from natural pastures andcrop aftermath with cultivated fodder crops. Feeding of concentrates is very common, but thequantities are usually low and fed mainly during the winter months.
20. The length of the feeding period in the harsh climate of Afghanistan commonly exceeds sixmonths in most locations. Thus, available resources for supplemental feeding and winter foragedetermine the number of animals that can be kept. This ‘Winter Feed Gap’, the major constraintof livestock production in most parts of Afghanistan, must be addressed with great care,however. Although no systematic data are available, the aspect of rangeland conditions appearsto be poor to catastrophic in many areas of the country. An expansion of livestock numbers,especially small ruminants, facilitated by improved forage resources for the winter feeding periodwill likely further increase pressure on already stressed rangelands. For small ruminants foragesharvested or grazed from pastures and rangelands appear to be quantitatively the most importantfeed resource. Rangeland conservation, accordingly, is a task of national priority.
21. The average time to reach markets was about two hours, a surprisingly low figure considering theroad conditions in Afghanistan. It is possible though that more villages were selected for the Level2 survey which was nearby the market centres. Farmers did not seem to be overly concernedabout access to markets. In light of the other critical issues identified (nutrition, low reproduction,farmer concerns about veterinary health care) markets are not an issue of highest priority.
22. The analysis of distribution of work load and decision making clearly suggests that women areresponsible for most livestock-related work at the homestead, while children and to a lesserdegree men handle livestock tasks outside the home compound. Since dairy animals are mostlyfed at the homestead, cattle forage programs should consider gender in their design. Decisionmaking in livestock production is the domain of men, but for some of the important decisions(purchase or sale of cattle) women share responsibility in the decision making process. Womendecide milk and wool sales; therefore, milk collection schemes must explicitly consider the viewsand involvement of women.
4

5
23. Women from rural households provided a wealth of answers on questions related to problems oflivestock production and desirable improvements. They overwhelmingly selected cattle as theirmost important species, and opted for milk production for sale as the most importantdevelopment activity for cattle production. For women the second most important species waschicken, with the aim of egg production for sale. Future survey work in preparation of livestockinterventions should further pursued these questions by asking the questions to both men andwomen.
24. Karakul sheep production for pelts was in the past an economically very important livestockproduction in Afghanistan and is still practised. Farmers reported lower sales in pelts and woolcompared to the previous year, but expected to sell more the following year. Much, if not most ofthe Karakul output enters the international markets. More research on the international marketsfor Astrakhan pelts is therefore needed to judge the potential future of Karakul sheep productionin Afghanistan.
25. The census was designed with two levels of sampling intensity. Level 1 as total enumerationcensus, designed to determine the total number of livestock in the country, and to provide anassessment of livestock losses caused by a catastrophic drought. Level 2 was a survey designed todescribe production systems and markets, based on a detailed questionnaire to selected farmers.The data analysis process revealed that sufficient well-trained personnel for checking of dataconsistency during the census are the key to timely and accurate census execution and analysis.Only stringent quality control exercised during the census allows the use of sophisticatedstatistical methods for in-depth consistency checking.
photo by: Thieme

7
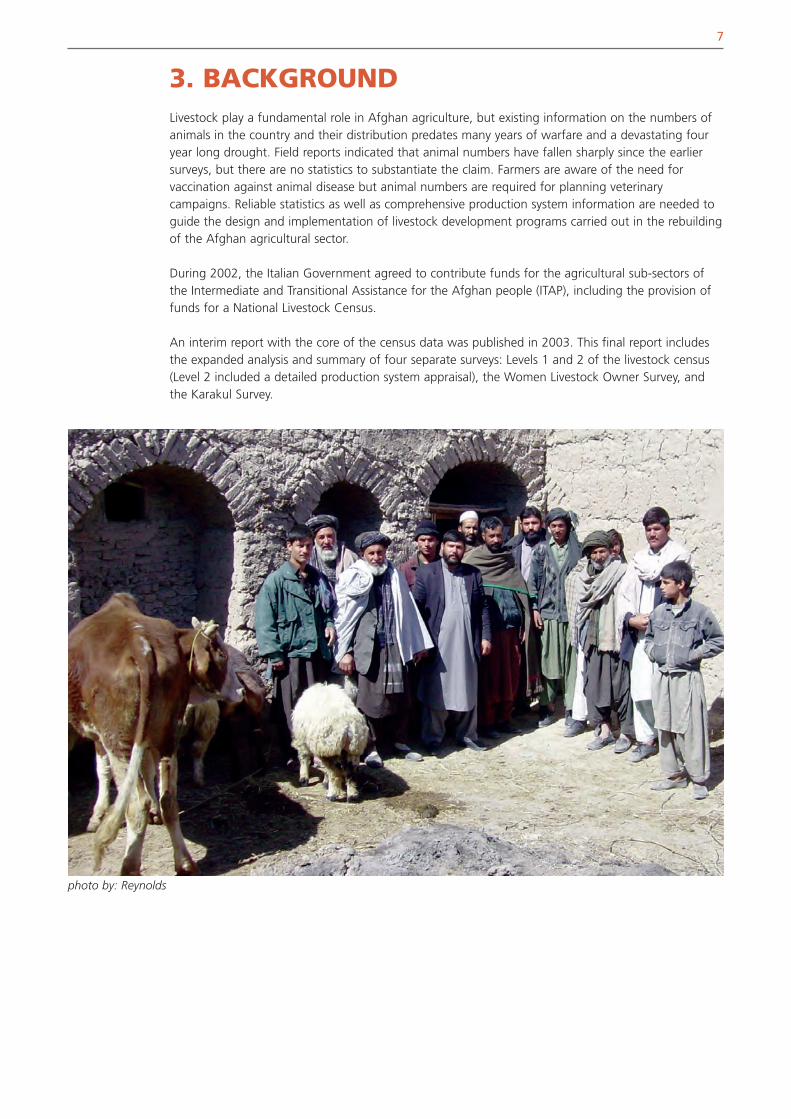
3. BACKGROUNDLivestock play a fundamental role in Afghan agriculture, but existing information on the numbers ofanimals in the country and their distribution predates many years of warfare and a devastating fouryear long drought. Field reports indicated that animal numbers have fallen sharply since the earliersurveys, but there are no statistics to substantiate the claim. Farmers are aware of the need forvaccination against animal disease but animal numbers are required for planning veterinarycampaigns. Reliable statistics as well as comprehensive production system information are needed toguide the design and implementation of livestock development programs carried out in the rebuildingof the Afghan agricultural sector.
During 2002, the Italian Government agreed to contribute funds for the agricultural sub-sectors ofthe Intermediate and Transitional Assistance for the Afghan people (ITAP), including the provision offunds for a National Livestock Census.
An interim report with the core of the census data was published in 2003. This final report includesthe expanded analysis and summary of four separate surveys: Levels 1 and 2 of the livestock census(Level 2 included a detailed production system appraisal), the Women Livestock Owner Survey, andthe Karakul Survey.
photo by: Reynolds


4. ACTIVITIES4.1 ORGANISATION AND PLANNING
Work in Afghanistan started in September 2002. An International Livestock Consultant developed thecensus and data analysis design and provided operational guidelines and training manuals. TheCensus Manager planned and supervised the administration of the field work. Census design andmethodology are described in full detail in Section 6. Briefly, the census was conducted on two levelsof intensity. Level 1 constituted the complete enumeration of all livestock numbers, including limitedinformation on livestock demography and recent changes in livestock wealth. These data werecollected at the community level, with a community typically representing a mosque assembly withina village or town. A much more detailed Level 2 census was administered by Supervisors to individualhouseholds in randomly selected districts and villages. Level 2 covered detailed information on animalhusbandry, feed management and markets. In addition to the census, two separate surveys wereadministered. One survey specifically addressed livestock production issues from the perspective ofwomen. This survey was administered by female enumerators. The second additional surveyspecifically addressed Karakul sheep production as a livestock activity of historic significance andcurrent potential for valued-added production.
Work plans were drawn up by early October, with the intention of completing data collection beforelivestock moved out of their winter quarters with the onset of spring weather. The start of work wasdivided so that provinces with predominantly mountainous areas would start earlier than loweraltitude Provinces where winter would be less of a hindrance to movement of data collectors.
Two levels of management were established. The Census Manager and an Assistant Manager basedin Kabul were responsible for nation-wide management of activities. Supervisors, covering 2-3Provinces provide the second management level, with Data Collectors (Field Staff) based in eachdistrict are responsible for visiting all villages in their District, and collecting information on animalnumbers.
A national data base kept by the Afghanistan Information Management System (AIMS) under the UNprovided a list of Provinces, districts and villages. Afghanistan comprised 32 Provinces, 329 Districtsand 30 172 villages. Provinces varied from 4 Districts (Sari Pul) to 22 (Nangarhar). Rural districts variedfrom 4 villages (Andkhoy in Faryab Province) to 620 (Daykundi in Uruzgan Province). Based onpopulation estimates from AIMS, and assuming seven persons per family, village size varied from sixfamilies per village in Wormamay district (Paktika Province) to 3 016 in Andkhoy district (FaryabProvince). However, much of the village data was derived from information compiled in the 1970s.This material was taken as the planning base for the census.
A complication arose from variations in the number of districts between the pre-2000 situationrecognised by AIMS as the authorised situation and the number of districts recognised officially by theMinistry of the Interior. A further complication arose from the administrative situation on the groundas a result of the creation of new districts by Provincial administrations, which have not been officiallyrecognised by Central Government.
It was decided that the locally accepted name for a district would be used in the Livestock Census -based on the answers from respondents. Names were taken and recorded in Dari or Pashtu. Thesurvey forms and training manuals were prepared in English and translated into two local languages,Dari and Pashtu. Training for Supervisors was held in English, translated into Dari by an interpreter.Field staff training, provided by the Supervisors was held in Dari or Pashtu.
It was estimated that each pre-2000 district would require an average of 4.5 man months (mm) ofwork to collect the Level 1 census data, giving a national total of 1500 mm. Less time would berequired for smaller districts or districts with easier travel conditions; larger or more difficult districtswould require more time. It was also recognised that flexibility was required, and a time planconceived in Kabul could only be taken as guidance. Supervisors were allowed, within limits, to vary
9

the manpower allowances to suit conditions on the ground. Considerable responsibility thereforerested on Supervisors and their judgement of the situation.
Orders were placed for vehicles and computer equipment during October. Computer equipmentarrived during January. Registration of the first vehicle occurred during February, and the secondvehicle was registered during March.
4.2 RECRUITMENT AND TRAINING
Twenty five supervisors were selected and trained by the Census Manager and his Assistant. Elevenpersons came from the Ministry of Agriculture and Animal Husbandry (MAAH), ten from previousFAO projects, one from the University of Kabul, one from an NGO and two from the private sector. Supervisor training, lasting three days, covered the purpose of the survey, the use of Level 1 and Level2 forms, and organisation and administration of Supervisor duties. During the course, the Level 1 andLevel 2 forms were field-tested by the Supervisors in a nearby village. Lessons learnt during fieldtesting were incorporated into the training. Supervisors also received guidance on organisation andimplementation of the training courses to be held in the Provinces for the Field staff.
Pairs of Supervisors were then allocated to cover 2-3 Provinces, given a list of the suggested man-months needed for data collection for each district, and an upper limit of the total man- monthsavailable for the group of Provinces under their control. They were given authority to vary the manmonths used for any one district, as long as the total man-months remained with in the limit for theirgroup of Provinces.
The country was divided into higher and lower attitude Provinces. Supervisors in higher altitudelocations started work recruitment and training of Field staff at the end of October. Selection andtraining in lower altitude areas started in late November.
In the Provinces the Supervisors visited Province Ministries to introduce themselves and inform theauthorities of their activities. In some locations it was possible to have broadcast interviews on localradio stations to publicise the livestock census. In these areas, villages then knew of the census beforethe enumerators arrived.
Data collectors were recruited by the Supervisors at District level, from local people with knowledgeof the area and of the livestock sector. These predominantly were Veterinary staff, originally part ofthe Ministry of Agriculture, but recently in a private sector environment. Other suitable local personswere recruited in Districts where no veterinary field unit existed. Training courses were organised bythe Supervisors at suitable locations around their group of Provinces, with around 30 potential fieldstaff attending each course. Attendance at a training course, and a demonstrable understanding ofthe proposed activities and duties was a requirement before contracts were offered to the field staff.
4.3 DATA COLLECTION
Field data was largely numeric. A record field remained blank where the respondents were unable toanswer the question. All names and dates were recorded in local script, Dari or Pashtu. It was decidedto record “perceived” names of the District in which the community understands itself to be located.
Information was collected at the village level. However, it was believed that information on totalanimal numbers would be more reliable from groups of a limited number of respondents, and that itwould be difficult to obtain reliable data from a single meeting in a large village. Therefore, duringthe planning period the collection unit was defined as a community group within a village.Community groups were based on mosque assemblies. A small village might have a single assembly,whereas a large village would have several.
10

Enumerators made two visits to each mosque assembly. On the first visit the reason for the censuswas explained to prevent any misconception over its potential tax raising implications, and anexplanation was given of the data required. The Shura (council of elders) was requested to organisecollection of information from village families by the return date of the enumerator. A second visitwas made a few days later and information collected from a representative group from the mosqueassembly.
In addition, data was collected from all urban centres. Kabul city was treated as a separate Unit fromKabul Province for data collection. One supervisor and 30 data collectors were involved in the censusof Kabul City, taking one month to complete. Enumerators visited Local Area representatives, who inturn contacted street representatives to organise data collection. Kabul City data collectors wererecruited from the Departments of Animal Science and Veterinary Science in the University of Kabul.Field staff in the Provinces were derived predominantly from the staff of Veterinary Field Units (VFU).The majority of VFUs are independent entities, although some are still formally in contract with NGOs.FAO received regular information about approximately 230 VFU, but in some regions of Afghanistanthese linkages were lacking. Letters of Agreement were prepared with two NGOs, covering areas inthe west, west–central and southwest regions of Afghanistan to assist with identification andselection of suitable Field staff in those areas where they have links to VFUs, and where FAO was notrepresented. Visits were made by census management and supervisors to the field to oversee thework, and ensure data quality.
Data collection was competed in all Provinces by the end of March, with the exception of GhorProvince. During the winter and early spring the road access to Ghor is virtually impossible because ofsnow and mud. The main access road was only declared open by the Government on 13 April. Thesurvey was undertaken in Ghor using large numbers of data collectors and completed by the end ofApril. Insecurity prevented data collection in only Barmal District of Paktika Province, adjacent to thePakistan border.
4.4 DATA ENTRY AND CHECKING
Ten data entry personnel were recruited in early February for training by the Survey Design andAnalysis consultant, who visited Kabul again during mid February. Data were entered onto computerby two teams of five staff, on a tailored form to simplify transfer of information from paper tocomputer. Data were entered in duplicate, once by each team. Each team worked on data from oneProvince each at a time, with single districts being allocated to a single operator. Data entry wascompleted by early June.
Duplicate entry by different teams simplified the task of checking the accuracy of entry, bycrosschecking the two files relating to a single district. Differences were identified and then correctedby reference to the original data form received from the field. Data checking and correction of thebasic data set was completed by the end of July
In total more than 53 000 records for Level 1 were entered by each team, each record containing 73fields. Level 2 data comprised 1 285 data records each containing 207 fields. The Women’s surveyproduced 2508 records with 170 data fields each. The Karakul survey material consisted of 133records with 63 data fields each.
4.5 DATA ANALYSIS
Data were analysed using standard software for descriptive statistics and the statistical analysispackage SAS for analytical statistics. For total livestock numbers, records without information about number of families were included. Forall computed variables on family basis, all records with missing information about number of familieswithin the community for which the data were enumerated were omitted. Due to many missing valuecells for small stock numbers, it was decided on an individual record basis whether the missing entry
11

12
was truly a missing value, or conversely, indicated zero. The criterion used was overall number ofanimals in the corresponding species. Where this decision was not possible, the record waseliminated.
For all computed variables involving animal ratios, records containing zeroes for the numerator wereeliminated. For records with missing values for the numerator variable, it was decided on an individualrecord basis if the missing entry denoted zero, or was truly a missing value.
The issues of data consistency encountered in this survey are reflective of general problems faced bysurveys and are further addressed in the Methods section. In the Results section we report summariesbased on Provinces and/or Agro-ecological zones. Detailed tables with all district level data are listedin the Annex sections.
photo by: Thieme

13
5. RESULTS5.1 CENSUS DATA SUMMARIES5.1.1 Districts
Information from field staff employed to collect census data revealed that the FAO baselineinformation on the number of Districts was at variance with the de facto situation on the ground.Under the many shifting political administrations, new districts were established by dividing thosealready in existence. While the legal status of the new districts is uncertain and their boundariesunclear, it was decided that location identification data recorded on the survey sheet would reflectthe District names in current use by the local population.
The Ministry of the Interior (MoI) had an official list of districts, based on the 1991 situation, but thiswas different from the list used by the Central Statistical Organisation (CSO). The AIMS list of districtsderives from 1979 when the only human population census occurred. The field data collected by thecurrent Livestock Census, shows significant variation from the official government list and from theAIMS list (see Annex). The census was able to identify the relationship between districts on thedifferent lists, allowing partial comparisons to be drawn between the results of the current censusand earlier FAO work. However, since the only available computerised maps of Afghanistan have beenorganised by AIMS, and the maps presented in this report are based on the AIMS maps, the resultsshown here must be viewed keeping in mind these potential divergences.
At the provincial level, there are a number of differences between the official list and AIMS data.Some districts are allocated to a different district in the AIMS list, and some districts have beencompletely omitted. Within Provinces there are many districts that do not appear on the AIMS list,and some that have disappeared.
The AIMS data base, from pre-2000 data included 329 Districts in 32 Provinces. Areas in whichProvincial capitals are sited are counted by the MoI as “Administrative Units” rather than Districts,e.g. the capital areas of Ghazni, Qalat, and Qalay-I-Naw. The CSO uses the title “Minor Civil Division”for all Provincial Centres and Districts. There are 351 Districts plus 32 Provincial administrative Areason the MoI list, but 357 plus 32 Provincial Centres in the Minor Civil Divisions of the CSO.Information collected from the field has shown that there are 397 de facto districts (countingProvincial Administrative Units as districts), plus up to 7 more in Ghor Province, and Barmal District inPaktika Province that were not accessed by the Census (Table 1). Some of the Districts on the MoI andCSO lists are not recognised by name by the people of the ground. These were Rashidan and WaliMohd Shaheed in Ghazni Province, Taraw in Paktika Province and Firoz Nakhchir in SamanganProvince. Full details are discussed in the Annex.
The project collected data from 16 urban districts (Nahya) in Kabul City. These areas are not countedas separate districts by the MoI, but are called Districts by the CSO.
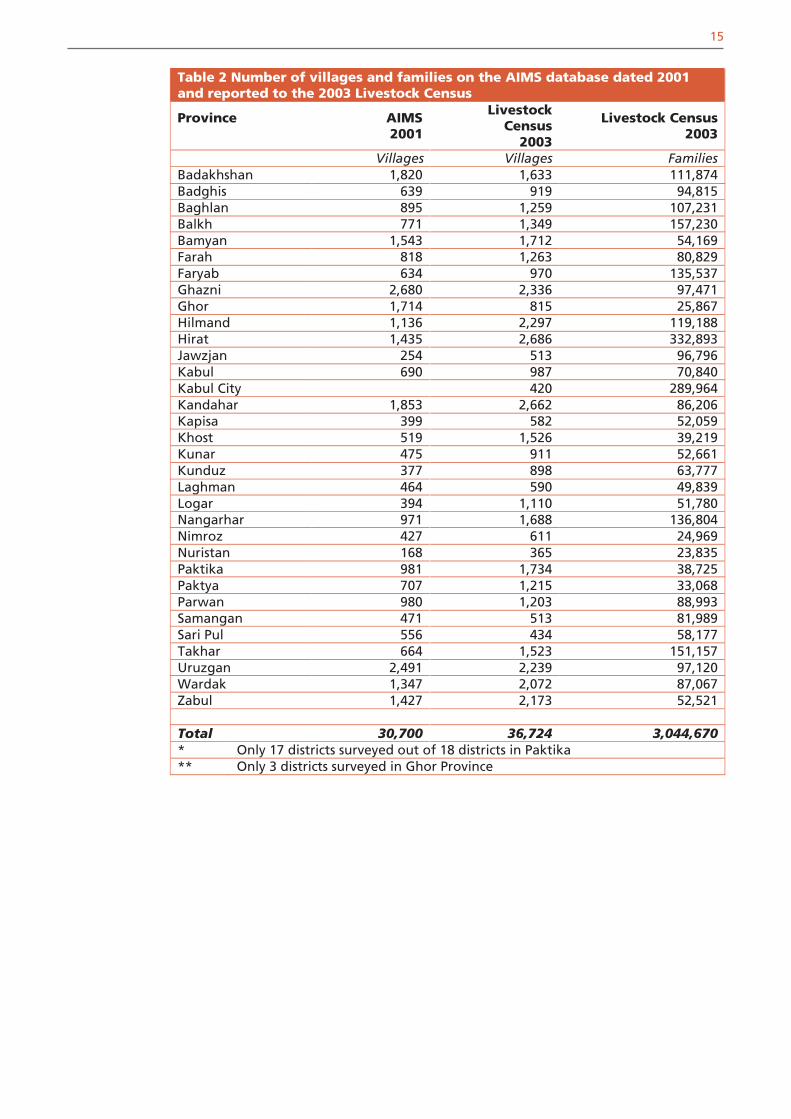
5.1.2 Villages, communities and families
The Census data showed that there were more villages than registered in the current AIMS data base.The Census recorded 36 724 villages in the districts surveyed, compared to 30 690 villages recordedin the AIMS data base, and around 36 000 villages known to the Ministry of the Interior. The numberof families recorded in the Census was 3 044 670, suggesting 83 families per village. However, thetrue number of families will be even greater because some communities were unable to state thenumber present. An attempt was made to determine the number of Kuchi (nomadic livestockproducer) families separately from resident families. The overall total of 23 949 Kuchi familiesrecorded in the census understates the true position as normal migration patterns have beendisturbed by insecurity along the Pakistan border.

Human population can be estimated, based on the numbers of families and family size. Recentestimates of rural family size (FAO, 2003) at 11.6 persons per household are higher than the figure of7.6 used in official calculations. The Livestock Census has not formally distinguished between urbanand rural families outside the capital. Assuming that 25 percent of families are urban-based and 75percent rural, and an urban family size of 7.6 people per household, the national human populationis at least 32 274 000. The Central Statistical Office (CSO, 2003) estimated the human population at22.2 million.
14
Province MoI #2003
CSO2003
AIMS2001
LivestockCensus2003
Badakhshan 27 27 13 30Badghis 6 6 7 9Baghlan 11 14 11 15Balkh 15 14 14 15Bamyan 6 6 5 7Farah 10 10 11 11Faryab 13 13 12 11Ghazni 18 18 16 17Ghor 9 9 7 (3) **Helmand 11 12 13 15Hirat 15 16 16 16Jawzjan 9 9 9 14Kabul 14 14 14 15Kandahar 15 15 12 17Kapisa 5 6 6 8Khost 12 11 12 13Kunar 14 14 12 15Kunduz 6 6 7 7Laghman 4 4 5 5Logar 6 6 5 7Nangahar 21 21 20 25Nimroz 5 4 5 6Nuristan 7 7 6 7Paktika 18 18 15 (17) *Paktya 9 10 12 14Parwan 13 13 12 14Samangan 6 6 5 9Sari Pul 5 5 6 7Takhar 16 16 12 17Uruzgan 8 8 10 9Wardak 8 8 8 10Zabul 9 9 9 12
Total 351 355 329 397# MoI data base excludes 31 Provincial capital administrative areas* Only 17 districts surveyed out of 18 districts in Paktika** Only 3 districts surveyed in Ghor Province
Table 1 Summary of districts recognised by the Ministry of the Interior (MoI), the Central Statistical Office (CSO), AIMS and reported to the Livestock Census
15
Table 2 Number of villages and families on the AIMS database dated 2001 and reported to the 2003 Livestock Census
Province AIMS2001
Livestock Census
2003
Livestock Census2003
Villages Villages FamiliesBadakhshan 1,820 1,633 111,874Badghis 639 919 94,815Baghlan 895 1,259 107,231Balkh 771 1,349 157,230Bamyan 1,543 1,712 54,169Farah 818 1,263 80,829Faryab 634 970 135,537Ghazni 2,680 2,336 97,471Ghor 1,714 815 25,867Hilmand 1,136 2,297 119,188Hirat 1,435 2,686 332,893Jawzjan 254 513 96,796Kabul 690 987 70,840Kabul City 420 289,964Kandahar 1,853 2,662 86,206Kapisa 399 582 52,059Khost 519 1,526 39,219Kunar 475 911 52,661Kunduz 377 898 63,777Laghman 464 590 49,839Logar 394 1,110 51,780Nangarhar 971 1,688 136,804Nimroz 427 611 24,969Nuristan 168 365 23,835Paktika 981 1,734 38,725Paktya 707 1,215 33,068Parwan 980 1,203 88,993Samangan 471 513 81,989Sari Pul 556 434 58,177Takhar 664 1,523 151,157Uruzgan 2,491 2,239 97,120Wardak 1,347 2,072 87,067Zabul 1,427 2,173 52,521
Total 30,700 36,724 3,044,670* Only 17 districts surveyed out of 18 districts in Paktika** Only 3 districts surveyed in Ghor Province
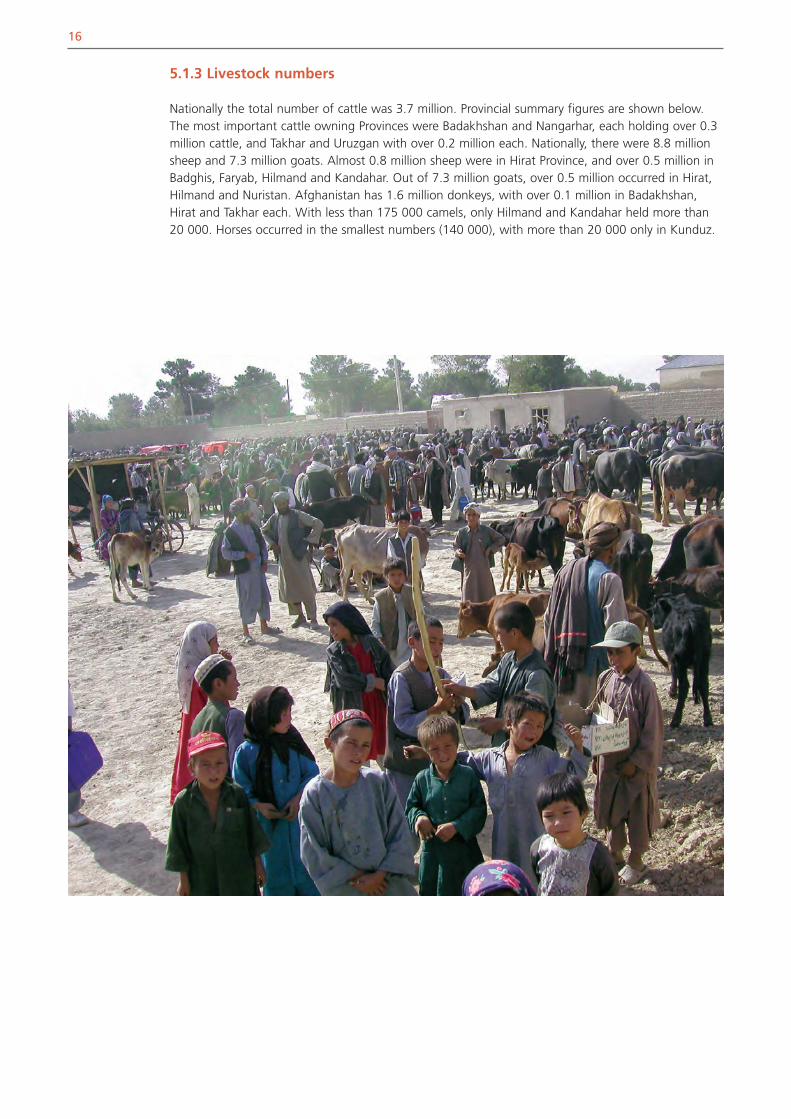
5.1.3 Livestock numbers
Nationally the total number of cattle was 3.7 million. Provincial summary figures are shown below.The most important cattle owning Provinces were Badakhshan and Nangarhar, each holding over 0.3million cattle, and Takhar and Uruzgan with over 0.2 million each. Nationally, there were 8.8 millionsheep and 7.3 million goats. Almost 0.8 million sheep were in Hirat Province, and over 0.5 million inBadghis, Faryab, Hilmand and Kandahar. Out of 7.3 million goats, over 0.5 million occurred in Hirat,Hilmand and Nuristan. Afghanistan has 1.6 million donkeys, with over 0.1 million in Badakhshan,Hirat and Takhar each. With less than 175 000 camels, only Hilmand and Kandahar held more than20 000. Horses occurred in the smallest numbers (140 000), with more than 20 000 only in Kunduz.
16

17
These numbers constitute a snapshot in time whose most valuable function is that of a nationalbaseline inventory. Combined with data on herd structure and reproductive performance levels, anassessment of the recovery and development potential of the Afghan livestock sector is possible. Basicherd structure data were collected in Level 1. More detailed herd structure information and data onreproductive performance became available through the Level 2 surveys. These data can be used inherd dynamics models to project growth and off take potential of the national inventory. The contribution of livestock to livelihoods is an important factor in assessing the importance of thelivestock sector. Hence, animal numbers per household must also be considered. These numbers arepresented below, summarised on the basis of province and agro-ecological region. More informationon agro-ecological regions is given in Section 5.2 of this report.
Only families in Badakhshan, Khost, Kunar, Laghman and Nuristan own on average more than threeor more cattle. Families own more sheep than goats in most Provinces, but Nuristan families haveseven times as many goats as sheep. In general, goats are more numerous than sheep in provincesalong the border with Pakistan. Poultry are kept in greatest numbers by families in the east andsouth-east.
For most Afghan farmers, animals are the only source for power for cultivation and transport. Thepreferred animal for draft power is the oxen; however, many farmers are too poor to own oxen. Thenext most frequently used animal for draft is the donkey. The statistics for draft animals summarisedthree categories: oxen (taken from the answers for this category in the Level 1 survey), cattle anddonkeys available for draft (taken from the corresponding answer categories in the Level 1 survey)and animals potentially available for draft (a computed category that included all cattle, donkeys,camels and horses older than two years). The following table presents these numbers as averages perprovince and summarised for agro-ecological regions. A very small number of records of the Level 1census did not list the number of families present in the community. Accordingly, all statisticscomputed on a per family basis were calculated on a filtered data set that was created after furtherconsistency checking.
18
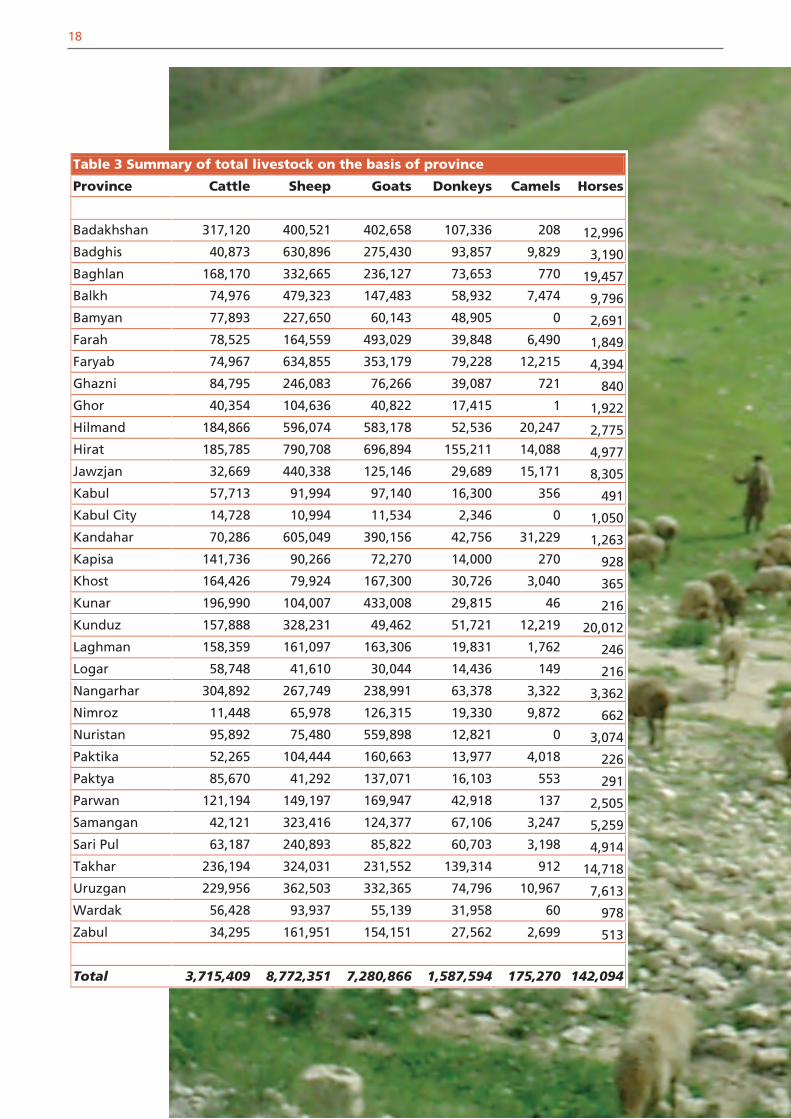
Table 3 Summary of total livestock on the basis of province
Province Cattle Sheep Goats Donkeys Camels Horses
Badakhshan 317,120 400,521 402,658 107,336 208 12,996Badghis 40,873 630,896 275,430 93,857 9,829 3,190Baghlan 168,170 332,665 236,127 73,653 770 19,457Balkh 74,976 479,323 147,483 58,932 7,474 9,796Bamyan 77,893 227,650 60,143 48,905 0 2,691Farah 78,525 164,559 493,029 39,848 6,490 1,849Faryab 74,967 634,855 353,179 79,228 12,215 4,394Ghazni 84,795 246,083 76,266 39,087 721 840Ghor 40,354 104,636 40,822 17,415 1 1,922Hilmand 184,866 596,074 583,178 52,536 20,247 2,775Hirat 185,785 790,708 696,894 155,211 14,088 4,977Jawzjan 32,669 440,338 125,146 29,689 15,171 8,305Kabul 57,713 91,994 97,140 16,300 356 491Kabul City 14,728 10,994 11,534 2,346 0 1,050Kandahar 70,286 605,049 390,156 42,756 31,229 1,263Kapisa 141,736 90,266 72,270 14,000 270 928Khost 164,426 79,924 167,300 30,726 3,040 365Kunar 196,990 104,007 433,008 29,815 46 216Kunduz 157,888 328,231 49,462 51,721 12,219 20,012Laghman 158,359 161,097 163,306 19,831 1,762 246Logar 58,748 41,610 30,044 14,436 149 216Nangarhar 304,892 267,749 238,991 63,378 3,322 3,362Nimroz 11,448 65,978 126,315 19,330 9,872 662Nuristan 95,892 75,480 559,898 12,821 0 3,074Paktika 52,265 104,444 160,663 13,977 4,018 226Paktya 85,670 41,292 137,071 16,103 553 291Parwan 121,194 149,197 169,947 42,918 137 2,505Samangan 42,121 323,416 124,377 67,106 3,247 5,259Sari Pul 63,187 240,893 85,822 60,703 3,198 4,914Takhar 236,194 324,031 231,552 139,314 912 14,718Uruzgan 229,956 362,503 332,365 74,796 10,967 7,613Wardak 56,428 93,937 55,139 31,958 60 978Zabul 34,295 161,951 154,151 27,562 2,699 513
Total 3,715,409 8,772,351 7,280,866 1,587,594 175,270 142,094

19
Table 4 Summary of total poultry on the basis of province
Province Chickens Ducks Turkeys
Badakhshan 314,992 2,897 1,793
Badghis 243,141 113 2,650
Baghlan 280,234 13,889 69,876
Balkh 287,895 2,036 3,677
Bamyan 123,432 1,324 6,227
Farah 438,934 10,763 40,431
Faryab 187,457 314 2,905
Ghazni 321,420 1,625 5,696
Ghor 71,391 287 622
Hilmand 850,020 82,262 89,815
Hirat 691,101 4,632 22,744
Jawzjan 155,470 72 560
Kabul 345,497 1,505 3,342
Kabul City 584,833 2,557 4,743
Kandahar 579,870 2,943 12,373
Kapisa 336,556 12,724 1,891
Khost 613,025 3,769 41,816
Kunar 567,032 17,278 53,298
Kunduz 236,551 11,589 15,019
Laghman 391,365 118,245 28,999
Logar 198.365 3,099 6,316
Nangarhar 1,046,032 45,327 86,156
Nimroz 136,657 5,596 21,809
Nuristan 281,504 216 672
Paktika 287,518 405 2,484
Paktya 472,394 2,478 13,852
Parwan 307,186 8,462 4,336
Samangan 118,862 209 288
Sari Pul 124,831 222 1,575
Takhar 345,947 7,182 6,718
Uruzgan 656,214 56,201 43,210
Wardak 268,652 1,312 2,918
Zabul 290,467 1,000 907
Total 12,155,846 422,533 599,718
20
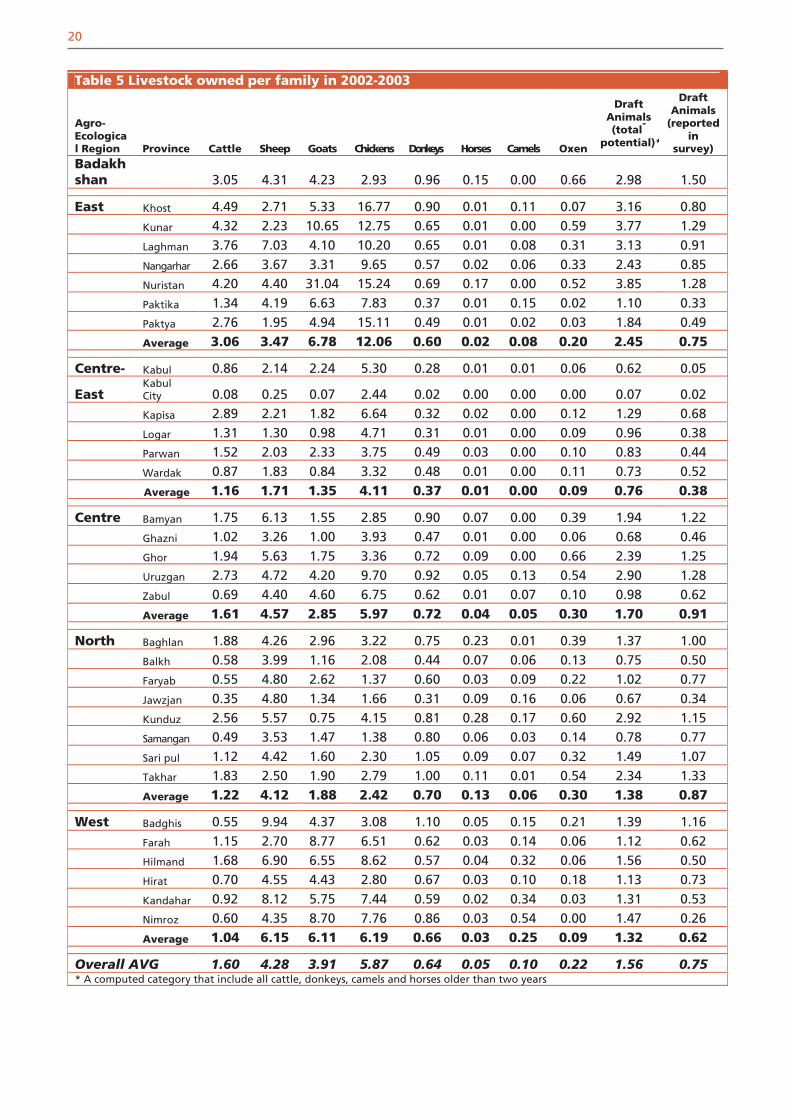
Table 5 Livestock owned per family in 2002-2003
Agro-Ecological Region Province Cattle Sheep Goats Chickens Donkeys Horses Camels Oxen
Draft Animals (total
-
potential)*
Draft Animals
(reportedin
survey)Badakhshan 3.05 4.31 4.23 2.93 0.96 0.15 0.00 0.66 2.98 1.50
East Khost 4.49 2.71 5.33 16.77 0.90 0.01 0.11 0.07 3.16 0.80
Kunar 4.32 2.23 10.65 12.75 0.65 0.01 0.00 0.59 3.77 1.29
Laghman 3.76 7.03 4.10 10.20 0.65 0.01 0.08 0.31 3.13 0.91
Nangarhar 2.66 3.67 3.31 9.65 0.57 0.02 0.06 0.33 2.43 0.85
Nuristan 4.20 4.40 31.04 15.24 0.69 0.17 0.00 0.52 3.85 1.28
Paktika 1.34 4.19 6.63 7.83 0.37 0.01 0.15 0.02 1.10 0.33
Paktya 2.76 1.95 4.94 15.11 0.49 0.01 0.02 0.03 1.84 0.49
Average 3.06 3.47 6.78 12.06 0.60 0.02 0.08 0.20 2.45 0.75
Centre- Kabul 0.86 2.14 2.24 5.30 0.28 0.01 0.01 0.06 0.62 0.05
EastKabul City 0.08 0.25 0.07 2.44 0.02 0.00 0.00 0.00 0.07 0.02
Kapisa 2.89 2.21 1.82 6.64 0.32 0.02 0.00 0.12 1.29 0.68
Logar 1.31 1.30 0.98 4.71 0.31 0.01 0.00 0.09 0.96 0.38
Parwan 1.52 2.03 2.33 3.75 0.49 0.03 0.00 0.10 0.83 0.44
Wardak 0.87 1.83 0.84 3.32 0.48 0.01 0.00 0.11 0.73 0.52
Average 1.16 1.71 1.35 4.11 0.37 0.01 0.00 0.09 0.76 0.38
Centre Bamyan 1.75 6.13 1.55 2.85 0.90 0.07 0.00 0.39 1.94 1.22
Ghazni 1.02 3.26 1.00 3.93 0.47 0.01 0.00 0.06 0.68 0.46
Ghor 1.94 5.63 1.75 3.36 0.72 0.09 0.00 0.66 2.39 1.25
Uruzgan 2.73 4.72 4.20 9.70 0.92 0.05 0.13 0.54 2.90 1.28
Zabul 0.69 4.40 4.60 6.75 0.62 0.01 0.07 0.10 0.98 0.62
Average 1.61 4.57 2.85 5.97 0.72 0.04 0.05 0.30 1.70 0.91
North Baghlan 1.88 4.26 2.96 3.22 0.75 0.23 0.01 0.39 1.37 1.00
Balkh 0.58 3.99 1.16 2.08 0.44 0.07 0.06 0.13 0.75 0.50
Faryab 0.55 4.80 2.62 1.37 0.60 0.03 0.09 0.22 1.02 0.77
Jawzjan 0.35 4.80 1.34 1.66 0.31 0.09 0.16 0.06 0.67 0.34
Kunduz 2.56 5.57 0.75 4.15 0.81 0.28 0.17 0.60 2.92 1.15
Samangan 0.49 3.53 1.47 1.38 0.80 0.06 0.03 0.14 0.78 0.77
Sari pul 1.12 4.42 1.60 2.30 1.05 0.09 0.07 0.32 1.49 1.07
Takhar 1.83 2.50 1.90 2.79 1.00 0.11 0.01 0.54 2.34 1.33
Average 1.22 4.12 1.88 2.42 0.70 0.13 0.06 0.30 1.38 0.87
West Badghis 0.55 9.94 4.37 3.08 1.10 0.05 0.15 0.21 1.39 1.16
Farah 1.15 2.70 8.77 6.51 0.62 0.03 0.14 0.06 1.12 0.62
Hilmand 1.68 6.90 6.55 8.62 0.57 0.04 0.32 0.06 1.56 0.50
Hirat 0.70 4.55 4.43 2.80 0.67 0.03 0.10 0.18 1.13 0.73
Kandahar 0.92 8.12 5.75 7.44 0.59 0.02 0.34 0.03 1.31 0.53
Nimroz 0.60 4.35 8.70 7.76 0.86 0.03 0.54 0.00 1.47 0.26
Average 1.04 6.15 6.11 6.19 0.66 0.03 0.25 0.09 1.32 0.62
Overall AVG 1.60 4.28 3.91 5.87 0.64 0.05 0.10 0.22 1.56 0.75* A computed category that include all cattle, donkeys, camels and horses older than two years

21

22

23
5.1.4 Herd Structures
Female cattle older than 2 yearsAlthough most cows do not enter lactation at 2 years in Afghanistan, for the simplification of theLevel 1 survey, this age threshold was chosen to provide an upper limit to numbers in meaningfulstock classes, in particular cattle available for dairy production and recruitment (see below). Onlyfamilies in Khost, Kunar, Laghman and Nuristan owned more than 1.5 cows per family. Note that allstatistics in this section not referenced on the basis of family were computed from the full data set(which included also records not listing the number of families present in the community surveyed).
Young stockA simple approach to summarising the state of reproduction is to compute a ratio of young stock tonumber of reproductive females. If data are of acceptably accuracy (this can be only expected if thesimplest of numbers are used, e.g. two age classes), this ratio can provide some insight as to whetherpopulations are stable, declining or have potential to increase. Of course there will be effects such astime of the year, regional markets and so forth that will influence the numbers, since not all data canbe collected simultaneously. Therefore, these data, on their own, are not sufficient to suggest highpriority areas nor do they give reason for complacency. The data are computed as the sum ofcategories (younger than 2 years) and current year’s young (calves, lambs, kids, foals). Thesecategories were kept clearly separate in the census. In many cases, no-entry cells were interpreted astrue zeroes. This may not always be correct. Therefore, the values reported in Table 7 must be viewedas a lower limit.
CattleThe data indicate that restocking of depleted herds in many areas will not be possible with currentreproduction rates. This is further substantiated by Level 2 data and will be discussed below. Theavailable information suggests that cattle reproduction in the east-central area (Ghazni, Wardak,Logar, Parwan, Kapisa Kunar) and in Kunduz and Badghis at 0.7 calves per adult female per yearindicates a calving interval of > 15 months after allowing for 10 percent mortality. At the other endof the scale, the calving interval in Jawzan appears to be 3.5 years or greater. Note that thesecalculations do not consider female sterility. Given the extreme poverty of farmers in Afghanistan,rigorous culling based on deficient reproductive performance is unlikely. Depending on results fromLevel 2, more in-depth analysis of this critical problem is clearly indicated, for example by way of spotsurveys and market surveys. It is also important to compare these data with available informationabout regional extent and severity of drought.
SmallstockThe basic data in Level 1 do not differentiate between Karakul and other sheep breeds. Provinceswith higher levels of Karakul could expect lower proportions of two year old young stock. The datashown below suggests lamb numbers/ewe/year of 1.5 available for restocking and above only inLogar, Nangarhar and Wardak, allowing for a mortality rate over two years of 25 percent subject tothe same caveats as the cattle values. Similarly for goats, 1.5 kids/doe/year is only reached in Badghis,Nangarhar and Nuristan.

24
Table 6 Cows owned per family in 2002-2003
Agro-Ecological Region
Province Average Standard Deviation
Badakhshan 1.08 0.88
East Khost 2.35 1.56Kunar 1.86 4.72Laghman 1.90 1.70Nangarhar 1.32 2.51Nuristan 1.87 1.15Paktika 0.65 0.55Paktya 1.33 0.97Average 1.49 2.25
Centre-East Kabul 0.35 0.38Kabul City 0.05 0.10Kapisa 0.83 0.44Logar 0.65 0.55Parwan 0.44 0.40Wardak 0.39 0.35Average 0.45 0.44
Centre Bamyan 0.56 0.39Ghazni 0.47 0.45Ghor 0.60 0.35Uruzgan 0.97 0.91Zabul 0.32 0.45Average 0.60 0.65
North Baghlan 0.70 0.78Balkh 0.26 0.35Faryab 0.13 0.13Jawzjan 0.18 0.26Kunduz 1.11 1.28Samangan 0.18 0.27Sari pul 0.37 0.48Takhar 0.76 0.69Average 0.48 0.71
West Badghis 0.14 0.21Farah 0.52 0.68Hilmand 0.77 0.62Hirat 0.27 0.36Kandahar 0.47 0.44Nimroz 0.35 0.44Average 0.47 0.54
Overall Average 0.68 1.12

25
Table 7 Ratio of young per adult for cattle, sheep, goats and donkeysYoung per
CowYoung per
EweYoung per
DoeYoung per
Jenny
Agro-Ecological Region
Province AVG SD AVG SD AVG SD AVG SD
Badakhshan 1.3 0.8 1.3 1.2 1.3 0.9 1.4 1.6
East Khost 0.9 0.7 0.7 0.8 0.9 2 0.5 0.6
Kunar 1.4 0.9 1.4 1 1.3 1 1.3 1.4
Laghman 1.1 1 1.3 3.1 1.2 1.1 0.7 1
Nangarhar 1.2 1 2.1 3.7 1.5 3.1 0.6 0.9
Nuristan 1.3 0.8 1.4 0.9 1.9 11.4 1.3 1
Paktika 1.1 0.6 1.2 1 1 1.2 0.3 0.5
Paktya 1.1 0.6 1.3 1.6 1.1 1.7 0.3 0.5
Centre- Kabul 1.2 1.0 1.5 1.9 1.3 3.2 0.8 1.5
East Kabul City 1 0.8 1.7 2.1 1.2 0.9 0.8 1.5
Kapisa 1.6 0.8 1.8 1.5 1.3 1.2 0.8 0.8
Logar 1.3 0.9 2.3 2.8 1.3 1.3 0.2 0.4
Parwan 1.5 1.0 1.4 2.1 1.2 1.3 0.8 0.9
Wardak 1.5 0.8 1.9 3 1.4 1.2 0.4 0.6
Centre Bamyan 1.0 0.6 0.9 0.6 1.0 0.7 0.6 0.6
Ghazni 1.4 1.1 1.5 1.6 1.3 1.3 0.3 0.9
Ghor 1.3 1.1 1.2 0.9 1.3 1.0 0.9 0.9
Uruzgan 1.1 1.0 1.2 2.3 0.9 0.9 0.7 1.1
Zabul 0.8 0.7 1.3 2.6 0.9 1.0 0.5 0.9
North Baghlan 0.9 0.8 0.4 0.8 0.5 0.9 0.4 0.6
Balkh 0.6 0.8 0.5 0.6 0.6 0.9 0.4 0.7
Faryab 0.7 0.8 0.8 1.7 1 1.7 0.4 0.7
Jawzjan 0.5 0.4 0.6 0.9 0.7 0.9 0.3 0.3
Kunduz 1.5 0.8 1.5 1.5 1.4 1.1 1.1 0.9
Samangan 0.7 0.9 0.5 1 0.5 0.9 0.7 1
Sari Pul 0.7 0.6 0.4 0.3 0.5 0.5 0.3 0.5
Takhar 1.2 0.6 1.1 0.7 1 0.6 1.1 0.6
West Badghis 1.7 1.9 1.6 1.5 1.7 1.4 1 2.7
Farah 1 1.3 1.5 2.4 1.4 1.7 1.4 1.6
Hilmand 1.1 1.1 1.5 2 1.1 1 0.9 1.1
Hirat 1.1 1.1 0.9 1.2 0.9 4.7 0.7 0.9
Kandahar 0.8 0.6 1 1.5 0.9 0.9 0.4 0.8
Nimroz 0.7 1.4 0.5 0.7 0.6 0.6 0.3 0.8
Overall Average 1.1 0.9 1.2 1.9 1.1 2.1 0.7 1.1

5.1.5 Changes in Livestock Ownership
Preliminary data and evidence suggested a massive and widespread reduction in livestock numbersdue to a 4 year long drought. Lacking dependable survey data prior to the onset of that drought, it isnot easily possible to obtain an accurate estimate of the extent of the impact of the drought. It wasdecided to ask in all communities the numbers of families without livestock now, and the number offamilies without livestock 4 years before the interviews took place (a time that corresponds to pre-drought conditions). In addition to drought, two additional factors must be considered: (i) Theappreciation of the Afghan currency after the ousting of the Taliban regime forced many to sell stockin order to finance loans, and (ii) the substantial number of refugees returning home to Afghanistan.This migration impacted the number of families in the communities, a distortion compounded by thefact that many returnees initially left their livestock behind outside Afghanistan. This is particularlyobvious in the case of Kabul City. Data for Kabul City were excluded from the calculation of theaverage of the Centre-East region
The following province-level summary shows that overall there was a substantial reduction in numberof families owning livestock. However, this was not the case for all provinces. At the time the censuswas taken, many returned refugees had probably still part or all of their livestock holdings left at theirhomes in exile. Many refugees needed to settle property claims and were unsure about security, sothis attitude is understandable. While we have verbal evidence for this behaviour, we cannotsubstantiate this speculation with numbers, however.
It goes without question, however, that drought and war substantially reduced the overall livestockpopulation and the average livestock holdings per family.
26
photo by: Thieme

27
Table 8 Summary of changes in livestock holdings (families owning no livestock)
Agro-Ecological Region
ProvinceFamilies without
livestock 1998
Families without
livestock 2002/2003
Percent Changeduring
Drought
Families withonly poultry
2002/2003
Badakhshan 11,274 14,522 28.81 9,156
East Khost 633 1,008 59.24 882
Kunar 1,781 2,453 37.73 1,447
Laghman 3,314 4,777 44.15 3,644
Nangarhar 1,491 26,720 52.76 19,705
Nuristan 1,422 2,290 61.04 1,735
Paktika 6,623 7,612 14.93 5,971
Paktya 2,959 4,093 38.32 3,690
Total 34,223 48,953 43.04 37,074
Centre- Kabul 17,730 14,994 -15.43 10,419
East Kabul City 24,739 265,401 972.80 163,682
Kapisa 2,818 4,258 51.10 3,666
Logar 14,908 15,927 6.84 14,293
Parwan 11,197 16,206 44.74 8,447
Wardak 26,452 32,466 22.74 25,466
Total 97,844 349,252 14.7* 225,973
Centre Bamyan 9,383 12,874 37.21 4,260
Ghazni 38,724 33,083 -14.57 30,297
Ghor 5,298 8,006 51.11 3,346
Uruzgan 16,440 15,366 -6.53 8,523
Zabul 18,467 21,575 16.83 11,703
Total 88,312 90,904 2.94 58,129
North Baghlan 25,644 32,319 26.03 9,611
Balkh 47,752 66,182 38.60 20,789
Faryab 42,955 49,366 14.92 16,054
Jawzjan 34,304 43,412 26.55 9,970
Kunduz 6,816 8,506 24.79 4,614
Samangan 22,016 28,277 28.44 7,422
Sari Pul 9,609 14,859 54.64 2,793
Takhar 27,852 24,147 -13.30 16,406
Total 216,948 267,068 23.10 87,659
West Badghis 26,207 31,354 19.64 11,041
Farah 19,712 23,144 17.41 11,584
Hilmand 14,245 15,222 6.86 10,888
Hirat 75,183 136,168 81.12 57,469
Kandahar 21,278 28,114 32.13 17,354
Nimroz 10,599 13,051 23.13 5,230
Total 167,224 247,053 47.74 113,566
Overall Sum 615,825 1,017,752 65.27 53,1557*Data for Kabul City were excluded from Centre-East for the calculation of the average change in numbers of families without livestock (see text)

5.2 REGIONAL PRODUCTION SYSTEM CHARACTERISTICS
In order to structure the results of the survey, especially the detailed Level 2 analysis, distinct agro-ecological zones were defined based on regional production characteristics including climatic andtopographic aspects. The following table summarises the classification of provinces into these regionsand the corresponding number of respondents for each region in the Level 2 survey. Some provinceswere not visited with the Level 2 survey. Badakhshan, for its unique properties, constitutes an agro-ecological region of its own.
28
photo by: Thieme

29
Some key statistics from Level 1 are presented as graphical summaries, indicating regional differencesapparent in the most basic indicators. Numerical differences between regions and response variablesare represented proportionally by the diameter of the circles.
Table 9 Classification of provinces into agro-ecological regionsAgro-ecologicalRegion Province
Number of Villages
Interviewed farmers
East Khost 6 30Kunar NV* NVLaghman 4 29Nangarhar 16 130Nuristan NV NVPaktika 6 30Paktya 7 32All 39 251
Centre-East Kabul 13 40Kabul City 33Kapisa 3 10Logar 7 50Parwan 12 42Wardak 6 30All 41 205
Centre Bamyan 18 76Ghazni 9 57Ghor 5 25Uruzgan NV NVZabul 10 54All 42 212
North Baghlan 21 97Balkh 5 32Faryab 4 28Jawzjan 4 29Kunduz 16 30Samangan 8 64Sari Pul 5 39Takhar 10 20All 73 339
West Badghis 5 25Farah 16 77Hilmand 4 20Hirat 15 136Kandahar NV NVNimroz 4 19All 44 277
Badakhshan NV NV
All 239 1284*NV: not visited

30
Figure 1 Livestock per family across regions
Livestock Class
Cattle Sheep Goats Chicken Donkeys Horses Oxen Draft
East
Centre-East
Centre
North
West
Badakshan
Figure 2 Cows and draft animals across regions
Livestock Class
Cows OxenDraft Animals
Potential Draft Animals
East
Centre-East
Centre
North
West
Badakshan
Agr
o-ec
olog
ical
Reg
ion
Agr
o-ec
olog
ical
Reg
ion

5.2.1 Forage Production and Feeding Situation
The following tables summarise the use of different types of feedstuff, their source (on farmproduction or purchase), preferences of use and sufficiency of feed supplies. Detailed summaries withindividual and total numbers of respondents are listed in Appendix 5.
5.2.1.1 Types of forages used
The following table summarises the percentages of farmers using the feedstuffs listed, specified foreach agro-ecological region. Wheat straw was the most commonly used feed from farm productionin all regions and Maize Straw is also widely used except in the Centre Region where little Maize isgrown. Shaftal and Lucerne are the most popular grown and used fodder crops. Shaftal as annualfodder crop has a relatively higher importance in Eastern Afghanistan while in the other regionsLucerne is the more important fodder crop. Hay from natural grassland has the greatest importance inthe Central Highlands. Maize is the most important farm produced concentrate in all regions exceptin the West is where Barley is more important as concentrate feed.
A large proportion of farmers in all regions purchase both concentrates and roughage for feedingtheir livestock. In addition to their own production approximately 40 percent of the interviewedfarmers still have to purchase additional straw to feed their livestock which by quantity is most likelythe most important purchased feedstuff. Although not specifically asked in the survey one canassumed that the Shaftal and Lucerne where purchased for feeding as fresh fodder crop. ManyAfghan farmers also purchase concentrates with Cotton seed cake, Wheat Bran, Maize and Barley inthe North and West being the more commonly purchased feed types.
31
photo by: Thieme

32
5.2.1.2 Preferences for feeds and feed supply
In addition to the actual use of feedstuffs the interviewed farmers were also asked for their mostpreferred feedstuffs, either purchased or produced on their own farm. In addition to the pre-definedtypes of feedstuffs of the previous chapter a number of other categories were hereby mentioned bythe interviewed farmers. The frequency of answers was used to establish a list of the most preferredfeedstuffs in the different Agro-ecological Regions.
Table 10 Types of forages used in the agro -ecological region (percentage of respondents)
Agro-ecological Region
East Centre-East
Centre North West
Own Production
Wheat Straw 71.7 88.8 67.5 75.8 74.8
Shaftal*) 64.5 64.4 31.1 8.0 48.2
Lucerne 10.8 66.3 49.1 22.1 54.0
Maize Straw 56.6 48.3 9.0 15.9 21.2
Maize 37.5 52.2 8.5 13.0 18.0
Hay 5.2 3.9 38.2 25.4 27.0
Wheat Bran 7.2 10.2 5.2 27.1 5.8
Barley 0.4 1.5 3.3 2.1 19.1
Sorghum 2.4 2.4 0.9 7.7 0.0
Millet 0.0 6.3 2.8 0.0 0.7
Cotton Seed Cake 0.4 2.9 1.9 3.5 1.1
Purchased Feed
Cotton Seed Cake 57.0 86.3 52.4 83.2 6.1
Wheat Straw 40.6 35.1 42.9 44.2 38.8
Wheat Bran 21.1 82.0 36.8 38.3 6.5
Lucerne 6.8 45.9 34.4 16.2 24.5
Barley 8.0 7.3 6.1 26.8 77.6
Maize 15.1 33.2 26.9 21.5 7.6
Shaftal 10.0 37.6 23.6 9.7 14.4
Maize Straw 28.3 5.9 2.4 5.9 1.8
Hay 3.2 3.4 10.4 10.9 2.2
Sorghum 0.4 5.4 0.9 3.5 0.7
Millet 1.2 2.9 0.5 0.3 0.7*Persian Clover, Trifolium resupinatum, but Trifolium clusii (annual Strawberry clover,less productive) is also called ‘Shaftal’.

33
Clearly, farmers prefer concentrates when buying feeds. Oil cakes are the most preferred concentratefeed, but that may be simply a reflection of availability and price. Purchase of Shaftal and Lucerne isespecially popular in the Centre and Centre-East regions, presumably as winter fodder.
Table 11 Preferences for purchased feeds (percentage of respondents)
Agro-ecological region
East Centre-East Centre North West
Forage 4.7 26.6 27.7 8.7 32.0
Lucerne 1.1 10.9 12.5 3.0 7.0
Persian clover 3.4 7.1 8.9 1.4 7.2
Hay 0.3 3.7 2.1 2.7 12.9
Green Plants 4.6 1.4 0.2 4.5
Mountain Grass 0.3 2.8 1.2 0.4
Various Crop Aftermath 27.3 11.2 19.9 10.6 17.6
Wheat Straw 17.3 8.9 12.4 5.1 14.4
Mung Bean Straw 0.8 5.3 0.3
Rice Straw 0.8 0.2 4.9 0.2
Maize Husks 5.9
Barley Straw 0.1 1.7 2.9
Maize Stalks 2.0 0.9
Maize Aftermath 2.4 0.1
Concentrates 67.7 59.4 49.5 75.9 47.6
Oil Cakes 10.3 21.3 15.0 35.5 5.6
Barley 10.3 2.2 7.3 26.5 30.2
Vetch (Lathyrus sativus) 11.8 9.3 9.1
Maize 9.4 4.4 7.9 2.8 5.0
Wheat Bran 0.7 7.8 8.5 7.4 0.9
Wheat 14.5 0.3 0.2 0.4 1.4
Grains 5.8 0.6 3.6
Bread 5.6 0.2 2.8 0.3
Soybean 8.2
Mung Bean (Vigna radiata) 2.8 0.6 0.5
Flour 2.4 0.3 0.2
Others 0.3 2.8 2.9 4.9 2.8

34
In terms of cultivated forage production, there seems to be considerable interest in Persian clover andLucerne. Especially Persian clover can be integrated well into crop rotations and should be considereda priority in livestock development programs. Noteworthy is that the preferences expressed for ‘Mountain Grass’ (harvested rangeland vegetation)corresponds with higher availability of this type of forage in higher elevation sites. At the same time,this regional differentiation reflects on the state of rangelands. There is simply no surplus to beharvested on rangelands in most of Afghanistan.
Table 12 Preferences for on-farm feeds (percentage of respondents)
Agro-ecological region
East Centre-East Centre North West
Forage 33.0 55.5 66.3 24.9 43.0
Persian clover 27.8 21.9 18.0 2.2 7.7
Lucerne 1.2 21.7 28.5 4.9 10.1
Mountain Grass 0.3 1.1 14.2 8.4 7.3
Green Plants 3.1 3.6 2.5 1.4 12.9
Hay 0.2 4.8 3.0 6.4 4.8
Weeds 0.3 2.3 0.1
Green Barley 0.2 0.2 1.5
Crop Aftermath 53.7 23.2 29.3 35.8 18.8
Wheat Straw 28.9 21.2 26.8 22.3 17.9
Maize Husks 12.4 0.2 0.9
Maize Aftermath 8.1 0.5 0.2
Rice Straw 3.9 0.1 2.0 0.9
Khasha (crop aftermath) 6.1
Mung Bean Straw 0.1 5.1 0.1
Crop Aftermath 0.7 1.5
Tree leaves 0.3 0.8
Concentrates 9.8 19.4 4.5 30.2 37.7
Maize 5.9 10.9 1.7 5.1 6.5
Barley 1.0 0.2 1.5 13.3 11.6
Grains 0.7 3.5 10.2
Wheat 0.3 2.0 8.3
Sorghum 1.4 5.3 0.2
Oil Cakes 2.5 0.7 1.3 0.2
Wheat Bran 0.5 0.6 0.7 1.9 0.6
Cotton Seed 1.7
Barley flour 1.3
Others 3.5 1.9 0.0 9.1 0.5

35
These answers provide a clear indication that in 2003 the drought effects began to subside. Thesedata are valuable as baseline data for future programs in drought preparedness.
Table 14 Length of feeding periods (months)
Agro-ecological Region
EastCentre-
East Centre North West
Pasture grazing 8.76 6.86 6.01 5.90 7.44
Stubble period 2.16 2.77 2.05 3.06 2.34
Supplementation period 6.64 8.22 6.29 4.15 4.45
Table 13 Feed supplies (percentage of respondents)
Agro-ecological region
East Centre-East Centre North West
Enough Feed 2002* 44.6 23.9 17.0 3.5 5.0
Enough Feed 2003 45.4 26.8 25.5 47.8 41.7
Pasture Sufficient 2002 16.3 6.3 29.7 11.5 6.8
Pasture Sufficient 2003 17.9 5.4 29.7 36.6 34.2
Purchased Supplements 2002 73.7 93.7 85.8 57.2 61.5
Purchased Supplements 2003 72.9 86.8 80.7 28.9 47.1
Produced Supplements 2002 25.5 15.1 9.4 5.0 2.2
Produced Supplements 2003 27.1 20.0 12.3 14.5 15.8
Feed Prices Increased 2002 80.9 95.1 87.3 96.2 85.3
Feed Prices Increased 2003 74.5 94.1 73.6 17.1 43.5* For all subjects percentage of respondents
36
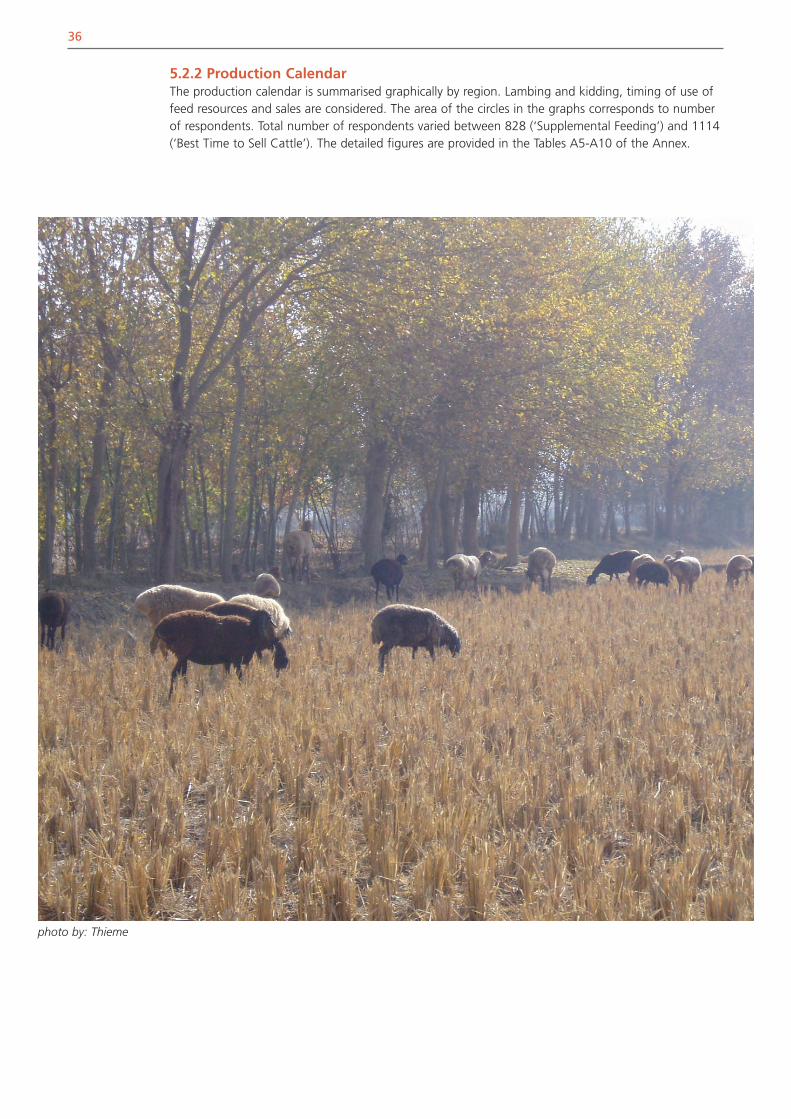
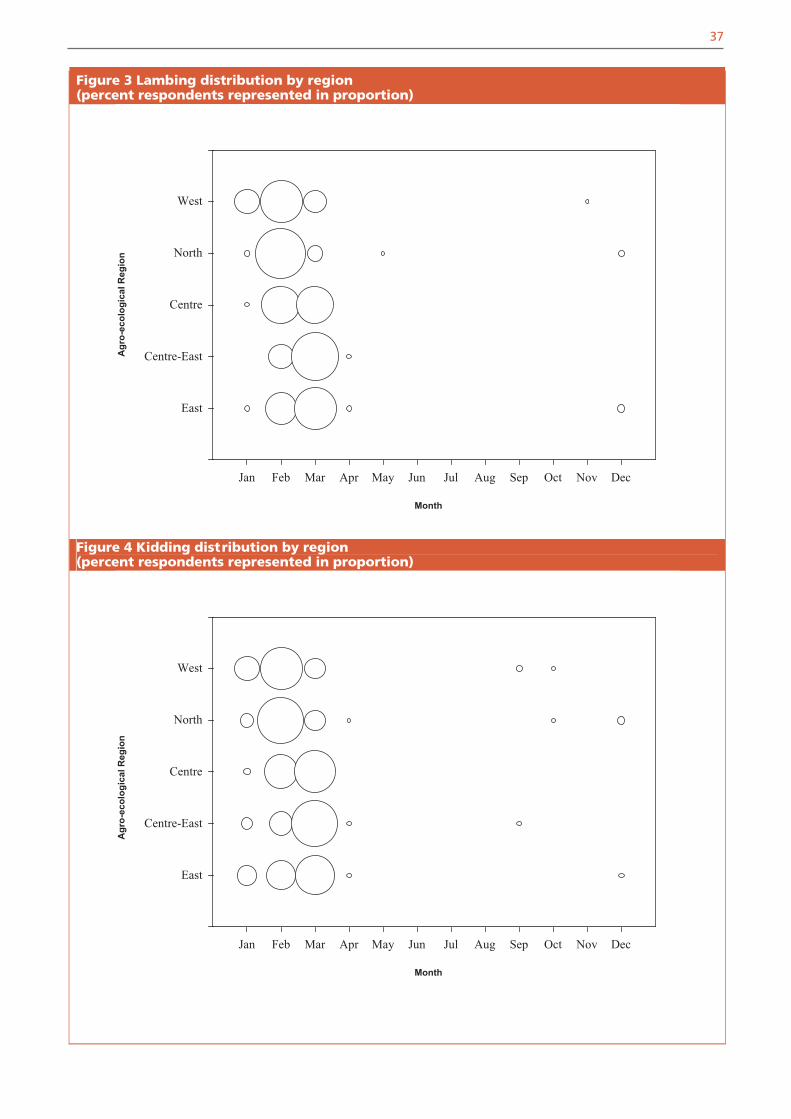
5.2.2 Production CalendarThe production calendar is summarised graphically by region. Lambing and kidding, timing of use offeed resources and sales are considered. The area of the circles in the graphs corresponds to numberof respondents. Total number of respondents varied between 828 (‘Supplemental Feeding’) and 1114(‘Best Time to Sell Cattle’). The detailed figures are provided in the Tables A5-A10 of the Annex.
photo by: Thieme
37
Figure 3 Lambing distribution by region (percent respondents represented in proportion)
Month
Jan Feb Mar Apr May Jun Jul Aug Sep Oct Nov Dec
East
Centre-East
Centre
North
West
Figure 4 Kidding distribution by region (percent respondents represented in proportion)
Month
Jan Feb Mar Apr May Jun Jul Aug Sep Oct Nov Dec
East
Centre-East
Centre
North
West
Agr
o-ec
olog
ical
Reg
ion
Agr
o-ec
olog
ical
Reg
ion

38
Figure 5 Begin of grazing season by region(percent respondents represented in proportion)
Month
Jan Feb Mar Apr May Jun Jul Aug Sep Oct Nov Dec
East
Centre-East
Centre
North
West
Figure 6 End of grazing season by region(percent respondents represented in proportion)
Month
Jan Feb Mar Apr May Jun Jul Aug Sep Oct Nov Dec
East
Centre-East
Centre
North
West
Agr
o-ec
olog
ical
Reg
ion
Agr
o-ec
olog
ical
Reg
ion

39
Figure 7 Begin of stubble grazing by region(percent respondents represented in proportion)
Month
Jan Feb Mar Apr May Jun Jul Aug Sep Oct Nov Dec
East
Centre-East
Centre
North
West
Figure 8 End of stubble grazing by region (percent respondents represented in proportion)
Month
Jan Feb Mar Apr May Jun Jul Aug Sep Oct Nov Dec
East
Centre-East
Centre
North
West
Agr
o-ec
olog
ical
Reg
ion
Agr
o-ec
olog
ical
Reg
ion

40
Figure 9 Begin of supplementary feeding by region (percent respondents represented in proportion)
Month
Jan Feb Mar Apr May Jun Jul Aug Sep Oct Nov Dec
East
Centre-East
Centre
North
West
Figure 10 End of supplementary feeding by region(percent respondents represented in proportion)
Month
Jan Feb Mar Apr May Jun Jul Aug Sep Oct Nov Dec
East
Centre-East
Centre
North
West
Agr
o-ec
olog
ical
Reg
ion
Agr
o-ec
olog
ical
Reg
ion

41
Figure 11 Best time to sell cattle by region(percent respondents represented in proportion)
Month
Jan Feb Mar Apr May Jun Jul Aug Sep Oct Nov Dec
East
Centre-East
Centre
North
West
Figure 12 Best time to sell sheep by region (percent respondents represented in proportion)
Month
Jan Feb Mar Apr May Jun Jul Aug Sep Oct Nov Dec
East
Centre-East
Centre
North
West
Agr
o-ec
olog
ical
Reg
ion
Agr
o-ec
olog
ical
Reg
ion

42
Figure 13 Best time to sell goats by region(percent respondents represented in proportion)
Month
Jan Feb Mar Apr May Jun Jul Aug Sep Oct Nov Dec
East
Centre-East
Centre
North
West
Figure 14 Best time to sell surplus by region(percent respondents represented in proportion)
Month
Jan Feb Mar Apr May Jun Jul Aug Sep Oct Nov Dec
East
Centre-East
Centre
North
West
Agr
o-ec
olog
ical
Reg
ion
Agr
o-ec
olog
ical
Reg
ion

43
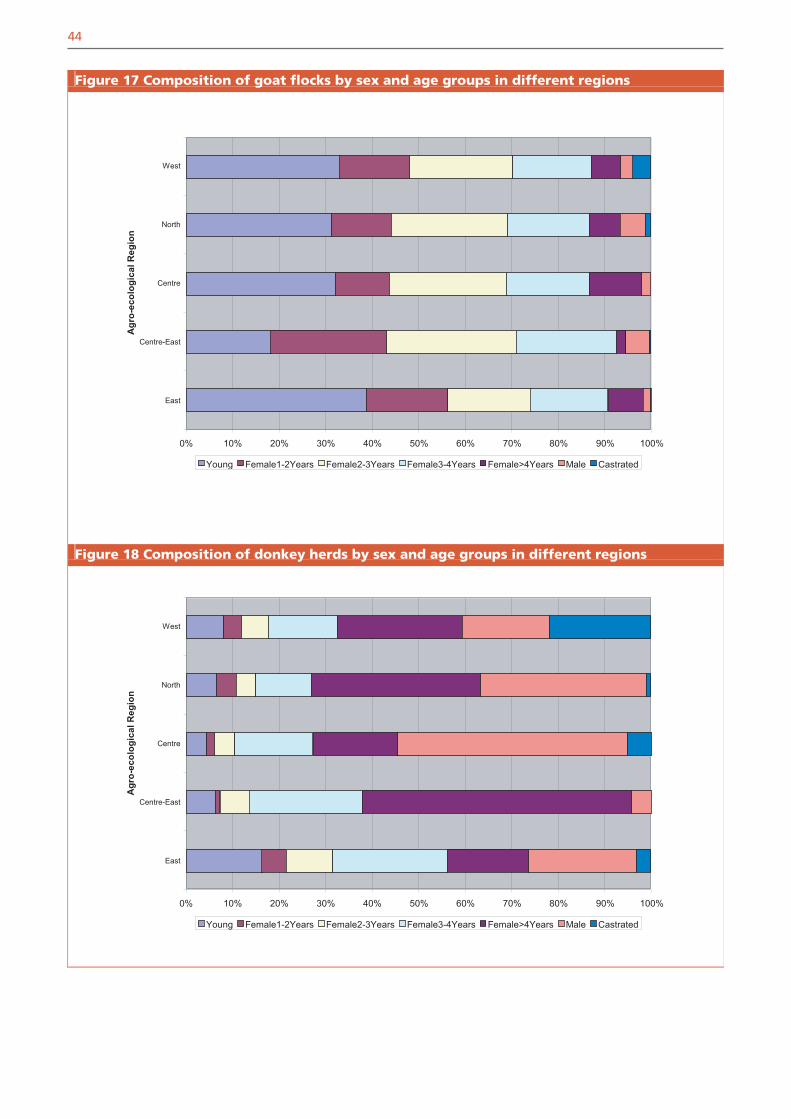
5.2.3 Livestock Species, Numbers and DemographyThe following summary graphs depict the age structure for major livestock species, differentiated byagro-ecological region. Data for camels and horses are summarised for the whole survey becausethere were not enough respondents to justify breakdown by agro-ecological zone. Note that differentage categories were enumerated for different species. Data are also presented in tabular form forfurther reference in Section 5.3.2 ‘Livestock Management’.
Figure 15 Composition of cattle herds by sex and age groups in different regions
0% 10% 20% 30% 40% 50% 60% 70% 80% 90% 100%
East
Centre-East
Centre
North
West
Agr
o-ec
olog
ical
Reg
ion
Young Female1-2Years Female2-3Years Female3-4Years Female>4Years Male Castrated
Figure 16 Composition of sheep flocks by sex and age groups in different regions
0% 10% 20% 30% 40% 50% 60% 70% 80% 90% 100%
East
Centre-East
Centre
North
West
Agr
o-ec
olog
ical
Reg
ion
Young Female1-2Years Female2-3Years Female3-4Years Female>4Years Male Castrated
44
Figure 17 Composition of goat flocks by sex and age groups in different regions
0% 10% 20% 30% 40% 50% 60% 70% 80% 90% 100%
East
Centre-East
Centre
North
West
Agr
o-ec
olog
ical
Reg
ion
Young Female1-2Years Female2-3Years Female3-4Years Female>4Years Male Castrated
Figure 18 Composition of donkey herds by sex and age groups in different regions
0% 10% 20% 30% 40% 50% 60% 70% 80% 90% 100%
East
Centre-East
Centre
North
West
Agr
o-ec
olog
ical
Reg
ion
Young Female1-2Years Female2-3Years Female3-4Years Female>4Years Male Castrated

45
Figure 19 Composition of camel herd by sex and age groups (all regions)
0% 10% 20% 30% 40% 50% 60% 70% 80% 90% 100%
YCamels FCamels12 FCamels23 FCamels34 FCamels>4 MCamels CCamels
Figure 20 Composition of horse herd by sex and age groups (all regions)
0% 10% 20% 30% 40% 50% 60% 70% 80% 90% 100% Females < 1 Year Males < 1 Year Females > 1 Year Males > 1 Year

46
5.3 PRODUCER CHARACTERISTICS5.3.1 Livestock Wealth Distribution
From the detailed Level 2 data, information about distribution of livestock ownership could becomputed. Four livestock species were used to classify wealth distribution: cattle, sheep, goats andchicken. This information is presented on the basis of province and agro-ecological region.
Table 15 Livestock wealth distribution classificationsClass Cattle Sheep Goats Chicken1 0 0 0 02 1-2 1-49 1-49 1-103 3-4 50-99 50-99 11-204 5-10 100-499 100-499 21-505 > 10 > 499 > 499 > 50
photo by: Park

47
Table 16 Cattle ownership distribution (percentages)
Herd size (number of cattle)
Region Province 0 1-2 3-4 5-10 > 10Total
Respondents
East Khost 16.67 10.00 10.00 40.00 23.33 30
Laghman 17.24 48.28 34.48 29
Nangarhar 2.31 21.54 35.38 37.69 3.08 130
Paktika 20.00 20.00 16.67 33.33 10.00 30
Paktya 3.13 18.75 28.13 21.88 28.13 32
All 5.98 19.12 30.68 35.06 9.16 251
Centre-East
Kabul 7.50 30.00 37.50 25.00 40
Kabul City
24.24 24.24 30.30 18.18 3.03 33
Kapisa 60.00 30.00 10.00 10
Logar 10.00 28.00 22.00 34.00 6.00 50
Parwan 30.95 45.24 21.43 2.38 42
Wardak 6.67 43.33 40.00 10.00 30
All 8.78 32.20 34.15 22.44 2.44 205
Centre Bamyan 15.87 46.03 19.05 17.46 1.59 63
Ghazni 35.09 26.32 28.07 10.53 57
Ghor 24.00 40.00 16.00 16.00 4.00 25
Zabul 18.52 25.93 31.48 22.22 1.85 54
All 23.12 34.17 24.62 16.58 1.51 199
North Baghlan 10.31 20.62 24.74 37.11 7.22 97
Balkh 9.38 43.75 46.88 32
Faryab 29.63 33.33 29.63 7.41 27
Jawzjan 48.28 34.48 3.45 13.79 29
Kunduz 3.33 23.33 23.33 30.00 20.00 30
Samangan 18.75 37.50 23.44 14.06 6.25 64
Sari Pul 15.38 30.77 25.64 25.64 2.56 39
Takhar 5.00 20.00 20.00 30.00 25.00 20
All 16.27 29.59 24.85 22.49 6.80 338
West Badghis 36.00 32.00 12.00 20.00 25
Farah 28.57 45.45 16.88 9.09 77
Hilmand 15.00 30.00 25.00 20.00 10.00 20
Hirat 39.85 36.09 15.79 7.52 0.75 133
Nimroz 15.00 55.00 10.00 15.00 5.00 20
All 32.73 39.27 16.00 10.55 1.45 275
Overall AVG/Total 17.67 30.76 25.55 21.45 4.57 1,268
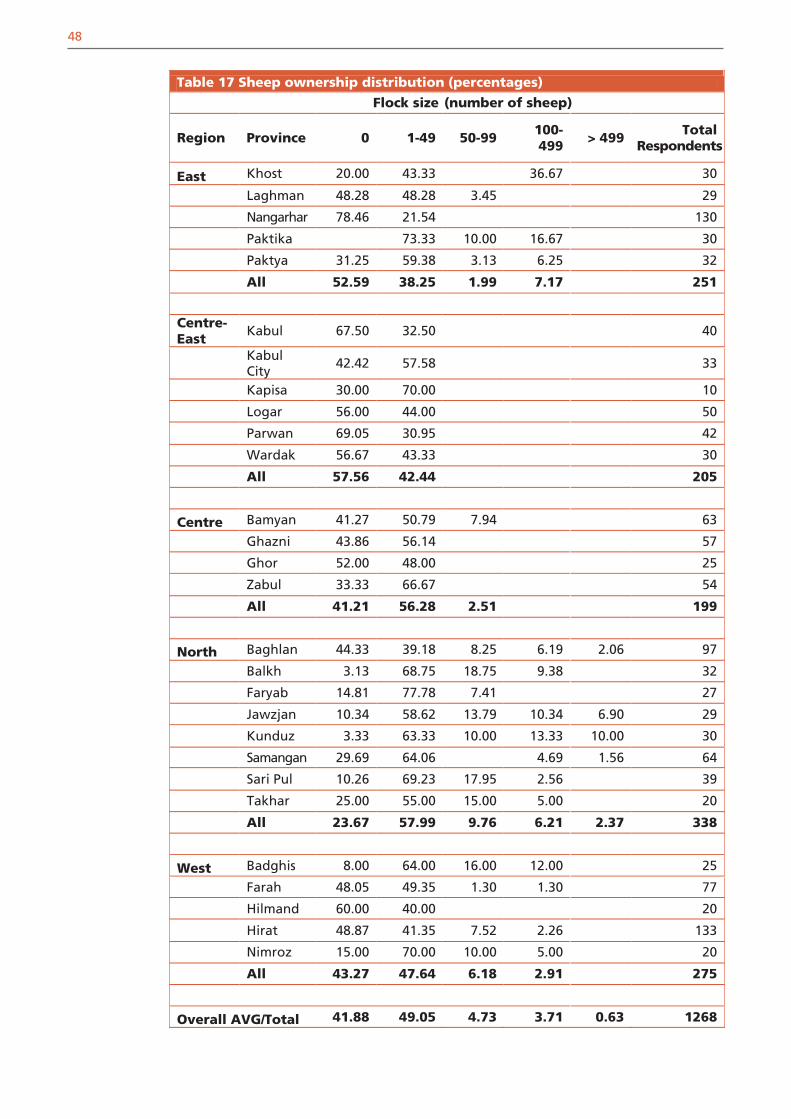
48
Table 17 Sheep ownership distribution (percentages)
Flock size (number of sheep)
Region Province 0 1-49 50-99 100-499 > 499 Total
Respondents
East Khost 20.00 43.33 36.67 30
Laghman 48.28 48.28 3.45 29
Nangarhar 78.46 21.54 130
Paktika 73.33 10.00 16.67 30
Paktya 31.25 59.38 3.13 6.25 32
All 52.59 38.25 1.99 7.17 251
Centre-East
Kabul 67.50 32.50 40
Kabul City
42.42 57.58 33
Kapisa 30.00 70.00 10
Logar 56.00 44.00 50
Parwan 69.05 30.95 42
Wardak 56.67 43.33 30
All 57.56 42.44 205
Centre Bamyan 41.27 50.79 7.94 63
Ghazni 43.86 56.14 57
Ghor 52.00 48.00 25
Zabul 33.33 66.67 54
All 41.21 56.28 2.51 199
North Baghlan 44.33 39.18 8.25 6.19 2.06 97
Balkh 3.13 68.75 18.75 9.38 32
Faryab 14.81 77.78 7.41 27
Jawzjan 10.34 58.62 13.79 10.34 6.90 29
Kunduz 3.33 63.33 10.00 13.33 10.00 30
Samangan 29.69 64.06 4.69 1.56 64
Sari Pul 10.26 69.23 17.95 2.56 39
Takhar 25.00 55.00 15.00 5.00 20
All 23.67 57.99 9.76 6.21 2.37 338
West Badghis 8.00 64.00 16.00 12.00 25
Farah 48.05 49.35 1.30 1.30 77
Hilmand 60.00 40.00 20
Hirat 48.87 41.35 7.52 2.26 133
Nimroz 15.00 70.00 10.00 5.00 20
All 43.27 47.64 6.18 2.91 275
Overall AVG/Total 41.88 49.05 4.73 3.71 0.63 1268

49
Table 18 Goat ownership distribution (percentages)
Flock size (number of goats)
Region Province 0 1-49 50-99 100-499 Total Respondents
East Khost 6.67 83.33 6.67 3.33 30
Laghman 79.31 20.69 29
Nangarhar 72.31 27.69 130
Paktika 50.00 46.67 3.33 30
Paktya 15.63 53.13 9.38 21.88 32
All 55.38 39.04 1.99 3.59 251
Centre-East
Kabul 75.00 25.00 40
Kabul City 66.67 33.33 33
Kapisa 100 10
Logar 80.00 20.00 50
Parwan 97.62 2.38 42
Wardak 90.00 10.00 30
All 82.93 17.07 205
Centre Bamyan 52.38 47.62 63
Ghazni 63.16 36.84 57
Ghor 20.00 76.00 4.00 25
Zabul 57.41 40.74 1.85 54
All 52.76 46.23 1.01 199
North Baghlan 37.11 58.76 3.09 1.03 97
Balkh 6.25 90.63 3.13 32
Faryab 25.93 74.07 27
Jawzjan 13.79 82.76 3.45 29
Kunduz 33.33 66.67 30
Samangan 50.00 43.75 4.69 1.56 64
Sari Pul 10.26 89.74 39
Takhar 40.00 55.00 5.00 20
All 30.47 66.27 2.07 1.18 338
West Badghis 92.00 4.00 4.00 25
Farah 20.78 71.43 2.60 5.19 77
Hilmand 60.00 40.00 20
Hirat 31.58 63.16 3.76 1.50 133
Nimroz 95.00 5.00 20
All 25.45 68.73 2.91 2.91 275
Overall AVG/Total 46.29 50.32 1.74 1.66 1268

50
Table 19 Chicken ownership distribution (percentages)
Ownership class (number of chicken)
Region Province 0 1-10 11-20 21-50 > 50Total
Respondents
East Khost 13.33 43.33 23.33 16.67 3.33 30
Laghman 6.90 68.97 17.24 6.90 29
Nangarhar 3.85 40.77 31.54 20.00 3.85 130
Paktika 3.33 56.67 33.33 6.67 30
Paktya 3.13 37.50 34.38 12.50 12.50 32
All 5.18 45.82 29.48 15.54 3.98 251
Centre-East
Kabul 7.50 47.50 32.50 12.50 40
Kabul City
21.21 42.42 27.27 9.09 33
Kapisa 10.00 40.00 40.00 10.00 10
Logar 36.00 44.00 12.00 8.00 50
Parwan 14.29 47.62 33.33 2.38 2.38 42
Wardak 16.67 53.33 30.00 30
All 19.51 46.34 26.83 6.83 0.49 205
Centre Bamyan 47.62 47.62 4.76 63
Ghazni 22.81 59.65 14.04 3.51 57
Ghor 24.00 76.00 25
Zabul 16.67 51.85 27.78 3.70 54
All 29.15 55.78 13.07 2.01 199
North Baghlan 17.53 60.82 13.40 8.25 97
Balkh 3.13 50.00 21.88 25.00 32
Faryab 29.63 66.67 3.70 27
Jawzjan 58.62 34.48 6.90 29
Kunduz 13.33 30.00 33.33 20.00 3.33 30
Samangan 42.19 42.19 15.63 64
Sari Pul 33.33 64.10 2.56 39
Takhar 20.00 35.00 35.00 10.00 20
All 25.74 49.70 15.09 8.58 0.89 338
West Badghis 16.00 76.00 8.00 25
Farah 2.60 32.47 42.86 22.08 77
Hilmand 45.00 50.00 5.00 20
Hirat 39.85 52.63 4.51 3.01 133
Nimroz 25.00 60.00 10.00 5.00 20
All 21.45 46.55 22.91 8.73 0.36 275
Overall AVG/Total 20.27 48.66 21.21 8.68 1.18 1268
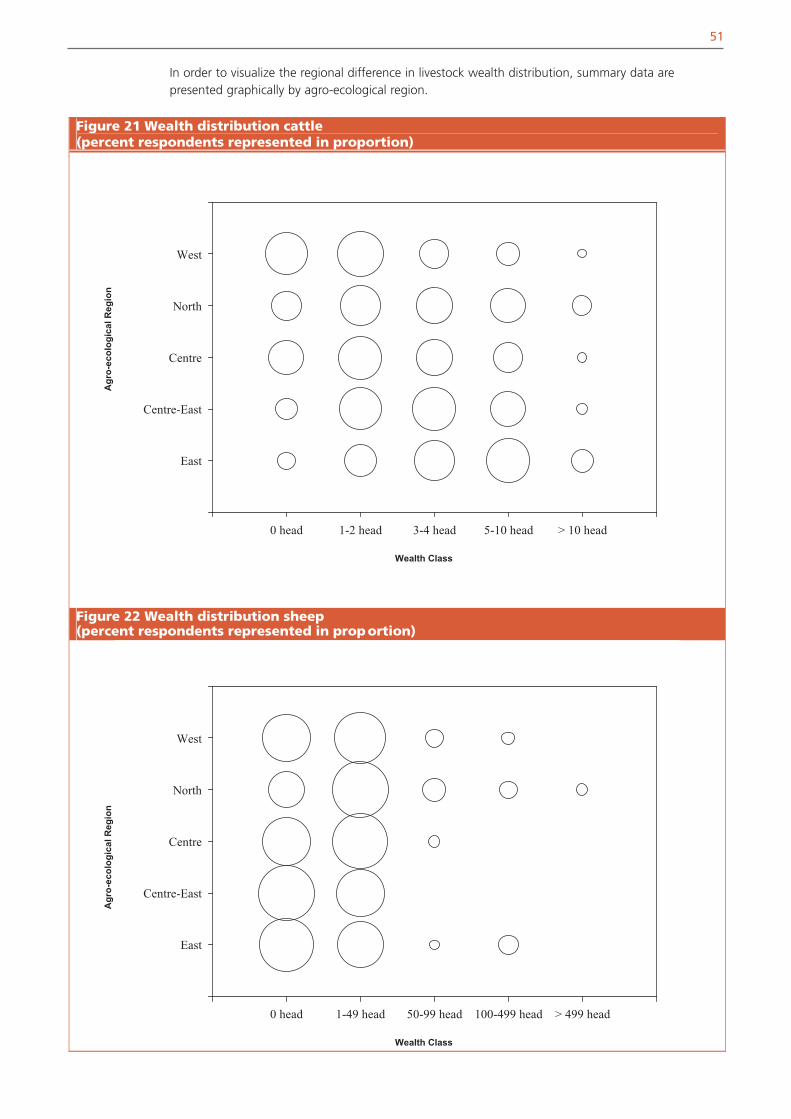
51
In order to visualize the regional difference in livestock wealth distribution, summary data arepresented graphically by agro-ecological region.
Figure 21 Wealth distribution cattle(percent respondents represented in proportion)
Wealth Class
0 head 1-2 head 3-4 head 5-10 head > 10 head
East
Centre-East
Centre
North
West
Figure 22 Wealth distribution sheep(percent respondents represented in proportion)
Wealth Class
0 head 1-49 head 50-99 head 100-499 head > 499 head
East
Centre-East
Centre
North
West
Agr
o-ec
olog
ical
Reg
ion
Agr
o-ec
olog
ical
Reg
ion

52
5.3.2 Livestock ManagementLivestock management comprised the following responses: age structures, performance characteristicfor cattle, sheep and goats, herd and flock composition (from Level 2 data) by agro-ecological region,and the culling and herd management policy in these three species.
5.3.2.1 Age structures
photo by: Guerne Bleich

53
Table 20 Age structure in herds and flocks surveyed in Level 2 by Agro-ecological region (percentages of the total herd or flock)
Region Females1-2 years
Females2-3 years
Females 3-4 years
Females > 4 years
Adultmale
Castrated male
Cattle
East 22.6 17.1 9.2 14.3 29.0 5.6 5.9Centre-East 18.1 14.6 11.5 18.5 19.7 3.5 5.9
Centre 18.4 12.6 7.2 15.9 27.8 15.0 7.4
North 22.4 9.3 5.4 11.8 26.2 4.4 19.3
West 22.5 7.9 20.7 22.0 14.4 6.9 17.6
Sheep
East 29.4 16.3 21.5 21.7 11.0 2.0 0.6Centre-East 24.8 9.7 25.5 21.4 8.0 9.2 0.7Centre 24.8 12.6 21.4 21.7 11.1 4.1 6.3North 19.4 11.9 23.2 16.0 13.0 2.5 0.8West 28.3 18.8 21.5 19.4 6.5 2.5 4.0
Goats
East 39.4 17.8 18.2 16.9 7.6 1.7Centre-East
18.4 25.2 28.2 21.8 2.0 5.1 0.3
Centre 33.0 11.9 25.8 18.4 11.6 2.0
North 29.6 12.2 23.6 16.7 6.2 5.2 1.1
West 33.4 15.2 22.5 17.2 6.3 2.7 4.0
Donkeys
East 17.6 5.7 10.8 26.5 18.7 24.9 3.4Centre-East 4.5 0.8 4.5 17.5 41.7 3.0
Centre 4.1 1.6 4.2 15.7 17.2 46.4 4.7
North 6.3 4.2 4.2 11.7 35.4 34.8 0.9
West 8.2 3.8 5.9 15.0 27.1 18.9 22.0
Camels*
4.3 11.0 9.3 10.4 31.7 28.0 2.7
Horses* Males Females Males Females
Younger than 1 year Older than 1 year
4.51 7.09 38.81 49.59
*Averages for all regions
Younger< 1 year
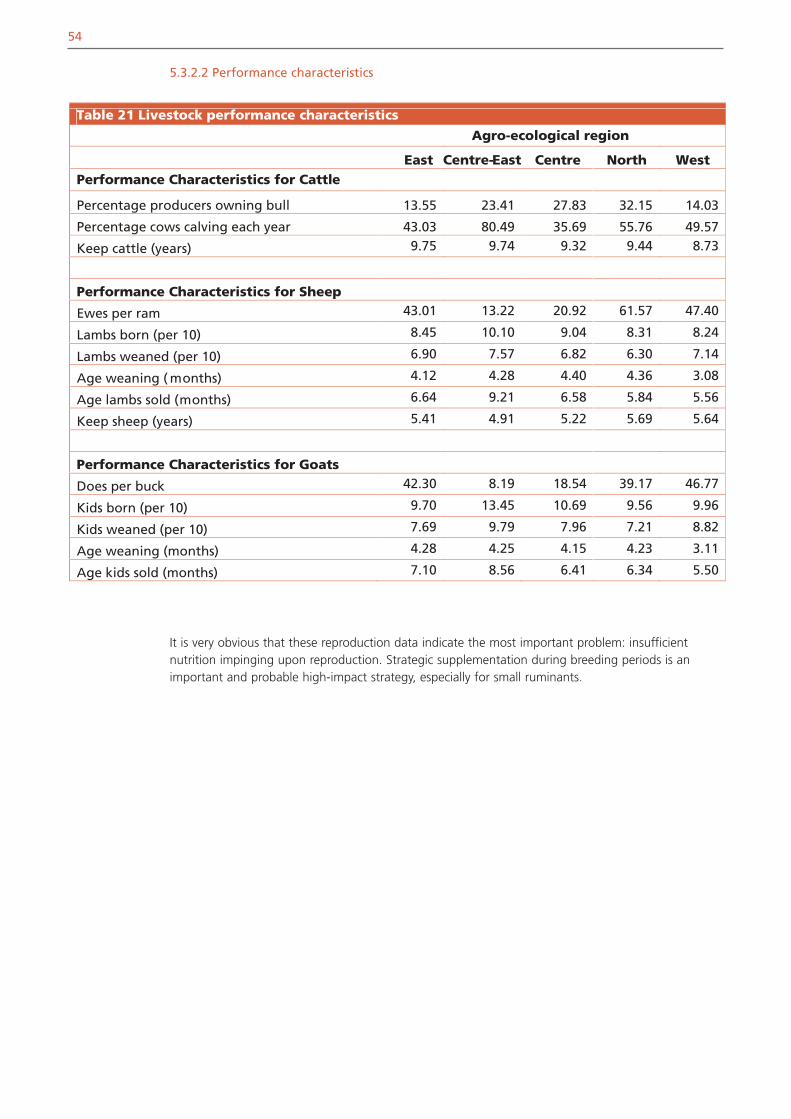
54
5.3.2.2 Performance characteristics
Table 21 Livestock performance characteristics
Agro-ecological region
East East Centre North WestPerformance Characteristics for Cattle
Percentage producers owning bull 13.55 23.41 27.83 32.15 14.03
Percentage cows calving each year 43.03 80.49 35.69 55.76 49.57
Keep cattle (years) 9.75 9.74 9.32 9.44 8.73
Performance Characteristics for Sheep
Ewes per ram 43.01 13.22 20.92 61.57 47.40
Lambs born (per 10) 8.45 10.10 9.04 8.31 8.24
Lambs weaned (per 10) 6.90 7.57 6.82 6.30 7.14
Age weaning ( months) 4.12 4.28 4.40 4.36 3.08
Age lambs sold (months) 6.64 9.21 6.58 5.84 5.56
Keep sheep (years) 5.41 4.91 5.22 5.69 5.64
Performance Characteristics for Goats
Does per buck 42.30 8.19 18.54 39.17 46.77
Kids born (per 10) 9.70 13.45 10.69 9.56 9.96
Kids weaned (per 10) 7.69 9.79 7.96 7.21 8.82
Age weaning (months) 4.28 4.25 4.15 4.23 3.11
Age kids sold (months) 7.10 8.56 6.41 6.34 5.50
Centre-
It is very obvious that these reproduction data indicate the most important problem: insufficientnutrition impinging upon reproduction. Strategic supplementation during breeding periods is animportant and probable high-impact strategy, especially for small ruminants.
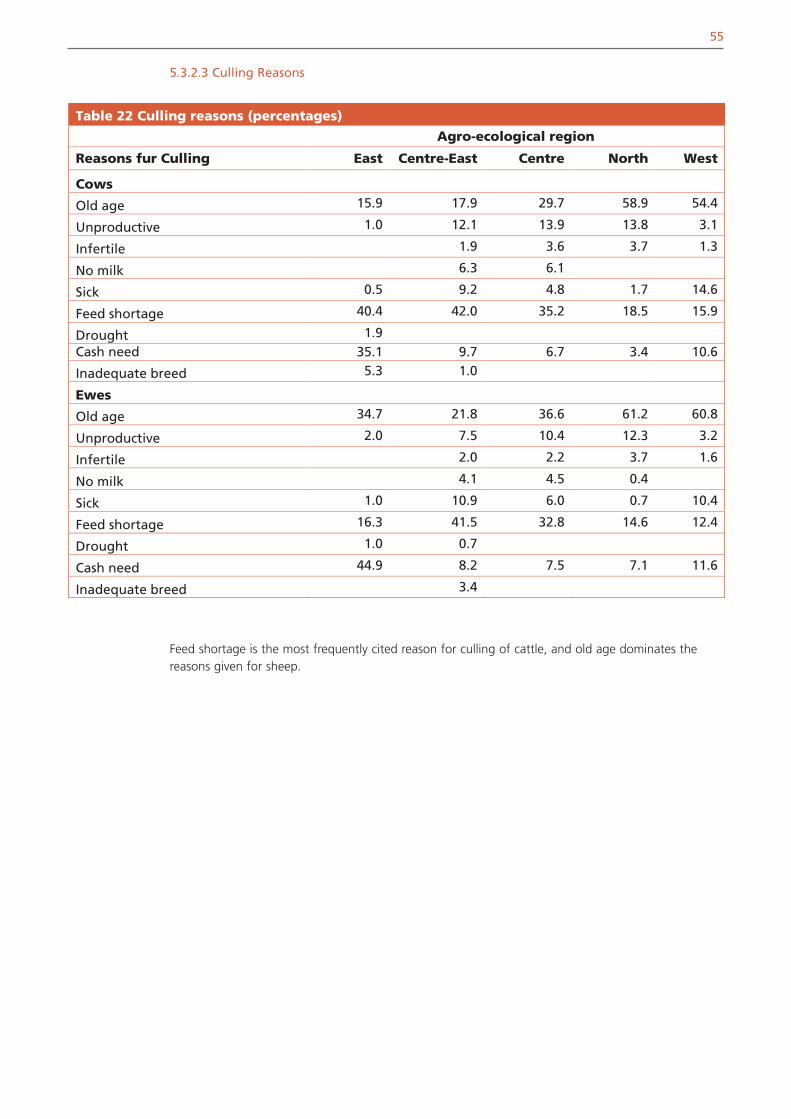
55
5.3.2.3 Culling Reasons
Table 22 Culling reasons (percentages)
Agro-ecological region
Reasons fur Culling East Centre-East Centre North West
Cows
Old age 15.9 17.9 29.7 58.9 54.4
Unproductive 1.0 12.1 13.9 13.8 3.1
Infertile 1.9 3.6 3.7 1.3
No milk 6.3 6.1
Sick 0.5 9.2 4.8 1.7 14.6
Feed shortage 40.4 42.0 35.2 18.5 15.9
Drought 1.9Cash need 35.1 9.7 6.7 3.4 10.6
Inadequate breed 5.3 1.0
Ewes
Old age 34.7 21.8 36.6 61.2 60.8
Unproductive 2.0 7.5 10.4 12.3 3.2
Infertile 2.0 2.2 3.7 1.6
No milk 4.1 4.5 0.4
Sick 1.0 10.9 6.0 0.7 10.4
Feed shortage 16.3 41.5 32.8 14.6 12.4
Drought 1.0 0.7
Cash need 44.9 8.2 7.5 7.1 11.6
Inadequate breed 3.4
Feed shortage is the most frequently cited reason for culling of cattle, and old age dominates thereasons given for sheep.

56
5.3.2.4 Livestock herd management and sales policy
Table 23 Livestock which are sold first (percentages)
Agro-ecological regionEast Centre-East Centre North West
Species
Cattle 40.0 62.4 41.4 36.5 30.1
Sheep 7.1 2.5 17.7 30.9 19.9
Goat 2.9 4.5 3.9 24.4 10.5
Other 3.3 1.6
Not specified 50.0 30.7 37.0 4.9 37.9
Sex
Male 75.8 41.1 20.4 7.5 18.4
Female 3.8 4.5 6.6 17.9 21.1
Not specified 20.4 54.5 72.9 74.6 60.5
Age
Sub Adult 5.4 18.3 16.6 8.8 3.9
Adult 16.3 27.7 38.7 48.9 71.5
Not specified 78.3 54.0 44.8 42.3 24.6
Performance
Producing 1.7 5.0 8.3 3.3 8.2
Not producing 7.5 37.1 34.3 1.3 5.9
Not specified 90.8 57.9 57.5 95.4 85.9

57
Table 24 Livestock which are kept under all circumstances (percentages)
Agro-ecological region
Species
Cattle 49.8 80.8 72.7 60.3 27.0
Sheep 5.1 0.5 2.2 32.3 6.6
Goat 2.5 3.5 4.9 1.3 12.7
Other 0.4 4.2 16.6
Not specified 42.2 15.2 20.2 1.9 37.1
Sex
Male 0.4 1.5 12.6 8.7 2.7
Female 97.5 97.5 82.0 56.5 52.9
Not specified 2.1 1.0 5.5 34.8 44.4
Age
Sub adult 4.2 6.0 0.3 31.3
Adult 94.1 98.5 89.1 65.2 46.7
Not specified 1.7 1.5 4.9 34.5 22.0
Performance
Producing 39.7 66.7 66.7 32.6 42.5
Not producing 0.8 0.5
Not specified 59.5 32.8 33.3 67.4 57.5
East Centre-East Centre North West
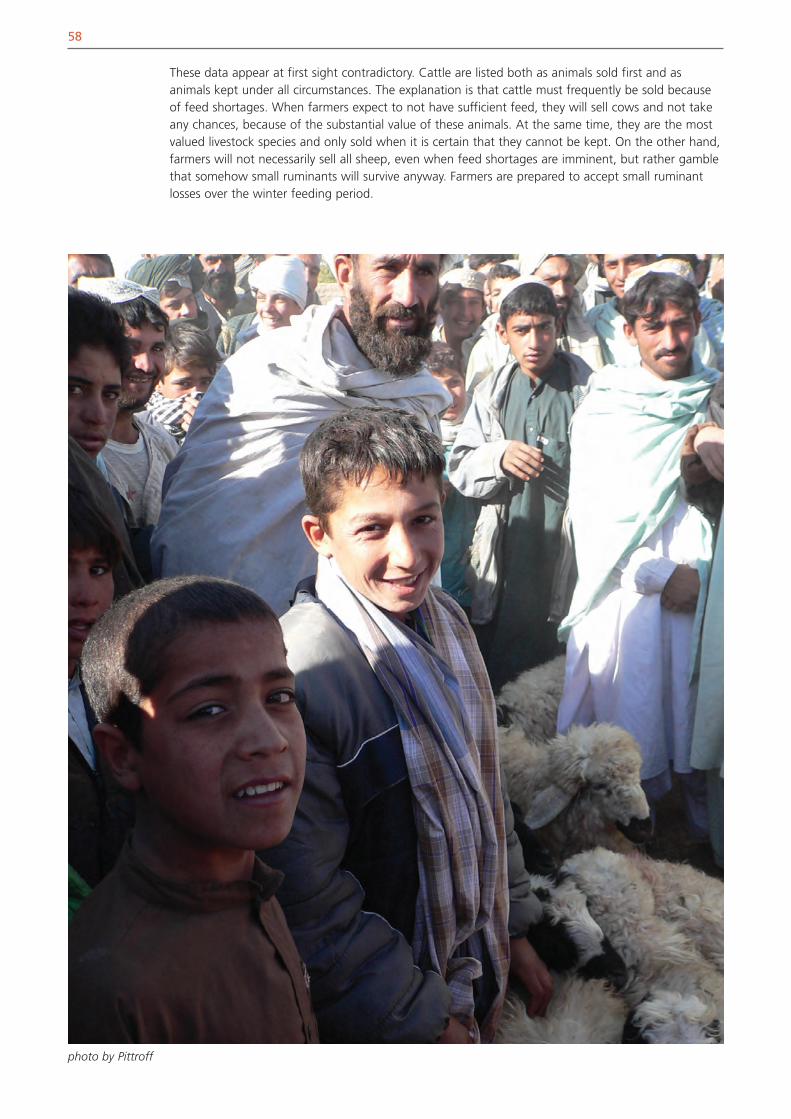
58
These data appear at first sight contradictory. Cattle are listed both as animals sold first and asanimals kept under all circumstances. The explanation is that cattle must frequently be sold becauseof feed shortages. When farmers expect to not have sufficient feed, they will sell cows and not takeany chances, because of the substantial value of these animals. At the same time, they are the mostvalued livestock species and only sold when it is certain that they cannot be kept. On the other hand,farmers will not necessarily sell all sheep, even when feed shortages are imminent, but rather gamblethat somehow small ruminants will survive anyway. Farmers are prepared to accept small ruminantlosses over the winter feeding period.
photo by Pittroff

59
5.3.3 MarketsIn this segment, data on comparative advantages of species and animal categories in the market,reasons for sale (prices, buyer behaviour), distance to market, and buyer properties are summarised.
5.3.3.1 Livestock sales – priority categories and reasons
Table 25 Sale of livestock (percentages)
Agro-ecological region
EastCentre-
East Centre North West
Sell calves* 33.1 75.4 39.9 35.3 60.0
Sell cattle* 27.1 70.1 43.8 31.4 58.9
Sell animals for feed 19.1 32.7 25.5 37.2 48.6
Sell animals for cash 26.3 50.2 50.0 59.0 60.1
Priority of Selling for:
Feed purchase 45.1 90.6 64.2 72.9 61.6
Cash 54.9 9.4 35.8 27.1 38.4
* Only responses from cattle owners were considered
5.3.3.2 Trading partners for farmers
Table 26 Livestock trading partners for farmers (percentages)
Agro-ecological region
EastCentre-
East Centre North West
Local trader 72.5 60.4 83.8 74.1 82.6
Regional trader 18.4 23.4 7.0 17.0 9.1
Foreign trader 0.4 4.3
Butcher 3.4 4.9
Bazaar 1.1 0.3
Different types 8.6 16.2 3.8 5.1 3.4
5.3.3.3 Distance to markets
Table 27 Distance to markets (hours)
Agro-ecological region
EastCentre-
East Centre North West
Selling animal 2.11 1.90 2.86 2.28 1.90
Selling wool 1.84 1.96 2.62 1.83 1.77
Selling milk 1.06 1.81 2.46 1.45 1.43
Buying feed 2.18 2.03 2.93 2.09 1.81

60
5.3.3.4 Sales decisions
Livestock producers were asked about current market experiences compared with the year before.Note that the question on prices was triangulated, asking the same question once in the animalcategory (‘Prices Higher’), and once in the price category (‘Price Increased’). There are some numericaldifferences in the answers, but it is obvious that all responses were optimistic and indicative ofstrongly improved market prospects.
Table 28 Market changes from 2001/2 to 2002/3 (percentages)
Agro-ecological region
EastCentre-
East Centre North West
Cattle
Prices higher 67.4 94.7 93.5 88.3 88.1
Earned more money 27.1 42.2 28.8 77.4 55.7
Sold more animals 14.4 34.2 35.9 11.0 11.9
Price Increased 94.9 98.4 98.0 95.1 98.4
More buyers 23.0 21.8 36.5 65.0 15.1
Sheep
Prices higher 73.1 85.1 88.0 85.3 87.8
Earned more money 49.6 31.0 22.2 76.7 61.5
Sold more animals 27.7 34.5 43.6 14.7 13.5
Price Increased 94.1 89.7 94.9 90.7 98.7
More buyers 55.4 21.5 48.6 58.2 17.9
Goats
Prices higher 82.1 85.7 91.5 87.7 87.8
Earned more money 47.3 17.1 28.7 77.0 57.1
Sold more animals 25.0 54.3 33.0 11.1 10.2
Price Increased 96.4 85.7 92.6 91.9 98.5
More buyers 37.6 12.9 30.7 55.0 18.4

61
Table 29 Which category sells best? (percentages)
Agro-ecological region
East Centre-East Centre North West
Cattle Calves 39.0 14.4 19.4 37.7 77.2
Cows 56.0 83.9 74.8 26.2 12.7
Males 4.0 0.6 3.9 34.6 7.6
Total (n) 100 174 155 260 197
Sheep Lambs 23.1 0.7 2.2 3.7 10.0
Females 33.9 60.7 59.0 21.9 38.1
Males 18.2 10.7 3.6 26.3 1.3
Big Size 24.0 26.4 33.1 46.7 48.5
Total (n) 121 140 139 270 239
Goats Lambs 19.8 1.0 0.9 1.9 38.0
Females 48.4 81.0 66.1 60.1 34.1
Males 26.4 1.0 0.0 10.8 0.5
Big Size 4.4 15.0 30.4 24.7 25.0
Total (n) 91 100 112 158 208
photo by Pittroff

5.4 WOMEN LIVESTOCK SURVEY5.4.1 Introduction
A total of 2.899 interviews were conducted by a female enumerator team assembled and trained bythe FAO Mission and the Ministry of Agriculture and Livestock. Interviews were conducted in Marchand April of 2003. The interviewed females from the rural households identified themselves mostly as‘Housewife’ and ‘Mother’, but also as ‘Head of Household’, ‘Mother in law’, or ‘Daughter in law’. Agroup of enumerators operated in each of the provinces visited. Enumerators did not work in morethan one province; however, they worked in several districts within their province. Some problemswith data quality assurance have to be suspected for a subsection of the survey in Kandahar province.Data from Kandahar province substantially diverging from national averages should be treated withcaution.
The survey comprises three sections: livestock statistics, information on division of labour in the familyand decision making, and inquiries into problems, possible improvements and perceived constraints tothe improvement of the livestock production enterprise of the respondents. The surveyed populationincludes mostly married women and, in a much smaller proportion, female heads of household. Themajority of respondents were the decision making female members of the household and a smallernumber those with less authority (daughters in law, daughters). The information about decisionmaking and work responsibilities was considered to be of highest importance. There is currently noreliable information available how work and decision making is divided between men, women andchildren. The data reported here are unique and of great relevance for developing interventionsspecifically designed to address gender issues in Afghanistan.
It was important to obtain a picture of the wealth distribution for women’s livestock resources.Accordingly, after determination of true zero responses, the complete data set was filtered toeliminate all respondents that did not have any animals of the species for which the followingstatistics are computed. That is, the following data do not represent global averages, but describestock distribution for those respondents that did indeed own stock of the species in question.However, global averages including zero stock respondents from this survey are used elsewhere in theanalysis of the Afghan Livestock Census data.
The absolute numbers and proportion of interviewed female farmers owning stock was summarisedfor all livestock species.
62
photo by Pittroff

63
* Tutum Dara is part of the Chaharikar district** Zhiray is part of the Panjwayi district
Table 30 Family size in the women livestock survey
Province District Average STD
Nangarhar Bati Kot 11.92 6.44
Bihsud 11.06 5.49
Shewa 9.61 3.95
All 10.90 5.49
Kabul Bagrami 10.51 4.69
Musayi 10.66 4.40
Paghman 9.83 4.85
All 10.35 4.66
Logar Puli Alam 11.86 8.14
Parwan Chaharikar 8.36 3.17
Tutum Dara* 8.58 3.53
All 8.46 3.35
Badakhshan Argo 8.30 2.94
Baharak 8.28 2.52
All 8.29 2.73
Balkh Chimtal 8.16 3.71
Dihdadi 9.04 3.45
Nahri Shahi 9.25 5.13
All 8.61 3.99
Kandahar Arghandab 12.68 5.09
Daman 13.35 4.43
Dand 12.60 4.58
Panjwayi 13.91 5.40
13.63 4.28
All 13.33 4.89
Overall Average 10.18 5.00
Zhiray**

64
In order to understand the following analyses, it is important to summarize ownership of importantlivestock species per province. Of the small ruminant owners, only minorities had either goats but nocattle (185, or 27 percent) or sheep but no cattle (163, or 18.9 percent). Although the differencebetween sheep and goat ownership for those who did not own cattle was small, goats are morefrequent among those who do not own cattle. The results confirm Level 1 and Level 2 data: the mostimportant livestock species in Afghanistan is cattle.
Table 31 Distribution of respondents in the women livestock survey by family status
Household Position Number Percentage
Housewife 1735 59.85
Mother 422 14.56
Mother in Law 172 5.93
Grandmother 12 0.41
Head of family 186 6.42
Widow 1 0.03
Daughter in Law 227 7.83
Daughter 117 4.04
Unknown 27 0.93
Total 2899
Information about work responsibility and decision making authority was asked separately for thethree main livestock species, cattle, sheep and goats. Similar information about chicken had beenearlier collected with larger number of village women and was therfore not included in the questions.Answers were only analysed for those respondents who actually owned the concerned livestockspercies.
Table 32 Ownership of livestock species in the women livestock survey(numbers of respondents owning the species listed)
Livestock speciesProvince Cattle Sheep Goats Poultry Donkeys Camel BuffalosNangarhar 608 47 126 584 276 55Kabul 403 101 62 367 244Logar 130 60 13 113 57 1Parwan 361 51 20 225 261Badakhshan 262 178 201 199 262 1Balkh 442 180 156 431 385 46 1Kandahar 302 244 111 378 145 26 1Total 2508 861 689 2297 1630 74 57

65
5.4.2 Work Responsibilities5.4.2.1 Cattle
Table 33 Work responsibility – feeding cattle (percentages of respondents )
Province No Response
Women Men Children Womenand Men
Women/ Children
Total Respondents
Nangarhar 0.33 73.85 18.09 7.40 0.16 0.16 608
Kabul 65.51 14.89 19.60 403
Logar 1.54 49.23 16.15 33.08 130
Parwan 1.39 63.16 14.96 20.50 361
Badakhshan 53.44 41.60 4.96 262
Balkh 0.90 65.61 29.86 2.94 0.45 0.23 442
Kandahar 0.33 99.01 0.66 0.33 302Overall Average/Total 0.56 69.14 19.46 10.65 0.12 0.08 2508
Table 34 Work responsibility – grazing cattle (percentages of respondents )
Province No Response
Women Men Children Womenand Men
Women/Children
Total Respondents
Nangarhar 58.22 4.28 10.03 27.30 0.16 608
Kabul 7.44 11.91 13.90 66.75 403
Logar 10.00 20.77 3.85 65.38 130
Parwan 1.66 16.07 13.57 68.70 361
Badakhshan 5.73 41.98 52.29 262
Balkh 1.58 24.43 45.70 27.83 0.23 0.23 442
Kandahar 0.33 1.66 21.85 76.16 302Overall Average/Total
16.39 11.44 21.89 50.16 0.08 0.04 2508
Table 35 Work responsibility – watering cattle (percentages of respondents )
ProvinceNo
ResponseWomen Men Children Women
and MenWomen/ Children
Total Respondents
Nangarhar 0.66 75.33 14.64 9.05 0.16 0.16 608
Kabul 0.25 56.82 13.40 29.53 403
Logar 0.77 41.54 6.92 50.77 130
Parwan 1.39 60.11 12.47 26.04 361
Badakhshan 27.10 40.08 32.82 262
Balkh 0.90 65.84 29.64 3.17 0.45 442
Kandahar 0.99 88.74 5.30 4.97 302Overall Average/Total 0.72 63.32 17.90 17.90 0.12 0.04 2508

66
Table 36 Work responsibility – tending young cattle (percentages of respondents )
Province No Response
Women Men Children Women and Men
Women/ Children
Total Respondents
Nangarhar 4.77 90.30 3.45 1.32 0.16 608
Kabul 2.98 95.29 0.74 0.74 0.25 403
Logar 20.00 61.54 3.08 15.38 130
Parwan 41.55 52.63 1.39 4.43 361
Badakhshan 3.82 93.13 2.67 0.38 262
Balkh 10.18 70.81 18.33 0.68 442
Kandahar 2.65 97.02 0.33 302Overall Average/Total
11.16 81.86 4.86 2.03 0.04 0.04 2508
Table 37 Work responsibility – milking cattle (percentages of respondents )
Province No Response
Women Men Children Women and Men
Total Respondents
Nangarhar 6.58 91.28 1.97 0.16 608
Kabul 5.46 94.29 0.25 403
Logar 11.54 86.92 0.77 0.77 130
Parwan 46.26 53.74 361
Badakhshan 3.44 95.42 1.15 262
Balkh 12.44 80.54 6.79 0.23 442
Kandahar 13.25 86.75 302Overall Average/Total
13.88 84.13 1.87 0.04 0.08 2508
Table 38 Work responsibility – treating cattle (percentages of respondents )
ProvinceNo
Response Women Men ChildrenWomen
and Men
Women/ Children
Total Respondents
Nangarhar 1.32 4.61 92.76 1.15 0.16 608
Kabul 0.50 11.17 86.35 1.99 403
Logar 3.08 36.92 60.00 130
Parwan 1.39 20.50 72.30 5.26 0.28 0.28 361
Badakhshan 22.90 75.95 1.15 262
Balkh 1.13 10.86 86.88 0.68 0.45 442
Kandahar 0.66 88.41 10.93 302Overall Average/Total 1.04 22.73 74.44 1.59 0.16 0.04 2508

67
5.4.2.2 Sheep
Table 39 Work responsibility – feeding sheep (percentages of respondents )
ProvinceNo
Response Women Men ChildrenWomen
and Men
Women/Children
Menand
Children
Total Respondents
Nangarhar 6.38 57.45 19.15 14.89 2.13 47
Kabul 0.99 58.42 13.86 25.74 0.99 101
Logar 41.67 11.67 46.67 60
Parwan 9.80 64.71 13.73 11.76 51
Badakhshan 38.76 56.74 4.49 178
Balkh 8.33 38.89 48.89 3.89 180
Kandahar 0.41 94.67 1.23 2.87 0.41 0.41 244Overall Average/Total 2.90 59.70 26.60 10.34 0.23 0.12 0.12 861
Table 40 Work responsibility – grazing sheep (percentages of respondents )
Province No Response
Women Men Children Men andChildren
Total Respondents
Nangarhar 57.45 6.38 36.17 47
Kabul 6.93 15.84 17.82 59.41 101
Logar 3.33 13.33 5.00 78.33 60
Parwan 9.80 7.84 19.61 62.75 51
Badakhshan 2.81 57.30 39.89 178
Balkh 9.44 17.22 56.67 16.11 0.56 180
Kandahar 1.64 0.82 15.98 81.56 244Overall Average/Total
7.20 7.67 32.17 52.85 0.12 861
Table 41 Work responsibility – watering sheep (percentages of respondents )
ProvinceNo Response Women Men Children Total
Respondents
Nangarhar 6.38 59.57 14.89 19.15 47
Kabul 0.99 49.50 13.86 35.64 101
Logar 30.00 6.67 63.33 60
Parwan 9.80 62.75 13.73 13.73 51
Badakhshan 16.29 57.30 26.40 178
Balkh 9.44 37.78 48.33 4.44 180
Kandahar 0.41 88.52 2.46 8.61 244
Overall AVG/Total 3.14 51.22 26.36 19.28 861

68
Table 42 Work responsibility – tending young sheep(percentages of respondents )
ProvinceNo Response Women Men Children Women/
ChildrenTotal
Respondents
Nangarhar 34.04 63.83 2.13 47
Kabul 21.78 75.25 0.99 0.99 0.99 101
Logar 28.33 48.33 1.67 21.67 60
Parwan 70.59 27.45 1.96 51
Badakhshan 0.56 53.37 33.71 12.36 178
Balkh 10.00 46.67 41.67 1.67 180
Kandahar 26.64 72.13 1.23 244Overall Average/Total
20.33 58.54 16.49 4.53 0.12 861
Table 43 Work responsibility – milking sheep (percentages of respondents )
Province No Response
Women Men Children Women and Men
Total Respondents
Nangarhar 57.45 42.55 47
Kabul 20.79 78.22 0.99 101
Logar 28.33 71.67 60
Parwan 70.59 29.41 51
Badakhshan 0.56 97.19 2.25 178
Balkh 22.22 56.11 20.00 0.56 1.11 180
Kandahar 73.36 26.23 0.41 244Overall Average/Total 37.28 57.49 4.88 0.12 0.23 861
Table 44 Work responsibility – treating sheep(percentages of respondents )
Province No Response Women Men Children Total Respondents
Nangarhar 8.51 4.26 82.98 4.26 47
Kabul 0.99 15.84 79.21 3.96 101
Logar 3.33 33.33 63.33 60
Parwan 9.80 37.25 50.98 1.96 51
Badakhshan 0.56 21.35 77.53 0.56 178
Balkh 10.00 10.56 78.89 0.56 180
Kandahar 0.82 88.11 11.07 244Overall Average/Total 3.83 38.21 56.91 1.05 861

69
5.4.2.3 Goats
Table 45 Work responsibility – feeding goats (percentages of respondents )
Province
No Response
Women Men Children Women/ Children
Men andChildren
Total Respondents
Nangarhar 7.94 77.78 7.14 7.14 126
Kabul 11.29 56.45 9.68 20.97 1.61 62
Logar 15.38 46.15 15.38 23.08 13
Parwan 25.00 50.00 10.00 15.00 20
Badakhshan 0.50 59.20 35.32 4.98 201
Balkh 6.41 44.23 44.23 4.49 0.64 156
Kandahar 1.80 92.79 1.80 3.60 111Overall Average/Total
5.37 63.86 23.37 7.11 0.15 0.15 689
Table 46 Work responsibility – grazing goats (percentages of respondents )
Province No Response
Women Men Children Men andChildren
Total Respondents
Nangarhar 60.32 3.97 4.76 30.16 0.79 126
Kabul 12.90 17.74 9.68 59.68 62
Logar 15.38 30.77 7.69 46.15 13
Parwan 25.00 10.00 25.00 40.00 20
Badakhshan 0.50 5.97 39.30 54.23 201
Balkh 6.41 23.72 55.13 14.74 156
Kandahar 2.70 2.70 7.21 87.39 111Overall Average/Total 15.24 10.74 27.72 46.15 0.15 689
Table 47 Work responsibility – watering goats (percentages of respondents )
Province No Response Women Men Children Men andChildren
Total Respondents
Nangarhar 7.94 73.81 4.76 12.70 0.79 126
Kabul 11.29 58.06 9.68 20.97 62
Logar 15.38 38.46 7.69 38.46 13
Parwan 25.00 45.00 10.00 20.00 20
Badakhshan 0.50 24.38 39.30 35.82 201
Balkh 6.41 44.87 43.59 5.13 156
Kandahar 1.80 85.59 1.80 10.81 111Overall Average/Total 5.37 51.81 23.80 18.87 0.15 689

70
Table 48 Work responsibility – tending young goats (percentages of respondents )
Province No Response
Women Men Children Total Respondents
Nangarhar 20.63 76.98 0.79 1.59 126
Kabul 12.90 83.87 3.23 62
Logar 30.77 53.85 7.69 7.69 13
Parwan 60.00 40.00 20
Badakhshan 0.50 72.64 13.93 12.94 201
Balkh 10.26 50.64 37.82 1.28 156
Kandahar 9.01 88.29 1.80 0.90 111Overall Average/Total 11.18 70.68 13.50 4.64 689
Table 49 Work responsibility – milking goats (percentages of respondents )
Province No Response Women Men Children Total Respondents
Nangarhar 30.95 67.46 0.79 0.79 126
Kabul 11.29 88.71 62
Logar 46.15 53.85 13
Parwan 60.00 40.00 20
Badakhshan 0.50 98.01 1.49 201
Balkh 25.00 56.41 18.59 156
Kandahar 11.71 87.39 0.90 111Overall Average/Total 16.98 77.94 4.93 0.15 689
Table 50 Work responsibility – treating goats (percentages of respondents )
Province No Response Women Men Children Women
and MenWomen/ Children
TotalRespondents
Nangarhar 10.32 1.59 85.71 2.38 126
Kabul 11.29 16.13 70.97 1.61 62
Logar 15.38 46.15 38.46 13
Parwan 25.00 15.00 60.00 20
Badakhshan 0.50 42.79 56.72 201
Balkh 7.05 16.67 74.36 1.28 0.64 156
Kandahar 1.80 90.09 8.11 111Overall Average/Total
5.95 33.82 59.22 0.58 0.29 0.15 689

71
5.4.3 Decision Making5.4.3.1 Cattle
Table 51 Decision making cattle – Purchasing animals(percentages of respondents )
Province No Response Women Men Women and Men
TotalRespondents
Nangarhar 0.16 30.26 69.57 608
Kabul 0.25 51.36 48.39 403
Logar 1.54 48.46 50.00 130
Parwan 0.55 46.81 52.63 361
Badakhshan 48.47 51.53 262
Balkh 2.04 5.88 91.86 0.23 442
Kandahar 0.66 22.52 76.82 302Overall Average/Total
0.68 33.65 65.63 0.04 2508
Table 52 Decision making cattl e – Purchasing feed(percentages of respondents )
Province No Response Women Men Women and Men
Total Respondents
Nangarhar 0.16 24.51 75.33 608
Kabul 0.25 46.15 53.60 403
Logar 0.77 49.23 50.00 130
Parwan 0.55 46.54 52.91 361
Badakhshan 32.82 67.18 262
Balkh 2.04 5.88 91.86 0.23 442
Kandahar 0.66 15.56 83.77 302Overall Average/Total
0.64 28.95 70.37 0.04 2508
Table 53 Decision making cattle – Selling animals(percentages of respondents )
Province No Response Women Men Total Respondents
Nangarhar 0.16 30.26 69.57 608
Kabul 0.74 41.69 57.57 403
Logar 50.00 50.00 130
Parwan 1.11 45.71 53.19 361
Badakhshan 72.90 27.10 262
Balkh 2.04 5.43 92.53 442
Kandahar 0.66 48.34 50.99 302
Overall Average/Total 0.76 37.60 61.64 2508

72
Table 54 Decision making cattle – Selling milk(percentages of respondents )
Province No Response Women Men Women and Men
Total Respondents
Nangarhar 41.28 44.08 14.64 608
Kabul 8.68 86.10 5.21 403
Logar 66.92 30.00 3.08 130
Parwan 44.88 49.58 5.54 361
Badakhshan 98.47 1.53 262
Balkh 9.50 21.04 69.23 0.23 442
Kandahar 46.36 42.38 11.26 302Overall Average/Total
28.59 52.31 19.06 0.04 2508
Table 55 Decision making cattle – Treating animals (percentages of respondents )
Province No Response
Women Men Children Women and Men
Total Respondents
Nangarhar 1.64 22.86 75.16 0.33 608
Kabul 0.74 36.72 62.53 403
Logar 0.77 58.46 40.77 130
Parwan 0.55 25.21 73.96 0.28 361
Badakhshan 42.37 57.63 262
Balkh 2.26 5.88 91.86 442
Kandahar 0.99 87.42 11.59 302Overall Average/Total
1.16 34.09 64.63 0.04 0.08 2508
photo by Reynolds

73
5.4.3.2 Sheep
Table 56 Decision making sheep – Purchasing animals(percentages of respondents )
Province No Response Women Men Total Respondents
Nangarhar 6.38 25.53 68.09 47
Kabul 0.99 51.49 47.52 101
Logar 1.67 43.33 55.00 60
Parwan 1.96 52.94 45.10 51
Badakhshan 50.56 49.44 178
Balkh 7.78 5.00 87.22 180
Kandahar 0.82 12.70 86.48 244
Overall Average/Total 2.56 28.69 68.76 861
Table 57 Decision making sheep – Purchasing feed(percentages of respondents )
Province No Response Women Men Total Respondents
Nangarhar 6.38 19.15 74.47 47
Kabul 0.99 53.47 45.54 101
Logar 1.67 45.00 53.33 60
Parwan 1.96 52.94 45.10 51
Badakhshan 32.58 67.42 178
Balkh 7.78 4.44 87.78 180
Kandahar 0.82 11.07 88.11 244
Overall Average/Total 2.56 24.39 73.05 861
Table 58 Decision making sheep – Selling animals(percentages of respondents )
Province No Response Women Men Total Respondents
Nangarhar 6.38 29.79 63.83 47
Kabul 1.98 45.54 52.48 101
Logar 3.33 40.00 56.67 60
Parwan 1.96 52.94 45.10 51
Badakhshan 65.73 34.27 178
Balkh 7.78 3.89 88.33 180
Kandahar 2.05 28.28 69.67 244
Overall Average/Total 3.14 35.31 61.56 861

74
Table 59 Decision making sheep – Selling milk (percentages of respondents )
Province No Response Women Men Womenand Men
Total Respondents
Nangarhar 80.85 6.38 12.77 47
Kabul 30.69 65.35 2.97 0.99 101
Logar 83.33 16.67 60
Parwan 66.67 25.49 7.84 51
Badakhshan 99.44 0.56 178
Balkh 19.44 8.33 72.22 180
Kandahar 86.48 10.25 3.28 244Overall Average/Total
46.34 35.89 17.65 0.12 861
Table 60 Decision making sheep – Selling wool (percentages of respondents )
Province No Response Women Men Total Respondents
Nangarhar 74.47 2.13 23.40 47
Kabul 46.53 37.62 15.84 101
Logar 91.67 6.67 1.67 60
Parwan 41.18 25.49 33.33 51
Badakhshan 99.44 0.56 178
Balkh 7.78 7.22 85.00 180
Kandahar 70.90 19.26 9.84 244
Overall Average/Total 40.07 34.03 25.90 861
Table 61 Decision making sheep – Treating animals
Province No Response Women Men Women and Men
Total Respondents
Nangarhar 12.77 12.77 72.34 2.13 47
Kabul 0.99 52.48 46.53 101
Logar 3.33 51.67 45.00 60
Parwan 3.92 35.29 60.78 51
Badakhshan 0.56 37.64 61.80 178
Balkh 7.78 4.44 87.78 180
Kandahar 0.82 88.11 11.07 244Overall Average/Total 3.25 46.23 50.41 0.12 861
(percentages of respondents )

75
5.4.3.3 Goats
Table 62 Decision making goats – Purchasing animals
Province No Response Women Men Total Respondents
Nangarhar 15.87 15.87 68.25 126
Kabul 8.06 59.68 32.26 62
Logar 7.69 61.54 30.77 13
Parwan 10.00 50.00 40.00 20
Badakhshan 54.23 45.77 201
Balkh 5.77 6.41 87.82 156
Kandahar 2.70 36.04 61.26 111
Overall Average/Total 5.81 33.96 60.23 689
(percentages of respondents )
Table 63 Decision making goats– Purchasing feed
Province No Response Women Men Total Respondents
Nangarhar 15.87 11.90 72.22 126
Kabul 8.06 56.45 35.48 62
Logar 7.69 53.85 38.46 13
Parwan 10.00 50.00 40.00 20
Badakhshan 38.31 61.69 201
Balkh 5.77 7.05 87.18 156
Kandahar 2.70 29.73 67.57 111
Overall Average/Total 5.81 27.29 66.91 689
(percentages of respondents )
Table 64 Decision making goats – Selling animals
Province No Response Women MenTotal
Respondents
Nangarhar 16.67 18.25 65.08 126
Kabul 8.06 51.61 40.32 62
Logar 7.69 53.85 38.46 13
Parwan 10.00 50.00 40.00 20
Badakhshan 76.62 23.38 201
Balkh 5.77 5.77 88.46 156
Kandahar 2.70 54.95 42.34 111
Overall Average/Total 5.95 42.96 51.09 689
(percentages of respondents )

76
Table 65 Decision making goats – Selling milk
Province No Response Women Men Total Respondents
Nangarhar 81.75 11.90 6.35 126
Kabul 19.35 80.65 62
Logar 92.31 7.69 13
Parwan 65.00 35.00 20
Badakhshan 99.50 0.50 201
Balkh 19.87 8.97 71.15 156
Kandahar 55.86 36.94 7.21 111
Overall Average/Total 33.82 47.61 18.58 689
(percentages of respondents )
Table 66 Decision making goats – Selling fibre
Province No Response Women Men Total Respondents
Nangarhar 88.89 5.56 5.56 126
Kabul 51.61 33.87 14.52 62
Logar 100 13
Parwan 60.00 20.00 20.00 20
Badakhshan 99.50 0.50 201
Balkh 10.26 8.33 81.41 156
Kandahar 67.57 29.73 2.70 111
Overall Average/Total 37.74 40.35 21.92 689
(percentages of respondents )
Table 67 Decision making goats – Treating animals
Province No Response Women Men Womenand Men
Total Respondents
Nangarhar 17.46 8.73 73.02 0.79 126
Kabul 11.29 48.39 40.32 62
Logar 7.69 46.15 46.15 13
Parwan 15.00 30.00 55.00 20
Badakhshan 52.24 47.76 201
Balkh 5.77 5.77 88.46 156
Kandahar 3.60 89.19 7.21 111Overall Average/Total
6.68 38.61 54.57 0.15 689
(percentages of respondents )

77
5.4.3.4 Graphical Summaries
In order to facilitate a comparative view of these findings, summary graphics were compiled.
Figure 24 Work responsibilities in cattle management
0% 20% 40% 60% 80% 100%
Milking Cattle
Tending Young Cattle
Cattle Feeding
Watering Cattle
Treating Cattle
Cattle Grazing
Women Men Children Combined Responsibility No Response
Figure 25 Work responsibilities in sheep management
0% 10% 20% 30% 40% 50% 60% 70% 80% 90% 100%
Sheep Feeding
Tending Young Sheep
Milking Sheep
Watering Sheep
Treating Sheep
Sheep Grazing
Women Men Children Combined Responsibility No Response

78
Figure 26 Work responsibilities in goat management
0% 10% 20% 30% 40% 50% 60% 70% 80% 90% 100%
Milking Goat
Tending Young Goat
Goat Feeding
Watering Goat
Treating Goat
Goat Grazing
Women Men Children Combined Responsibility No Response
Figure 27 Decision making for cattle management
0% 10% 20% 30% 40% 50% 60% 70% 80% 90% 100%
Selling Milk
Selling Animals
Treating Animals
Purchasing Animals
Purchasing Feed
Women Men Both No Response
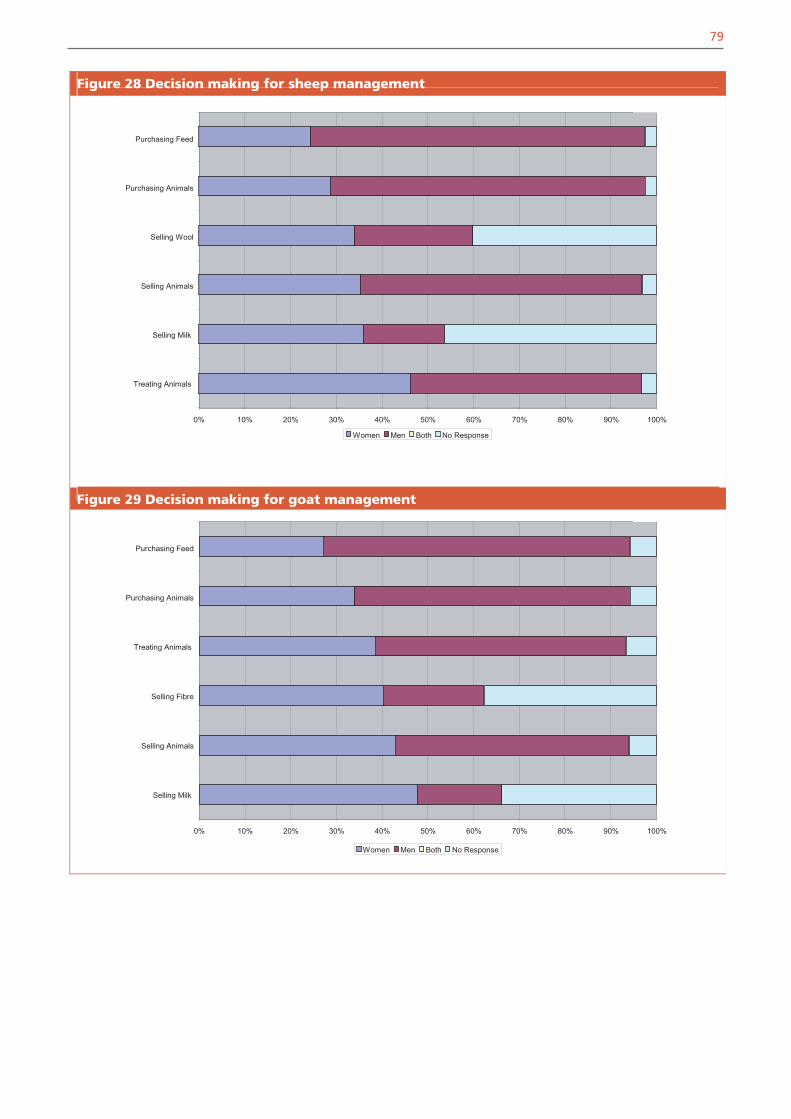
79
Figure 28 Decision making for sheep management
0% 10% 20% 30% 40% 50% 60% 70% 80% 90% 100%
Treating Animals
Selling Milk
Selling Animals
Selling Wool
Purchasing Animals
Purchasing Feed
Women Men Both No Response
Figure 29 Decision making for goat management
0% 10% 20% 30% 40% 50% 60% 70% 80% 90% 100%
Selling Milk
Selling Animals
Selling Fibre
Treating Animals
Purchasing Animals
Purchasing Feed
Women Men Both No Response

80
5.4.4 Goals and Preferences
The Women Livestock Survey attempted to evaluate the most important problems perceived andimprovements desired by the respondents. All women participating in the survey were given theoption to rank specific problems and desired improvements.
In the first question of this Section the respondents were asked from which livestock species theywould like to have more animals, and for what purpose of production (milk, meat, wool and work,where applicable, either for household consumption or for sale). Only one preferred species could belisted, but multiple answers for preferred uses were possible. Respondents were required to decideexclusively whether household consumption or production for sale was the most important use. In allbut some cases for poultry these restrictions were successfully maintained. The answers fromrespondents who selected chickens as their most preferred species for herd expansion were alsomaintained in those cases which were ambiguous for preferred use.
5.4.4.1 Preferred livestock species for herd expansion
5.4.4.1.1 Cattle
The number of respondents who selected cattle as their preferred species for owning more animalswas 1,655. Among these respondents 261 did not presently own cattle.
Table 68 Cattle preferred use: milk (percentages of respondents)
Province No Response (No Preference)
Household Consumption
Sale Total Respondents
Nangarhar 1.53 45.09 53.37 326
Kabul 0.75 26.42 72.83 265
Logar 3.66 74.39 21.95 82
Parwan 16.77 20.00 63.23 155
Badakhshan 99.36 0.64 157
Balkh 2.83 3.89 93.29 283
Kandahar 1.29 33.59 65.12 387
Overall Average/Total 2.96 36.62 60.42 1655
Table 69 Cattle preferred use: work/draft
Province No Response (No Preference) Home Use Rent Total
Respondents
Nangarhar 100 326
Kabul 100 265
Logar 97.56 2.44 82
Parwan 83.23 10.97 5.81 155
Badakhshan 55.41 44.59 157
Balkh 17.31 65.72 16.96 283
Kandahar 99.74 0.26 387
Overall Average/Total 74.62 17.64 7.73 1655
(percentages of respondents )
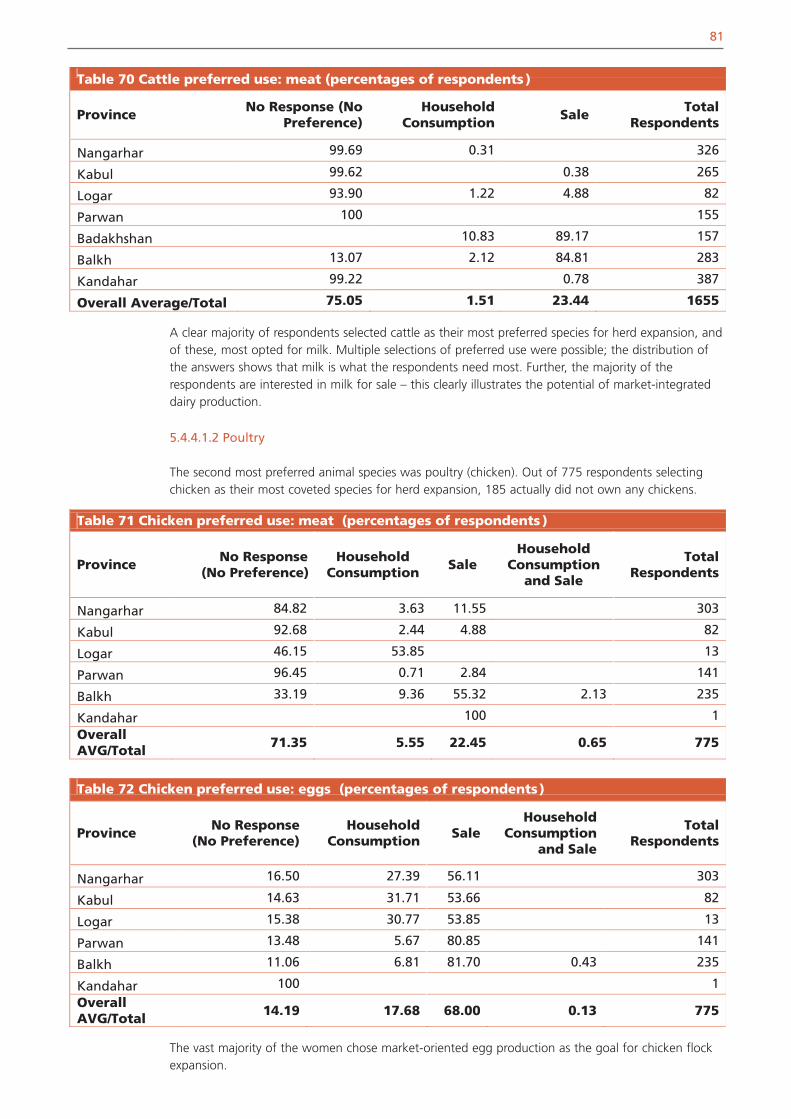
81
A clear majority of respondents selected cattle as their most preferred species for herd expansion, andof these, most opted for milk. Multiple selections of preferred use were possible; the distribution ofthe answers shows that milk is what the respondents need most. Further, the majority of therespondents are interested in milk for sale – this clearly illustrates the potential of market-integrateddairy production.
5.4.4.1.2 Poultry
The second most preferred animal species was poultry (chicken). Out of 775 respondents selectingchicken as their most coveted species for herd expansion, 185 actually did not own any chickens.
Table 71 Chicken preferred use: meat (percentages of respondents )
Province No Response (No Preference)
Household Consumption
SaleHousehold
Consumption and Sale
Total Respondents
Nangarhar 84.82 3.63 11.55 303
Kabul 92.68 2.44 4.88 82
Logar 46.15 53.85 13
Parwan 96.45 0.71 2.84 141
Balkh 33.19 9.36 55.32 2.13 235
Kandahar 100 1Overall AVG/Total
71.35 5.55 22.45 0.65 775
Table 70 Cattle preferred use: meat (percentages of respondents )
Province No Response (No Preference)
Household Consumption
Sale Total Respondents
Nangarhar 99.69 0.31 326
Kabul 99.62 0.38 265
Logar 93.90 1.22 4.88 82
Parwan 100 155
Badakhshan 10.83 89.17 157
Balkh 13.07 2.12 84.81 283
Kandahar 99.22 0.78 387
Overall Average/Total 75.05 1.51 23.44 1655
The vast majority of the women chose market-oriented egg production as the goal for chicken flockexpansion.
Table 72 Chicken preferred use: eggs (percentages of respondents)
Province No Response (No Preference)
Household Consumption Sale
Household Consumption
and Sale
Total Respondents
Nangarhar 16.50 27.39 56.11 303
Kabul 14.63 31.71 53.66 82
Logar 15.38 30.77 53.85 13
Parwan 13.48 5.67 80.85 141
Balkh 11.06 6.81 81.70 0.43 235
Kandahar 100 1Overall AVG/Total
14.19 17.68 68.00 0.13 775

82
5.4.4.1.3 Sheep
Approximately 14.4 percent of all respondents (417) selected sheep as their preferred species forexpansion of livestock production. Of these, 244 actually did not own sheep at the time of theinterviews, but all respondents selecting sheep as the species preferred for herd expansion ownedcattle. This observation again demonstrates that sheep ownership in Afghanistan seems to beconcentrated among wealthier farmers.
Table 73 Sheep preferred use: milk (percentages of respond ents)
Province No Response(No Preference)
Household Consumption Sale Total
Nangarhar 100 4
Kabul 77.42 8.60 13.98 93
Logar 84.09 15.91 44
Parwan 69.70 9.09 21.21 66
Balkh 27.27 3.03 69.70 66
Badakhshan 99.13 0.87 115
Kandahar 86.21 6.90 6.90 29
Overall Average/Total 48.44 33.33 18.23 417
Respondents
Table 74 Sheep preferred use: meat (percentages of respondents )
Province No Response(No Preference)
Household Consumption Sale Total
Nangarhar 75.00 25.00 4
Kabul 30.11 53.76 16.13 93
Logar 13.64 77.27 9.09 44
Parwan 46.97 51.52 1.52 66
Badakhshan 13.04 86.96 115
Balkh 7.58 7.58 84.85 66
Kandahar 20.69 79.31 29
Overall Average/Total 18.23 33.81 47.96 417
Respondents
Table 75 Sheep preferred use: wool (percentages of respondents)
Province No Response (No Preference)
Household Consumption
Sale Total Respondents
Nangarhar 100 4
Kabul 97.85 2.15 93
Logar 100 44
Parwan 96.97 3.03 66
Badakhshan 0.87 79.13 20.00 115
Balkh 28.79 13.64 57.58 66
Kandahar 100 29
Overall Average/Total 60.43 24.94 14.63 417
The majority of respondents are interested in an expansion of sheep husbandry because of market-oriented meat production. Wool and milk production from sheep was much less important to therespondents.

83
5.4.4.1.4 Goats
Table 76 Goats preferred use: milk (percentages of respondents )
Province No Response (No Preference)
Household Consumption Sale Total
Respondents
Nangarhar 40.00 40.00 20.00 5
Kabul 87.50 12.50 8
Parwan 100 1
Badakhshan 100 13
Balkh 100 3
Kandahar 66.67 33.33 3
Overall Average/Total 6.06 75.76 18.18 33
Table 77 Goats preferred use: meat (percentages of respondents )
Province No Response(No Preference) Sale Total Respondents
Nangarhar 100 5
Kabul 87.50 12.50 8
Parwan 100 1
Badakhshan 100 13
Balkh 33.33 66.67 3
Kandahar 100 3
Overall Average/Total 51.52 48.48 33
Table 78 Goats preferred use: fibre (percentages of respondents )
Province No Response(No Preference)
Household Consumption
Sale Total Respondents
Nangarhar 100 5
Kabul 87.50 12.50 8
Parwan 100 1
Badakhshan 92.31 7.69 13
Balkh 33.33 33.33 33.33 3
Kandahar 100 3Overall Average/Total
51.52 39.39 9.09 33
Goats are clearly not a species considered especially desirable by female Afghan livestock producers.Those that opted for goats were mostly interested in milk production. Given that milk is so importantin Afghanistan, it would be interesting to find out more about the fact that the potentially mostefficient dairy animal receives so little attention by livestock owners. One possible reason could bethat there are no productive dairy goats present in the country. A pilot project for extensive dairy goatproduction might be a worthwhile consideration.

5.4.4.1.5 Summary of Goals and Preferences:The key aspects of the preceding section are summarised graphically. Since the clear emphasis in theanswers was on cattle and poultry production, results were graphed for only these subsectors.
84
Figure 30 Preferred Livestock Species
Cattle58%
Sheep14%
Goat1%
Poultry27%
Cattle Sheep Goat Poultry
Milk Use24.8%
Milk Sale41.0%
Meat Use1.0%
Meat Sale15.9%
Own Work12.0%
Work Rent5.2%
Milk Use Milk Sale Meat Use Meat Sale Own Work Work Rent
Figure 31 Priorities for cattle production

85
It is very obvious that cattle are the preferred species, and that milk production for sale is the mostimportant priority for livestock development for Afghan women livestock producers. The second mostimportant priority is poultry development, again with the aim to earn money by selling products onthe market.
Figure 32 Priorities for poultry production
Meat Use5% Meat Sale
20%
Egg Use15%
Egg Sale60%
Meat Use Meat Sale Egg Use Egg Sale
photo by Thieme

86
5.4.5 Problems and Improvements
The survey collected considerable amounts of information on problems and opportunities perceivedby female livestock owners. All women participating in the survey were given the option to rankspecific problems and desired improvements. It was considered to be necessary to summarise thesedata in both graphical and tabular form. Summary tables in this section do not contain data ondistrict level. These can be found in Annex 8.4.
5.4.5.1 Problems identified for cattle production
Table 79 Problems cattle production - Not enough feed(percentages of respondents )
Province Most important
Second most important
Third most important
Not Mentioned
Total Respondents
Nangarhar 77.12 13.48 3.76 5.64 319
Kabul 49.54 18.58 20.43 11.46 323
Logar 50.94 8.49 8.49 32.08 106
Parwan 28.10 18.57 9.52 43.81 210
Badakhshan 62.96 32.10 1.85 3.09 162
Balkh 68.86 11.40 6.36 13.38 456
Kandahar 98.77 0.62 0.62 324Overall Average/Total
66.05 13.53 7.32 13.11 1900
Table 80 Problems cattle production - Animal disease(percentages of respondents )
Province Most important
Second most important
Third most important
Not Mentioned
Total Respondents
Nangarhar 12.54 54.55 25.71 7.21 319
Kabul 24.15 54.18 14.86 6.81 323
Logar 11.32 45.28 16.98 26.42 106
Parwan 64.29 28.10 4.29 3.33 210
Badakhshan 32.72 62.35 4.32 0.62 162
Balkh 20.39 38.16 28.51 12.94 456
Kandahar 0.31 63.89 33.33 2.47 324Overall Average/Total
21.68 49.37 21.16 7.79 1900
Table 81 Problems cattle production - Too far to the market(percentages of respondents )
Province Most important
Second most important
Third most important
Not Mentioned
Total Respondents
Badakhshan 0.62 1.23 42.59 55.56 162
Balkh 1.54 23.90 29.82 44.74 456
Kabul 1.55 3.10 95.36 323
Kandahar 0.31 0.93 7.10 91.67 324
Logar 5.66 14.15 12.26 67.92 106
Nangarhar 1.88 21.63 25.08 51.41 319
Parwan 0.95 38.57 30.95 29.52 210Overall Average/Total
1.21 14.95 20.84 63.00 1900

87
Table 82 Problems cattle production - Not enough buyers(percentages of respondents )
Province Most important
Second most important
Third most important
NotMentioned
Total Respondents
Nangarhar 1.25 5.96 8.78 84.01 319
Kabul 0.31 2.79 3.41 93.50 323
Logar 1.89 3.77 14.15 80.19 106
Parwan 1.43 5.71 10.48 82.38 210
Badakhshan 0.62 0.62 1.85 96.91 162
Balkh 0.22 14.04 11.40 74.34 456
Kandahar 0.31 0.31 99.38 324Overall Average/Total
0.63 5.79 6.95 86.63 1900
Table 83 Problems cattle production - Too much work(percentages of respondents )
Province Most important
Second most important
Third most important
Not Mentioned
Total Respondents
Nangarhar 6.90 3.45 18.50 71.16 319
Kabul 8.05 4.64 11.76 75.54 323
Logar 12.26 4.72 6.60 76.42 106
Parwan 2.86 2.38 6.67 88.10 210
Badakhshan 2.47 6.17 91.36 162
Balkh 9.21 1.32 0.88 88.60 456
Kandahar 0.62 0.93 5.25 93.21 324Overall Average/Total
6.05 2.37 7.84 83.74 1900
Table 84 Problems cattle production - Cost of labor(percentages of respondents )
Province Most important
Second most important
Third most important
Not Mentioned
Total Respondents
Nangarhar 0.63 1.57 97.81 319
Kabul 3.10 13.00 30.34 53.56 323
Logar 17.92 23.58 33.02 25.47 106
Parwan 0.95 3.33 9.52 86.19 210
Badakhshan 0.62 3.70 43.21 52.47 162
Balkh 0.44 0.22 0.88 98.46 456
Kandahar 0.62 4.01 95.37 324Overall Average/Total
1.79 4.47 12.89 80.84 1900
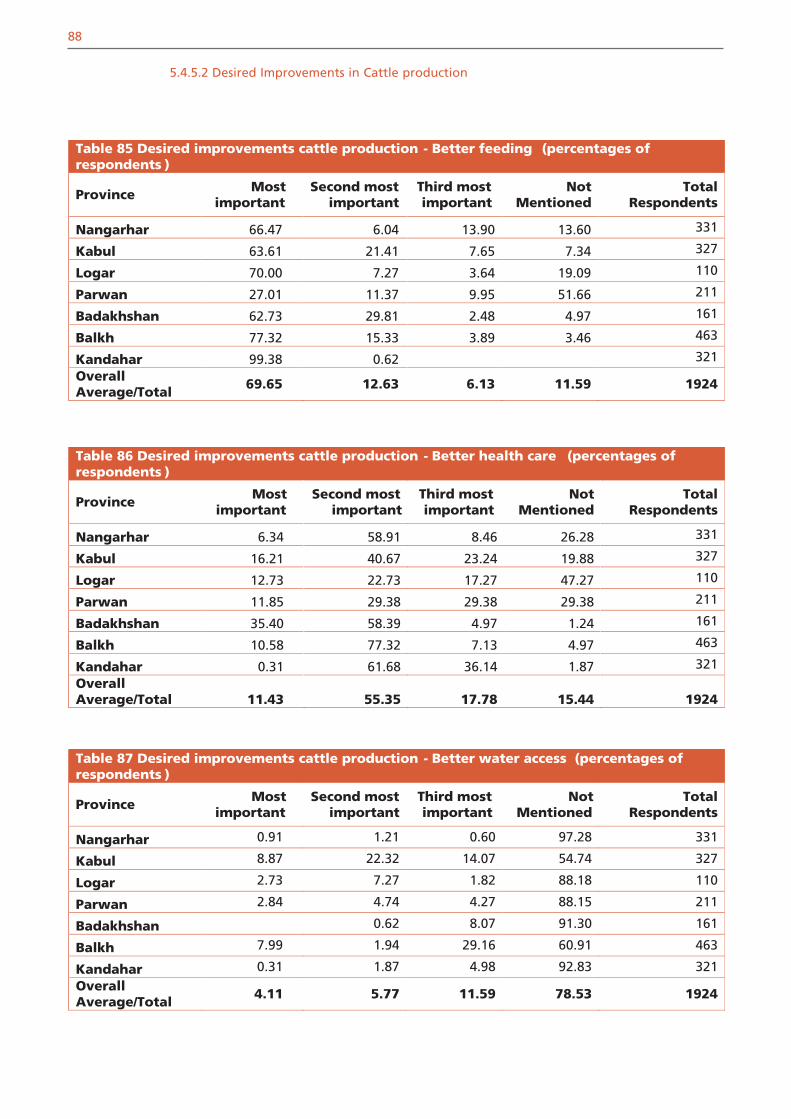
88
5.4.5.2 Desired Improvements in Cattle production
Table 85 Desired improvements cattle production - Better feeding (percentages of respondents )
Province Most important
Second most important
Third most important
Not Mentioned
Total Respondents
Nangarhar 66.47 6.04 13.90 13.60 331
Kabul 63.61 21.41 7.65 7.34 327
Logar 70.00 7.27 3.64 19.09 110
Parwan 27.01 11.37 9.95 51.66 211
Badakhshan 62.73 29.81 2.48 4.97 161
Balkh 77.32 15.33 3.89 3.46 463
Kandahar 99.38 0.62 321Overall Average/Total
69.65 12.63 6.13 11.59 1924
Table 86 Desired improvements cattle production - Better health care (percentages of respondents )
Province Most important
Second most important
Third most important
Not Mentioned
Total Respondents
Nangarhar 6.34 58.91 8.46 26.28 331
Kabul 16.21 40.67 23.24 19.88 327
Logar 12.73 22.73 17.27 47.27 110
Parwan 11.85 29.38 29.38 29.38 211
Badakhshan 35.40 58.39 4.97 1.24 161
Balkh 10.58 77.32 7.13 4.97 463
Kandahar 0.31 61.68 36.14 1.87 321Overall Average/Total 11.43 55.35 17.78 15.44 1924
Table 87 Desired improvements cattle production - Better water access (percentages of respondents )
Province Most important
Second most important
Third most important
Not Mentioned
Total Respondents
Nangarhar 0.91 1.21 0.60 97.28 331
Kabul 8.87 22.32 14.07 54.74 327
Logar 2.73 7.27 1.82 88.18 110
Parwan 2.84 4.74 4.27 88.15 211
Badakhshan 0.62 8.07 91.30 161
Balkh 7.99 1.94 29.16 60.91 463
Kandahar 0.31 1.87 4.98 92.83 321Overall Average/Total
4.11 5.77 11.59 78.53 1924
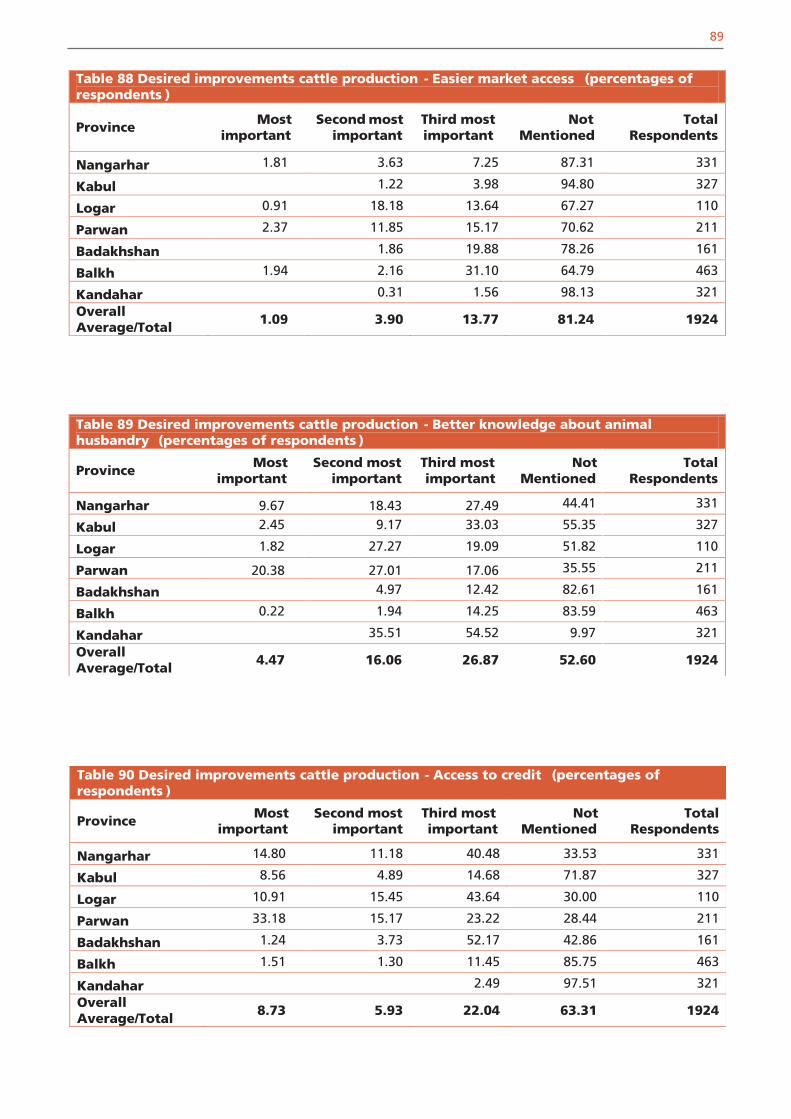
89
Table 88 Desired improvements cattle production - Easier market access (percentages of respondents )
Province Most important
Second most important
Third most important
Not Mentioned
Total Respondents
Nangarhar 1.81 3.63 7.25 87.31 331
Kabul 1.22 3.98 94.80 327
Logar 0.91 18.18 13.64 67.27 110
Parwan 2.37 11.85 15.17 70.62 211
Badakhshan 1.86 19.88 78.26 161
Balkh 1.94 2.16 31.10 64.79 463
Kandahar 0.31 1.56 98.13 321Overall Average/Total
1.09 3.90 13.77 81.24 1924
Table 89 Desired improvements cattle production - Better knowledge about animal husbandry (percentages of respondents )
Province Most important
Second most important
Third most important
Not Mentioned
Total Respondents
Nangarhar 9.67 18.43 27.49 44.41 331
Kabul 2.45 9.17 33.03 55.35 327
Logar 1.82 27.27 19.09 51.82 110
Parwan 20.38 27.01 17.06 35.55 211
Badakhshan 4.97 12.42 82.61 161
Balkh 0.22 1.94 14.25 83.59 463
Kandahar 35.51 54.52 9.97 321Overall Average/Total
4.47 16.06 26.87 52.60 1924
Table 90 Desired improvements cattle production - Access to credit (percentages of respondents )
Province Most important
Second most important
Third most important
Not Mentioned
Total Respondents
Nangarhar 14.80 11.18 40.48 33.53 331
Kabul 8.56 4.89 14.68 71.87 327
Logar 10.91 15.45 43.64 30.00 110
Parwan 33.18 15.17 23.22 28.44 211
Badakhshan 1.24 3.73 52.17 42.86 161
Balkh 1.51 1.30 11.45 85.75 463
Kandahar 2.49 97.51 321Overall Average/Total
8.73 5.93 22.04 63.31 1924

90
5.4.5.3 Problems identified for sheep production
Table 91 Problems sheep production - Not enough feed(percentages of respondents )
Province Most important
Second most important
Third most important
Not Mentioned
Total Respondents
Nangarhar 50.00 50.00 2
Kabul 75.00 13.89 2.78 8.33 36
Logar 60.00 10.00 5.00 25.00 20
Parwan 50.00 8.33 16.67 25.00 12
Badakhshan 73.45 20.35 2.65 3.54 113
Balkh 55.36 14.29 7.14 23.21 112
Kandahar 96.30 3.70 108Overall Average/Total
73.20 12.66 3.72 10.42 403
Table 92 Problems sheep production - Animal disease(percentages of respondents )
Province Most important
Second most important
Third most important
Not Mentioned
Total Respondents
Nangarhar 50.00 50.00 2
Kabul 8.33 63.89 22.22 5.56 36
Logar 15.00 50.00 5.00 30.00 20
Parwan 25.00 33.33 16.67 25.00
Badakhshan 23.89 72.57 3.54 113
Balkh 26.79 27.68 29.46 16.07 112
Kandahar 1.85 71.30 21.30 5.56 108Overall Average/Total
17.12 56.58 17.62 8.68 403
Table 93 Problems sheep production - Too far to market(percentages of respondents)
Province Most important
Second most important
Third most important
Not Mentioned
Total Respondents
Nangarhar 100 2
Kabul 5.56 2.78 5.56 86.11 36
Logar 5.00 15.00 15.00 65.00 20
Parwan 25.00 41.67 33.33 12
Badakhshan 0.88 14.16 84.96 113
Balkh 25.00 17.86 57.14 112
Kandahar 12.04 87.96 108Overall Average/Total
0.74 8.93 14.64 75.68 403

91
Table 94 Problems sheep production - Not enough buyers(percentages of respondents )
Province Most important
Second most important
Third most important
Not Mentioned
Total Respondents
Nangarhar 50.00 2
Kabul 2.78 11.11 86.11 36
Logar 15.00 85.00 20
Parwan 16.67 83.33 12
Badakhshan 2.65 4.42 92.92 113
Balkh 0.89 8.93 8.93 81.25 112
Kandahar 100 108Overall Average/Total
0.25 3.97 5.71 90.07 403
Table 95 Problems sheep production - Too much work(percentages of respondents )
Province Most important
Second most important
Third most important
Not Mentioned
Total Respondents
Nangarhar 100 2
Kabul 5.56 2.78 11.11 80.56 36
Logar 10.00 10.00 10.00 70.00 20
Parwan 8.33 16.67 75.00 12
Badakhshan 2.65 1.77 18.58 76.99 113
Balkh 16.07 2.68 1.79 79.46 112
Kandahar 1.85 2.78 13.89 81.48 108Overall Average/Total
6.95 3.23 10.92 78.91 403
Table 96 Problems sheep production - Cost of labor(percentages of respondents )
Province Most important
Second most important
Third most important
Not Mentioned
Total Respondents
Nangarhar 100 2
Kabul 8.33 19.44 72.22 36
Logar 10.00 15.00 45.00 30.00 20
Parwan 8.33 25.00 66.67 12
Badakhshan 1.77 56.64 41.59 113
Balkh 0.89 2.68 3.57 92.86 112
Kandahar 9.26 90.74 108Overall Average/Total
0.99 2.73 24.07 72.21 403

92
5.4.5.4 Desired improvements for sheep production
Table 97 Desired improvements sheep production - Better feeding(percentages of respondents )
Province Most important
Second most important
Third most important
Not Mentioned
Total Respondents
Nangarhar 50.00 50.00 2
Kabul 88.24 5.88 2.94 2.94 34
Logar 60.00 10.00 30.00 20
Parwan 60.00 10.00 10.00 20.00 10
Badakhshan 76.11 20.35 1.77 1.77 113
Balkh 77.97 12.71 4.24 5.08 118
Kandahar 98.10 1.90 105Overall Average/Total
82.09 11.19 2.24 4.48 402
Table 98 Desired improvements sheep production - Better health care (percentages of respondents )
Province Most important
Second most important
Third most important
Not Mentioned
Total Respondents
Nangarhar 50.00 50.00 2
Kabul 2.94 55.88 11.76 29.41 34
Logar 30.00 30.00 10.00 30.00 20
Parwan 10.00 20.00 20.00 50.00
Badakhshan 23.89 71.68 3.54 0.88 113
Balkh 11.02 75.42 7.63 5.93 118
Kandahar 1.90 71.43 24.76 1.90 105Overall Average/Total
12.69 67.91 11.69 7.71 402
Table 99 Desired improvements sheep production - Better water access(percentages of respondents )
Province Most important
Second most important
Third most important
Not Mentioned
Total Respondents
Nangarhar 100 2
Kabul 14.71 14.71 70.59 34
Logar 5.00 20.00 75.00 20
Parwan 100 10
Badakhshan 2.65 30.09 67.26 113
Balkh 4.24 2.54 33.05 60.17 118
Kandahar 0.95 11.43 87.62 105Overall Average/Total
1.49 3.98 22.39 72.14 402

93
Table 100 Desired improvements sheep production - Easier market access (percentages of respondents )
Province Most important
Second most important
Third most important
Not Mentioned
Total Respondents
Nangarhar 50.00 50.00 2
Kabul 2.94 11.76 85.29 34
Logar 15.00 20.00 65.00 20
Parwan 10.00 30.00 60.00 10
Badakhshan 7.08 92.92 113
Balkh 3.39 3.39 22.03 71.19 118
Kandahar 2.86 97.14 105Overall Average/Total
1.24 2.24 11.94 84.58 402
Table 101 Desired improvements sheep production - Better knowledge about animal husbandry (percentages of respondents )
Province Most important
Second most important
Third most important
Not Mentioned
Total Respondents
Nangarhar 100 2
Kabul 11.76 32.35 55.88 34
Logar 20.00 20.00 60.00 20
Parwan 50.00 10.00 40.00 10
Badakhshan 1.77 12.39 85.84 113
Balkh 0.85 4.24 21.19 73.73 118
Kandahar 24.76 56.19 19.05 105Overall Average/Total
0.25 11.44 28.86 59.45 402
Table 102 Desired improvements sheep production - Access to credit(percentages of respondents )
Province Most important
Second most important
Third most important
Not Mentioned
Total Respondents
Nangarhar 100 2
Kabul 5.88 8.82 23.53 61.76 34
Logar 5.00 10.00 40.00 45.00 20
Parwan 30.00 10.00 30.00 30.00 10
Badakhshan 3.54 45.13 51.33 113
Balkh 2.54 1.69 9.32 86.44 118
Kandahar 0.95 4.76 94.29 105Overall Average/Total
2.24 3.23 21.39 73.13 402

94
5.4.5.5 Problem identified for goat production
Table 103 Problems goat production - Not enough feed(percentages of respondents )
Province Most important
Second most important
Third most important
Not Mentioned
Total Respondents
Badakhshan 54.55 36.36 9.09 11
Balkh 40.28 22.22 4.17 33.33 72
Kabul 16.67 50.00 33.33 6
Kandahar 58.33 33.33 8.33 12
Nangarhar 50.00 50.00 2
Parwan 100 2Overall Average/Total 41.90 26.67 6.67 24.76 105
Table 104 Problems goat production - Animal disease(percentages of respondents )
Province Most important
Second most important
Third most important
Not Mentioned
Total Respondents
Badakhshan 45.45 54.55 11
Balkh 34.72 23.61 23.61 18.06 72
Kabul 50.00 33.33 16.67 6
Kandahar 41.67 50.00 8.33 12
Nangarhar 50.00 50.00 2
Parwan 100 2Overall Average/Total 34.29 28.57 23.81 13.33 105
Table 105 Problems goat production - Too far to the market (percentages of respondents )
Province Most important
Second most important
Third most important
Not Mentioned
Total Respondents
Badakhshan 27.27 72.73 11
Balkh 18.06 18.06 63.89 72 18.06
Kabul 100 6
Kandahar 100 12
Nangarhar 50.00 50.00 2 50.00
Parwan 100 2 100Overall Average/Total 15.24 15.24 69.52 105 15.24

95
Table 106 Problems goat production - Not enough buyers(percentages of respondents )
Province Most important
Second most important
Third most important
Not Mentioned
Total Respondents
Badakhshan 100 11
Balkh 1.39 2.78 1.39 94.44 72
Kabul 100 6
Kandahar 8.33 8.33 83.33 12
Nangarhar 100 2
Parwan 100 2Overall Average/Total 0.95 2.86 1.90 94.29 105
Table 107 Problems goat production - Too much work(percentages of respondents )
Province Most important
Second most important
Third most important
Not Mentioned
Total Respondents
Badakhshan 9.09 90.9 11
Balkh 22.22 2.78 75.0 72
Kabul 33.33 66.7 6
Kandahar 41.67 25.00 33.3 12
Nangarhar 100 2
Parwan 100 2Overall Average/Total 20.00 1.90 5.71 72.4 105
Table 108 Problems goat production - Cost of labor(percentages of respondents )
Province Most important
Second most important
Third most important
Not Mentioned
Total Respondents
Badakhshan 9.09 63.64 27.27 11
Balkh 1.39 4.17 11.11 83.33 72
Kabul 16 .67 83.33 6
Kandahar 16.67 83.33 12
Nangarhar 100 2
Parwan 100 2Overall Average/Total 0.95 3.81 17.14 78.10 105

96
5.4.5.6 Desired improvements for goat production
Table 109 Desired improvements goat production - Better feeding (percentages of respondents )
Province Most important
Second most important
Third most important
Not Mentioned
Total Respondents
Badakhshan 63.64 36.36 11
Balkh 76.74 9.30 8.14 5.8 86
Kabul 80.00 20.00 5
Kandahar 100 4
Nangarhar 100 2
Parwan 100 2Overall Average/Total 75.45 11.82 6.36 6.4 110
Table 110 Desired improvements goat production - Better health care(percentages of respondents )
Province Most important
Second most important
Third most important
Not Mentioned
Total Respondents
Badakhshan 36.36 63.64 11
Balkh 11.63 72.09 6.98 9.3 86
Kabul 20.00 40.00 40.0 5
Kandahar 50.00 50.00 4
Nangarhar 100 2
Parwan 100 2Overall Average/Total
12.73 67.27 10.91 9.1 110
Table 111 Desired improvements goat production - Better water access (percentages of respondents )
Province Most important
Second most important
Third most important
Not Mentioned
Total Respondents
Badakhshan 18.18 81.8 11
Balkh 5.81 2.33 36.05 55.8 86
Kabul 20.00 20.00 60.0 5
Kandahar 100 4
Nangarhar 100 2
Parwan 100 2Overall Average/Total 4.55 2.73 30.91 61.8 110
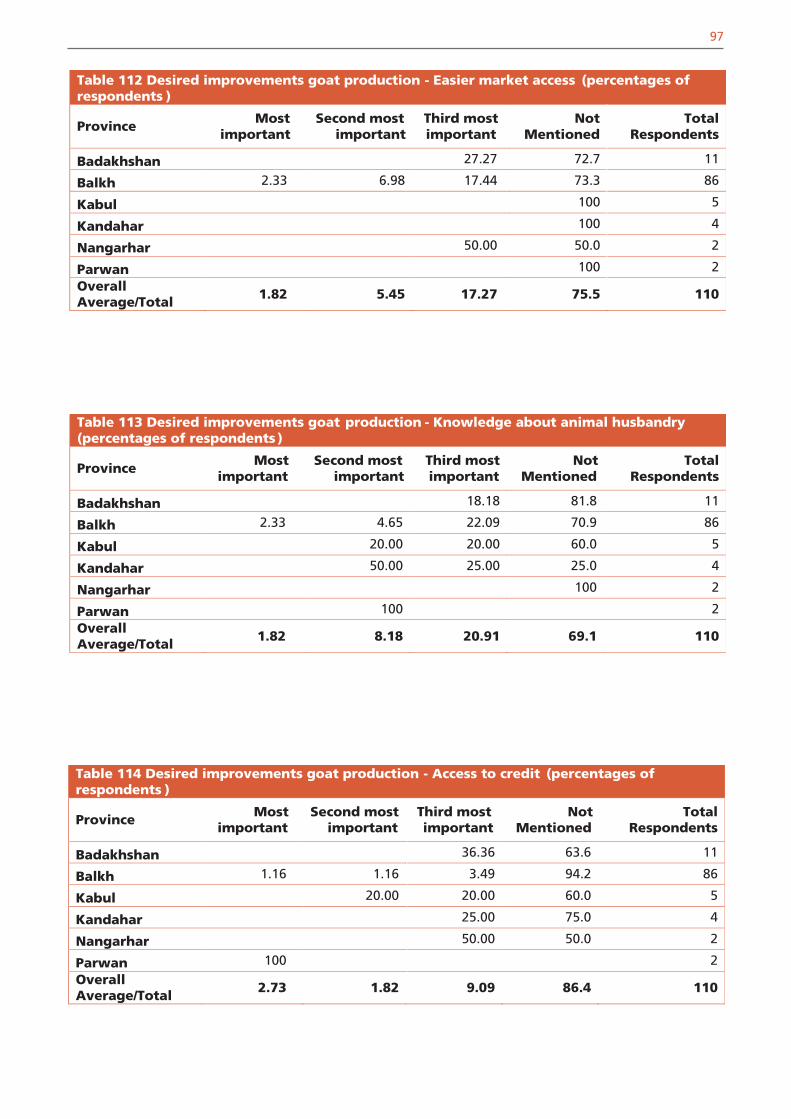
97
Table 112 Desired improvements goat production - Easier market access (percentages of respondents )
Province Most important
Second most important
Third most important
NotMentioned
Total Respondents
Badakhshan 27.27 72.7 11
Balkh 2.33 6.98 17.44 73.3 86
Kabul 100 5
Kandahar 100 4
Nangarhar 50.00 50.0 2
Parwan 100 2Overall Average/Total 1.82 5.45 17.27 75.5 110
Table 113 Desired improvements goat production - Knowledge about animal husbandry (percentages of respondents )
Province Most important
Second most important
Third most important
Not Mentioned
Total Respondents
Badakhshan 18.18 81.8 11
Balkh 2.33 4.65 22.09 70.9 86
Kabul 20.00 20.00 60.0 5
Kandahar 50.00 25.00 25.0 4
Nangarhar 100 2
Parwan 100 2Overall Average/Total 1.82 8.18 20.91 69.1 110
Table 114 Desired improvements goat production - Access to credit (percentages of respondents )
Province Most important
Second most important
Third most important
Not Mentioned
Total Respondents
Badakhshan 36.36 63.6 11
Balkh 1.16 1.16 3.49 94.2 86
Kabul 20.00 20.00 60.0 5
Kandahar 25.00 75.0 4
Nangarhar 50.00 50.0 2
Parwan 100 2Overall Average/Total 2.73 1.82 9.09 86.4 110

98
5.4.5.7 SummaryThe following graphs summarise the preceding sections.
Figure 33 Problems of cattle production
0.0%
10.0%
20.0%
30.0%
40.0%
50.0%
60.0%
70.0%
80.0%
FeedShortage
Disease MarketDistance
No Buyers WorkLoad
LabourCost
First Priority Second Priority Third Priority Not Mentioned
Figure 34 Priorities for improvement of cattle production
0.0%
10.0%
20.0%
30.0%
40.0%
50.0%
60.0%
70.0%
80.0%
Feed Health Water Market Husbandry Credit
First Priority Second Priority Third Priority Not Mentioned

99
Figure 35 Problems of sheep production
0.0%
10.0%
20.0%
30.0%
40.0%
50.0%
60.0%
70.0%
80.0%
FeedShortage
Disease MarketDistance
No Buyers WorkLoad
LabourCost
First Priority Second Priority Third Priority Not Mentioned
Figure 36 Priorities for improvement of sheep production
0.0%
10.0%
20.0%
30.0%
40.0%
50.0%
60.0%
70.0%
80.0%
90.0%
Feed Health Water Market Husbandry Credit
First Priority Second Priority Third Priority Not Mentioned
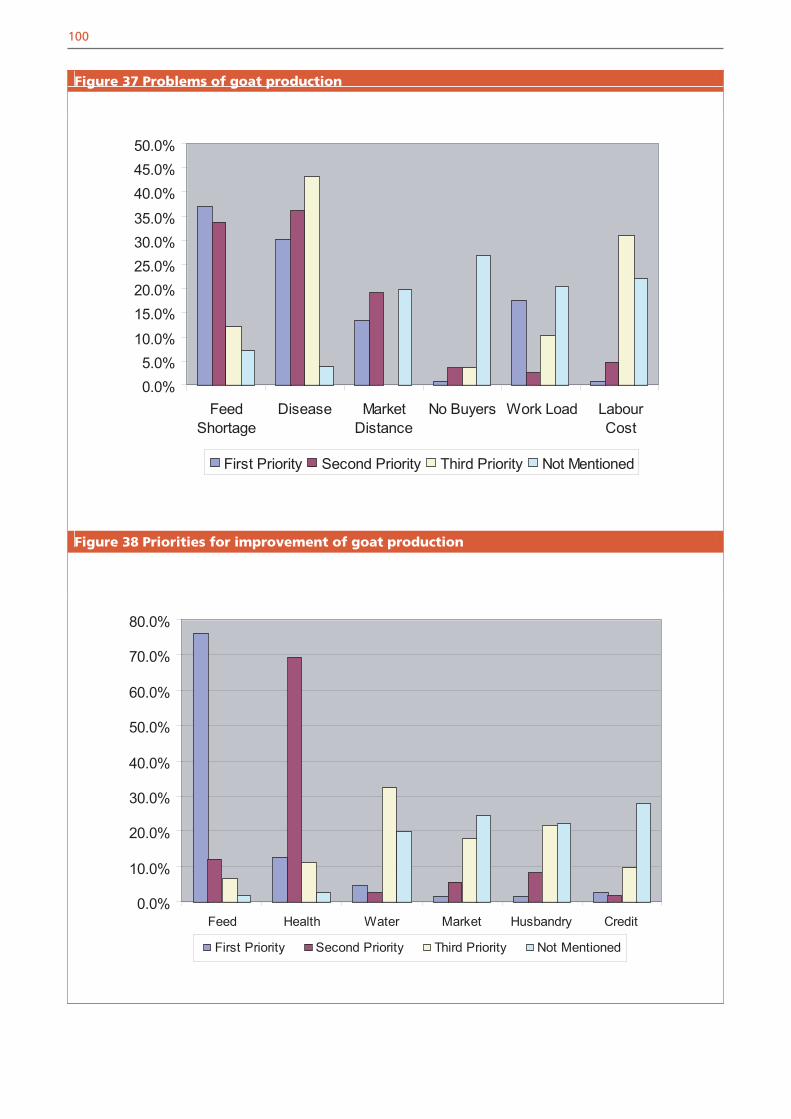
100
Figure 37 Problems of goat production
0.0%5.0%
10.0%
15.0%20.0%25.0%30.0%35.0%
40.0%45.0%50.0%
FeedShortage
Disease MarketDistance
No Buyers Work Load LabourCost
First Priority Second Priority Third Priority Not Mentioned
Figure 38 Priorities for improvement of goat production
0.0%
10.0%
20.0%
30.0%
40.0%
50.0%
60.0%
70.0%
80.0%
Feed Health Water Market Husbandry Credit
First Priority Second Priority Third Priority Not Mentioned

101
Figure 39 First priorities for improving cattle production
Feed, 70.0%
Water, 4.1%
Health, 11.5%
Market, 1.1%
Husbandry, 4.5% Credit, 8.8%
Feed Health Water Market Husbandry Credit
Figure 40 First priorities for improving sheep production
Feed, 82.1%
Credit, 2.2%
Husbandry, 0.2%
Water, 1.5%Market, 1.2%
Health, 12.7%
Feed Health Water Market Husbandry Credit

102
5.5 KARAKUL SURVEY5.5.1 Introduction
A survey was carried out to collect data and information on Karakul production. This sector has beentraditionally of great significance in Northern Afghanistan. Because it is a value added sector, it offersopportunities for income generation as an alternative to the production of illicit drugs. Very little isknown about production figures and producers of Karakul in Central and South Asia in general.During the 90’s, Karakul went into a deep decline in former Soviet Central Asia. This decline has beendriven largely by two factors: (1) the disruption of Soviet-internal and export market channels afterthe break-up of the Soviet Union, and (2) the general decline in international demand for Karakulpelts, a development that parallels the decline in demand for pelts in the western industrialized worldin general. However, anecdotal evidence from Central Asia suggests that in recent years, demand, inparticular from countries of the former Soviet Union has been increasing again. Unfortunately, thereare no reliable data on the Karakul sector available at all.
As a first step in the development of a Karakul research and development program, basic productioninformation and producer perceptions need to be collected. The Karakul Survey was conducted in thenorthern provinces of Kunduz, Balkh, Faryab, Samangan, Sari Pul and Jawzjan. A total of 131 Karakulproducers were surveyed.
The results also include information about the coefficient of variation because we felt that thisadditional parameter was useful, given the relatively small sample size and the fact that this is firstrecent published evaluation of Afghan Karakul production.
photo by Thieme

5.5.2 Flock Size and Distribution of Colour Types
In some areas, notably Balkh, answers to the questions about colour distribution in flocks were notanswered. In order to ascertain colour distribution, the data set was filtered for each colour type toinclude only those records that were true zeros or above. Therefore, the colour type distributionstatistics could not be combined into one table.
103
Table 115 Size of karakul flocks in different provinces
Province Average Flock Size STD of Flock Size
Balkh 168 161.69
Faryab 45.32 48.07
Jawzjan 197.27 339.84
Kunduz 181.61 142.22
Samangan 14.22 12.09
Saripul 101.67 113.68
Overall 133.95 189.87
Table 116 Number and proportion of GREY colour pelts in Karakul flocks fromdifferent provinces
Province Average Flock Size Average No of Grey Colour
Percentages of Grey Colour
Faryab 45.35 23.76 52.40
Jawzjan 96.50 43.14 44.71
Kunduz 181.61 129.10 71.09
Samangan 14.22 6.11 42.97
Saripul 36.25 21.25 58.62
Table 117 Number and proportion of SUR (golden-brown) colour pelts in karakul flocks from different provinces
Province Average Flock Size Average No of Sur Colour
Percentages of Sur Colour
Faryab 43.86 0.57 1.30
Jawzjan 96.50 0.29 0.30
Kunduz 182.80 17.13 9.37
Samangan 14.35 0.00 0.00
Saripul 36.25 0.00 0.00

104
Since the Sur (Golden-Brown) colour achieves the highest price on the market, higher proportion ofSur type animals would probably increase income for Karakul farmers. The association of high-pricedcolour types with lethal factors requires careful consideration, however.
Wealth distribution was defined by delineating 5 ownership classes:
These ownership classes differ from the ones defined above for Level 2 summaries because onlyproducers actually owning sheep were interviewed.
Table 119 Ownership classes for karakul flocksOwnership Class Flock Size1 1-152 16-493 50-994 100-4995 > 499
Table 118 Number and proportion of BLACK colour pelts in karakul flocks from different provinces
Province Average Flock Size
Average No.of Black Colour
Percentages of Black colour
Faryab 45.35 21.41 47.21
Jawzjan 96.50 53.07 55.00
Kunduz 181.61 35.95 19.80
Samangan 14.22 8.11 57.03
Saripul 36.25 15.00 41.38
Table 120 Distribution of karakul flock sizes in different provinces
Ownership class
Province 1 2 3 4 5 Total Respondents
Balkh 4.35 30.43 56.52 8.70 23
Faryab 26.32 47.37 10.53 15.79 19
Jawzjan 9.09 18.18 36.36 27.27 9.09 22
Kunduz 2.44 17.07 14.63 60.98 4.88 41
Samangan 83.33 11.11 5.56 18
Saripul 33.33 44.44 22.22 9Overall Average
17.42 19.70 21.21 37.12 4.55 132

105
These data are graphically summarised as follows:
Figure 41 Karakul sheep wealth distribution(percent respondents represented in proportion)
1-15 head 16-49 head 50-99 head 100-499 head > 499 head
Balkh
Faryab
Jawzjan
Kunduz
Samangan
Saripul
There are several conclusions from these numbers. First, there is a very large variation in average flocksize both between and with provinces (see coefficient of variation). Second, the SUR colour type israre and sometimes absent. This is the colour that achieves the highest prices in the market. Clearly,there is considerable scope for production improvement. In Karakul sheep, the most expensive coloursand curl types are associated with lethal factors. Therefore, the selection to increase Percentages andNumbers of these high-value pelt types is not a trivial undertaking and would benefit considerablyfrom support by research and extension entities. Third, there are quite large flocks in Afghanistan,suggesting the potential to rebuild an industry that formerly was economically very important in theNorthern provinces.
5.5.3 Pelt Production
According to Central Asian folklore, Karakul pelt production developed out of the practice to kill onelamb if a ewe had twins, especially in a bad forage year, because the milk production capacity of theKarakul ewe under range conditions suffices only for the successful rearing of one lamb. One shouldexpect therefore a relationship between forage year and decision to pelt lambs rather than rearingthem. This decision is based on rainfall. In Northern Afghanistan, most of the precipitation falls in thewinter months. At lambing time in early spring, producers therefore have a good sense of expectedforage production. Accordingly, the survey asked for typical pelt harvest averages in a bad and in agood forage year.
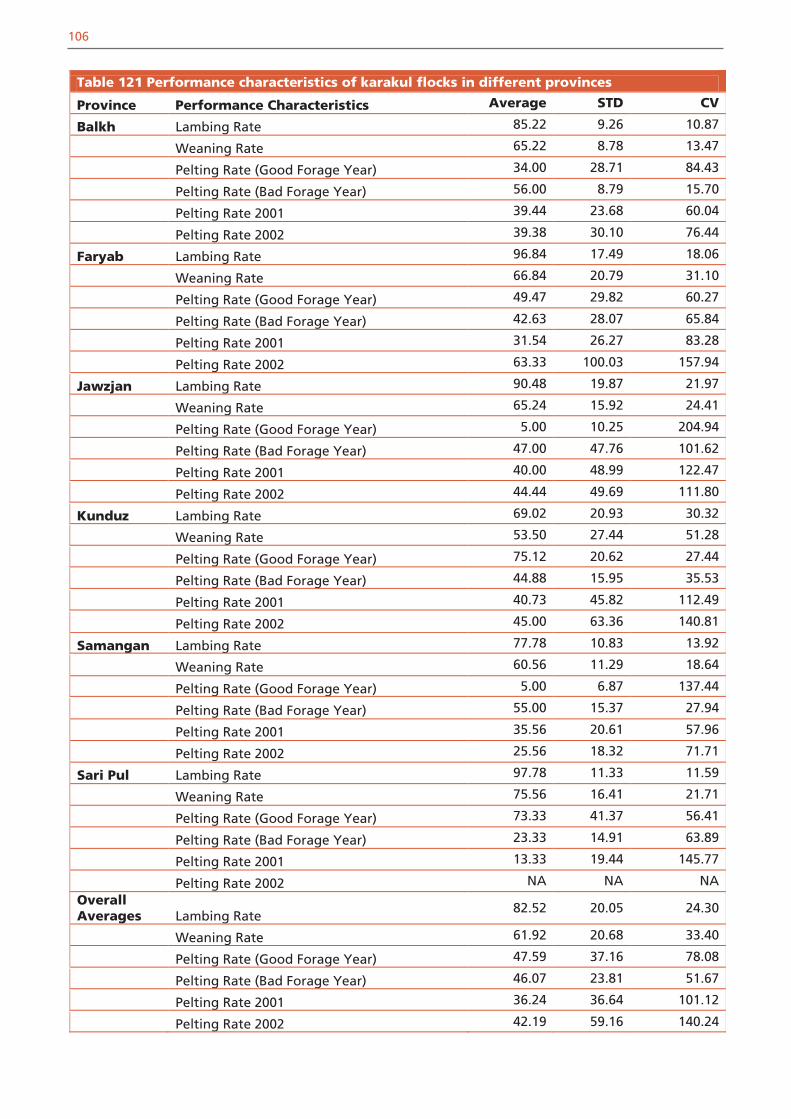
106
Table 121 Performance characteristics of karakul flocks in different provinces
Province Performance Characteristics Average STD CV
Balkh Lambing Rate 85.22 9.26 10.87
Weaning Rate 65.22 8.78 13.47
Pelting Rate (Good Forage Year) 34.00 28.71 84.43
Pelting Rate (Bad Forage Year) 56.00 8.79 15.70
Pelting Rate 2001 39.44 23.68 60.04
Pelting Rate 2002 39.38 30.10 76.44
Faryab Lambing Rate 96.84 17.49 18.06
Weaning Rate 66.84 20.79 31.10
Pelting Rate (Good Forage Year) 49.47 29.82 60.27
Pelting Rate (Bad Forage Year) 42.63 28.07 65.84
Pelting Rate 2001 31.54 26.27 83.28
Pelting Rate 2002 63.33 100.03 157.94
Jawzjan Lambing Rate 90.48 19.87 21.97
Weaning Rate 65.24 15.92 24.41
Pelting Rate (Good Forage Year) 5.00 10.25 204.94
Pelting Rate (Bad Forage Year) 47.00 47.76 101.62
Pelting Rate 2001 40.00 48.99 122.47
Pelting Rate 2002 44.44 49.69 111.80
Kunduz Lambing Rate 69.02 20.93 30.32
Weaning Rate 53.50 27.44 51.28
Pelting Rate (Good Forage Year) 75.12 20.62 27.44
Pelting Rate (Bad Forage Year) 44.88 15.95 35.53
Pelting Rate 2001 40.73 45.82 112.49
Pelting Rate 2002 45.00 63.36 140.81
Samangan Lambing Rate 77.78 10.83 13.92
Weaning Rate 60.56 11.29 18.64
Pelting Rate (Good Forage Year) 5.00 6.87 137.44
Pelting Rate (Bad Forage Year) 55.00 15.37 27.94
Pelting Rate 2001 35.56 20.61 57.96
Pelting Rate 2002 25.56 18.32 71.71
Sari Pul Lambing Rate 97.78 11.33 11.59
Weaning Rate 75.56 16.41 21.71
Pelting Rate (Good Forage Year) 73.33 41.37 56.41
Pelting Rate (Bad Forage Year) 23.33 14.91 63.89
Pelting Rate 2001 13.33 19.44 145.77
Pelting Rate 2002 NA NA NAOverall Averages Lambing Rate
82.52 20.05 24.30
Weaning Rate 61.92 20.68 33.40
Pelting Rate (Good Forage Year) 47.59 37.16 78.08
Pelting Rate (Bad Forage Year) 46.07 23.81 51.67
Pelting Rate 2001 36.24 36.64 101.12
Pelting Rate 2002 42.19 59.16 140.24

Interestingly, the results are not consistent and may be conditioned by differences between provincesin the general forage situation and feed availability. Usually, Karakul producers pelt most of theirlambs in a bad forage year, and rear as many as possible (pelting only male) in a good year. This wasthe case in the provinces of Balkh, Faryab, Jawzjan, and Samangan, but not in Kunduz and Sari Pul. Lambing Percentages and Numbers was quite low in Kunduz and Samangan. This indicatesconsiderable potential for improvement in nutrition and reproduction. This is even more evident forthe weaning rate data. These performance data demonstrate the benefits that a developmentprogram could realize by improving nutrition and health services for Karakul production. On the otherhand, these reproductive figures are too low for a speedy recovery of sheep flocks after the drought.Interventions in the Karakul sheep sector are necessary.
107
photo by Pittroff

108
5.5.4 Markets5.5.4.1 Returns from pelts and wool
In order to gather information about recent developments, producers were asked if their returns forwool and pelts were better or worse than the previous year.
Table 122 Returns from the sale of pelts in 2002 compared to 2001
Province Lower Returns
Higher Returns
NA Number of Respondents
Percentages with lower returns
Balkh 23 23 100
Faryab 19 19 100
Jawzjan 21 1 22 95.45
Kunduz 28 12 1 41 68.29
Samangan 6 2 10 18 33.33
Sari Pul 9 9 100
All 106 14 12 132 80.30
On average, producers reported lower returns, with the notable exception of Samangan. This maysuggest regional differences in marketing. Unfortunately, there are no marketing studies available forKarakul pelt production. Most likely, the market is dominated by a few traders that buy directly fromproducers at lambing time. This may explain why in one province apparently better prices were paid.A better understanding of the Karakul marketing channels in Afghanistan, and indeed Uzbekistanand Turkmenistan (all these countries are likely served by the same traders) is required to developinterventions that help producers directly. The total absence of any quality control and any assistancein training in pelt treatment and conservation must play a role in the economic returns for producers.This could be improved.
Table 123 Returns from the sale of wool in 2002 compared to 2001
Province Lower Returns
Higher Returns NA Number of
Respondents
Percentages with lower
returns
Balkh 23 23 100
Faryab 19 19 100
Jawzjan 10 11 1 22 45.45
Kunduz 29 11 1 41 70.73
Samangan 7 1 10 18 38.89
Sari Pul 9 9 100
All 97 23 12 132 73.48
The situation for wool sales mirror the results obtained for the pelt market. Again Samangan was theexception. The fact that most of the carpet wool in Afghanistan is imported would suggest goodmarket potential for home-grown wool. However, there is not a single mill in Afghanistan;consequently, wool produced in Afghanistan is hand-spun and can likely not compete with woolpurchased at low prices from New Zealand and Europe. Again, an intervention program should lookat the market and intermediary processing. Investing in a wool mill in Afghanistan could be aprofitable enterprise, if initially some regulation of the wool market was enacted by the Government.Definitely, this could help Afghan sheep producers in rebuilding their flocks and businesses.

109
Overall, sheep producers had a somewhat optimistic view of the pelt market.
Table 126 Interest of customers for buying more or less pelts
Province Less More NA Number of Respondents
Percentages of Respondents who
expected to sell less
Balkh 11 12 23 47.83
Faryab 12 7 19 63.16
Jawzjan 19 2 1 22 86.36
Kunduz 1 40 41 2.44
Samangan 2 7 9 18 11.11
Sari Pul 9 9 100
All 54 68 10 132 40.91
5.5.4.2 Market Opportunities
The farmers were asked about current and expected market opportunities. First it was of interested tosee if pelts and wool sales differed from the previous year.
Table 124 Market opportunities for karakul pelts
Sale of pelts in 2002 compared to 2001
Province Less More NA Number of Respondents
Percentagesof Respondents
who sold less
Balkh 14 8 1 23 60.87
Faryab 17 2 19 89.47
Jawzjan 17 4 1 22 77.27
Kunduz 23 18 41 56.10
Samangan 12 1 5 18 66.67
Sari Pul 9 9 100
All 92 33 7 132 69.70
The reasons for lower sales could be manifold, including the desire to rebuild flocks. Therefore, thesenumbers do not reflect future intentions of producers.
The wool market seemed to have been better than the pelt market, but still more farmers reportedless wool sales than those reporting higher wool sales. Without more detailed information aboutregional and international markets, these data are difficult to interpret.
Table 125 Market opportunities for karakul wool
Sale of karakul wool in 2002 compared to 2001
Province Less More NA Number of Respondents
Percentagesof Respondents
who sold less
Balkh 5 18 23 21.74
Faryab 12 7 19 63.16
Jawzjan 10 10 2 22 45.45
Kunduz 23 14 4 41 56.10
Samangan 13 2 3 18 72.22
Sari Pul 9 9 100
All 72 51 9 132 54.55

110
Table 127 Interest of customers for buying more or less wool
Province Less More NA Number of Respondents
Percentages of Respondents who
expected to sell less
Faryab 12 7 19 63.16
Jawzjan 12 9 1 22 54.55
Kunduz 1 34 6 41 2.44
Samangan 8 7 3 18 44.44
Sari Pul 9 9 100
All 51 71 10 132 38.64
The same result was obtained for wool. Again, farmers in Kunduz were the most optimistic.
Finally, farmers were asked if they would be interested in producing more pelts, and which colourobtains the best price for pelts.
With the exception of Samangan, farmers were clearly interested in Karakul production. It woulddefinitely be of interest to conduct follow up work in Samangan to clarify.
Table 128 Interest of customers for producing more or less pelts
Province Less More NA Number of Respondents
Percentages of Respondents who
are interested in producing more
Balkh 2 21 23 91.30
Faryab 7 12 19 63.16
Jawzjan 10 11 1 22 50.00
Kunduz 39 2 41 95.12
Samangan 9 9 18 0.00
Sari Pul 3 5 1 9 55.56
All 31 88 13 132 66.67
In international markets, the SUR colour usually achieves the highest price. The fact that with theexception of Samangan province most farmers listed GREY as the colour fetching the best pricesuggests perhaps a preference for that colour that is typical for the market in Afghanistan itself. Thisfurther demonstrates the need for market studies to design interventions that help revitalize theKarakul sheep sector in Afghanistan.
Table 129 Colour of pelts for which best price was obtained
Province Grey Sur NA Number of Respondents
Percentages of Grey
Balkh 23 23 100
Faryab 19 19 100
Jawzjan 22 22 100
Kunduz 34 7 41 82.93
Samangan 3 12 3 18 16.67
Sari Pul 9 9 100
All 110 19 3 132 83.33
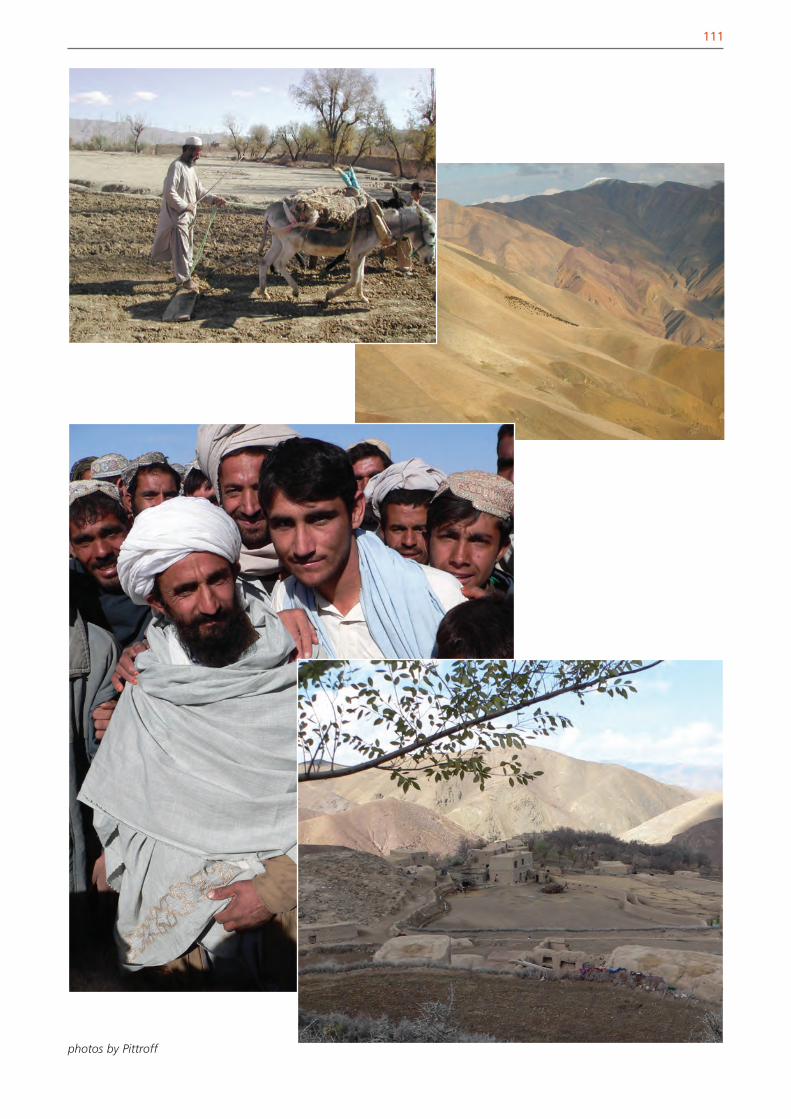
111
photos by Pittroff


113
6. DISCUSSION6.1 CENSUS DATA SUMMARIES
Previous data on livestock numbers can be found in FAO surveys undertaken since 1995 (1995,1997/98 and 2000). Some areas covered in 1995 were omitted from the larger coverage of 1998,because of security and accessibility problems. Previous surveys, due to numerous constraints, couldnot attempt a systematic estimation of comprehensive livestock numbers. Further, in the absence ofreliable human demographics and consistent information about location and administrative settingsof human settlements (as explained above, there is no consistent district database), it was impossibleto develop a sampling frame that would have allowed for truly randomized sampling on either of thetwo levels. Consequently, the method of total enumeration was used for Level 1.
No reliable data exist on which to base estimates of the proportion of families or communitiesincluded in prior surveys. Accordingly, a comparison of the Afghanistan National Livestock Censusdata to total numbers reported in previous surveys is not sensible, but nevertheless the numbers perhousehold may give a general indication of livestock numbers pre-drought, together with the changesthat have occurred between 1995 and today.
Livestock owned per family, and sheep numbers in particular have clearly fallen sharply. Although thedecline between 1998 and 2003 appears steeper than between 1995 and 1998, changes werealready underway during the earlier period. There are reports of trans- border movements of livestockby emigrating families, and of returnees leaving stock behind while they investigated the situation inAfghanistan for themselves.
The time of year of the surveys is also important because the Kuchi herds may or may not be present.The Kuchi population in the south and south-east of Afghanistan spend the winter in Pakistan or indistricts of Afghanistan close to the border (FAO, 1999). With the current security situation along theborder area, it is probable that many would have chosen to remain in Pakistan. During the 1995 survey, the average sheep flock for Kuchis was 100 head, and nationally the totallivestock owned by Kuchis was equal to the number owned by the resident population. The presentcensus only captured records from 29,000 Kuchi families, far fewer than were recorded by the limitedsurveys during 1995 (59,000 families) and 1998 (75,000 families).
Given that a far smaller Kuchi population was captured by the 2003 Census, a comparison would bebetter made with the stock holdings of resident families in previous years. On this basis it is still clearthat livestock holdings have declined and that sheep have been particularly hard hit by adverseconditions.Limited livestock data can be found in the Agricultural surveys undertaken by FAO twice yearly, winterand summer. In the current census, livestock numbers per family have been shown to be considerablyreduced from pre-drought values. The survey undertaken in May-June 2002 collected data from 5000farms in 540 villages across all 32 Provinces and agro-ecological zones. The results indicated that onaverage a typical farm owned two cattle, four sheep, four goats and six birds. Compared to theprevious year, livestock numbers and the proportion of farms keeping livestock had decreased. Surveydata over the years 1998-2002 indicated livestock numbers had fallen faster in the later years of thedrought.
Table 130 A comparison of livestock numbers per family from FAO surveys and census results between 1995 and 2003Species 1995 Survey 1998 Survey 2003 Census
All Resident All Resident AllCattle 3.66 3.75 2.51 2.75 1.22Sheep 21.93 12.59 14.20 7.93 2.88Goats 9.40 5.67 5.76 4.38 2.40Donkey 1.09 0.96 0.71 0.62 0.52Camels 0.41 0.12 0.23 0.07 0.06Poultry 11.56 11.86 6.84 7.01 4.00

114
Preliminary results from the Agricultural survey in winter 2002 indicted that both livestock numbersand proportion of farmers with livestock had started to increase compared to earlier in the year. Moreinformation is needed on the marketing patterns for livestock to understand the significance of theseobservations.
The present Census shows that over the country as a whole, livestock numbers per family are lowerthan found in the surveys.
6.2 REGIONAL PRODUCTION SYSTEM AND PRODUCER CHARACTERISTICS
The classification of provinces into agro-ecoregions was based on expert opinion. Provinces that aresimilar in terms of production calendar, natural resource endowment and climatic conditions weregrouped together. Badakhshan is different enough from all other provinces to merit definition as aunique agro-ecological region. From Level 1 data, several summary statistics were computed thatdemonstrated regional differences in livestock wealth, including species-specific differences. Thesedata help understand subsequent summaries on the basis of agro-ecological region.
Forage productionThe forage production identified wheat straw, Shaftal (Persian clover), Lucerne, maize straw andmaize as the important cultivated and crop-aftermath forages produced on farm. There wereconsiderable differences between agro-ecological regions in some forages, but clearly the mostimportant on-farm feed resource across the whole country is wheat straw. Among the purchasedfeeds that are currently used, cotton seed cake, wheat straw, wheat bran and Lucerne are the mostpopular. When asked about preferences for purchased feeds, farmers tended to favour concentrate feed.
When planning interventions for on-farm forage production, the differences between regions shouldbe taken into account. Except for the northern region, farmers seem to favour forages and cropaftermath. Shaftal was particularly popular in the East and Centre-East regions.
Length of feeding periodOn average livestock is out on pastures for more than half of the year. Animals need to be fed in thewinter between 4 and 8 months, depending on region. The very long period for Centre-East is clearlyconditioned by Kabul (see Appendix for province-level data), due to the limited grazing capacityaround Kabul City. Information about grazing periods was not asked separately for the differentlivestock species. However, it is clear that large numbers of the lactating cattle, especially in the Eastand Centre-East, are also stall-fed during most of the spring and summer months.
The length of the winter feeding period compounds the generally extremely low forage productioncapacity to create a 'winter feed gap', probably the most critical constraint for livestock production inmost parts of Afghanistan. This is definitely the most critical intervention needed. However, it must berecognized that this constraint limits the number of animals grazing rangelands the rest of the year.Given the extremely deteriorated condition of rangelands in Afghanistan (appropriate quantitativedata are lacking and should be urgently procured), the 'winter feed gap' may currently be animportant safety mechanism preventing further, perhaps irreversible destruction of rangelands. Thisimplies that in locations, were grazing of livestock is important, forage interventions must not takeplace outside a watershed rehabilitation context, lest incentives be created to even further increasepressure on already overstressed rangeland grazing resources.
Production calendarThe forage year appears to begin in March for most of the country. This coincides with the maincalving and lambing periods and the begin of lactation for a large proportion of the livestock. Theaverage early turnout in the northern and western regions is somewhat surprising. Certainly, thebegin of the forage year or grazing season in higher elevations occurs much later.The distribution pattern for end of grazing season was much less clear. For most of the country, thegrazing season ends in September - November. The western region is relatively late with mostrespondents indicating November as the end of the grazing period. However, Kuchi nomads beginleaving higher elevation pastures in some areas as soon as late August.
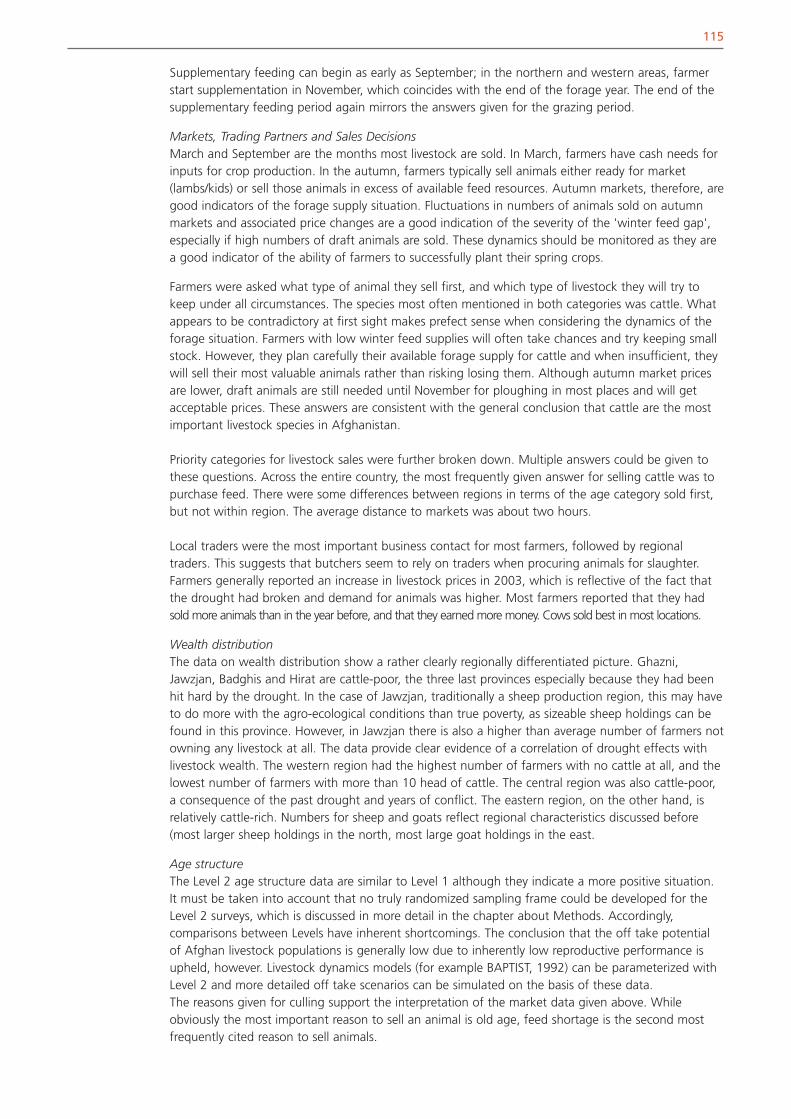
115
Supplementary feeding can begin as early as September; in the northern and western areas, farmerstart supplementation in November, which coincides with the end of the forage year. The end of thesupplementary feeding period again mirrors the answers given for the grazing period.
Markets, Trading Partners and Sales DecisionsMarch and September are the months most livestock are sold. In March, farmers have cash needs forinputs for crop production. In the autumn, farmers typically sell animals either ready for market(lambs/kids) or sell those animals in excess of available feed resources. Autumn markets, therefore, aregood indicators of the forage supply situation. Fluctuations in numbers of animals sold on autumnmarkets and associated price changes are a good indication of the severity of the 'winter feed gap',especially if high numbers of draft animals are sold. These dynamics should be monitored as they area good indicator of the ability of farmers to successfully plant their spring crops.
Farmers were asked what type of animal they sell first, and which type of livestock they will try tokeep under all circumstances. The species most often mentioned in both categories was cattle. Whatappears to be contradictory at first sight makes prefect sense when considering the dynamics of theforage situation. Farmers with low winter feed supplies will often take chances and try keeping smallstock. However, they plan carefully their available forage supply for cattle and when insufficient, theywill sell their most valuable animals rather than risking losing them. Although autumn market pricesare lower, draft animals are still needed until November for ploughing in most places and will getacceptable prices. These answers are consistent with the general conclusion that cattle are the mostimportant livestock species in Afghanistan.
Priority categories for livestock sales were further broken down. Multiple answers could be given tothese questions. Across the entire country, the most frequently given answer for selling cattle was topurchase feed. There were some differences between regions in terms of the age category sold first,but not within region. The average distance to markets was about two hours.
Local traders were the most important business contact for most farmers, followed by regionaltraders. This suggests that butchers seem to rely on traders when procuring animals for slaughter.Farmers generally reported an increase in livestock prices in 2003, which is reflective of the fact thatthe drought had broken and demand for animals was higher. Most farmers reported that they hadsold more animals than in the year before, and that they earned more money. Cows sold best in most locations.
Wealth distributionThe data on wealth distribution show a rather clearly regionally differentiated picture. Ghazni,Jawzjan, Badghis and Hirat are cattle-poor, the three last provinces especially because they had beenhit hard by the drought. In the case of Jawzjan, traditionally a sheep production region, this may haveto do more with the agro-ecological conditions than true poverty, as sizeable sheep holdings can befound in this province. However, in Jawzjan there is also a higher than average number of farmers notowning any livestock at all. The data provide clear evidence of a correlation of drought effects withlivestock wealth. The western region had the highest number of farmers with no cattle at all, and thelowest number of farmers with more than 10 head of cattle. The central region was also cattle-poor,a consequence of the past drought and years of conflict. The eastern region, on the other hand, isrelatively cattle-rich. Numbers for sheep and goats reflect regional characteristics discussed before(most larger sheep holdings in the north, most large goat holdings in the east.
Age structureThe Level 2 age structure data are similar to Level 1 although they indicate a more positive situation.It must be taken into account that no truly randomized sampling frame could be developed for theLevel 2 surveys, which is discussed in more detail in the chapter about Methods. Accordingly,comparisons between Levels have inherent shortcomings. The conclusion that the off take potentialof Afghan livestock populations is generally low due to inherently low reproductive performance isupheld, however. Livestock dynamics models (for example BAPTIST, 1992) can be parameterized withLevel 2 and more detailed off take scenarios can be simulated on the basis of these data. The reasons given for culling support the interpretation of the market data given above. Whileobviously the most important reason to sell an animal is old age, feed shortage is the second mostfrequently cited reason to sell animals.

6.3 WOMEN SURVEY
The women survey focused on three areas: work distribution between men, women and children,decision making authority, and goals, preferences and problems formulated by the women farmers.Questions about work distribution and decision making were by livestock species. The results indicatethat the responsibility for specific tasks is distributed among genders and age groups in characteristicways independent of livestock species. Activities that would require work outside the homesteadcompound are mostly handled by men and children. Feeding livestock (at the homestead) is typically atask for which women are responsible, whereas herding grazing animals is a task perfumed bychildren and to a lesser degree by men. Watering animals, tending young and milking animals is theresponsibility of women. Treating sick animals is a task performed mostly by men; however, for smallruminants, the involvement of women in animal treatment is larger. These clear patterns of division oflabour suggest the need to consider gender in interventions. For example, tuberculosis preventionshould specifically target women since they are most exposed to lactating animals. Likewise, they areresponsible for feeding animals on farm. Feeding improvement interventions targeting especially dairyanimals should be aware of the need to consider special training needs for women, but also the factthat decisions about input supply are largely made by men. Since the herding of grazing animals islargely a task of children, interventions increasing work load due to herding will likely impact schoolenrolment and should be carefully monitored.
Decision making in livestock production is mostly a domain of men, but for some important activities,such as purchasing cattle, or selling livestock in general, more than a third of the respondentsreported that women make these decisions. Women also decide milk and wool sales. Women play animportant role in decision making about treating sick animals and this should be reflected in thedesign of veterinary programs.
The vast majority of women selected cattle as the species preferred for expansion of their livestockholdings. The most frequently cited intention of using cattle was milk production for sale. The nextmost important species for women was poultry; the most frequent reason given was egg productionfor sale. Sheep were selected only by about 15 percent of all respondents as the livestock specieswhich they preferred for future investments. More than half of those respondents preferring sheepdid not actually own sheep, but all of the women who wanted to have (more) sheep, also ownedcattle. Preferences for sheep were explained by milk and meat, and to a lesser degree by woolproduction. Goats were not a preferred livestock species for women farmers, and proposals to expandgoat production or introduce specific goat systems such as dairy-emphasis goat production should becarefully piloted and evaluated for adoption.
Most women named problems with feeding as the most important for cattle, sheep and goatproduction, followed by better veterinary health care. Answers for other possible problems wereheterogeneous and should be consulted for the planning of specific improvement interventions.
Answers given for desired improvements largely reflected the corresponding answers for the mainproblems. Improvement of feed supply and veterinary health care were the most frequently requestedinterventions. In general, the respondents did not seem to perceive labour, market access or lack ofknowledge as burning problems. Especially the answers regarding the lack of knowledge suggestpotential difficulties in implementing farmer training programs.
6.4 KARAKUL SURVEY
The Karakul survey produced some limited information about production parameters and marketopportunities. However, the high variability of the given answers precludes strong conclusions. It isalso not clear from the survey how much Karakul sheep production in general is contributing to thelivelihoods of the farmers. Large Karakul sheep herds exist and most interviewed farmers expected tosell more, and were interested in producing more. Karakul production was traditionally an importantlivestock sector in Afghanistan; considerable market research is necessary to determine its futurepotential.
116

117
photos by Pittroff


7. METHODS7.1 SURVEY DESIGN
From the outset, the census was designed to take place on two levels. Level 1 was planned as acomplete enumeration. There were no reliable baseline data, and such an effort is required in order tobegin a systematic census program needed for designing sector policies, development interventions,and national vaccination programs.
Typically, in national censuses the approach is to develop an appropriate sampling frame for randomsampling that allows the creation of 'gold standard' data against which total enumeration data arethen evaluated. This was not possible in Afghanistan. Although the comparison was attempted (seeSection 7.2), neither level could, in fact, provide 'gold standard' data quality data. However, theresults of this census allow the definition of an appropriate sampling frame for the future.Accordingly, the methodology described in Section 7.2 can be considered a reference for future work.
The design of the census on two levels was motivated primarily by two considerations: first, acquiredetailed production system data, and second, create a data set that allows consistency checking ofLevel 1 data where feasible. While the comparison, as discussed, suffered from inherent samplingdesign problems impossible to avoid, the analysis of production system characteristics was verysuccessful and further supported by data derived in the survey of female livestock owners.
119
As this report amply documents, data from both levels are intrinsically consistent and provide anexcellent summary picture of the Afghan livestock sector. The key problems and most promisingintervention routes were identified. Level 2 results allow the application of livestock herd dynamicmodels (for example Baptist, 1992) to extrapolate herd growth and potential off take data. Theimpact of the drought on animal numbers was identified by the survey; however, the reasons for thedecline of animal numbers are manifold. For example, many farmers in Afghanistan sell livestockwhen their wheat crop fails. While often this coincides with forage shortages caused by drought, thesale of the animals does not necessarily coincide with the worst state of the pastures in a drought.
photo by Rlung

120
7.2 ANALYSIS METHODOLOGY
Most of the analysis effort was invested in data cleaning. The most critical problem encountered wasthe separation of true zero answers from missing answers. Many statistics required the computation ofratios (for example, number of certain livestock per species, or number of young per dam, etc.). Thefrequent inconsistency of data entries as a result of unsatisfactory distinction between true zero andmissing answer required considerable verification effort. With the exception of the Level comparisonstatistics, only basic univariate summary statistics were employed. Additional analysis is conceivable, forexample discriminate analysis verifying that the definition of agro-ecological zones adequately reflectsimportant production system characteristics. Further, reproduction data could be used for livestockpopulation dynamics modelling.
Most of the analysis effort was invested in data cleaning. The most critical problem encountered was the separation of true zero answers from missing answers. Many statistics required the computation of ratios (for example, number of certain livestockper species, or number of young per dam, etc.). The frequent inconsistency of data entries as a result of unsatisfactory distinction between true zero and missing answer required considerable verification effort. With the exception of the Level comparison statistics, only basic univariate summary statistics were employed. Additional analysisis conceivable, for example discriminate analysis verifying that the definition of agro-ecological zones adequately reflects important production system characteristics. Further, reproduction data could be used for livestock population dynamics modelling.
7.3. Data consistency
Assumptions and Notation Comparison of Level I and Level II observations were made at the district level. Level I observations are regarded as census data. We denote ratios of number of livestock per family in a district by:
cattle the number of cattle per family,
sheep the number of sheep per family,
goats the number of goats per family,
donkeys the number of donkeys per family,
camels the number of camels per family.
In our an alysis, we take as our null hypothesis that these ratios computed from Level I (census) data are the true district values. For example, if:
,cattle ijX the nu mber of cattle owned by the thj family in the
thi village of the district ,
and there are N villages in the district and iR families in the thi village, then:
cattle,1 1
1
iRNcattle iji j
Nii
X
R .
The four other ratios are computed in the same manner.
Level II observations are obtained from sub-samples of families that have been randomly selected from
each of n villages. Let ir denote the number of families selected from the thi village. The n villages
were randomly selected from the district. Thus a Level II observation, ijY , is represented as:
ij i ijY , 1, 2, , i n , 1, 2, , ij r ,
where
the mean of all ijY ís in the district,
i the deviation of the mean of all ijY ís in the thi village from ,
and
ij the deviation of ijY from the mean of all ijY ís in the thi village.
Because both the number of villages and the number of families in the Level II data are generally qui te small relative to the corresponding numbers in the population (Level I data), we ignore the use of finite
7.3 DATA CONSISTENCY

121
population correction factors in our analysis and regard i ís and ij ís as random components in our
representation of ijY . [Asid e: Use of finite population correction factors in our analysis likely would
have the effect of slightly decreasing our standard error estimates fo r Level II estimates of district means.This would result in slight strengthening of the conc lusions that we present.] Thus, we assume that:
i ís iid 20,. and ij ís iid
20,. ,
Comparisons of Level I and Level II Observations
We outline the basic analysis for cattle data only, and then present results of our analyses for catt le,sheep, goat, donkey and camel data. Under the null hypothesis that
cattle,1 1
1
iRNcattle iji j
Nii
X
R
is the true ratio of cattle per family in a given district, we compute:
cattle cattlecattle
cattle
ˆt
ˆs.e.,
where
cattleˆ,1 1
1
irncattle iji j
nii
Y
r,
is an unbiased estimator of cattle computed from the Level II data. Derivation and computation of
the standard error of cattleˆ , cattleˆs.e. , follows.
Derivation of Standard Erro r :
Letting 1n
iim r (and dropping the subscript ìcattleî for notational convenience), we have
that:
cattleˆ 1 1
1
irniji j
nii
Y
r 11 ni.im Y ,
where replac ement of a subscript by a dot indicates summation over that subscript. Becauseobservations from different villages are independent due to the random sampling of villages:
cattle ..ˆVar Var Y 211 n
i.im Var Y 211 n
i.im Var Y .
Using our mixed model representation of ijY :
1 1 1 ,i i ir r ri. ij ij iji j j
j j
Var Y Var Y Cov Y Y
2 2 21i i ir r r
2 2 2i ir r .

122
Therefore:
121 n
.. i.iVar Y Var Ym
2 2 212
1 ni ii r r
m2
2 212
1nii r
mm
We note that for the special case in which equal numbers of families are sub-sampled in each
village, i.e.,
(say)1 2 nr r r r , so that m nr , then:
..Var Y 2 21 1n nr
.
Restricted maximum likelihood (REML) estimates of 2
and2
, which we denote by 2ˆ and
2ˆ respectively, were obtained using the VARCOMP Procedure of SAS Version 9.0. The
estimated variance of ..Y (or cattleˆ ) was computed as:
22 21
21n
ii.. cattle
rˆ ˆ ˆVar Y Var
mm ,
and the standard error of ..Y (or cattleˆ ) then was computed as:
22 21
21n
ii.. cattle
rˆ ˆ ˆs.e. Y s.e.
mm
Example Calculation of cattlet :
We use observations from the Qadi s district of Ba dghis provinc e to illustrate the calculation of
cattlet . The Level I (census) value for cattle in the Qadis district is:
0 5105cattle . .
Families from six ( n 6) villages in the Qa dis district were randomly sub-sampled for Level IIobservation. The numbers of families selected were (in no particular order):
1 5r , 2 4r , 3 1r , 4 5r , 5 5r and 6 5r .
The Level II estimated ratio of cattle per family was 2 4000cattleˆ . . REML estimates of the
variance components were:
2 1 35743ˆ . and 2 6 41973ˆ . ,
so that the standard error of cattleˆ was computed as:

123
Conclusions and DiscussionIf Level 2 data are randomly selected sub-samples from districts, then the distributions of the valuesare inconsistent with the hypothesis that Level 1 (census) values are true values. However, Level 2observations were sampled mostly from families with livestock, and no sampling frame could bedeveloped based on the distribution of livestock wealth from Level 1 data. In total, only 29respondents in Level 2 (of 1284) had no livestock at all. Therefore, we should expect the distributionsof the values to exhibit the tendencies noted in the table above. This, of course, is because Level 2ratios are estimating the ratios of number livestock to number of families, given that the family haslivestock, whereas Level 1 data are global averages of number of animals per family, definitelyincluding all families that had no livestock. Thus, there are three potential sources of bias in the Level2 data: one is the fact that the number of families without livestock in the sample is likely notrepresentative of the number of families without livestock in the population. This bias could becorrected if the number of families without livestock (for each specific species in question) could bereliably estimated from Level 1 data. However, this is not possible since the questions about numberof families without livestock in Level 1 were not species-specific. The next source of bias is wealthdistribution. Level 1 data are global community averages per family – not allowing to derive afrequency distribution of livestock ownership according to wealth classes as discussed above. If weknow the proportion of families in each district who possess no livestock of a given type, then bias-correction adjustments can be made to our Level 2 ratios. The bias-corrected Level 2 ratios can thenbe reanalyzed using the procedures outlined herein to assess accuracy of the Level 1 (census)observations. The third source of bias is the selection of villages for Level 2 sampling. Althoughenumerators were asked to not intentionally select villages for sampling, systematic sampling basedon convenience criteria is of course likely. However, since no village list was available at the start ofLevel 2, randomized sampling of villages was not possible.
22 21
21n
ii.. cattle
rˆ ˆ ˆs.e. Y s.e.
mm
2 2 2 2 2 2
25 4 1 5 5 5 11 35743 6 41973
2525. .
0 71477. .
Finally, we compute cattlet as:
0 51050 2 4000 2 6440 71477cattle
. .t .
. .
Summary of Results :
The following table presents values of cattlet ( sheept , goatst and donkeyst are given in the Tables A -
A). If the ratios cattle , sheep , goats and donkeys computed using the Level 1 (census) data are
the true district values, th en corresponding values of cattlet , sheept , goatst and donkeyst shou ld
behave approximately like independent standard normal random variables based on Central Limi t Theorem arguments. As a rule of thumb, approximately 95 percent of the values should fall betweenminus two and plus two, and essentially all values should fall betwee n minus three and plus thre e. Further, values should be distributed somewhat symmetric ally about zero. All four tables exhibit, to varying degrees, the following tendencies:
1. An excess (relative to our rule of thumb) of large t values.
2. Most t values are positive, i.e., values tend to be greater than zero.
Conclusions and DiscussionIf Level 2 data are randomly selected sub-samples from districts, then the distributions of the t values are inconsistent with the hypothesis that Level 1 (census) values are true values. However, Level 2 observations were sampled mostly from families with livestock,and no sampling frame could be developed based on the distribution of livestock wealthfrom Level 1 data. In total, only 29 respondents in Level 2 (of 1284) had no livestock atall. Therefore, we should expect the distributions of the t values to exhibit the tendencies noted in the table above. This, of course, is because Level 2 ratios are estimating the ratiosof number livestock to number of families, given that the family has livestock, whereas Level 1 data are global averages of number of animals per family, definitely including all families that had no livestock. Thus, there are three potential sources of bias in the Level 2 data: one is the fact that the number of families without livestock in the sample is likely not representative of the number of families without livestock in the population. This biascould be corrected if the number of families without livestock (for each specific species in question) could be reliably estimated from Level 1 data. However, this is not possible since the questions about number of families without livestock in Level 1 were not species-specific. The next source of bias is wealth distribution. Level 1 data are global community averages per family – not allowing to derive a frequency distribution of livestockownership according to wealth classes as discussed above. If we know the proportion offamilies in each district who possess no livestock of a given type, then bias-correction adjustments can be made to our Level 2 ratios. The bias-corrected Level 2 ratios can then be reanalyzed using the procedures outlined herein to assess accuracy of the Level 1 (census) observations. The third source of bias is the selection of villages for Level 2 sampling. Although enumerators were asked to not intentionally select villages for sampling, systematic sampling based on convenience criteria is of course likely.

124
Table 131 Comparison of cattle numbers in selected districts from Level 1 and Level 2 observations
Obs Province District cattleπ ˆ cattleπ s.e.( ˆ cattleπ ) cattlet
1 Badghis Qadis 0.511 2.400 0.715 2.644
2 Baghlan Baghlan 1.805 3.849 1.045 1.956
3 Baghlan Dushi 1.718 4.344 0.493 5.325
4 Baghlan Khinjan 2.477 5.563 0.675 4.571
5 Balkh Dawlat Abad 0.350 2.250 0.201 9.463
6 Bamyan Kamhard 2.001 2.571 0.869 0.656
7 Bamyan Saighan 1.534 2.321 0.437 1.804
8 Bamyan Shibar 1.050 1.100 0.307 0.164
9 Bamyan Yakawlang 1.708 3.214 1.120 1.345
10 Farah Anar Dara 0.446 1.432 0.352 2.802
11 Faryab Dawlat Abad 0.291 1.821 0.345 4.434
12 Ghazni Dih Yak 0.997 2.231 0.320 3.855
13 Ghazni Zana Khan 0.429 1.936 0.690 2.184
14 Ghor Tulak 0.851 2.640 0.668 2.680
15 Hilmand Nad Ali 1.961 4.000 0.811 2.514
16 Hirat Ghoryan 0.380 1.600 0.537 2.270
17 Hirat Kohsan 0.289 0.611 0.224 1.441
18 Hirat Obe 0.936 2.449 0.317 4.774
19 Jawzjan Qurghan 0.105 1.379 0.445 2.864
20 Kabul Chahar Asyab 1.121 4.067 0.496 5.939
21 Kabul City Nahya 14 0.060 6.375 1.235 5.113
22 Kapisa Hisa Awal Kohistan 3.020 4.200 1.321 0.894
23 Kunduz Dasht Archi 1.628 8.100 3.065 2.112
24 Kunduz Imam Sahib 3.764 15.900 6.623 1.832
25 Laghman Alingar 2.211 4.036 0.314 5.812
26 Logar Baraki Barak 1.256 4.807 1.234 2.877
27 Logar Charkh 0.725 4.474 0.589 6.362
28 Nangarhar Kama 5.053 4.515 0.554 -0.970
29 Nangarhar Khogyani 2.235 3.278 0.531 1.965
30 Nangarhar Muhmand Dara 2.654 5.359 0.460 5.887
31 Nangarhar Pachir Wa Agam 2.515 4.191 0.746 2.246
32 Nimroz Khash Rod 0.667 2.600 0.568 3.403
33 Paktika Mata Khan 2.345 5.917 1.965 1.818
34 Paktika Sharan 2.214 3.000 1.025 0.767
35 Paktya Chamkani 3.409 4.923 0.970 1.560
36 Paktya Dandi Patan 3.432 8.526 3.359 1.516
37 Parwan Bagram 1.404 4.037 0.405 6.505
38 Parwan Jabalusaraj 1.306 5.200 1.126 3.457
39 Samangan Kaldar 1.078 3.750 0.751 3.555
40 Samangan Khulm 0.416 3.875 2.048 1.689
41 Sari Pul Sayed Abad 1.750 2.000 0.730 0.342
42 Takhar Ishkamish 1.561 7.800 2.681 2.327
43 Takhar Yangi Qala 2.087 7.100 2.029 2.471
44 Zabul Shahjoy 0.777 3.148 0.695 3.413
45 Zabul Shahr-e-Safa 0.965 3.087 0.789 2.688
While the exact comparison between Levels 1 and 2 ultimately proved impossible, we shouldcomment on general tendencies exhibited in the data. The production system data from Level 2appear to be plausible and coherent. Likewise, summary statistics from Level 1, for example on agestructure, are compatible with expert opinion about levels of reproduction typical for the extreme lowinput conditions of Afghanistan. No systematic bias could be detected. Thus, we arrived at theconclusion that the census data provide a reliable picture of the Afghan livestock sector.
7.4. KEY LESSONS LEARNED
“Statistical inference, properly interpreted, can be misleading. But the nature of statistical evidence issuch that we cannot observe strong misleading evidence very often.” (Chambers and Skinner, 2003;p. 60)
Important lessons were learned in the Afghan National Livestock Census. They fall into the categoriesof Methodology, Organization and Supervision, Logistics, and Analysis.
MethodologyThe Census was designed to be conducted on two levels of sampling intensity (in terms of amount ofinformation asked from farmers). Level 1, or total enumeration, had the explicit objective of visitingevery community in Afghanistan and enumerate livestock numbers by species, relating it to numberof families. Level 2, or sub sampling, had the objective to gather detailed production systeminformation and data that could assist in the interpretation of the general stock inventories gatheredin Level 1 and inform the design of interventions in the livestock sector.A survey requires a sampling frame. A frame is an operational representation of the population unitsof interest (in the case of the Afghanistan National Livestock Census, all farmers). A frame could befor example a list of all farmers. Typically, there would be various steps involved in developing asampling frame for general populations. In any case, at some point a list of all objects in the area tobe sampled must be available. This was obviously not possible for the Census. Accordingly, the onlyfeasible solution for the estimation of livestock populations in Afghanistan was total enumeration.However, information on a more detailed level was required, given the near-total lack of informationabout production system characteristics, markets, and producer problems and preferences.Accordingly, a much more detailed questionnaire had to be designed and administered to a subsample of farmers in Afghanistan. However, since it was not possible to develop a sampling framebecause of the total enumeration survey being conducted almost concurrently, certain aspects of theLevel 2 survey data may be biased. Sources of bias include omission of provinces (due to security andlogistics issues), non-random selection of villages within districts and provinces and non-randomselection of farmers (because no frame was available). Accordingly, Level 2 violated one of Dalenius’srequired prerequisites of a survey (as cited and discussed in Biemer and Lyberg, 2003, p. 4) – thesampling of units from the frame in accordance with a sampling design specifying a probabilitymechanism and a sample size. This critical issue affected certain aspects of Level 2 results, inparticular composite statistics on number of livestock per family, as discussed above. However, theconsistency of data on production system properties and farmer preferences clearly demonstrates thateven a survey impacted by (in our case unavoidable) design deficiencies can produce valuable andtrustworthy data, if conducted by a responsible field team. In fact, given the enormous logisticsproblems typically faced by survey teams in developing countries, it is arguable if the rigorousconditions theoretically required are ever met. What is needed, however, is an assessment anddiscussion of possible sources of error. Unfortunately, this seems to be very rarely accomplished inpractice. As the key lesson learned we conclude that a more rigorous description of methods forsurvey design and analysis of data gathered under conditions not meeting ‘ideal’ requirements wouldbe useful for practitioners.
The methodology problems encountered in the Afghanistan National Livestock Census had two majorsources:
(1) The time restrictions implied by the donor (2) The security problems restricting access to parts of the country
125

The implications of these restrictions, which seem to be frequently encountered in similar surveyscenarios, will be discussed next.
LogisticsOne of the most critical problems encountered when reviewing previous FAO livestock surveys inAfghanistan was the proper identification of location. As detailed in this report, considerableconfusion persists about delineation of districts. As a result, unique identification of sampling units(typically mosque communities within village) for Level 1 (total enumeration) data collection wasexpected to be difficult. To remedy the problem of non-unique identification of sampling units, it wasproposed to equip all surveying teams with GPS units for the recording of geographical coordinatesthat would ensure unique identification. However, the timeline set by the donor made it impossible towait until all equipment had arrived. As a result, a major effort had to be invested in uniqueidentification of locations (communities visited for total enumeration). This was a key problem inpreparing the data for comparison with Level 2 data. Obviously, the translation from and into Dariand operational difficulties in maintaining translation standards compounded the problem.Nevertheless, the key lesson learned is that census quality is a direct function of available time forpreparation and execution. In the preparation of a livestock census operation, all logistical problemsmust be analysed carefully and their impact on data quality assessed as conservatively as possible. It iscritically important to maintain good and direct communications between the donor and the censusteam to ensure that spending deadlines do not impinge upon survey quality. If a census beginswithout the necessary preparation, delays in data analysis are unavoidable if minimal standards ofdata quality, integrity and utility are to be maintained.
Organization and SupervisionThe number of people employed in the Afghanistan National Livestock Census indicates the scopeand intensity of a task of this magnitude. Given the extraordinary difficulties accessing communities inAfghanistan, the extent to which farmers were reached constitutes a major achievement by itself. Theorganization scheme employing numerator teams and supervisors in all provinces worked well for thedata collection process. However, a critical problem that could have been prevented to a certaindegree by reallocation of personnel resources became apparent during the data analysis process. Asdescribed above, one of the most difficult, and in some cases almost intractable problems is thedifferentiation between true zero responses, and no or missing responses. In particular in thecalculation of summary statistics such as livestock per family, or number of young per adult femalethe confounding of true zeros and missing observations causes enormous problems that requireconsiderable time to resolve. An important lesson learned in the Afghanistan National LivestockCensus, therefore, is that consistency checking of data sheets and data entry should begin as soon asthe first field data arrive at the census headquarters. As long as enumerators are in the field,corrections are possible with manageable effort. Post hoc data corrections are very difficult, timeconsuming and costly. Thus, not only is it necessary to employ a data entry team that facilitatesconsistency checking, there should be an additional team that interfaces between the enumerator –supervisor teams and the data entry teams. The task of this team should be the immediate checkingof data sheets and identification of all instances of inconsistent information. It is necessary to developa special manual for this team that facilitates this task. This manual should be developed during thetesting phase of the survey.
Although an effort was made to ensure spelling consistency, the level of preparation of the data entryteam was not consistent, especially in terms of knowledge of English. If language problems of thelevel of complexity encountered in Afghanistan are to be expected, data files should be checked byan additional group of personnel trained specifically to identify spelling consistency problems.Especially if multi-level surveys are conducted, comparisons between survey levels will be extremelytime-consuming or even impossible if spelling problems have been resolved post-hoc.
Investment in adequate personnel support during data collection and data entry is the key factor intimely execution and analysis of livestock surveys.
126
127
AnalysisMost problems encountered in the analysis of the Afghanistan National Livestock Census data werecaused by a few, well defined issues. Chief among them were: differentiation between true zeros andno/missing response, proper identification of location, and spelling inconsistency.
While the methods needed for census data analysis are not very sophisticated, comparison betweenlevels or analysis of triangulated questions can be very involved, as the above section on comparisonmethodology suggests. More sophisticated methods will be useful only, however, if the quality of datamatches their requirements. The most critical issue in survey statistics is the definition of the samplingframe and the appropriate definition of sampling size. As discussed above, this was not possible forLevel 2 within the time frame set by the donor.
Livestock surveys are often necessary in post crisis situations, where very little if any tangibleinformation needed for the construction of a sampling frame is available. In such cases, totalenumeration should be considered as a first step, focusing on livestock numbers, number of familiesand, if it all possible, data that allow to derive a distribution of livestock wealth classes so that thisimportant factor can be considered in subsequent survey work. After the analysis of totalenumeration data, the next step for the development of a sampling frame for more detailed analyseswould be the selection of villages/communities within district and province. For detailed Level 2 typesurveys, a sampling frame can be developed based on the randomized selection of villages. In otherwords, the selection of survey units (farmers) following a national census would be a two stepprocess, first developing a sampling frame for villages, and then for farmers (respondents) withinvillages.
The analysis of Level 2 data produced evidence of some questions not properly understood byrespondents and enumerators. Although training was conducted, a manual was written and thesurvey was tested, few survey results are free of such problems. Accordingly, the important lessonlearned is that extensive testing and in-depth analysis of test survey data pays high dividends innational census programs.
REFERENCES:
Baptist, R. 1992. Derivation of steady state herd productivity. Agricultural Systems 39:253-272
Biemer, P.P. & L.E. Lyberg. 2003. Introduction to Survey Quality. Wiley Interscience, 402 p.
Chambers, R.L. & C.J. Skinner. 2003. Analysis of Survey Data. Wiley, London 376 p.
CSO. 2003. Estimated population of Afghanistan 2003-2004, Transitional Islamic State ofAfghanistan, Kabul, Afghanistan
FAO. 1999. Activities of the Kuchi Working Team. Working Paper 1/99. FAO Kabul, Afghanistan
FAO. 2003. National Crop Output Assessment. FAO Kabul, Afghanistan

128
photo by: Pittroff

8. ANNEX8.1 DISTRICT NAMING COMPARISONS AND EXPLANATIONSThe capital cities of Provinces and the geographic areas in which they are located are not officiallydesignated as Districts. They are called Administrative Units. However, there is no differentiation madeby the people on the ground. The Ministry of the Interior therefore omits these Administrative unitsfrom their list of Districts.
During the recent periods of insecurity, additional districts have been formed in some locationsunofficially by local area commanders, and in some cases pre-existing Districts have been unofficiallymoved from one Province to another. Examples are especially found in the northern provinces ofFaryab, Jawzjan, and Balkh.
The district list used by AIMS dates from 1979 when the first and last complete human populationcensus was taken. The list of official districts provided by the Ministry of the Interior originates from1991, but unfortunately the Ministry of the Interior has no maps showing the boundaries of theseofficial districts. The Central Statistical Organisation has hand drawn maps with district boundariesand village location, which remain to be computerised. However, some official district names are notin use by the local population. The Livestock Census therefore relied on information provided to thedata collectors by village representatives, together with their own local knowledge in recordingDistrict names.
The following is an attempt to reconcile different sources of information.
129

130
B a d a k hs ha n P r o v ince
FAO LIVESTOCK CENSUS AIMS DATA MOI DISTRICTS
ARGHONJ KHWA [FAYZABAD] ARGHON J KHWAARGO [FAYZABAD] ARGO
BAHARAK BAHARAK BAHARAKDARAEEM [FAYZABAD] DARAEEM
DARWAZ BALA DARWAZ DARWAZ BALAFAYZABAD FAYZABAD (PROVINCIAL CAPITAL)ISHKASHIM ISHKASHIM ISHKASHIM
JURM JURM JURMKARAN WA MANJAN KURAN WA MUNJAN KARAN WA MUNJAN
KHASH [JURM] KHASHKHWAHAN KHWAHAN KHWAKAN
KISHIM KISHIM KISHIMKOHISTAN [RAGH] KOHISTAN
KOHISTAN RAGH [RAGH]KOOF [DARWAZ] KOOFAB
NASI DARWAZ [DARWAZ] DARWAZRAGHISTAN [RAGH] RAGHISTAN
SHAHRI BUZURG SHA HRI BUZURG SHAHRI BUZURGSHIGHNAN SHIGHNAN SHIGHNAN
SHIKI DARWAZ [DARWAZ] SHIKI (DARWAZ )SHOHADA [BAHARAK] SHOHADA
TAGAB KISHIM [KISHIM] TAGAB (KISHIM?)TESHKAN [KISHIM] TESHKANWAKHAN WAKHAN WAKHANWARDOOJ [BAHARAK] WARDOOJ
YAFTA L BALA [FAYZABAD]YAFTAL - i - PAYAN [FAYZABAD] YAFTA SUFLA
YAMGAN [JURM] YAMGANYAWAN RAGH RAGH YAWAN (GIROWAN)
ZEBAK ZEBAK ZEBAK
• Arghonj Khwa, Daraeem, Yaftal Payan, Yaftal Bala and Argo were all part of FazyabadDistrict
• Tagab Ki shim and Teshkan (FAO and MoI) were part of Kishim District • Yangam and Khash (FAO and MoI) were part of Jurm District • Wardooj and Shohada (FAO and MoI) were part of Baharak District • Nasi Darwaz, Shiki Darwaz and Koof (FAO and MoI) were part of Darwaz Distri ct – the
remaining portion is now Darwaz Bala District • Kohistan, Kohistan Ragh, Yawan Ragh and Ragistan (FAO and MoI) were part of Ragh
District

131
B a d g is P r ov ince
FAO LIVESTOCK CENSUS AIMS DATA MOI DISTRICTS AB KAMARI AB KAMARI
BALA MURGHAB [MURGHAB]
DARA IBOUM [QADIS] GHORMACH GHORMACH GHORMACH
JAWAND JAWAND JAWAND
MUQUR MUQUR MUQUR
MURGHAB MURGHAB MURGHAB
QADIS QADIS QADIS
QALAY i NAW QALAY I NAW (PROVINCIAL CAPITAL)SANGE AATASH [AB KAMARI]
• Ab Kamari, Sange Aatash (FAO and/or MoI) were part of Qalay i Naw District• Dara i boum (FAO and/or MoI) is part of Qadis District• Bala Murghab (FAO and/or MoI) is part of Murghab District
B a g hla n P r ov ince
FAO LIVESTOCK CENSUS AIMS DATA MOI DISTRICTS
[KHOST WA FIRING] FIRING WA GHAROO
[KHOST WA FIRING] GUZARGAH I NUR
ANDARAB MARKAZ [DEHSALAH (ANDARAB)] ANDARAB
BAGHLAN MARKAZ BAGHLAN
BAGHLAN QADEEM [BAGHLANI JADEED]
BAGHLANI JADEED BAGHLANI JADEED BAGHLAN JADEED
BANOO ANDARAB [DEHSALAH (ANDARAB)]
BURKA BURKA
DAHANI-I-GHORI DAHANI-I-GHORI DAHAN I GHORI
DEH SALAH ANDARAB DEHSALAH (ANDARAB) DEH SALAH
DUSHI DUSHI
KHINJAN KHINJAN KHINJAN
KHOST WA FIRING KHOST WA FIRING KHOST WA FIRING
NAHRIN NAHRIN NAHRIN
PULI HISARI ANDARAB [DEHSALAH (ANDARAB)] PULI HISARI (ANDARAB ?)
PULI KHUMRI PULI KHUMRI (PROVINCIAL CAPITAL)
TALA WA BURFUK TALA WA BARFAK TALA WA BARFAK
• Puli Khumri (FAO)is the same as Baghlan Markaz (MoI)• Baghlan Qadeem (FAO) is officially part of Baghlan Jadeed District• Deh Salah Andarab (AIMS) has officially been divided into Deh Salah Andarab, and Pui Hisari
Andarab District (FAO and MoI).• Banoo Andarab (FAO) was part of Andarab district• Kahmard District (AIMS) is officially part of Bamyan Province• Khwaja Hijran was part of Nahrin District• Guzargah i Nur and Firing wa Gharoo were part of Khost Wa Firing District

132
B a lk h P r ov ince
FAO LIVESTOCK CENSUS AIMS DATA MOI DISTRICTS
KALDAR KALDAR
KHULM KHULM
BALKH BALKH BALKH
CHAHAR BOLAK CHAHAR BOLAK CHARBOLAK
CHAHAR KINT CHAHAR KINT CHARKINT
CHAI [DAWLATABAD]
CHIMTAL CHIMTAL CHEMTAL
DAWLATABAD DAWLATABAD DAWLATABAD
DIHDADI DIHDADI DIHDADI
KISHINDIH KISHINDIH KISHINDEH
KOHI ALBARZ [NAHRI SHAH] KOHI ALBARZ
MARMUL MARMUL MARMUL
MAZAR ISHARIF MAZARI SHARIF (PROVINCIAL CAPITAL)
NAHRI SHAHI NAHRI SHAH NAHRI SHAH
SHOLGARA SHOLGARA SHOLGARA
SHORTEPA SHORTEPA SHORTEPA
ZAREH [KISHINDIH] ZAREH
• Kaldar and Khulm (AIMS and MoI)Districts are officially in Balkh Province• Chai (FAO)was part of Dawlatabad• Zareh (FAO and MoI) was part of Kishindih District
B a m ya n P r ov ince
FAO LIVESTOCK CENSUS AIMS DATA MOI DISTRICTS
BAMYAN BAMYAN (PROVINCIAL CAPITAL)
KAMHARD [SE E BAGHLAN PROV] KAHMARD
PANJAB PANJAB PANJAB
SAIGHAN [KAHMARD] SAIGHAN
SHIBAR SHIBAR SHIBAR
WARAS WARAS WARAS
YAKAWLANG YAKAWLANG YAKAWANG
• Kamhard District (FAO and MoI) has been officially reallocated to Bamyan Province from Baghlan Province (AIMS)
• Saighnan (FAO and MoI) District was part of Kahmard District

133
F a r a h P r ov ince
FAO LIVESTOCK CENSUS AIMS DATA MOI DISTRICTS
ANAR DARA ANAR DARA ANAR DARA
BAKWA BAKWA BAKWA
BALA BULUK BALA BULUK BALA BULUK
FARAH MARKAZ FARAH (PROVINCIAL CAPITAL)
GULISTAN GULISTAN GULISTAN
KHAKI SAFED KHAKI SAFED KHAKI SAFED
LASH WA JUWAYN LASH WA JUWAYN LASH WA JUWAYN
PURCHAMAN PURCHAMAN PURCHAMAN
PUSHTE ROD PUSHTE ROD PUSHTE ROD
QALAY I KAH QALAY I KAH QALAY I KAH
QALAY I KAH PUSHT KOH QALAY I KAH PUSHT KOH QALAY I KAH PUSHT KOH
SHIB KOH QALAY I KAH SHIB KOH QALAY I KAH SHIB KOH QALAY I KAH
F a r ya b P r ov ince
FAO LIVESTOCK CENSUS AIMS DATA MOI DISTRICTS
QARAMQOL QARAMQOL
KHANI CHAHAR BAGH KHANI CHARBAGH
ANDKHOY ANDKHOY
[ANDKHOY] QURGHAN
ALMAR ALMAR ALMAR
BILCHIRAGH BILCHIRAGH BILCHIRAGH
DAWLAT ABAD DAWLAT ABAD DAWLAT ABAD
GURZIWAN [BILCHIRAGH] GURZIWAN
KHWAJA MOSA [PASHTUN KOT]
KHWAJA SABZ POSH KHWAJA SABZ POSH KHWAJA SABZ POSH
KOHISTAN KOHISTAN KOHISTAN
MAYMANA MAYMANA (PROVINCIAL CAPITAL)
PASHTUN KOT PASHTUN KOT PASHTUN KOT
QAYSAR QAYSAR QAYSAR
SHIRIN TAGAB SHIRIN TAGAB SHIRIN TAGAB
• Gurziwan (FAO and MoI) was part of Bilchiragh District.• Khwaja Mosa (FAO)was part of Pashtun Kot District• Qurghan (MoI) was part of Andkhoi
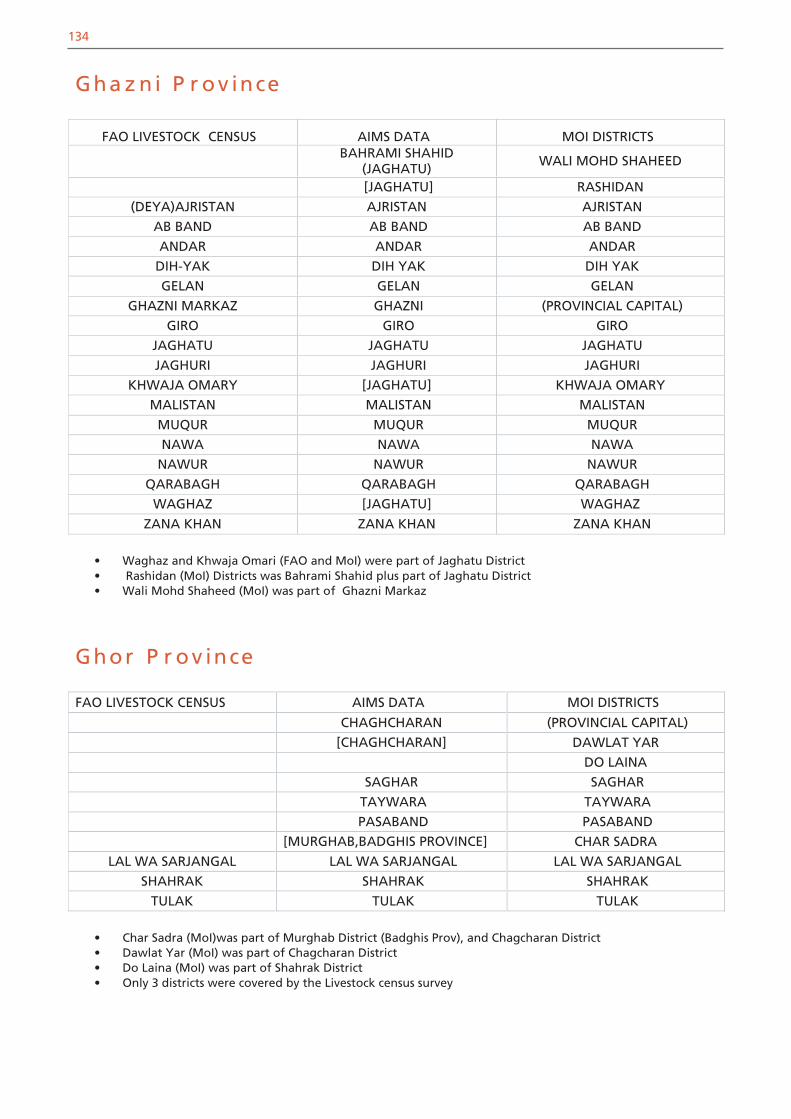
134
Gha z n i P r ov ince
FAO LIVESTOCK CENSUS AIMS DATA MOI DISTRICTS BAHRAMI SHAHID
(JAGHATU) WALI MOHD SHAHEED
[JAGHATU] RASHIDAN
(DEYA)AJRISTAN AJRISTAN AJRISTAN
AB BAND AB BAND AB BAND
ANDAR ANDAR ANDAR
DIH-YAK DIH YAK DIH YAK
GELAN GELAN GELAN
GHAZNI MARKAZ GHAZNI (PROVINCIAL CAPITAL)
GIRO GIRO GIRO
JAGHATU JAGHATU JAGHATU
JAGHURI JAGHURI JAGHURI
KHWAJA OMARY [JAGHATU] KHWAJA OMARY
MALISTAN MALISTAN MALISTAN
MUQUR MUQUR MUQUR
NAWA NAWA NAWA
NAWUR NAWUR NAWUR
QARABAGH QARABAGH QARABAGH
WAGHAZ [JAGHATU] WAGHAZ
ZANA KHAN ZANA KHAN ZANA KHAN
• Waghaz and Khwaja Omari (FAO and MoI) were part of Jaghatu District• Rashidan (MoI) Districts was Bahrami Shahid plus part of Jaghatu District• Wali Mohd Shaheed (MoI) was part of Ghazni Markaz
Ghor P r ov ince
FAO LIVESTOCK CENSUS AIMS DATA MOI DISTRICTS
CHAGHCHARAN (PROVINCIAL CAPITAL)
[CHAGHCHARAN] DAWLAT YAR
DO LAINA
SAGHAR SAGHAR
TAYWARA TAYWARA
PASABAND PASABAND
[MURGHAB,BADGHIS PROVINCE] CHAR SADRA
LAL WA SARJANGAL LAL WA SARJANGAL LAL WA SARJANGAL
SHAHRAK SHAHRAK SHAHRAK
TULAK TULAK TULAK
• Char Sadra (MoI)was part of Murghab District (Badghis Prov), and Chagcharan District• Dawlat Yar (MoI) was part of Chagcharan District• Do Laina (MoI) was part of Shahrak District• Only 3 districts were covered by the Livestock census survey

135
H i lm a nd P r ov ince
FAO LIVESTOCK CENSUS AIMS DATA MOI DISTRICTS
BAGHRAN BAGHRAN BAGHRAN
DISHU DISHU DISHU
GARMSER GARMSER GARMSER
GERISHK NAHRI SARRAJ [LASHKAR GAR] GERISHK
KAJAKI KAJAKI KAJAKI
KHANSHEEN [REG]
LASHKARGAH LASHKARGAH (PROVINCIAL CAPITAL)
MARJA [NAD ALI]
MUSA QALA MUSA QALA MUSA QALA
NAD ALI NAD ALI NAD ALI
NAW ZAD NAW ZAD NAW ZAD
NAWA NAWA NAWA
REG REG REG
SANGIN SANGIN SANGIN
WASHER WASHER WASHER
• Geriskh (FAO and MoI) was part of Lashkar Gar.• Marja (FAO) is of Nad Ali District.• Khansheen is part of Reg District.
H ir a t P r ov ince
FAO LIVESTOCK CENSUS AIMS DATA MOI DISTRICTS
ADRASKAN ADRASKAN ADRASKAN
CHISHTE SHARIF CHISTI SHARIF CHISHTE SHARIF
FARSI FARSI FARSI
GHORYAN GHORYAN GHORYAN
GULRAN GULRAN GULRAN
GUZARA GUZARA GUZARA
HIRAT HERAT (PROVINCIAL CAPITAL)
INJIL INJIL INJIL
KARUKH KARUKH KARUKH
KOHSAN KOHSAN KOHSAN
KUSHKE KUHNA KUSHKI KUHNA KUSHKE KOHNA
OBE OBE OBE
PASHTUN ZARGHUN PASHTUN ZARGHUN PASHTUN ZARGHUN
RABAT ISANGY KUSHK KUSHK
SHINDAND SHINDAND SHINDAND
ZINDA JAN ZINDA JAN ZINDA JAN

136
K a bu l P r ov ince
FAO LIVESTOCK CENSUS AIMS DATA MOI DISTRICTS
BAGRAMI BAGRAMI BAGRAMI
CHAHAR ASYAB CHAHAR ASYAB CHAHAR ASYAB
DIH SABZ DIH SABZ DEH SABZ
FARZA [MIR BACHA KOT] FARZA
GULDARA GULDARA GUDARA
ISTALIF ISTALIF ISTALIF
KABUL CITY KABUL (PROVINCIAL CAPITAL)
KALAKAN KALAKAN KALAKAN
KHAKI JABBAR KHAKI JABBAR KHAKI JABBAR
MIR BACHA KOT MIR BACHA KOT MIR BACHA KOT
MUSAYI MUSAYI MUSAYI
PAGHMAN PAGHMAN PAGHMAN
QARABAGH QARABAGH QARABAGH
SAROBI SUROBI SAROBI
SHAKADARA SHAKARDARA SHAKARDARAH
• Farza District (FAO and MoI) was part of Mir Bacha Kot District
Ja w z ja n P r ov ince
FAO LIVESTOCK CENSUS AIMS DATA MOI DISTRICTS
ANDKHOI [ANDKHOI,FARYAB PROVINCE]
AQCHA AQCHA AQCHA
DARZAB DARZAB DARZAB
FAZYABAD FAZYABAD FAYZABAD
KHAMYAB KHAMYAB KHAMYAB
KHANI CHARBAGH[KHANI CHARBAGH,FARYAB
PROVINCE]KHWAJA DUKOH KHWAJA DUKOH KHWAJA DUKOH
MARDYAN MARDYAN MARDYAN
MINGAJIK MINGAJIK MINGAJIK
QARAMQOL [QARAMQOL,FARYAB PROVINCE]
QARQIN QARQIN QARQEEN
QOSHTEPA [DARZAB] QOSHTEPA
QURGHAN [QURGHAN,FARYAB PROVINCE]
SHIBIRGHAN SHIBIRGHAN (PROVINCIAL CAPITAL)
• Andkhoi, Qaramqol, Khani Charbagh and Qurghan Districts (FAO) are officially part of Faryab Province
• Qoshtepa (FAO and MoI) was part of Darzab

137
K a p is a P r ov ince
FAO LIVESTOCK CENSUS AIMS DATA MOI DISTRICTS
ALASAI ALASAY ALASAI
HISA I AWAL KOHISTAN [KOHISTAN] HISA AWAL KOHISTAN
HISA I DOUM KOHISTAN [KOHISTAN]
KOHBAND KOHBAND KOHBAND
KOHISTAN KOHISTAN
MAHMUD RAQI MAHMUD RAQI (PROVINCIAL CAPITAL)
NIJRAB NIJRAB NIJRAB
TAGAB TAGAB TAGAB
• Officially the Districts of Kohistan, Hiasa Awal-i-Kohistan and Hisa Doum Kohistan (FAO and/or MoI) are one district – Hisa Awal-i- Kohistan District
K a nd a ha r P r ov ince
FAO LIVESTOCK CENSUS AIMS DATA MOI DISTRICTS
ARGHANDAB ARGHANDAB ARGHANDAB
ARGHISTAN ARGHISTAN ARGHISTAN
DAMAN DAMAN DAMAN
GHORAK GHORAK GHORAK
JARRI [ARGHANDAB,MAYWAND AND JARRI
KANDAHAR (DAND) KANDAHAR (DAND) (PROVINCIAL CAPITAL)
KHAKREZ KHAKREZ KHAKREZ
MARUF MARUF MARUF
MAYWAND MAYWAND MAIWAND
MEENASHEEN [SHAH WALI KOT] MEENASHIN
NESH [NESH,URUZGAN PROVINCE] NESH
PANJWAYI PANJWAYI PANJWAYI
REG [SHORABAK] REG
SHAH WALI KOT SHAH WALI KOT SHAHWALI KOT
SHIGAH [DAMAN]
SHORABAK SHORABAK SHORABAK
SPIN BOLDAK SPIN BOLDAK SPIN BOLDAK
• Jarri District (FAO and MoI) was formed from parts of Arghandab, Maywand and Panjwayi Districts
• Reg (FAO and MoI) was part of Shorabek District• Nesh (FAO and MoI) was shown on the AIMS database as part of Uruzgan Province• Shigah (FAO) is part of Daman

138
K una r P r ov ince
FAO LIVESTOCK CENSUS AIMS DATA MOI DISTRICTS
[BAR KUNAR] GHAZI ABAD
ASADABAD MARKAZ ASAD ABAD (PROVINCIAL CAPITAL)
ASMAR BAR KUNAR BAR KUNAR
CHAPA DARA CHAPA DARA (GULSALIK) CHAPADARAH
CHAWKAY CHAWKAY CHAWKAY
DANGAM DANGAM DANGAM
KHAS KUNAR KHAS KUNAR KHAS KUNAR
MARAWARA MARAWARA MANAWARA
MANOGUY PECH DARAE PECH
NARANG NARANG NARANG
NARI NARI NARI
NURGAL NURGAL NURGAL
SHIGAL [ DANGAM] SHIGAL WA SHILTON
SIRKANAY SIRKANAY (PASHIT) SIRKANI
WATA PUR [PECH] WATA PUR
• Asmar (FAO) was part of Bar Kunar District• Shigal (FAO and MoI)was part of Dangam District• Wata Pur (FAO and MoI) was part of Pech District• Ghazi Abad (MoI)was formed from parts of Bar Kunar and Kamdesh (Nuristan Province)
K hos t P r ov ince
FAO LIVESTOCK CENSUS AIMS DATA MOI DISTRICTS
[SHAMAL,PAKTYA PROVINCE] SHAMAL
ALISHIR TERE ZAYI TERE ZAI
BAK BAK BAK
GURBUZ GURBUZ GURBUZ
ISMAIL KHIL MANDO ZAYI MANDO ZAI
JAJI MAYDAN JAYI MAYDAN JAJI MAYDAN
KHOST MARKAZ KHOST (MATUN) (PROVINCIAL CAPITAL)
MUSA KHIL MUSA KHEL MUSA KHEL
NADIR SHAH KOT NADIR SHAH KOT NADIR SHAH KOT
QALANDAR QALANDAR QALANDAR
SABRI YAQUBI [SABARI]
SPERA SPERA SPERA
TANI TANI TANI
YAQUBI SABARI SABARI
• Alishir (FAO) is an alternative name for Tere Zai District• Shamal (MoI) District has been officially reallocated to Khost from Paktya Province• Yaqubi and Sabri Yaqubi (FAO and/or MoI) were Sabari District• Ismail Khel (FAO) is an alternative name for Mando Zayi
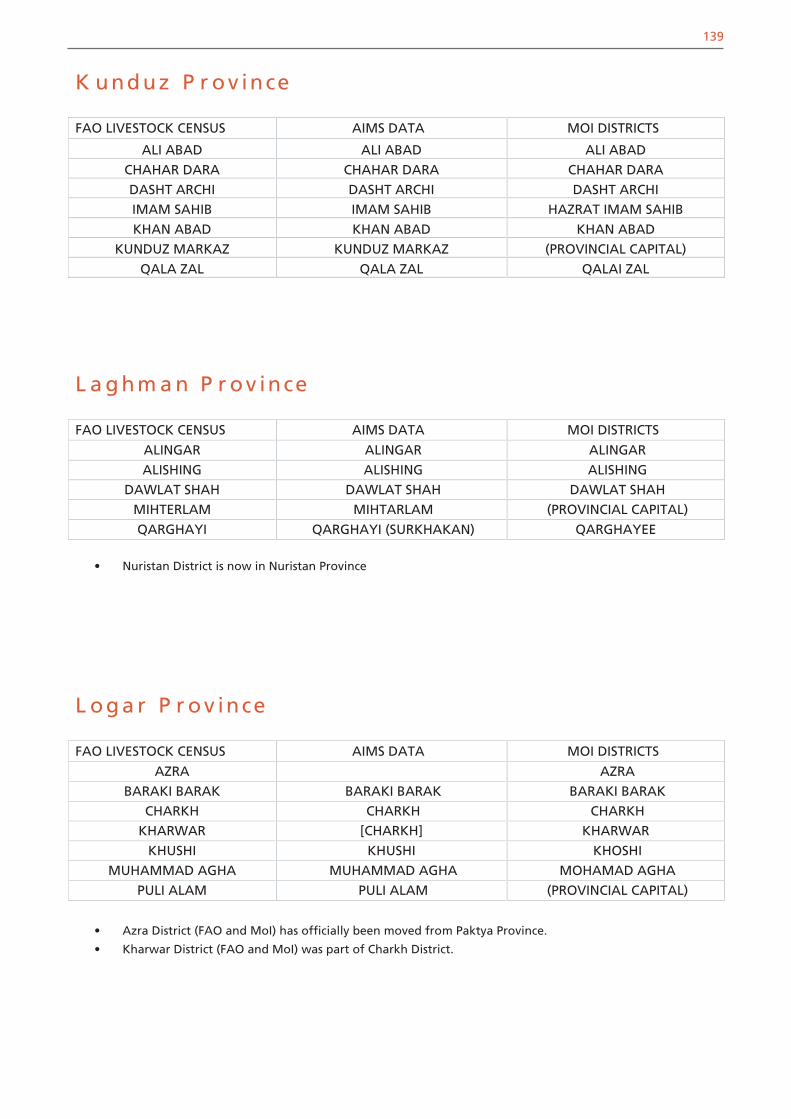
139
L a g hm a n P r ov ince
FAO LIVESTOCK CENSUS AIMS DATA MOI DISTRICTS
ALINGAR ALINGAR ALINGAR
ALISHING ALISHING ALISHING
DAWLAT SHAH DAWLAT SHAH DAWLAT SHAH
MIHTERLAM MIHTARLAM (PROVINCIAL CAPITAL)
QARGHAYI QARGHAYI (SURKHAKAN) QARGHAYEE
• Nuristan District is now in Nuristan Province
K und uz P r ov ince
FAO LIVESTOCK CENSUS AIMS DATA MOI DISTRICTS
ALI ABAD ALI ABAD ALI ABAD
CHAHAR DARA CHAHAR DARA CHAHAR DARA
DASHT ARCHI DASHT ARCHI DASHT ARCHI
IMAM SAHIB IMAM SAHIB HAZRAT IMAM SAHIB
KHAN ABAD KHAN ABAD KHAN ABAD
KUNDUZ MARKAZ KUNDUZ MARKAZ (PROVINCIAL CAPITAL)
QALA ZAL QALA ZAL QALAI ZAL
L og a r P r ov ince
FAO LIVESTOCK CENSUS AIMS DATA MOI DISTRICTS
AZRA AZRA
BARAKI BARAK BARAKI BARAK BARAKI BARAK
CHARKH CHARKH CHARKH
KHARWAR [CHARKH] KHARWAR
KHUSHI KHUSHI KHOSHI
MUHAMMAD AGHA MUHAMMAD AGHA MOHAMAD AGHA
PULI ALAM PULI ALAM (PROVINCIAL CAPITAL)
• Azra District (FAO and MoI) has officially been moved from Paktya Province.
• Kharwar District (FAO and MoI) was part of Charkh District.
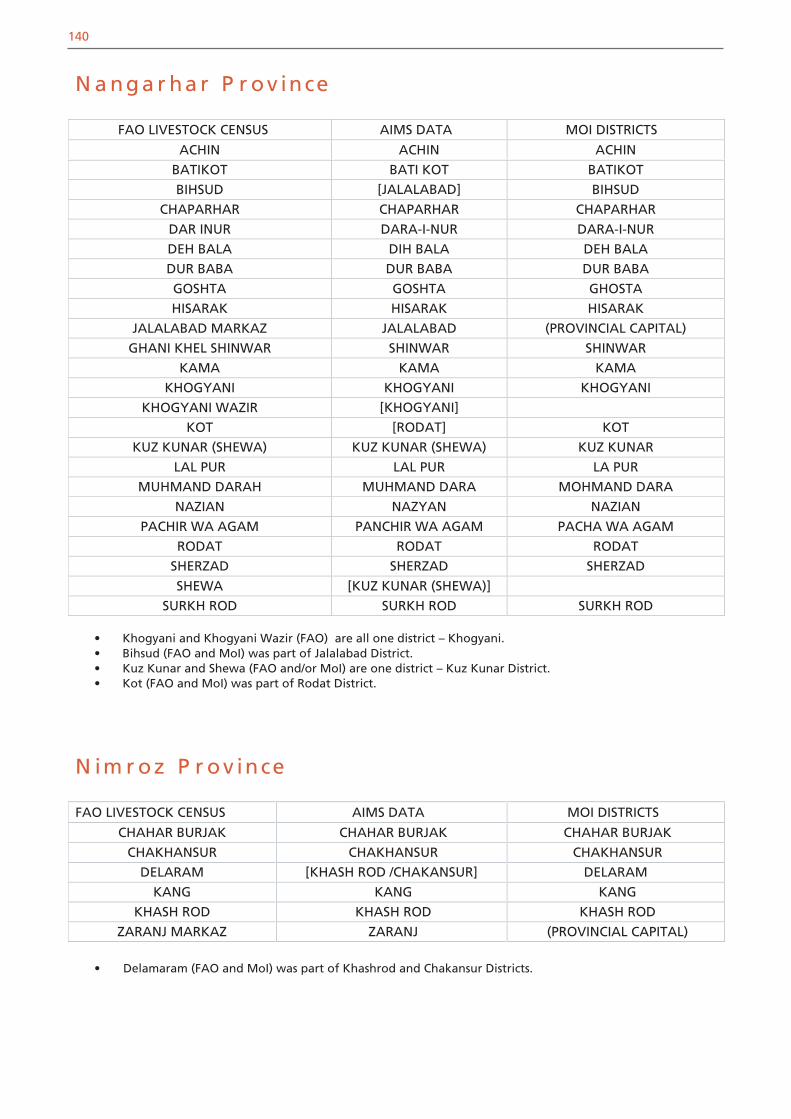
140
N a ng a r ha r P r ov ince
FAO LIVESTOCK CENSUS AIMS DATA MOI DISTRICTS
ACHIN ACHIN ACHIN
BATIKOT BATI KOT BATIKOT
BIHSUD [JALALABAD] BIHSUD
CHAPARHAR CHAPARHAR CHAPARHAR
DAR INUR DARA-I-NUR DARA-I-NUR
DEH BALA DIH BALA DEH BALA
DUR BABA DUR BABA DUR BABA
GOSHTA GOSHTA GHOSTA
HISARAK HISARAK HISARAK
JALALABAD MARKAZ JALALABAD (PROVINCIAL CAPITAL)
GHANI KHEL SHINWAR SHINWAR SHINWAR
KAMA KAMA KAMA
KHOGYANI KHOGYANI KHOGYANI
KHOGYANI WAZIR [KHOGYANI]
KOT [RODAT] KOT
KUZ KUNAR (SHEWA) KUZ KUNAR (SHEWA) KUZ KUNAR
LAL PUR LAL PUR LA PUR
MUHMAND DARAH MUHMAND DARA MOHMAND DARA
NAZIAN NAZYAN NAZIAN
PACHIR WA AGAM PANCHIR WA AGAM PACHA WA AGAM
RODAT RODAT RODAT
SHERZAD SHERZAD SHERZAD
SHEWA [KUZ KUNAR (SHEWA)]
SURKH ROD SURKH ROD SURKH ROD
• Khogyani and Khogyani Wazir (FAO) are all one district – Khogyani.• Bihsud (FAO and MoI) was part of Jalalabad District.• Kuz Kunar and Shewa (FAO and/or MoI) are one district – Kuz Kunar District.• Kot (FAO and MoI) was part of Rodat District.
N im r oz P r ov ince
FAO LIVESTOCK CENSUS AIMS DATA MOI DISTRICTS
CHAHAR BURJAK CHAHAR BURJAK CHAHAR BURJAK
CHAKHANSUR CHAKHANSUR CHAKHANSUR
DELARAM [KHASH ROD /CHAKANSUR] DELARAM
KANG KANG KANG
KHASH ROD KHASH ROD KHASH ROD
ZARANJ MARKAZ ZARANJ (PROVINCIAL CAPITAL)
• Delamaram (FAO and MoI) was part of Khashrod and Chakansur Districts.

141
N ur is ta n P r ov ince
FAO LIVESTOCK CENSUS AIMS DATA MOI DISTRICTS
BARGI MATAL BARGI MATAL BARGI MATAL
DO AAB [MANDOL] DO AAB
KAMDESH KAMDESH KAMDESH
MANDOL MANDOL MANDOL
NURISTAN NURISTAN NURISTAN
WAMA WAMA WAMA
WAYGAL WAYGAL WIGAL
• Nooristan District (AIMS) is officially in Nuristan Province.• Do Aib was part of Mandol District
P a k t ik a P r o v ince
FAO LIVESTOCK CENSUS AIMS DATA MOI DISTRICTS
ZARGHUN SHAHR ZARGHUM SHAHR ? TARAW
(BARMAL) BARMAL BARMAL DILA KHOSHMAND DILA DILA
GAYAN GAYAN GAYAN GOMAL GOMAL GOMAL
JANI KHIL [ZARGHUN SHAHR] JANI KHEL KHIR KOT [ZARGHUN SHAHR]
MATA KHAN MATA KHAN MATA KHAN NIKA NIKA NIKA
OMNA OMNA OMNA SAR HAWZA SAR HAWZA SAR HAWZA
SAROBI SAROBI SAROBI SHARANA MARKAZ SHARAN (PROVINCIAL CAPITAL)
URGUN URGUN URGUN WAZA KHAWA WAZA KHWA WAZA KHWA WOR MAMAY WOR MA MAY WORMAMAY YAHYA KHIL [ZARGHUN SHAHR] YAHYA KHEL YUSUF KHIL [ZARGHUN SHAHR] YUSUF KHEL
ZIRUK ZIRUK ZIRUK
• Yahya Khel, Yusuf Khel, Jani Khel (FAO and MoI) were part of Zarghun Shahr District.• Khir Kot (FAO) is part of Jani Khil and is not a separate d istrict.

142
P a k tya P r ov ince
FAO LIVESTOCK CENSUS AIMS DATA MOI DISTRICTS
AZRA
ADMA [ZURMAT]
AHMAD KHEIL {JAJI} LIJA AHMAD KHEL
CHAMKANI CHAMKANI CHAMKANI
DAND WA PATAN DAND WA PATAN DAND WA PATAN
DOHMANDA SHAMAL [SHAMAL]
GARDEZ GARDEZ (PROVINCIAL CAPITAL)
JAJI JAJI JAJI
JANI KHEL JANI KEL JANI KHEL
LIJA MANGAL LIJA MANGAL
SAYED KARAM SAYID KARAM SAYED KARAM
SHAMAL SHAMAL
SHWAK SHWAK SHWAK
WAZA JADRAN JADRAN WAZA JADRAN
ZURMAT ZURMAT ZURMAT
• Adma and Zurmat (FAO) are one District – Zurmat District.
• Dohmanda Shamal and Shamal (FAO) are one District – Shamal, and is now part of KHOST
Province.
• Admad Khel and Lija Mangal (FAO) are one district – Lija Ahmed Khel (MoI), which was
originally part of Jaji District.
• Azra District (AIMS) is officially part of Logar Province.
P a r w a n P r ov ince
FAO LIVESTOCK CENSUS AIMS DATA MOI DISTRICTS
BAGRAM BAGRAM BAGRAM
CHAHARIKAR CHAHARIKAR (PROVINCIAL CAPITAL)
HISA AWA PANJSHIR PANJSHER HISA AWA PANJSHIR
HISA CHAORUM PANJSHIR HISA CHAORUM PANJSHIR
HISA DOUM PANJSHIR HISA IAWALI PANJSHER HISA DOUM PANJSHIR
HISA SOUM PANJSHIR HISA IDUWUMI PANJSHER HISA SOUM PANJSHIR
JABALUSARAJ JABALUSARAJ JABALSARAJ
KOHI SAFI KOHI SAFI KOHI SAFI
SALANG SALANG SALANG
SAYED KHIL [CHARIKAR, AND JABALUSARAJ] SAYED KHEL
SHIKH ALI SHEKH ALI SHIKH ALI
SHINWARI SHINWARI SHINWARI
SIAGIRD (GHORBAND) GHORBAND GHORBAND
SURKH IPARSU SURKHI PARSA SURKHI PARSA
• Sayed Khil (FAO and MoI) is located between Charikar and Jabalusaraj Districts.• Siagird (FAO) is offically called Ghorband District.• The three parts of Panjsher (AIMS) and been divided into four districts (FAO and MoI).

143
S a m a ng a n P r o v ince
FAO LIVESTOCK CENSUS AIMS DATA MOI DISTRICTS
[KHULM,BALKH PROVINCE] FIROZ NAKHCHIRAYBAK (MARKAZ
SAMANGAN) AYBAK (PROVINCIAL CAPITAL)
DARA-I-SUF DARA-I-SUFDARA-I-SUF SUFLA [DARA-I-SUF] DARA ISUF PAYEENDARA-I-SUF-BALA [DARA-I-SUF] DARA ISUF BALAHAZRATI SULTAN HAZRATI SULTAN HAZRATI SULTAN
KALDAR [KALDAR,BALKH PROVINCE]KHORAM WA SARBAGH KHURAM WA SARBAGH KHURAN SARBAGH
KHULM [KHULM,BALKH PROVINCE]RUYI DU AB RUYI DU AB RUYI DU AB
• Dara I Suf (AIMS) has been officially divided into Dara I Suf Bala and Dara I Suf Sufla (FAO
and or MoI) Districts.
• Khulm and Kaldar (FAO) Districts are officially part of Balkh Province.
• Firoz Nakhchir (MoI) was part of Khulm District.
S a r ipu l P r ov ince
FAO LIVESTOCK CENSUS AIMS DATA MOI DISTRICTS
BALKHAB BALKHAB BALKHAB
KOHISTANAT KOHISTANAT KOHISTANAT
SANGCHARAK SANGCHARAK SANG CHARAK
SARI PUL SARI PUL (PROVINCIAL CAPITAL)
SAYED ABAD [SAYYAD]
SAYYAD SAYYAD SAYYAD
SOZMA QALA SOZMA QALA SUZMA QAA
• Sayed Abad (FAO) was part of Sayyad
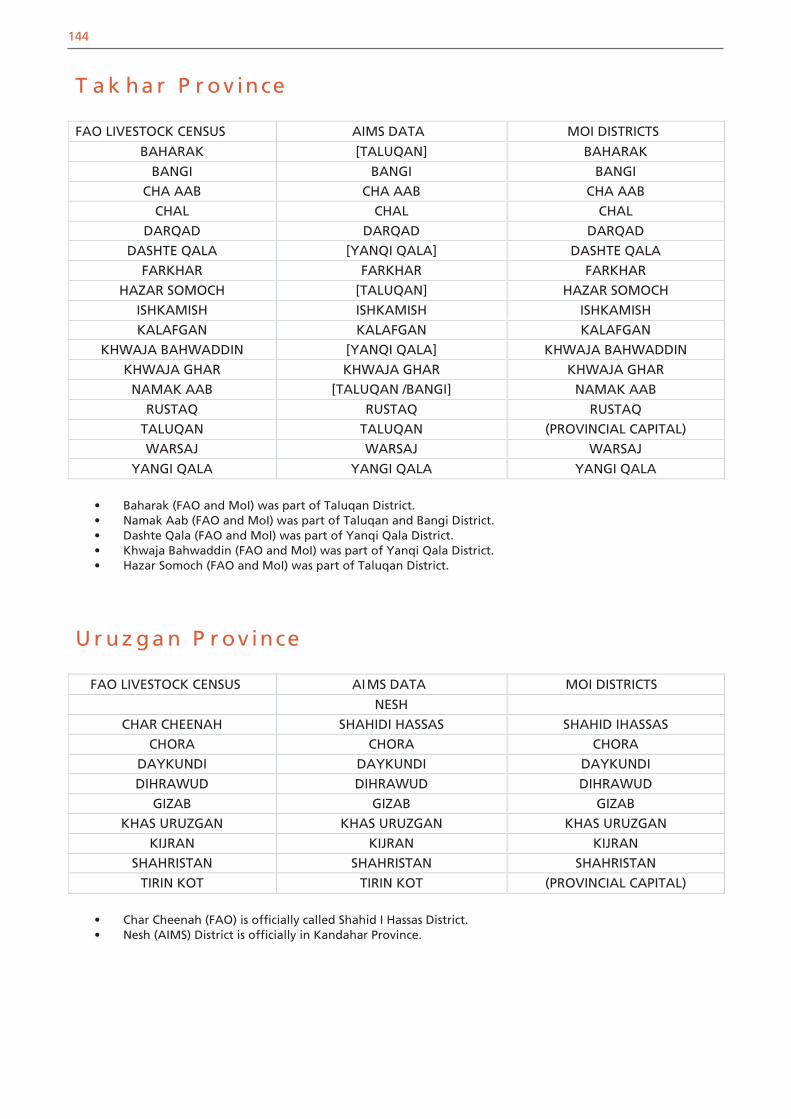
144
T a k ha r P r ov ince
FAO LIVESTOCK CENSUS AIMS DATA MOI DISTRICTS
BAHARAK [TALUQAN] BAHARAK
BANGI BANGI BANGI
CHA AAB CHA AAB CHA AAB
CHAL CHAL CHAL
DARQAD DARQAD DARQAD
DASHTE QALA [YANQI QALA] DASHTE QALA
FARKHAR FARKHAR FARKHAR
HAZAR SOMOCH [TALUQAN] HAZAR SOMOCH
ISHKAMISH ISHKAMISH ISHKAMISH
KALAFGAN KALAFGAN KALAFGAN
KHWAJA BAHWADDIN [YANQI QALA] KHWAJA BAHWADDIN
KHWAJA GHAR KHWAJA GHAR KHWAJA GHAR
NAMAK AAB [TALUQAN /BANGI] NAMAK AAB
RUSTAQ RUSTAQ RUSTAQ
TALUQAN TALUQAN (PROVINCIAL CAPITAL)
WARSAJ WARSAJ WARSAJ
YANGI QALA YANGI QALA YANGI QALA
• Baharak (FAO and MoI) was part of Taluqan District.• Namak Aab (FAO and MoI) was part of Taluqan and Bangi District.• Dashte Qala (FAO and MoI) was part of Yanqi Qala District.• Khwaja Bahwaddin (FAO and MoI) was part of Yanqi Qala District.• Hazar Somoch (FAO and MoI) was part of Taluqan District.
U r uz g a n P r ov ince
FAO LIVESTOCK CENSUS AIMS DATA MOI DISTRICTS
NESH
CHAR CHEENAH SHAHIDI HASSAS SHAHID IHASSAS
CHORA CHORA CHORA
DAYKUNDI DAYKUNDI DAYKUNDI
DIHRAWUD DIHRAWUD DIHRAWUD
GIZAB GIZAB GIZAB
KHAS URUZGAN KHAS URUZGAN KHAS URUZGAN
KIJRAN KIJRAN KIJRAN
SHAHRISTAN SHAHRISTAN SHAHRISTAN
TIRIN KOT TIRIN KOT (PROVINCIAL CAPITAL)
• Char Cheenah (FAO) is officially called Shahid I Hassas District.• Nesh (AIMS) District is officially in Kandahar Province.

145
W a r d a k P r ov ince
FAO LIVESTOCK CENSUS AIMS DATA MOI DISTRICTS
BEHSUD MARKAZ BIHSUD MARKAZI BIHSUD MARKAZ
CHAK CHAKI WARDAK CHAK
DAY MIRDAD DAY MIRDAD DAYMERDAD
HISA-i-AWALI BEHSUD HISA-I-AWALI BIHSUD HISA AWALI BIHSUD
JAGHATU [JAGHATU,GHAZNI PROVINCE] JAGHATU
JALREZ JALREZ JAREZ
KOTI ASHRO MAYDAN SHAHR (KOTI ASHRO) (PROVINCIAL CAPITAL)
MARKAZ [MAYDAN SHAHR (KOTI ASHRO)]
MAYDAN SHAHR [MAYDAN SHAHR (KOTI ASHRO)]
MAYDEN SHAHR /KOTI ASHRO [MAYDAN SHAHR (KOTI ASHRO)]
NIRKH NIRKH NIRKH
SAYED ABAD SAYD ABAD SAYED ABAD
• Maydan Shahr, Maydan Shahr/ Koti Ashro and Koti Ashro (FAO) are all one district – Maydan
Shahr District (FAO).
• Jaghatu District is shown by AIMS as part of Jaghatu in Ghazni Province (FAO).
Za bu l P r ov ince
FAO LIVESTOCK CENSUS AIMS DATA MOI DISTRICTS
ARGHANDAB ARGHANDAB ARGHANDAB
ATGHAR ATGHAR ATGHAR
DAYCHOPAN DAYCHOPAN DAYCHOPAN
KHAKI AFGHAN [DAYCHOPAN] KAKAR
MIZAN MIZAN MIZAN
NAWBAHAR [SHAMALZAI AND SHAHJOY]
QALAT QALAT (PROVINCIAL CAPITAL)
SHAHJOY SHAHJOY SHAHJOY
SHAHR SAFAH TARNAK WA JALDAK TARNAK WA JALDAK
SHAMULZAYI SHAMULZAYI SHAMALZAI
SHINKAY SHINKAY SHINKAY
SEYOURAY [SHINKAY]
• Khaki Afghan (FAO) and Karar (MoI) are part of Day Chopan District.• Seyouray (FAO) was part of Shinkay.• Nawbahar (FAO) is part of Shamalzai and Shahjoy Districts. • Shahr Safah is officially called Tarnak wa Jaldak District.

146
Table A1 Total number of selected lives tock species on district basis
Province District Cattle Sheep Goats Donkeys Camels Horses Chicken
Badakhshan Arghonj Khwa 4,037 15,399 7,733 1,163 0 105 2,063
Argo 35,107 45,179 44,745 15,041 0 1,497 35,207
Baharak 16,725 25,863 11,005 3,821 0 268 12,596
Daraeem 14,850 27,574 28,425 7,329 0 1,138 19,366
Darwaz Bala 6,938 8,411 12,076 1,778 0 358 6,444
Fayzabad 8,057 11,405 11,354 3,800 0 162 13,113
Ishkashim 6,683 11,517 7,847 1,186 44 554 2,790
Jurm 11,330 16,412 16,848 4,018 0 201 9,583
Karan Wa Manjan 2,999 3,630 4,549 715 0 324 1,430
Khash 4,636 14,704 5,841 2,006 0 133 5,240
Khwahan 9,595 7,026 8,955 2,446 0 352 5,776
Kishim 68,906 40,595 45,927 21,227 0 1,085 58,855
Kohistan 5,923 9,361 7,450 2,270 0 321 2,875
Kohistan Ragh 1,652 2,315 1,906 646 0 96 774
Koof 6,837 5,720 9,824 1,858 0 224 2,609
Nasi Darwaz 9,044 11,655 19,292 2,129 0 348 6,390
Raghistan 12,817 14,404 13,842 2,278 0 1,357 6,950
Shahri Buzurg 5,367 6,538 9,075 5,877 48 963 5,095
Shighnan 8,355 11,784 11,408 1,534 0 377 1,900
Shiki Darwaz 5,281 3,257 11,014 1,657 0 74 5,608
Shohada 9,534 16,581 13,050 2,636 0 218 5,220
Tagab Kishim 7,141 11,339 19,854 2,890 0 500 10,382
Teshkan 3,715 4,515 10,799 2,771 0 257 6,342
Wakhan 5,146 9,660 4,467 991 115 291 1,092
Wardooj 8,952 14,926 19,018 2,277 0 138 4,795
Yaftal Bala 1,619 1,395 1,265 580 0 72 1,853
Yaftal-i-Payan 12,750 19,558 16,579 5,626 0 413 15,213
Yamgan 8,260 15,013 8,470 2,146 0 372 5,315
Yawan Ragh 11,998 10,141 15,473 3,793 0 421 6,651
Zebak 2,866 4,644 4,567 847 1 377 822
All 317,120 400,521 402,658 107,336 208 12,996 262,349
Badghis Bala Murghab 919 7,770 6,364 2,453 206 26 6,928
Dara-i-Boum 626 21,633 13,093 2,838 280 137 6,229
Ghormach 6,690 200,693 49,555 13,241 2,337 426 16,519
Jawand 3,132 39,188 15,790 5,348 394 206 12,117
Muqur 424 7,977 7,341 4,808 358 73 5,932
Murghab 14,942 216,937 62,850 17,411 2,830 778 54,475
Qadis 8,244 48,431 41,418 16,208 88 548 38,627
Qala-i-Naw 5,651 40,616 46,561 23,179 416 765 42,336
Sange Aatash 245 47,651 32,458 8,371 2,920 231 10,758
All 40,873 630,896 275,430 93,857 9,829 3,190 193,921
8.2. TABULAR SUMMARY STATISTICS LEVEL 18.2.1 Total Livestock on District Basis
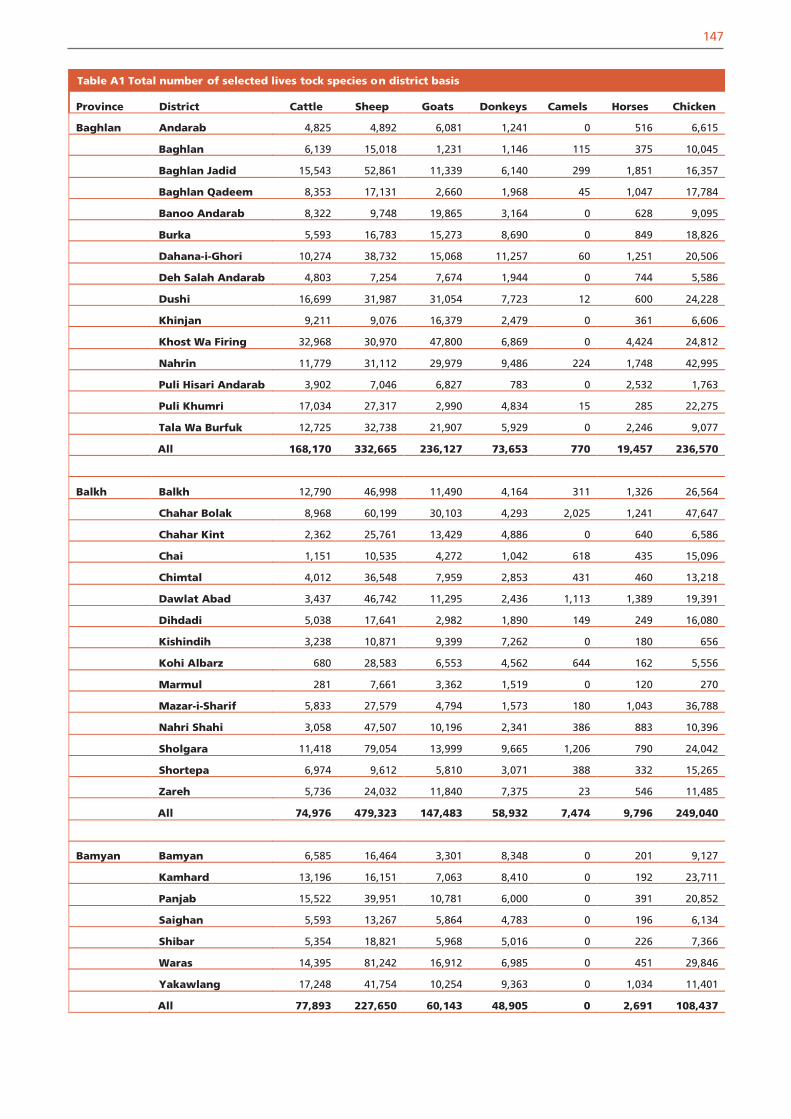
147
Baghlan Andarab 4,825 4,892 6,081 1,241 0 516 6,615
Baghlan 6,139 15,018 1,231 1,146 115 375 10,045
Baghlan Jadid 15,543 52,861 11,339 6,140 299 1,851 16,357
Baghlan Qadeem 8,353 17,131 2,660 1,968 45 1,047 17,784
Banoo Andarab 8,322 9,748 19,865 3,164 0 628 9,095
Burka 5,593 16,783 15,273 8,690 0 849 18,826
Dahana-i-Ghori 10,274 38,732 15,068 11,257 60 1,251 20,506
Deh Salah Andarab 4,803 7,254 7,674 1,944 0 744 5,586
Dushi 16,699 31,987 31,054 7,723 12 600 24,228
Khinjan 9,211 9,076 16,379 2,479 0 361 6,606
Khost Wa Firing 32,968 30,970 47,800 6,869 0 4,424 24,812
Nahrin 11,779 31,112 29,979 9,486 224 1,748 42,995
Puli Hisari Andarab 3,902 7,046 6,827 783 0 2,532 1,763
Puli Khumri 17,034 27,317 2,990 4,834 15 285 22,275
Tala Wa Burfuk 12,725 32,738 21,907 5,929 0 2,246 9,077
All 168,170 332,665 236,127 73,653 770 19,457 236,570
Balkh Balkh 12,790 46,998 11,490 4,164 311 1,326 26,564
Chahar Bolak 8,968 60,199 30,103 4,293 2,025 1,241 47,647
Chahar Kint 2,362 25,761 13,429 4,886 0 640 6,586
Chai 1,151 10,535 4,272 1,042 618 435 15,096
Chimtal 4,012 36,548 7,959 2,853 431 460 13,218
Dawlat Abad 3,437 46,742 11,295 2,436 1,113 1,389 19,391
Dihdadi 5,038 17,641 2,982 1,890 149 249 16,080
Kishindih 3,238 10,871 9,399 7,262 0 180 656
Kohi Albarz 680 28,583 6,553 4,562 644 162 5,556
Marmul 281 7,661 3,362 1,519 0 120 270
Mazar-i-Sharif 5,833 27,579 4,794 1,573 180 1,043 36,788
Nahri Shahi 3,058 47,507 10,196 2,341 386 883 10,396
Sholgara 11,418 79,054 13,999 9,665 1,206 790 24,042
Shortepa 6,974 9,612 5,810 3,071 388 332 15,265
Zareh 5,736 24,032 11,840 7,375 23 546 11,485
All 74,976 479,323 147,483 58,932 7,474 9,796 249,040
Bamyan Bamyan 6,585 16,464 3,301 8,348 0 201 9,127
Kamhard 13,196 16,151 7,063 8,410 0 192 23,711
Panjab 15,522 39,951 10,781 6,000 0 391 20,852
Saighan 5,593 13,267 5,864 4,783 0 196 6,134
Shibar 5,354 18,821 5,968 5,016 0 226 7,366
Waras 14,395 81,242 16,912 6,985 0 451 29,846
Yakawlang 17,248 41,754 10,254 9,363 0 1,034 11,401
All 77,893 227,650 60,143 48,905 0 2,691 108,437
Table A1 Total number of selected lives tock species on district basis
Province District Cattle Sheep Goats Donkeys Camels Horses Chicken

148
Farah Anar Dara 2,123 6,297 17,245 1,994 420 0 10,758
Bakwa 5,134 13,481 8,039 979 389 25 14,825
Bala Buluk 8,374 20,036 36,226 3,551 1,992 831 33,307
Farah Markaz 9,894 11,476 31,492 4,475 122 37 56,753
Gulistan 5,623 7,509 70,536 3,892 221 18 21,672
Khaki Safed 6,370 21,433 24,641 3,352 982 33 19,891
Lash Wa Juwayn 3,227 23,301 39,614 2,353 2,059 49 43,933
Purchaman 22,358 25,072 183,913 10,018 111 804 68,318
Pushte Rod 6,573 9,618 15,104 3,186 133 17 26,264
Qala i Kah 673 4,977 6,105 982 1 2 7,662
Qala-i-Kah Pusht Koh 4,706 10,940 32,018 2,770 35 7 30,893
Shib Koh Qalay-i-Kah 3,470 10,419 28,096 2,296 25 26 20,653
All 78,525 164,559 493,029 39,848 6,490 1,849 354,929
Faryab Almar 12,964 85,378 35,865 13,355 2,027 420 43,628
Bilchiragh 6,228 18,007 13,820 7,346 22 842 5,980
Dawlat Abad 1,624 91,412 7,464 3,760 2,639 87 2,198
Gurziwan 7,810 33,108 16,036 8,369 70 596 10,824
Khwaja Mosa 4,519 41,339 11,075 5,549 2,233 56 3,592
Khwaja Sabz Posh 4,309 16,549 9,906 4,569 364 58 2,226
Kohistan 4,709 68,770 52,180 4,530 0 796 11,548
Maymana 5,949 10,146 11,347 3,896 97 108 16,793
Pashtun Kot 10,753 35,845 28,187 10,398 27 436 8,491
Qaysar 13,509 192,833 154,646 11,519 3,432 926 43,577
Shirin Tagab 2,593 41,468 12,653 5,937 1,304 69 8,046
All 74,967 634,855 353,179 79,228 12,215 4,394 156,903
Table A1 Total number of selected lives tock species on district basis
Province District Cattle Sheep Goats Donkeys Camels Horses Chicken

149
Ghazni Ab Band 2,623 18,541 5,558 3,051 263 47 16,166
Ajristan 4,752 6,919 4,412 1,190 97 334 3,482
Andar 17,422 26,079 1,696 2,643 7 72 18,312
Dih Yak 3,817 9,879 1,933 1,448 0 14 15,915
Gelan 2,748 15,790 800 1,706 3 33 29,811
Ghazni Markaz 3,876 8,234 563 513 11 2 17,438
Giro 3,524 13,291 3,829 2,025 12 32 12,160
Jaghatu 4,471 11,204 2,818 2,588 0 20 13,021
Jaghuri 953 9,024 4,108 827 0 1 6,988
Khoja Omary 1,738 2,301 730 471 0 1 2,900
Malistan 11,104 33,881 13,682 5,119 4 39 16,871
Muqur 3,723 12,968 5,433 3,364 6 25 27,470
Nawa 1,906 19,957 13,167 2,289 316 42 17,739
Nawur 6,090 12,784 4,523 4,424 0 117 13,844
Qara Bagh 13,108 30,131 6,749 5,266 0 46 31,834
Waghaz 2,130 11,097 2,577 951 2 12 8,344
Zana Khan 845 4,248 3,768 1,266 0 3 6,016
All 84,830 246,328 76,346 39,141 721 840 258,311
Ghor Lal Wa Sarjangal 29,585 88,043 18,170 10,227 0 966 53,875
Shahrak 5,548 7,707 8,779 2,526 0 559 6,234
Tulak 5,221 8,886 13,873 4,662 1 397 7,628
All 40,354 104,636 40,822 17,415 1 1,922 67,737
Hilmand Baghran 15,932 84,761 198,812 6,645 210 637 85,170
Dishu 1,580 9,068 14,906 1,122 1,482 87 15,012
Garmser 19,050 81,217 25,434 5,966 4,235 104 50,629
Gerishk 17,571 49,283 18,559 4,907 1,555 363 58,318
Kajaki 17,908 21,727 12,437 5,920 304 82 46,006
Khanshen 3,337 9,974 13,440 874 2,052 97 16,222
Lashkar Gah 8,530 26,379 7,648 3,302 1,014 245 35,406
Marja 31,256 55,034 31,505 2,318 1,006 221 100,655
Musa Qala 6,143 22,240 32,934 1,868 803 163 39,189
Nad Ali 12,463 45,769 18,263 1,714 849 101 25,908
Naw Zad 6,054 51,063 42,114 5,013 2,719 287 41,599
Nawa 22,106 65,912 20,588 3,315 1,958 68 74,313
Reg 6,600 30,138 89,086 2,724 0 0 28,578
Sangin 12,788 14,679 4,817 2,456 171 218 22,929
Washer 3,548 28,830 52,635 4,392 1,889 102 22,241
All 184,866 596,074 583,178 52,536 20,247 2,775 662,175
Table A1 Total number of selected lives tock species on district basis
Province District Cattle Sheep Goats Donkeys Camels Horses Chicken

150
Hirat Adraskan 8,641 22,166 80,703 7,643 1,636 259 17,957
Chishte Sharif 4,817 8,641 19,516 3,256 756 209 6,287
Farsi 3,960 5,579 6,227 3,915 0 326 3,192
Ghoryan 6,337 86,652 62,503 5,417 387 152 23,456
Gulran 8,447 175,077 59,388 21,210 682 650 47,720
Guzarah 15,323 26,740 20,807 5,203 496 126 57,162
Injil 45,318 50,207 26,682 14,008 179 575 66,176
Karukh 11,580 38,848 53,136 9,824 98 272 36,819
Kohsan 3,061 50,987 31,175 9,940 141 92 26,023
Kushke Kuhna 8,053 35,799 25,210 13,193 1,407 485 19,386
Obe 14,222 37,499 53,572 10,602 975 414 35,175
Pashtun Zarghun 12,256 29,636 37,095 6,339 851 272 20,295
Rabat-i-Sangy 14,791 73,505 42,204 20,280 2,393 792 47,070
Shindand 19,527 111,413 135,965 11,959 3,850 226 87,170
Zinda Jan 9,452 37,959 42,711 12,422 237 127 42,386
All 185,785 790,708 696,894 155,211 14,088 4,977 536,274
Jawzjan Andkhoi 1,222 32,878 4,249 870 693 488 4,974
Aqcha 3,136 44,869 15,563 2,430 1,118 1,117 17,188
Darzab 4,185 14,984 9,672 5,461 2 283 3,491
Fayz Abad 2,317 33,346 13,454 2,282 1,305 568 9,846
Khamyab 3,040 8,870 867 456 187 674 5,184
Khani Chaharbagh 416 12,908 2,765 1,027 777 252 1,920
Khwaja Dukoh 773 24,556 3,535 1,546 974 238 6,297
Mardyan 1,610 33,511 14,610 1,451 667 1,300 35,288
Mingajik 1,421 38,441 15,680 3,112 1,045 1,099 21,077
Qaramqol 308 23,188 2,648 821 947 121 1,902
Qarqin 5,211 3,767 2,572 984 178 503 3,673
Qoshtepa 1,781 63,708 13,392 4,562 4,849 599 2,763
Qurghan 548 18,400 3,531 565 589 335 3,170
Shibirghan 6,853 86,912 22,608 4,122 1,840 728 20,708
All 32,821 440,338 125,146 29,689 15,171 8,305 137,481
Table A1 Total number of selected lives tock species on district basis
Province District Cattle Sheep Goats Donkeys Camels Horses Chicken

151
Kabul Bagrami 7,453 2,031 937 2,635 0 271 23,781
Chahar Asyab 3,344 1,565 1,262 424 2 7 16,977
Dih Sabz 3,188 8,420 7,788 1,103 0 50 61,201
Farza 3,255 15,476 18,577 2,184 120 5 13,342
Guldara 294 924 433 259 0 0 1,412
Istalif 370 2,973 1,464 391 0 38 4,538
Kalakan 1,006 1,133 421 277 8 28 3,893
Khaki Jabbar 1,057 3,127 4,743 821 0 4 7,570
Mir Bacha Kot 699 913 415 123 0 0 8,270
Musayi 4,210 2,212 2,499 949 0 0 14,072
Paghman 5,817 8,349 3,891 1,397 2 22 34,603
Qara Bagh 3,152 15,270 5,631 896 80 58 19,310
Sarobi 15,462 27,704 48,109 4,283 144 0 81,580
Shakardara 8,406 1,897 970 558 0 8 11,430
All 57,713 91,994 97,140 16,300 356 491 301,979
Kabul City Nahya 1 10 44 61 14 0 0 17,621
Nahya 2 76 128 334 23 0 1 3,851
Nahya 3 89 125 181 63 0 4 18,720
Nahya 4 919 871 432 38 0 38 26,364
Nahya 5 1,199 1,870 684 138 0 87 74,229
Nahya 6 799 1,835 360 122 0 87 24,220
Nahya 7 1,527 602 707 181 0 112 33,077
Nahya 8 1,162 486 449 137 0 47 90,030
Nahya 9 2,094 429 518 504 0 435 17,268
Nahya 10 1,268 539 606 187 0 29 20,657
Nahya 11 447 612 1,827 54 0 12 17,942
Nahya 12 275 180 591 26 0 0 13,812
Nahya 14 1,337 1,945 1,092 221 0 3 31,612
Nahya 15 2,189 1,092 3,351 167 0 64 88,590
Nahya 16 1,337 236 341 471 0 131 32,401
All 14,728 10,994 11,534 2,346 0 1,050 510,394
Table A1 Total number of selected lives tock species on district basis
Province District Cattle Sheep Goats Donkeys Camels Horses Chicken

152
Kandahar Arghandab 8,441 17,733 4,866 3,273 429 125 65,239
Arghistan 4,416 31,386 19,476 4,835 517 162 18,094
Daman 3,905 28,619 15,521 1,908 435 34 21,225
Dand 3,489 5,523 2,893 1,033 87 101 11,095
Ghorak 3,075 31,485 22,446 2,111 864 19 17,267
Jarri 8,543 16,542 3,499 1,161 372 135 74,065
Kandahar 998 776 640 269 0 216 4,667
Khakrez 5,191 25,219 38,009 3,658 277 7 24,593
Maywand 7,337 64,755 19,967 3,906 1,726 7 60,067
Meenasheen 2,447 11,561 11,096 1,357 412 67 6,401
Nesh 3,037 11,565 16,597 2,949 403 8 18,788
Panjwayi 6,591 33,348 9,159 1,450 1,026 16 44,353
Reg 398 57,204 39,822 1,480 11,209 114 12,033
Shah Wali Kot 4,490 21,589 12,869 1,839 673 18 22,354
Shigah 1,028 21,066 8,211 1,679 194 5 8,958
Shorabak 320 164,399 117,341 3,312 11,208 6 28,036
Spin Boldak 980 33,395 9,254 1,981 1,365 42 7,987
All 70,286 605,049 390,156 42,756 31,229 1,263 463,855
Kapisa Alasay 6,247 4,549 3,156 502 53 95 10,289Hisa-i-Awal Kohistan 18,151 5,979 8,335 2,216 0 24 28,518Hisa-i-Doum Kohistan 27,940 6,593 993 1,903 5 196 63,246
Kohband 13,576 15,428 17,457 2,701 0 0 18,699
Mahmudraqi 19,155 15,213 3,509 2,257 128 149 31,947
Nurab 40,496 20,662 17,137 2,866 16 449 79,944
Tagab 16,171 21,842 21,683 1,555 68 15 49,811
All 141,736 90,266 72,270 14,000 270 928 282,454
Khost Alishir 14,960 33,108 19,472 4,912 1,378 131 49,120
Bak 10,581 3,662 3,129 2,138 37 33 26,626
Gurbuz 11,943 10,107 6,045 2,962 89 11 15,019
Ismail Khil 12,891 2,444 3,852 753 0 7 46,355
Jaji Maydan 15,573 5,011 15,285 2,319 35 133 23,345
Khost Markaz 25,820 4,283 4,929 2,180 166 20 70,536
Musa Khil 10,665 3,214 32,325 2,319 140 3 33,188
Nadir Shah Kot 13,183 4,055 9,426 2,535 0 0 74,854
Qalandar 6,495 1,899 25,000 1,191 34 0 20,571
Sabri Yaqubi 17,403 3,100 2,672 2,754 8 13 46,814
Spera 9,281 1,426 26,725 2,076 737 0 32,674
Tani 10,102 7,294 18,122 3,952 416 10 33,013
Yaqubi 5,529 321 318 635 0 4 16,648
All 164,426 79,924 167,300 30,726 3,040 365 488,763
Maruf 5,600 28,884 38,490 4,555 32 181 18,633
Table A1 Total number of selected lives tock species on district basis
Province District Cattle Sheep Goats Donkeys Camels Horses Chicken

153
Kunar Asadabad Markaz 10,029 7,343 11,235 1,288 8 0 21,380
Asmar 13,899 8,980 45,192 959 0 0 30,486
Chapa Dara 11,057 2,240 21,769 318 0 0 13,618
Chawkay 22,164 6,746 32,341 3,659 0 2 67,471
Dangam 1,078 645 9,425 281 0 10 4,400
Khas Kunar 20,470 11,640 10,713 3,990 0 2 40,510
Manawara 20,254 2,206 36,446 1,130 0 3 37,987
Manoguy 6,895 3,410 23,720 1,337 0 0 35,440
Narang 11,655 8,522 17,264 3,578 15 86 22,510
Nari 18,952 25,143 96,765 4,600 0 62 57,600
Nurgal 24,215 12,775 34,470 3,483 23 1 32,540
Shigal 16,790 5,931 52,719 1,218 0 0 28,225
Sirkanay 7,242 2,716 9,679 2,199 0 50 17,680
Wata Pur 12,290 5,710 31,270 1,775 0 0 31,650
All 196,990 104,007 433,008 29,815 46 216 441,497
Kunduz Ali Abad 14,726 34,140 5,504 7,444 146 968 20,704
Chahar Dara 22,182 38,189 3,438 4,707 834 1,975 56,536
Dasht Archi 13,064 63,826 5,674 7,529 1,573 833 15,321
Imam Sahib 47,603 71,710 22,834 18,002 7,069 12,666 26,849
Khan Abad 11,162 12,493 5,339 6,661 75 639 20,013
Kunduz Markaz 32,046 40,319 551 3,420 328 1,850 33,988
Qala Zal 17,105 67,554 6,122 3,958 2,194 1,081 21,780
All 157,888 328,231 49,462 51,721 12,219 20,012 195,191
Laghman Alingar 26,559 15,737 51,971 2,140 110 19 59,895
Alishing 22,612 21,115 26,043 5,044 44 6 46,489
Dawlat Shah 24,685 4,575 51,718 823 0 2 53,429
Mihterlam Markaz 41,084 78,781 24,075 5,896 1,001 147 88,242
Qarghayi 43,419 40,889 9,499 5,928 607 72 87,043
All 158,359 161,097 163,306 19,831 1,762 246 335,098
Logar Azra 1,423 1,326 10,335 163 1 20 7,913
Baraki Barak 18,928 7,205 2,283 4,022 8 74 39,795
Charkh 5,641 1,599 3,250 1,632 0 21 16,717
Kharwar 7,591 5,943 3,179 2,727 79 87 16,786
Khushi 711 5,201 2,138 414 1 0 9,781
Muhammad Agha 8,739 10,048 4,634 2,265 60 5 33,238
Puli Alam 15,715 10,288 4,225 3,213 0 9 43,434
All 58,748 41,610 30,044 14,436 149 216 167,664
Table A1 Total number of selected lives tock species on district basis
Province District Cattle Sheep Goats Donkeys Camels Horses Chicken

154
Nangarhar Achin 11,391 10,979 37,022 6,335 10 10 48,070
Bati Kot 27,094 9,026 1,884 5,043 192 16 58,830
Bihsud 13,950 22,560 4,093 2,520 74 55 29,750
Chaparhar 8,117 16,675 3,415 2,473 113 24 50,765
Dara-i-Nur 13,390 2,732 21,509 320 0 6 25,563
Deh Bala 10,798 15,847 9,366 2,604 0 1 50,280
Dur Baba 5,339 3,833 14,056 4,939 576 2,125 12,100
Ghani Khel Shinwar 15,366 6,218 5,088 2,124 86 0 34,680
Goshta 8,402 2,972 4,602 2,402 0 0 22,329
Hisarak 9,152 12,860 16,809 1,604 99 23 21,948
JalalAbad Markaz 7,013 2,262 1,311 663 8 260 40,279
Kama 48,313 12,893 13,245 4,017 97 5 75,440
Khogyani 19,826 23,105 10,688 3,072 284 159 70,996
Khogyani Wazir 8,989 13,272 7,487 1,461 32 31 29,063
Kot 6,301 5,736 3,696 1,100 0 3 33,980
Kuz Kunar Shewa 11,330 23,711 5,650 1,964 539 26 21,514
Lal Pur 7,754 2,705 11,818 3,974 5 17 18,803
Muhmandara 13,374 34,496 7,873 6,031 998 16 34,868
Nazian 4,644 3,584 19,501 1,830 7 91 16,520
Pachir Wa Agam 8,102 8,954 8,536 2,000 82 254 19,375
Rodat 6,616 3,992 2,911 1,640 0 10 20,380
Sherzad 22,201 13,236 24,133 3,361 0 58 42,325
Shewa 1,871 816 628 233 18 0 2,055
Surkh Rod 15,559 15,285 3,670 1,668 102 172 60,283
All 304,892 267,749 238,991 63,378 3,322 3,362 840,196
Nimroz Chahar Burjak 2,480 13,318 9,136 2,982 1,584 0 29,817
Chakhansur 1,746 23,106 17,414 1,215 4,438 190 16,066
Delaram 452 5,820 13,480 299 1,034 80 6,785
Kang 2,511 8,207 7,853 9,067 157 182 16,164
Khash Rod 3,585 12,099 68,804 2,322 1,880 204 33,719
Zaranj Markaz 674 3,428 9,628 3,445 779 6 11,430
All 11,448 65,978 126,315 19,330 9,872 662 113,981
Nuristan Bargi Matal 12,749 7,475 23,536 409 0 696 7,801
Do Aab 2,058 2,374 28,259 480 0 12 15,570
Kamdesh 11,567 10,556 47,392 849 0 180 11,109
Mandol 14,659 22,780 143,095 4,478 0 1,836 104,930
Nuristan 9,438 16,227 116,474 2,577 0 3 19,196
Wama 22,473 9,376 80,441 1,409 0 345 17,129
Waygal 22,948 6,692 120,701 2,619 0 2 33,586
All 95,892 75,480 559,898 12,821 0 3,074 209,321
Table A1 Total number of selected lives tock species on district basis
Province District Cattle Sheep Goats Donkeys Camels Horses Chicken

155
Paktika
Dila Khoshmand 3,738 20,685 6,038 2,128 177 51 16,165
Gayan 3,991 331 4,182 1,111 102 0 36,636
Gomal 3,689 9,403 30,256 1,365 1,869 13 18,707
Jani Khil 3,364 9,050 6,362 973 64 17 9,359
Khir Kot 2,918 4,767 3,278 336 85 27 8,330
Mata Khan 3,177 5,585 962 464 0 7 14,525
Nika 1,829 178 8,466 734 260 0 13,333
Omna 1,030 1,717 9,205 516 375 2 3,603
Sar Hawza 1,120 2,012 4,761 702 78 4 6,830
Sarobi 2,103 1,529 6,622 651 127 1 10,923
Sharana Markaz 6,280 8,942 1,629 244 16 20 19,273
Urgun 4,142 1,790 7,466 1,286 19 4 24,304
Waza Khwa 1,942 20,132 27,966 1,300 302 8 18,899
Wor Mamay 2,255 6,599 25,939 502 193 50 13,548
Yahya Khil 3,291 5,886 2,375 216 5 14 5,826
Yusuf Khil 2,913 5,565 3,006 366 16 8 6,029
Ziruk 4,483 273 12,150 1,083 330 0 15,859
All 52,265 104,444 160,663 13,977 4,018 226 242,149
Paktya Adma 207 1,409 1,777 186 29 2 735
Ahmad Khel 3,208 587 13,447 1,168 33 25 25,483
Chamkani 10,746 1,478 14,933 1,974 5 11 48,912
Dand Wa Patan 7,335 2,670 21,224 1,388 97 36 53,983
Dowamanda Shamal 1,442 259 4,174 260 14 0 7,265
Gardez 6,747 5,288 1,570 754 0 5 36,159
Jaji 7,733 2,722 11,836 1,912 24 154 48,153
Jani Khel 14,419 2,743 36,219 2,100 178 4 46,022
Lija Mangal 1,918 754 9,946 728 26 0 14,740
Sayed Karam 10,836 3,883 1,402 2,693 1 3 51,696
Shwak 841 188 7,014 574 4 0 4,695
Waza Jadran 1,644 101 7,771 498 93 0 3,953
Zurmat 18,594 19,210 5,758 1,868 49 51 43,188
All 85,670 41,292 137,071 16,103 553 291 384,984
Table A1 Total number of selected lives tock species on district basis
Province District Cattle Sheep Goats Donkeys Camels Horses Chicken

156
Parwan Bagram 11,067 11,780 3,682 1,435 75 69 17,002
Chaharikar 15,915 5,356 6,902 4,745 6 248 31,201
Hisa Awa Panjshir 14,305 21,325 23,463 3,189 0 1,550 15,416Hisa Chaorum Panjshir 8,887 10,419 24,457 2,497 0 48 22,755
Hisa Doum Panjshir 6,687 5,851 10,633 828 0 98 11,761
Hisa Soum Panjshir 5,326 2,588 5,610 642 0 60 15,138
Jabalusaraj 7,850 7,432 7,320 1,850 0 28 17,367Kohisafi 4,193 5,704 13,862 3,108 28 20 16,567
Salang 2,130 10,488 16,556 790 0 81 6,774
Sayed Khel 9,715 1,035 114 1,056 0 85 20,070
Shikh Ali 5,847 12,999 7,707 3,341 0 60 8,556
Shinwari 13,038 22,700 27,340 8,109 28 60 40,401
Siagird Ghorband 5,455 13,399 13,229 5,787 0 58 22,662
Surkhi Parsa 10,779 18,121 9,072 5,541 0 40 14,711
All 121,194 149,197 169,947 42,918 137 2,505 121,194
Samangan Aybak 6,801 63,333 18,404 5,928 469 554 16,210
Dara-i-Suf 7,799 16,859 12,183 10,299 0 776 10,302
Dara-i-Suf Sufla 3,150 10,610 9,704 13,735 22 509 3,526
Hazrati Sultan 5,505 82,106 25,292 11,380 854 852 9,222
Kaldar 3,068 6,949 5,762 1,617 426 113 7,376
Khoram wa Sarbagh 4,677 40,772 20,597 8,265 0 544 18,988
Khulm 3,384 51,167 14,575 3,672 1,474 646 19,731
Ruyi Du Ab 7,737 51,620 17,860 12,210 2 1,265 15,370
All 42,121 323,416 124,377 67,106 3,247 5,259 100,725
Sari Pul Balkhab 11,819 19,918 16,920 8,118 0 824 25,749
Kohistanat 13,409 28,742 7,228 12,506 45 1,355 28,042
Sang Charak 10,921 64,457 26,642 17,599 1,172 639 22,179Sari Pul 9,065 49,297 11,283 7,398 463 799 14,128
Sayed Abad 4,724 39,835 9,869 3,415 1,180 278 3,515
Sayyad 3,598 16,799 5,501 3,255 125 458 2,061
Sozma Qala 9,651 21,845 8,379 8,412 213 561 8,845
All 63,187 240,893 85,822 60,703 3,198 4,914 104,519
Table A1 Total number of selected lives tock species on district basis
Province District Cattle Sheep Goats Donkeys Camels Horses Chicken
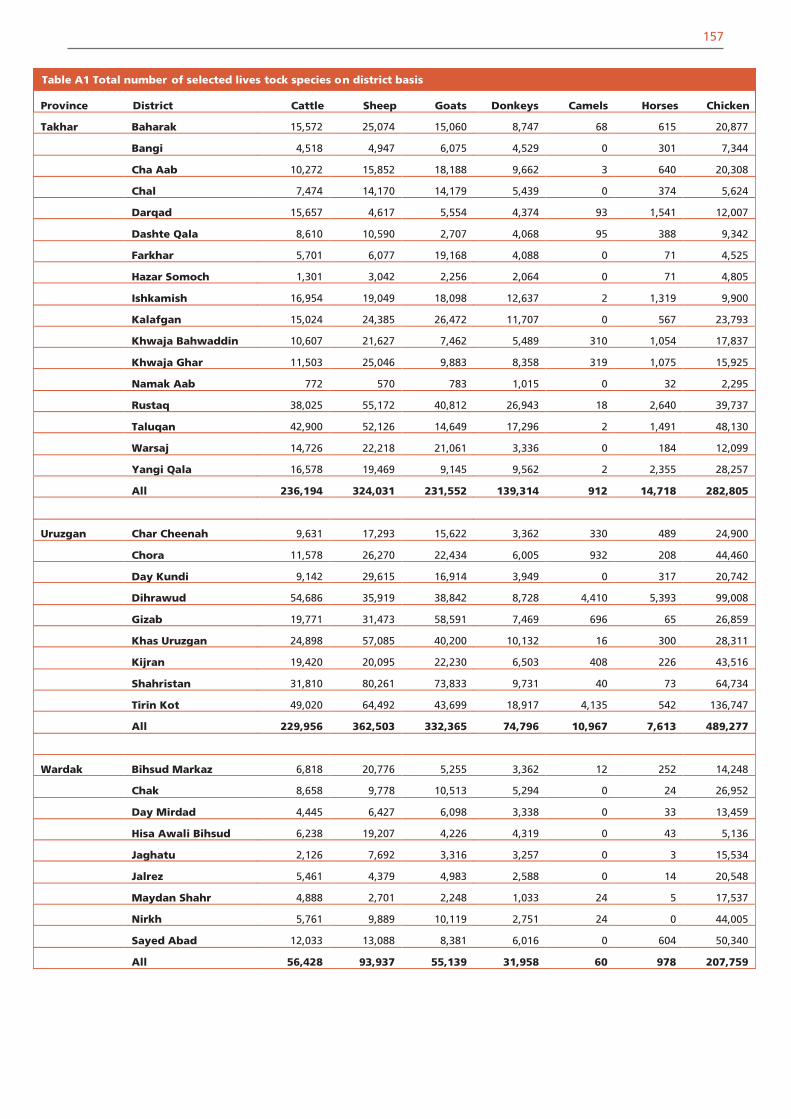
157
Takhar Baharak 15,572 25,074 15,060 8,747 68 615 20,877
Bangi 4,518 4,947 6,075 4,529 0 301 7,344
Cha Aab 10,272 15,852 18,188 9,662 3 640 20,308
Chal 7,474 14,170 14,179 5,439 0 374 5,624
Darqad 15,657 4,617 5,554 4,374 93 1,541 12,007
Dashte Qala 8,610 10,590 2,707 4,068 95 388 9,342
Farkhar 5,701 6,077 19,168 4,088 0 71 4,525
Hazar Somoch 1,301 3,042 2,256 2,064 0 71 4,805
Ishkamish 16,954 19,049 18,098 12,637 2 1,319 9,900
Kalafgan 15,024 24,385 26,472 11,707 0 567 23,793
Khwaja Bahwaddin 10,607 21,627 7,462 5,489 310 1,054 17,837
Khwaja Ghar 11,503 25,046 9,883 8,358 319 1,075 15,925
Namak Aab 772 570 783 1,015 0 32 2,295
Rustaq 38,025 55,172 40,812 26,943 18 2,640 39,737
Taluqan 42,900 52,126 14,649 17,296 2 1,491 48,130
Warsaj 14,726 22,218 21,061 3,336 0 184 12,099
Yangi Qala 16,578 19,469 9,145 9,562 2 2,355 28,257
All 236,194 324,031 231,552 139,314 912 14,718 282,805
Uruzgan Char Cheenah 9,631 17,293 15,622 3,362 330 489 24,900
Chora 11,578 26,270 22,434 6,005 932 208 44,460
Day Kundi 9,142 29,615 16,914 3,949 0 317 20,742
Dihrawud 54,686 35,919 38,842 8,728 4,410 5,393 99,008
Gizab 19,771 31,473 58,591 7,469 696 65 26,859
Khas Uruzgan 24,898 57,085 40,200 10,132 16 300 28,311
Kijran 19,420 20,095 22,230 6,503 408 226 43,516
Shahristan 31,810 80,261 73,833 9,731 40 73 64,734
Tirin Kot 49,020 64,492 43,699 18,917 4,135 542 136,747
All 229,956 362,503 332,365 74,796 10,967 7,613 489,277
Wardak Bihsud Markaz 6,818 20,776 5,255 3,362 12 252 14,248
Chak 8,658 9,778 10,513 5,294 0 24 26,952
Day Mirdad 4,445 6,427 6,098 3,338 0 33 13,459
Hisa Awali Bihsud 6,238 19,207 4,226 4,319 0 43 5,136
Jaghatu 2,126 7,692 3,316 3,257 0 3 15,534
Jalrez 5,461 4,379 4,983 2,588 0 14 20,548
Maydan Shahr 4,888 2,701 2,248 1,033 24 5 17,537
Nirkh 5,761 9,889 10,119 2,751 24 0 44,005
Sayed Abad 12,033 13,088 8,381 6,016 0 604 50,340
All 56,428 93,937 55,139 31,958 60 978 207,759
Table A1 Total number of selected lives tock species on district basis
Province District Cattle Sheep Goats Donkeys Camels Horses Chicken

158
Zabul Arghandab 4,899 12,161 20,137 2,986 73 51 42,217
Atghar 1,487 5,163 7,790 1,488 38 15 7,143
Daychopan 3,257 9,194 14,809 2,816 420 94 8,828
Khaki Afghan 3,277 7,921 13,360 2,264 30 79 11,851
Mizan 1,290 12,785 10,244 1,341 703 13 6,064
Nawbahar 1,752 8,414 12,034 2,135 7 27 11,875
Qalat 6,289 34,907 15,039 3,932 546 28 27,079
Seyouray 1,650 6,079 8,263 1,332 5 32 12,634
Shahjoy 5,920 23,724 15,611 3,494 67 62 56,334
Shahr Safa 2,210 8,705 7,397 1,403 321 18 9,497
Shamulzayi 724 22,651 20,471 2,928 430 79 21,886
Shinkay 1,540 10,247 8,996 1,443 59 15 2,537
All 34,295 161,951 154,151 27,562 2,699 513 217,945
Afghanistan All 3,715,596 8,772,596 7,280,946 1,587,648 175,270 142,094 9,865,064
Table A1 Total number of selected lives tock species on district basis
Province District Cattle Sheep Goats Donkeys Camels Horses Chicken

159
Table A2 Average and Standard Deviation of Total Animal Numbers per Family for Selected Species
Cows Donkeys ChickenPreferred
Ploughing AnimalsDraft
Animals
Province District AVG STD AVG STD AVG STD AVG STD AVG STD
Badakhshan Arghonj Khwa 1.41 0.95 1.16 0.49 2.60 1.20 0.83 0.41 2.12 0.87
Argo 0.95 0.81 1.25 0.98 3.80 3.08 0.66 0.36 1.93 3.09
Baharak 1.94 1.36 1.04 1.17 3.50 3.74 0.88 0.63 1.80 1.28
Daraeem 0.91 1.17 0.93 0.79 2.94 2.46 0.51 0.82 1.06 1.31
Darwaz Bala 0.90 0.32 0.74 0.26 3.87 1.62 1.16 0.45 1.84 0.53
Fayzabad 0.53 0.40 0.63 0.42 2.13 2.02 0.42 0.38 1.06 0.75
Ishkashim 1.90 0.72 1.07 0.41 3.50 1.53 1.39 0.67 2.22 0.61
Jurm 0.75 0.62 0.77 0.39 2.35 1.84 0.44 0.35 1.19 0.66
Karan Wa Manjan 2.12 1.74 1.50 0.66 8.82 21.15 0.50 0.52 2.10 0.84
Khash 0.94 0.43 0.96 0.17 3.22 1.58 0.72 0.38 1.41 0.49
Khwahan 0.79 0.61 0.71 0.28 2.82 3.42 1.36 0.94 2.13 2.79
Kishim 1.17 0.76 1.67 0.98 6.32 4.04 0.72 0.63 1.70 1.01
Kohistan 1.65 0.85 1.64 0.63 2.97 1.62 0.96 0.40 1.98 0.78
Kohistan Ragh 1.56 0.95 1.43 0.39 2.15 0.72 0.80 0.34 1.65 0.56
Koof 0.97 0.56 0.77 0.34 1.75 1.21 0.61 0.29 1.47 0.56
Nasi Darwaz 0.93 0.44 0.78 0.27 3.23 1.32 0.25 0.14 1.68 0.51
Raghistan 1.65 1.20 0.66 0.58 2.31 1.63 0.72 0.65 1.43 0.88
Shahri Buzurg 0.30 0.12 1.16 0.44 1.23 0.85 0.07 0.05 0.61 0.22
Shighnan 0.77 0.34 0.64 0.26 1.00 0.92 0.29 0.14 0.89 0.30
Shiki Darwaz 0.64 0.28 0.77 0.13 4.06 2.80 0.34 0.24 1.39 0.29
Shohada 1.01 0.68 0.73 0.55 2.30 4.74 0.84 0.73 1.37 0.92
Tagab Kishim 0.98 0.69 0.90 0.30 3.66 1.65 0.42 0.33 1.10 0.49
Teshkan 0.34 0.23 0.64 0.20 1.68 2.37 0.29 0.13 0.94 0.27
Wakhan 1.28 0.66 0.96 0.28 1.18 0.84 0.96 0.46 1.67 0.60
Wardooj 1.11 0.37 0.94 0.25 2.96 1.22 0.56 0.34 1.54 0.53
Yaftal Bala 0.77 0.33 0.84 0.18 4.07 2.10 1.17 0.76 2.12 0.77
Yaftal-i-Payan 1.05 0.73 1.13 0.70 3.66 3.58 0.70 0.45 1.59 0.92
Yamgan 1.17 0.76 0.71 0.28 2.37 1.54 0.80 0.66 1.37 0.58
Yawan Ragh 1.50 0.85 0.94 0.52 1.99 1.34 0.69 0.44 1.49 0.78
Zebak 1.38 0.46 1.35 0.51 1.70 1.20 0.98 0.39 1.66 0.52
All 1.08 0.88 0.96 0.68 2.93 3.42 0.66 0.58 1.50 1.32

160
Badghis Bala Murghab 0.24 0.17 1.52 0.58 5.97 5.53 0.19 0.14 1.25 0.46
Dara-i-Boum 0.09 0.08 1.16 0.51 3.12 1.48 0.08 0.08 0.89 0.37
Ghormach 0.10 0.15 1.17 0.52 2.30 2.73 0.33 0.26 1.33 0.66
Jawand 0.09 0.11 0.74 0.35 2.37 1.50 0.23 0.22 1.00 0.54
Muqur 0.02 0.06 1.06 1.12 1.39 1.32 0.07 0.15 0.94 0.99
Murghab 0.36 0.31 1.22 0.83 4.74 5.37 0.38 0.37 1.47 1.25
Qadis 0.14 0.20 1.17 0.73 3.73 3.19 0.25 0.29 1.24 0.85
Qala-i-Naw 0.07 0.09 1.08 0.81 2.74 3.19 0.09 0.14 1.10 0.88
Sange Aatash 0.01 0.02 0.85 0.50 1.21 1.18 0.00 0.02 0.79 0.47
All 0.14 0.21 1.10 0.72 3.08 3.58 0.21 0.28 1.16 0.89
Baghlan Andarab 0.58 0.35 0.51 0.29 3.06 2.45 0.42 0.28 0.63 0.39
Baghlan 0.88 0.56 0.59 0.90 4.12 2.79 0.35 0.31 0.83 0.80
Baghlan Jadid 1.10 0.94 0.91 0.76 3.59 2.83 0.50 0.38 1.20 0.74
Baghlan Qadeem 1.08 0.92 0.79 0.55 7.69 7.53 0.77 0.47 1.43 0.71
Banoo Andarab 1.38 2.24 1.04 0.46 3.45 3.02 0.50 0.23 1.42 0.55
Burka 0.29 0.37 1.32 0.83 3.52 3.08 0.39 0.35 1.38 0.83
Dahana-i-Ghori 0.57 0.67 1.14 0.66 2.70 2.86 0.38 0.40 1.41 0.85
Deh Salah Andarab 0.41 0.42 0.56 0.31 2.25 2.39 0.32 0.19 0.62 0.33
Dushi 0.76 0.59 0.85 0.58 4.17 6.36 0.21 0.23 0.76 0.52
Khinjan 1.10 0.65 0.69 0.38 3.96 2.12 0.25 0.27 0.83 0.47
Khost Wa Firing 0.79 0.59 0.39 0.24 1.71 2.19 0.32 0.24 0.63 0.36
Nahrin 0.30 0.43 0.55 0.37 3.85 4.83 0.16 0.21 0.73 0.45
Puli Hisari Andarab 0.16 0.32 0.33 0.34 1.01 1.90 0.26 0.26 0.46 0.44
Puli Khumri 0.75 0.75 0.52 0.37 2.58 2.51 0.58 0.79 1.14 1.10
Tala Wa Burfuk 0.99 0.31 1.46 0.50 3.50 2.20 1.14 0.73 2.38 1.00
All 0.70 0.78 0.75 0.62 3.22 3.87 0.39 0.43 1.00 0.78
Table A2 Average and Standard Deviation of Total Animal Numbers per Family for Selected Species
Cows Donkeys ChickenPreferred
Ploughing AnimalsDraft
Animals
Province District AVG STD AVG STD AVG STD AVG STD AVG STD

161
Balkh Balkh 0.74 0.67 0.39 0.27 3.01 2.35 0.18 0.17 0.51 0.35
Chahar Bolak 0.37 0.31 0.33 0.25 4.08 3.25 0.10 0.13 0.36 0.26
Chahar Kint 0.09 0.09 0.55 0.31 1.02 1.15 0.17 0.14 0.71 0.36
Chai 0.12 0.09 0.16 0.12 2.42 3.89 0.00 0.00 0.14 0.12
Chimtal 0.31 0.25 0.45 0.29 2.30 1.80 0.23 0.22 0.58 0.39
Dawlat Abad 0.24 0.21 0.26 0.24 2.35 1.76 0.00 0.00 0.20 0.19
Dihdadi 0.20 0.23 0.25 0.18 2.54 1.36 0.17 0.13 0.33 0.19
Kishindih 0.04 0.04 0.54 0.33 0.05 0.22 0.19 0.27 0.56 0.31
Kohi Albarz 0.03 0.05 0.75 0.70 1.08 0.74 0.10 0.14 0.67 0.57
Marmul 0.08 0.06 0.87 0.26 0.21 0.21 0.06 0.09 0.93 0.29
Mazar-i-Sharif 0.11 0.10 0.05 0.06 1.26 1.44 0.00 0.02 0.05 0.07
Nahri Shahi 0.26 0.27 0.33 0.31 1.73 1.42 0.05 0.11 0.30 0.28
Sholgara 0.30 0.35 0.71 0.47 2.10 3.41 0.38 0.43 0.96 0.71
Shortepa 0.71 0.39 0.55 0.62 3.85 1.87 0.10 0.06 0.52 0.23
Zareh 0.38 0.30 1.32 0.65 3.01 1.96 0.04 0.12 1.40 0.82
All 0.26 0.35 0.44 0.47 2.08 2.45 0.13 0.23 0.50 0.53
Bamyan Bamyan 0.29 0.24 0.80 0.41 0.89 0.91 0.16 0.16 0.78 0.42
Kamhard 0.85 0.57 1.27 0.79 4.35 2.63 0.60 0.57 1.74 1.10
Panjab 0.72 0.38 0.88 0.34 3.18 1.81 0.72 0.42 1.36 0.56
Saighan 0.62 0.34 1.40 0.51 1.81 1.08 0.47 0.29 1.59 0.62
Shibar 0.46 0.26 1.14 0.48 1.97 1.53 0.42 0.24 1.35 0.55
Waras 0.42 0.23 0.73 0.33 4.52 2.23 0.04 0.07 1.07 0.48
Yakawlang 0.66 0.50 0.98 0.49 1.29 0.97 0.50 0.33 1.29 0.64
All 0.56 0.39 0.90 0.44 2.85 2.20 0.39 0.41 1.22 0.61
Farah Anar Dara 0.22 0.23 0.49 0.36 3.51 2.24 0.01 0.10 0.40 0.28
Bakwa 0.59 1.01 0.25 0.22 4.79 5.54 0.00 0.01 0.17 0.14
Bala Buluk 0.28 0.29 0.42 0.32 4.63 3.87 0.05 0.11 0.34 0.27
Farah Markaz 0.59 0.49 0.44 0.35 6.09 4.35 0.04 0.07 0.36 0.30
Gulistan 0.41 0.33 0.98 0.87 6.29 3.31 0.11 0.12 1.16 0.68
Khaki Safed 1.14 2.08 0.84 0.45 6.29 5.74 0.02 0.08 0.63 0.36
Lash Wa Juwayn 0.35 0.36 0.62 0.41 13.66 20.93 0.01 0.04 0.37 0.40
Purchaman 0.64 0.47 0.81 0.71 7.09 5.23 0.12 0.23 1.06 1.04
Pushte Rod 0.63 0.46 0.62 0.45 6.44 3.38 0.05 0.07 0.47 0.42
Qala i Kah 0.21 0.33 0.72 0.21 7.41 6.02 0.02 0.05 0.72 0.30
Qala-i-Kah Pusht Koh 0.75 0.92 0.59 0.30 7.50 6.22 0.02 0.05 0.37 0.33
Shib Koh Qalay-i-Kah 0.44 0.37 0.53 0.38 5.54 4.04 0.01 0.06 0.52 0.38
All 0.52 0.68 0.62 0.55 6.51 6.98 0.06 0.14 0.62 0.68
Table A2 Average and Standard Deviation of Total Animal Numbers per Family for Selected Species
Cows Donkeys ChickenPreferred
Ploughing AnimalsDraft
Animals
Province District AVG STD AVG STD AVG STD AVG STD AVG STD

162
Faryab
Almar 0.12 0.15 1.00 0.50 3.32 3.25 0.21 0.25 1.04 0.70
Bilchiragh 0.22 0.16 0.79 0.36 0.76 0.52 0.35 0.17 1.09 0.44
Dawlat Abad 0.04 0.04 0.73 0.19 0.57 0.45 0.11 0.14 0.42 0.41
Gurziwan 0.18 0.13 0.57 0.28 0.86 0.68 0.27 0.17 0.79 0.37
Khwaja Mosa 0.17 0.25 0.75 0.56 0.59 0.52 0.29 0.23 1.04 0.66
Khwaja Sabz Posh 0.10 0.08 0.46 0.19 0.28 0.15 0.25 0.15 0.74 0.33
Kohistan 0.15 0.07 0.84 0.33 3.09 0.95 0.53 0.22 1.28 0.46
Maymana 0.15 0.11 0.27 0.25 1.34 0.90 0.11 0.13 0.38 0.36
Pashtun Kot 0.14 0.17 0.70 0.41 0.86 1.40 0.32 0.22 1.01 0.51
Qaysar 0.11 0.05 0.45 0.29 2.19 1.36 0.14 0.05 0.56 0.25
Shirin Tagab 0.07 0.06 0.53 0.28 0.88 0.59 0.06 0.06 0.58 0.29
All 0.13 0.13 0.60 0.39 1.37 1.59 0.22 0.20 0.77 0.50
Ghazni Ab Band 0.31 0.31 0.73 0.56 5.84 4.38 0.02 0.07 0.57 0.51
Ajristan 0.71 0.40 0.58 1.13 2.30 2.24 0.33 0.16 0.76 0.30
Andar 0.90 0.49 0.28 0.18 2.77 1.69 0.02 0.06 0.31 0.21
Dih Yak 0.44 0.32 0.39 0.26 5.52 3.95 0.06 0.07 0.42 0.28
Gelan 0.27 0.26 0.35 0.43 6.42 3.65 0.02 0.04 0.26 0.31
Ghazni Markaz 0.32 0.36 0.07 0.11 2.59 2.26 0.00 0.02 0.07 0.11
Giro 0.60 0.55 0.56 0.36 4.33 2.49 0.02 0.07 0.52 0.33
Jaghatu 0.43 0.41 0.56 0.33 3.82 2.02 0.03 0.11 0.65 0.46
Jaghuri 0.18 0.30 0.32 0.24 3.67 1.65 0.03 0.06 0.34 0.26
Khoja Omary 0.30 0.22 0.18 0.14 1.64 0.97 0.01 0.04 0.18 0.15
Malistan 0.54 0.37 0.65 0.30 2.68 1.50 0.14 0.12 0.71 0.35
Muqur 0.39 0.27 0.58 0.33 6.38 4.90 0.01 0.03 0.43 0.29
Nawa 0.15 0.14 0.43 0.46 4.28 2.00 0.01 0.05 0.37 0.42
Nawur 0.44 0.60 0.82 0.56 4.04 3.46 0.26 0.27 0.80 0.51
Qara Bagh 0.64 0.42 0.47 0.38 3.43 2.07 0.08 0.17 0.46 0.40
Waghaz 0.27 0.25 0.25 0.22 2.75 2.10 0.03 0.09 0.27 0.25
Zana Khan 0.24 0.26 0.61 0.28 5.34 2.61 0.00 0.01 0.59 0.27
All 0.47 0.45 0.47 0.44 3.93 3.02 0.06 0.14 0.46 0.41
Ghor Lal Wa Sarjangal 0.70 0.33 0.72 0.28 4.03 2.31 0.83 0.45 1.43 0.57
Shahrak 0.41 0.28 0.56 0.48 1.75 2.31 0.22 0.23 0.64 0.48
Tulak 0.34 0.32 0.85 0.40 1.81 1.52 0.32 0.22 0.94 0.45
All 0.60 0.35 0.72 0.34 3.36 2.42 0.66 0.47 1.25 0.62
Table A2 Average and Standard Deviation of Total Animal Numbers per Family for Selected Species
Cows Donkeys ChickenPreferred
Ploughing AnimalsDraft
Animals
Province District AVG STD AVG STD AVG STD AVG STD AVG STD

Hilmand Baghran 0.64 0.31 0.52 0.41 8.64 6.91 0.10 0.14 0.50 0.27
Dishu 0.53 0.42 0.56 0.28 10.86 5.48 0.04 0.08 0.43 0.31
Garmser 1.04 0.85 0.51 0.50 8.59 6.19 0.02 0.08 0.48 0.44
Gerishk 0.91 0.69 0.56 0.68 10.50 16.82 0.14 0.30 0.64 0.72
Kajaki 0.93 0.53 0.64 0.39 7.39 6.21 0.10 0.22 0.54 0.37
Khanshen 1.17 1.03 0.61 0.51 15.17 7.05 0.01 0.05 0.52 0.47
Lashkar Gah 0.69 0.41 0.53 0.42 8.61 5.37 0.00 0.01 0.40 0.35
Marja 0.70 0.33 0.12 0.14 8.25 8.21 0.09 0.14 0.23 0.17
Musa Qala 0.67 0.81 0.35 0.42 9.12 18.56 0.05 0.11 0.35 0.46
Nad Ali 0.83 0.58 0.51 1.03 5.99 3.84 0.02 0.06 0.37 0.59
Naw Zad 0.31 0.30 0.77 0.89 7.08 8.84 0.03 0.07 0.50 0.59
Nawa 1.00 0.61 0.38 0.75 12.47 11.07 0.00 0.01 0.14 0.41
Reg 0.93 0.22 0.58 0.08 7.27 1.46 0.12 0.07 0.76 0.13
Sangin 0.92 0.36 0.48 0.38 5.06 4.47 0.04 0.11 0.50 0.39
Washer 0.34 0.39 1.71 1.33 7.24 10.11 0.01 0.04 1.31 1.03
All 0.77 0.62 0.57 0.69 8.62 10.34 0.06 0.16 0.50 0.56
Hirat Adraskan 0.27 0.44 0.56 0.39 1.80 2.46 0.12 0.20 0.58 0.45
Chishte Sharif 0.28 0.26 0.63 0.42 1.43 1.34 0.30 0.41 0.86 0.64
Farsi 0.27 0.19 0.79 0.37 1.10 0.97 0.13 0.17 1.04 0.46
Ghoryan 0.17 0.22 0.47 0.38 2.57 2.55 0.02 0.06 0.36 0.32
Gulran 0.27 0.35 1.51 1.00 4.91 3.77 0.10 0.20 1.29 0.87
Guzarah 0.32 0.47 0.28 0.30 2.37 1.32 0.23 0.30 0.44 0.45
Injil 0.43 0.42 0.30 0.33 1.65 1.43 0.26 0.32 0.54 0.54
Karukh 0.18 0.19 0.63 0.76 2.91 3.04 0.31 0.32 0.83 0.85
Kohsan 0.09 0.14 0.94 0.24 2.73 1.32 0.03 0.11 0.74 0.32
Kushke Kuhna 0.30 0.44 1.52 0.73 3.25 4.16 0.21 0.25 1.51 0.70
Obe 0.32 0.34 0.78 0.49 3.93 3.69 0.31 0.38 0.79 0.66
Pashtun Zarghun 0.22 0.21 0.38 0.30 1.64 1.08 0.23 0.22 0.56 0.31
Rabat-i-Sangy 0.26 0.26 0.75 0.43 2.19 1.89 0.17 0.33 0.77 0.52
Shindand 0.24 0.27 0.40 0.28 4.20 3.41 0.14 0.16 0.50 0.31
Zinda Jan 0.28 0.63 0.81 0.57 3.92 4.08 0.13 0.21 0.71 0.56
All 0.27 0.36 0.67 0.61 2.80 3.00 0.18 0.27 0.73 0.62
Table A2 Average and Standard Deviation of Total Animal Numbers per Family for Selected Species
Cows Donkeys ChickenPreferred
Ploughing AnimalsDraft
Animals
Province District AVG STD AVG STD AVG STD AVG STD AVG STD
163

164
Jawzjan Andkhoi 0.11 0.07 0.12 0.11 0.91 0.70 0.00 0.02 0.12 0.11
Aqcha 0.15 0.13 0.18 0.17 1.41 1.26 0.03 0.05 0.21 0.18
Darzab 0.19 0.13 1.01 0.35 0.78 0.54 0.40 0.26 1.42 0.53
Fayz Abad 0.15 0.11 0.31 0.22 1.68 2.01 0.04 0.08 0.23 0.20
Khamyab 0.92 0.38 0.27 0.16 3.28 1.40 0.07 0.06 0.38 0.21
Khani Chaharbagh 0.08 0.06 0.42 0.20 1.03 1.03 0.04 0.09 0.39 0.22
Khwaja Dukoh 0.14 0.12 0.34 0.27 1.62 3.38 0.00 0.00 0.34 0.27
Mardyan 0.14 0.08 0.21 0.15 6.06 5.78 0.03 0.02 0.20 0.12
Mingajik 0.11 0.13 0.35 0.21 2.51 2.00 0.00 0.00 0.30 0.19
Qaramqol 0.07 0.07 0.28 0.14 0.82 1.02 0.01 0.03 0.28 0.14
Qarqin 1.26 0.30 0.36 0.13 1.49 1.04 0.02 0.03 0.40 0.10
Qoshtepa 0.07 0.08 0.80 0.43 0.61 0.61 0.19 0.17 0.86 0.44
Qurghan 0.07 0.07 0.12 0.10 0.81 1.07 0.00 0.00 0.11 0.09
Shibirghan 0.18 0.17 0.23 0.25 1.22 1.22 0.06 0.09 0.24 0.27
All 0.18 0.26 0.31 0.32 1.66 2.42 0.06 0.13 0.34 0.39
Kabul Bagrami 0.60 0.42 0.41 0.22 4.52 1.96 0.05 0.09 0.01 0.02
Chahar Asyab 0.58 0.35 0.18 0.16 6.97 4.43 0.10 0.18 0.00 0.02
Dih Sabz 0.28 0.21 0.30 0.24 14.29 10.70 0.08 0.11 0.01 0.06
Farza 0.49 0.40 0.55 0.80 5.15 3.50 0.02 0.04 0.01 0.03
Guldara 0.10 0.10 0.19 0.19 1.30 0.61 0.01 0.02 0.17 0.13
Istalif 0.07 0.05 0.14 0.14 2.13 1.20 0.00 0.01 0.09 0.09
Kalakan 0.08 0.07 0.05 0.03 1.04 0.88 0.01 0.03 0.04 0.04
Khaki Jabbar 0.26 0.35 0.64 0.36 7.03 4.74 0.08 0.11 0.25 0.36
Mir Bacha Kot 0.07 0.09 0.03 0.05 1.76 1.54 0.01 0.05 0.01 0.05
Musayi 0.84 0.43 0.46 0.25 7.82 3.97 0.15 0.13 0.01 0.06
Paghman 0.28 0.15 0.20 0.30 4.99 3.51 0.02 0.04 0.00 0.00
Qara Bagh 0.10 0.12 0.07 0.15 1.87 2.04 0.01 0.02 0.05 0.08
Sarobi 0.75 0.50 0.83 0.77 12.20 7.22 0.22 0.23 0.10 0.19
Shakardara 0.58 0.23 0.11 0.09 2.49 1.43 0.04 0.04 0.14 0.10
All 0.35 0.38 0.28 0.42 5.30 5.89 0.06 0.12 0.05 0.13
Table A2 Average and Standard Deviation of Total Animal Numbers per Family for Selected Species
Cows Donkeys ChickenPreferred
Ploughing AnimalsDraft
Animals
Province District AVG STD AVG STD AVG STD AVG STD AVG STD

165
Kabul City Nahya 1 0.00 0.00 0.00 0.01 3.66 2.05 0.00 0.00 0.00 0.00
Nahya 2 0.01 0.00 0.00 0.01 0.49 0.17 0.00 0.00 0.00 0.00
Nahya 3 0.01 0.01 0.00 0.01 1.47 1.32 0.00 0.00 0.00 0.01
Nahya 4 0.02 0.07 0.00 0.00 1.09 1.25 0.00 0.00 0.00 0.01
Nahya 5 0.07 0.11 0.06 0.21 7.38 6.31 0.01 0.02 0.07 0.21
Nahya 6 0.03 0.02 0.01 0.01 1.78 0.80 0.00 0.01 0.01 0.01
Nahya 7 0.10 0.16 0.02 0.05 2.03 0.89 0.01 0.02 0.03 0.07
Nahya 8 0.03 0.04 0.01 0.02 3.20 1.63 0.00 0.00 0.01 0.01
Nahya 9 0.08 0.08 0.04 0.07 2.09 1.19 0.03 0.09 0.06 0.13
Nahya 10 0.05 0.11 0.01 0.02 0.96 1.00 0.00 0.00 0.01 0.02
Nahya 11 0.03 0.03 0.01 0.02 1.85 0.31 0.00 0.00 0.00 0.00
Nahya 12 0.03 0.03 0.01 0.01 2.80 0.54 0.00 0.00 0.01 0.01
Nahya 14 0.09 0.22 0.03 0.07 2.09 1.34 0.02 0.07 0.05 0.15
Nahya 15 0.02 0.02 0.00 0.00 2.09 0.41 0.00 0.00 0.00 0.00
Nahya 16 0.08 0.15 0.05 0.08 3.02 1.94 0.00 0.01 0.05 0.08
All 0.05 0.10 0.02 0.07 2.44 2.57 0.00 0.03 0.02 0.08
Kandahar Arghandab 0.78 0.82 0.46 0.70 11.44 11.72 0.00 0.01 0.43 0.68
Arghistan 0.49 0.44 1.22 0.59 5.86 5.42 0.06 0.12 1.16 0.62
Daman 0.51 0.54 0.44 0.64 6.74 6.15 0.00 0.04 0.45 0.64
Dand 0.36 0.30 0.19 0.27 2.66 1.63 0.00 0.01 0.18 0.26
Ghorak 0.54 0.49 1.56 1.89 9.77 6.85 0.01 0.04 1.23 1.46
Jarri 0.52 0.31 0.11 0.14 11.30 5.83 0.05 0.13 0.11 0.14
Kandahar 0.12 0.12 0.05 0.07 0.96 0.73 0.00 0.00 0.05 0.09
Khakrez 0.48 0.33 0.88 0.62 7.12 3.70 0.07 0.11 0.77 0.49
Maruf 0.42 0.45 0.83 0.47 5.13 5.98 0.05 0.14 0.67 0.45
Maywand 0.58 0.44 0.80 1.09 11.36 7.62 0.00 0.03 0.72 0.93
Meenasheen 0.40 0.21 0.59 0.35 3.59 1.98 0.15 0.12 0.62 0.34
Nesh 0.71 0.36 1.33 0.90 11.93 8.34 0.04 0.08 1.38 0.52
Panjwayi 0.57 0.33 0.21 0.25 10.38 4.64 0.00 0.01 0.20 0.23
Reg 0.05 0.09 0.89 1.13 7.32 6.63 0.02 0.07 0.59 0.59
Shah Wali Kot 0.62 0.48 0.54 0.56 7.02 6.49 0.05 0.10 0.58 0.56
Shigah 0.38 0.71 1.01 0.66 6.94 5.78 0.00 0.00 0.98 0.68
Shorabak 0.04 0.09 0.92 0.38 9.97 5.91 0.01 0.02 0.58 0.24
Spin Boldak 0.26 0.24 0.47 1.29 5.30 6.98 0.01 0.04 0.37 0.49
All 0.47 0.44 0.59 0.78 7.44 6.76 0.03 0.09 0.53 0.65
Table A2 Average and Standard Deviation of Total Animal Numbers per Family for Selected Species
Cows Donkeys ChickenPreferred
Ploughing AnimalsDraft
Animals
Province District AVG STD AVG STD AVG STD AVG STD AVG STD
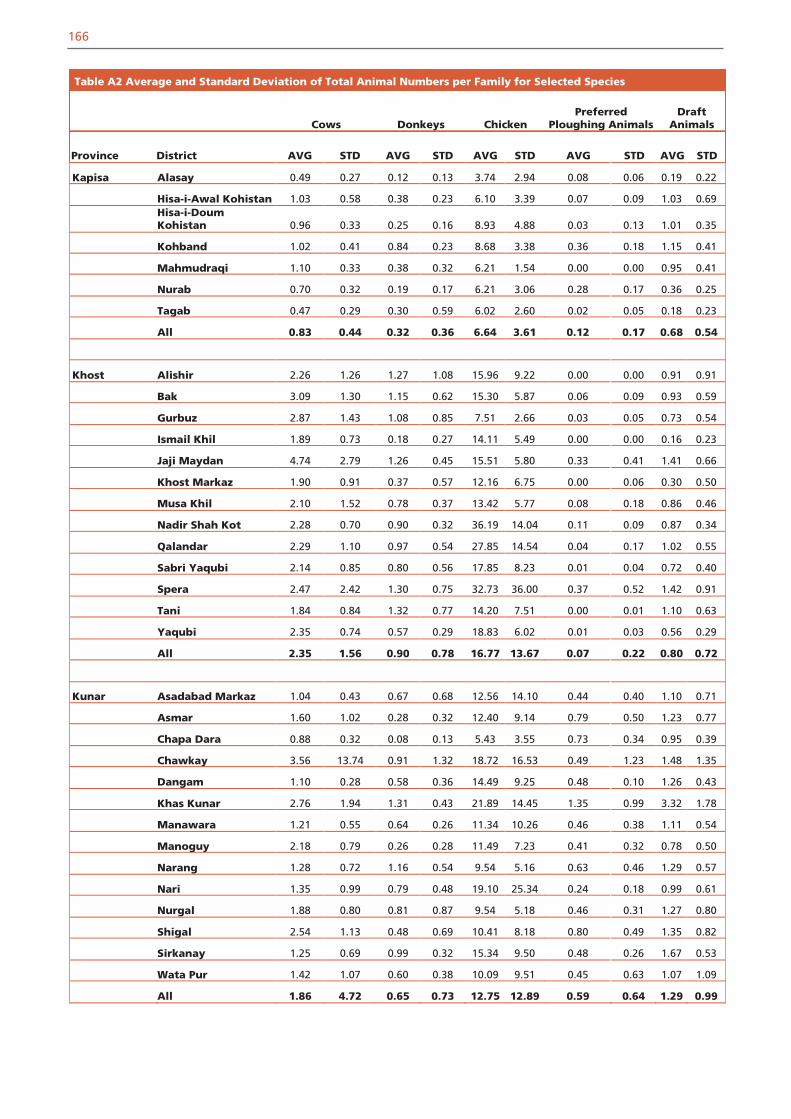
166
Kapisa Alasay 0.49 0.27 0.12 0.13 3.74 2.94 0.08 0.06 0.19 0.22
Hisa-i-Awal Kohistan 1.03 0.58 0.38 0.23 6.10 3.39 0.07 0.09 1.03 0.69Hisa-i-Doum Kohistan 0.96 0.33 0.25 0.16 8.93 4.88 0.03 0.13 1.01 0.35
Kohband 1.02 0.41 0.84 0.23 8.68 3.38 0.36 0.18 1.15 0.41
Mahmudraqi 1.10 0.33 0.38 0.32 6.21 1.54 0.00 0.00 0.95 0.41
Nurab 0.70 0.32 0.19 0.17 6.21 3.06 0.28 0.17 0.36 0.25
Tagab 0.47 0.29 0.30 0.59 6.02 2.60 0.02 0.05 0.18 0.23
All 0.83 0.44 0.32 0.36 6.64 3.61 0.12 0.17 0.68 0.54
Khost Alishir 2.26 1.26 1.27 1.08 15.96 9.22 0.00 0.00 0.91 0.91
Bak 3.09 1.30 1.15 0.62 15.30 5.87 0.06 0.09 0.93 0.59
Gurbuz 2.87 1.43 1.08 0.85 7.51 2.66 0.03 0.05 0.73 0.54
Ismail Khil 1.89 0.73 0.18 0.27 14.11 5.49 0.00 0.00 0.16 0.23
Jaji Maydan 4.74 2.79 1.26 0.45 15.51 5.80 0.33 0.41 1.41 0.66
Khost Markaz 1.90 0.91 0.37 0.57 12.16 6.75 0.00 0.06 0.30 0.50
Musa Khil 2.10 1.52 0.78 0.37 13.42 5.77 0.08 0.18 0.86 0.46
Nadir Shah Kot 2.28 0.70 0.90 0.32 36.19 14.04 0.11 0.09 0.87 0.34
Qalandar 2.29 1.10 0.97 0.54 27.85 14.54 0.04 0.17 1.02 0.55
Sabri Yaqubi 2.14 0.85 0.80 0.56 17.85 8.23 0.01 0.04 0.72 0.40
Spera 2.47 2.42 1.30 0.75 32.73 36.00 0.37 0.52 1.42 0.91
Tani 1.84 0.84 1.32 0.77 14.20 7.51 0.00 0.01 1.10 0.63
Yaqubi 2.35 0.74 0.57 0.29 18.83 6.02 0.01 0.03 0.56 0.29
All 2.35 1.56 0.90 0.78 16.77 13.67 0.07 0.22 0.80 0.72
Kunar Asadabad Markaz 1.04 0.43 0.67 0.68 12.56 14.10 0.44 0.40 1.10 0.71
Asmar 1.60 1.02 0.28 0.32 12.40 9.14 0.79 0.50 1.23 0.77
Chapa Dara 0.88 0.32 0.08 0.13 5.43 3.55 0.73 0.34 0.95 0.39
Chawkay 3.56 13.74 0.91 1.32 18.72 16.53 0.49 1.23 1.48 1.35
Dangam 1.10 0.28 0.58 0.36 14.49 9.25 0.48 0.10 1.26 0.43
Khas Kunar 2.76 1.94 1.31 0.43 21.89 14.45 1.35 0.99 3.32 1.78
Manawara 1.21 0.55 0.64 0.26 11.34 10.26 0.46 0.38 1.11 0.54
Manoguy 2.18 0.79 0.26 0.28 11.49 7.23 0.41 0.32 0.78 0.50
Narang 1.28 0.72 1.16 0.54 9.54 5.16 0.63 0.46 1.29 0.57
Nari 1.35 0.99 0.79 0.48 19.10 25.34 0.24 0.18 0.99 0.61
Nurgal 1.88 0.80 0.81 0.87 9.54 5.18 0.46 0.31 1.27 0.80
Shigal 2.54 1.13 0.48 0.69 10.41 8.18 0.80 0.49 1.35 0.82
Sirkanay 1.25 0.69 0.99 0.32 15.34 9.50 0.48 0.26 1.67 0.53
Wata Pur 1.42 1.07 0.60 0.38 10.09 9.51 0.45 0.63 1.07 1.09
All 1.86 4.72 0.65 0.73 12.75 12.89 0.59 0.64 1.29 0.99
Table A2 Average and Standard Deviation of Total Animal Numbers per Family for Selected Species
Cows Donkeys ChickenPreferred
Ploughing AnimalsDraft
Animals
Province District AVG STD AVG STD AVG STD AVG STD AVG STD

167
Kunduz Ali Abad 1.13 1.47 1.09 0.80 3.40 3.09 0.59 0.60 1.39 1.03
Chahar Dara 1.71 1.02 0.63 0.42 8.43 6.24 0.48 0.32 0.96 0.49
Dasht Archi 0.81 1.12 0.99 1.27 2.90 2.88 0.31 0.87 0.44 0.97
Imam Sahib 1.63 2.24 1.41 1.08 2.78 4.93 0.95 0.54 2.23 1.24
Khan Abad 0.53 0.36 0.64 0.47 3.20 2.19 0.38 0.29 0.89 0.67
Kunduz Markaz 1.05 0.50 0.30 0.21 3.52 2.26 0.81 0.54 1.10 0.61
Qala Zal 0.86 0.44 0.62 0.32 4.18 1.99 0.99 1.25 1.36 0.68
All 1.11 1.28 0.81 0.84 4.15 4.35 0.60 0.69 1.15 1.00
Laghman Alingar 1.33 0.86 0.51 1.08 6.17 4.75 0.20 0.30 0.61 1.07
Alishing 1.63 1.03 0.95 1.67 11.29 7.83 0.29 0.21 1.35 1.58
Dawlat Shah 2.14 1.86 0.13 0.19 8.31 7.47 0.15 0.16 0.25 0.27
Mihterlam Markaz 2.08 2.29 0.70 1.24 10.46 11.09 0.40 0.31 1.05 1.09
Qarghayi 2.41 1.65 0.81 1.00 14.87 11.30 0.47 0.44 1.13 0.79
All 1.90 1.70 0.65 1.20 10.20 9.46 0.31 0.33 0.91 1.13
Logar Azra 0.50 0.38 0.14 0.17 7.37 4.66 0.06 0.14 0.28 0.32
Baraki Barak 0.81 0.55 0.35 0.23 4.23 3.15 0.14 0.14 0.43 0.32
Charkh 0.40 0.30 0.22 0.17 3.23 2.18 0.03 0.05 0.23 0.18
Kharwar 0.51 0.31 0.56 0.29 4.63 3.09 0.07 0.11 0.60 0.34
Khushi 0.18 0.18 0.26 0.37 6.13 3.29 0.01 0.03 0.27 0.37
Muhammad Agha 0.51 0.34 0.26 0.30 4.46 2.64 0.07 0.11 0.33 0.34
Puli Alam 0.90 0.73 0.30 0.29 5.32 3.14 0.11 0.17 0.37 0.35
All 0.65 0.55 0.31 0.28 4.71 3.18 0.09 0.13 0.38 0.34
Table A2 Average and Standard Deviation of Total Animal Numbers per Family for Selected Species
Cows Donkeys ChickenPreferred
Ploughing AnimalsDraft
Animals
Province District AVG STD AVG STD AVG STD AVG STD AVG STD
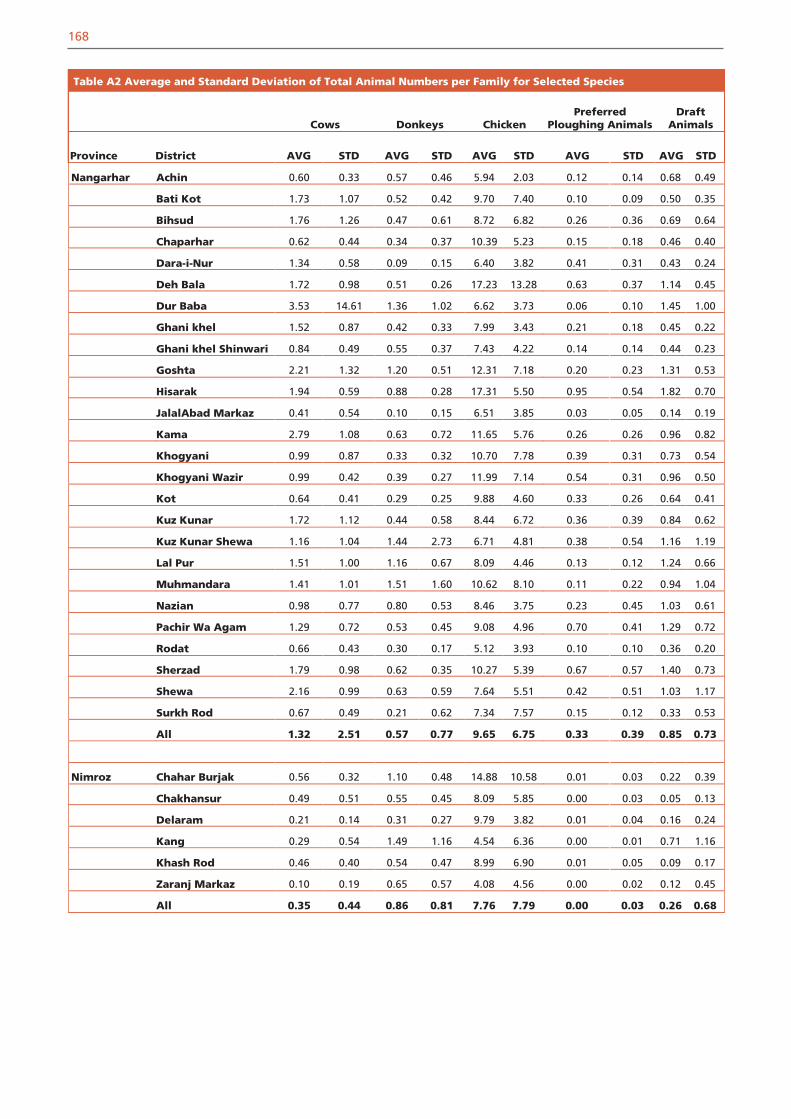
168
Nangarhar Achin 0.60 0.33 0.57 0.46 5.94 2.03 0.12 0.14 0.68 0.49
Bati Kot 1.73 1.07 0.52 0.42 9.70 7.40 0.10 0.09 0.50 0.35
Bihsud 1.76 1.26 0.47 0.61 8.72 6.82 0.26 0.36 0.69 0.64
Chaparhar 0.62 0.44 0.34 0.37 10.39 5.23 0.15 0.18 0.46 0.40
Dara-i-Nur 1.34 0.58 0.09 0.15 6.40 3.82 0.41 0.31 0.43 0.24
Deh Bala 1.72 0.98 0.51 0.26 17.23 13.28 0.63 0.37 1.14 0.45
Dur Baba 3.53 14.61 1.36 1.02 6.62 3.73 0.06 0.10 1.45 1.00
Ghani khel 1.52 0.87 0.42 0.33 7.99 3.43 0.21 0.18 0.45 0.22
Ghani khel Shinwari 0.84 0.49 0.55 0.37 7.43 4.22 0.14 0.14 0.44 0.23
Goshta 2.21 1.32 1.20 0.51 12.31 7.18 0.20 0.23 1.31 0.53
Hisarak 1.94 0.59 0.88 0.28 17.31 5.50 0.95 0.54 1.82 0.70
JalalAbad Markaz 0.41 0.54 0.10 0.15 6.51 3.85 0.03 0.05 0.14 0.19
Kama 2.79 1.08 0.63 0.72 11.65 5.76 0.26 0.26 0.96 0.82
Khogyani 0.99 0.87 0.33 0.32 10.70 7.78 0.39 0.31 0.73 0.54
Khogyani Wazir 0.99 0.42 0.39 0.27 11.99 7.14 0.54 0.31 0.96 0.50
Kot 0.64 0.41 0.29 0.25 9.88 4.60 0.33 0.26 0.64 0.41
Kuz Kunar 1.72 1.12 0.44 0.58 8.44 6.72 0.36 0.39 0.84 0.62
Kuz Kunar Shewa 1.16 1.04 1.44 2.73 6.71 4.81 0.38 0.54 1.16 1.19
Lal Pur 1.51 1.00 1.16 0.67 8.09 4.46 0.13 0.12 1.24 0.66
Muhmandara 1.41 1.01 1.51 1.60 10.62 8.10 0.11 0.22 0.94 1.04
Nazian 0.98 0.77 0.80 0.53 8.46 3.75 0.23 0.45 1.03 0.61
Pachir Wa Agam 1.29 0.72 0.53 0.45 9.08 4.96 0.70 0.41 1.29 0.72
Rodat 0.66 0.43 0.30 0.17 5.12 3.93 0.10 0.10 0.36 0.20
Sherzad 1.79 0.98 0.62 0.35 10.27 5.39 0.67 0.57 1.40 0.73
Shewa 2.16 0.99 0.63 0.59 7.64 5.51 0.42 0.51 1.03 1.17
Surkh Rod 0.67 0.49 0.21 0.62 7.34 7.57 0.15 0.12 0.33 0.53
All 1.32 2.51 0.57 0.77 9.65 6.75 0.33 0.39 0.85 0.73
Nimroz Chahar Burjak 0.56 0.32 1.10 0.48 14.88 10.58 0.01 0.03 0.22 0.39
Chakhansur 0.49 0.51 0.55 0.45 8.09 5.85 0.00 0.03 0.05 0.13
Delaram 0.21 0.14 0.31 0.27 9.79 3.82 0.01 0.04 0.16 0.24
Kang 0.29 0.54 1.49 1.16 4.54 6.36 0.00 0.01 0.71 1.16
Khash Rod 0.46 0.40 0.54 0.47 8.99 6.90 0.01 0.05 0.09 0.17
Zaranj Markaz 0.10 0.19 0.65 0.57 4.08 4.56 0.00 0.02 0.12 0.45
All 0.35 0.44 0.86 0.81 7.76 7.79 0.00 0.03 0.26 0.68
Table A2 Average and Standard Deviation of Total Animal Numbers per Family for Selected Species
Cows Donkeys ChickenPreferred
Ploughing AnimalsDraft
Animals
Province District AVG STD AVG STD AVG STD AVG STD AVG STD

169
Nuristan Bargi Matal 1.90 0.94 0.19 0.14 6.30 3.87 1.25 0.58 1.64 0.67
Do Aab 1.17 0.52 0.54 0.32 22.43 10.96 0.03 0.05 0.46 0.28
Kamdesh 1.36 0.49 0.23 0.19 5.31 3.62 0.49 0.30 0.74 0.33
Mandol 2.04 1.04 1.27 0.48 42.48 23.88 0.08 0.14 1.46 0.55
Nuristan 1.44 0.55 1.05 0.94 8.60 4.11 0.12 0.15 1.16 0.95
Wama 2.85 1.76 0.43 0.34 11.02 16.06 0.80 1.08 1.35 1.16
Waygal 1.83 1.07 0.59 0.42 8.84 11.64 0.84 0.59 1.49 0.78
All 1.87 1.15 0.69 0.66 15.24 19.19 0.52 0.68 1.28 0.84
Paktika Dila Khoshmand 0.62 0.35 0.64 0.33 6.08 2.49 0.01 0.07 0.50 0.26
Gayan 0.84 0.17 0.45 0.37 13.25 8.73 0.05 0.05 0.36 0.26
Gomal 0.49 0.32 0.50 0.61 8.99 5.63 0.01 0.04 0.43 0.52
Jani Khil 0.61 0.36 0.36 0.24 5.19 2.31 0.01 0.03 0.28 0.20
Khir Kot 0.48 0.39 0.13 0.18 3.44 2.71 0.04 0.09 0.14 0.22
Mata Khan 1.28 0.55 0.31 0.27 14.27 7.52 0.00 0.02 0.28 0.24
Nika 0.96 0.37 0.93 0.45 17.20 15.01 0.00 0.00 0.93 0.45
Omna 0.53 0.54 0.41 0.38 4.56 2.05 0.01 0.03 0.38 0.38
Sar Hawza 0.34 0.41 0.49 0.40 5.55 4.69 0.01 0.04 0.46 0.38
Sarobi 0.47 0.18 0.39 0.17 6.71 2.12 0.09 0.10 0.39 0.18
Sharana Markaz 1.25 0.67 0.11 0.24 9.68 5.87 0.01 0.04 0.08 0.15
Urgun 0.81 0.53 0.45 0.31 12.68 7.44 0.01 0.02 0.43 0.31
Waza Khwa 0.18 0.24 0.37 0.35 6.14 1.95 0.00 0.02 0.36 0.34
Wor Mamay 0.44 0.32 0.21 0.29 7.60 3.10 0.07 0.13 0.24 0.26
Yahya Khil 0.99 0.39 0.13 0.10 5.44 3.05 0.00 0.00 0.13 0.10
Yusuf Khil 0.65 0.41 0.16 0.23 3.28 1.32 0.00 0.00 0.15 0.21
Ziruk 1.48 0.97 0.86 0.36 14.21 11.00 0.01 0.07 0.86 0.36
All 0.65 0.55 0.37 0.39 7.83 5.90 0.02 0.07 0.33 0.35
Paktya Adma 0.67 0.39 1.32 0.65 7.18 2.08 0.06 0.09 1.27 0.82
Ahmad Khel 0.85 0.40 0.57 0.34 18.31 6.93 0.04 0.05 0.61 0.34
Chamkani 1.54 0.50 0.61 0.33 20.72 8.31 0.03 0.11 0.64 0.36
Dand Wa Patan 1.82 0.72 0.62 0.32 32.25 13.43 0.07 0.15 0.69 0.40
Dowamanda Shamal 1.08 0.44 0.43 0.40 13.07 4.57 0.00 0.00 0.42 0.41
Gardez 0.72 0.79 0.16 0.24 8.48 6.50 0.02 0.03 0.16 0.20
Jaji 1.06 0.68 0.53 0.37 17.19 13.79 0.07 0.11 0.60 0.42
Jani Khel 2.92 1.91 0.72 0.30 24.21 12.97 0.07 0.13 0.78 0.39
Lija Mangal 0.75 0.47 0.62 0.48 18.06 6.74 0.03 0.06 0.65 0.50
Sayed Karam 1.19 0.41 0.53 0.34 14.33 5.94 0.00 0.01 0.46 0.29
Shwak 0.62 0.26 0.82 0.40 8.61 3.59 0.03 0.07 0.86 0.41
Waza Jadran 0.96 0.41 0.64 0.28 6.60 2.22 0.03 0.06 0.67 0.30
Zurmat 1.59 0.80 0.35 0.47 10.37 5.97 0.02 0.08 0.29 0.42
All 1.33 0.97 0.49 0.42 15.11 10.77 0.03 0.09 0.49 0.44
Table A2 Average and Standard Deviation of Total Animal Numbers per Family for Selected Species
Cows Donkeys ChickenPreferred
Ploughing AnimalsDraft
Animals
Province District AVG STD AVG STD AVG STD AVG STD AVG STD
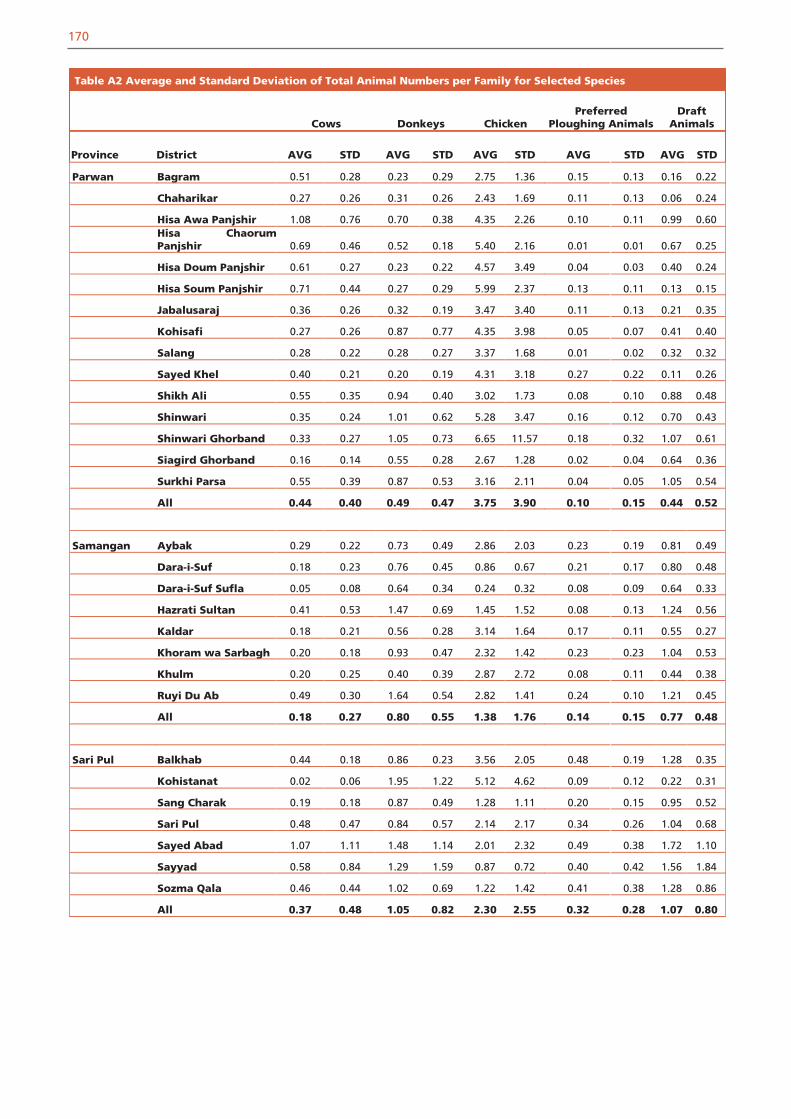
170
Parwan Bagram 0.51 0.28 0.23 0.29 2.75 1.36 0.15 0.13 0.16 0.22
Chaharikar 0.27 0.26 0.31 0.26 2.43 1.69 0.11 0.13 0.06 0.24
Hisa Awa Panjshir 1.08 0.76 0.70 0.38 4.35 2.26 0.10 0.11 0.99 0.60Hisa Chaorum Panjshir 0.69 0.46 0.52 0.18 5.40 2.16 0.01 0.01 0.67 0.25
Hisa Doum Panjshir 0.61 0.27 0.23 0.22 4.57 3.49 0.04 0.03 0.40 0.24
Hisa Soum Panjshir 0.71 0.44 0.27 0.29 5.99 2.37 0.13 0.11 0.13 0.15
Jabalusaraj 0.36 0.26 0.32 0.19 3.47 3.40 0.11 0.13 0.21 0.35
Kohisafi 0.27 0.26 0.87 0.77 4.35 3.98 0.05 0.07 0.41 0.40
Salang 0.28 0.22 0.28 0.27 3.37 1.68 0.01 0.02 0.32 0.32
Sayed Khel 0.40 0.21 0.20 0.19 4.31 3.18 0.27 0.22 0.11 0.26
Shikh Ali 0.55 0.35 0.94 0.40 3.02 1.73 0.08 0.10 0.88 0.48
Shinwari 0.35 0.24 1.01 0.62 5.28 3.47 0.16 0.12 0.70 0.43
Shinwari Ghorband 0.33 0.27 1.05 0.73 6.65 11.57 0.18 0.32 1.07 0.61
Siagird Ghorband 0.16 0.14 0.55 0.28 2.67 1.28 0.02 0.04 0.64 0.36
Surkhi Parsa 0.55 0.39 0.87 0.53 3.16 2.11 0.04 0.05 1.05 0.54
All 0.44 0.40 0.49 0.47 3.75 3.90 0.10 0.15 0.44 0.52
Samangan Aybak 0.29 0.22 0.73 0.49 2.86 2.03 0.23 0.19 0.81 0.49
Dara-i-Suf 0.18 0.23 0.76 0.45 0.86 0.67 0.21 0.17 0.80 0.48
Dara-i-Suf Sufla 0.05 0.08 0.64 0.34 0.24 0.32 0.08 0.09 0.64 0.33
Hazrati Sultan 0.41 0.53 1.47 0.69 1.45 1.52 0.08 0.13 1.24 0.56
Kaldar 0.18 0.21 0.56 0.28 3.14 1.64 0.17 0.11 0.55 0.27
Khoram wa Sarbagh 0.20 0.18 0.93 0.47 2.32 1.42 0.23 0.23 1.04 0.53
Khulm 0.20 0.25 0.40 0.39 2.87 2.72 0.08 0.11 0.44 0.38
Ruyi Du Ab 0.49 0.30 1.64 0.54 2.82 1.41 0.24 0.10 1.21 0.45
All 0.18 0.27 0.80 0.55 1.38 1.76 0.14 0.15 0.77 0.48
Sari Pul Balkhab 0.44 0.18 0.86 0.23 3.56 2.05 0.48 0.19 1.28 0.35
Kohistanat 0.02 0.06 1.95 1.22 5.12 4.62 0.09 0.12 0.22 0.31
Sang Charak 0.19 0.18 0.87 0.49 1.28 1.11 0.20 0.15 0.95 0.52
Sari Pul 0.48 0.47 0.84 0.57 2.14 2.17 0.34 0.26 1.04 0.68
Sayed Abad 1.07 1.11 1.48 1.14 2.01 2.32 0.49 0.38 1.72 1.10
Sayyad 0.58 0.84 1.29 1.59 0.87 0.72 0.40 0.42 1.56 1.84
Sozma Qala 0.46 0.44 1.02 0.69 1.22 1.42 0.41 0.38 1.28 0.86
All 0.37 0.48 1.05 0.82 2.30 2.55 0.32 0.28 1.07 0.80
Table A2 Average and Standard Deviation of Total Animal Numbers per Family for Selected Species
Cows Donkeys ChickenPreferred
Ploughing AnimalsDraft
Animals
Province District AVG STD AVG STD AVG STD AVG STD AVG STD

171
Takhar Baharak 1.01 0.60 1.16 0.45 3.69 1.75 0.63 0.34 1.51 0.59
Bangi 0.39 0.22 0.96 0.39 2.08 1.01 0.30 0.18 1.06 0.47
Cha Aab 0.39 0.32 0.83 0.26 2.45 2.20 0.32 0.24 0.85 0.43
Chal 0.51 0.24 0.74 0.39 1.04 0.67 0.25 0.20 0.83 0.42
Darqad 1.60 0.58 1.04 0.49 3.77 1.83 1.21 0.37 1.90 0.56
Dashte Qala 0.62 0.45 0.70 0.29 2.01 0.95 0.31 0.17 0.77 0.30
Farkhar 0.37 0.14 0.76 0.19 1.42 1.62 0.26 0.15 0.83 0.31
Hazar Somoch 0.28 0.16 1.27 0.57 3.19 1.09 0.37 0.17 1.42 0.50
Ishkamish 0.64 0.46 1.30 0.72 1.34 1.03 0.48 0.33 1.38 0.70
Kalafgan 0.72 0.46 1.56 0.80 4.01 2.62 0.87 0.56 2.15 1.17
Khwaja Bahwaddin 1.31 0.55 1.67 0.42 5.26 2.49 1.34 0.58 2.72 0.87
Khwaja Ghar 0.47 0.20 0.92 0.40 2.59 0.79 0.48 0.19 1.20 0.38
Namak Aab 0.31 0.17 1.14 0.64 3.42 1.77 0.30 0.17 1.18 0.67
Rustaq 0.62 0.50 0.89 1.05 1.84 1.90 0.44 0.46 1.17 1.33
Taluqan 0.91 0.75 0.87 0.73 3.56 4.44 0.71 0.68 1.52 1.14
Warsaj 1.43 1.08 0.59 0.34 2.60 1.68 0.35 0.28 0.92 0.51
Yangi Qala 1.16 1.22 1.51 1.83 4.91 7.84 0.64 0.58 1.79 1.70
All 0.76 0.69 1.00 0.80 2.79 3.19 0.54 0.50 1.33 1.01
Uruzgan Char Cheenah 0.95 0.41 1.06 0.90 9.40 5.81 0.46 0.24 1.17 0.53
Chora 1.00 0.82 1.21 1.14 12.48 18.54 0.69 0.59 1.79 1.06
Day Kundi 0.26 0.26 0.28 0.24 2.04 1.50 0.19 0.18 0.50 0.37
Dihrawud 1.21 0.86 0.65 0.54 13.04 8.21 0.51 0.50 0.94 0.58
Gizab 0.75 0.36 0.84 0.45 5.37 4.28 0.65 0.47 1.24 0.61
Khas Uruzgan 0.93 0.74 1.33 0.78 4.79 2.78 0.77 0.66 1.86 1.12
Kijran 0.85 1.13 0.74 0.42 6.93 9.56 0.62 0.55 1.49 1.09
Shahristan 0.56 0.65 0.51 0.46 4.18 3.39 0.30 0.26 0.71 0.46
Tirin Kot 1.68 1.05 1.51 1.41 18.81 16.47 0.77 0.69 1.91 1.01
All 0.97 0.91 0.92 1.00 9.70 12.50 0.54 0.55 1.28 0.96
Wardak Bihsud Markaz 0.37 0.28 0.46 0.24 1.65 8.23 0.22 0.28 0.67 0.95
Chak 0.34 0.31 0.37 0.22 2.85 1.94 0.06 0.09 0.38 0.25
Day Mirdad 0.36 0.32 0.72 0.33 3.42 2.65 0.15 0.16 0.78 0.38
Hisa Awali Bihsud 0.73 0.48 1.19 0.50 1.87 1.31 0.34 0.33 1.33 0.57
Jaghatu 0.18 0.17 0.46 0.42 3.00 2.28 0.01 0.03 0.44 0.44
Jalrez 0.49 0.33 0.52 0.34 5.30 3.86 0.07 0.12 0.55 0.40
Maydan Shahr 0.57 0.36 0.21 0.18 5.38 2.95 0.11 0.14 0.29 0.24
Nirkh 0.31 0.33 0.24 0.30 5.41 3.85 0.04 0.12 0.25 0.32
Sayed Abad 0.27 0.19 0.27 0.18 3.05 2.08 0.01 0.03 0.16 0.18
All 0.39 0.35 0.48 0.43 3.32 4.09 0.11 0.21 0.52 0.60
Table A2 Average and Standard Deviation of Total Animal Numbers per Family for Selected Species
Cows Donkeys ChickenPreferred
Ploughing AnimalsDraft
Animals
Province District AVG STD AVG STD AVG STD AVG STD AVG STD
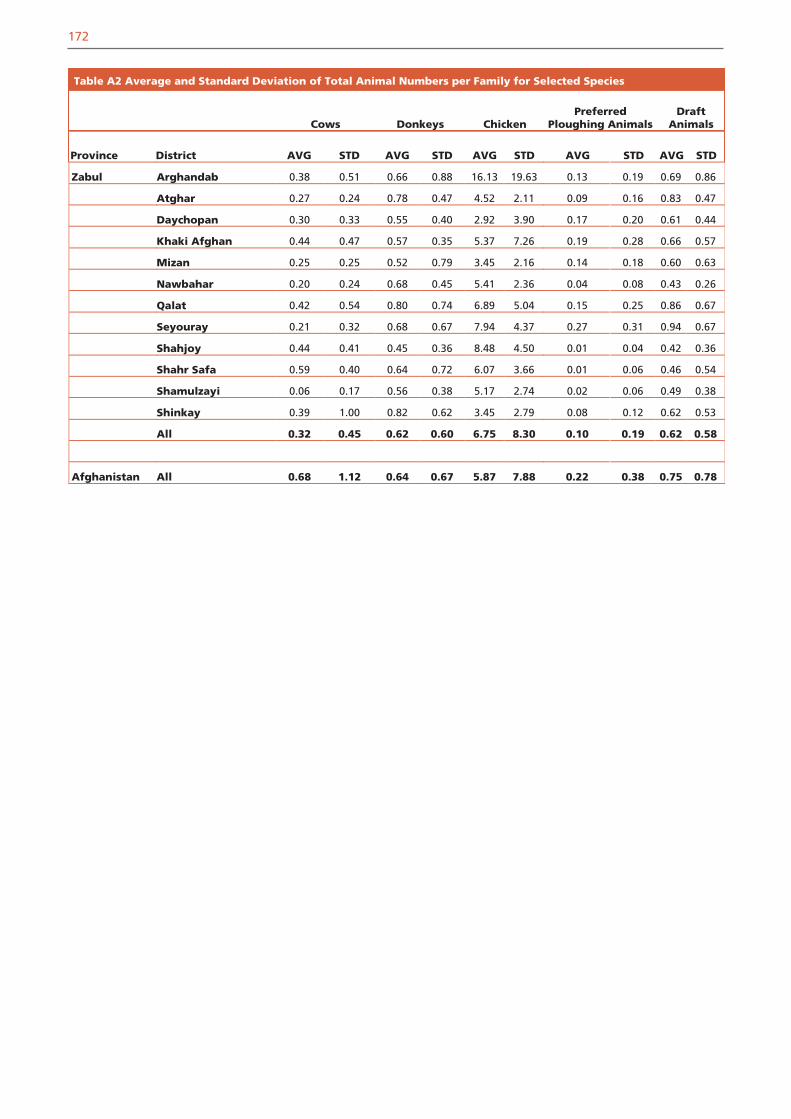
172
Zabul Arghandab 0.38 0.51 0.66 0.88 16.13 19.63 0.13 0.19 0.69 0.86
Atghar 0.27 0.24 0.78 0.47 4.52 2.11 0.09 0.16 0.83 0.47
Daychopan 0.30 0.33 0.55 0.40 2.92 3.90 0.17 0.20 0.61 0.44
Khaki Afghan 0.44 0.47 0.57 0.35 5.37 7.26 0.19 0.28 0.66 0.57
Mizan 0.25 0.25 0.52 0.79 3.45 2.16 0.14 0.18 0.60 0.63
Nawbahar 0.20 0.24 0.68 0.45 5.41 2.36 0.04 0.08 0.43 0.26
Qalat 0.42 0.54 0.80 0.74 6.89 5.04 0.15 0.25 0.86 0.67
Seyouray 0.21 0.32 0.68 0.67 7.94 4.37 0.27 0.31 0.94 0.67
Shahjoy 0.44 0.41 0.45 0.36 8.48 4.50 0.01 0.04 0.42 0.36
Shahr Safa 0.59 0.40 0.64 0.72 6.07 3.66 0.01 0.06 0.46 0.54
Shamulzayi 0.06 0.17 0.56 0.38 5.17 2.74 0.02 0.06 0.49 0.38
Shinkay 0.39 1.00 0.82 0.62 3.45 2.79 0.08 0.12 0.62 0.53
All 0.32 0.45 0.62 0.60 6.75 8.30 0.10 0.19 0.62 0.58
Afghanistan All 0.68 1.12 0.64 0.67 5.87 7.88 0.22 0.38 0.75 0.78
Table A2 Average and Standard Deviation of Total Animal Numbers per Family for Selected Species
Cows Donkeys ChickenPreferred
Ploughing AnimalsDraft
Animals
Province District AVG STD AVG STD AVG STD AVG STD AVG STD

173
Table A3 Summary of forage use and feeding situationMaize
ProductionMaize
PurchasedSorghum
ProductionSorghum Purchased
Millet Production
Millet Purchased
Region AnswerNumber
Respondents %Number
Respondents %Number
Respondents %Number
Respondents %Number
Respondents %Number
Respondents %
East Total 251 251 251 251 251 251
No 157 62.55 213 84.86 245 97.61 250 99.60 251 100 248 98.80
Yes 94 37.45 38 15.14 6 2.39 1 0.40 0 0 3 1.20
Centre Total 205 205 205 205 205 205
East No 98 47.80 137 66.83 200 97.56 194 94.63 192 93.66 199 97.07
Yes 107 52.20 68 33.17 5 2.44 11 5.37 13 6.34 6 2.93
Centre Total 212 212 212 212 212 212
No 194 91.51 155 73.11 210 99.06 210 99.06 206 97.17 211 99.53
Yes 18 8.49 57 26.89 2 0.94 2 0.94 6 2.83 1 0.47
North Total 339 339 339 339 339 339
No 295 87.02 266 78.47 313 92.33 327 96.46 339 100 338 99.71
Yes 44 12.98 73 21.53 26 7.67 12 3.54 0 0 1 0.29
West Total 278 278 278 278 278 278
No 228 82.01 257 92.45 278 100 276 99.28 276 99.28 276 99.28
Yes 50 17.99 21 7.55 0 0 2 0.72 2 0.72 2 0.72
Total Total 1285 1285 1285 1285 1285 1285
No 972 75.64 1028 80.00 1246 96.96 1257 97.82 1264 98.37 1272 98.99
Yes 313 24.36 257 20.00 39 3.04 28 2.18 21 1.63 13 1.01
Table A3 Summary of forage use and feeding situationShaftal
ProductionShaftal
PurchasedLucerne
ProductionLucerne
PurchasedWheat
ProductionWheat
Purchased
Region AnswerNumber
Respondents %Number
Respondents %Number
Respondents %Number
Respondents %Number
Respondents %Number
Respondents %
East Total 251 251 251 251 251 251
No 89 35.46 226 90.04 224 89.24 234 93.23 71 28.29 149 59.36
Yes 162 64.54 25 9.96 27 10.76 17 6.77 180 71.71 102 40.64
Centre Total 205 205 205 205 205 205
East No 73 35.61 128 62.44 69 33.66 111 54.15 23 11.22 133 64.88
Yes 132 64.39 77 37.56 136 66.34 94 45.85 182 88.78 72 35.12
Centre Total 212 212 212 212 212 212
No 146 68.87 162 76.42 108 50.94 139 65.57 69 32.55 121 57.08
Yes 66 31.13 50 23.58 104 49.06 73 34.43 143 67.45 91 42.92
North Total 339 339 339 339 339 339
No 312 92.04 306 90.27 264 77.88 284 83.78 82 24.19 189 55.75
Yes 27 7.96 33 9.73 75 22.12 55 16.22 257 75.81 150 44.25
West Total 278 278 278 278 278 278
No 144 51.80 238 85.61 128 46.04 210 75.54 70 25.18 170 61.15
Yes 134 48.20 40 14.39 150 53.96 68 24.46 208 74.82 108 38.85
Total Total 1285 1285 1285 1285 1285 1285
No 764 59.46 1060 82.49 793 61.71 978 76.11 315 24.51 762 59.30
Yes 521 40.54 225 17.51 492 38.29 307 23.89 970 75.49 523 40.70
8.3. TABULAR SUMMARY STATISTICS LEVEL 2

174
Table A3 Summary of forage use and feeding situation
Hay Production
Hay Purchased
Wheat Bran Production
Wheat Bran Purchased
Cotton Seed CakeProduction
Cotton Seed CakePurchased
Region AnswerNumber
Respondents %Number
Respondents %Number
Respondents %Number
Respondents %Number
Respondents %Number
Respondents %
East Total 251 251 251 251 251 251
No 238 94.82 243 96.81 233 92.83 198 78.88 250 99.60 108 43.03
Yes 13 5.18 8 3.19 18 7.17 53 21.12 1 0.40 143 56.97
Centre Total 205 205 205 205 205 205
East No 197 96.10 198 96.59 184 89.76 37 18.05 199 97.07 28 13.66
Yes 8 3.90 7 3.41 21 10.24 168 81.95 6 2.93 177 86.34
Centre Total 212 212 212 212 212 212
No 131 61.79 190 89.62 201 94.81 134 63.21 208 98.11 101 47.64
Yes 81 38.21 22 10.38 11 5.19 78 36.79 4 1.89 111 52.36
North Total 339 339 339 339 339 339
No 253 74.63 302 89.09 247 72.86 209 61.65 327 96.46 57 16.81
Yes 86 25.37 37 10.91 92 27.14 130 38.35 12 3.54 282 83.19
West Total 278 278 278 278 278 278
No 203 73.02 272 97.84 262 94.24 260 93.53 275 98.92 261 93.88
Yes 75 26.98 6 2.16 16 5.76 18 6.47 3 1.08 17 6.12
Total Total 1285 1285 1285 1285 1285 1285
No 1022 79.53 1205 93.77 1127 87.70 838 65.21 1259 97.98 555 43.19
Yes 263 20.47 80 6.23 158 12.30 447 34.79 26 2.02 730 56.81
Table A3 Summary of forage use and feeding situation
Maize Stover Own Production
Maize Stover Purchased
Barley Own Production Barley Purchased
Region AnswerNumber
Respondents %Number
Respondents %Number
Respondents %Number
Respondents %East Total 251 251 251 251
No 109 43.43 180 71.71 250 99.60 231 92.03Yes 142 56.57 71 28.29 1 0.40 20 7.97
Centre Total 205 205 205 205East No 106 51.71 193 94.15 202 98.54 190 92.68
Yes 99 48.29 12 5.85 3 1.46 15 7.32
Centre Total 212 212 212 212
No 193 91.04 207 97.64 205 96.70 199 93.87
Yes 19 8.96 5 2.36 7 3.30 13 6.13
North Total 339 339 339 339
No 285 84.07 319 94.10 332 97.94 248 73.16
Yes 54 15.93 20 5.90 7 2.06 91 26.84
West Total 278 278 278 125
No 219 78.78 273 98.20 225 80.94 28 22.40
Yes 59 21.22 5 1.80 53 19.06 97 77.60
Total Total 1285 1285 1285 1285
No 912 70.97 1172 91.21 1214 94.47 1049 81.63Yes 373 29.03 113 8.79 71 5.53 236 18.37

175
Table A4 General aspects of the feeding situation Enough Feed Pasture Sufficent
2001-2002 2002-2003 2001-2002 2002-2003
Region AnswerNumber
Respondents %Number
Respondents %Number
Respondents %Number
Respondents %
East Total 251 251 251 251
No 139 55.38 137 54.58 210 83.67 206 82.07
Yes 112 44.62 114 45.42 41 16.33 45 17.93
Centre Total 205 205 205 205
East No 156 76.10 150 73.17 192 93.66 194 94.63
Yes 49 23.90 55 26.83 13 6.34 11 5.37
Centre Total 212 212 212 212
No 176 83.02 158 74.53 149 70.28 149 70.28
Yes 36 16.98 54 25.47 63 29.72 63 29.72
North Total 339 339 339 339
No 327 96.46 177 52.21 300 88.50 215 63.42
Yes 12 3.54 162 47.79 39 11.50 124 36.58
West Total 278 278 278 278
No 264 94.96 162 58.27 259 93.17 183 65.83
Yes 14 5.04 116 41.73 19 6.83 95 34.17
Total Total 1285 1285 1285 1285
No 1062 82.65 784 61.01 1110 86.38 947 73.70
Yes 223 17.35 501 38.99 175 13.62 338 26.30
Table A4 General aspects of the feeding situation
Bought Supplements Produced Supplements Price for Supplements Up
2001-2002 2002-2003 2001-2002 2002-2003 2001-2002 2002-2003
Region AnswerNumber
Respondents %Number
%Number
%Number
%Number
%Number
%
East Total 251 251 251 251 251 251
No 66 26.29 68 27.09 187 74.50 183 72.91 48 19.12 64 25.50
Yes 185 73.71 183 72.91 64 25.50 68 27.09 203 80.88 187 74.50
Centre Total 205 205 205 205 205 205
East No 13 6.34 27 13.17 174 84.88 164 80.00 10 4.88 12 5.85
Yes 192 93.66 178 86.83 31 15.12 41 20.00 195 95.12 193 94.15
Centre Total 212 212 212 212 212 212
No 30 14.15 41 19.34 192 90.57 186 87.74 27 12.74 56 26.42
Yes 182 85.85 171 80.66 20 9.43 26 12.26 185 87.26 156 73.58
North Total 339 339 339 339 339 339
No 145 42.77 241 71.09 322 94.99 290 85.55 13 3.83 281 82.89
Yes 194 57.23 98 28.91 17 5.01 49 14.45 326 96.17 58 17.11
West Total 278 278 278 278 278 278
No 107 38.49 147 52.88 272 97.84 234 84.17 41 14.75 157 56.47
Yes 171 61.51 131 47.12 6 2.16 44 15.83 237 85.25 121 43.53
Total Total 1285 1285 1285 1285 1285 1285
No 361 28.09 524 40.78 1147 89.26 1057 82.26 139 10.82 570 44.36
Yes 924 71.91 761 59.22 138 10.74 228 17.74 1146 89.18 715 55.64
Respondents Respondents Respondents Respondents Respondents

176
Table A6 Monthly distribution of begin and end of pasture period by regions (number ofrespondents)
Begin of Pasture Period by Region End of Pasture Period by Region
Month East Centre-East
Centre North West All East Centre-East
Centre North West All
January 0 0 1 5 0 6 0 0 0 0 5 5
February 0 0 1 174 85 260 76 0 3 17 16 112
March 132 136 121 35 118 542 9 0 2 10 5 26
April 2 25 50 0 0 77 4 0 14 28 8 54
May 1 0 0 9 1 11 12 8 40 52 36 148
June 0 1 1 0 0 2 2 19 8 6 17 52
July 0 0 0 1 0 1 0 9 1 1 1 12
August 5 0 1 3 5 14 4 12 1 17 0 34
September 9 1 1 1 5 17 19 28 39 38 22 146
October 8 0 0 5 0 13 15 46 32 58 37 188
November 0 0 0 0 0 0 16 42 36 14 68 176
December 0 0 0 7 0 7 0 0 0 0 0 0
All 157 163 176 240 214 950 157 164 176 241 215 953
Table A5 Monthly distribution of lambing and kidding by regions (number of respondents)
Lambing by Region Kidding by Region
Month East Centre-East
Centre North West All East Centre-East
Centre North West All
January 1 0 1 3 48 53 15 5 2 16 52 90
February 35 30 67 221 141 494 33 21 52 186 151 443
March 61 111 63 21 41 297 58 85 78 37 37 295
April 1 1 0 0 0 2 1 1 0 1 0 3
May 0 0 0 1 0 1 0 0 0 0 0 0
June 0 0 0 0 0 0 0 0 0 0 0 0
July 0 0 0 0 0 0 0 0 0 0 0 0
August 0 0 0 0 0 0 0 0 0 0 0 0
September 0 0 0 0 0 0 0 1 0 0 4 5
October 0 0 0 0 0 0 0 0 0 2 2 4
November 0 0 0 0 1 1 0 0 0 0 0 0
December 2 0 0 3 0 5 1 0 0 5 0 6
All 100 142 131 249 231 853 108 113 132 247 246 846

177
Table A7 Monthly distribution of begin and end of stubble grazing by regions (number of respondents)
Begin of Stubble Grazing by Region End of Stubble Grazing by Region
Month East Centre-East
Centre North West All East Centre-East
Centre North West All
January 0 0 0 0 0 0 0 0 0 0 0 0
February 0 0 0 4 0 4 0 0 0 0 0 0
March 1 1 0 1 1 4 0 0 0 0 0 0
April 0 6 2 2 16 26 0 4 0 1 0 5
May 58 10 17 167 98 350 3 1 0 0 1 5
June 26 109 32 98 146 411 63 7 21 108 104 303
July 4 63 93 0 9 169 5 90 57 51 112 315
August 0 0 11 0 11 2 33 23 45 38 141
September 41 0 20 0 61 13 33 67 51 11 175
October 15 0 0 0 15 29 13 5 14 3 64
November 0 0 0 0 0 26 6 0 2 1 35
December 0 0 0 0 0 0 1 0 0 0 1
All 145 189 175 272 270 1051 141 188 173 272 270 1044
Table A8 Monthly distribution of begin and end of feed supplementation by regions (number of respondents)
Begin of Feed Supplementation by Region End of Feed Supplementation by Region
Month East Centre-East
Centre North West All East Centre-East
Centre North West All
January 14 1 27 0 1 43 0 0 2 105 0 107
February 6 0 1 6 0 13 68 59 50 91 140 408
March 32 86 32 0 0 150 20 30 87 38 26 201
April 0 0 0 0 0 0 21 3 4 1 1 30
May 1 0 0 9 0 10 1 0 0 0 0 1
June 1 4 0 2 1 8 1 0 0 0 1 2
July 0 0 0 0 0 0 0 1 0 1 0 2
August 0 2 1 0 1 4 0 1 0 0 0 1
September 22 12 36 19 23 112 1 21 2 12 1 37
October 17 25 27 42 15 126 0 19 2 2 0 23
November 10 6 14 167 129 326 0 4 3 2 1 10
December 9 1 13 9 4 36 0 0 0 2 4 6
All 112 137 151 254 174 828 112 138 150 254 174 828

178
Table A10 Monthly distribution of selli ng goats and best time for selling by regions(number of respondents)
Selling goats by regions Best time for selling by regions
Month East Centre-East
Centre North West All East Centre-East
Centre North West All
January 24 0 0 8 0 32 48 2 0 1 0 51
February 4 1 0 95 20 120 14 3 4 30 7 58
March 76 47 68 87 7 285 5 4 7 22 3 41
April 7 1 2 16 1 27 1 1 0 7 0 9
May 3 5 0 32 4 44 3 1 1 44 4 53
June 0 0 6 0 6 1 2 15 3 21
July 0 0 0 0 0 0 0 17 0 17
August 1 0 1 1 3 6 2 1 2 56 6 67
September 32 41 75 7 203 358 27 97 131 64 210 529
October 9 12 2 19 12 54 18 49 8 27 16 118
November 11 0 0 6 17 11 31 2 17 7 68
December 1 0 0 0 0 1 0 0 1 1 2
All 157 118 148 271 256 950 129 190 157 301 257 1034
Table A9 Monthly distribution of selling cattle and sheep by regions (number of respondents)
Selling Cattle by Regions Selling Sheep by Regions
Month East Centre-East
Centre North West All East Centre-East
Centre North West All
January 80 0 0 1 0 81 28 0 0 8 0 36
February 11 6 3 109 39 168 4 4 2 108 21 139
March 107 119 92 92 20 430 81 35 48 89 6 259
April 7 10 2 12 2 33 7 2 1 18 1 29
May 1 0 0 0 1 4 3 1 30 5 43
June 1 1 0 2 0 4 0 1 7 0 8
July 0 0 1 0 1 0 0 0 0 0
August 1 1 40 0 42 1 1 2 1 3 8
September 4 24 75 35 157 295 39 50 100 15 194 398
October 4 17 1 3 9 34 7 34 11 1 14 67
November 10 0 11 2 23 15 1 0 3 19
December 1 0 0 1 0 2 1 0 0 0 0 1
All 215 189 174 307 229 1114 172 144 167 277 247 1007
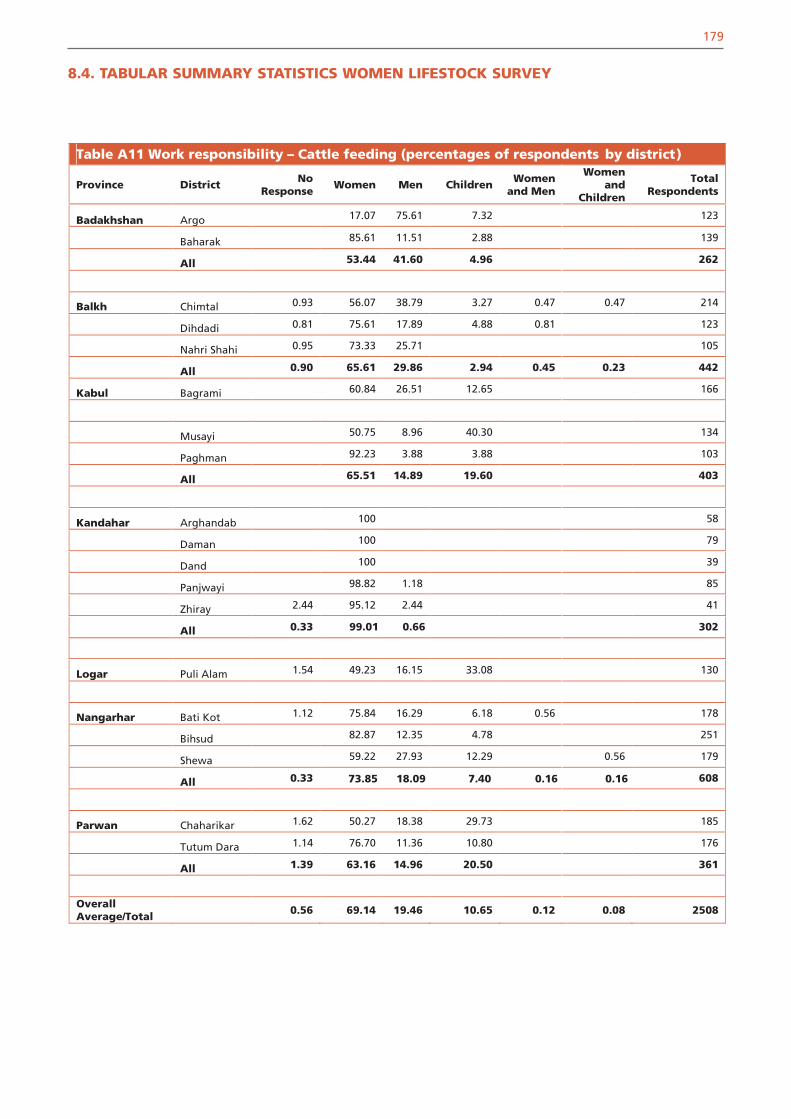
179
Table A11 Work responsibility – Cattle feeding (percentages of respondents by district)
Province District No Response
Women Men Children Womenand Men
Womenand
Children
Total Respondents
Badakhshan Argo 17.07 75.61 7.32 123
Baharak 85.61 11.51 2.88 139
All 53.44 41.60 4.96 262
Balkh Chimtal 0.93 56.07 38.79 3.27 0.47 0.47 214
Dihdadi 0.81 75.61 17.89 4.88 0.81 123
Nahri Shahi 0.95 73.33 25.71 105
All 0.90 65.61 29.86 2.94 0.45 0.23 442
Kabul Bagrami 60.84 26.51 12.65 166
Musayi 50.75 8.96 40.30 134
Paghman 92.23 3.88 3.88 103
All 65.51 14.89 19.60 403
Kandahar Arghandab 100 58
Daman 100 79
Dand 100 39
Panjwayi 98.82 1.18 85
Zhiray 2.44 95.12 2.44 41
All 0.33 302
Logar Puli Alam 1.54 49.23 16.15 33.08 130
Nangarhar Bati Kot 1.12 75.84 16.29 6.18 0.56 178
Bihsud 82.87 12.35 4.78 251
Shewa 59.22 27.93 12.29 0.56 179
All 0.33 608
Parwan Chaharikar 1.62 50.27 18.38 29.73 185
Tutum Dara 1.14 76.70 11.36 10.80 176
All 1.39 63.16 14.96 20.50 361
Overall Average/Total 0.56 69.14 19.46 10.65 0.12 0.08 2508
99.01 0.66
73.85 18.09 7.40 0.16 0.16
8.4. TABULAR SUMMARY STATISTICS WOMEN LIFESTOCK SURVEY
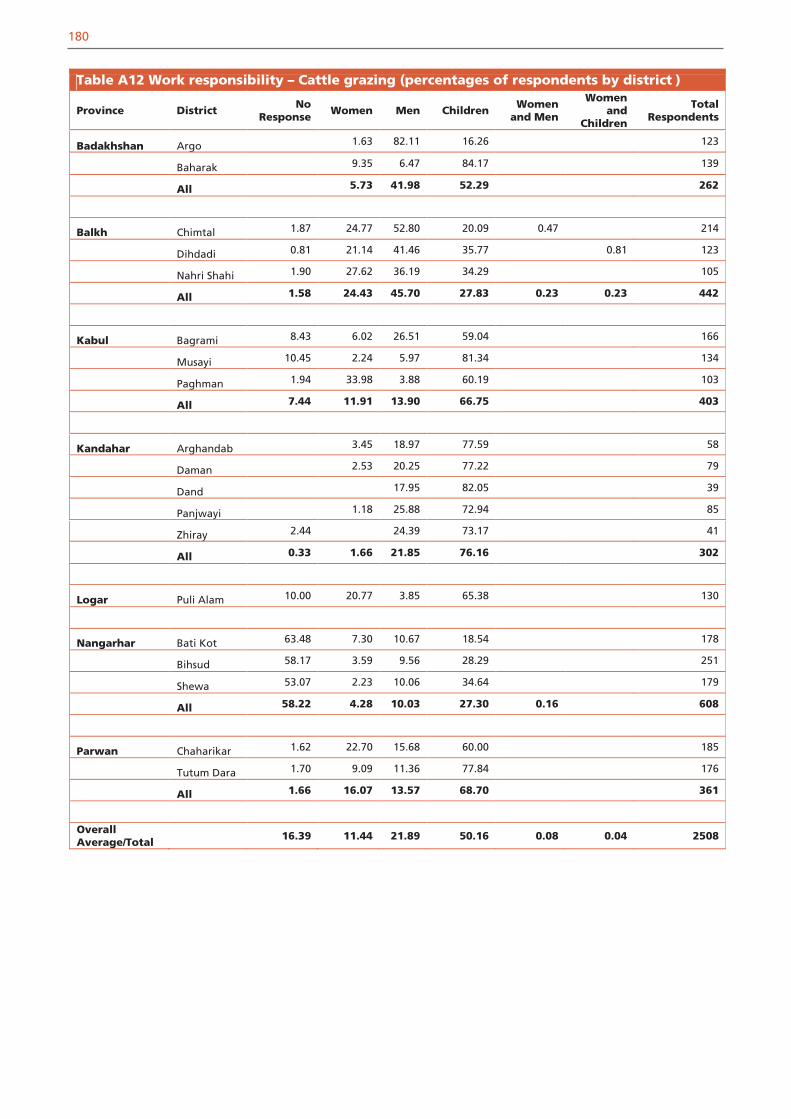
180
Table A12 Work responsibility – Cattle grazing (percentages of respondents by district )
Province District No Response
Women Men Children Women and Men
Womenand
Children
Total Respondents
Badakhshan Argo 1.63 82.11 16.26 123
Baharak 9.35 6.47 84.17 139
All 5.73 41.98 52.29 262
Balkh Chimtal 1.87 24.77 52.80 20.09 0.47 214
Dihdadi 0.81 21.14 41.46 35.77 0.81 123
Nahri Shahi 1.90 27.62 36.19 34.29 105
All 1.58 24.43 45.70 27.83 0.23 0.23 442
Kabul Bagrami 8.43 6.02 26.51 59.04 166
Musayi 10.45 2.24 5.97 81.34 134
Paghman 1.94 33.98 3.88 60.19 103
All 7.44 11.91 13.90 66.75 403
Kandahar Arghandab 3.45 18.97 77.59 58
Daman 2.53 20.25 77.22 79
Dand 17.95 82.05 39
Panjwayi 1.18 25.88 72.94 85
Zhiray 2.44 24.39 73.17 41
All 0.33 1.66 21.85 76.16 302
Logar Puli Alam 10.00 20.77 3.85 65.38 130
Nangarhar Bati Kot 63.48 7.30 10.67 18.54 178
Bihsud 58.17 3.59 9.56 28.29 251
Shewa 53.07 2.23 10.06 34.64 179
All 58.22 4.28 10.03 27.30 0.16 608
Parwan Chaharikar 1.62 22.70 15.68 60.00 185
Tutum Dara 1.70 9.09 11.36 77.84 176
All 1.66 16.07 13.57 68.70 361
Overall Average/Total 16.39 11.44 21.89 50.16 0.08 0.04 2508

181
Table A13 Work responsibility – Watering cattle (percentages of respondents by district )
Province District No Response
Women Men Children Womenand Men
Womenand
Children
Total Respondents
Badakhshan Argo 4.07 80.49 15.45 123
Baharak 47.48 4.32 48.20 139
All 27.10 40.08 32.82 262
Balkh Chimtal 0.93 57.01 38.32 2.80 0.93 214
Dihdadi 0.81 76.42 17.07 5.69 123
Nahri Shahi 0.95 71.43 26.67 0.95 105
All 0.90 65.84 29.64 3.17 0.45 442
Kabul Bagrami 0.60 54.82 22.89 21.69 166
Musayi 44.03 8.96 47.01 134
Paghman 76.70 3.88 19.42 103
All 0.25 56.82 13.40 29.53 403
Kandahar Arghandab 91.38 8.62 58
Daman 1.27 91.14 7.59 79
Dand 87.18 7.69 5.13 39
Panjwayi 87.06 5.88 7.06 85
Zhiray 4.88 85.37 4.88 4.88 41
All 0.99 88.74 5.30 4.97 302
Logar Puli Alam 0.77 41.54 6.92 50.77 130
Nangarhar Bati Kot 1.12 82.02 9.55 6.74 0.56 178
Bihsud 0.80 80.48 10.36 7.97 0.40 251
Shewa 61.45 25.70 12.85 179
All 0.66 75.33 14.64 9.05 0.16 0.16 608
Parwan Chaharikar 1.62 49.73 15.14 33.51 185
Tutum Dara 1.14 71.02 9.66 18.18 176
All 1.39 60.11 12.47 26.04
361
Overall Average/Total 0.72 63.32 17.90 17.90 0.12 0.04 2508
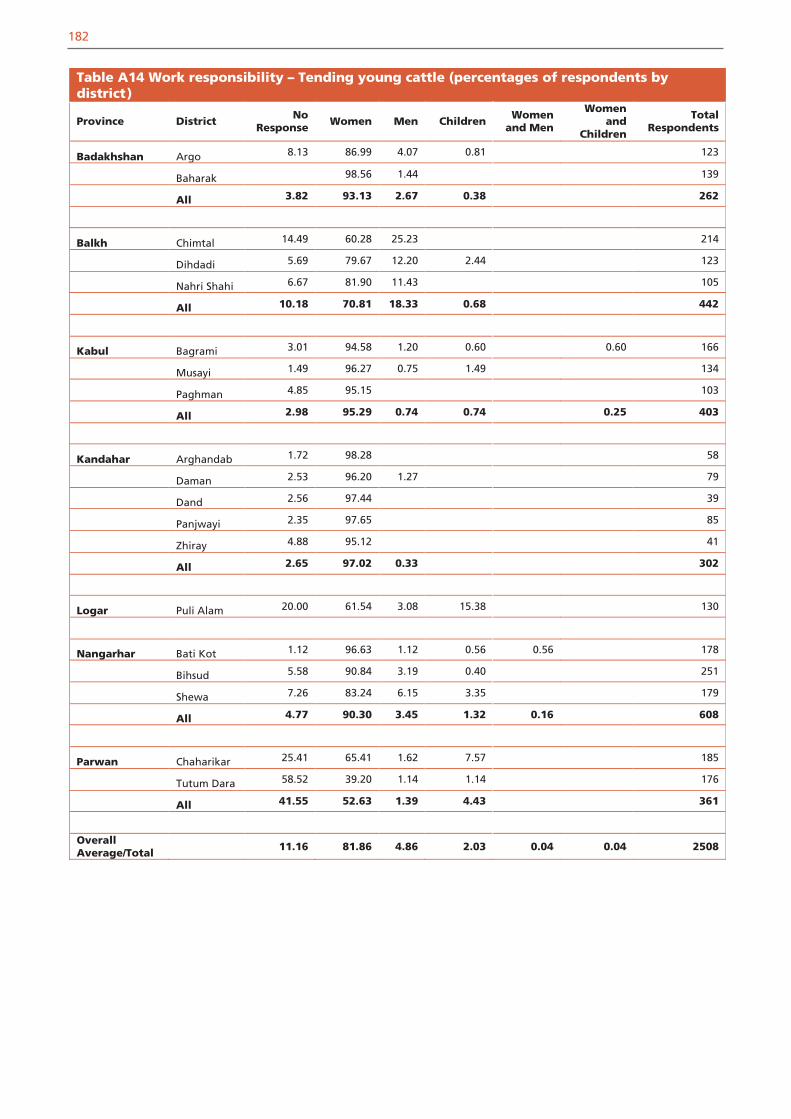
182
Table A14 Work responsibility – Tending young cattle (percentages of respondents by district)
Province DistrictNo
ResponseWomen Men Children
Womenand Men
Womenand
Children
Total Respondents
Badakhshan Argo 8.13 86.99 4.07 0.81 123
Baharak 98.56 1.44 139
All 3.82 93.13 2.67 0.38 262
Balkh Chimtal 14.49 60.28 25.23 214
Dihdadi 5.69 79.67 12.20 2.44 123
Nahri Shahi 6.67 81.90 11.43 105
All 10.18 70.81 18.33 0.68 442
Kabul Bagrami 3.01 94.58 1.20 0.60 0.60 166
Musayi 1.49 96.27 0.75 1.49 134
Paghman 4.85 95.15 103
All 2.98 95.29 0.74 0.74 0.25 403
Kandahar Arghandab 1.72 98.28 58
Daman 2.53 96.20 1.27 79
Dand 2.56 97.44 39
Panjwayi 2.35 97.65 85
Zhiray 4.88 95.12 41
All 2.65 97.02 0.33 302
Logar Puli Alam 20.00 61.54 3.08 15.38 130
Nangarhar Bati Kot 1.12 96.63 1.12 0.56 0.56 178
Bihsud 5.58 90.84 3.19 0.40 251
Shewa 7.26 83.24 6.15 3.35 179
All 4.77 90.30 3.45 1.32 0.16 608
Parwan Chaharikar 25.41 65.41 1.62 7.57 185
Tutum Dara 58.52 39.20 1.14 1.14 176
All 41.55 52.63 1.39 4.43 361
Overall Average/Total
11.16 81.86 4.86 2.03 0.04 0.04 2508

183
Table A15 Work responsibility – Milking cattle (percentages of respondents by district )
Province District No Response Women Men Children Womenand Men
Total Respondents
Badakhshan Argo 7.32 91.87 0.81 123
Baharak 98.56 1.44 139
All 3.44 95.42 1.15 262
Balkh Chimtal 16.82 71.50 11.68 214
Dihdadi 8.94 87.80 2.44 0.81 123
Nahri Shahi 7.62 90.48 1.90 105
All 12.44 80.54 6.79 0.23 442
Kabul Bagrami 6.63 92.77 0.60 166
Musayi 0.75 99.25 134
Paghman 9.71 90.29 103
All 5.46 94.29 0.25 403
Kandahar Arghandab 10.34 89.66 58
Daman 10.13 89.87 79
Dand 17.95 82.05 39
Panjwayi 17.65 82.35 85
Zhiray 9.76 90.24 41
All 13.25 86.75 302
Logar Puli Alam 11.54 86.92 0.77 0.77 130
Nangarhar Bati Kot 2.81 97.19 178
Bihsud 6.37 88.45 4.78 0.40 251
Shewa 10.61 89.39 179
All 6.58 91.28 1.97 0.16 608
Parwan Chaharikar 21.62 78.38 185
Tutum Dara 72.16 27.84 176
All 46.26 53.74 361
Overall Average/Total 13.88 84.13 1.87 0.04 0.08 2508

184
Table A16 Work responsibility – Treating cattle (percentages of respondents by district )
Province District No Response
Women Men Children Women and Men
Men and Children
Total Respondents
Badakhshan Argo 19.51 78.86 1.63 123
Baharak 25.90 73.38 0.72 139
All 22.90 75.95 1.15 262
Balkh Chimtal 1.40 10.28 87.85 0.47 214
Dihdadi 0.81 8.94 87.80 1.63 0.81 123
Nahri Shahi 0.95 14.29 83.81 0.95 105
All 1.13 10.86 86.88 0.68 0.45 442
Kabul Bagrami 14.46 81.93 3.61 166
Musayi 0.75 9.70 88.06 1.49 134
Paghman 0.97 7.77 91.26 103
All 0.50 11.17 86.35 1.99 403
Kandahar Arghandab 1.72 91.38 6.90 58
Daman 88.61 11.39 79
Dand 92.31 7.69 39
Panjwayi 84.71 15.29 85
Zhiray 2.44 87.80 9.76 41
All 0.66 88.41 10.93 302
Logar Puli Alam 3.08 36.92 60.00 130
Nangarhar Bati Kot 2.81 6.74 89.89 0.56 178
Bihsud 0.80 5.18 92.83 0.80 0.40 251
Shewa 0.56 1.68 95.53 2.23 179
All 1.32 4.61 92.76 1.15 0.16 608
Parwan Chaharikar 1.62 12.43 77.30 8.11 0.54 185
Tutum Dara 1.14 28.98 67.05 2.27 0.57 176
All 1.39 20.50 72.30 5.26 0.28 0.28 361
Overall Average/Total 1.04 22.73 74.44 1.59 0.16 0.04 2508

185
Table A17 Work responsibility – Feeding sheep (percentages of respondents by district )
Province DistrictNo
Response Women Men ChildrenWomen
and Men
Womenand
Children
Menand
Children
Total Respondents
Badakhshan Argo 9.82 83.93 6.25 112
Baharak 87.88 10.61 1.52 66
All 38.76 56.74 4.49 178
Balkh Chimtal 4.35 32.17 59.13 4.35 115
Dihdadi 20.59 52.94 23.53 2.94 34
Nahri Shahi 9.68 48.39 38.71 3.23 31
All 8.33 38.89 48.89 3.89 180
Kabul Bagrami 48.39 25.81 25.81 31
Musayi 4.35 21.74 8.70 60.87 4.35 23
Paghman 82.98 8.51 8.51 47
All 0.99 58.42 13.86 25.74 0.99 101
Kandahar Arghandab 95.83 4.17 48
Daman 1.67 93.33 3.33 1.67 60
Dand 100.00 31
Panjwayi 96.05 1.32 2.63 76
Zhiray 86.21 6.90 3.45 3.45 29
All 0.41 94.67 1.23 2.87 0.41 0.41 244
Logar Puli Alam 41.67 11.67 46.67 60
Nangarhar Bati Kot 13.33 46.67 13.33 20.00 6.67 15
Bihsud 11.11 77.78 11.11 9
Shewa 56.52 26.09 17.39 23
All 6.38 57.45 19.15 14.89 2.13 47
Parwan Chaharikar 14.29 35.71 28.57 21.43 14
Tutum Dara 8.11 75.68 8.11 8.11 37
All 9.80 64.71 13.73 11.76 51
Overall Average/Total
2.90 59.70 26.60 10.34 0.23 0.12 0.12 861

186
Table A18 Work responsibility – Grazing sheep (percentages of respondents by district)
Province DistrictNo
ResponseWomen Men Children
Men and Children
Total Respondents
Badakhshan Argo 0.89 86.61 12.50 112
Baharak 6.06 7.58 86.36 66
All 2.81 57.30 39.89 178
Balkh Chimtal 4.35 16.52 68.70 9.57 0.87 115
Dihdadi 20.59 17.65 32.35 29.41 34
Nahri Shahi 16.13 19.35 38.71 25.81 31
All 9.44 17.22 56.67 16.11 0.56 180
Kabul Bagrami 6.45 29.03 64.52 31
Musayi 17.39 4.35 13.04 65.22 23
Paghman 2.13 31.91 12.77 53.19 47
All 6.93 15.84 17.82 59.41 101
Kandahar Arghandab 2.08 8.33 89.58 48
Daman 1.67 1.67 16.67 80.00 60
Dand 0.00 12.90 87.10 31
Panjwayi 1.32 23.68 75.00 76
Zhiray 6.90 10.34 82.76 29
All 1.64 0.82 15.98 81.56 244
Logar Puli Alam 3.33 13.33 5.00 78.33 60
Nangarhar Bati Kot 40.00 6.67 53.33 15
Bihsud 66.67 33.33 9
Shewa 65.22 8.70 26.09 23
All 57.45 6.38 36.17 47
Parwan Chaharikar 14.29 7.14 35.71 42.86 14
Tutum Dara 8.11 8.11 13.51 70.27 37
All 9.80 7.84 19.61 62.75 51
Overall Average/Total
7.20 7.67 32.17 52.85 0.12 861

187
Table A19 Work responsibility – Watering sheep(percentages of respondents by district )
Province District No Response Women Men Children Total Respondents
Badakhshan Argo 1.79 86.61 11.61 112
Baharak 40.91 7.58 51.52 66
All 16.29 57.30 26.40 178
Balkh Chimtal 5.22 32.17 58.26 4.35 115
Dihdadi 20.59 50.00 23.53 5.88 34
Nahri Shahi 12.90 45.16 38.71 3.23 31
All 9.44 37.78 48.33 4.44 180
Kabul Bagrami 48.39 25.81 25.81 31
Musayi 4.35 13.04 13.04 69.57 23
Paghman 68.09 6.38 25.53 47
All 0.99 49.50 13.86 35.64 101
Kandahar Arghandab 87.50 12.50 48
Daman 1.67 91.67 3.33 3.33 60
Dand 93.55 3.23 3.23 31
Panjwayi 85.53 3.95 10.53 76
Zhiray 86.21 0.00 13.79 29
All 0.41 88.52 2.46 8.61 244
Logar Puli Alam 30.00 6.67 63.33 60
Nangarhar Bati Kot 13.33 53.33 6.67 26.67 15
Bihsud 11.11 77.78 11.11 9
Shewa 56.52 21.74 21.74 23
All 6.38 59.57 14.89 19.15 47
Parwan Chaharikar 14.29 35.71 28.57 21.43 14
Tutum Dara 8.11 72.97 8.11 10.81 37
All 9.80 62.75 13.73 13.73 51
Overall Average/Total
3.14 51.22 26.36 19.28 861

188
Table A20 Work responsibility – Tending young sheep(percentages of respondents by district )
Province District No Response Women Men Children Women and
ChildrenTotal
Respondents
Badakhshan Argo 0.89 27.68 51.79 19.64 112
Baharak 96.97 3.03 66
All 0.56 53.37 33.71 12.36 178
Balkh Chimtal 6.09 40.87 52.17 0.87 115
Dihdadi 20.59 55.88 20.59 2.94 34
Nahri Shahi 12.90 58.06 25.81 3.23 31
All 10.00 46.67 41.67 1.67 180
Kabul Bagrami 96.77 3.23 31
Musayi 8.70 91.30 23
Paghman 42.55 53.19 2.13 2.13 47
All 21.78 75.25 0.99 0.99 0.99 101
Kandahar Arghandab 27.08 72.92 48
Daman 23.33 71.67 5.00 60
Dand 35.48 64.52 31
Panjwayi 23.68 76.32 76
Zhiray 31.03 68.97 29
All 26.64 72.13 1.23 244
Logar Puli Alam 28.33 48.33 1.67 21.67 60
Nangarhar Bati Kot 46.67 53.33 15
Bihsud 33.33 66.67 9
Shewa 26.09 69.57 4.35 23
All 34.04 63.83 2.13 47
Parwan Chaharikar 50.00 42.86 7.14 14
Tutum Dara 78.38 21.62 37
All 70.59 27.45 1.96 51
Overall Average/Total
20.33 58.54 16.49 4.53 0.12 861

189
Table A21 Work responsibility – Milking sheep (Percentages of Respondents by District)
Province DistrictNo
ResponseWomen Men Children Women
and MenTotal
Respondents
Badakhshan Argo 0.89 97.32 1.79 112
Baharak 96.97 3.03 66
All 0.56 97.19 2.25 178
Balkh Chimtal 22.61 53.91 23.48 115
Dihdadi 26.47 58.82 8.82 5.88 34
Nahri Shahi 16.13 61.29 19.35 3.23 31
All 22.22 56.11 20.00 0.56 1.11 180
Kabul Bagrami 6.45 93.55 31
Musayi 8.70 91.30 23
Paghman 36.17 61.70 2.13 47
All 20.79 78.22 0.99 101
Kandahar Arghandab 75.00 25.00 48
Daman 76.67 21.67 1.67 60
Dand 77.42 22.58 31
Panjwayi 69.74 30.26 76
Zhiray 68.97 31.03 29
All 73.36 26.23 0.41 244
Logar Puli Alam 28.33 71.67 60
Nangarhar Bati Kot 73.33 26.67 15
Bihsud 44.44 55.56 9
Shewa 52.17 47.83 23
All 57.45 42.55 47
Parwan Chaharikar 50.00 50.00 14
Tutum Dara 78.38 21.62 37
All 70.59 29.41 51
Overall Average/Total 37.28 57.49 4.88 0.12 0.23 861

190
Table A22 Work responsibility – Treating sheep (percentages of respondents by district)
Province District No Response Women Men Children Total
Respondents
Badakhshan Argo 22.32 76.79 0.89 112
Baharak 1.52 19.70 78.79 66
All 0.56 21.35 77.53 0.56 178
Balkh Chimtal 4.35 10.43 85.22 115
Dihdadi 26.47 5.88 67.65 34
Nahri Shahi 12.90 16.13 67.74 3.23 31
All 10.00 10.56 78.89 0.56 180
Kabul Bagrami 25.81 67.74 6.45 31
Musayi 4.35 4.35 86.96 4.35 23
Paghman 14.89 82.98 2.13 47
All 0.99 15.84 79.21 3.96 101
Kandahar Arghandab 93.75 6.25 48
Daman 1.67 86.67 11.67 60
Dand 90.32 9.68 31
Panjwayi 88.16 11.84 76
Zhiray 3.45 79.31 17.24 29
All 0.82 88.11 11.07 244
Logar Puli Alam 3.33 33.33 63.33 60
Nangarhar Bati Kot 13.33 6.67 73.33 6.67 15
Bihsud 11.11 88.89 9
Shewa 4.35 4.35 86.96 4.35 23
All 8.51 4.26 82.98 4.26 47
Parwan Chaharikar 14.29 7.14 71.43 7.14 14
Tutum Dara 8.11 48.65 43.24 37
All 9.80 37.25 50.98 1.96 51
OverallAverage/Total
3.83 38.21 56.91 1.05 861
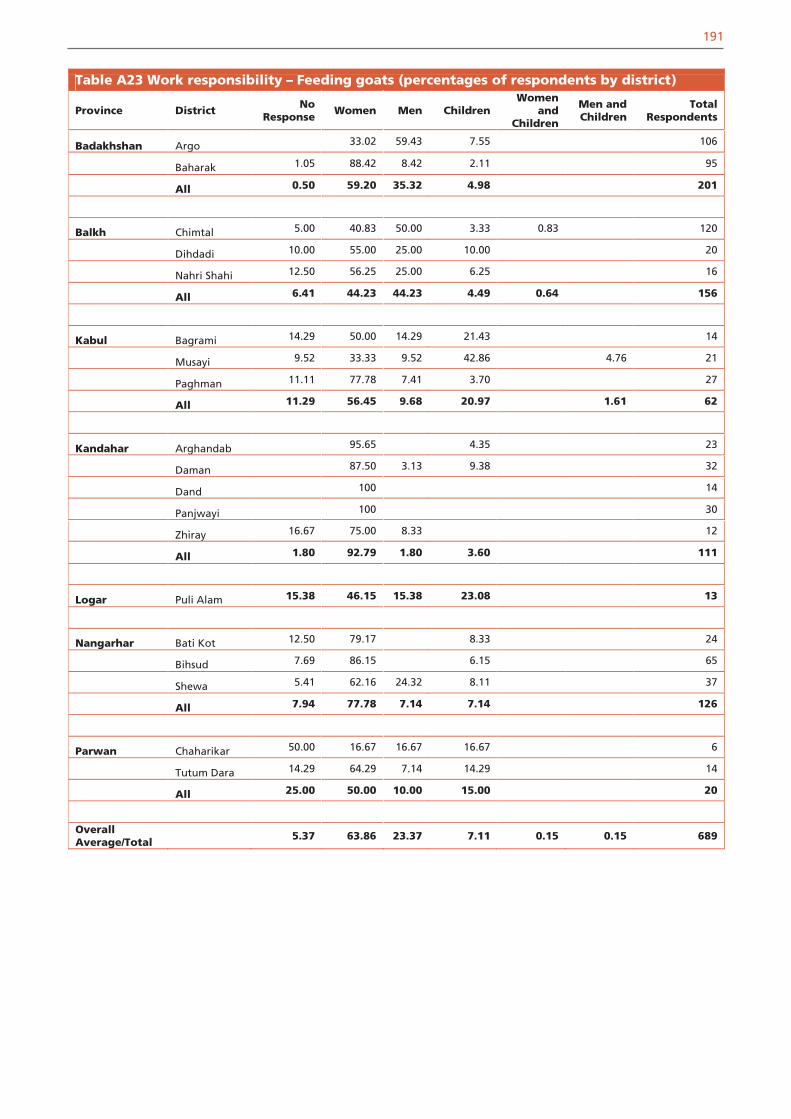
191
Table A23 Work responsibility – Feeding goats (percentages of respondents by district)
Province District No Response
Women Men ChildrenWomen
and Children
Men and Children
Total Respondents
Badakhshan Argo 33.02 59.43 7.55 106
Baharak 1.05 88.42 8.42 2.11 95
All 0.50 59.20 35.32 4.98 201
Balkh Chimtal 5.00 40.83 50.00 3.33 0.83 120
Dihdadi 10.00 55.00 25.00 10.00 20
Nahri Shahi 12.50 56.25 25.00 6.25 16
All 6.41 44.23 44.23 4.49 0.64 156
Kabul Bagrami 14.29 50.00 14.29 21.43 14
Musayi 9.52 33.33 9.52 42.86 4.76 21
Paghman 11.11 77.78 7.41 3.70 27
All 11.29 56.45 9.68 20.97 1.61 62
Kandahar Arghandab 95.65 4.35 23
Daman 87.50 3.13 9.38 32
Dand 100 14
Panjwayi 100 30
Zhiray 16.67 75.00 8.33 12
All 1.80 92.79 1.80 3.60 111
Logar Puli Alam 15.38 46.15 15.38 23.08 13
Nangarhar Bati Kot 12.50 79.17 8.33 24
Bihsud 7.69 86.15 6.15 65
Shewa 5.41 62.16 24.32 8.11 37
All 7.94 77.78 7.14 7.14 126
Parwan Chaharikar 50.00 16.67 16.67 16.67 6
Tutum Dara 14.29 64.29 7.14 14.29 14
All 25.00 50.00 10.00 15.00 20
Overall Average/Total 5.37 63.86 23.37 7.11 0.15 0.15 689

192
Table A24 Work responsibility – Grazing goats (percentages of respondents by district)
Province District No Response
Women Men Children Men and Children
Total Respondents
Badakhshan Argo 5.66 67.92 26.42 106
Baharak 1.05 6.32 7.37 85.26 95
All 0.50 5.97 39.30 54.23 201
Balkh Chimtal 5.00 23.33 60.83 10.83 120
Dihdadi 10.00 25.00 40.00 25.00 20
Nahri Shahi 12.50 25.00 31.25 31.25 16
All 6.41 23.72 55.13 14.74 156
Kabul Bagrami 14.29 7.14 7.14 71.43 14
Musayi 14.29 9.52 9.52 66.67 21
Paghman 11.11 29.63 11.11 48.15 27
All 12.90 17.74 9.68 59.68 62
Kandahar Arghandab 8.70 91.30 23
Daman 6.25 6.25 87.50 32
Dand 7.14 7.14 85.71 14
Panjwayi 3.33 6.67 90.00 30
Zhiray 16.67 8.33 75.00 12
All 2.70 2.70 7.21 87.39 111
Logar Puli Alam 15.38 30.77 7.69 46.15 13
Nangarhar Bati Kot 58.33 8.33 4.17 29.17 24
Bihsud 60.00 1.54 4.62 33.85 65
Shewa 62.16 5.41 5.41 24.32 2.70 37
All 60.32 3.97 4.76 30.16 0.79 126
Parwan Chaharikar 50.00 16.67 16.67 16.67 6
Tutum Dara 14.29 7.14 28.57 50.00 14
All 25.00 10.00 25.00 40.00 20
Overall Average/Total 15.24 10.74 27.72 46.15 0.15 689

193
Table A25 Work responsibility – Watering goats (percentages of respondents by district )
Province District No Response
Women Men Children Men and Children
Total Respondents
Badakhshan Argo 5.66 68.87 25.47 106
Baharak 1.05 45.26 6.32 47.37 95
All 0.50 24.38 39.30 35.82 201
Balkh Chimtal 5.00 42.50 49.17 3.33 120
Dihdadi 10.00 50.00 25.00 15.00 20
Nahri Shahi 12.50 56.25 25.00 6.25 16
All 6.41 44.87 43.59 5.13 156
Kabul Bagrami 14.29 64.29 7.14 14.29 14
Musayi 9.52 38.10 14.29 38.10 21
Paghman 11.11 70.37 7.41 11.11 27
All 11.29 58.06 9.68 20.97 62
Kandahar Arghandab 82.61 17.39 23
Daman 84.38 3.13 12.50 32
Dand 100 14
Panjwayi 93.33 6.67 30
Zhiray 16.67 58.33 8.33 16.67 12
All 1.80 85.59 1.80 10.81 111
Logar Puli Alam 15.38 38.46 7.69 38.46 13
Nangarhar Bati Kot 12.50 70.83 16.67 24
Bihsud 7.69 80.00 12.31 65
Shewa 5.41 64.86 16.22 10.81 2.70 37
All 7.94 73.81 4.76 12.70 0.79 126
Parwan Chaharikar 50.00 16.67 16.67 16.67 6
Tutum Dara 14.29 57.14 7.14 21.43 14
All 25.00 45.00 10.00 20.00 20
Overall Average/Total 5.37 51.81 23.80 18.87 0.15 689

194
Table A26 Work responsibility – Tending young goats(percentages of respondents by district )
Province District No Response Women Men Children Total Respondents
Badakhshan Argo 51.89 23.58 24.53 106
Baharak 1.05 95.79 3.16 95
All 0.50 72.64 13.93 12.94 201
Balkh Chimtal 8.33 47.50 43.33 0.83 120
Dihdadi 15.00 55.00 25.00 5.00 20
Nahri Shahi 18.75 68.75 12.50 16
All 10.26 50.64 37.82 1.28 156
Kabul Bagrami 14.29 85.71 14
Musayi 9.52 90.48 21
Paghman 14.81 77.78 7.41 27
All 12.90 83.87 3.23 62
Kandahar Arghandab 95.65 4.35 23
Daman 3.13 90.63 6.25 32
Dand 21.43 78.57 14
Panjwayi 13.33 86.67 30
Zhiray 16.67 83.33 12
All 9.01 88.29 1.80 0.90 111
Logar Puli Alam 30.77 53.85 7.69 7.69 13
Nangarhar Bati Kot 20.83 75.00 4.17 24
Bihsud 24.62 73.85 1.54 65
Shewa 13.51 83.78 2.70 37
All 20.63 76.98 0.79 1.59 126
Parwan Chaharikar 50.00 50.00 6
Tutum Dara 64.29 35.71 14
All 60.00 40.00 20
Overall Average/Total
11.18 70.68 13.50 4.64 689

195
Table A27 Work responsibility – Milking goats(percentages of respond ents by district)
Province District No Response Women Men Children Total Respondents
Badakhshan Argo 99.06 0.94 106
Baharak 1.05 96.84 2.11 95
All 0.50 98.01 1.49 201
Balkh Chimtal 24.17 54.17 21.67 120
Dihdadi 30.00 70.00 20
Nahri Shahi 25.00 56.25 18.75 16
All 25.00 56.41 18.59 156
Kabul Bagrami 14.29 85.71 14
Musayi 9.52 90.48 21
Paghman 11.11 88.89 27
All 11.29 88.71 62
Kandahar Arghandab 100 23
Daman 9.38 87.50 3.13 32
Dand 21.43 78.57 14
Panjwayi 16.67 83.33 30
Zhiray 16.67 83.33 12
All 11.71 87.39 0.90 111
Logar Puli Alam 46.15 53.85 13
Nangarhar Bati Kot 33.33 66.67 24
Bihsud 32.31 66.15 1.54 65
Shewa 27.03 70.27 2.70 37
All 30.95 67.46 0.79 0.79 126
Parwan Chaharikar 50.00 50.00 6
Tutum Dara 64.29 35.71 14
All 60.00 40.00 20
Overall Average/Total
16.98 77.94 4.93 0.15 689

196
Table A28 Work responsibility – Treating goats (percentages of respondents by district)
Province District No Response Women Men Children Women
and Men
Womenand
Children
Total Respondents
Badakhshan Argo 59.43 40.57 106
Baharak 1.05 24.21 74.74 95
All 0.50 42.79 56.72 201
Balkh Chimtal 5.83 15.83 76.67 1.67 120
Dihdadi 10.00 15.00 70.00 5.00 20
Nahri Shahi 12.50 25.00 62.50 16
All 7.05 16.67 74.36 1.28 0.64 156
Kabul Bagrami 14.29 14.29 64.29 7.14 14
Musayi 9.52 19.05 71.43 21
Paghman 11.11 14.81 74.07 27
All 11.29 16.13 70.97 1.61 62
Kandahar Arghandab 95.65 4.35 23
Daman 96.88 3.13 32
Dand 85.71 14.29 14
Panjwayi 86.67 13.33 30
Zhiray 16.67 75.00 8.33 12
All 1.80 90.09 8.11 111
Logar Puli Alam 15.38 46.15 38.46 13
Nangarhar Bati Kot 12.50 8.33 79.17 24
Bihsud 9.23 90.77 65
Shewa 10.81 81.08 8.11 37
All 10.32 1.59 85.71 2.38 126
Parwan Chaharikar 50.00 50.00 6
Tutum Dara 14.29 21.43 64.29 14
All 25.00 15.00 60.00 20
Overall Average/Total
5.95 33.82 59.22 0.58 0.29 0.15 689

197
Table A29 Decision making cattle – Purchasing animals(percentages of respondents by district )
Province DistrictNo
Response Women MenWomen and
MenTotal
Respondents
Badakhshan Argo 83.74 16.26 123
Baharak 17.27 82.73 139
All 48.47 51.53 262
Balkh Chimtal 2.80 5.61 91.59 214
Dihdadi 0.81 5.69 92.68 0.81 123
Nahri Shahi 1.90 6.67 91.43 105
All 2.04 5.88 91.86 0.23 442
Kabul Bagrami 60.24 39.76 166
Musayi 0.75 20.90 78.36 134
Paghman 76.70 23.30 103
All 0.25 51.36 48.39 403
Kandahar Arghandab 1.72 20.69 77.59 58
Daman 22.78 77.22 79
Dand 20.51 79.49 39
Panjwayi 23.53 76.47 85
Zhiray 2.44 24.39 73.17 41
All 0.66 22.52 76.82 302
Logar Puli Alam 1.54 48.46 50.00 130
Nangarhar Bati Kot 33.71 66.29 178
Bihsud 34.66 65.34 251
Shewa 0.56 20.67 78.77 179
All 0.16 30.26 69.57 608
Parwan Chaharikar 1.08 37.84 61.08 185
Tutum Dara 56.25 43.75 176
All 0.55 46.81 52.63 361
Overall Average/Total 0.68 33.65 65.63 0.04 2508

198
Table A30 Decision making cattle – Purchasing feed(percentages of respondents by district)
Province District No Response Women Men Women and
MenTotal
Respondents
Badakhshan Argo 57.72 42.28 123
Baharak 10.79 89.21 139
All 32.82 67.18 262
Balkh Chimtal 2.80 5.14 92.06 214
Dihdadi 0.81 5.69 92.68 0.81 123
Nahri Shahi 1.90 7.62 90.48 105
All 2.04 5.88 91.86 0.23 442
Kabul Bagrami 46.39 53.61 166
Musayi 0.75 19.40 79.85 134
Paghman 80.58 19.42 103
All 0.25 46.15 53.60 403
Kandahar Arghandab 1.72 17.24 81.03 58
Daman 15.19 84.81 79
Dand 12.82 87.18 39
Panjwayi 11.76 88.24 85
Zhiray 2.44 24.39 73.17 41
All 0.66 15.56 83.77 302
Logar Puli Alam 0.77 49.23 50.00 130
Nangarhar Bati Kot 29.78 70.22 178
Bihsud 27.09 72.91 251
Shewa 0.56 15.64 83.80 179
All 0.16 24.51 75.33 608
Parwan Chaharikar 1.08 37.30 61.62 185
Tutum Dara 56.25 43.75 176
All 0.55 46.54 52.91 361
Overall Average/Total
0.64 28.95 70.37 0.04 2508

199
Table A31 Decision making cattle – Selling animals(percentages of respondents by district)
Province District No Response Women MenTotal
Respondents
Badakhshan Argo 70.73 29.27 123
Baharak 74.82 25.18 139
All 72.90 27.10 262
Balkh Chimtal 2.80 5.14 92.06 214
Dihdadi 0.81 4.88 94.31 123
Nahri Shahi 1.90 6.67 91.43 105
All 2.04 5.43 92.53 442
Kabul Bagrami 40.96 59.04 166
Musayi 1.49 17.16 81.34 134
Paghman 0.97 74.76 24.27 103
All 0.74 41.69 57.57 403
Kandahar Arghandab 1.72 37.93 60.34 58
Daman 49.37 50.63 79
Dand 58.97 41.03 39
Panjwayi 44.71 55.29 85
Zhiray 2.44 58.54 39.02 41
All 0.66 48.34 50.99 302
Logar Puli Alam 50.00 50.00 130
Nangarhar Bati Kot 34.83 65.17 178
Bihsud 32.67 67.33 251
Shewa 0.56 22.35 77.09 179
All 0.16 30.26 69.57 608
Parwan Chaharikar 1.08 36.76 62.16 185
Tutum Dara 1.14 55.11 43.75 176
All 1.11 45.71 53.19 361
Overall Average/Total 0.76 37.60 61.64 2508

200
Table A32 Decision making cattle – Selling milk (percentages of respondents by district )
Province District No Response Women MenWomen and
MenTotal
Respondents
Badakhshan Argo 97.56 2.44 123
Baharak 99.28 0.72 139
All 98.47 1.53 262
Balkh Chimtal 14.49 14.49 71.03 214
Dihdadi 4.88 29.27 65.85 123
Nahri Shahi 4.76 24.76 69.52 0.95 105
All 9.50 21.04 69.23 0.23 442
Kabul Bagrami 6.63 91.57 1.81 166
Musayi 2.99 83.58 13.43 134
Paghman 19.42 80.58 103
All 8.68 86.10 5.21 403
Kandahar Arghandab 43.10 41.38 15.52 58
Daman 51.90 39.24 8.86 79
Dand 53.85 41.03 5.13 39
Panjwayi 47.06 38.82 14.12 85
Zhiray 31.71 58.54 9.76 41
All 46.36 42.38 11.26 302
Logar Puli Alam 66.92 30.00 3.08 130
Nangarhar Bati Kot 34.83 58.43 6.74 178
Bihsud 43.03 42.63 14.34 251
Shewa 45.25 31.84 22.91 179
All 41.28 44.08 14.64 608
Parwan Chaharikar 16.76 73.51 9.73 185
Tutum Dara 74.43 24.43 1.14 176
All 44.88 49.58 5.54 361
Overall Average/Total 28.59 52.31 19.06 0.04 2508

201
Table A33 Decision making cattle – Treating animals ( percentages of respondents by district)
Province District No Response Women Men Children Women
and MenTotal
Respondents
Badakhshan Argo 62.60 37.40 123
Baharak 24.46 75.54 139
All 42.37 57.63 262
Balkh Chimtal 3.27 5.14 91.59 214
Dihdadi 0.81 6.50 92.68 123
Nahri Shahi 1.90 6.67 91.43 105
All 2.26 5.88 91.86 442
Kabul Bagrami 24.10 75.90 166
Musayi 2.24 11.94 85.82 134
Paghman 89.32 10.68 103
All 0.74 36.72 62.53 403
Kandahar Arghandab 3.45 87.93 8.62 58
Daman 89.87 10.13 79
Dand 87.18 12.82 39
Panjwayi 85.88 14.12 85
Zhiray 2.44 85.37 12.20 41
All 0.99 87.42 11.59 302
Logar Puli Alam 0.77 58.46 40.77 130
Nangarhar Bati Kot 1.12 28.65 69.10 1.12 178
Bihsud 1.99 25.50 72.51 251
Shewa 1.68 13.41 84.92 179
All 1.64 22.86 75.16 0.33 608
Parwan Chaharikar 0.54 17.84 81.08 0.54 185
Tutum Dara 0.57 32.95 66.48 176
All 0.55 25.21 73.96 0.28 361
Overall Average/Total
1.16 34.09 64.63 0.04 0.08 2508

202
Table A34 Decision making sheep – Purchasing animals(percentages of respondents by district)
Province District No Response Women Men Total Respondents
Badakhshan Argo 73.21 26.79 112
Baharak 12.12 87.88 66
All 50.56 49.44 178
Balkh Chimtal 4.35 2.61 93.04 115
Dihdadi 11.76 8.82 79.41 34
Nahri Shahi 16.13 9.68 74.19 31
All 7.78 5.00 87.22 180
Kabul Bagrami 41.94 58.06 31
Musayi 4.35 17.39 78.26 23
Paghman 74.47 25.53 47
All 0.99 51.49 47.52 101
Kandahar Arghandab 2.08 12.50 85.42 48
Daman 1.67 16.67 81.67 60
Dand 12.90 87.10 31
Panjwayi 9.21 90.79 76
Zhiray 13.79 86.21 29
All 0.82 12.70 86.48 244
Logar Puli Alam 1.67 43.33 55.00 60
Nangarhar Bati Kot 13.33 13.33 73.33 15
Bihsud 11.11 11.11 77.78 9
Shewa 39.13 60.87 23
All 6.38 25.53 68.09 47
Parwan Chaharikar 7.14 21.43 71.43 14
Tutum Dara 64.86 35.14 37
All 1.96 52.94 45.10 51
Overall Average/Total 2.56 28.69 68.76 861

203
Table A35 Decision making sheep – Purchasing feed(percentages of respondents by district )
Province District No Response Women Men Total Respondents
Badakhshan Argo 49.11 50.89 112
Baharak 4.55 95.45 66
All 32.58 67.42 178
Balkh Chimtal 4.35 2.61 93.04 115
Dihdadi 11.76 5.88 82.35 34
Nahri Shahi 16.13 9.68 74.19 31
All 7.78 4.44 87.78 180
Kabul Bagrami 38.71 61.29 31
Musayi 4.35 17.39 78.26 23
Paghman 80.85 19.15 47
All 0.99 53.47 45.54 101
Kandahar Arghandab 2.08 16.67 81.25 48
Daman 1.67 13.33 85.00 60
Dand 9.68 90.32 31
Panjwayi 5.26 94.74 76
Zhiray 13.79 86.21 29
All 0.82 11.07 88.11 244
Logar Puli Alam 1.67 45.00 53.33 60
Nangarhar Bati Kot 13.33 13.33 73.33 15
Bihsud 11.11 11.11 77.78 9
Shewa 26.09 73.91 23
All 6.38 19.15 74.47 47
Parwan Chaharikar 7.14 21.43 71.43 14
Tutum Dara 64.86 35.14 37
All 1.96 52.94 45.10 51
Overall Average/Total 2.56 24.39 73.05 861

204
Table A36 Decision making sheep – Selling animals(percentages and numbers of districts)
Province District No Response Women Men Total Respondents
Badakhshan Argo 64.29 35.71 112
Baharak 68.18 31.82 66
All 65.73 34.27 178
Balkh Chimtal 4.35 2.61 93.04 115
Dihdadi 11.76 2.94 85.29 34
Nahri Shahi 16.13 9.68 74.19 31
All 7.78 3.89 88.33 180
Kabul Bagrami 25.81 74.19 31
Musayi 4.35 17.39 78.26 23
Paghman 2.13 72.34 25.53 47
All 1.98 45.54 52.48 101
Kandahar Arghandab 6.25 14.58 79.17 48
Daman 3.33 31.67 65.00 60
Dand 38.71 61.29 31
Panjwayi 22.37 77.63 76
Zhiray 48.28 51.72 29
All 2.05 28.28 69.67 244
Logar Puli Alam 3.33 40.00 56.67 60
Nangarhar Bati Kot 13.33 20.00 66.67 15
Bihsud 11.11 22.22 66.67 9
Shewa 39.13 60.87 23
All 6.38 29.79 63.83 47
Parwan Chaharikar 7.14 21.43 71.43 14
Tutum Dara 64.86 35.14 37
All 1.96 52.94 45.10 51
Overall Average/Total 3.14 35.31 61.56 861
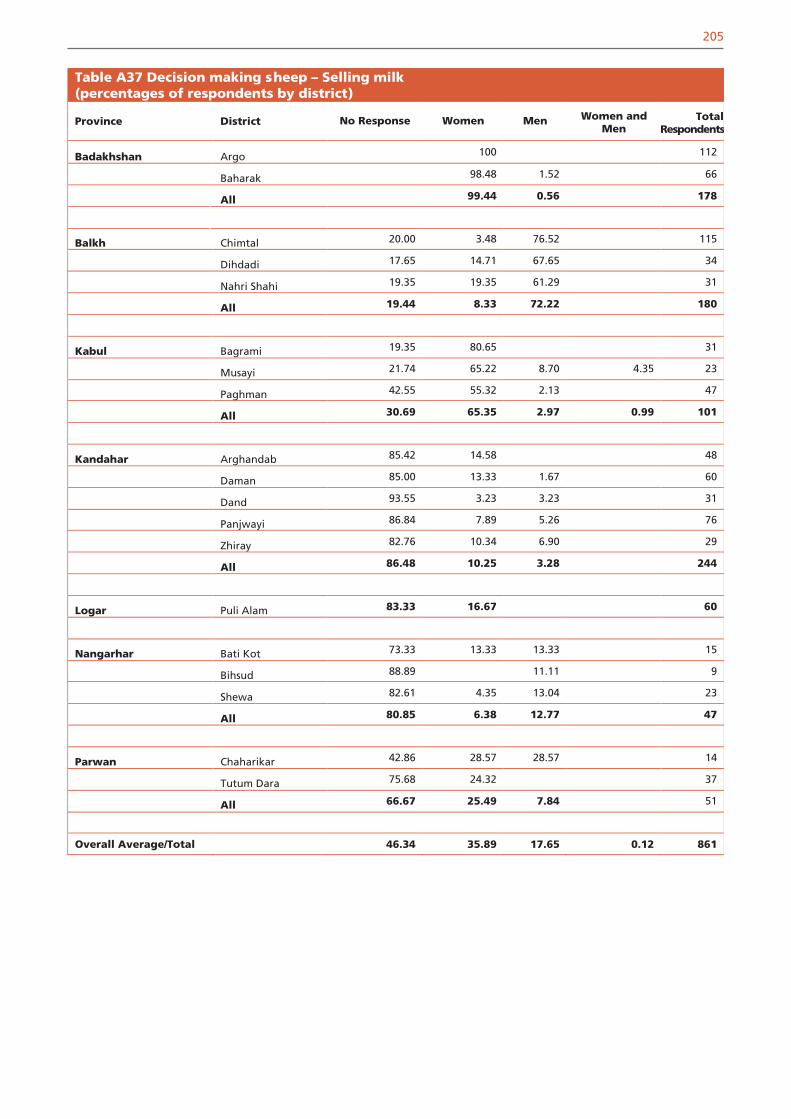
205
Table A37 Decision making sheep – Selling milk(percentages of respondents by district)
Province District No Response Women Men Women and Men
Total Respondents
Badakhshan Argo 100 112
Baharak 98.48 1.52 66
All 99.44 0.56 178
Balkh Chimtal 20.00 3.48 76.52 115
Dihdadi 17.65 14.71 67.65 34
Nahri Shahi 19.35 19.35 61.29 31
All 19.44 8.33 72.22 180
Kabul Bagrami 19.35 80.65 31
Musayi 21.74 65.22 8.70 4.35 23
Paghman 42.55 55.32 2.13 47
All 30.69 65.35 2.97 0.99 101
Kandahar Arghandab 85.42 14.58 48
Daman 85.00 13.33 1.67 60
Dand 93.55 3.23 3.23 31
Panjwayi 86.84 7.89 5.26 76
Zhiray 82.76 10.34 6.90 29
All 86.48 10.25 3.28 244
Logar Puli Alam 83.33 16.67 60
Nangarhar Bati Kot 73.33 13.33 13.33 15
Bihsud 88.89 11.11 9
Shewa 82.61 4.35 13.04 23
All 80.85 6.38 12.77 47
Parwan Chaharikar 42.86 28.57 28.57 14
Tutum Dara 75.68 24.32 37
All 66.67 25.49 7.84 51
Overall Average/Total 46.34 35.89 17.65 0.12 861

206
Table A38 Decision making sheep – Selling wool(percentages of respondents by district )
Province District No Response Women Men Total Respondents
Badakhshan Argo 100 112
Baharak 98.48 1.52 66
All 99.44 0.56 178
Balkh Chimtal 4.35 6.09 89.57 115
Dihdadi 11.76 8.82 79.41 34
Nahri Shahi 16.13 9.68 74.19 31
All 7.78 7.22 85.00 180
Kabul Bagrami 25.81 45.16 29.03 31
Musayi 8.70 65.22 26.09 23
Paghman 78.72 19.15 2.13 47
All 46.53 37.62 15.84 101
Kandahar Arghandab 81.25 14.58 4.17 48
Daman 71.67 18.33 10.00 60
Dand 80.65 12.90 6.45 31
Panjwayi 60.53 23.68 15.79 76
Zhiray 68.97 24.14 6.90 29
All 70.90 19.26 9.84 244
Logar Puli Alam 91.67 6.67 1.67 60
Nangarhar Bati Kot 60.00 6.67 33.33 15
Bihsud 77.78 22.22 9
Shewa 82.61 17.39 23
All 74.47 2.13 23.40 47
Parwan Chaharikar 7.14 21.43 71.43 14
Tutum Dara 54.05 27.03 18.92 37
All 41.18 25.49 33.33 51
Overall Average/Total 40.07 34.03 25.90 861
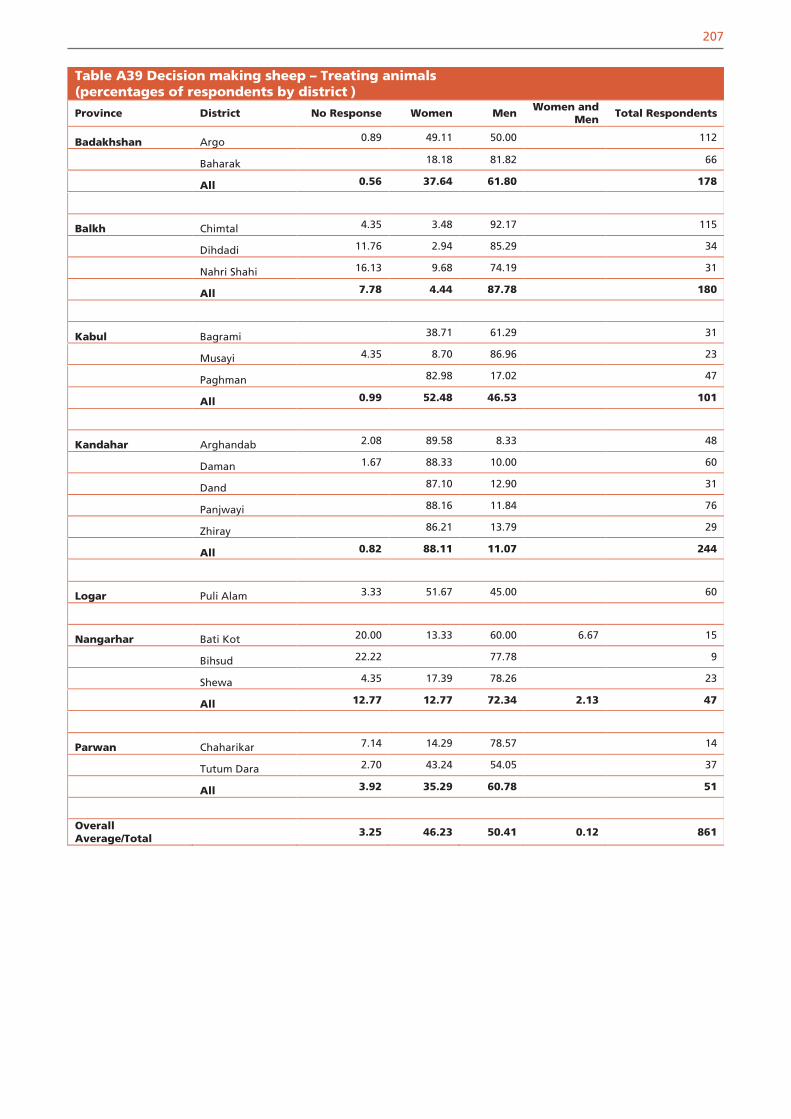
207
Table A39 Decision making sheep – Treating animals(percentages of respondents by district )
Province District No Response Women Men Women and Men Total Respondents
Badakhshan Argo 0.89 49.11 50.00 112
Baharak 18.18 81.82 66
All 0.56 37.64 61.80 178
Balkh Chimtal 4.35 3.48 92.17 115
Dihdadi 11.76 2.94 85.29 34
Nahri Shahi 16.13 9.68 74.19 31
All 7.78 4.44 87.78 180
Kabul Bagrami 38.71 61.29 31
Musayi 4.35 8.70 86.96 23
Paghman 82.98 17.02 47
All 0.99 52.48 46.53 101
Kandahar Arghandab 2.08 89.58 8.33 48
Daman 1.67 88.33 10.00 60
Dand 87.10 12.90 31
Panjwayi 88.16 11.84 76
Zhiray 86.21 13.79 29
All 0.82 88.11 11.07 244
Logar Puli Alam 3.33 51.67 45.00 60
Nangarhar Bati Kot 20.00 13.33 60.00 6.67 15
Bihsud 22.22 77.78 9
Shewa 4.35 17.39 78.26 23
All 12.77 12.77 72.34 2.13 47
Parwan Chaharikar 7.14 14.29 78.57 14
Tutum Dara 2.70 43.24 54.05 37
All 3.92 35.29 60.78 51
Overall Average/Total
3.25 46.23 50.41 0.12 861

208
Table A40 Decision making goats – Purchasing animals(percentages of respondents by district)
Province District No Response Women Men Total Respondents
Badakhshan Argo 89.62 10.38 106
Baharak 14.74 85.26 95
All 54.23 45.77 201
Balkh Chimtal 6.67 5.00 88.33 120
Dihdadi 5.00 10.00 85.00 20
Nahri Shahi 12.50 87.50 16
All 5.77 6.41 87.82 156
Kabul Bagrami 7.14 57.14 35.71 14
Musayi 4.76 33.33 61.90 21
Paghman 11.11 81.48 7.41 27
All 8.06 59.68 32.26 62
Kandahar Arghandab 4.35 34.78 60.87 23
Daman 46.88 53.13 32
Dand 42.86 57.14 14
Panjwayi 23.33 76.67 30
Zhiray 16.67 33.33 50.00 12
All 2.70 36.04 61.26 111
Logar Puli Alam 7.69 61.54 30.77 13
Nangarhar Bati Kot 16.67 12.50 70.83 24
Bihsud 15.38 15.38 69.23 65
Shewa 16.22 18.92 64.86 37
All 15.87 15.87 68.25 126
Parwan Chaharikar 33.33 33.33 33.33 6
Tutum Dara 57.14 42.86 14
All 10.00 50.00 40.00 20
Overall Average/Total 5.81 33.96 60.23 689

209
Table A41 Decision making goats – Purchasing feed(percentages of respondents by district)
Province District No Response Women Men Total Respondents
Badakhshan Argo 66.04 33.96 106
Baharak 7.37 92.63 95
All 38.31 61.69 201
Balkh Chimtal 6.67 5.00 88.33 120
Dihdadi 5.00 10.00 85.00 20
Nahri Shahi 18.75 81.25 16
All 5.77 7.05 87.18 156
Kabul Bagrami 7.14 42.86 50.00 14
Musayi 4.76 33.33 61.90 21
Paghman 11.11 81.48 7.41 27
All 8.06 56.45 35.48 62
Kandahar Arghandab 4.35 21.74 73.91 23
Daman 43.75 56.25 32
Dand 35.71 64.29 14
Panjwayi 20.00 80.00 30
Zhiray 16.67 25.00 58.33 12
All 2.70 29.73 67.57 111
Logar Puli Alam 7.69 53.85 38.46 13
Nangarhar Bati Kot 16.67 16.67 66.67 24
Bihsud 15.38 10.77 73.85 65
Shewa 16.22 10.81 72.97 37
All 15.87 11.90 72.22 126
Parwan Chaharikar 33.33 33.33 33.33 6
Tutum Dara 57.14 42.86 14
All 10.00 50.00 40.00 20
Overall Average/Total 5.81 27.29 66.91 689

210
Table A42 Decision making goats – Selling animals(percentages of respondents by district)
Province District No Response Women Men Total Respondents
Badakhshan Argo 81.13 18.87 106
Baharak 71.58 28.42 95
All 76.62 23.38 201
Balkh Chimtal 6.67 5.00 88.33 120
Dihdadi 5.00 5.00 90.00 20
Nahri Shahi 12.50 87.50 16
All 5.77 5.77 88.46 156
Kabul Bagrami 7.14 28.57 64.29 14
Musayi 4.76 28.57 66.67 21
Paghman 11.11 81.48 7.41 27
All 8.06 51.61 40.32 62
Kandahar Arghandab 4.35 43.48 52.17 23
Daman 59.38 40.63 32
Dand 71.43 28.57 14
Panjwayi 53.33 46.67 30
Zhiray 16.67 50.00 33.33 12
All 2.70 54.95 42.34 111
Logar Puli Alam 7.69 53.85 38.46 13
Nangarhar Bati Kot 16.67 16.67 66.67 24
Bihsud 16.92 15.38 67.69 65
Shewa 16.22 24.32 59.46 37
All 16.67 18.25 65.08 126
Parwan Chaharikar 33.33 33.33 33.33 6
Tutum Dara 57.14 42.86 14
All 10.00 50.00 40.00 20
Overall Average/Total 5.95 42.96 51.09 689

211
Table A43 Decision making goats – Selling milk(percentages of respondents by district)
Province District No Response Women Men Total Respondents
Badakhshan Argo 100 106
Baharak 98.95 1.05 95
All 99.50 0.50 201
Balkh Chimtal 22.50 5.00 72.50 120
Dihdadi 15.00 15.00 70.00 20
Nahri Shahi 6.25 31.25 62.50 16
All 19.87 8.97 71.15 156
Kabul Bagrami 7.14 92.86 14
Musayi 9.52 90.48 21
Paghman 33.33 66.67 27
All 19.35 80.65 62
Kandahar Arghandab 43.48 52.17 4.35 23
Daman 53.13 37.50 9.38 32
Dand 50.00 42.86 7.14 14
Panjwayi 63.33 26.67 10.00 30
Zhiray 75.00 25.00 12
All 55.86 36.94 7.21 111
Logar Puli Alam 92.31 7.69 13
Nangarhar Bati Kot 70.83 25.00 4.17 24
Bihsud 89.23 7.69 3.08 65
Shewa 75.68 10.81 13.51 37
All 81.75 11.90 6.35 126
Parwan Chaharikar 33.33 66.67 6
Tutum Dara 78.57 21.43 14
All 65.00 35.00 20
Overall Average/Total 33.82 47.61 18.58 689

212
Table A44 Decision making goats – Selling fibre(percentages of respondents by district)Province District No Response Women Men Total Respondents
Badakhshan Argo 100 106
Baharak 98.95 1.05 95
All 99.50 0.50 201
Balkh Chimtal 10.83 6.67 82.50 120
Dihdadi 5.00 10.00 85.00 20
Nahri Shahi 12.50 18.75 68.75 16
All 10.26 8.33 81.41 156
Kabul Bagrami 35.71 35.71 28.57 14
Musayi 4.76 71.43 23.81 21
Paghman 96.30 3.70 27
All 51.61 33.87 14.52 62
Kandahar Arghandab 65.22 34.78 23
Daman 65.63 31.25 3.13 32
Dand 71.43 28.57 14
Panjwayi 66.67 26.67 6.67 30
Zhiray 75.00 25.00 12
All 67.57 29.73 2.70 111
Logar Puli Alam 100 13
Nangarhar Bati Kot 87.50 8.33 4.17 24
Bihsud 89.23 4.62 6.15 65
Shewa 89.19 5.41 5.41 37
All 88.89 5.56 5.56 126
Parwan Chaharikar 50.00 33.33 16.67 6
Tutum Dara 64.29 14.29 21.43 14
All 60.00 20.00 20.00 20
Overall Average/Total 37.74 40.35 21.92 689

213
Table A45 Decision making goats – Treating animals(percentages of respondents by district)
Province District No Response Women Men Women/Men Total Respondents
Badakhshan Argo 79.25 20.75 106
Baharak 22.11 77.89 95
All 52.24 47.76 201
Balkh Chimtal 6.67 5.00 88.33 120
Dihdadi 5.00 5.00 90.00 20
Nahri Shahi 12.50 87.50 16
All 5.77 5.77 88.46 156
Kabul Bagrami 14.29 28.57 57.14 14
Musayi 9.52 14.29 76.19 21
Paghman 11.11 85.19 3.70 27
All 11.29 48.39 40.32 62
Kandahar Arghandab 8.70 86.96 4.35 23
Daman 100 32
Dand 85.71 14.29 14
Panjwayi 86.67 13.33 30
Zhiray 16.67 75.00 8.33 12
All 3.60 89.19 7.21 111
Logar Puli Alam 7.69 46.15 46.15 13
Nangarhar Bati Kot 12.50 12.50 75.00 24
Bihsud 18.46 6.15 73.85 1.54 65
Shewa 18.92 10.81 70.27 37
All 17.46 8.73 73.02 0.79 126
Parwan Chaharikar 33.33 16.67 50.00 6
Tutum Dara 7.14 35.71 57.14 14
All 15.00 30.00 55.00 20
Overall Average/Total
6.68 38.61 54.57 0.15 689

214
Table A46 Cattle preferred use: milk (percentages of respondents by district)
Province District No Response (No Preference)
Household Consumption
Sale Total Respondents
Nangarhar Bati Kot 1.72 50.00 48.28 116
Bihsud 1.77 48.67 49.56 113
Shewa 1.03 35.05 63.92 97
All 1.53 45.09 53.37 326
Kabul Bagrami 22.86 77.14 70
Musayi 2.27 13.64 84.09 88
Paghman 39.25 60.75 107
All 0.75 26.42 72.83 265
Logar Puli Alam 3.66 74.39 21.95 82
3.66 74.39 21.95 82
Parwan Chaharikar 6.90 20.69 72.41 58
Tutum Dara 22.68 19.59 57.73 97
All 16.77 20.00 63.23 155
Badakhshan Argo 100 52
Baharak 99.05 0.95 105
All 99.36 0.64 157
Balkh Chimtal 2.38 2.38 95.24 168
Dihdadi 4.69 9.38 85.94 64
Nahri Shahi 1.96 1.96 96.08 51
All 2.83 3.89 93.29 283
Kandahar Arghandab 1.28 30.77 67.95 78
Daman 1.05 36.84 62.11 95
Dand 34.78 65.22 46
Panjwayi 1.74 31.30 66.96 115
Zhiray 1.89 35.85 62.26 53
All 1.29 33.59 65.12 387
Overall Average/Total
2.96 36.62 60.42 1655

215
Table A47 Cattle preferred use: work/draft (percentages of respondents by district)
Province DistrictNo Response (No
Preference)Household
Consumption SaleTotal
Respondents
Nangarhar Bati Kot 100 116
Bihsud100 113
Shewa100 97
All 100 326
Kabul Bagrami100 70
Musayi100 88
Paghman100 107
All 100 265
Logar Puli Alam 97.56 2.44 82
97.56 2.44 82
Parwan Chaharikar 93.10 3.45 3.45 58
Tutum Dara 77.32 15.46 7.22 97
All 83.23 10.97 5.81 155
Badakhshan Argo 94.23 5.77 52
Baharak 36.19 63.81 105
All 55.41 44.59 157
Balkh Chimtal 15.48 77.38 7.14 168
Dihdadi 26.56 57.81 15.63 64
Nahri Shahi 11.76 37.25 50.98 51
All 17.31 65.72 16.96 283
Kandahar Arghandab 100 78
Daman 98.95 1.05 95
Dand 100 46
Panjwayi 100 115
Zhiray 100 53
All 99.74 0.26 387
Overall Average/Total 74.62 17.64 7.73 1655
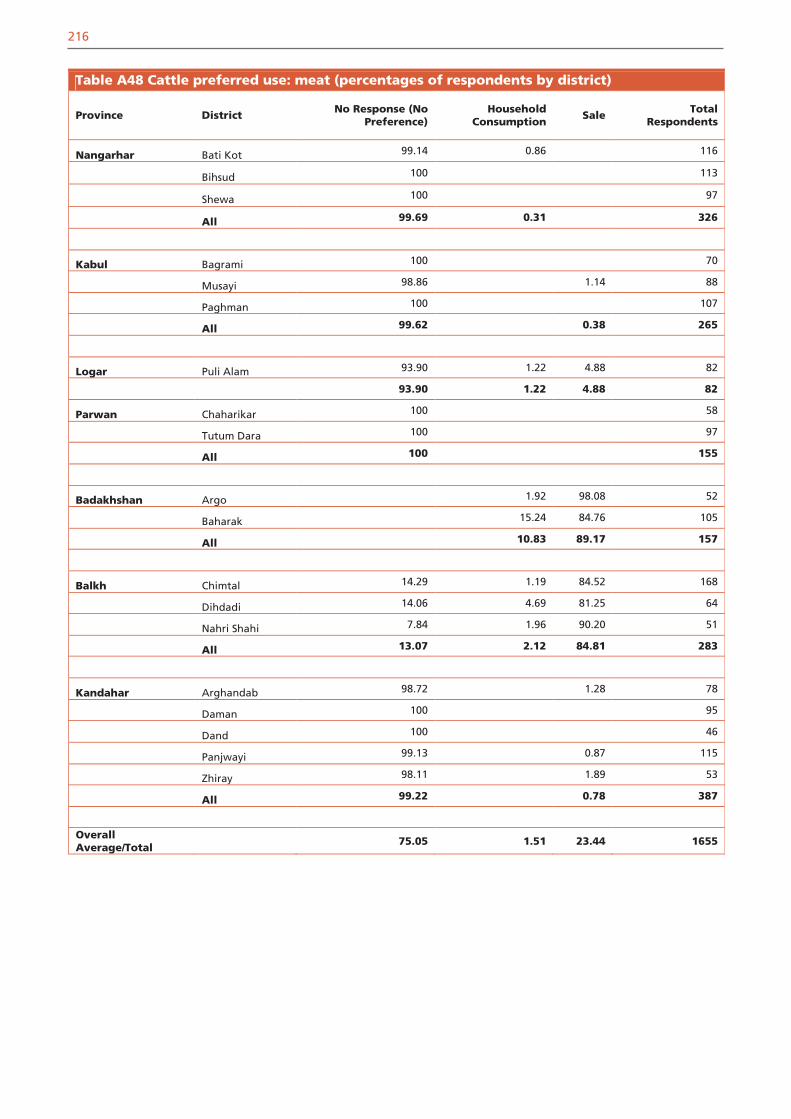
216
Table A48 Cattle preferred use: meat (percentages of respondents by district)
Province District No Response (No Preference)
Household Consumption
Sale Total Respondents
Nangarhar Bati Kot 99.14 0.86 116
Bihsud 100 113
Shewa 100 97
All 99.69 0.31 326
Kabul Bagrami 100 70
Musayi 98.86 1.14 88
Paghman 100 107
All 99.62 0.38 265
Logar Puli Alam 93.90 1.22 4.88 82
93.90 1.22 4.88 82
Parwan Chaharikar 100 58
Tutum Dara 100 97
All 100 155
Badakhshan Argo 1.92 98.08 52
Baharak 15.24 84.76 105
All 10.83 89.17 157
Balkh Chimtal 14.29 1.19 84.52 168
Dihdadi 14.06 4.69 81.25 64
Nahri Shahi 7.84 1.96 90.20 51
All 13.07 2.12 84.81 283
Kandahar Arghandab 98.72 1.28 78
Daman 100 95
Dand 100 46
Panjwayi 99.13 0.87 115
Zhiray 98.11 1.89 53
All 99.22 0.78 387
Overall Average/Total
75.05 1.51 23.44 1655

217
Table A49 Poultry preference use: meat (percentages of respondents by district)
Province District No Response (No Preference)
Household Consumption
SaleHousehold
Consumption / Sale
Total Respondents
Nangarhar Bati Kot 75.36 2.90 21.74 69
Bihsud 91.33 2.00 6.67 150
Shewa 80.95 7.14 11.90 84
All 84.82 3.63 11.55 303
Kabul Bagrami 95.65 4.35 46
Musayi 82.61 17.39 23
Paghman 100 13
All 92.68 2.44 4.88 82
Logar Puli Alam 46.15 53.85 13
46.15 53.85 13
Parwan Chaharikar 96.52 0.87 2.61 115
Tutum Dara 96.15 3.85 26
All 96.45 0.71 2.84 141
Balkh Chimtal 34.21 1.75 63.16 0.88 114
Dihdadi 40.28 23.61 36.11 72
Nahri Shahi 20.41 6.12 65.31 8.16 49
All 33.19 9.36 55.32 2.13 235
Kandahar Zhiray 100 1
Overall Average/Total 71.35 5.55 22.45 0.65 775
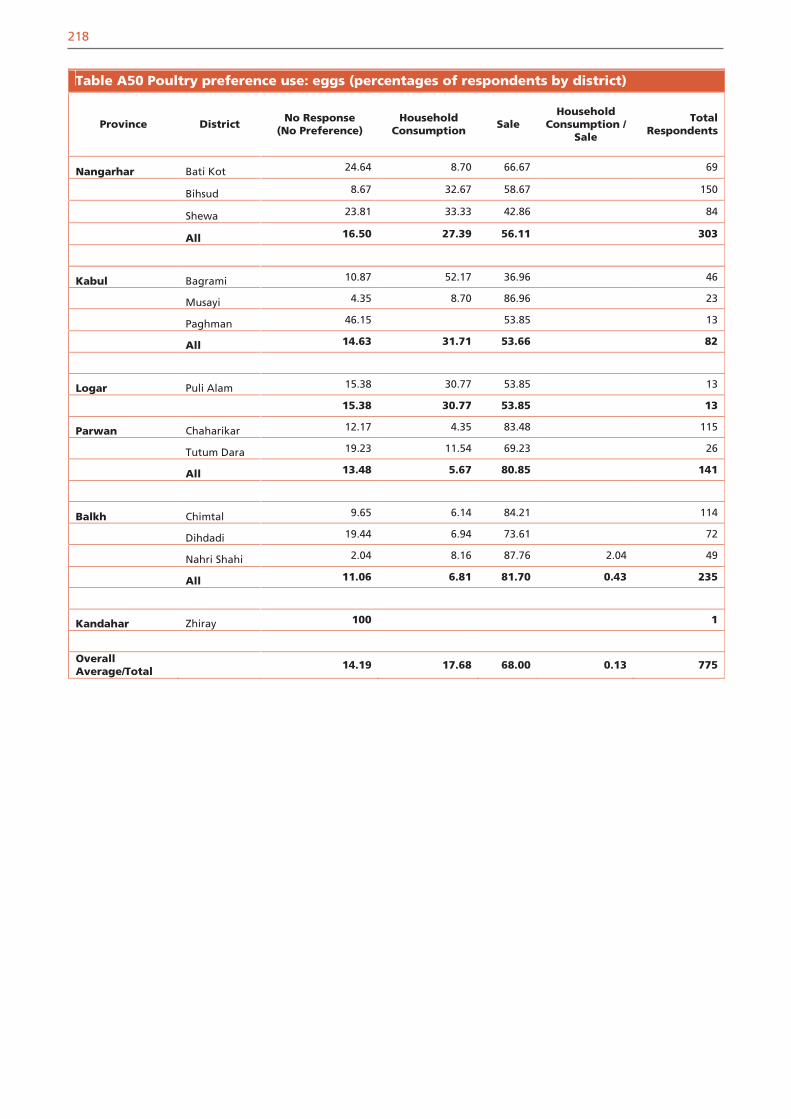
218
Table A50 Poultry preference use: eggs (percentages of respondents by district)
Province DistrictNo Response
(No Preference)Household
ConsumptionSale
Household Consumption /
Sale
Total Respondents
Nangarhar Bati Kot 24.64 8.70 66.67 69
Bihsud 8.67 32.67 58.67 150
Shewa 23.81 33.33 42.86 84
All 16.50 27.39 56.11 303
Kabul Bagrami 10.87 52.17 36.96 46
Musayi 4.35 8.70 86.96 23
Paghman 46.15 53.85 13
All 14.63 31.71 53.66 82
Logar Puli Alam 15.38 30.77 53.85 13
15.38 30.77 53.85 13
Parwan Chaharikar 12.17 4.35 83.48 115
Tutum Dara 19.23 11.54 69.23 26
All 13.48 5.67 80.85 141
Balkh Chimtal 9.65 6.14 84.21 114
Dihdadi 19.44 6.94 73.61 72
Nahri Shahi 2.04 8.16 87.76 2.04 49
All 11.06 6.81 81.70 0.43 235
Kandahar Zhiray 100 1
Overall Average/Total
14.19 17.68 68.00 0.13 775

219
Table A51 Sheep preferred use: milk (percentages of respondents by district)
Province District No Response(No Preference)
Household Consumption Sale Total
Respondents
Nangarhar Bati Kot 100 2
Bihsud 100 1
Shewa 100 1
All 100 4
Kabul Bagrami 77.36 11.32 11.32 53
Musayi 96.30 3.70 27
Paghman 38.46 15.38 46.15 13
All 77.42 8.60 13.98 93
Logar Puli Alam 84.09 15.91 44
Parwan Chaharikar 40.00 10.00 50.00 20
Tutum Dara 82.61 8.70 8.70 46
All 69.70 9.09 21.21 66
Balkh Chimtal 33.33 3.33 63.33 30
Dihdadi 27.27 4.55 68.18 22
Nahri Shahi 14.29 85.71 14
All 27.27 3.03 69.70 66
Badakhshan Argo 100 80
Baharak 97.14 2.86 35
All 99.13 0.87 115
Kandahar Arghandab 50.00 50.00 2
Daman 72.73 9.09 18.18 11
Dand 100 7
Panjwayi 100 7
Zhiray 100 2
All 86.21 6.90 6.90 29
Overall Average/Total 48.44 33.33 18.23 417

220
Table A52 Sheep preferred use: meat (percentages of respondents by district)
Province District No Response(No Preference)
Household Consumption Sale Total
Respondents
Nangarhar Bati Kot 50.00 50.00 2
Bihsud 100 1
Shewa 100 1
75.00 25.00 4
Kabul Bagrami 35.85 62.26 1.89 53
Musayi 3.70 55.56 40.74 27
Paghman 61.54 15.38 23.08 13
30.11 53.76 16.13 93
Logar Puli Alam 13.64 77.27 9.09 44
Parwan Chaharikar 80.00 15.00 5.00 20
Tutum Dara 32.61 67.39 46
46.97 51.52 1.52 66
Badakhshan Argo 10.00 90.00 80
Baharak 20.00 80.00 35
13.04 86.96 115
Balkh Chimtal 13.33 6.67 80.00 30
Dihdadi 4.55 4.55 90.91 22
Nahri Shahi 14.29 85.71 14
7.58 7.58 84.85 66
Kandahar Arghandab 50.00 50.00 2
Daman 45.45 54.55 11
Dand 100 7
Panjwayi 100 7
Zhiray 100 2
20.69 79.31 29
Overall Average/Total 18.23 33.81 47.96 417

221
Table A53 Sheep preferred use: wool (percentages of respondents by district)
Province District No Response (No Preference)
Household Consumption
Sale Total Respondents
Nangarhar Bati Kot 100 2
Bihsud 100 1
Shewa 100 1
All 100 4
Kabul Bagrami 96.23 3.77 53
Musayi 100 27
Paghman 100 13
All 97.85 2.15 93
Logar Puli Alam 100 44
Parwan Chaharikar 95.00 5.00 20
Tutum Dara 97.83 2.17 46
All 96.97 3.03 66
Badakhshan Argo 100 80
Baharak 2.86 31.43 65.71 35
All 0.87 79.13 20.00 115
Balkh Chimtal 36.67 13.33 50.00 30
Dihdadi 27.27 13.64 59.09 22
Nahri Shahi 14.29 14.29 71.43 14
All 28.79 13.64 57.58 66
Kandahar Arghandab 100 2
Daman 100 11
Dand 100 7
Panjwayi 100 7
Zhiray 100 2
All 100 29
Overall Average/Total
60.43 24.94 14.63 417

222
Table A54 Goats preferred use: milk (Percentages of respondents by district)
Province DistrictNo Response (No
Preference)Household
ConsumptionSale
Total Respondents
Nangarhar Bati Kot 100 1
Bihsud 33.33 66.67 3
Shewa 100 1
All 40.00 40.00 20.00 5
Kabul Bagrami 100 5
Musayi 50.00 50.00 2
Paghman 100 1
All 87.50 12.50 8
Parwan Tutum Dara 100 1
Badakhshan Argo 100 7
Baharak 100 6
All 100 13
Balkh Chimtal 100 2
Dihdadi 100 1
All 100 3
Kandahar Arghandab 50.00 50.00 2
Zhiray 100 1
All 66.67 33.33 3
Overall Average/Total
6.06 75.76 18.18 33

223
Table A55 Goats preferred use: Meat milk(percentages of respondents by district)
Province District No Response(No Preference) Sale Total Respondents
Nangarhar Bati Kot 100 1
Bihsud 100 3
Shewa 100 1
All 100 5
Kabul Bagrami 100 5
Musayi 50.00 50.00 2
Paghman 100 1
All 87.50 12.50 8
Parwan Tutum Dara 100 1
Badakhshan Argo 100 7
Baharak 100 6
All 100 13
Balkh Chimtal 50.00 50.00 2
Dihdadi 100 1
All 33.33 66.67 3
Kandahar Arghandab 100 2
Zhiray 100 1
All 100 3
Overall Average/Total 51.52 48.48 33

224
Table A56 Goats preferred use: Fibre (percentages of respondents by district)
Province District No Response(No Preference)
Household Consumption
Sale Total Respondents
Nangarhar Bati Kot 100 1
Bihsud 100 3
Shewa 100 1
All 100 5
Kabul Bagrami 100 5
Musayi 50.00 50.00 2
Paghman 100 1
All 87.50 12.50 8
Badakhshan Argo 100 7
Baharak 83.33 16.67 6
All 92.31 7.69 13
Balkh Chimtal 50.00 50.00 2
Dihdadi 100 1
All 33.33 33.33 33.33 3
Parwan Tutum Dara 100 1
Kandahar Arghandab 100 2
Zhiray 100 1
All 100 3
Overall Average/Total
51.52 39.39 9.09 33
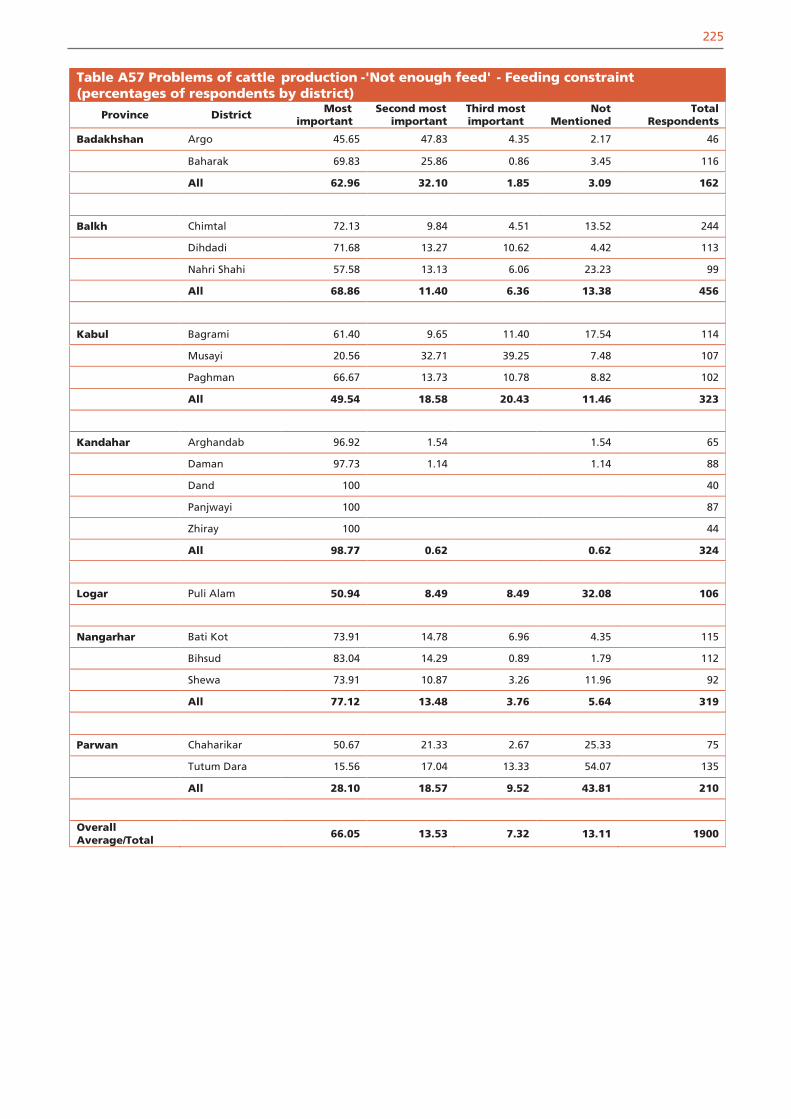
225
Table A57 Problems of cattle production -'Not enough feed' - Feeding constraint(percentages of respondents by district)
Province District Most important
Second most important
Third most important
Not Mentioned
Total Respondents
Badakhshan Argo 45.65 47.83 4.35 2.17 46
Baharak 69.83 25.86 0.86 3.45 116
All 62.96 32.10 1.85 3.09 162
Balkh Chimtal 72.13 9.84 4.51 13.52 244
Dihdadi 71.68 13.27 10.62 4.42 113
Nahri Shahi 57.58 13.13 6.06 23.23 99
All 68.86 11.40 6.36 13.38 456
Kabul Bagrami 61.40 9.65 11.40 17.54 114
Musayi 20.56 32.71 39.25 7.48 107
Paghman 66.67 13.73 10.78 8.82 102
All 49.54 18.58 20.43 11.46 323
Kandahar Arghandab 96.92 1.54 1.54 65
Daman 97.73 1.14 1.14 88
Dand 100 40
Panjwayi 100 87
Zhiray 100 44
All 98.77 0.62 0.62 324
Logar Puli Alam 50.94 8.49 8.49 32.08 106
Nangarhar Bati Kot 73.91 14.78 6.96 4.35 115
Bihsud 83.04 14.29 0.89 1.79 112
Shewa 73.91 10.87 3.26 11.96 92
All 77.12 13.48 3.76 5.64 319
Parwan Chaharikar 50.67 21.33 2.67 25.33 75
Tutum Dara 15.56 17.04 13.33 54.07 135
All 28.10 18.57 9.52 43.81 210
Overall Average/Total
66.05 13.53 7.32 13.11 1900

226
Table A58 Problems of cattle production - Animal disease - Disease constraint(percentages of respondents by district)
Province District Most important
Second most important
Third most important
Not Mentioned
Total Respondents
Badakhshan Argo 50.00 47.83 2.17 46
Baharak 25.86 68.10 5.17 0.86 116
All 32.72 62.35 4.32 0.62 162
Balkh Chimtal 17.21 35.66 37.30 9.84 244
Dihdadi 18.58 34.51 24.78 22.12 113
Nahri Shahi 30.30 48.48 11.11 10.10 99
All 20.39 38.16 28.51 12.94 456
Kabul Bagrami 19.30 53.51 18.42 8.77 114
Musayi 36.45 41.12 14.02 8.41 107
Paghman 16.67 68.63 11.76 2.94 102
All 24.15 54.18 14.86 6.81 323
Kandahar Arghandab 66.15 32.31 1.54 65
Daman 1.14 62.50 32.95 3.41 88
Dand 57.50 37.50 5.00 40
Panjwayi 67.82 31.03 1.15 87
Zhiray 61.36 36.36 2.27 44
All 0.31 63.89 33.33 2.47 324
Logar Puli Alam 11.32 45.28 16.98 26.42 106
Nangarhar Bati Kot 14.78 45.22 30.43 9.57 115
Bihsud 9.82 55.36 28.57 6.25 112
Shewa 13.04 65.22 16.30 5.43 92
All 12.54 54.55 25.71 7.21 319
Parwan Chaharikar 29.33 50.67 10.67 9.33 75
Tutum Dara 83.70 15.56 0.74 135
All 64.29 28.10 4.29 3.33 210
Overall Average/Total
21.68 49.37 21.16 7.79 1900

227
Table A59 Problems of cattle production -'Too far to the market' –Market distance constraint (percentages of respondents by district)
Province District Most important
Second most important
Third most important
Not Mentioned
Total Respondents
Badakhshan Argo 100 46
Baharak 0.86 1.72 59.48 37.93 116
All 0.62 1.23 42.59 55.56 162
Balkh Chimtal 0.41 26.64 31.56 41.39 244
Dihdadi 3.54 25.66 32.74 38.05 113
Nahri Shahi 2.02 15.15 22.22 60.61 99
All 1.54 23.90 29.82 44.74 456
Kabul Bagrami 1.75 2.63 95.61 114
Musayi 2.80 6.54 90.65 107
Paghman 100 102
All 1.55 3.10 95.36 323
Kandahar Arghandab 1.54 7.69 90.77 65
Daman 1.14 1.14 7.95 89.77 88
Dand 10.00 90.00 40
Panjwayi 1.15 5.75 93.10 87
Zhiray 4.55 95.45 44
All 0.31 0.93 7.10 91.67 324
Logar Puli Alam 5.66 14.15 12.26 67.92 106
Nangarhar Bati Kot 2.61 29.57 36.52 31.30 115
Bihsud 16.07 21.43 62.50 112
Shewa 3.26 18.48 15.22 63.04 92
All 1.88 21.63 25.08 51.41 319
Parwan Chaharikar 2.67 14.67 32.00 50.67 75
Tutum Dara 51.85 30.37 17.78 135
All 0.95 38.57 30.95 29.52 210
Overall Average/Total
1.21 14.95 20.84 63.00 1900

228
Table A60 Problems of cattle production -'Not enough buyers' - Sales constraint(percentages of respondents by district)
Province District Most important
Second most important
Third most important
Not Mentioned
Total Respondents
Badakhshan Argo 2.17 2.17 95.65 46
Baharak 0.86 1.72 97.41 116
All 0.62 0.62 1.85 96.91 162
Balkh Chimtal 13.93 6.56 79.51 244
Dihdadi 22.12 20.35 57.52 113
Nahri Shahi 1.01 5.05 13.13 80.81 99
All 0.22 14.04 11.40 74.34 456
Kabul Bagrami 2.63 97.37 114
Musayi 0.93 3.74 7.48 87.85 107
Paghman 1.96 2.94 95.10 102
All 0.31 2.79 3.41 93.50 323
Kandahar Arghandab 100 65
Daman 100 88
Dand 2.50 97.50 40
Panjwayi 1.15 98.85 87
Zhiray 100 44
All 0.31 0.31 99.38 324
Logar Puli Alam 1.89 3.77 14.15 80.19 106
Nangarhar Bati Kot 1.74 6.96 9.57 81.74 115
Bihsud 7.14 8.93 83.93 112
Shewa 2.17 3.26 7.61 86.96 92
All 1.25 5.96 8.78 84.01 319
Parwan Chaharikar 4.00 1.33 5.33 89.33 75
Tutum Dara 8.15 13.33 78.52 135
All 1.43 5.71 10.48 82.38 210
Overall Average/Total
0.63 5.79 6.95 86.63 1900

229
Table A61 Problems of cattle production -'Too much work' - Labor constraint(percentages of respondents by district)
Province District Most important
Second most important
Third most important
Not Mentioned
Total Respondents
Badakhshan Argo 2.17 19.57 78.26 46
Baharak 2.59 0.86 96.55 116
All 2.47 6.17 91.36 162
Balkh Chimtal 11.07 2.05 0.41 86.48 244
Dihdadi 5.31 0.88 1.77 92.04 113
Nahri Shahi 9.09 1.01 89.90 99
All 9.21 1.32 0.88 88.60 456
Kabul Bagrami 14.04 7.02 14.91 64.04 114
Musayi 5.61 4.67 15.89 73.83 107
Paghman 3.92 1.96 3.92 90.20 102
All 8.05 4.64 11.76 75.54 323
Kandahar Arghandab 3.08 1.54 9.23 86.15 65
Daman 1.14 5.68 93.18 88
Dand 100 40
Panjwayi 1.15 4.60 94.25 87
Zhiray 4.55 95.45 44
All 0.62 0.93 5.25 93.21 324
Logar Puli Alam 12.26 4.72 6.60 76.42 106
Nangarhar Bati Kot 6.09 3.48 2.61 87.83 115
Bihsud 7.14 6.25 25.00 61.61 112
Shewa 7.61 30.43 61.96 92
All 6.90 3.45 18.50 71.16 319
Parwan Chaharikar 8.00 6.67 18.67 66.67 75
Tutum Dara 100 135
All 2.86 2.38 6.67 88.10 210
Overall Average/Total
6.05 2.37 7.84 83.74 1900

230
Table A62 Problems of cattle production - Cost of labor(percentages of respondents by district)
Province District Most important
Second most important
Third most important
Not Mentioned
Total Respondents
Badakhshan Argo 4.35 71.74 23.91 46
Baharak 0.86 3.45 31.90 63.79 116
All 0.62 3.70 43.21 52.47 162
Balkh Chimtal 0.82 99.18 244
Dihdadi 0.88 0.88 1.77 96.46 113
Nahri Shahi 1.01 98.99 99
All 0.44 0.22 0.88 98.46 456
Kabul Bagrami 5.26 25.44 52.63 16.67 114
Musayi 2.80 8.41 11.21 77.57 107
Paghman 0.98 3.92 25.49 69.61 102
All 3.10 13.00 30.34 53.56 323
Kandahar Arghandab 100 65
Daman 1.14 7.95 90.91 88
Dand 2.50 5.00 92.50 40
Panjwayi 3.45 96.55 87
Zhiray 2.27 97.73 44
All 0.62 4.01 95.37 324
Logar Puli Alam 17.92 23.58 33.02 25.47 106
Nangarhar Bati Kot 0.87 2.61 96.52 115
Bihsud 100 112
Shewa 1.09 2.17 96.74 92
All 0.63 1.57 97.81 319
Parwan Chaharikar 1.33 1.33 9.33 88.00 75
Tutum Dara 0.74 4.44 9.63 85.19 135
All 0.95 3.33 9.52 86.19 210
Overall Average/Total
1.79 4.47 12.89 80.84 1900

231
Table A63 Improvements for cattle production - Better feeding of cattle(percentages of respondents by district)
Province DistrictMost
importantSecond most
importantThird most important
Not Mentioned
TotalRespondents
Badakhshan Argo 52.17 26.09 6.52 15.22 46
Baharak 66.96 31.30 0.87 0.87 115
All 62.73 29.81 2.48 4.97 161
Balkh Chimtal 75.60 18.40 4.80 1.20 250
Dihdadi 77.39 11.30 4.35 6.96 115
Nahri Shahi 81.63 12.24 1.02 5.10 98
All 77.32 15.33 3.89 3.46 463
Kabul Bagrami 62.39 15.38 8.55 13.68 117
Musayi 48.15 36.11 12.96 2.78 108
Paghman 81.37 12.75 0.98 4.90 102
All 63.61 21.41 7.65 7.34 327
Kandahar Arghandab 98.44 1.56 64
Daman 98.81 1.19 84
Dand 100 41
Panjwayi 100 88
Zhiray 100 44
All 99.38 0.62 321
Logar Puli Alam 70.00 7.27 3.64 19.09 110
Nangarhar Bati Kot 55.08 9.32 23.73 11.86 118
Bihsud 75.65 5.22 5.22 13.91 115
Shewa 69.39 3.06 12.24 15.31 98
All 66.47 6.04 13.90 13.60 331
Parwan Chaharikar 48.65 14.86 9.46 27.03 74
Tutum Dara 15.33 9.49 10.22 64.96 137
All 27.01 11.37 9.95 51.66 211
Overall Average/Total 69.65 12.63 6.13 11.59 1924

232
Table A64 Improvements for cattle production - Better health care of cattle(percentages of res pondents by district)
Province District Most important
Second most important
Third most important
Not Mentioned
Total Respondents
Badakhshan Argo 47.83 52.17 46
Baharak 30.43 60.87 6.96 1.74 115
All 35.40 58.39 4.97 1.24 161
Balkh Chimtal 9.20 78.40 7.60 4.80 250
Dihdadi 13.91 72.17 7.83 6.09 115
Nahri Shahi 10.20 80.61 5.10 4.08 98
All 10.58 77.32 7.13 4.97 463
Kabul Bagrami 11.97 26.50 25.64 35.90 117
Musayi 28.70 29.63 26.85 14.81 108
Paghman 7.84 68.63 16.67 6.86 102
All 16.21 40.67 23.24 19.88 327
Kandahar Arghandab 59.38 35.94 4.69 64Daman 1.19 63.10 34.52 1.19 84
Dand 63.41 36.59 41
Panjwayi 62.50 35.23 2.27 88
Zhiray 59.09 40.91 44
All 0.31 61.68 36.14 1.87 321
Logar Puli Alam 12.73 22.73 17.27 47.27 110
Nangarhar Bati Kot 11.02 49.15 6.78 33.05 118
Bihsud 5.22 65.22 10.43 19.13 115
Shewa 2.04 63.27 8.16 26.53 98
All 6.34 58.91 8.46 26.28 331
Parwan Chaharikar 6.76 29.73 6.76 56.76 74
Tutum Dara 14.60 29.20 41.61 14.60 137
All 11.85 29.38 29.38 29.38 211
Overall Average/Total 11.43 55.35 17.78 15.44 1924

233
Table A65 Improvements for cattle production - Better water access for cattle(percentages of respondents by district)
Province District Most important
Second most important
Third most important
Not Mentioned
Total Respondents
Badakhshan Argo 13.04 86.96 46
Baharak 0.87 6.09 93.04 115
All 0.62 8.07 91.30 161
Balkh Chimtal 13.20 0.80 26.40 59.60 250
Dihdadi 4.35 20.87 74.78 115
Nahri Shahi 4.08 2.04 45.92 47.96 98
All 7.99 1.94 29.16 60.91 463
Kabul Bagrami 12.82 34.19 10.26 42.74 117
Musayi 6.48 25.93 28.70 38.89 108
Paghman 6.86 4.90 2.94 85.29 102
All 8.87 22.32 14.07 54.74 327
Kandahar Arghandab 1.56 3.13 9.38 85.94 64
Daman 1.19 2.38 96.43 84
Dand 7.32 92.68 41
Panjwayi 3.41 4.55 92.05 88
Zhiray 2.27 97.73 44
All 0.31 1.87 4.98 92.83 321
Logar Puli Alam 2.73 7.27 1.82 88.18 110
Nangarhar Bati Kot 0.85 2.54 1.69 94.92 118
Bihsud 100 115
Shewa 2.04 1.02 96.94 98
All 0.91 1.21 0.60 97.28 331
Parwan Chaharikar 5.41 13.51 12.16 68.92 74
Tutum Dara 1.46 98.54 137
All 2.84 4.74 4.27 88.15 211
Overall Average/Total 4.11 5.77 11.59 78.53 1924

234
Table A66 Improvements for cattle production - Easier market access(percentages of respondents by district)
Province DistrictMost
importantSecond most
importantThird most important
Not MentionedTotal
Respondents
Badakhshan Argo 2.17 97.83 46
Baharak 2.61 26.96 70.43 115
All 1.86 19.88 78.26 161
Balkh Chimtal 0.80 0.80 34.40 64.00 250
Dihdadi 5.22 5.22 33.04 56.52 115
Nahri Shahi 1.02 2.04 20.41 76.53 98
All 1.94 2.16 31.10 64.79 463
Kabul Bagrami 1.71 5.13 93.16 117
Musayi 1.85 98.15 108
Paghman 6.86 93.14 102
All 1.22 3.98 94.80 327
Kandahar Arghandab 100 64
Daman 2.38 97.62 84
Dand 4.88 95.12 41
Panjwayi 1.14 1.14 97.73 88
Zhiray 100 44
All 0.31 1.56 98.13 321
Logar Puli Alam 0.91 18.18 13.64 67.27 110
Nangarhar Bati Kot 2.54 5.93 11.02 80.51 118
Bihsud 0.87 3.48 6.96 88.70 115
Shewa 2.04 1.02 3.06 93.88 98
All 1.81 3.63 7.25 87.31 331
Parwan Chaharikar 6.76 14.86 9.46 68.92 74
Tutum Dara 10.22 18.25 71.53 137
All 2.37 11.85 15.17 70.62 211
Overall Average/Total
1.09 3.90 13.77 81.24 1924

235
Table A67 Improvements for cattle production - Better knowledge about animal husbandry(percentages of res pondents by district)
Province DistrictMost
importantSecond most
importantThird most important
Not Mentioned
Total Respondents
Badakhshan Argo 15.22 26.09 58.70 46
Baharak 0.87 6.96 92.17 115
All 4.97 12.42 82.61 161
Balkh Chimtal 0.40 1.20 14.00 84.40 250
Dihdadi 4.35 16.52 79.13 115
Nahri Shahi 1.02 12.24 86.73 98
All 0.22 1.94 14.25 83.59 463
Kabul Bagrami 5.13 11.11 29.06 54.70 117
Musayi 1.85 2.78 20.37 75.00 108
Paghman 13.73 50.98 35.29 102
All 2.45 9.17 33.03 55.35 327
Kandahar Arghandab 35.94 50.00 14.06 64
Daman 34.52 58.33 7.14 84
Dand 36.59 48.78 14.63 41
Panjwayi 32.95 56.82 10.23 88
Zhiray 40.91 54.55 4.55 44
All 35.51 54.52 9.97 321
Logar Puli Alam 1.82 27.27 19.09 51.82 110
Nangarhar Bati Kot 16.10 16.95 22.03 44.92 118
Bihsud 6.09 18.26 32.17 43.48 115
Shewa 6.06 18.18 33.33 42.42 89
All 9.67 18.43 27.49 44.41 331
Parwan Chaharikar 5.41 12.16 25.68 56.76 74
Tutum Dara 28.47 35.04 12.41 24.09 137
All 20.38 27.01 17.06 35.55 211
Overall Average/Total
4.47 16.06 26.87 52.60 1924

236
Table A68 Improvements for cattle production - Access to credit(percentages of respondents by district)
Province DistrictMost
importantSecond most
importantThird most important
Not Mentioned
Total Respondents
Badakhshan Argo 6.52 52.17 41.30 46
Baharak 1.74 2.61 52.17 43.48 115
All 1.24 3.73 52.17 42.86 161
Balkh Chimtal 0.80 0.40 10.40 88.40 250
Dihdadi 2.61 3.48 12.17 81.74 115
Nahri Shahi 2.04 1.02 13.27 83.67 98
All 1.51 1.30 11.45 85.75 463
Kabul Bagrami 7.69 11.11 21.37 59.83 117
Musayi 14.81 2.78 10.19 72.22 108
Paghman 2.94 11.76 85.29 102
All 8.56 4.89 14.68 71.87 327
Kandahar Arghandab 4.69 95.31 64
Daman 1.19 98.81 84
Dand 2.44 97.56 41
Panjwayi 2.27 97.73 88
Zhiray 2.27 97.73 44
All 2.49 97.51 321
Logar Puli Alam 10.91 15.45 43.64 30.00 110
Nangarhar Bati Kot 14.41 15.25 31.36 38.98 118
Bihsud 13.04 7.83 44.35 34.78 115
Shewa 17.35 10.20 46.94 25.51 98
All 14.80 11.18 40.48 33.53 331
Parwan Chaharikar 21.62 12.16 35.14 31.08 74
Tutum Dara 39.42 16.79 16.79 27.01 137
All 33.18 15.17 23.22 28.44 211
Overall Average/Total
8.73 5.93 22.04 63.31 1924
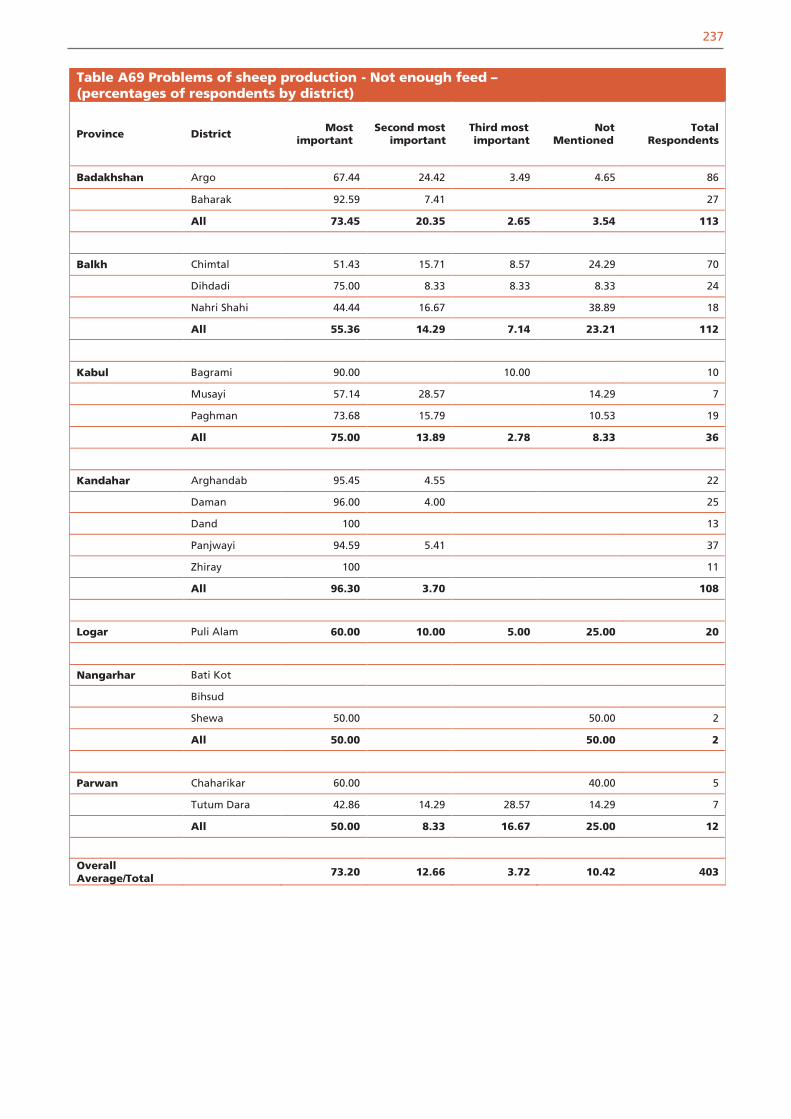
237
Table A69 Problems of sheep production - Not enough feed –(percentages of respondents by district)
Province DistrictMost
importantSecond most
importantThird most important
Not Mentioned
Total Respondents
Badakhshan Argo 67.44 24.42 3.49 4.65 86
Baharak 92.59 7.41 27
All 73.45 20.35 2.65 3.54 113
Balkh Chimtal 51.43 15.71 8.57 24.29 70
Dihdadi 75.00 8.33 8.33 8.33 24
Nahri Shahi 44.44 16.67 38.89 18
All 55.36 14.29 7.14 23.21 112
Kabul Bagrami 90.00 10.00 10
Musayi 57.14 28.57 14.29 7
Paghman 73.68 15.79 10.53 19
All 75.00 13.89 2.78 8.33 36
Kandahar Arghandab 95.45 4.55 22
Daman 96.00 4.00 25
Dand 100 13
Panjwayi 94.59 5.41 37
Zhiray 100 11
All 96.30 3.70 108
Logar Puli Alam 60.00 10.00 5.00 25.00 20
Nangarhar Bati Kot
Bihsud
Shewa 50.00 50.00 2
All 50.00 50.00 2
Parwan Chaharikar 60.00 40.00 5
Tutum Dara 42.86 14.29 28.57 14.29 7
All 50.00 8.33 16.67 25.00 12
Overall Average/Total
73.20 12.66 3.72 10.42 403

238
Table A70 Problems of sheep production - Animal disease –(percentages of respondents by district)
Province District Most important
Second most important
Third most important
Not Mentioned
Total Respondents
Badakhshan Argo 29.07 68.60 2.33 86
Baharak 7.41 85.19 7.41 27
All 23.89 72.57 3.54 113
Balkh Chimtal 28.57 25.71 32.86 12.86 70
Dihdadi 16.67 20.83 33.33 29.17 24
Nahri Shahi 33.33 44.44 11.11 11.11 18
All 26.79 27.68 29.46 16.07 112
Kabul Bagrami 10.00 70.00 20.00 10
Musayi 14.29 42.86 28.57 14.29 7
Paghman 5.26 68.42 21.05 5.26 19
All 8.33 63.89 22.22 5.56 36
Kandahar Arghandab 63.64 36.36 22
Daman 56.00 20.00 24.00 25
Dand 100 13
Panjwayi 5.41 67.57 27.03 37
Zhiray 100 11
All 1.85 71.30 21.30 5.56 108
Logar Puli Alam 15.00 50.00 5.00 30.00 20
Nangarhar Shewa 50.00 50.00 2
Parwan Chaharikar 20.00 40.00 40.00 5
Tutum Dara 42.86 42.86 14.29 7
All 25.00 33.33 16.67 25.00 12
Overall Average/Total
17.12 56.58 17.62 8.68 403
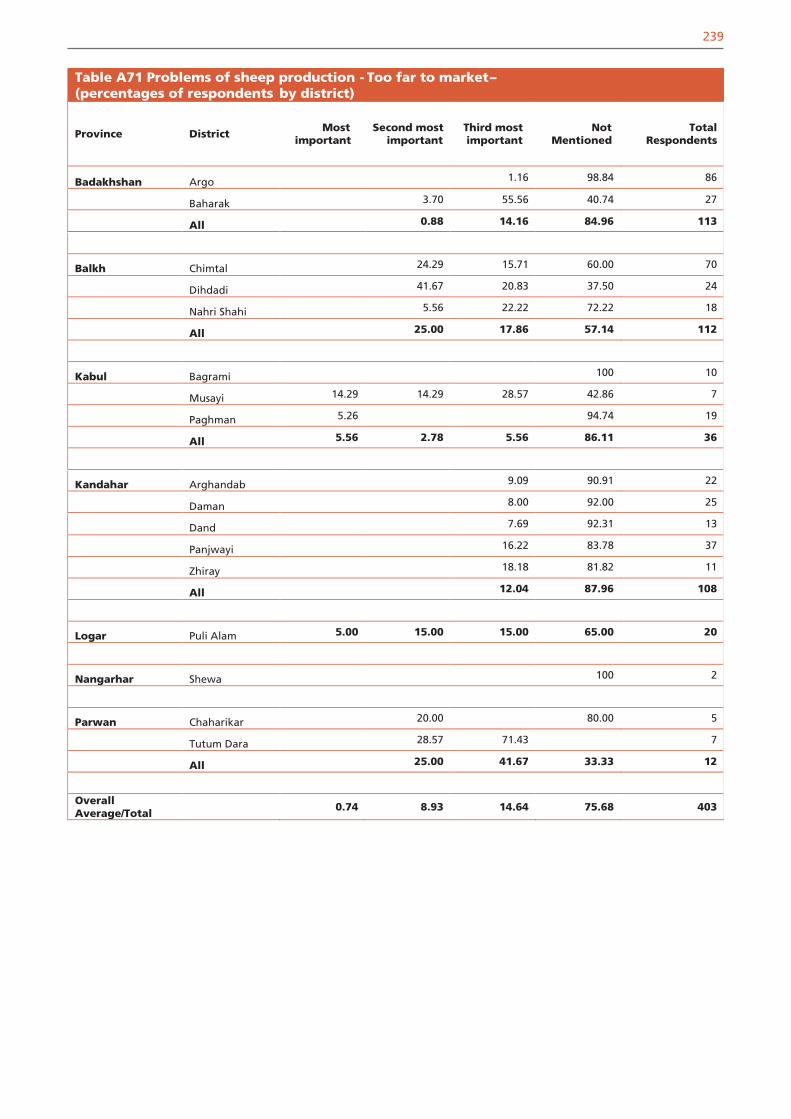
239
Table A71 Problems of sheep production - Too far to market–(percentages of respondents by district)
Province District Most important
Second most important
Third most important
Not Mentioned
Total Respondents
Badakhshan Argo 1.16 98.84 86
Baharak 3.70 55.56 40.74 27
All 0.88 14.16 84.96 113
Balkh Chimtal 24.29 15.71 60.00 70
Dihdadi 41.67 20.83 37.50 24
Nahri Shahi 5.56 22.22 72.22 18
All 25.00 17.86 57.14 112
Kabul Bagrami 100 10
Musayi 14.29 14.29 28.57 42.86 7
Paghman 5.26 94.74 19
All 5.56 2.78 5.56 86.11 36
Kandahar Arghandab 9.09 90.91 22
Daman 8.00 92.00 25
Dand 7.69 92.31 13
Panjwayi 16.22 83.78 37
Zhiray 18.18 81.82 11
All 12.04 87.96 108
Logar Puli Alam 5.00 15.00 15.00 65.00 20
Nangarhar Shewa 100 2
Parwan Chaharikar 20.00 80.00 5
Tutum Dara 28.57 71.43 7
All 25.00 41.67 33.33 12
Overall Average/Total
0.74 8.93 14.64 75.68 403

240
Table A72 Problems of sheep production -Not enough buyers-(percentages of respondents by district)
Province District Most important
Second most important
Third most important
Not Mentioned
Total Respondents
Badakhshan Argo 2.33 3.49 94.19 86
Baharak 3.70 7.41 88.89 27
All 2.65 4.42 92.92 113
Balkh Chimtal 1.43 7.14 4.29 87.14 70
Dihdadi 20.83 25.00 54.17 24
Nahri Shahi 5.56 94.44 18
All 0.89 8.93 8.93 81.25 112
Kabul Bagrami 10.00 90.00 10
Musayi 28.57 71.43 7
Paghman 10.53 89.47 19
All 2.78 11.11 86.11 36
Kandahar Arghandab 100 22
Daman 100 25
Dand 100 13
Panjwayi 100 37
Zhiray 100 11
All 100 108
Logar Puli Alam 15.00 85.00 20
Nangarhar Shewa 50.00 50.00 2
Parwan Chaharikar 20.00 80.00 5
Tutum Dara 14.29 85.71 7
All 16.67 83.33 12
Overall Average/Total 0.25 3.97 5.71 90.07 403

241
Table A73 Problems of sheep production - Too much work-(Percentages of respondents by district)
Province District Most important
Second most important
Third most important
Not Mentioned
Total Respondents
Badakhshan Argo 3.49 2.33 24.42 69.77 86
Baharak 100 27
All 2.65 1.77 18.58 76.99 113
Balkh Chimtal 18.57 2.86 1.43 77.14 70
Dihdadi 8.33 4.17 4.17 83.33 24
Nahri Shahi 16.67 83.33 18
All 16.07 2.68 1.79 79.46 112
Kabul Bagrami 30.00 70.00 10
Musayi 14.29 14.29 14.29 57.14 7
Paghman 5.26 94.74 19
All 5.56 2.78 11.11 80.56 36
Kandahar Arghandab 4.55 4.55 22.73 68.18 22
Daman 4.00 4.00 24.00 68.00 25
Dand 7.69 92.31 13
Panjwayi 2.70 2.70 94.59 37
Zhiray 18.18 81.82 11
All 1.85 2.78 13.89 81.48 108
Logar Puli Alam 10.00 10.00 10.00 70.00 20
Nangarhar Shewa 100 2
Parwan Chaharikar 20.00 40.00 40.00 5
Tutum Dara 100.00 7
All 8.33 16.67 75.00 12
Overall Average/Total 6.95 3.23 10.92 78.91 403

242
Table A74 Problems of sheep production -Cost of labor-(percentages of respondents by district)
Province District Most important
Second most important
Third most important
Not Mentioned
Total Respondents
Badakhshan Argo 2.33 65.12 32.56 86
Baharak 29.63 70.37 27
Àll 1.77 56.64 41.59 113
Balkh Chimtal 4.29 5.71 90.00 70
Dihdadi 100 24
Nahri Shahi 5.56 94.44 18
All 0.89 2.68 3.57 92.86 112
Kabul Bagrami 20.00 40.00 40.00 10
Musayi 100 7
Paghman 5.26 15.79 78.95 19
All 8.33 19.44 72.22 36
Kandahar Arghandab 4.55 95.45 22
Daman 8.00 92.00 25
Dand 23.08 76.92 13
Panjwayi 8.11 91.89 37
Zhiray 9.09 90.91 11
All 9.26 90.74 108
Logar Puli Alam 10.00 15.00 45.00 30.00 20
Nangarhar Shewa 100 2
Parwan Chaharikar 60.00 40.00 5
Tutum Dara 14.29 85.71 7
All 8.33 25.00 66.67 12
Overall Average/Total 0.99 2.73 24.07 72.21 403

243
Table A75 Improvements for sheep production - Better feeding –(percentages of respondents by district)
Province District Most important
Second most important
Third most important
Not Mentioned
Total Respondents
Badakhshan Argo 70.93 24.42 2.33 2.33 86
Baharak 92.59 7.41 27
All 76.11 20.35 1.77 1.77 113
Balkh Chimtal 77.50 15.00 3.75 3.75 80
Dihdadi 65.22 13.04 8.70 13.04 23
Nahri Shahi 100 15
All 77.97 12.71 4.24 5.08 118
Kabul Bagrami 88.89 11.11 9
Musayi 66.67 16.67 16.67 6
Paghman 94.74 5.26 19
All 88.24 5.88 2.94 2.94 34
Kandahar Arghandab 100 21
Daman 100 24
Dand 100 13
Panjwayi 94.44 5.56 36
Zhiray 100 11
All 98.10 1.90 105
Logar Puli Alam 60.00 10.00 30.00 20
Nangarhar Bati Kot 100 1
Shewa 100 1
All 50.00 50.00 2
Parwan Chaharikar 100 4
Tutum Dara 33.33 16.67 16.67 33.33 6
All 60.00 10.00 10.00 20.00 10
Overall Average/Total
82.09 11.19 2.24 4.48 402

244
Table A76 Improvements for sheep production - Better health care(percentages of respondents by district)
Province DistrictMost
importantSecond most
importantThird most important
Not Mentioned
Total Respondents
Badakhshan Argo 29.07 68.60 1.16 1.16 86
Baharak 7.41 81.48 11.11 27
All 23.89 71.68 3.54 0.88 113
Balkh Chimtal 11.25 73.75 8.75 6.25 80
Dihdadi 17.39 65.22 8.70 8.70 23
Nahri Shahi 100 15
All 11.02 75.42 7.63 5.93 118
Kabul Bagrami 11.11 44.44 11.11 33.33 9
Musayi 66.67 33.33 6
Paghman 57.89 15.79 26.32 19
All 2.94 55.88 11.76 29.41 34
Kandahar Arghandab 61.90 33.33 4.76 21
Daman 79.17 20.83 24
Dand 92.31 7.69 13
Panjwayi 5.56 61.11 33.33 36
Zhiray 81.82 9.09 9.09 11
All 1.90 71.43 24.76 1.90 105
Logar Puli Alam 30.00 30.00 10.00 30.00 20
Nangarhar Bati Kot 100 1
Shewa 100 1
All 50.00 50.00 2
Parwan Chaharikar 25.00 75.00 4
Tutum Dara 16.67 16.67 33.33 33.33 6
All 10.00 20.00 20.00 50.00 10
Overall Average/Total
12.69 67.91 11.69 7.71 402
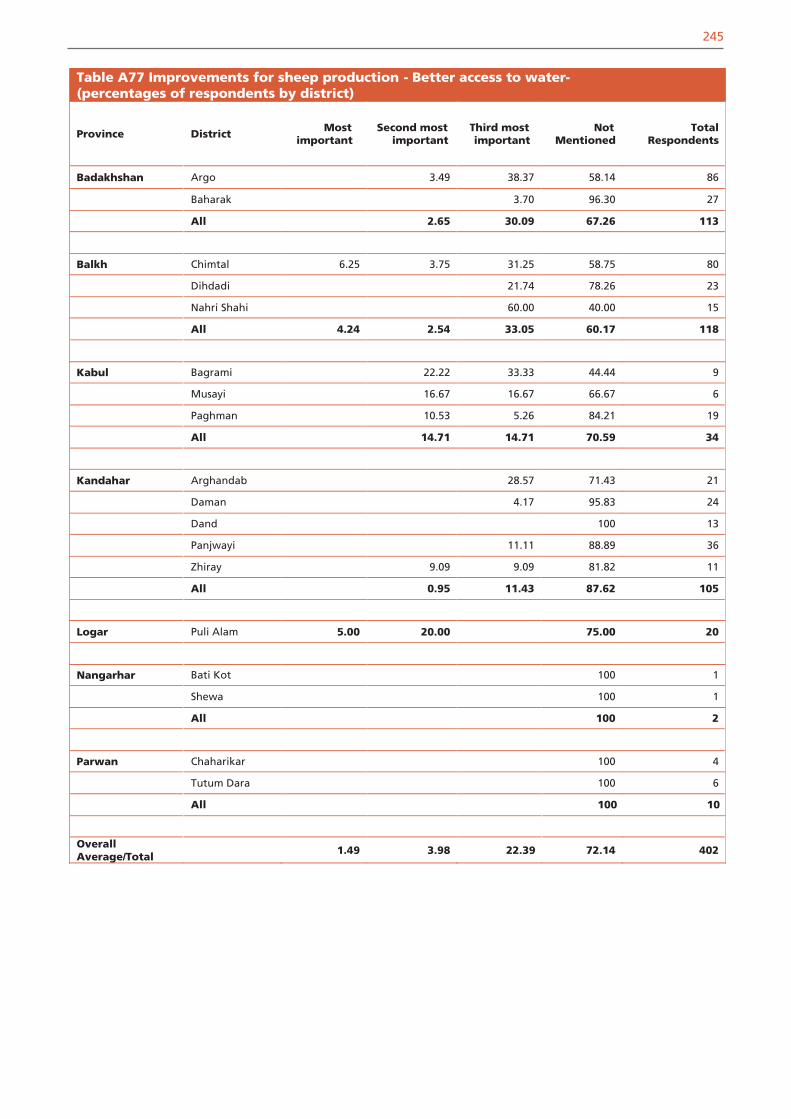
245
Table A77 Improvements for sheep production - Better access to water-(percentages of respondents by district)
Province DistrictMost
importantSecond most
importantThird most important
Not Mentioned
Total Respondents
Badakhshan Argo 3.49 38.37 58.14 86
Baharak 3.70 96.30 27
All 2.65 30.09 67.26 113
Balkh Chimtal 6.25 3.75 31.25 58.75 80
Dihdadi 21.74 78.26 23
Nahri Shahi 60.00 40.00 15
All 4.24 2.54 33.05 60.17 118
Kabul Bagrami 22.22 33.33 44.44 9
Musayi 16.67 16.67 66.67 6
Paghman 10.53 5.26 84.21 19
All 14.71 14.71 70.59 34
Kandahar Arghandab 28.57 71.43 21
Daman 4.17 95.83 24
Dand 100 13
Panjwayi 11.11 88.89 36
Zhiray 9.09 9.09 81.82 11
All 0.95 11.43 87.62 105
Logar Puli Alam 5.00 20.00 75.00 20
Nangarhar Bati Kot 100 1
Shewa 100 1
All 100 2
Parwan Chaharikar 100 4
Tutum Dara 100 6
All 100 10
Overall Average/Total
1.49 3.98 22.39 72.14 402

246
Table A78 Improvements for sheep production - Easier market access -(percentages of respondents by district)
Province DistrictMost
importantSecond most
importantThird most important
Not Mentioned
Total Respondents
Badakhshan Argo 1.16 98.84 86
Baharak 25.93 74.07 27
All 7.08 92.92 113
Balkh Chimtal 1.25 1.25 23.75 73.75 80
Dihdadi 13.04 13.04 26.09 47.83 23
Nahri Shahi 6.67 93.33 15
All 3.39 3.39 22.03 71.19 118
Kabul Bagrami 100 9
Musayi 16.67 83.33 6
Paghman 21.05 78.95 19
All 2.94 11.76 85.29 34
Kandahar Arghandab 100 21
Daman 4.17 95.83 24
Dand 100 13
Panjwayi 2.78 97.22 36
Zhiray 9.09 90.91 11
All 2.86 97.14 105
Logar Puli Alam 15.00 20.00 65.00 20
Nangarhar Bati Kot 100 1
Shewa 100 1
All 50.00 50.00 2
Parwan Chaharikar 25.00 25.00 50.00 4
Tutum Dara 33.33 66.67 6
All 10.00 30.00 60.00 10
Overall Average/Total
1.24 2.24 11.94 84.58 402

247
Table A79 Improvements for sheep production - Better knowledge about animal husbandry- (percentages of respondents by district)
Province DistrictMost
importantSecond most
importantThird most important
Not Mentioned
Total Respondents
Badakhshan Argo 2.33 15.12 82.56 86
Baharak 3.70 96.30 27
All 1.77 12.39 85.84 113
Balkh Chimtal 1.25 6.25 22.50 70.00 80
Dihdadi 17.39 82.61 23
Nahri Shahi 20.00 80.00 15
All 0.85 4.24 21.19 73.73 118
Kabul Bagrami 22.22 11.11 66.67 9
Musayi 16.67 83.33 6
Paghman 10.53 47.37 42.11 19
All 11.76 32.35 55.88 34
Kandahar Arghandab 33.33 33.33 33.33 21
Daman 20.83 66.67 12.50 24
Dand 7.69 92.31 13
Panjwayi 33.33 44.44 22.22 36
Zhiray 9.09 72.73 18.18 11
All 24.76 56.19 19.05 105
Logar Puli Alam 20.00 20.00 60.00 20
Nangarhar Bati Kot 100 1
Shewa 100 1
All 100 2
Parwan Chaharikar 50.00 25.00 25.00 4
Tutum Dara 50.00 50.00 6
All 50.00 10.00 40.00 10
Overall Average/Total
0.25 11.44 28.86 59.45 402

248
Table A80 Improvements for sheep production - Access to credit –(percentages of respondents by district)
Province DistrictMost
importantSecond most
importantThird most important
Not Mentioned
Total Respondents
Badakhshan Argo 1.16 41.86 56.98 86
Baharak 11.11 55.56 33.33 27
All 3.54 45.13 51.33 113
Balkh Chimtal 2.50 7.50 90.00 80
Dihdadi 4.35 8.70 13.04 73.91 23
Nahri Shahi 13.33 86.67 15
All 2.54 1.69 9.32 86.44 118
Kabul Bagrami 11.11 44.44 44.44 9
Musayi 16.67 50.00 33.33 6
Paghman 5.26 10.53 5.26 78.95 19
All 5.88 8.82 23.53 61.76 34
Kandahar Arghandab 4.76 4.76 90.48 21
Daman 4.17 95.83 24
Dand 100 13
Panjwayi 8.33 91.67 36
Zhiray 100 11
All 0.95 4.76 94.29 105
Logar Puli Alam 5.00 10.00 40.00 45.00 20
Nangarhar Bati Kot 100 1
Shewa 100 1
All 100 2
Parwan Chaharikar 50.00 50.00 4
Tutum Dara 50.00 16.67 16.67 16.67 6
All 30.00 10.00 30.00 30.00 10
Overall Average/Total
2.24 3.23 21.39 73.13 402

249
Table A81 Problems of goat production - Not enough feed –(percentages of respondents by district)
Province District Most important
Second most important
Third most important
Not Mentioned
Total Respondents
Badakhshan Argo 71.43 14.29 14.29 7
Baharak 25.00 75.00 4
All 54.55 36.36 9.09 11
Balkh Chimtal 42.59 20.37 5.56 31.48 54
Dihdadi 22.22 44.44 33.33 9
Nahri Shahi 44.44 11.11 44.44 9
All 40.28 22.22 4.17 33.33 72
Kabul Bagrami 50.00 50.00 2
Musayi 66.67 33.33 3
Paghman 100 1
All 16.67 50.00 33.33 6
Kandahar Arghandab 50.00 50.00 4
Daman 57.14 28.57 14.29 7
Zhiray 100 1
All 58.33 33.33 8.33 12
Nangarhar Bihsud 50.00 50.00 2
Parwan Tutum Dara 100 2
Overall Average/Total
41.90 26.67 6.67 24.76 105

250
Table A82 Problems of goat production -Animal disease –(percentages of respondents by district)
Province DistrictMost
importantSecond most
importantThird most important
Not Mentioned
Total Respondents
Badakhshan Argo 28.57 71.43 7
Baharak 75.00 25.00 4
All 45.45 54.55 11
Balkh Chimtal 31.48 22.22 25.93 20.37 54
Dihdadi 55.56 11.11 22.22 11.11 9
Nahri Shahi 33.33 44.44 11.11 11.11 9
All 34.72 23.61 23.61 18.06 72
Kabul Bagrami 50.00 50.00 2
Musayi 33.33 33.33 33.33 3
Paghman 100 1
50.00 33.33 16.67
6
Kandahar Arghandab 25.00 75.00 4
Daman 57.14 28.57 14.29 7
Zhiray 100 1
41.67 50.00 8.33 12
Nangarhar Bihsud 50.00 50.00 2
Parwan Tutum Dara 100 2
Overall Average/Total
34.29 28.57 23.81 13.33 105
All
All

251
Table A83 Problems of goat production -Too far to the market –(percentages of respondents by district)
Province DistrictMost
importantSecond most
importantNot Mentioned Total Respondents
Badakhshan Argo 100 7
Baharak 75.00 25.00 4
All 27.27 72.73 11
Balkh Chimtal 22.22 14.81 62.96 54
Dihdadi 11.11 44.44 44.44 9
Nahri Shahi 11.11 88.89 9
All 18.06 18.06 63.89 72
Kabul Bagrami 100 2
Musayi 100 3
Paghman 100 1
All 100 6
Kandahar Arghandab 100 4
Daman 100 7
Zhiray 100 1
All 100 12
Nangarhar Bihsud 50.00 50.00 2
Parwan Tutum Dara 100 2
Overall Average/Total
15.24 15.24 69.52 105

252
Table A84 Problems of goat production - Not enough buyers-(percentages of respondents by district)
Province DistrictMost
importantSecond most
importantThird most important
Not Mentioned
Total Respondents
Badakhshan Argo 100 7
Baharak 100 4
All 100 11
Balkh Chimtal 1.85 1.85 96.30 54
Dihdadi 11.11 11.11 77.78 9
Nahri Shahi 100 9
All 1.39 2.78 1.39 94.44 72
Kabul Bagrami 100 2
Musayi 100 3
Paghman 100 1
All 100 6
Kandahar Arghandab 100 4
Daman 14.29 14.29 71.43 7
Zhiray 100 1
All 8.33 8.33 83.33 12
Nangarhar Bihsud 100 2
Parwan Tutum Dara 100 2
Overall Average/Total
0.95 2.86 1.90 94.29 105

253
Table A85 Problems of goat production -Too much work –(percentages of respondents by district)
Province District Most important
Second most important
Third most important
Not Mentioned
Total Respondents
Badakhshan Argo 14.29 85.7 7
Baharak 100 4
All 9.09 90.9 11
Balkh Chimtal 24.07 1.85 74.1 54
Dihdadi 22.22 77.8 9
Nahri Shahi 11.11 11.11 77.8 9
All 22.22 2.78 75.0 72
Kabul Bagrami 50.00 50.0 2
Musayi 33.33 66.7 3
Paghman 100 1
All 33.33 66.7 6
Kandahar Arghandab 50.00 25.00 25.0 4
Daman 42.86 28.57 28.6 7
Zhiray 100 1
All 41.67 25.00 33.3 12
Nangarhar Bihsud 100 2
Parwan Tutum Dara 100 2
Overall Average/Total
20.00 1.90 5.71 72.4 105

254
Table A86 Problems of goat production -Cost of labor -(percentages of respondents by district)
Province DistrictMost
importantSecond most
importantThird most important
Not Mentioned
Total Respondents
Badakhshan Argo 14.29 85.71 7
Baharak 25.00 75.00 4
All 9.09 63.64 27.27 11
Balkh Chimtal 1.85 3.70 12.96 81.48 54
Dihdadi 11.11 11.11 77.78 9
Nahri Shahi 100 9
All 1.39 4.17 11.11 83.33 72
Kabul Bagrami 50.00 50.00 2
Musayi 100 3
Paghman 100 1
All 16.67 83.33 6
Kandahar Arghandab 100 4
Daman 28.57 71.43 7
Zhiray 100 1
All 16.67 83.33 12
Nangarhar Bihsud 100 2
Parwan Tutum Dara 100 2
Overall Average/Total
0.95 3.81 17.14 78.10 105

255
Table A87 Improvements for goat production - Better feeding-(percentages of respondents by district)
Province District Most important
Second most important
Third most important
Not Mentioned
Total Respondents
Badakhshan Argo 85.71 14.29 7
Baharak 25.00 75.00 4
All 63.64 36.36 11
Balkh Chimtal 82.09 7.46 7.46 3.0 67
Dihdadi 37.50 25.00 25.00 12.5 8
Nahri Shahi 72.73 9.09 18.2 11
All 76.74 9.30 8.14 5.8 86
Kabul Bagrami 100 2
Musayi 66.67 33.33 3
All 80.00 20.00 5
Kandahar Arghandab 100 2
Daman 100 1
Zhiray 100 1
All 100 4
Nangarhar Bihsud 100 2
Parwan Tutum Dara 100 2
Overall Average/Total 75.45 11.82 6.36 6.4 110

256
Table A88 Improvements for goat production - Better health care -(percentages of respondents by district)
Province District Most important
Second most important
Third most important
Not Mentioned
Total Respondents
Badakhshan Argo 14.29 85.71 7
Baharak 75.00 25.00 4
All 36.36 63.64 11
Balkh Chimtal 7.46 79.10 5.97 7.5 67
Dihdadi 37.50 37.50 12.50 12.5 8
Nahri Shahi 18.18 54.55 9.09 18.2 11
All 11.63 72.09 6.98 9.3 86
Kabul Bagrami 50.00 50.00 2
Musayi 33.33 66.7 3
All 20.00 40.00 40.0 5
Kandahar Arghandab 50.00 50.00 2
Daman 100 1
Zhiray 100 1
All 50.00 50.00 4
Nangarhar Bihsud 100 2
Parwan Tutum Dara 100 2
Overall Average/Total
12.73 67.27 10.91 9.1 110
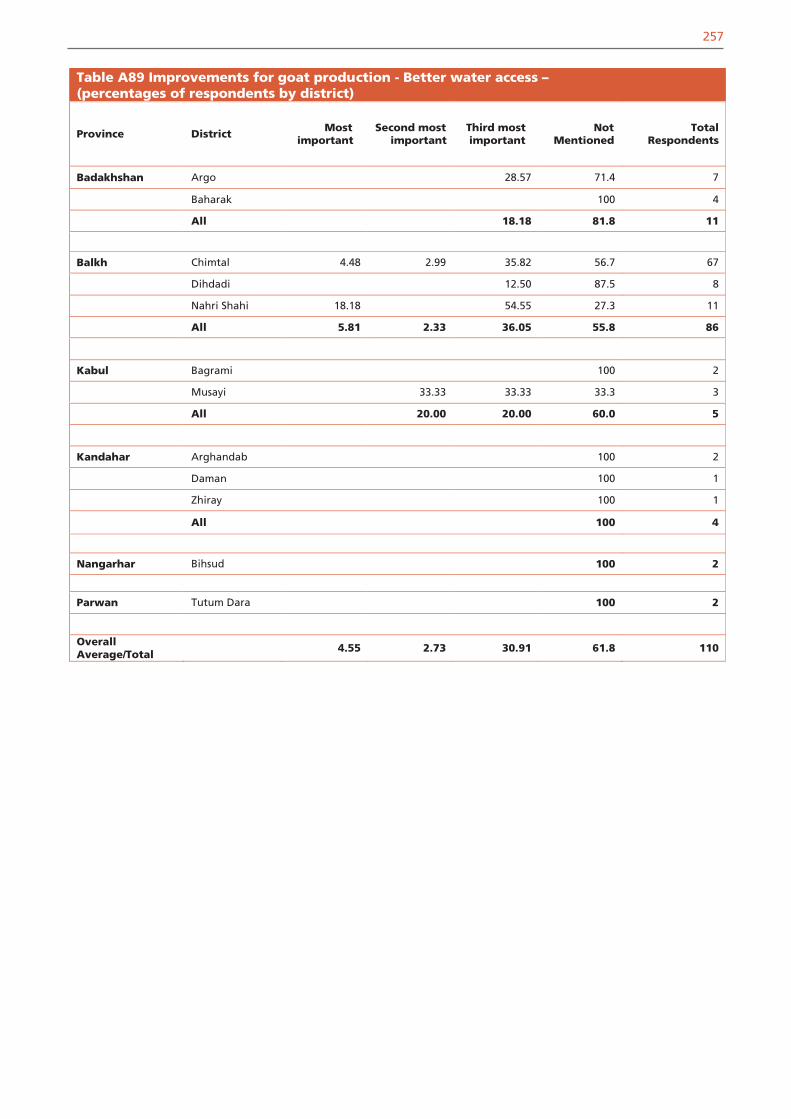
257
Table A89 Improvements for goat production - Better water access –(percentages of respondents by district)
Province District Most important
Second most important
Third most important
Not Mentioned
Total Respondents
Badakhshan Argo 28.57 71.4 7
Baharak 100 4
All 18.18 81.8 11
Balkh Chimtal 4.48 2.99 35.82 56.7 67
Dihdadi 12.50 87.5 8
Nahri Shahi 18.18 54.55 27.3 11
All 5.81 2.33 36.05 55.8 86
Kabul Bagrami 100 2
Musayi 33.33 33.33 33.3 3
All 20.00 20.00 60.0 5
Kandahar Arghandab 100 2
Daman 100 1
Zhiray 100 1
All 100 4
Nangarhar Bihsud 100 2
Parwan Tutum Dara 100 2
Overall Average/Total
4.55 2.73 30.91 61.8 110

258
Table A90 Improvements for goat production - Easier market access -(percentages of respondents by district)
Province District Most important
Second most important
Third most important
Not Mentioned
Total Respondents
Badakhshan Argo 100 7
Baharak 75.00 25.0 4
All 27.27 72.7 11
Balkh Chimtal 1.49 5.97 19.40 73.1 67
Dihdadi 12.50 12.50 25.00 50.0 8
Nahri Shahi 9.09 90.9 11
All 2.33 6.98 17.44 73.3 86
Kabul Bagrami 100 2
Musayi 100 3
All 100 5
Kandahar Arghandab 100 2
Daman 100 1
Zhiray 100 1
All 100 4
Nangarhar Bihsud 50.00 50.0 2
Parwan Tutum Dara 100 2
Overall Average/Total
1.82 5.45 17.27 75.5 110

259
Table A91 Improvements for goat production - Knowledge about animal husbandry -(percentages of respondents by district)
Province District Most important
Second most important
Third most important
Not Mentioned
Total Respondents
Badakhshan Argo 28.57 71.4 7
Baharak 100 4
All 18.18 81.8 11
Balkh Chimtal 1.49 2.99 23.88 71.6 67
Dihdadi 12.50 25.00 25.00 37.5 8
Nahri Shahi 9.09 90.9 11
All 2.33 4.65 22.09 70.9 86
Kabul Bagrami 50.00 50.0 2
Musayi 33.33 66.7 3
All 20.00 20.00 60.0 5
Kandahar Arghandab 50.00 50.0 2
Daman 100 1
Zhiray 100 1
All 50.00 25.00 25.0 4
Nangarhar Bihsud 100 2
Parwan Tutum Dara 100 2
Overall Average/Total
1.82 8.18 20.91 69.1 110

260
Table A92 Improvements for goat production - Access to credit –(percentages of respondents by district)
Province District Most important
Second most important
Third most important
Not Mentioned
Total Respondents
Badakhshan Argo 42.86 57.1 7
Baharak 25.00 75.0 4
All 36.36 63.6 11
Balkh Chimtal 1.49 4.48 94.0 67
Dihdadi 100 8
Nahri Shahi 9.09 90.9 11
All 1.16 1.16 3.49 94.2 86
Kabul Bagrami 50.00 50.0 2
Musayi 33.33 66.7 3
All 20.00 20.00 60.0 5
Kandahar Arghandab 50.00 50.0 2
Daman 100 1
Zhiray 100 1
All 25.00 75.0 4
Nangarhar Bihsud 50.00 50.0 2
Parwan Tutum Dara 100 2
Overall Average/Total
2.73 1.82 9.09 86.4 110

261
Table A93 Summary of the calculation of values of sheept by district
Obs Province District sheepπ π̂ s.e.( π̂ ) sheept
1 Badghis Qadis 2.999 4.080 14.081 2.917
2 Baghlan Baghlan 4.416 65.364 33.259 1.833
3 Baghlan Dushi 3.314 6.806 2.739 1.275
4 Baghlan Khinjan 2.441 56.969 27.280 1.999
5 Balkh Dawlat Abad 4.757 122.781 28.651 4.119
6 Bamyan Kamhard 2.420 8.214 5.649 1.026
7 Bamyan Saighan 3.639 10.179 4.391 1.489
8 Bamyan Shibar 3.686 4.650 1.417 0.680
9 Bamyan Yakawlang 4.105 12.714 7.675 1.122
10 Farah Anar Dara 1.323 7.784 4.252 1.520
11 Faryab Dawlat Abad 16.356 36.214 16.738 1.186
12 Ghazni Dih Yak 2.579 4.808 2.805 0.794
13 Ghazni Zana Khan 2.180 7.194 1.802 2.783
14 Ghor Tulak 1.448 7.520 3.535 1.718
15 Hilmand Nad Ali 7.211 1.600 0.499 -11.234
16 Hirat Ghoryan 5.195 18.320 4.676 2.807
17 Hirat Kohsan 4.807 21.778 6.193 2.741
18 Hirat Obe 2.469 11.667 3.021 3.044
19 Jawzjan Qurghan 3.522 149.517 58.110 2.512
20 Kabul Chahar Asyab 0.525 0.000 2.142 -0.245
21 Kabul City Nahya 14 0.087 2.000 0.998 1.916
22 Kapisa Hisa Awal Kohistan 1.004 6.000 4.356 1.147
23 Kunduz Dasht Archi 8.059 67.900 46.970 1.274
24 Kunduz Imam Sahib 5.670 365.900 187.843 1.918
25 Laghman Alingar 1.310 4.897 2.181 1.644
26 Logar Baraki Barak 0.475 2.710 0.818 2.732
27 Logar Charkh 0.206 1.158 0.623 1.530
28 Nangarhar Kama 1.348 0.412 0.434 -2.156
29 Nangarhar Khogyani 2.605 0.694 0.225 -8.501
30 Nangarhar Muhmand Dara 6.844 0.179 0.160 -41.685
31 Nangarhar Pachir Wa Agam 2.655 1.571 0.576 -1.882
32 Nimroz Khash Rod 2.250 25.800 8.008 2.941
33 Paktika Mata Khan 4.122 18.583 6.119 2.363
34 Paktika Sharan 3.152 65.556 27.604 2.261
35 Paktya Chamkani 0.469 11.308 4.383 2.473
36 Paktya Dandi Patan 1.249 17.526 13.933 1.168
37 Parwan Bagram 1.495 0.704 0.251 -3.158
38 Parwan Jabalusaraj 1.237 0.267 0.178 -5.465
39 Samangan Kaldar 2.443 7.719 2.078 2.539
40 Samangan Khulm 6.282 81.313 45.078 1.665
41 Sari Pul Sayed Abad 14.759 123.600 37.080 2.935
42 Takhar Ishkamish 1.754 25.400 7.839 3.017
43 Takhar Yangi Qala 2.451 37.500 20.493 1.710
44 Zabul Shahjoy 3.115 8.679 2.778 2.002
45 Zabul Shahr-e-Safa 3.801 7.217 2.477 1.379
sheepsheep
8.5. TABULAR SUMMARY STATISTICS DATA CONSISTENCY

262
Table A94 Summary of the calculation of values of goatst by district
Obs Province District goatsπ π̂ s.e.( π̂ ) goatst
1 Badghis Qadis 2.565 22.320 6.409 3.082
2 Baghlan Baghlan 0.362 14.970 4.682 3.120
3 Baghlan Dushi 3.208 9.281 4.894 1.241
4 Baghlan Khinjan 4.405 11.906 4.990 1.503
5 Balkh Dawlat Abad 1.150 18.000 3.202 5.263
6 Bamyan Kamhard 1.065 1.571 1.425 0.356
7 Bamyan Saighan 1.608 2.893 0.896 1.433
8 Bamyan Shibar 1.171 1.650 0.483 0.993
9 Bamyan Yakawlang 1.013 1.357 0.796 0.433
10 Farah Anar Dara 3.623 28.351 8.574 2.884
11 Faryab Dawlat Abad 1.336 4.179 1.362 2.087
12 Ghazni Dih Yak 0.505 1.692 0.847 1.402
13 Ghazni Zana Khan 1.878 3.000 1.208 0.929
14 Ghor Tulak 2.261 13.040 3.268 3.299
15 Hilmand Nad Ali 2.876 3.500 1.674 0.373
16 Hirat Ghoryan 3.747 10.120 2.341 2.723
17 Hirat Kohsan 2.939 28.528 8.127 3.149
18 Hirat Obe 3.528 13.041 2.522 3.772
19 Jawzjan Qurghan 0.676 11.517 3.542 3.061
20 Kabul Chahar Asyab 0.423 0.000 1.957 -0.216
21 Kabul City Nahya 14 0.049 0.250 0.250 0.804
24 Kunduz Imam Sahib 1.806 9.700 5.022 1.572
25 Laghman Alingar 4.327 2.143 1.728 -1.264
26 Logar Baraki Barak 0.152 0.968 0.359 2.275
28 Nangarhar Kama 1.385 0.412 0.199 -4.885
29 Nangarhar Khogyani 1.205 1.000 0.296 -0.694
30 Nangarhar Muhmand Dara 1.562 0.436 0.179 -6.285
31 Nangarhar Pachir Wa Agam 2.631 1.429 0.470 -2.559
32 Nimroz Khash Rod 12.796 23.250 6.475 1.614
33 Paktika Mata Khan 0.710 2.583 3.574 0.524
34 Paktika Sharan 0.574 11.944 10.606 1.072
35 Paktya Chamkani 4.738 82.000 8.903 4.087
36 Paktya Dandi Patan 9.932 33.368 21.237 1.104
39 Samangan Kaldar 2.025 4.581 1.881 1.359
40 Samangan Khulm 1.785 16.313 7.936 1.831
41 Sari Pul Sayed Abad 3.657 14.400 3.522 3.050
42 Takhar Ishkamish 1.667 23.300 16.604 1.303
43 Takhar Yangi Qala 1.151 8.400 3.890 1.863
44 Zabul Shahjoy 2.050 3.552 0.877 1.712
45 Zabul Shahr-e-Safa 3.230 4.739 3.730 0.405
goatsgoats
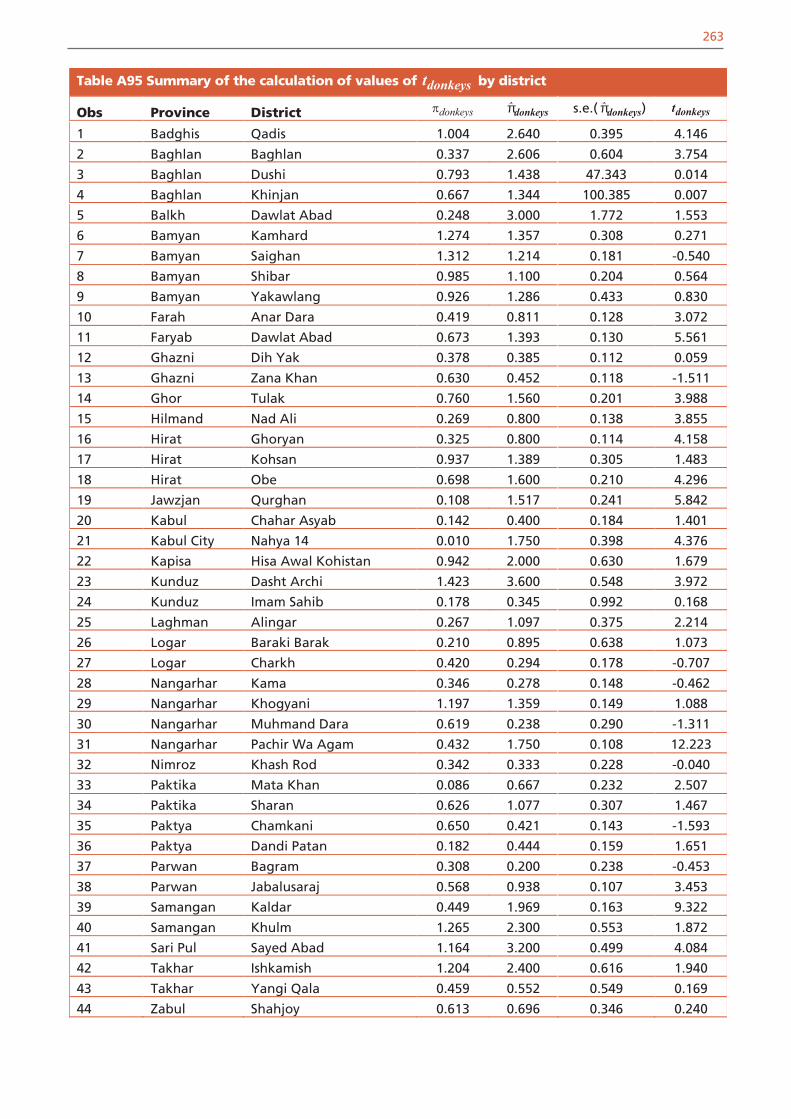
263
Table A95 Summary of the calculation of values of donkeyst by district
Obs Province District donkeysπ π̂ s.e.( π̂ ) donkeyst
1 Badghis Qadis 1.004 2.640 0.395 4.146
2 Baghlan Baghlan 0.337 2.606 0.604 3.754
3 Baghlan Dushi 0.793 1.438 47.343 0.014
4 Baghlan Khinjan 0.667 1.344 100.385 0.007
5 Balkh Dawlat Abad 0.248 3.000 1.772 1.553
6 Bamyan Kamhard 1.274 1.357 0.308 0.271
7 Bamyan Saighan 1.312 1.214 0.181 -0.540
8 Bamyan Shibar 0.985 1.100 0.204 0.564
9 Bamyan Yakawlang 0.926 1.286 0.433 0.830
10 Farah Anar Dara 0.419 0.811 0.128 3.072
11 Faryab Dawlat Abad 0.673 1.393 0.130 5.561
12 Ghazni Dih Yak 0.378 0.385 0.112 0.059
13 Ghazni Zana Khan 0.630 0.452 0.118 -1.511
14 Ghor Tulak 0.760 1.560 0.201 3.988
15 Hilmand Nad Ali 0.269 0.800 0.138 3.855
16 Hirat Ghoryan 0.325 0.800 0.114 4.158
17 Hirat Kohsan 0.937 1.389 0.305 1.483
18 Hirat Obe 0.698 1.600 0.210 4.296
19 Jawzjan Qurghan 0.108 1.517 0.241 5.842
20 Kabul Chahar Asyab 0.142 0.400 0.184 1.401
21 Kabul City Nahya 14 0.010 1.750 0.398 4.376
22 Kapisa Hisa Awal Kohistan 0.942 2.000 0.630 1.679
23 Kunduz Dasht Archi 1.423 3.600 0.548 3.972
24 Kunduz Imam Sahib 0.178 0.345 0.992 0.168
25 Laghman Alingar 0.267 1.097 0.375 2.214
26 Logar Baraki Barak 0.210 0.895 0.638 1.073
27 Logar Charkh 0.420 0.294 0.178 -0.707
28 Nangarhar Kama 0.346 0.278 0.148 -0.462
29 Nangarhar Khogyani 1.197 1.359 0.149 1.088
30 Nangarhar Muhmand Dara 0.619 0.238 0.290 -1.311
31 Nangarhar Pachir Wa Agam 0.432 1.750 0.108 12.223
32 Nimroz Khash Rod 0.342 0.333 0.228 -0.040
33 Paktika Mata Khan 0.086 0.667 0.232 2.507
34 Paktika Sharan 0.626 1.077 0.307 1.467
35 Paktya Chamkani 0.650 0.421 0.143 -1.593
36 Paktya Dandi Patan 0.182 0.444 0.159 1.651
37 Parwan Bagram 0.308 0.200 0.238 -0.453
38 Parwan Jabalusaraj 0.568 0.938 0.107 3.453
39 Samangan Kaldar 0.449 1.969 0.163 9.322
40 Samangan Khulm 1.265 2.300 0.553 1.872
41 Sari Pul Sayed Abad 1.164 3.200 0.499 4.084
42 Takhar Ishkamish 1.204 2.400 0.616 1.940
43 Takhar Yangi Qala 0.459 0.552 0.549 0.169
44 Zabul Shahjoy 0.613 0.696 0.346 0.240
donkeys donkeys

264
N
Airp
orta
ndA
irfie
ld?
Inte
rnat
iona
l
BOU
ND
ARIE
S
Prov
ince
Dis
trict
Cap
ital
% [Pr
ovin
ce# Y # S
Dis
trict
CE
NT
ER
S
RO
AD
SAl
lwea
ther
Prim
ary
Allw
eath
erSe
cond
ary
Trac
k
LEG
END
UN
Ope
ratio
nR
egio
n
AFG
HAN
ISTA
NC
apita
lReg
ion
NO
TE:
The
boun
darie
san
dna
mes
onth
em
aps
dono
tim
ply
offic
iale
ndor
sem
ento
racc
epta
nce
byth
eU
nite
dN
atio
ns.
Forf
urth
erin
form
atio
nco
ntac
tAIM
S.E-
mai
l:in
fo@
aim
s.or
g.af
Dat
e:J
une
2004
LOC
ATIO
NDI
AGR
AM
#S
#S#S
#S
#S#S
#S
#S#S#S
#S#S
#S
#S#S
#S
#S
#S#S
#S
#S
#S
#S
#S
#S
#S
#S
#S
#S
#S
#S
#S
#S
#S
#S
#S#S
#S
#S
#S
#S
#S
#S
#S#S
#S
#S
#S#S
#S
#S
#S
#S
#S
#S
#S
#S
#S#S
#S
#S
#S
#S
#S
#S
#S#S
#S
#S
#S
#S
#Y
#Y
#Y
#Y
#Y
#Y
#Y
#Y
%[
KAPI
SA
PAKT
YA
LOG
AR
NA
NG
ARH
AR
Bagr
ami
Khak
iJab
bar
Qal
eh-y
eN
a'im
Tara
khel
Suro
biPa
ghm
an
Shak
arD
arre
h
Mir
Bach
cheh
Kot
Kala
kan
Qar
ahBa
ghIs
talif
Taga
b
Alas
ay
Izza
tkhe
l
Hajik
hel Ni
jrab
Rukh
a
Syah
gerd
Qas
hqal
(Shi
nwar
i)
Bagr
am
Mol
amoh
amm
ad-k
hel
Jaba
luss
araj
Surk
hiPa
rsa
Shek
hA
li
Jalre
z
Kane
Ezz
at
Mira
n
Behs
ud
Zark
harid
Khus
hi
Char
kh
Moh
amm
adAg
ha
Azra
Dado
(Zan
aKh
an)
Doab
i
Zam
bar
Dere
Der
ang
AliK
hel
Sayi
dKa
ram
Cham
kani
Sulta
npur
Hisa
rak
Khog
yani Pa
chir
Wa
Agam
Sher
zad
LalK
hana
ba
Dawl
atSh
ah
Dush
iKh
inja
n
Anda
rab(
Banu
)
Ruyi
DuAb
Shib
ar
Jagh
atu
Chah
arQ
arya
Dara
-I-H
azar
a
Sala
ng
Chak
iWar
dak
Sayd
abad
Bara
ki
Jani
Khe
l
Lija
Man
gal
Jaji
May
dan
Alish
ing
Daha
na-I-
Gho
ri
Tala
Wa
Barfa
k
Kahm
ard
Man
dol
Gul
dara
Mus
ayi
Khur
amW
aS
arba
gh
Jagh
atu
Gha
zni
GH
AZN
I
WAR
DA
K
PAR
WA
N
BAG
HLA
N
Chah
arik
ar
Kow
t-eAs
hrow
Mah
mud
Raqi
Mih
tarla
m
Puli
Alam
Bam
yan
SAM
AN
GA
N
LAG
HM
AN
NU
RIS
TAN
Khur
amW
aSa
rbag
h
Nahr
in
Daha
na-I-
Gho
ri
Dush
i
Hisa
-I-A
wali
Pan
jshe
rRu
yiD
uAb
Anda
rab
Man
dol
Khin
jan
Tala
Wa
Barfa
k
Kahm
ard
Panj
sher
Sala
ng
Hisa
-I-D
uwum
Panj
sher
Gho
rban
dSh
inw
ari
Daw
latS
hah
Kohi
stan
Jaba
luss
araj
Koh
Band
Nijra
b
Shek
hAl
i
Chah
arik
ar
Shib
ar
Mah
mud
Raq
iAl
asay
Bagr
am
Surk
hiP
arsa
Bam
yan
Kohi
Safi
Taga
b
Alis
hing
Ista
lif
Qar
abag
h
Suro
bi
Gul
dara
Kala
kan
Hisa
-I-Aw
alBi
hsud
Dih
Sabz
Shak
arD
ara
Mir
Bach
aKo
t
Mih
tarla
m
Jalre
zQ
argh
ayi
Pagh
man
Mar
kazi
Bih
sud
Kabu
lM
ayda
nSh
ahr
Nirk
h
Bagr
ami
Surk
hR
od
Day
Mird
adKh
akiJ
abba
r
Chah
arAs
yab
Mus
ayi
Hisa
rak
Sher
zad
Muh
amm
adA
gha
Chap
arha
r
Khog
yani
Chak
Azra
Puli
Alam
Pach
irW
aAg
am
Naw
ur
Sayd
abad
Khus
hiJa
ji
Bara
kiB
arak
Jagh
atu
Lija
Man
gal
Dand
Wa
Pat
anSa
yidKa
ram
Cham
kani
Char
kh
Gar
dez
Zana
Khan
Bahr
amiS
hahi
d(J
agha
tu)
Jaji
May
dan
Jani
Khel
Ajris
tan
Bak
Saba
riDi
hYa
kM
usa
Khe
l
EAST
ER
NR
EGIO
N
CE
NTR
AL
HIG
HLA
ND
REG
ION
CA
PITA
LR
EG
ION
SOU
THEA
ST
RE
GIO
N
NO
RTH
EAS
TR
EG
ION
Khos
tWa
Firin
g
Nuris
tan
Nuris
tan
Alin
gar
Panj
ab
War
as
Shah
rista
n
Yaka
wlan
g
Dara
-I-Su
fTA
KH
ARW
arsa
j
NO
RTH
ER
NR
EG
ION
BAM
YAN
Zurm
at
KABU
L
Gard
ezG
hazn
iM
alis
tan
Ghaz
ni
KHO
ST
350
3570
105
Kilo
met
ers

265
N
Airp
orta
ndA
irfie
ld?
Inte
rnat
iona
l
BOU
ND
ARIE
S
Prov
ince
Dis
trict
Cap
ital
% [Pr
ovin
ce# Y # S
Dis
trict
CE
NT
ER
S
RO
AD
SAl
lwea
ther
Prim
ary
Allw
eath
erSe
cond
ary
Trac
k
LEG
END
UN
Ope
ratio
nR
egio
n
AFG
HAN
ISTA
NC
entra
lHig
hlan
dR
egio
n
NO
TE:
The
boun
darie
san
dna
mes
onth
em
aps
dono
tim
ply
offic
iale
ndor
sem
ento
racc
epta
nce
byth
eU
nite
dN
atio
ns.
Forf
urth
erin
form
atio
nco
ntac
tAIM
S.E-
mai
l:in
fo@
aim
s.or
g.af
Dat
e:J
une
2004
LOC
ATIO
NDI
AGR
AM
e
e
e
#S
#S
#S
#S
#S
#S
#S
#S
#S
#S
#S
#Y
BAM
YAN
Balk
hab
Tala
Wa
Barfa
k
Kahm
ard
Yaka
wlan
g
Shek
hAl
i
Shib
arSu
rkhi
Par
sa
Bam
yan
LalW
aS
arja
ngal
Hisa
-I-Aw
alBi
hsud
Mar
kazi
Bih
sud
Panj
ab
Day
Mird
adW
aras
Chak
Naw
ur
Mira
n
Bihs
ud
Zark
harid
Doab
i
Shib
ar
Yaka
wlan
g
Panj
ab
LalW
aSa
rjang
al
Tala
Wa
Barfa
k
Kohm
ard
War
as
Bam
yan
Kohi
stan
at
Day
Kund
i
Jalre
z
Dara
-I-Su
f
BAG
HLA
NSA
RIP
UL
SAM
AN
GA
N
GH
OR
UR
UZG
AN
UR
UZG
AN
GH
AZN
I
WAR
DA
K
PAR
WA
N
BAG
HLA
N
Shah
rista
n
CE
NTR
AL
HIG
HLA
ND
REG
ION
NO
THW
EST
RE
GIO
N
WES
TER
NR
EG
ION
SOU
THE
RN
RE
GIO
NC
API
TAL
RE
GIO
NNO
THE
AST
REG
ION
100
1020
3040
50K
ilom
eter
s

266
N
Airfi
elds
?
Inte
rnat
iona
l
BOU
ND
ARIE
S
Prov
ince
Dis
trict
Cap
ital
% [Pr
ovin
ce# Y # S
Dis
trict
CE
NT
ER
S
RO
AD
SAl
lwea
ther
Prim
ary
Allw
eath
erSe
cond
ary
Trac
k
LEG
END
UN
Ope
ratio
nR
egio
n
AFG
HAN
ISTA
NEa
ster
nR
egio
n
NO
TE:
The
boun
darie
san
dna
mes
onth
em
aps
dono
tim
ply
offic
iale
ndor
sem
ento
racc
epta
nce
byth
eU
nite
dN
atio
ns.
Forf
urth
erin
form
atio
nco
ntac
tAIM
S.E-
mai
l:in
fo@
aim
s.or
g.af
Dat
e:J
une
2004
LOC
ATIO
NDI
AGR
AM
350
3570
Kilo
met
ers
#S
#S
#S
#S
#S
#S
#S
#S
#S
#S
#S
#S#S#S
#S#S
#S#S
#S
#S
#S
#S#S
#S
#S
#S
#S
#S
#S
#S
#S
#S
#S
#S
#S
#S
#S
#S
#S
#S
#S
#S#S
#S
#S
#S
#S
#S
#S
#S
#S
#S
#Y
#Y
#Y#Y
Asad
abad
Jala
laba
d
Mih
tarla
m
Azra
Kam
a
Taga
b
Rukh
a
Shew
a
Nari
Asm
ar
Soru
bi
Alas
ay
Nijra
b
Lalp
ur
Gos
hta
Chaw
kay
Nurg
al
Nazy
an
Nara
ng
Dang
am
Man
dol
Shin
war
Hesa
rak
Sher
zad
Sirk
anay
Kam
desh
Alin
gar
AliK
hel
DurB
aba
Deh
Bal
aSr
aKa
la
Khog
yani
Man
oG
ai
Alish
ing
Mar
awar
a
Sulta
nP
ur
Chap
arha
r
Khas
Kuna
r
Way
gal(
1)
Chap
aD
ara
Dara
-I-Nu
r
Dawl
atSh
ah
Barg
iMat
al
Muh
man
dD
ara
LalK
hana
bad
Chah
arQ
arya
Dara
-I-H
azar
a
Pach
irW
aAg
am
Nade
rSha
hK
owt
Kura
nW
aM
unja
nKh
ostW
aFi
ring
Shah
iKot
(Sar
Shah
iKot
)
Man
dol
Wam
a
Anda
rab
Kura
nW
aM
unja
n
Azra
Barg
iMat
al
Nari
Khos
tWa
Firin
g
Suro
bi
Jaji
Nuris
tan
Kam
desh
Roda
t
Alin
gar
Qar
ghay
i
Way
gal
Pech
Hisa
-I-A
wali
Pan
jshe
r
Nijra
b
Hisa
rak
Achi
n
Taga
b
Panj
sher
LalP
ur
Kohi
Safi
Alis
hing
Daw
latS
hah
Asad
abad
Sher
zad
Dih
Bala
BarK
unar
Gos
hta
Khog
yani
Mih
tarla
m
Nurg
al
Khak
iJab
bar
DurB
aba
Kam
a
Chap
aD
ara
Dang
amAl
asay
Surk
hR
od
Kuz
Kuna
r
Hisa
-I-D
uwum
Panj
sher
Nara
ng
Chaw
kay Kh
asK
unar
Sirk
anay
Dara
-I-N
ur
Shin
war
Bati
Kot
Pach
irW
aAg
amChap
arha
r
Mar
awar
a
Jala
laba
d
Koh
Band
Muh
man
dD
ara
Nazy
an
Mah
mud
Raq
i
NU
RIS
TAN
KUN
AR
NA
NG
ARH
AR
LAG
HM
AN
BAD
AK
HS
HA
N
TAKH
AR
BAG
HLA
N
PAR
WA
N
KAPI
SA
KABU
L
PAKT
YA
SOU
THEA
ST
RE
GIO
N
CA
PITA
LR
EG
ION
NO
RTH
EAS
TR
EG
ION
EAST
ER
NR
EGIO
N
PAR
WA
N
Wam
a
Nuris
tan
(Lok
ar)
PAK
I
ST
A
N
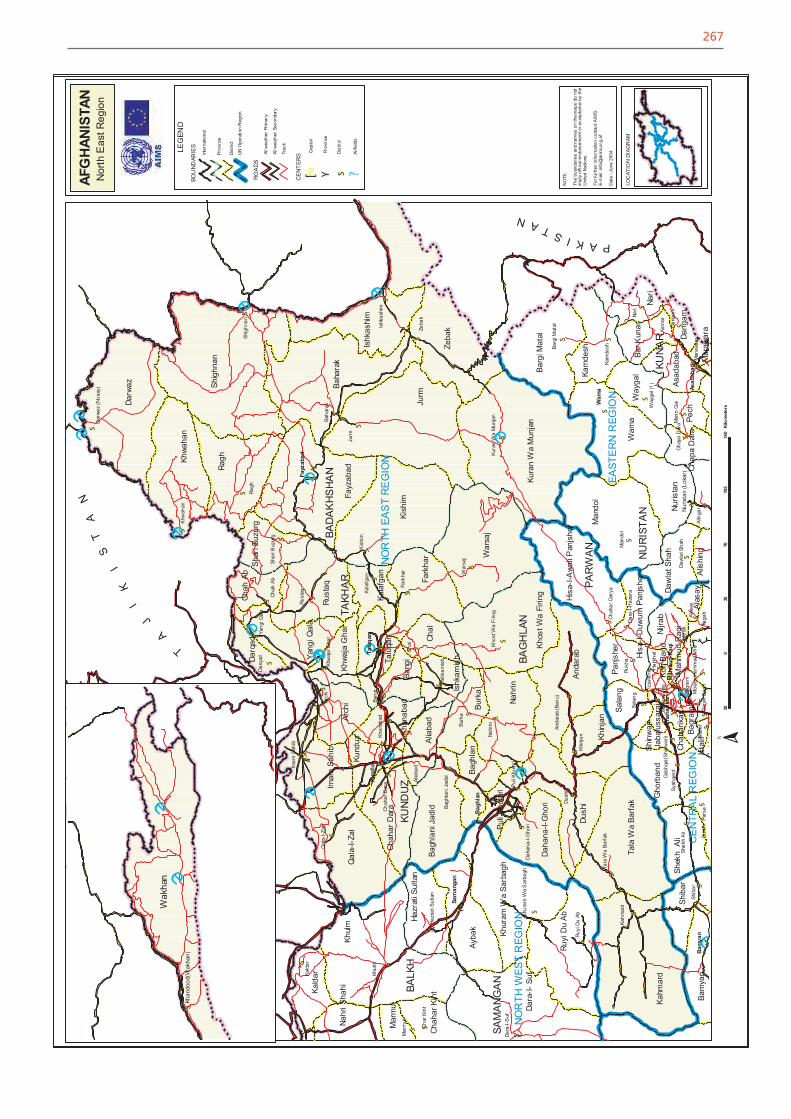
267
N
Airfi
elds
?
Inte
rnat
iona
l
BOU
ND
ARIE
S
Prov
ince
Dis
trict
Cap
ital
% [Pr
ovin
ce# Y # S
Dis
trict
CE
NT
ER
S
RO
AD
SAl
lwea
ther
Prim
ary
Allw
eath
erSe
cond
ary
Trac
k
LEG
END
UN
Ope
ratio
nR
egio
n
AFG
HAN
ISTA
NN
orth
Eas
tReg
ion
NO
TE:
The
boun
darie
san
dna
mes
onth
em
aps
dono
tim
ply
offic
iale
ndor
sem
ento
racc
epta
nce
byth
eU
nite
dN
atio
ns.
Forf
urth
erin
form
atio
nco
ntac
tAIM
S.E-
mai
l:in
fo@
aim
s.or
g.af
Dat
e:J
une
2004
LOC
ATIO
NDI
AGR
AM
350
3570
105
140
Kilo
met
ers
e
ee
eee
e
e
e
e
e
e
e
e
e
e
#S#S
#S#S
#S#S
#S
#S
#S#S
#S
#S
#S
#S
#S#S
#S
#S#S
#S
#S
#S
#S
#S
#S
#S
#S
#S
#S
#S
#S#S
#S
#S
#S
#S
#S
#S
#S
#S
#S
#S
#S
#S
#S #S
#S
#S
#S
#S
#S
#S
#S
#S
#S
#S
#S
#S
#S
#S
#S
#S
#S
#S
#S
#S
#S#S
#S#S
#S
#S
#S
#S
#S
#S
#S
#S
#S
#S
#Y
#Y
#Y
#Y
#Y
#Y
#Y#Y
#Y
#Y
Kund
uz
Bam
yan
Bagh
lan
Talu
qan
Sam
anga
n
Fayz
abad
Asad
abad
Chah
arik
arM
ahm
udRa
qi
Wam
a
Ragh
Chal
Jurm
Taga
b
Rukh
aNa
ri
Asm
ar
Dush
i
Zeba
k
Bang
i
Burk
a
Arch
i
Khul
m
Alas
ayNi
jrab
Bagr
am
War
saj
Nahr
in
Shib
ar
Kish
im
Sala
ng
Dang
am
Rust
aq
Darq
ad
Kald
ar
Man
dol
Mar
mul
Ista
lef
Kam
desh
Khw
ahan
Baha
rak
Chah
Ab
Fark
har
Khin
jan
Alia
bad
Alin
gar
Kahm
ard
Hajik
hel
Syah
gerd
Man
oG
ai
Kala
fgan
Shig
hnan
Khan
abad
Mar
awar
a
Izza
tkhe
l
Ishk
ashi
m
Ishk
amis
h
Char
Kint
Qar
ahBa
gh
Shek
hA
li
Qal
a-I-Z
al
Ruyi
DuAb
Yang
iQal
a
Imam
Sahi
b
Dara
-I-S
uf
Way
gal(
1)
Chap
aD
ara
Dawl
atSh
ah
Puli
Khum
ri
Barg
iMat
al
Khw
aja
Gha
r
Chah
arD
ara
Jaba
luss
araj
Chah
arQ
arya
Surk
hiPa
rsa
Shar
iBuz
urg
Dara
-I-H
azar
a
Anda
rab(
Banu
)
Daha
na-I-
Gho
ri
Tala
Wa
Barfa
k
Hazr
atiS
ulta
n
Bagh
lani
Jadi
d
Kura
nW
aM
unja
n
Dar
waz
(Nus
ay)
Khos
tWa
Firin
g
Qas
hqal
(Shi
nwar
i)
Mol
amoh
amm
ad-k
hel
Khur
amW
aS
arba
gh
Jurm
Khul
m
Shig
hnan
Kish
im
War
saj
Darw
az
Kahm
ard
Dara
-I-Su
f
Baha
rak
Ragh
Man
dol
Zeba
k
Fayz
abad
Dush
i
Wam
a
Anda
rab
Nahr
in
Kura
nW
aM
unja
n
Ayba
k
Rust
aq
Bam
yan
Khwa
han
Qal
a-I-Z
al
Ruyi
Du
Ab
Fark
har
Tala
Wa
Barfa
k
Arch
i
Shib
ar
Barg
iMat
al
Nari
Khin
jan
Khos
tWa
Firin
g
Ishk
ashi
m
Nahr
iSha
hi
Burk
a
Imam
Sahi
b
Gho
rban
d
Kald
ar
Nuris
tan
Chal
Kam
desh
Khur
amW
aSa
rbag
h
Chah
arKi
ntBa
ghla
niJa
did
Yang
iQal
a
Bang
iTalu
qan
Way
gal
Pech
Hisa
-I-A
wali
Pan
jshe
r
Alia
bad
Chah
arD
ara
Nijra
b
Bagh
lan
Sala
ng
Shek
hAl
i
Daha
na-I-
Gho
ri
Kund
uz
Panj
sher
Kala
fgan
Hazr
atiS
ulta
n
Chah
Ab Alis
hing
Khan
abad
Daw
latS
hah
Asad
abad
Shar
iBuz
urg
BarK
unar
Darq
ad
Ishk
amis
h
Puli
Khum
ri
Khwa
jaG
har
Mar
mul
Bagr
am
Shin
war
i
Chap
aD
ara
Dang
amAl
asay
Hisa
-I-D
uwum
Panj
sher
Chah
arik
ar
Ista
lifM
araw
ara
Koh
Band
Gul
dara
Jaba
luss
araj
Mah
mud
Raq
i
Kl
k
BAG
HLA
NTAKH
AR
KUN
DU
Z
NO
RTH
WES
TR
EGIO
N
CE
NTR
AL
REG
ION
EAST
ER
NR
EGIO
N
NO
RTH
EAS
TR
EG
ION
BAD
AK
HS
HA
N
BALK
H
NU
RIS
TAN
PAR
WA
N
KUN
AR
SAM
AN
GA
N
Nur
ista
n(L
okar
)
e
e
#S
Wak
han
Khan
dood
(Wak
han)
TA
J
IK
IS
TA
N
PAKISTAN

268
N
Airfi
elds
?
Inte
rnat
iona
l
BOU
ND
ARIE
S
Prov
ince
Dis
trict
Cap
ital
% [Pr
ovin
ce# Y # S
Dis
trict
CE
NT
ER
S
RO
AD
SAl
lwea
ther
Prim
ary
Allw
eath
erSe
cond
ary
Trac
k
LEG
END
UN
Ope
ratio
nR
egio
n
AFG
HAN
ISTA
NN
orth
Wes
tReg
ion
NO
TE:
The
boun
darie
san
dna
mes
onth
em
aps
dono
tim
ply
offic
iale
ndor
sem
ento
racc
epta
nce
byth
eU
nite
dN
atio
ns.
Forf
urth
erin
form
atio
nco
ntac
tAIM
S.E-
mai
l:in
fo@
aim
s.or
g.af
Dat
e:J
une
2004
LOC
ATIO
NDI
AGR
AM
e
ee
e
e
e
#S
#S
#S
#S
#S
#S
#S
#S
#S
#S
#S
#S
#S
#S
#S
#S
#S
#S
#S
#S
#S#S
#S
#S
#S
#S
#S
#S
#S#S
#S
#S
#S#S
#S
#S
#S
#S
#S
#S
#S
#S
#S#S
#S
#S
#S
#S
#Y
#Y#Y
#Y
#Y
#Y
TAJI
KIS
TAN
UZB
EK
ISTA
NTU
RK
ME
NIS
TAN
BALK
H
FAR
YAB
SAR
IPU
L
JAW
ZJA
N
SAM
AN
GA
N
WES
TER
NR
EG
ION
CE
NTR
AL
HIG
HLA
ND
NO
RTH
EAS
TR
EG
ION
NO
RTH
WES
TR
EGIO
N
Qal
`a
Alm
ar
Aqch
a
Khul
m
Balk
h
Tukz
ar
Shib
ar
Jaw
and
Kald
ar
Qay
sar
Darz
ab
Mar
mul
Sayy
ad
Mar
dyan
Kham
yab
Dihd
adi
Chim
tal
Andk
hoy
Kahm
ard
Qar
amqu
l
Man
gajik
Shol
gara
Shor
Tepa
Faze
laba
d
Qar
qin(
1)
Yaka
wlan
g
Chah
arKi
nt
Kish
indi
h
Shek
hA
li
Qal
a-I-Z
al
Ruyi
DuAb
Dawl
atab
ad
Char
Bola
k
Bilch
iragh
Dowl
atab
ad
Dara
-I-S
uf
Sozm
aQ
ala
Nahr
iSha
hi
Pash
tun
Kot
Shiri
nTa
gab
Khw
aja
Du
Koh
Daha
na-I-
Gho
ri
Tala
Wa
Barfa
k
Hazr
atiS
ulta
n
Balk
hab(
Tark
hoj)
LalW
aSa
rjang
al
Khur
amW
aS
arba
gh
Khan
iCha
harB
agh
Kohi
stan
at(P
asni
)
Jawa
nd
Chag
hcha
ran
Kohi
stan
at
Khul
m
Yaka
wlan
g
Kahm
ard
Balk
hab
Dara
-I-Su
f
Qay
sar
Sari
Pul
Alm
ar
Dush
iBi
lchi
ragh
Kohi
stan
Shib
irgha
n
Ayba
k
Kish
indi
h
Daw
lata
bad
Bam
yan
Qal
a-I-Z
al Jalre
z
Qar
qin
Ruyi
Du
Ab
LalW
aS
arja
ngal
Darz
ab
Tala
Wa
Barfa
k
Chim
tal
Shiri
nTa
gab
Shol
gara
Sayy
ad
Shib
ar
Aqch
a
Shor
tepa
Qar
amqo
lNa
hriS
hahi
Sang
char
ak
Kald
ar
Khwa
jaD
uKo
h
Min
gajik
Khur
amW
aSa
rbag
h
Chah
arKi
nt
Bagh
lani
Jadi
d
Mar
dyan
Chah
arD
ara
Pash
tun
Kot
Shek
hAl
i
Balk
h
Daha
na-I-
Gho
ri
Kham
yab
Andk
hoy
Hazr
atiS
ulta
n
Surk
hiP
arsa
Khwa
jaS
abz
Sozm
aQ
ala
P
Mar
mul
May
man
aKhan
iCha
harB
agh
Hisa
-I-Aw
alBi
hsud
Dihd
adi
Chah
arBo
lak
Maz
ariS
harif
GH
OR
BAD
GH
IS
BAM
YAN
BAG
HLA
N
KUN
DU
Z
Ayba
k
Maz
ariS
harif
Shib
irgha
n
May
man
a
Bam
yan
Sari
Pul
Daw
lata
bad
Fayz
abad
Mar
kazi
Bih
sud
Panj
ab
350
3570
105
Kilo
met
ers

269
N
Airp
orta
ndA
irfie
ld?
Inte
rnat
iona
l
BOU
ND
ARIE
S
Prov
ince
Dis
trict
Cap
ital
% [Pr
ovin
ce# Y # S
Dis
trict
CE
NT
ER
S
RO
AD
S
Allw
eath
erPr
imar
y
Allw
eath
erSe
cond
ary
Trac
k
LEG
END
UN
Ope
ratio
nR
egio
n
AFG
HAN
ISTA
NSo
uth
East
Reg
ion
NO
TE:
The
boun
darie
san
dna
mes
onth
em
aps
dono
tim
ply
offic
iale
ndor
sem
ento
racc
epta
nce
byth
eU
nite
dN
atio
ns.
Forf
urth
erin
form
atio
nco
ntac
tAIM
S.E-
mai
l:in
fo@
aim
s.or
g.af
Dat
e:J
une
2004
LOC
ATIO
NDI
AGR
AM
e
e
e
ee
e
e
e
#S#S
#S
#S
#S
#S
#S#S
#S
#S
#S
#S
#S
#S
#S
#S
#S
#S
#S
#S#S
#S
#S
#S
#S
#S
#S
#S
#S
#S
#S#S#S
#S
#S
#S
#S
#S
#S
#S
#S
#S#S
#S
#S
#S
#S
#S #S
#S
#S
#S
#S
#S
#S
#S
#S
#S
#S#S
#S
#S
#S
#S
#S
#S
#S
#S
#S
#S
#S
#S
#S
#S
#S
#Y
#Y
#Y
#Y
#Y
#Y
Khak
iJab
bar
Kane
Ezz
at
Mira
n
Behs
ud
Khos
hi
Char
kh
Moh
amm
adAg
ha
Azra
Dado
(Zan
aKh
an)
Ram
ak
Doab
i
Sang
iMas
ha(J
aghu
ri)
Qar
abag
h
Moq
ur
Hajik
hel
Miri
(And
ar)
Pana
Nawa
Dila
Om
naUr
gun
Nika
SarH
awza
Sper
aZe
rok
Alaq
adar
i
Dadw
alZam
bar
Tere
zai
Dere
Der
ang
Tani
Shek
ham
irKa
lay
Kapa
ray
Khos
tMel
a
AliK
hel
Shw
ak
Sham
al
Seyy
edKa
ram
Cham
kani
Mot
akha
n
Deh
Bal
a
Hisa
rak
Khog
yani
Pach
irW
aAg
am
Sher
zad
Mar
uf
Saya
gaz
Day
Cho
pan
Hoku
mat
eSh
inka
y
Atgh
ar
Sang
ar
Mal
ista
n
Gel
an
Shah
Joy
Sham
ulza
yi
Khas
Uru
zgan
Chak
iWar
dak
Sayd
abad
Bara
ki
Jani
Khe
l
Gom
al
Jadr
an
Laja
man
gal
Zurm
at
Waz
aK
hwa
Wor
Mam
ay
Gay
an
Barm
alSa
robi
Mus
aK
hel
Jaji
May
dan
Bak
War
as
Mus
ayi
Jagh
atuy
iGha
zni
Mar
kazi
Bih
sud
y
Nirk
h
Jala
laba
dSu
rkh
Rod
Day
Mird
ad
Khak
iJab
bar
Chah
arAs
yab
Mus
ayi
Hisa
rak
Sher
zad
War
asM
uham
mad
Agh
a
Chap
arha
r
Khog
yani
Chak
Azra
Puli
Alam
Pach
irW
aAg
amNa
wur
Dih
Bala
Sayd
abad
Khus
hi
Jaji
Shah
rista
n
Bara
kiB
arak
Jagh
atu
Lija
Man
gal
Dand
Wa
Pat
anSa
yidKa
ram
Cham
kani
Char
kh
Gar
dez
Zana
Khan
Giz
ab
Jaji
May
dan
Jani
Khel
Ajris
tan
Bak
Saba
riG
hazn
i
Zurm
at
Dih
Yak
Mus
aK
hel
Mal
ista
nQ
alan
dar
Jadr
anTe
reZa
yiSh
wak
Nadi
rSha
hKo
t
Anda
r
Khos
t(Mat
un)
Jagh
uri
Qar
abag
hM
ata
Kha
n
Shar
an
Sham
al
Khas
Uru
zgan
Gur
buz
Sper
aTa
niNi
kaZi
ruk
SarH
awza
Giro
Muq
urUr
gun
AbBa
nd
Gay
an
Om
na
Argh
anda
b
Zarg
hun
Shah
r
Barm
al
Gom
al
Gel
an
Saro
bi
Dila
Shah
joy
Naw
a
Waz
aKh
wa
Qal
at
Wor
Mam
ay
Shin
kay
Sham
ulza
yiAt
ghar
Shar
anW
olus
wal
i
Ghaz
ni
Khos
t(M
atun
)
Gard
ez
Qala
t
SOU
THEA
ST
RE
GIO
N
SOU
THE
RN
RE
GIO
N
CE
NTR
AL
HIG
HLA
ND
REG
ION
BAM
YAN
UR
UZG
AN
ZABU
L
GH
AZN
I
PAKT
IKA
PAKT
YA
KHO
ST
LOG
AR
WAR
DA
K
NA
NG
ARH
AR
Puli
Alam
EAST
ER
NR
EGIO
N
KAN
DAH
AR M
aruf
Argh
ista
n
CA
PITA
LR
EG
ION
Jagh
atu
Tarn
akW
aJa
ldak
Miz
an
250
2550
7510
0K
ilom
eter
s
P
A
K
I
S
T
A
N

270
N
Airp
orta
ndA
irfie
ld?
Inte
rnat
iona
l
BOU
ND
ARIE
S
Prov
ince
Dis
trict
Cap
ital
% [Pr
ovin
ce# Y # S
Dis
trict
CE
NT
ER
S
RO
AD
SAl
lwea
ther
Prim
ary
Allw
eath
erSe
cond
ary
Trac
k
LEG
END
UN
Ope
ratio
nR
egio
n
AFG
HAN
ISTA
NSo
uthe
rnR
egio
n
NO
TE:
The
boun
darie
san
dna
mes
onth
em
aps
dono
tim
ply
offic
iale
ndor
sem
ento
racc
epta
nce
byth
eU
nite
dN
atio
ns.
Forf
urth
erin
form
atio
nco
ntac
tAIM
S.E-
mai
l:in
fo@
aim
s.or
g.af
Dat
e:J
une
2004
LOC
ATIO
NDI
AGR
AM
eeee
e
ee
e
ee
e
ee
ee
e
e
ee
e
#S
#S
#S
#S#S
#S
#S
#S
#S#S
#S
#S
#S#S
#S
#S
#S
#S#S
#S
#S
#S
#S#S
#S#S
#S#S
#S #S
#S
#S
#S
#S
#S
#S#S #S
#S
#S#S
#S
#S
#S
#S
#S
#S
#S
#S
#S
#S
#S
#S
#S
#S
#S
#S
#S
#S
#S
#S
#S
#S
#S
#S
#S
#S #S
#S
#S#S
#S
#S#S
#S#S
#S
#S
#S
#S
#S
#S
#S
#S
#S
#S
#S
#S
#S
#S
#Y
#Y#Y
#Y
#Y
#Y
#Y
#Y
HIL
MA
ND
KAN
DAH
AR
UR
UZG
AN
FAR
AH
GH
OR
NIM
RO
Z
ZABU
L
Behs
ud
Zark
harid
Doab
i
Sang
iMas
ha(J
aghu
ri)Q
arab
agh
Muq
ur
Hajik
hel
Nawa
Dila
Khak
iSaf
id
Sulta
niBa
kwa
Bala
Bulu
k
Kang
Chak
hans
ur
Lokh
i
Chah
arBu
rjak
Giri
shk
Sang
in
Mus
aQ
ala
Kaja
ki
Bagh
ran
Dish
u
Khak
rez
Gho
rak
Argh
anda
b
Mar
uf
Saya
gaz
Dayc
hopa
n
Shin
kay At
ghar
Dihr
awud
Khes
raw
Sang
ar
Kijra
n
Yaka
wlan
g
Panj
ab
Injil
Guz
ara
Pash
tun
Zarg
hun
Gho
ryan
Obe
Chis
htiS
harif
Karu
kh
Zind
aJa
n
Kohs
an
Adra
skan
Shin
dand
Fars
i
Anar
Dara
Qal
a-I-K
ah
Gul
ista
n
Purc
ham
an
Lash
Wa
Juw
ayn
Shah
rak
Sagh
ar
Tula
k
Tayw
ara
LalW
aSa
rjang
al
Pasa
band
Mal
ista
n
Gel
an
Khan
ishi
n
Naw
Zad
Was
her
Gar
mse
r
Nad
Ali Na
wa-I-
Bar
akza
yi
Spin
Bold
ak
Dam
anAr
ghis
tan
Shor
abak
Panj
way
iM
ayw
and
Shah
Wal
iKot
Jald
ak
Miz
an
Shah
Joy
Sham
ulza
yi
Nesh
Khas
Uru
zgan
Day
Kund
i
Chor
a
Giza
b
War
as
Shah
idiH
assa
s
Reg
Shib
Koh
Push
tRod
Jagh
atuy
iGha
zni
Jawa
ndKu
shki
Kuh
naCh
aghc
hara
nQ
adis
Shib
arBa
mya
nLa
lWa
Sar
jang
alKo
hsan
Hisa
-I-Aw
alBi
hsud
Zind
aJa
nIn
jil
Karu
kh
Mar
kazi
Bih
sud
Panj
ab
Obe
Chis
htiS
harif
Shah
rak
Gho
ryan
Day
Kund
iPa
shtu
nZa
rghu
n
Hira
t
War
asG
uzar
aTu
lak
Fars
i
Naw
urAd
rask
an
Pasa
band
Shah
rista
n
Jagh
atu
Sagh
arG
izab
Ajris
tan
Tayw
ara
Shin
dand
Kijra
nM
alis
tan
Anar
Dar
aPu
rCha
man
Jagh
uri
Qar
abag
h
Bagh
ran
Chor
aKh
asU
ruzg
an
Shah
idiH
assa
s
Bala
Bulu
k
Muq
ur
Dayc
hopa
n
AbBa
ndG
ulis
tan
Argh
anda
bZ
Tirin
Kot
Dihr
awud
Mus
aQ
ala
Gel
an
Naw
Zad
Khak
iSaf
edDi
la
Kaja
kiSh
ahjo
yNa
wa
Nesh
Push
tRod
Qal
a-I-K
ah
Bakw
aQ
alat
Shah
Wal
iKot
Was
her
Fara
hM
izan
Gho
rak
Khak
rez
Sang
in
Khas
hR
od
Shib
Koh
Tarn
akW
aJa
ldak
Shin
kay
Sham
ulza
yiNa
hriS
arra
jLa
shW
aJu
way
n
Chak
hans
urAt
ghar
Argh
anda
bM
aywa
nd
Dam
an
Argh
ista
nNa
dAl
i
Panj
way
i
Mar
uf
Kand
ahar
Lash
karG
ahKa
ngNa
wa-
i-Bar
akza
yi
Spin
Bold
ak
Reg
Gar
mse
r
Zara
nj
Chah
arBu
rjak
Reg
Shor
abak
Dish
u
Lash
karG
ah
Qala
t
Tirin
Kot
Fara
h
Zara
nj
Kand
ahar
Chag
hcha
ran
HIR
AT
SOU
THE
RN
RE
GIO
N
WES
TER
NR
EG
ION
SOU
THEA
ST
RE
GIO
N
CE
NTR
AL
HIG
HLA
ND
REG
ION
BAM
YAN
GH
AZN
I
BAD
GH
ISYa
kawl
ang
250
2550
7510
012
5K
ilom
eter
s
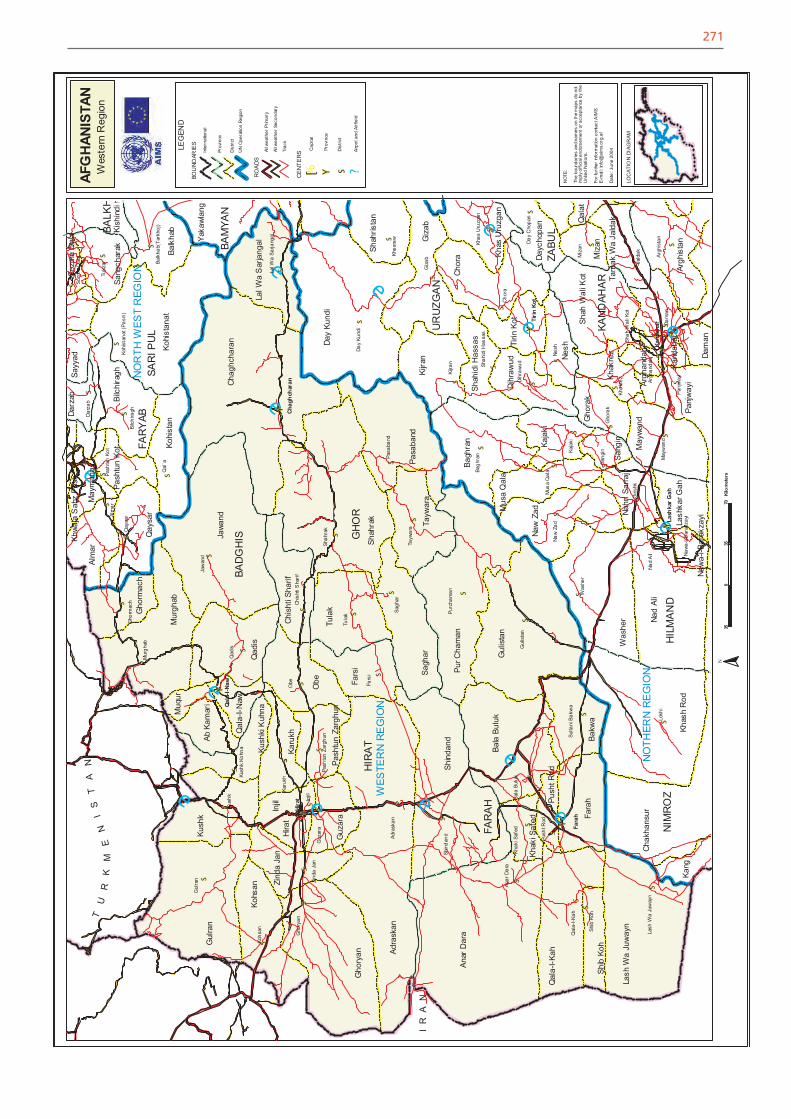
271
N
Airp
otan
dA
irfie
ld?
Inte
rnat
iona
l
BOU
ND
ARIE
S
Prov
ince
Dis
trict
Cap
ital
% [Pr
ovin
ce# Y # S
Dis
trict
CE
NT
ER
S
RO
AD
SAl
lwea
ther
Prim
ary
Allw
eath
erSe
cond
ary
Trac
k
LEG
END
UN
Ope
ratio
nR
egio
n
AFG
HAN
ISTA
NW
este
rnR
egio
n
NO
TE:
The
boun
darie
san
dna
mes
onth
em
aps
dono
tim
ply
offic
iale
ndor
sem
ento
racc
epta
nce
byth
eU
nite
dN
atio
ns.
Forf
urth
erin
form
atio
nco
ntac
tAIM
S.E-
mai
l:in
fo@
aim
s.or
g.af
Dat
e:J
une
2004
LOC
ATIO
NDI
AGR
AM
350
3570
Kilo
met
ers
TU
RK
ME
NI
ST
AN
IR
AN
e
e
eee
e
e
e
ee
e
e
ee
#S
#S
#S
#S
#S#S
#S
#S
#S
#S
#S
#S#S
#S
#S
#S#S
#S
#S#S
#S
#S
#S
#S
#S
#S
#S#S
#S
#S
#S
#S#S
#S
#S
#S
#S
#S
#S
#S
#S
#S
#S
#S
#S
#S
#S
#S
#S
#S
#S
#S
#S
#S #S
#S#S
#S
#S
#S#S
#S
#S
#S
#S
#S
#S
#S
#S
#S
#S
#S
#S
#S
#S
#S
#Y
#Y#Y
#Y
#Y
#Y
#Y
#Y
SAR
IPU
L UR
UZG
AN
FAR
AH
GH
OR
Tukz
ar Balk
hab(
Tark
hoj)
Qal
`a
Alm
ar
Bilch
iragh
Gho
rmac
h
Khak
iSaf
ed
Sulta
niBa
kwa
Bala
Bulu
k
Lokh
i
Giri
shk
Sang
in
Mus
aQ
ala
Kaja
ki
Bagh
ran
Khak
rez
Gho
rak
Argh
anda
b
Day
Cho
pan
Dihr
awud
Khes
raw
Kijra
n
Kohi
stan
at(P
asni
)
Mur
ghab
Qad
is
Jaw
and
Injil
Guz
ara
Pash
tun
Zarg
hun
Gul
ran
Kush
k
Gho
ryan
Obe
Chis
htiS
harif
Karu
kh
Zind
aJa
n
Kohs
an
Adra
skan
Shin
dand
Fars
i
Anar
Dara
Qal
a-I-K
ah
Gul
ista
n
Purc
ham
an
Lash
Wa
Juw
ayn
Shah
rak
Sagh
ar
Tula
k
Tayw
ara
LalW
aSa
rjang
al
Pasa
band
Naw
Zad
Was
her
Nad
Ali Na
wa-I-
Bar
akza
yi
Dam
anAr
ghis
tan
Panj
way
i
May
wan
d
Shah
Wal
iKot
Jald
akMiz
an
Nesh
Khas
Uru
zgan
Day
Kund
i
Chor
a
Giza
b
Pash
tun
Kot
Qay
sar
Darz
ab
Kush
kKo
hna
Sozm
aQ
ala
Shah
idiH
assa
s
Shib
Koh
Push
tRod
Darz
abSa
yyad
Sozm
aQ
ala Ki
shin
dih
Alm
ar
Sang
char
ak
May
man
a
Gho
rmac
h
Bilc
hira
gh
Kohi
stan
at
Pash
tun
Kot
Mur
ghab
Qay
sar
Balk
hab
Gul
ran
Kohi
stan
Yaka
wlan
gKu
shk
Jawa
nd
Muq
ur
AbKa
mar
i
Kush
kiK
uhna
Chag
hcha
ran
Qad
is
Qal
a-I-N
aw
LalW
aS
arja
ngal
Kohs
an Zind
aJa
nIn
jil
Karu
kh
Obe
Chis
htiS
harif
Shah
rak
Gho
ryan
Day
Kund
iPa
shtu
nZa
rghu
n
Hira
t
Guz
ara
Tula
k
Fars
i
Adra
skan
Pasa
band
Shah
rista
n
Sagh
arG
izab
Tayw
ara
Shin
dand
Kijra
n
Anar
Dar
aPu
rCha
man
Bagh
ran
Chor
a Khas
Uru
zgan
Shah
idiH
assa
s
Bala
Bulu
k
Dayc
hopa
n
Gul
ista
nTi
rinKo
tDi
hraw
udM
usa
Qal
a
Naw
Zad
Khak
iSaf
edKa
jaki
Nesh
Push
tRod
Qal
a-I-K
ah
Bakw
aQ
alat
Shah
Wal
iKot
Was
her
Fara
hM
izan
Gho
rak
Khak
rez
Sang
in
Khas
hR
od
Shib
Koh
Tarn
akW
aJa
ldak
Nahr
iSar
raj
Lash
Wa
Juw
ayn
Chak
hans
urAr
ghan
dab
May
wand
Dam
an
Argh
ista
n
Nad
Ali
Panj
way
i
Kand
ahar
Lash
karG
ahKa
ng
Naw
a-i-B
arak
zayiLa
shka
rGah
Tirin
Kot
Fara
h
Hira
t
Kand
ahar
Chag
hcha
ran
HIR
AT
WES
TER
NR
EG
IONQa
la-I-
Naw
BAD
GH
IS
HIL
MA
ND
BAM
YAN
NO
RTH
WES
TR
EGIO
N
NO
THER
NR
EG
ION
BALK
H
FAR
YAB
KAN
DAH
AR
NIM
RO
Z
ZABU
L
Khwa
jaS
abz
Posh