National Institute UK Economic Outlook
61
Summer 2021 Series A. No. 3 National Institute UK Economic Outlook Emerging from the Shadow of Covid-19
Transcript of National Institute UK Economic Outlook
Summer 2021
Series A. No. 3
National Institute UK Economic Outlook
Emerging from the Shadow of Covid-19

National Institute UK Economic Outlook – Summer 2021
ISSN 2753-9350© National Institute of Economic and Social Research, 2021National Institute of Economic and Social Research 2 Dean Trench StLondon SW1P 3HET: +44 (0)20 7222 7665E: [email protected] W: niesr.ac.uk
Registered charity no. 306083
NATIONAL INSTITUTE OF ECONOMIC AND SOCIAL RESEARCH
OFFICERS OF THE INSTITUTEPRESIDENT
SIR PAUL TUCKER
COUNCIL OF MANAGEMENTPROFESSOR NICHOLAS CRAFTS (CHAIR)
Tera Allas CBE Stephen King Alex Baker Keith Mackrell Jenny Bates Neville Manuel Professor Phillip Brown Professor Jill Rubery Neil Gaskell Romesh Vaitilingam Professor Sir David Greenaway
DIRECTORPROFESSOR JAGJIT S. CHADHA OBE
2 Dean Trench Street, Smith Square London, SW1P 3HE
The National Institute of Economic and Social Research is an independent research institute, founded in 1938. The vision of our founders was to carry out research to improve understanding of the economic and social forces that affect people’s lives, and the ways in which policy can bring about change. And this remains central to NIESR’s ethos. We continue to apply our expertise in both quantitative and qualitative methods and our understanding of economic and social issues to current debates and to influence policy. The Institute is independent of all party political interests.

Contents
Foreword 3
National Institute UK Economic Outlook – Summer 2021 5
1 UK economic outlook: Brisk but not better growth 6Economic background and overview of the forecast 6Economic activity 8Households 11Firms 14Trade 16Fiscal policy 17Inflation and monetary policy 19Box A: The simple arithmetic of inflation. Using “drop-in” and “drop-out” for exploring future short-run inflation scenarios 23Box B: The long and uncertain road to exiting Quantitative Easing 25Box C: Firm indebtedness and risks to investment 30Box D: Foreign aid makes good macroeconomic sense 34
2 UK Regional Outlook: Summer 2021 37Regional Outlook 38Regional Gross Value Added (GVA) 38Regional employment 39Labour productivity 40Labour force decomposition 40Regional inactivity and unemployment 41Inactivity and unemployment by age and gender 43Income, Consumption and Savings at the household level 44Conclusion 49
Appendix 51
National Institute of Economic and Social Research 3
National Institute UK Economic Outlook – Summer 2021
ForewordIt seems likely that later this year or early next the economy will return to the level of overall activity recorded at the end of 2019. But even if activity in aggregate returns to pre-crisis levels, with services and construction in the lead, neither manufacturing nor agriculture seem likely to do so. We also then expect to see considerable regional variation in the short and medium-run, with the economic prospects of London showing most resilience and the Midlands and Northern Ireland looking particularly vulnerable. More importantly the economy has lost some two years of economic growth and sectors, such as hospitality and the arts, which are so important to UK plc may bear the scars for some time to come. And although there are encouraging signs in the rate of Covid infections, it is far too early to get out the bunting. Once again, a crisis has exposed existing vulnerabilities and we need to focus on our policy responses.
There are four specific areas to watch carefully in the second half of this yearFirst, the calculus on lockdowns and exit remains complex. And we cannot rule out the need for further constraints on our social interactions. It has never been a mechanical question of lockdown versus liberty and correspondingly recession or growth but a question of how we decide on the deployment of social controls under great uncertainty of their impact. The more infectious Delta variant showed signs of rapid growth, and while the hospital mortality rate is considerably lower than we saw in 2020, for a time the numbers were worrying with the risks heavily skewed into a mad world of a rapid growth in infections. That said, nobody can be certain what will happen in the second half of this year and there are some preliminary indications that we may have achieved herd immunity. So policy must be guided by the risks we can estimate as well as the uncertainty induced by changing policy. In general, a good principle is to respect the risks, as they sit on the side of the worst case, and bear in mind that we do not quite understand the result of a policy intervention – in this case – to open up. This means that we need to move in a gradual and cautious manner. But think more carefully about the protocols around those who may have been exposed to the virus and have been vaccinated and what support we provide to those who cannot work as a result of Covid-19.
Second, in the labour market, as the furlough scheme winds down, we need to understand what fraction of those employees will be taken back on by firms and how many will be made redundant. Related to this, what specific support might be offered to help those losing their jobs, or entering the labour market, to search for work or train for new careers? Our own analysis is that the fiscal burden of the furlough scheme has paid for itself in terms the direct costs of the scheme and the alternative of considerably more unemployment. Indeed, the University and further education sector seems well placed to offer re-training schemes and support employment rotation.
Thirdly, there has been a good rate of new company start-ups and, so far, firms have not suffered large scale bankruptcies and debt default. This tends to be a good indicator of future employment and may support future productivity, but the composition of these new firms has been strongest in those sectors that are best able to withstand social distancing. These may not necessarily be the best firms to promote enduring prosperity. Firm growth in the low wage service sector is welcome but a preferable source of national productivity is the development of internationally competitive firms around the country supporting local demand. It is also of concern that the corporate sector is now carrying even more debt, which may act as drag on future hiring and investment.
Fourthly, as an economy sensitive to the fluctuations in world trade, the UK remains acutely subject to the maxim that: This Won’t End for Anyone Until It Ends for Everyone. This means that for as long as the crisis casts its shadow, the denuded prospects for tourism, international trade and labour mobility may act to constrain UK activity. So, as well as an ethical issue, self-interest also dictates that we ought to be in the lead of arguing for waivers on intellectual property so that the vaccine technology can be shared with the world.
We cannot think simply in terms of a fixed capacity for production in the economy for which policy simply acts to stoke demand. Government and Bank of England policies should be used to support the most efficient and dynamic production of goods and services. Attention must be paid to maintaining the credibility of our institutions to manage inflation risks and the stability of the financial system. But, as we face obstacles to the recovery from Covid-19, HM Treasury and the central bank must also show flexibility to support our continued fightback from the pandemic.
At present our hapless fiscal framework – the rules the government sets for managing the public finances – is under scrutiny by the Treasury and we wait for its next iteration. So far we have failed to adopt a transparent timetable for our fiscal events and more formal scrutiny of the normative choices made by HM Treasury. But what we do not need are yet more arbitrary rules; fiscal policy needs to be directed at the regional and household inequalities that the pandemic has both highlighted and exacerbated. It could well be that, although we have a ministry of finance, we need a ministry for the economy. This might support a more consistent and durable set of economic policies.
4 National Institute of Economic and Social Research
National Institute UK Economic Outlook – Summer 2021
Last spring, monetary policy responded well to the initial lockdown with a cut in interest rates from the Bank of England and an increase in the size of the quantitative easing programme. With the recovery in train, it is now time to complete the task of forward guidance and explain better what might happen to Bank Rate and the stock of asset purchases as the economy bounces back. In sympathy with the recent report from the Lords Economic Affairs Committee, we argue for more clarity on how we will exit quantitative easing and move towards quantitative tightening. It is simply not enough to focus our attention on small changes in the base rate that may or may not matter. What matters is that financial capital is matched with the most productive prospects at the best global terms.
Not so long ago the only thing that seemed to matter was how and when we delivered Brexit, and what that might mean for an economy that had suffered a prolonged period of underinvestment. Now, as we think about how to plot a way out of the Covid crisis, it is precisely those gaps in human and physical capital that we need to fill in order to deliver sustainable and balanced growth across the country. It is the biggest problem we face. Can we solve it?
Jagjit S. Chadha
Director, NIESR August 2021
National Institute of Economic and Social Research 5
National Institute UK Economic Outlook – Summer 2021
National Institute UK Economic Outlook – Summer 2021
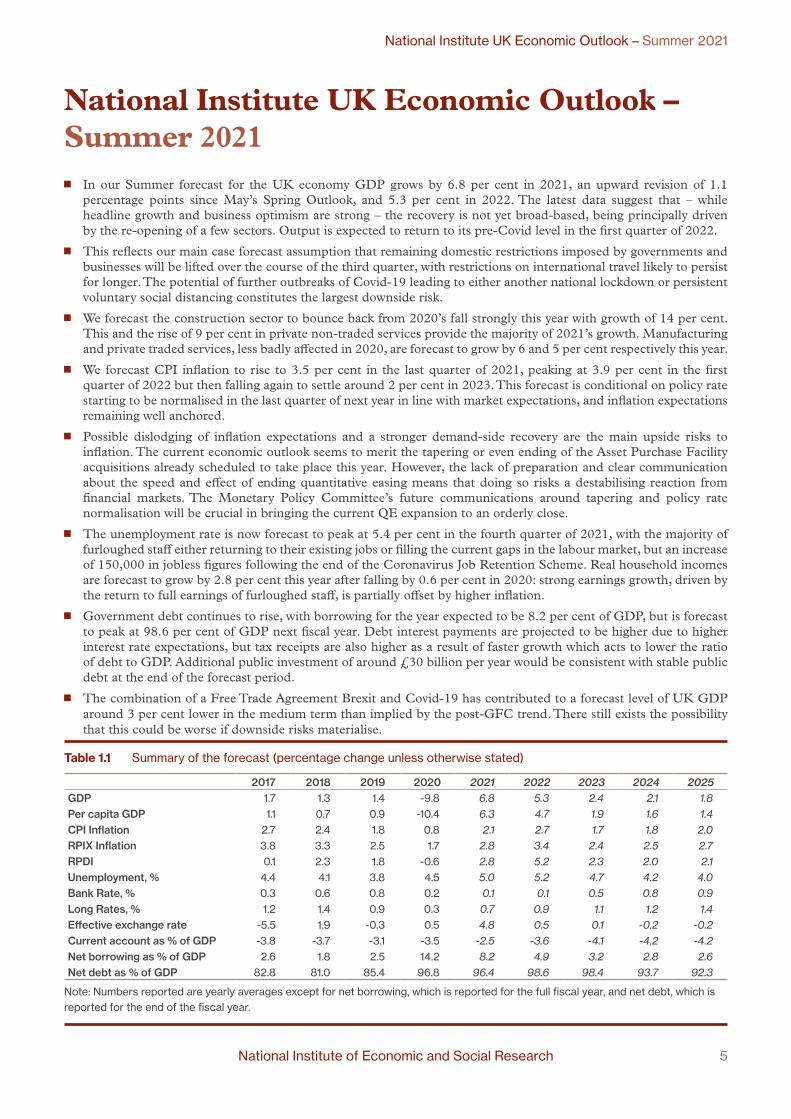
J In our Summer forecast for the UK economy GDP grows by 6.8 per cent in 2021, an upward revision of 1.1 percentage points since May’s Spring Outlook, and 5.3 per cent in 2022. The latest data suggest that – while headline growth and business optimism are strong – the recovery is not yet broad-based, being principally driven by the re-opening of a few sectors. Output is expected to return to its pre-Covid level in the first quarter of 2022.
J This reflects our main case forecast assumption that remaining domestic restrictions imposed by governments and businesses will be lifted over the course of the third quarter, with restrictions on international travel likely to persist for longer. The potential of further outbreaks of Covid-19 leading to either another national lockdown or persistent voluntary social distancing constitutes the largest downside risk.
J We forecast the construction sector to bounce back from 2020’s fall strongly this year with growth of 14 per cent. This and the rise of 9 per cent in private non-traded services provide the majority of 2021’s growth. Manufacturing and private traded services, less badly affected in 2020, are forecast to grow by 6 and 5 per cent respectively this year.
J We forecast CPI inflation to rise to 3.5 per cent in the last quarter of 2021, peaking at 3.9 per cent in the first quarter of 2022 but then falling again to settle around 2 per cent in 2023. This forecast is conditional on policy rate starting to be normalised in the last quarter of next year in line with market expectations, and inflation expectations remaining well anchored.
J Possible dislodging of inflation expectations and a stronger demand-side recovery are the main upside risks to inflation. The current economic outlook seems to merit the tapering or even ending of the Asset Purchase Facility acquisitions already scheduled to take place this year. However, the lack of preparation and clear communication about the speed and effect of ending quantitative easing means that doing so risks a destabilising reaction from financial markets. The Monetary Policy Committee’s future communications around tapering and policy rate normalisation will be crucial in bringing the current QE expansion to an orderly close.
J The unemployment rate is now forecast to peak at 5.4 per cent in the fourth quarter of 2021, with the majority of furloughed staff either returning to their existing jobs or filling the current gaps in the labour market, but an increase of 150,000 in jobless figures following the end of the Coronavirus Job Retention Scheme. Real household incomes are forecast to grow by 2.8 per cent this year after falling by 0.6 per cent in 2020: strong earnings growth, driven by the return to full earnings of furloughed staff, is partially offset by higher inflation.
J Government debt continues to rise, with borrowing for the year expected to be 8.2 per cent of GDP, but is forecast to peak at 98.6 per cent of GDP next fiscal year. Debt interest payments are projected to be higher due to higher interest rate expectations, but tax receipts are also higher as a result of faster growth which acts to lower the ratio of debt to GDP. Additional public investment of around £30 billion per year would be consistent with stable public debt at the end of the forecast period.
J The combination of a Free Trade Agreement Brexit and Covid-19 has contributed to a forecast level of UK GDP around 3 per cent lower in the medium term than implied by the post-GFC trend. There still exists the possibility that this could be worse if downside risks materialise.
Table 1.1 Summary of the forecast (percentage change unless otherwise stated)
2017 2018 2019 2020 2021 2022 2023 2024 2025GDP 1.7 1.3 1.4 -9.8 6.8 5.3 2.4 2.1 1.8Per capita GDP 1.1 0.7 0.9 -10.4 6.3 4.7 1.9 1.6 1.4CPI Inflation 2.7 2.4 1.8 0.8 2.1 2.7 1.7 1.8 2.0RPIX Inflation 3.8 3.3 2.5 1.7 2.8 3.4 2.4 2.5 2.7RPDI 0.1 2.3 1.8 -0.6 2.8 5.2 2.3 2.0 2.1Unemployment, % 4.4 4.1 3.8 4.5 5.0 5.2 4.7 4.2 4.0Bank Rate, % 0.3 0.6 0.8 0.2 0.1 0.1 0.5 0.8 0.9Long Rates, % 1.2 1.4 0.9 0.3 0.7 0.9 1.1 1.2 1.4Effective exchange rate -5.5 1.9 -0.3 0.5 4.8 0.5 0.1 -0.2 -0.2Current account as % of GDP -3.8 -3.7 -3.1 -3.5 -2.5 -3.6 -4.1 -4.2 -4.2Net borrowing as % of GDP 2.6 1.8 2.5 14.2 8.2 4.9 3.2 2.8 2.6Net debt as % of GDP 82.8 81.0 85.4 96.8 96.4 98.6 98.4 93.7 92.3
Note: Numbers reported are yearly averages except for net borrowing, which is reported for the full fiscal year, and net debt, which is reported for the end of the fiscal year.

6 National Institute of Economic and Social Research
National Institute UK Economic Outlook – Summer 2021
1 UK economic outlook: Emerging from the shadow of Covid-19
by Hande Küçük, Cyrille Lenoël and Rory Macqueen1
1 We would like to thank Arnab Bhattacharjee, Janine Boshoff, Jagjit Chadha, Huw Dixon, Paul Mortimer-Lee, Barry Naisbitt, Andrew Sentance, Bart van Ark and Garry Young for helpful comments and Patricia Sanchez Juanino for preparing the charts and the database underlying the forecast. The forecast was completed on 16th July 2021; more recent data are incorporated in the text. Unless otherwise specified, the source of all data reported in tables and figures is the NiGEM database and NIESR forecast baseline. All questions and comments related to the forecast and its underlying assumptions should be addressed to Cyrille Lenoël ([email protected]).
2 As recorded by the ‘Average of new forecasts’ in HM Treasury’s monthly ‘Forecasts for the UK economy’
Economic background and overview of the forecastSpring optimism gives way to summer cautionThe background to our Summer forecast is a period of optimism which has ebbed notably in recent weeks, due to the virulent Delta strain of Covid-19. The UK’s advanced vaccination programme has dramatically reduced the link between the virus’s spread and mortality, but both deaths and hospitalisations rose noticeably in July. The most recent National Institure Covid-19 Tracker (29 July 2021) indicates a more positive outlook for infection rates since the latest peak.
Figure 1.1 UK daily Covid-19 statistics
0
500
1,000
1,500
2,000
2,500
3,000
3,500
4,000
4,500
5,000
0
200
400
600
800
1,000
1,200
1,400
1,600
Mar 20 Jul 20 Nov 20 Mar 21 Jul 21
Deaths within 28 days of a posit ive test (LHS)
Patients admitted to hospital (RHS)
Source: Data.gov.uk
Data indicate more rapid economic growth throughout the second quarter than we forecast in May…Economic news and indicators until around a month ago were almost universally positive. The fall in GDP in the first quarter of the year was much smaller than that in the second quarter of 2020, suggesting an economy which had learned to deal better with lockdowns. Monthly growth in April was 2.3 per cent while forecasts for 2021 growth
rose from 5.7 per cent in April to 7.1 in July.2 The FTSE 100 continued its recovery to reach a Covid-era peak in May. Purchasing manager indices set new records.
…but the Delta variant has slowed things and raised questions about prospects for the summer periodSince then the positive message has cooled somewhat, due partly to the natural end of some ‘catch-up’ effects, but mostly to the renewed growth in Covid-19 cases. Month-on-month growth slowed dramatically in May to 0.8 per cent, of which 0.7 per cent was attributed to the hospitality sector, where restrictions were lifted. Retail sales fell in May and only recovered slightly in June.
The scheduled date for ending remaining restrictions was delayed from 21st June to 19th July and the government has advised the public to continue to exercise caution, with a substantial, if lower, degree of voluntary social distancing and mask-wearing still evident. The bond market rallies seen earlier in the year have eased and even reversed slightly (see Figure 1.2) while PMIs have declined from their highs.
Figure 1.2 10-year government bond yields
0.0
0.4
0.8
1.2
1.6
2.0
Jan 20 Apr 20 Jul 20 Oct 20 Jan 21 Apr 21 Jul 21
Per
cen
t pe
r an
num
United States United Kingdom
Source: Datastream
National Institute of Economic and Social Research 7
National Institute UK Economic Outlook – Summer 2021
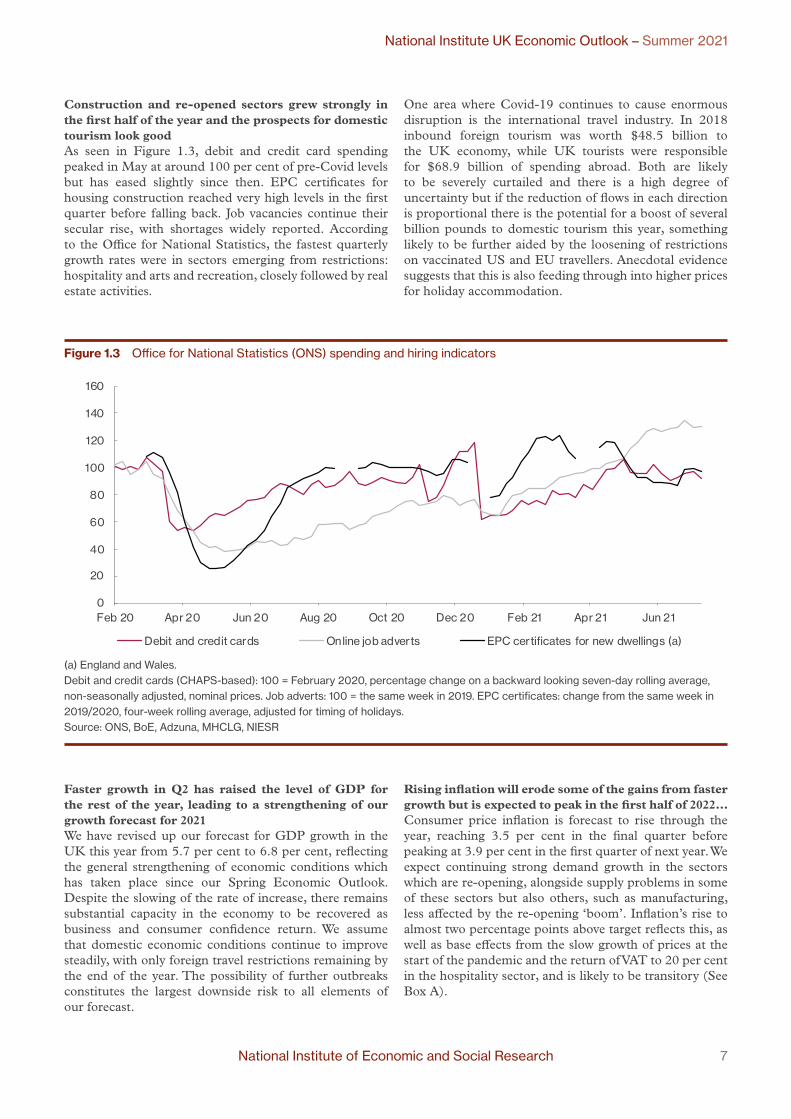
Construction and re-opened sectors grew strongly in the first half of the year and the prospects for domestic tourism look goodAs seen in Figure 1.3, debit and credit card spending peaked in May at around 100 per cent of pre-Covid levels but has eased slightly since then. EPC certificates for housing construction reached very high levels in the first quarter before falling back. Job vacancies continue their secular rise, with shortages widely reported. According to the Office for National Statistics, the fastest quarterly growth rates were in sectors emerging from restrictions: hospitality and arts and recreation, closely followed by real estate activities.
One area where Covid-19 continues to cause enormous disruption is the international travel industry. In 2018 inbound foreign tourism was worth $48.5 billion to the UK economy, while UK tourists were responsible for $68.9 billion of spending abroad. Both are likely to be severely curtailed and there is a high degree of uncertainty but if the reduction of flows in each direction is proportional there is the potential for a boost of several billion pounds to domestic tourism this year, something likely to be further aided by the loosening of restrictions on vaccinated US and EU travellers. Anecdotal evidence suggests that this is also feeding through into higher prices for holiday accommodation.
Faster growth in Q2 has raised the level of GDP for the rest of the year, leading to a strengthening of our growth forecast for 2021We have revised up our forecast for GDP growth in the UK this year from 5.7 per cent to 6.8 per cent, reflecting the general strengthening of economic conditions which has taken place since our Spring Economic Outlook. Despite the slowing of the rate of increase, there remains substantial capacity in the economy to be recovered as business and consumer confidence return. We assume that domestic economic conditions continue to improve steadily, with only foreign travel restrictions remaining by the end of the year. The possibility of further outbreaks constitutes the largest downside risk to all elements of our forecast.
Rising inflation will erode some of the gains from faster growth but is expected to peak in the first half of 2022…Consumer price inflation is forecast to rise through the year, reaching 3.5 per cent in the final quarter before peaking at 3.9 per cent in the first quarter of next year. We expect continuing strong demand growth in the sectors which are re-opening, alongside supply problems in some of these sectors but also others, such as manufacturing, less affected by the re-opening ‘boom’. Inflation’s rise to almost two percentage points above target reflects this, as well as base effects from the slow growth of prices at the start of the pandemic and the return of VAT to 20 per cent in the hospitality sector, and is likely to be transitory (See Box A).
Figure 1.3 Office for National Statistics (ONS) spending and hiring indicators
0
20
40
60
80
100
120
140
160
Feb 20 Apr 20 Jun 20 Aug 20 Oct 20 Dec 20 Feb 21 Apr 21 Jun 21
Debit and credit cards Online job adverts EPC certificates for new dwellings (a)
(a) England and Wales. Debit and credit cards (CHAPS-based): 100 = February 2020, percentage change on a backward looking seven-day rolling average, non-seasonally adjusted, nominal prices. Job adverts: 100 = the same week in 2019. EPC certificates: change from the same week in 2019/2020, four-week rolling average, adjusted for timing of holidays. Source: ONS, BoE, Adzuna, MHCLG, NIESR

8 National Institute of Economic and Social Research
National Institute UK Economic Outlook – Summer 2021
Figure 1.4 Sectoral balances (saving minus investment)
-15
-10
-5
0
5
10
15
2010 2013 2016 2019 2022 2025
Per
cen
t of
GD
P
Households Companies
Government Finance from abroad
Forecast
Source: NiGEM database, NIESR forecast
…though interest rates are not expected to rise until late 2022We forecast Bank Rate to remain at its current level until the fourth quarter of 2022 in line with market expectations. The Monetary Policy Committee’s future communications around tapering asset purchases and policy rate normalisation will be crucial to keep inflation expectations well anchored while preventing a destabilising reaction from financial markets (see Box B).
Household income growth looks strong thanks to workers returning from furloughHousehold incomes are forecast to rise by over 5 per cent this year, with average earnings growing by 2.4 per cent. Unemployment peaks at 5.4 per cent in the last quarter of 2021, after the Coronavirus Job Retention Scheme comes to an end, consistent with around 150,000 people not returning to their furloughed job or finding another during or after the third quarter.
Public debt peaks next year after the withdrawal of Covid-19 fiscal supportGovernment borrowing remains relatively high this year at around 8 per cent of GDP, so that government debt climbs in 2022-23 to just below 99 per cent of GDP, falling to 92 per cent by 2025-26.
The current account deficit returns to pre-referendum levels in the medium termWe forecast the current account deficit to shrink this year but to remain around 4 per cent in the medium term (see Figure 1.4). Domestically, the reduction in government borrowing is matched by the reduction in household saving and the return of the corporate sector to positive net investment.
Figure 1.5 Projected quarterly growth in 2021
-8
-6
-4
-2
0
2
4
6
8
10
12
2021Q1 2021Q2 2021Q3 2021Q4
Per
cen
t ch
ange
qua
rter
-on
-qua
rter
GDPHousehold consumptionPrivate sector investment
Source: NiGEM database, NIESR forecast Note: Household consumption is household and NPISH final consumption expenditure (durable and non-durable).
Economic activity
Spring growth was faster than anticipated but the Delta variant has meant a downside risk being realisedIn our UK forecast for the Spring Economic Outlook we forecast growth of 5.7 per cent for the UK economy in 2021, faster than at any time in living memory but with significant downside risk from the emergence of new variants of Covid-19: something which has materialised in the form of the Delta variant.
Much economic data since then has been positive, and our GDP forecast has been revised up accordingly, but not by as much as might have been the case a month ago.
Both demand and supply are likely to be affected by the resurgence of the virus at a time when we hoped it would be largely in the pastWith high frequency indicators and surveys indicating a slowing of growth in the middle part of the year, it seems that demand in many sectors is growing more slowly than would have been the case in the absence of a resurgence in Covid-19 infections, due partly to the delay in lifting restrictions but also to consumer hesitancy. Hopefully, the success of the vaccination programme and a fall in hospitalisations will translate into a full recovery for consumer-facing services which comes slightly later but is no weaker than would have been the case.

National Institute of Economic and Social Research 9
National Institute UK Economic Outlook – Summer 2021
This has coincided with the rise of certain supply-side constraints: a widely-reported global shortage of semiconductors which is expected to ease; supply chain bottlenecks, in particular relating to imports from the European Union; and a shortage of labour exacerbated by compulsory Covid-related isolation but concentrated in sectors which previously relied on European workers and those in age-groups not yet fully vaccinated. The last of these constraints is only likely to be exacerbated, along with the supply restrictions inherent to social distancing, by any renewed spread of Covid-19.
Output in several sectors remains well below pre-Covid peaksAs discussed in previous UK forecasts the initial Covid-19 shock was a sectorally and regionally heterogenous one, with face-to-face service sectors – and areas with economies which centre around those sectors – badly affected, but also construction and manufacturing. By the third quarter of 2020 output was over 11 per cent lower than a year earlier in the West Midlands, compared with around 3 per cent in Northern Ireland. Subsequent waves have been more concentrated in terms of their impact, with the largest effects on education, hospitality, arts and recreation in the first quarter of 2021.
Figure 1.6 GDP fan chart (quarterly, 2018 prices)
410
460
510
560
610
2018 2020 2022 2024
£ bi
llion
Source: NiGEM database, NIGEM forecast, NIGEM stochastic simulation. Notes: The fan chart is intended to represent the uncertainty around the main-case forecast scenario shown by the black line. There is a 10 per cent chance that GDP growth in any particular year will lie within any given shaded area in the chart. There is a 20 per cent chance that GDP growth will lie outside the shaded area of the fan chart.
Unsurprisingly, monthly GDP data in Spring suggested the fastest growth rates in sectors which saw their Covid-19 restrictions lifted: the hospitality sector was operating at around 40 per cent of its February 2020 peak during the first quarter of the year, returning to around 80 per cent in May, but still suffering from both reduced consumer demand and reduced labour supply. Clearly, substitution took place while hospitality outlets were closed: the retail sector offsetting losses in non-essential shops during lockdown with increased sales of food and drink. April saw retail and wholesale activity 5 per cent above its pre-Covid peak, falling slightly in May as some spending switched back to pubs and restaurants.
The manufacturing sector has been badly hit by global shortages of equipment, which are expected to ease in the third quarter, and is likely to have seen around zero growth in the second quarter. Construction had a strong first quarter, possibly responding to rising house prices, and the finance sector recovered its February 2020 level a year later, seemingly not too badly affected by the lack of an equivalence agreement with the European Union or the loss of trading to other European cities.
Fast growth in the second quarter has raised our forecast for this year and next We estimate that GDP grew by around 5 per cent in the second quarter of 2021 and will slow to 2.6 per cent in the third quarter – still rapid by historical standards – on the assumption of waning Covid-19 cases and the lifting of all domestic restrictions by the end of the third quarter (Figure 1.5). This leads to forecast growth for 2021 of 6.8 per cent in 2021 year-on-year.
In our main case forecast scenario GDP then grows by 5.3 per cent in 2022 and 2.4 per cent in 2023, returning below 2 per cent in 2025. This means that GDP will supersede its pre-Covid peak from the final quarter of 2019 in the first quarter of 2022 (see Figure 1.6), but the forecast trajectory remains around 3 per cent lower than its pre-Covid trend. Over the six years from 2020 to 2025 the cumulative loss in GDP, relative to a continuation of the 2010-2019 trend, is forecast to be £735 billion. Cumulative growth of 8 per cent between 2019 and 2025 is comparable to other major European economies but slower than the US.
The combination of Brexit and Covid-19 is likely to lead to permanent scarring to the level of GDP, though not its growth pathOur forecast for GDP in 2025 is now 2 per cent lower than we forecast in February 2020, at a time when we knew the outline of the government’s Brexit deal but Covid-19’s effects on the UK were not understood. One of the main channels of scarring from the pandemic is weaker capital accumulation due to lockdowns, prolonged pandemic uncertainty and financial factors including increased indebtedness of small and medium-sized enterprises (see Box C). The long-run effects of Brexit due to a reduction in trade and foreign direct investment flows are likely to reinforce the long-run effects of the pandemic.

10 National Institute of Economic and Social Research
National Institute UK Economic Outlook – Summer 2021
A second channel is related to the effects of Covid-19 on labour supply. Even if lockdown restrictions are relaxed, the pandemic will still have restraining effects due to the need for self-isolation. The reduction in migration also implies a smaller labour force, which affects potential output in the long run. Weaker capital accumulation and continued disruptions in labour supply due to reoccurring waves of infection are also likely to reduce labour market productivity although permanent working from home arrangements and increase in digitalisation and automation may mitigate these effects (Van Ark et al, 2020 and Haskel, 2021).
Figure 1.7 Forecast growth in 2021
-20
-15
-10
-5
0
5
10
15
GDP Privatecons.
Gov.cons.
Invest. Exports Imports(inverse)
Per
cen
t
May 2021 forecast Aug 2021 forecast
Source: NIESR forecast
Figure 1.8 Components of investment growth
0
2
4
6
8
10
12
MayForecast
AugustForecast
MayForecast
AugustForecast
2021 2022
Per
cen
t
Business investment Private housing Gen Govt.
Source: ONS, NIESR forecast
Investment and the trade position are expected to provide greater support to 2021 growthAs seen in Figures 1.7 and 1.8, growth in 2021 is now expected to be boosted more by investment than was our view in May, though this is principally due to government and housing sector investment, with business investment recovering more strongly in 2022. Net exports are also expected to make a greater positive contribution, less due to an increased demand for UK exports than a reduction in imports (see page 17).
Risks to GDP are evenly balanced. Upside risks to GDP come, as in our Spring Outlook, from the faster running down of consumer savings, a rapid normalising of behaviour following full vaccination, and business confidence leading to a boom in investment. Downside risks come from uncertainties regarding the pandemic and the increase in cases related to the Delta variant, with unknown consequences for consumer confidence.
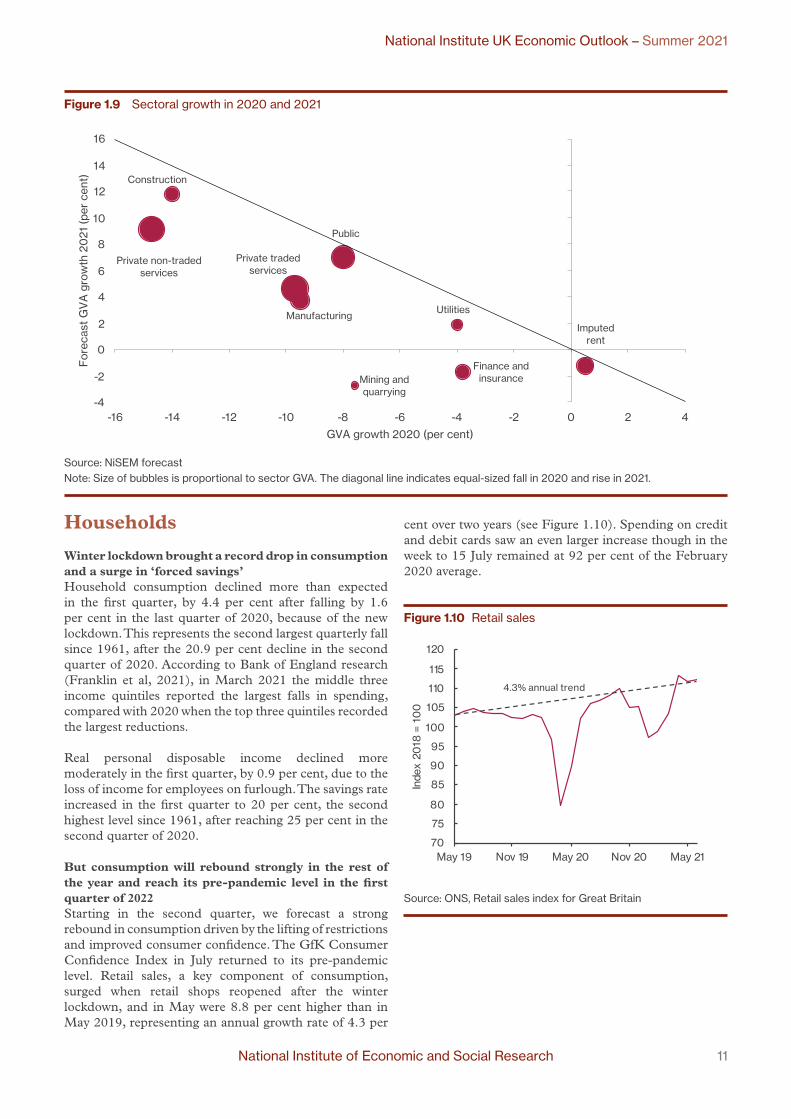
Manufacturing growth is limited by supply shortages with growth mostly coming from servicesUsing our sectoral model, NiSEM (see Lenoël and Young, 2021), we forecast GVA in construction to have the fastest growth rate in 2021, with output increasing by 14 per cent after a similar fall in 2020 (see Table A11). Private non-traded services, which include hospitality, retail, arts and recreation, fared the worst in 2020 – falling by 15 per cent – and are now forecast to grow by 9 per cent this year and next. Manufacturing is forecast to grow by 6 per cent this year after a 10 per cent fall in 2020. Unsurprisingly the mining and quarrying sector sees a large decline, reflecting both the scheduled maintenance to oil platforms which began in April and the long-term reduction in fossil fuel extraction from the UK continental shelf. As seen in Figure 1.9, sectors that contracted the most in 2020 are expected to display larger increases in 2021, reflecting the effects of opening-up and an element of catch-up.
Relatively weak growth in the manufacturing sector (with sectoral GVA expected to recover to its pre-pandemic level by the second half of 2022) will have material spillovers onto other sectors. While the manufacturing sector has a relatively small share in total gross value added, its share of gross output is much higher, reflecting its greater use of intermediate goods and services produced in other sectors.
National Institute of Economic and Social Research 11
National Institute UK Economic Outlook – Summer 2021
Households
Winter lockdown brought a record drop in consumption and a surge in ‘forced savings’Household consumption declined more than expected in the first quarter, by 4.4 per cent after falling by 1.6 per cent in the last quarter of 2020, because of the new lockdown. This represents the second largest quarterly fall since 1961, after the 20.9 per cent decline in the second quarter of 2020. According to Bank of England research (Franklin et al, 2021), in March 2021 the middle three income quintiles reported the largest falls in spending, compared with 2020 when the top three quintiles recorded the largest reductions.
Real personal disposable income declined more moderately in the first quarter, by 0.9 per cent, due to the loss of income for employees on furlough. The savings rate increased in the first quarter to 20 per cent, the second highest level since 1961, after reaching 25 per cent in the second quarter of 2020.
But consumption will rebound strongly in the rest of the year and reach its pre-pandemic level in the first quarter of 2022Starting in the second quarter, we forecast a strong rebound in consumption driven by the lifting of restrictions and improved consumer confidence. The GfK Consumer Confidence Index in July returned to its pre-pandemic level. Retail sales, a key component of consumption, surged when retail shops reopened after the winter lockdown, and in May were 8.8 per cent higher than in May 2019, representing an annual growth rate of 4.3 per
cent over two years (see Figure 1.10). Spending on credit and debit cards saw an even larger increase though in the week to 15 July remained at 92 per cent of the February 2020 average.
Figure 1.10 Retail sales
70
75
80
85
90
95
100
105
110
115
120
May 19 Nov 19 May 20 Nov 20 May 21
Inde
x 20
18 =
10
0
4.3% annual trend
Source: ONS, Retail sales index for Great Britain
Figure 1.9 Sectoral growth in 2020 and 2021
Private non-traded services
Construction
Private traded services
Manufacturing
Mining and quarrying
Public
Utilities
Finance and insurance
Imputed rent
-4
-2
0
2
4
6
8
10
12
14
16
-16 -14 -12 -10 -8 -6 -4 -2 0 2 4
For
ecas
t G
VA
gro
wth
20
21 (p
er c
ent)
GVA growth 2020 (per cent)
Source: NiSEM forecast Note: Size of bubbles is proportional to sector GVA. The diagonal line indicates equal-sized fall in 2020 and rise in 2021.

12 National Institute of Economic and Social Research
National Institute UK Economic Outlook – Summer 2021
Figure 1.11 Household savings ratio
0
5
10
15
20
25
30
2015 2017 2019 2021 2023 2025
Per
cce
nt
Forecast
Note: NiGEM database, NIESR forecast
Figure 1.12 Decomposition of fall in employment since February 2020: decline in economically active, increase in unemployment
-800
-700
-600
-500
-400
-300
-200
-100
0Oct 2020 Jan 2021 Apr 2021
Tho
usan
ds
Active Unemployed
Source: ONS
Thanks to a drawdown of some ‘forced savings’, consumption is forecast to return to its pre-pandemic level in the first quarter of next year. As a result the savings rate progressively returns to around 8 per cent at the end of the forecast period, close to its 1997-2019 average of 8½ per cent (Figure 1.11).
Employment fell during the pandemic because people dropped out of the labour forceSince the beginning of the pandemic, Labour Force Survey employment has declined by 706,000. Most of this decline can be attributed to people dropping out of the labour force, rather than a rise in unemployment: Figure 1.12 decomposes the decline in employment since February
2020. In April, the number of economically active people was 455,000 fewer than in February 2020, while the number of unemployed increased by 252,000 over the same period. Chapter 2 provides a detailed analysis on labour force decomposition across UK regions.
Some of the reduction in the active labour force is explained by people becoming inactive – for example to look after their family – and some by people leaving the country to return to their home country – a large fraction of this being EU citizens. In our main case scenario, we follow the ONS population projections and do not yet expect this reduction in the labour force to be permanent. This obviously constitutes a downside risk to our forecast.
Labour shortages in health and excess labour in accommodationThe end of the furlough scheme in September will force businesses to re-evaluate their labour needs in the next few months. The number of workers on furlough nearly halved from 5.1 million in January to 2.5 million at the end of May thanks to the partial lifting of restrictions but the rapid fall in furlough has not been enough to accommodate the recovery in labour demand, and vacancies increased to a record level of 862,000 in the three months to June. A stock of 1.9 million workers still on furlough at the end of June suggests that there is room for employers to respond to further increases in business activity by taking back workers that were on furlough, but there is a risk of a mismatch between the sectors that are hiring and the skills of the people in furlough.
Figure 1.13 compares vacancies and furlough by sectors: two sectors stand out. On the one hand, the health and social work sector shows a clear shortage with nearly twice as many vacancies as people still on furlough. On the other hand, the accommodation and food services sector
Figure 1.13 (Mis)match between vacancies and furlough by sectors
Retail
Accommodation and food
Health and social work
0
20
40
60
80
100
120
140
160
180
0 100 200 300 400 500 600 700
Vac
anci
es (t
hous
ands
)
Furlough (thousands)
Source: ONS and HMRC. Vacancies are for June and furlough for end of May.

National Institute of Economic and Social Research 13
National Institute UK Economic Outlook – Summer 2021
seems to have excess labour with nearly six times as many furloughed workers as vacancies. There are also reports of labour shortages in haulage.
Unemployment to peak at 5.4 per cent after the end of the furlough schemeWhile headline unemployment stood at 4.8 per cent in March to May 2021, if all full-time furloughed staff were included (analogous to how furloughed staff are reported in the US) the unemployment rate would have been 8-9 per cent. Using a rule-of-thumb Okun’s Law coefficient of 0.43, GDP 7 per cent below pre-Covid trend for the second quarter would imply an unemployment rate of 6.5-7.0 per cent. On the other hand, a Beveridge Curve estimated on the period 2007-2019 would associate the number of vacancies with an unemployment rate below 4 per cent.
We have revised down our unemployment forecast because of the unexpected rise in employment during the winter lockdown and reported labour shortages in some sectors. Unemployment is now set to peak at 5.4 per cent in the fourth quarter of 2021, a full percentage point below our previous forecast peak (Figure 1.14). This is consistent with around 150,000 of those on furlough being added to the official unemployment figures between the third and fourth quarters.
Figure 1.14 UK unemployment
3.0
3.5
4.0
4.5
5.0
5.5
6.0
6.5
7.0
2015 2017 2019 2021 2023 2025
Per
cen
t
May forecast August forecast
Forecast
Source: NiGEM database, NIESR forecast
3 Taken from Prof. Jonathan Haskel’s 19 July remarks ‘Will the pandemic “scar” the economy?’ https://www.bankofengland.co.uk/speech/2021/july/jonathan-haskel-speech-on-scaring-in-the-economy-at-the-university-of-liverpool
Earnings growth is expected to this yearGrowth in average weekly earnings including bonuses in Great Britain increased sharply in the three months to May to 7.3 per cent, compared to a year ago, up from 5.7 per cent in the three months to April. Removing the effects of a low base last year – caused by the drop in earnings by workers on furlough – and from a change in the earnings distribution with lower-paid workers dropping out, the National Institute Wage Tracker in July estimated that underlying earnings growth was 3.8 per cent in the three months to May, up from 2.5 per cent in the three months to April. We forecast growth in earnings of 2.4 per cent this year and 5.2 next year.
The KPMG and REC UK Report on Jobs points to a decrease in candidate availability to explain the rise in wages, in particular for new recruits. The end of the furlough scheme in September should increase candidate availability and reduce pressure on wages, but relatively strong wage growth could continue if there is a persistent mismatch between the skills of the labour force and the demand of new jobs.
…but the rise in inflation will limit real income gainsReal personal disposable income is expected to increase by 2.8 per cent this year after having declined by 0.6 per cent last year. The gradual return of employees from furlough and the increase in wages in sectors that suffer labour shortages are the main reason for the household income gains, but an expected rise in inflation this year and next will limit the real income gains.
House price growth is set to moderate next year after government support endsHM Land Registry’s house price index increased by 10 per cent in the year to May, the fastest growth rate since 2007. The rise in house prices can be explained by a combination of temporary and more permanent factors. The increased popularity of working from home has pushed people to spend more on housing, while last year’s reduction in property taxes is being reversed this year (the Stamp Duty holiday in England will expire in October). As government support is removed, we expect house prices to moderate from a growth of 7½ per cent this year to 1½ per cent next year.

14 National Institute of Economic and Social Research
National Institute UK Economic Outlook – Summer 2021
Firms
Business confidence is high, with credit ample and demand expected to be strong…Business confidence indicators have hit record highs in recent months. The Lloyds Business Barometer reported monthly increases in trading prospects and employment expectations in each of the five months to June. UK equities (see Figure 1.15) reached a Covid-era high in spring but remain below their early 2020 peak. The Bank of England’s credit conditions survey reported a slight improvement in the availability of credit to the corporate sector in the second quarter, concentrated in credit for large firms, with little change expected in the third quarter.
Anecdotally, participants at NIESR’s quarterly Business Conditions Forum4 reported that while firms were hesitant about hiring new staff due to demand conditions a year ago, hiring is now constrained by the supply of labour. There has been speculation about the extent to which this is driven by lower migration, lower vaccination rates amongst young workers and the continuation of the furlough scheme. A downside risk to demand-side optimism is clearly constituted by the recent uptick in Covid-19 cases discussed on page 6.
…but limiting factors are emerging on the supply sideHealthy demand expectations are being joined as a source of inflation upside risk by input costs faced by firms. Continued Covid-related restrictions on capacity, including social distancing, may be imposed by government or voluntarily adopted by businesses in order to reassure consumers: to this extent the persistence of the
4 See www.niesr.ac.uk/summary-niesr-business-conditions-forum
virus constitutes a threat to the supply side as well as the demand side.
Figure 1.15 FTSE 350 index
60
65
70
75
80
85
90
95
100
105
Jan 20 Apr 20 Jul 20 Oct 20 Jan 21 Apr 21 Jul 21
Inde
x 1
Jan
2020
= 1
00
Source: DataStream, NIESR calculations
Many firms are carrying increased debt as a result of Covid-19 but they appear to be concentrated in sectors with the strongest outlooks for 2020For many firms increased input costs in the medium-term future will include the servicing of debt acquired over the past 18 months. Government-guaranteed loan schemes have been used by one in four businesses. Businesses in the sectors which were worst affected by Covid-19 – hospitality, arts and recreation – were more likely to have used the CJRS
Figure 1.16 Sector shares of output and Covid-19 government loans
02468
1012141618
Agr
icul
ture
Ex
trac
tion
and
uti
litie
s
Ma
nufa
ctu
ring
Co
nstr
uct
ion
Ret
ail
and
wh
ole
sale
Tra
nspo
rt
Ho
spita
lity
Info
rma
tion
and
Co
mm
un
icat
ion
Fin
anc
e an
dIn
sura
nce
Rea
l Est
ate
Act
iviti
es
(ex
cl. i
mpu
ted
re
nt)
Pro
fes
sio
nal
, Sc
ien
tific
and
Te
chni
cal
Adm
inis
tra
tive
and
Su
ppo
rt
Art
s a
nd
Rec
rea
tion
Oth
er
Se
rvic
eA
ctiv
itie
s
Per
cen
t
Share of total loans value Share of GVA (2019Q4)
Source: British Business Bank, NIESR calculations. Predominantly non-market sectors (education, health and public administration) excluded.

National Institute of Economic and Social Research 15
National Institute UK Economic Outlook – Summer 2021
than loan schemes (Banks et al, 2021), no doubt because in relative terms their need for support was greater than their confidence in being able to repay any loans. Corporate debt acquired during Covid-19 and likely implications for investment are discussed in Box C.
Figure 1.16 shows that around a third of loans were issued to firms in the retail and construction sectors, which are among those to have already recovered relatively strongly. Bank of England agents reported in Q2 that concerns about corporate failures were receding, though risks remained in areas such as foreign travel and businesses based in office districts. Taken together with the distribution of loans, it seems likely that the majority of repayments will fall on firms in sectors which have grown healthily so far in 2021 and may be well placed to pass on any increased costs to consumers.
Business reports strong investment intentions but a very weak start to 2021 will impact annual growth figuresBusiness investment fell by more than 10 per cent in the first quarter of 2021 to 17 per cent below its pre-Covid level: a much larger decrease than the economy as a whole. Healthy growth from this low base appears likely, given the optimism reported in business surveys and the end to Brexit-related uncertainty. The Accenture/IHSMarkit UK Business Outlook reported in July that capital expenditure and R&D plans were the highest for six years.
We forecast business investment to increase by only 4 per cent this year, held back by the large fall in the first quarter, but to rise by 9 per cent in 2022. Private housing investment recovers more quickly, rising by 18 per cent this year after a 13 per cent fall in 2020. Overall we forecast investment to rise by 11 per cent this year, supported by a 24 per cent rise in government investment (see Figure 1.8 on page 10).
The private capital stock is forecast to rise by slightly above 1 per cent on average annually between 2022 and 2025, compared with around 4 per cent in the public sector.
Productivity
There was considerable sectoral heterogeneity in labour productivity growth in 2020Labour productivity, as measured by GDP per hours worked, rose by 0.4 per cent in 2020, with substantial sectoral heterogeneity as output and hours responses to the pandemic varied significantly across sectors. Figure 1.17 shows the breakdown of hourly productivity growth by five major sectors, i.e. agriculture, manufacturing, construction, finance and insurance, and services excluding finance and insurance, to highlight sectoral differences in labour productivity due to Covid-19.
Figure 1.17 Annual growth in labour productivity (per cent)
-7-6-5-4-3-2-101234
Total
Agriculture
Manufacturing
Construction
Finance and insurance
Other servic
es
2010-2019 2020
Source: ONS
Lockdown restrictions during 2020 meant that total hours worked fell in all major sectors, except within finance and insurance, where remote or teleworking was most commonly a feasible alternative to face-to-face work. Interestingly, hourly productivity in the manufacturing sector increased by 3.4 per cent during the pandemic, posting a growth rate almost five times its post-GFC growth rate of 0.7 per cent. The growth rates of hourly productivity in construction and services (2.3 and 0.9 per cent respectively) were more in line with their post-GFC averages while finance and insurance posted a big fall (-5.7 per cent) in hourly productivity.

16 National Institute of Economic and Social Research
National Institute UK Economic Outlook – Summer 2021
Allocation effects have supported the rise in labour productivity both at sector and at aggregate levelPart of the increase in hourly productivity seen in 2020 reflects allocation effects i.e. a shift of production from lower productivity firms toward higher productivity ones (see Figure 1.18), though manufacturing sector hourly productivity increased by around 2 per cent.
Figure 1.18 Contributions to productivity growth
-1.5
-1.0
-0.5
0.0
0.5
1.0
1.5
2.0
2.5
1998-2007average
2008-2009average
2010-2019average
2020
Allocation effectsConstruction and agricultureServicesManufacturingTotal
Source: ONS, NIESR calculations
As the economy re-opens, it is anticipated that less productive firms will resume trading and therefore temper the observed rise in overall productivity. Although the data is likely to be subject to large revisions in the near future (ONS, 2021), productivity rises may also partly be reflecting accelerated use of new technologies including digitisation and automation, as firms adjusted to the pandemic.
Our main-case scenario envisages 1 per cent growth in labour productivity in the medium term but with significant downside risksLabour productivity increased by 0.8 in the first quarter of 2021 as hours worked dropped more than GDP during the winter lockdown. Our main-case scenario is for labour productivity to grow by 0.7 per cent in each of 2021 and 2022 as the economy normalises. We forecast a higher rate of labour productivity growth from 2023, averaging 1 per cent a year between 2023 and 2025, implying sustained positive effects from the acceleration in digital transformation during the pandemic (discussed in Van Ark, 2021).
However, there are significant downside risks; for example, productivity gains may be concentrated in already high-performing businesses with limited spillover effects for
the rest of the economy, and investment in R&D and new technologies might be weaker due to deteriorated balance sheets or persistent demand deficiencies.
The statistical adjustment for double deflation is likely to lead to revisions in our labour productivity forecasts following the publication of quarterly productivity estimates consistent with Blue Book 2021 in October 2021. On one hand, the implementation of double deflation implies a slightly stronger trend for labour productivity growth after the Global Financial Crisis, which is likely to be reflected in medium-term forecasts. But it might also imply a downward revision to growth in the short-term due to a base effect if the present level of productivity is revised up significantly.
A permanent increase in home working may have small consequences for productivityResearch about the impact on productivity of an increase in home-working remains inconclusive. On average, workers in the UK report being as productive as they were pre-pandemic. There may be productivity gains for jobs which are better suited, and workers who have previously worked at home, but reductions in productivity have been reported for others (see Marioni, 2021).
Trade
Imports account for the majority of the fall in expenditure at the start of the yearIn the first quarter of 2021 UK gross final expenditure – GDP plus imports – fell by almost £30 billion (in constant 2018 prices). However, after the removal of expenditure on imports, which fell by over £20 billion, the reduction in GDP was less than £10 billion. Given that renewed Covid restrictions were concentrated in service sectors with low import intensity (hospitality, transport, education and retail), the dramatic fall in imports is unlikely to have been principally driven by the new lockdown. Indeed, the decrease was much larger for trade with the EU than with the rest of the world, and much larger in goods than services. £11 billion of the £15 billion decrease in goods imports from the EU was in chemicals, materials, machinery and transport equipment: not commodities obviously linked to lockdown.
Brexit disruption accounts for the lion’s share of the fall in the first quarter and imports from the European Union have struggled to recover since JanuaryTotal trade (exports plus imports) with the European Union fell by 22 per cent in the first quarter of the year, compared with a 4.5 per cent fall in trade with the rest of the world, suggesting that Brexit was having a large effect. Some of this reflects the natural unwinding of the temporary increase in UK-EU trade which occurred at the end of 2020, driven by uncertainty about the coming change. Temporary ‘teething problems’, such as new

National Institute of Economic and Social Research 17
National Institute UK Economic Outlook – Summer 2021
paperwork and customs checkpoints, have also played a role but are being gradually reduced.5
Figure 1.19 shows the evolution of import and export volumes since the start of 2020 relative to the same month in 2018, the last year before the UK’s first planned exit from the EU and the Covid-19 pandemic both affected monthly trade figures. Imports from both the EU and elsewhere suffered in Spring 2020, during the UK’s first and largest national lockdown, but the fall in January 2021 (and slow recovery) is much more evident in imports from the EU. Synthetic control methods by UK Trade Policy Observatory (Tamberi, 2021) find UK exports to the EU 42 per cent below counterfactual in January and still down by 14 per cent in April, while imports fell by less initially but more persistently: over 25 per cent down on a counterfactual scenario. This could be because of greater problems with new paperwork on the UK side of the border, a decrease in demand for EU-produced products, or even substitution of non-EU suppliers in supply chains.
Figure 1.19 UK imports and exports
50
60
70
80
90
100
110
Jan 20 Apr 20 Jul 20 Oct 20 Jan 21 Apr 21
Equ
ival
ent
mon
th in
20
18 =
10
0
EU exports EU imports
Non-EU exports Non-EU imports
Source: ONS, NIESR calculations
Relatively supportive sterling conditions should have limited the cost to importers of price rises in Europe and the rest of the worldSterling’s appreciation since the start of the year ought to have helped importers offset rising input costs, so weak imports are not driven by price movements. The volatility of trade data means that it may nonetheless be some time before we can answer with certainty how much of the shift is permanent, how much has been compensated by trade with the rest of the world, how much by increased domestic production and how much by reduced expenditure.
5 Since the start of the year Eurostat data have recorded lower exports from the UK to the EU than UK data, due to methodology changes, with no corresponding difference in imports data. Research suggests that HMRC/ONS data are more accurate and should be used for comparison: see Gasiorek, M. and Tamberi, N. (2021) ‘Trade data statistics’, University of Sussex Business School Working Paper 09-2021
The restrictions placed on international travel are likely to impact on exports and imports in the third quarter particularly, as discussed on page 7, resulting in less cross-border economic activity. Over the medium-term export volumes are forecast slightly higher, due to stronger global demand. In our central case forecast scenario the current account deficit narrows further to 2.5 per cent of GDP this year, returning to around 4 per cent of GDP for the majority of the forecast period. The effective exchange rate is expected to remain around its current level between now and 2025.
Fiscal policy
The deficit was lower in 2020-21 than previously expected…The budget deficit for financial year 2020-21 was slightly lower than expected, at £299 billion or 14.2 per cent of GDP, compared to £322 billion, or 15.6 per cent of GDP in our May forecast. The downward revision can be explained by lower managed expenditure and slightly higher receipts.
…but fiscal stimulus continues into 2021-22Covid-related fiscal stimulus is continuing into the current financial year, with, for example, lower Value Added Tax rates in hospitality and tourism. Borrowing in the first two months of 2021-22 came to £53.4 billion, lower than the £91.1 billion in the first two months of 2020-21 when the government initiated extraordinary support at the beginning of the pandemic, but higher than the £11.9 billion seen in 2019-20. We have revised down our forecast for public sector borrowing to £194 billion or 8.2 per cent of GDP in 2021-22, compared to 9.6 per cent of GDP in the May forecast, mainly as a result of higher receipts on the back of stronger GDP growth.
The super-deduction will have limited macroeconomic effectsThe current tax deduction on investment in plant and machinery (the ‘super-deduction’ announced at the Budget in March) is forecast to help business investment back towards pre-pandemic levels, but we do not forecast a sustained investment boom as the end of the deduction in March 2023 and higher corporation tax thereafter reduce the expected earnings from investment.
Government debt peaks at close to 100 per cent of GDP in 2022-23Sustained fiscal consolidation is expected to increase in 2022-23, with the headline corporation tax rate being increased from 19 to 25 per cent in 2023. The March Budget also includes downward revisions to the departmental spending envelope ahead of the expected Spending Review and reports since have suggested a tough

18 National Institute of Economic and Social Research
National Institute UK Economic Outlook – Summer 2021
spending round: see Box D for a discussion of the impact of the reduction in government spending on foreign aid in 2021.
Figure 1.20 Public sector net debt
0
20
40
60
80
100
120
1960 1970 1980 1990 2000 2010 2020
Per
cen
t of
GD
P
Forecast
Source: ONS, NIESR forecast
Public sector net debt stood at £2.2 billion in May and is still increasing due to the relatively high level of borrowing. The debt stock has risen from around 80 per cent of GDP before the pandemic to close to 100 per cent (Figure 1.20). We expect the recovery in GDP and the reduction in public spending to slow this rise to 96.4 per cent at the end of 2021-22 and 98.6 per cent in 2022-23.
Debt is forecast to decline as a share of GDP thereafter, partly thanks to the assumed end of the Term Funding Scheme. The fall of 1.4 percentage points in 2025-26 suggests that additional public investment in excess of £30 billion would be compatible with a stable debt-to-GDP ratio. As described in our Spring Economic Outlook, preparing for future shocks to public health (or reducing the risk of catastrophic climate change) has economic benefits in the longer term which may outweigh the short-term benefit from reducing public debt.
Debt interest payments decline as a share of GDP despite the recent rise in inflationThe increase to our inflation forecast this year and next leads to higher debt interest payments both through index-linked gilts and higher interest rate forecasts but, even taking this into account, debt interest payments decline in
our main case scenario from 2 per cent of GDP in 2020 to 1.9 per cent this year and 1.8 per cent next year. This is an upward revision from our May forecast of 1.5 per cent of GDP this year and next (see Figure 1.21).
Figure 1.21 UK government debt interest payments
0.0
0.5
1.0
1.5
2.0
2.5
3.0
3.5
2015
2016
2017
2018
2019
2020
2021
2022
2023
2024
2025
Per
cen
t
August forecast May forecast
Source: NiGEM database, NIESR forecast
Government debt interest is more sensitive to Bank Rate rises but these are likely to be offset by increased tax receipts from higher GDPQuantitative easing has reduced the cost of servicing debt because the Bank of England pays interests to the Treasury on the gilts it holds. This has however made debt interest payments more sensitive to changes in short-term interest rates because it has reduced the average maturity of public sector net debt (which includes Bank of England holdings).
Higher than expected inflation that triggers a monetary policy tightening by increasing interest rates or reducing QE may constitute a risk to the fiscal forecast but, as explained in Macqueen (2021), an increase in debt interest payments is not a concern when occasioned by a rise in real GDP, because government revenues also rise. Upward revisions to inflation also aid the fiscal position through fiscal drag while both nominal and real gains lead to a larger denominator for the debt/GDP ratio.
National Institute of Economic and Social Research 19
National Institute UK Economic Outlook – Summer 2021
Inflation and monetary policy
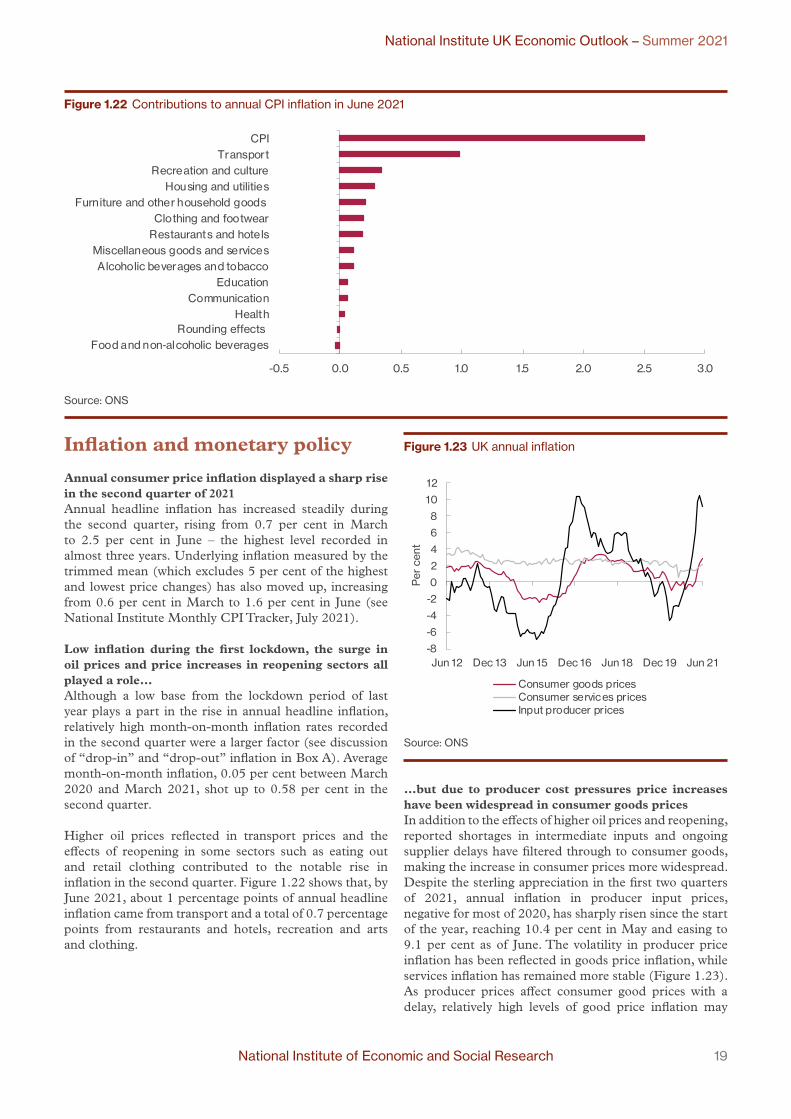
Annual consumer price inflation displayed a sharp rise in the second quarter of 2021Annual headline inflation has increased steadily during the second quarter, rising from 0.7 per cent in March to 2.5 per cent in June – the highest level recorded in almost three years. Underlying inflation measured by the trimmed mean (which excludes 5 per cent of the highest and lowest price changes) has also moved up, increasing from 0.6 per cent in March to 1.6 per cent in June (see National Institute Monthly CPI Tracker, July 2021).
Low inflation during the first lockdown, the surge in oil prices and price increases in reopening sectors all played a role…Although a low base from the lockdown period of last year plays a part in the rise in annual headline inflation, relatively high month-on-month inflation rates recorded in the second quarter were a larger factor (see discussion of “drop-in” and “drop-out” inflation in Box A). Average month-on-month inflation, 0.05 per cent between March 2020 and March 2021, shot up to 0.58 per cent in the second quarter.
Higher oil prices reflected in transport prices and the effects of reopening in some sectors such as eating out and retail clothing contributed to the notable rise in inflation in the second quarter. Figure 1.22 shows that, by June 2021, about 1 percentage points of annual headline inflation came from transport and a total of 0.7 percentage points from restaurants and hotels, recreation and arts and clothing.
Figure 1.23 UK annual inflation
-8
-6
-4
-2
0
2
4
6
8
10
12
Jun 12 Dec 13 Jun 15 Dec 16 Jun 18 Dec 19 Jun 21
Per
cen
t
Consumer goods pricesConsumer services pricesInput producer prices
Source: ONS
…but due to producer cost pressures price increases have been widespread in consumer goods pricesIn addition to the effects of higher oil prices and reopening, reported shortages in intermediate inputs and ongoing supplier delays have filtered through to consumer goods, making the increase in consumer prices more widespread. Despite the sterling appreciation in the first two quarters of 2021, annual inflation in producer input prices, negative for most of 2020, has sharply risen since the start of the year, reaching 10.4 per cent in May and easing to 9.1 per cent as of June. The volatility in producer price inflation has been reflected in goods price inflation, while services inflation has remained more stable (Figure 1.23). As producer prices affect consumer good prices with a delay, relatively high levels of good price inflation may
Figure 1.22 Contributions to annual CPI inflation in June 2021
-0.5 0.0 0.5 1.0 1.5 2.0 2.5 3.0
Food and non-alcoholic beverages Rounding effects
Health Communication
Education Alcoholic beverages and tobacco
Miscellaneous goods and services Restaurants and hotels Clothing and footwear
Furniture and other household goods Housing and utilities
Recreation and culture Transport
CPI
Source: ONS

20 National Institute of Economic and Social Research
National Institute UK Economic Outlook – Summer 2021
persist in the short term before starting to come down as disruptions to supply chains ease.
The rise in consumer inflation will continue in the short-term, with a likely peak in the first quarter of 2022Supply-side factors and the effects of reopening which have dominated the recent surge in inflation are likely to keep inflationary pressures high in the short-term. The recovery in aggregate demand will also contribute to higher inflation through increased capacity utilization rates. Base effects will continue to add to the volatility in inflation in the coming months, having a notable downward effect in July and September but an upward effect in August. The VAT cut of 2020 is scheduled to be reversed in October 2021 and April 2022, which will add to the upward pressure on annual consumer price inflation depending on the degree of pass-through (See Box A).
Figure 1.24 Expectations of annual inflation
0.0
0.5
1.0
1.5
2.0
2.5
3.0
3.5
4.0
2009 2011 2013 2015 2017 2019 2021
Per
cen
t
5-year breakeven inflation rate
Household inf lation expectations
Source: Bank of England, Resolution Foundation, NIESR calculations Notes: Household expectations are based on Inflation Attitudes Survey, financial market expectations are based on 5-year break even inflation rates.
Our main-case inflation forecast is conditional on policy rates rising in the last quarter of next yearAs a result, in our main-case scenario, we forecast CPI inflation to rise to 3.5 per cent in the last quarter of the year, peaking at 3.9 per cent in the first quarter of 2022 but falling again to settle around 2 per cent in 2023 (see Figure 1.25). The removal of temporary factors such as rising VAT for certain sectors and the pass-through from higher input prices will be instrumental in the forecast fall over the rest of 2022, i.e. base effects working in the opposite direction. However, this forecast is conditional on policy rates starting to be normalised in the last quarter of next year (in line with market expectations), and inflation expectations remaining well-anchored, limiting
possible secondary effects from supply-side factors, which are assumed to be temporary.
Dislodged inflation expectations and stronger demand side recovery are the main upside risks to inflationAlthough inflation expectations have not yet displayed any notable rise (Figure 1.24), annual inflation is expected to remain above target for most part of next year, which could lead to dislodging of expectations, posing an upside risk to our inflation forecasts for next year and beyond. A stronger than expected recovery in consumption, possibly led by a faster unwinding of accumulated savings, also constitutes an important upside risk, which could imply inflation remaining above the 2 per cent target beyond 2022 (Figure 1.25).
To be alert to the potential for transitory inflation effects becoming more persistent, a number of indicators should be monitored over the coming weeks and months: underlying wage growth after adjusting for base and compositional effects; market and household expectations for future inflation; firm mark-ups; and any sign of contagion from sectors experiencing temporarily high inflation (see Figure 1.22 and Dixon, 2021) to the rest of the economy.
Figure 1.25 Inflation fan chart
-2
-1
0
1
2
3
4
5
6
7
2018 2020 2022 2024
Per
cen
t
Forecast
Source: NiGEM database, NIGEM forecast, NIGEM stochastic simulation Notes: The fan chart is intended to represent the uncertainty around the main-case forecast scenario shown by the black line. There is a 10 per cent chance that CPI inflation in any particular year will lie within any given shaded area in the chart. There is a 20 per cent chance that CPI inflation will lie outside the shaded area of the fan. The Bank of England’s CPI inflation target is 2 per cent per annum.

National Institute of Economic and Social Research 21
National Institute UK Economic Outlook – Summer 2021
Figure 1.26 Bank of England policy rate
0
1
2
3
4
5
6
7
8
1997 2001 2005 2009 2013 2017 2021 2025
Per
cen
t
May forecast August forecast
Forecast
Source: NiGEM database, NIESR forecast
We recommend that the Bank of England starts preparing the ground for normalising its monetary policy stance by clearly communicating how Bank Rate and asset purchases will be adjusted in response to a changing inflation outlook Both the main-case scenario and the balance of risks around it suggest that the Bank of England’s priority should be to keep inflation expectations well anchored around the 2 per cent inflation target in order to prevent the forecast rise in short-term inflation from feeding into a wage and price spiral, making the increase more permanent. In line with market expectations at the time of the forecast, we anticipate the first rise in Bank Rate taking place in the fourth quarter of 2022.
As we have emphasised previously (see Barwell, 2021, and Chadha, 2021) the Bank of England ought to give more guidance as to the timing and instrument of monetary policy tightening to contain inflation expectations. A change in the Bank’s communication to signal a tighter stance conditional on the persistence of inflationary pressures beyond the transitory effects, and the announcement of a plan for tapering asset purchases when required, might help start monetary policy normalisation without causing a significant tightening in financial conditions which risks the ongoing recovery from the pandemic.
Bank of England communication around tapering and policy rate normalisation will be crucial to avoid a significant tightening in financial conditionsAlthough quantitative easing (QE) programmes have a significant impact in lowering government bond yields (Rossi, 2021), there is considerable uncertainty regarding their effectiveness across different states of the economy, the strength of their transmission channels and their interaction with the policy rate, especially when a normalisation of the monetary policy stance is required. As Bailey (2020) argues, to the extent that QE is more effective during crisis periods, there might be a stronger case for relying more on balance sheet unwind during normalisation, but there is little prior experience with tapering asset purchases and the effects of the unwind on long-term yields through the portfolio rebalancing and signalling channels remain uncertain. Hence, the Bank of England needs to communicate any taper plan very carefully, including its implications for future path of policy rates, in order to avoid overreaction from financial markets (Box B provides a discussion of the literature on different aspects of unwinding QE).
22 National Institute of Economic and Social Research
National Institute UK Economic Outlook – Summer 2021
REFERENCESBailey, A. (2020), ‘The central bank balance sheet as a policy
tool: past, present and future’, Paper prepared for the Jackson Hole Economic Policy Symposium, 27–28 August 2020
Banks, W., Karmakar, S. and Walker, D. (2021) ‘What types of businesses have used government support during the Covid-19 pandemic?’, Bank Underground, 5 July
Barwell, R. (2021), ‘MPC communication: the case for taking back control of financial conditions’, May 2021, UK Economic Outlook, Spring 2021 issue.
Chadha, J.S (2021), Written evidence submitted to the Quantitative Easing Inquiry by Economic Affairs Committee https://committees.parliament.uk/writtenevidence/36897/html/
Dixon, H. (2020), ‘Will CPIH inflation understate inflation for April 2020?,’ NIESR blog https://www.niesr.ac.uk/blog/will-cpih-inflation-understate-inflation-april-2020
Dixon, H. (2021) ‘CPI Inflation, June 2021’, NIESR blog, 14 July
Franklin, F., Green, G., Rice-Jones, L., Venables, S. and Wukovits-Votzi, T. (2021) ‘Household debt and Covid’, Bank of England Quarterly Bulleting, 2021 Q2
Haskel, J, (2021), ‘Will the pandemic “scar” the economy?’, Speech at online webinar at the University of Liverpool Management School, 19 July 2021.
Lenoël, C. and Young, G. (2021) ‘Modelling the impact of Covid-19 on the UK economy: an application of a disaggregated New-Keynesian model’, forthcoming
Macqueen, R. (2021) ‘Interest rate rises and Covid-19 government debts’, NIESR UK Economic Outlook, Spring 2021, May.
Marioni, L. (2021) ‘Will people go back to the office after the pandemic?’, Economics Observatory, July
ONS, (2021), ‘Impact of double deflation on labour productivity: 1997 to 2018’, 28 June 2021.
Rossi, B. (2021) ‘Identifying and estimating the effects of unconventional monetary policy: How to do it and what have we learned?’, The Econometrics Journal 24:1
Tamberi, N. (2021) ‘UK-EU trade and the TCA update: results up to April 2021’, UK Trade Policy Observatory blog, 23 July
Van Ark, B., de Vries, K., and Erumban, A. (2020) ‘How to not miss a productivity revival once again?’National Institute Economic Review, February 2021, pp. 9-24.
Van Ark, B. (2021), ‘Outlook on Productivity in 2021’, The Productivity Institute, May 18, 2021.
https://www.productivity.ac.uk/news/outlook-on-productivity-for-2021/

National Institute of Economic and Social Research 23
National Institute UK Economic Outlook – Summer 2021
Box A The simple arithmetic of inflation. Using “drop-in” and “drop-out” for exploring future short-run inflation scenarios.
By Huw Dixon1
1 NIESR and Cardiff University. The author is grateful to Jagjit Chadha and Rory Macqueen for helpful comments and suggestions.
Inflation is reported and understood as an annual variable: it states the proportional growth of prices over the previous twelve months to the present. Inflation figures are published each month, with a month’s lag. The June 2021 inflation data were published on 14th July 2021: CPI inflation was 2.5 per cent (CPIH 2.4 per cent), meaning that the general level of prices in June 2021 was 2.4 per cent (2.5 per cent) higher than in June 2020. Monthly inflation is also published, going back for over a year, giving the month-on-month inflation (mom), the proportionate growth of inflation between months: for example, the June 2021 mom inflation was 0.4 per cent, meaning prices in June were 0.4 per cent higher than in May 2021. The headline annual and the month-on-month inflation are linked by a simple approximation that works very well when inflation rates are low (as they are now).
Annual Inflation = Sum of monthly inflation for the last 12 months.
Thus, the June 2021 headline inflation of 2.4 per cent equals the sum of mom inflation from July 2020 through to June 2021 (inclusive), giving us the twelve-monthly figure. The change in the headline annual rate as we move forward by one month has two elements: the new monthly inflation “drops in”, the previous eleven months stay the same, and the thirteenth month “drops out”. Thus, if we compare the CPI for June 2021 (2.4 per cent) with May 2021 (2.1 per cent), we see the monthly inflation for May-June 2021 drop in (0.5 per cent) and the old inflation for May-June 2020 (0.1 per cent) drop-out. Hence the change in inflation (0.4 per cent) equals the sum of the new inflation 0.5 per cent which drops in minus the old inflation 0.1 per cent which drops out.
This simple relationship means that in July 2021, we already know the inflation that will drop out month by month for the next eleven months until the May-June 2021 eventually drops out in June 2022. The rate of monthly inflation is highly variable: whilst it has a mean of 0.17 per cent (which equates to an annual inflation rate of 2 per cent), it can be much higher or lower in any single month (although most of the values are between 0.6 per cent and -0.2 per cent). We do not know how the inflation will drop in over the coming months. However, we can make some assumptions to construct simple future scenarios.
In the first scenario, we can simply assume a constant monthly drop-in rate equal to the long-run average of 0.17 per cent (the “medium” case). In addition to this we can look at a “high” scenario with drop-ins at 0.25 per cent (equivalent to annual inflation of 3 per cent) and a “low” scenario of 0.08 per cent (equivalent to 1 per cent annual inflation). This then gives us predicted paths of inflation from June 2021 to June 2022, which reflect the known “drop outs” over this period (sometimes called “base effects”). If we do this, then we get the path of inflation depicted in Figure 1:
Figure 1 Scenario 1. A constant drop-in of new inflation
0.0
0.5
1.0
1.5
2.0
2.5
3.0
3.5
4.0
4.5
Mar-20 Jun-20 Sep-20 Dec-20 Mar-21 Jun-21 Sep-21 Dec-21 Mar-22 Jun-22
Per
cen
t
Medium Low High
Actual Future "Predicted"Inflation peaks in March 2022 at 3.4% under the
medium scenario and 4% under the high scenario
4%
3.4%
Future Inflation: Simple "Drop out"
Source: Author calculations based on ONS CPI data

24 National Institute of Economic and Social Research
National Institute UK Economic Outlook – Summer 2021
In scenario 1, annual inflation peaks at 3.4 per cent in February with medium drop-ins and 4 per cent with high drop-ins. Inflation then declines rapidly (a mirror image of the surge in March-June 2020) despite constant mom inflation. Most economists would agree that the low drop-in scenario is unlikely in the coming months, but even this predicts a peak of 2.7 per cent annual inflation.
However, maybe we know more about the future, and can “adjust” the future drop-ins to reflect this. For example, we know that the VAT reduction introduced in July 2020 temporarily (a 5 per cent reduced rate of VAT relating to hospitality, hotel and holiday accommodation and admission to certain attractions) will be reversed in the coming months. There will be an increase from 5 per cent to 12.5 per cent in October 2021 (7.5 per cent pp up) and another from 12.5 per cent to 20 per cent from April 2022 (7.5 percentage points up). Assuming a CPI ‘basket’ share of up to 8.5 per cent and that these VAT increases are 100 per cent is passed on, this could imply up to 0.65 percentage points being added to mom inflation in these two months. This is surely an overestimate, since 100 per cent pass through is highly unlikely, but possible. However, we can add this as an additional “drop in” in the two relevant months of September 2021 and March 2022, depicted in Figure 2 for the three scenarios. Retaining our monthly drop-in assumptions from Scenario 1 otherwise, and concentrating on the medium and high cases, inflation peaks at 4.1-4.8 per cent in April 2022 and falls back to 2-3 per cent by April 2023.
Figure 2 Scenario 2 VAT changes with full pass through
0
1
2
3
4
5
Mar-20 Jun-20 Sep-20 Dec-20 Mar-21 Jun-21 Sep-21 Dec-21 Mar-22 Jun-22
Per
cen
t
Low High
VAT increases scheduled for October 2021 and April 2022
4.8%
4.1%
Actual Future "Predicted"
Inflation Peaks in April 2022 at 4.1% under the medium
scenario and 4.8% under the high scenario
Future Inflation with Simple Drop Out with VAT increases
Source: Author calculations based on ONS CPI data
Of course, we may still know more about the future (for example likely changes to regulated prices such as energy) and can also allow for seasonality (rather than a constant drop-in rate have it varying with the usual “calendar month” effects). This simple ‘hack’ of representing annual inflation as the sum of the twelve-monthly values provides a simple way of getting this information into forecasts for the coming months.
How accurate is the approximation? It ignores “compounding”. However, with monthly inflation at an average of 0.4 per cent or less (equivalent to 5 per cent annual inflation) this approximation works well to within one decimal place, which is the “precision” of the published inflation data. To be precise, because of rounding, you need to calculate the twelve monthly rates at full precision and then add them up before rounding. The ONS publishes the monthly rates to one decimal place, thus rounding each month individually. These rounding “errors” can accumulate, which is why the ONS annual rate might differ from the sum of the previous twelve monthly rates in its consumer price inflation release.
National Institute of Economic and Social Research 25
National Institute UK Economic Outlook – Summer 2021
Box B The long and uncertain road to exiting Quantitative EasingBy Cyrille Lenoël1
1 NIESR. The author is grateful to Jagjit Chadha, Hande Küçük, Corrado Macchiarelli and Rory Macqueen for helpful comments and suggestions.
2 See Chadha and Holly (2011) for an assessment of the effectiveness of QE and other unconventional monetary instruments used by central banks as a response to the GFC early on. Rossi (2021) provides a review of the recent empirical literature on the effects of QE.
3 Except for a brief episode in 2006 when the Bank of Japan reduced its holding of Japanese Government Bonds from ¥63.8 trillion in January 2006 to ¥49.2 trillion in March 2007. Blinder (2010) describes this episode of monetary tightening as “curious” because it happened at a time when inflation was around 0 per cent.
4 The evidence on the bank lending channel is mixed because it interacts with other channels. Butt et al (2014) and Giansante et al. (2019) find no evidence of an increase in bank lending because of QE in the UK, but Kuang et al find (2020) and Kapoor and Peia (2021) find an effect in the US that depends on the level of reserves and type of assets that banks hold.
There is a rich literature on Quantitative Easing (QE) but less so on its unwinding.2 QE was initiated in 2001 in Japan, followed by the US in 2008 after the Global Financial Crisis, and there has been time to evaluate it, while there has not been any sustained unwinding of QE so far3. The only episode that approaches an unwinding of QE is the so-called ‘Taper Tantrum’ in the United States in 2013, when Treasury yields surged on the news that the Federal Reserve would be slowing down its purchases of bonds.
In this box, we survey the literature on QE and use the findings to discuss possible exit strategies. While there is little consensus among central bankers on the optimal exit strategy, what stands out is that the road to unwinding will probably be a long and uncertain one, and central banks may even keep large amount of government bonds permanently on their balance sheet.
The channels of QE
Quantitative easing is the process whereby a Central Bank (CB) purchases government or corporate bonds to stimulate the economy. Purchases are done in the secondary market in order to prevent ‘monetary financing’, which would be when the CB directly buys bonds issued by the Treasury (Macchiarelli and McMahon, 2020). The purchases tend to reduce the yields on the bonds and thus are intended to feed through to lower interest rates for households and businesses, stimulating economic activity in a similar way as a cut in the policy rate. In the UK, the Bank of England has announced the purchase of £895 billion worth of bonds between November 2009 and November 2020.
QE effects are generally decomposed in the economic literature into three channels: signalling, portfolio rebalancing and liquidity premium (Bailey et al., 2020). When the CB announces its intention to do QE, it also announces a timetable i.e. the total value of bonds to be purchased and over what period – usually several years. Because long rates are closely related to the expected path of short rates, such an announcement is seen by markets as a commitment to ease monetary policy for a significant period, and yields start declining at the announcement date, rather than when the CB actively starts purchasing bonds. This is the signalling channel.
On the other side of the bond transactions are sellers like money market funds or pension funds. These will generally reinvest the proceeds from their sale into other assets with higher yields like shares or properties. That process will in turn reduce the yields of other asset classes, making the households that hold these assets wealthier and able to spend more. This is the portfolio rebalancing channel. The academic literature models this channel by replacing the Efficient Market Hypothesis with assumptions of portfolio preferences so that different assets are imperfect substitutes on account of their non-pecuniary properties (Brainard and Tobin (1963), Andres et al. (2004), Chen et al. (2012) and Harrison (2012)), portfolio adjustment costs (Harrison, 2011, 2017), or preferred habitats, in which investors might demand certain assets for specific – perhaps regulatory – purposes (Vayanos and Vila, 2009, 2020).
The third channel is the liquidity premium. A bond investor will occasionally need to sell some of the bonds it holds and the risk that it may not find a willing buyer on time is called the liquidity premium. This liquidity premium is incorporated in the price of bonds. The fact that the CB becomes a willing buyer of a large quantities of bonds reduces the liquidity premium and therefore yields. The liquidity channel relies on the existence of a market or informational friction, which creates a role for central bank asset purchases in encouraging trading and reducing liquidity premia in a given market (Joyce et al., 2011; Haldane et al., 2016). By meeting the increased demand for safe and liquid assets by the banking sector and acting as a substitute for private sector collateral QE can also support the bank lending channel (Corrado et al., 2020).4

26 National Institute of Economic and Social Research
National Institute UK Economic Outlook – Summer 2021
Diminishing returns?
A difficult question for a CB initiating QE is how to evaluate the amount of bonds necessary to purchase in order to reduce yields to the target level. Is it possible that QE may suffer from diminishing returns whereby the central bank has to buy ever increasing quantities of bonds to have the same marginal effect.
Some studies have found diminishing effects of QE in later rounds – see for example Greenlaw et al. (2018) and Krishnamurthy and Vissing-Jorgensen (2011). One argument for diminishing returns is that the term premium – defined as the difference between the bond yield and the average expected value of future short-term interest rates over the life of the bond – may not decline too much without distorting markets. Via the portfolio rebalancing channel, QE reduces the term premium, which may then become negative. For example, with German Bund yields currently being negative, investors have the option of holding paper currency instead of buying Bunds, which may limit the effect of QE if the European Central Bank wants to increase its QE programme. However, NIESR’s term premium estimate for Germany has been negative since May 2019, and it does not seem to have produced market dysfunctions in Germany or the Euro Area so far (National Institute Term Premium Tracker, June 2021)
On the other hand, additional QE bond purchases may remove bonds from investors who are more reluctant to sell them and thus who demand ever higher prices (and lower yields), suggesting the possibility of non-diminishing returns. In an empirical study, Ihrig et al. (2018) find persistent effect for all rounds of QE in the US.
There are differing views from policy makers about when QE is most effective. Bailey et al. (2020) and Vlieghe (2021) from the Bank of England have argued that QE is particularly effective in crisis times. As expressed by Gertjan Vlieghe “[QE] is a very powerful tool to lower yields when market functioning is poor, by significantly increasing aggregate liquidity through abundant reserves and signalling the willingness to offset shocks. But when market functioning is restored, and if long term yields already at very low levels with inflation expectations near the target, in my view the ability for QE to impart additional macro-economic stimulus is limited. In other words, the impact of QE is state-contingent” (Vlieghe, 2021). But Ben Bernanke, former Federal Reserve chair, argues that “the research rejects the notion that QE is only effective during periods of financial disruption. Instead, once market participants’ expectations are accounted for, the impact of new purchase programs seems to have been more or less constant over time, independent of market functioning, the level of rates, or the size of the central bank balance sheet” (Bernanke, 2020).
Quantitative estimates
Figure B1 shows the minimum, maximum and median estimates from the literature of QE on 10-year yield reduction, normalized to purchases of 10 per cent of GDP, for the US, UK, Japan and Euro Area. The vast majority of the studies are for the US, but there are three for the UK and Euro Area each, and two for Japan. The studies unanimously conclude that QE lowers bond yields significantly, but the range of the estimates is quite wide. In the case of the UK, studies find that a QE expansion of 10 per cent of GDP reduces 10-year gilt yields by 46.5 basis points. Applying this estimate to the £895 billion of announced bond purchases by the Bank of England between 2009 and 2020 (or 47.5 per cent of average GDP), suggests a cumulative decline in 10-year gilt yield of 2.2 percentage points. Over the same period, the yield declined from 3.8 per cent to 0.3 per cent, which suggests that 2.2 percentage points of the 3.5 percentage points decline can be attributed to the QE programme.5
5 The empirical evidence on the effects of QE on low frequency macroeconomic variables like inflation and output is less conclusive. See Rossi (2021) for an excellent review of this literature.
Figure B.1 Literature estimates of effects of QE bond purchases on 10-year yields
67.546.5
68
0
50
100
150
200
250
300
US UK Euro Area Japan
Bas
is p
oint
s (n
egat
ive)
Median
Note: Gagnon (2016) and author’s calculations. Purchases are normalized to 10 percent of GDP.

National Institute of Economic and Social Research 27
National Institute UK Economic Outlook – Summer 2021
Exiting QE
There are mainly two arguments for unwinding QE. The first one is to ‘normalise’ monetary policy so that there is more room to ease when the next negative shock hits the economy (Chadha, 2017). The second is that the recent rise in inflation in the UK may become more persistent if accompanied by a strong demand-side recovery and a rise in wages, and the Bank of England should consider tightening the overall policy stance as soon as next year. The two arguments are, of course, not mutually exclusive.
By reversing the channels of QE discussed above, one can get an idea of the likely effects of unwinding QE. The Taper Tantrum episode provides support for the idea that unwinding QE should be done over several years and in moderate steps, to prevent a strong market reaction. The greater uncertainty about the efficacy and channels of QE compared to the well-known effects of short-term policy rates, also argues for gradualism in unwinding it (Williams, 2013). An announcement to slow down asset purchases and start reducing the stock of holdings would be a strong signal to markets that the CB will tighten monetary policy and not look through a rise in inflation. Gradually reducing bond holdings will reduce liquidity in the government bond markets, and financial intermediaries need to be prepared to see one of the largest participants in this market step back. The portfolio rebalancing channel will lead to higher bond yields and term premia.
The interaction between policy instruments
The quantitative effects of entering and exiting QE may not be symmetrical because of the interaction with policy rates. QE was set up as a complementary easing instrument when policy rates were believed to be at the Zero Lower Bound (ZLB). But now that central banks have two main policy tools (policy rates and QE), it is not clear which should be used first when tightening monetary policy. In the case of the UK, if we assume the same median estimate of QE (46.5 basis points), then the hypothetical case of a full reversal of QE by the Bank of England could increase the 10-year gilt from a current yield of 0.5 per cent to 2.7 per cent. However, there is considerable uncertainty around this estimate not only because of the uncertainty regarding how much the size of the balance sheet will be reduced but also because of the interaction with the policy rate. For example, if Bank Rate is raised first so that it is not at the ZLB, the impact of unwinding QE on yields may be lower per se.6
In its June 2018 meeting, the MPC set out its policy for unwinding QE: the Bank’s balance sheet should be unwound “over a number of years at a gradual and predictable pace”, allowing reserves to fall back to a level demanded by commercial banks as evidenced through participation in regular repo operations. The MPC also declared its preference for increasing Bank Rate first to 1½ per cent, before beginning to reduce its balance sheet. The threshold of 1.5 per cent, while somewhat arbitrary, was viewed as a level from which Bank Rate could be cut materially (or raised further) as necessary. This approach allows Bank Rate to be used as the primary instrument to set the stance of monetary policy in response to shocks in either direction, while a gradual and orderly balance sheet unwind continues. Broadbent (2018) justified this approach by reference to the fact that Bank Rate is a more flexible instrument, which can be adjusted more nimbly to shorter-term macroeconomic shocks, with more predictable effects.
While this policy has the merit of providing clear guidance, it has not been tested against alternative policies of normalisation: either to reduce the balance sheet before increasing Bank Rate, or to act simultaneously on the balance sheet and rates.
There are arguments for reducing the balance sheet first. QE may be more distorting to financial markets than the standard policy rate. By affecting both the short end of the yield curve (with the policy rate) and the long end (with QE), the current policy stance tries to some extent to control the yield curve, which affects an important price signal for financial markets (Chadha, 2021). QE also has an impact on the profitability of some financial intermediaries like money market funds and banks, which may create financial instability and asset price bubbles. Darracq-Paries and Kuehl (2017) explain that frictions in financial markets make QE particularly effective at easing monetary policy at the ZLB via the term premium, and the corollary is that it is optimal to unwind QE before increasing policy rates in order to reduce the welfare costs of portfolio frictions.
6 Another complication regarding the exit from QE and a rise in interest rates relates to its possible impact on public finances given that the share of government debt held by the Bank of England is expected to reach some 40 per cent. The Treasury has received so far an indemnity of £112 billion from the Bank of England from marked-to-market gains associated to the gilts it holds, but is at risk of having to compensate the Bank if yields increase. See Macqueen (2021) and Allen (2021) for a detailed discussion.

28 National Institute of Economic and Social Research
National Institute UK Economic Outlook – Summer 2021
The recent rise in inflationary pressures requires central banks to start preparing the ground for a normalisation in monetary policy. Given the role of supply-side factors in pushing inflation up and continued uncertainties regarding the pandemic, communication around tapering asset purchases and policy rate normalisation will be crucial to avoid a significant tightening in financial conditions which risks the ongoing recovery.
REFERENCESAllen, W.A. (2021), ‘Managing the fiscal risk of higher interest
rates’, NIESR Policy Paper 25, March 2021.Allen W.A., Chadha J.S. and Turner P. (2021), ‘Quantitative
Tightening: Protecting Monetary Policy from Fiscal Encroachment’, National Institute of Economic and Social Research Policy Paper 027.
Andrés, J, López-Salido, J and Nelson, E (2004), ‘Tobin’s Imperfect Asset Substitution in Optimizing General Equilibrium’, Journal of Money, Credit and Banking, 36(4), pages 665–90.
Bailey, A. J., Bridges, J., Harrison, R., Jones, J., & Mankodi, A. (2020). ‘The central bank balance sheet as a policy tool: Past, present and future’. Bank of England Working Paper No. 899.
Bernanke, B. S. (2020), The New Tools of Monetary Policy: American Economic Association Presidential Address. Brookings Institution, January, 4.
Blinder, A. S. (2010), ‘Quantitative easing: entrance and exit strategies’. Federal Reserve Bank of St. Louis Review, 92(6), 465-479.
Brainard, W. C., & Tobin, J. (1963), ‘Financial intermediaries and the effectiveness of monetary controls’. American Economic Review, 53(2), 383-400.
Broadbent, B (2018), ‘The history and future of QE’, speech given at the Society of Professional Economists, London. 23 July
Butt, N., Churm, R., McMahon, M. F., Morotz, A., & Schanz, J. F. (2014), ‘QE and the bank lending channel in the United Kingdom’, Bank of England Working Paper No. 511
Chadha, J. S (2017), ‘Commentary: Interest rate normalisation’, National Institute Economic Review No. 241, August 2017.
Chadha, J.S. (2021), Written evidence submitted to the Quantitative Easing Inquiry by Economic Affairs Committee https://committees.parliament.uk/writtenevidence/36897/html/
Chadha, J.S., & Holly, S. (2011). Interest rates, prices and liquidity. Cambridge University Press.
Chen, H, Cúrdia, V and Ferrero, A (2012), ‘The macroeconomic effects of large-scale asset purchase programmes’, The Economic Journal, Vol. 122, issue 564, pages F289–F315.
Corrado, L., Schuler, T. and Chadha, J.S. (2020), ‘Bank Reserves and Broad Money in the Global Financial Crisis: A Quantitative Evaluation’. ECB Working Paper No. 20202463
Darracq-Paries, M and Kuehl, M (2017), ‘The Optimal Conduct of Central Bank Asset Purchases’, Deutsche Bundesbank Discussion Paper No. 22/2017.
Gagnon, J. (2016). ‘Quantitative easing: An underappreciated success’. PIIE Policy Brief, 16.
Giansante, S., Fatouh, M., & Ongena, S. (2019), ‘Does quantitative easing boost bank lending to the real economy or cause other bank asset reallocation? The case of the UK’, (August 18, 2019). Swiss Finance Institute Research Paper, No.19-72.
Greenlaw, D, Hamilton,J, Harris, J and West, K (2018), ‘A Skeptical View of the Impact of the Fed’s Balance Sheet’, National Bureau of Economic Research Working Paper No. 24687.
Haldane, A, Roberts-Sklar, M, Wieladek, T and Young, C (2016), ‘QE: the story so far’, Bank of England Staff Working Paper No. 624
Harrison, R (2011), ‘Asset purchase policies and portfolio balance effects: a DSGE analysis’, in Chadha, J. S and Holly, S. eds Interest rates, prices and liquidity. Cambridge University Press.
Harrison, R (2012), ‘Asset purchase policy at the effective lower bound for interest rates’, Bank of England Working Paper No. 444.
Harrison (2017), ‘Optimal quantitative easing’, Bank of England Staff Working Paper No. 678.
Ihrig, J, Klee, E, Li, C, Wei, M and Kachovec, J (2018), ‘Expectations about the Federal Reserve’s balance sheet and the term structure of interest rates’, International Journal of Central Banking, Vol. 14(2), pages 341–90.
Joyce, M, Lasaosa, A, Stevens, I and Tong, M (2011), ‘The Financial Market Impact of Quantitative Easing in the United Kingdom’, International Journal of Central Banking, Vol. 7(3): pages 113–61.
Kapoor, S., & Peia, O. (2021), ‘The impact of quantitative easing on liquidity creation’, Journal of Banking & Finance, 122, 105998.
Krishnamurthy, A and Vissing-Jorgensen, A (2011), ‘The Effects of Quantitative Easing on Interest Rates: Channels and Implications for Policy’, Brookings Papers on Economic Activity 42 (Fall), pages 215–65.
Kuang, C., Yang, J. and Zhu, W. (2020), ‘Quantitative Easing and Bank Lending: The Liquidity Channel’, manuscript.
Macchiarelli, C. and McMahon, M. (2020), ‘Quantitative easing and monetary financing: what’s the difference?’, Economics Observatory, 27 May 2020.
Macqueen, R. (2021), ‘Interest rate rises and Covid-19 government debts’, National Institute UK Economic Outlook, Spring 2021.
National Institute Term Premium Tracker, June 2021 available at https://www.niesr.ac.uk/sites/default/files/files/NIESR%20Quarterly%20Term%20Premium%20Tracker%20No_1%20-%20Full%20Document.pdf

National Institute of Economic and Social Research 29
National Institute UK Economic Outlook – Summer 2021
Rossi, B, (2021), ‘Identifying and estimating the effects of unconventional monetary policy: How to do it and what have we learned?’, The Econometrics Journal 24:1
Vayanos, D and Vila, J (2009), ‘A Preferred-Habitat Model of the Term Structure of Interest Rates’, National Bureau of Economic Research Working Paper No. 15487.
Vayanos, D and Vila, J (2020), ‘A preferred-habitat model of the term structure of interest rates’, mimeo, London School of Economics.
Vlieghe, G. (2021) Speech at the University of Bath, on Thursday 27 May 2021
Williams, J (2013), ‘A Defense of Moderation in Monetary Policy’, Journal of Macroeconomics No. 38, December, pages 137–50.
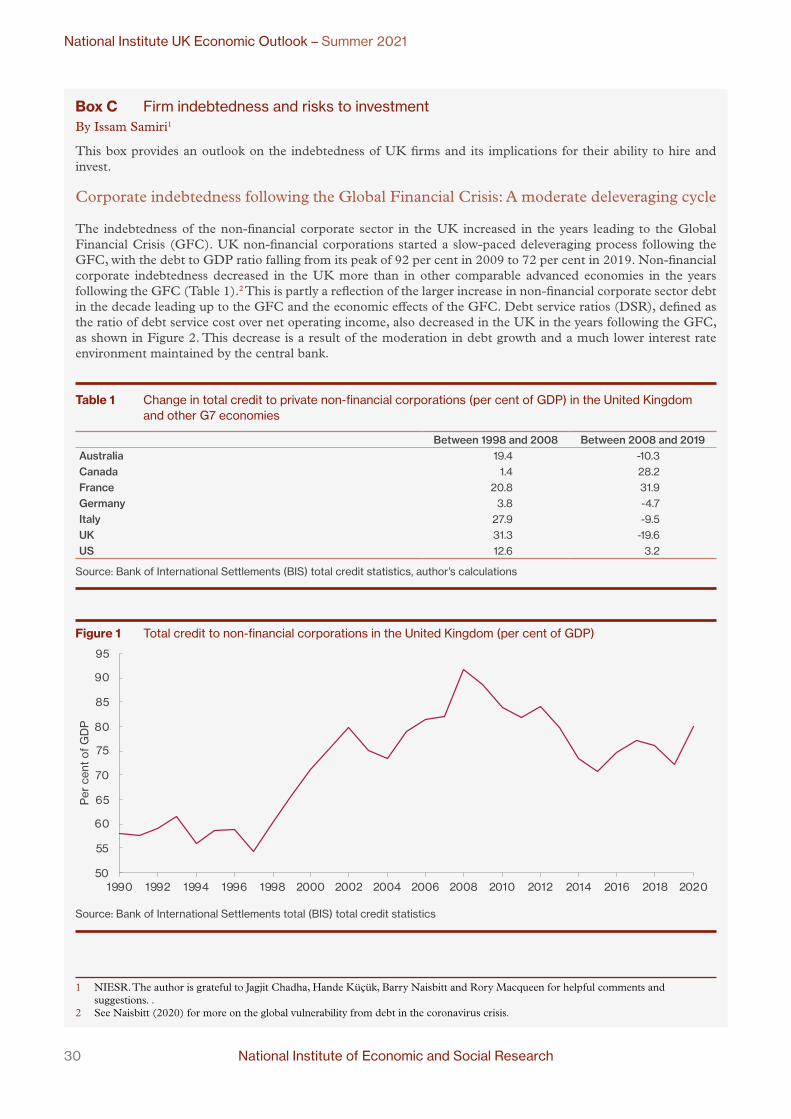
30 National Institute of Economic and Social Research
National Institute UK Economic Outlook – Summer 2021
Box C Firm indebtedness and risks to investmentBy Issam Samiri1
1 NIESR. The author is grateful to Jagjit Chadha, Hande Küçük, Barry Naisbitt and Rory Macqueen for helpful comments and suggestions. .
2 See Naisbitt (2020) for more on the global vulnerability from debt in the coronavirus crisis.
This box provides an outlook on the indebtedness of UK firms and its implications for their ability to hire and invest.
Corporate indebtedness following the Global Financial Crisis: A moderate deleveraging cycle
The indebtedness of the non-financial corporate sector in the UK increased in the years leading to the Global Financial Crisis (GFC). UK non-financial corporations started a slow-paced deleveraging process following the GFC, with the debt to GDP ratio falling from its peak of 92 per cent in 2009 to 72 per cent in 2019. Non-financial corporate indebtedness decreased in the UK more than in other comparable advanced economies in the years following the GFC (Table 1).2 This is partly a reflection of the larger increase in non-financial corporate sector debt in the decade leading up to the GFC and the economic effects of the GFC. Debt service ratios (DSR), defined as the ratio of debt service cost over net operating income, also decreased in the UK in the years following the GFC, as shown in Figure 2. This decrease is a result of the moderation in debt growth and a much lower interest rate environment maintained by the central bank.
Table 1 Change in total credit to private non-financial corporations (per cent of GDP) in the United Kingdom and other G7 economies
Between 1998 and 2008 Between 2008 and 2019Australia 19.4 -10.3Canada 1.4 28.2France 20.8 31.9Germany 3.8 -4.7Italy 27.9 -9.5UK 31.3 -19.6US 12.6 3.2
Source: Bank of International Settlements (BIS) total credit statistics, author’s calculations
Figure 1 Total credit to non-financial corporations in the United Kingdom (per cent of GDP)
50
55
60
65
70
75
80
85
90
95
1990 1992 1994 1996 1998 2000 2002 2004 2006 2008 2010 2012 2014 2016 2018 2020
Per
cen
t of
GD
P
Source: Bank of International Settlements total (BIS) total credit statistics

National Institute of Economic and Social Research 31
National Institute UK Economic Outlook – Summer 2021
Figure 2 Debt service ratios (DSR) of non-financial corporations in the UK (per cent)
29
31
33
35
37
39
41
43
45
2004 2005 2006 2007 2008 2009 2010 2011 2012 2013 2014 2015 2016 2017 2018 2019 2020
Source: Bank of International Settlements (BIS) total credit statistics
The pandemic and business indebtedness in the UK: More debt overall, more so for smaller businesses
Although firms’ indebtedness has decreased since the GFC, corporate debt remained relatively high in historic terms in the years leading up to the pandemic (Figure 1). When the pandemic struck, the need to close the cashflow gap created by the pandemic-related economic disruption led to further demand for debt.
While £75.5 billion of net financing was raised by the UK’s private non-financial corporations between March 2020 and May 2021 (Table 2), approximately £75 billion was raised through the government Covid-19 lending schemes.3 The UK government offered three loan packages to help UK firms weather the pandemic induced economic disruption: the Coronavirus Business Interruption Loan Scheme (CBILS), the Coronavirus Large Business Interruption Loan Scheme (CLBILS) and the Bounce Back Loan Scheme (BBLS). The CBILS was designed to provide financial support to smaller businesses, with loans of less than £5 million, while the CLBILS was dedicated to larger businesses with a turnover of more than £45 million by providing loans of up to £200 million. The BBLS was dedicated to provide businesses with readily available liquidity up to £50,000. These loan schemes were all issued by a selection of lenders with a full government-backed guarantee for the CBILS and BBLS loans and partial government-backed guarantee (80 per cent) for the CLBILS loans. They came to an end in March 2021. Of the £75 billion borrowed through these schemes, only £5.6 billion was borrowed by larger businesses through the CLBILS. A further Recovery Loan Scheme (RLS) opened to applications on 6th April 2021. This scheme provides financial support of up to £10 million to businesses across the UK to help them recover and grow following the pandemic. For loan facilities above £250,000, the RLS provides lenders with up to 20 per cent protection of outstanding balances after the proceeds of business assets have been applied.
Table 2 Net financing raised by the UK’s private non-financial corporations through various instruments from March 2020 to May 2021 (in £ millions)
Net commercial paper issuance -4284Net bond issuance 23409Net shares issuance 28338
Net loan issuance 28033
Net total financing 75496
Source: Bank of England, author’s calculations.
3 British Business Bank figures.
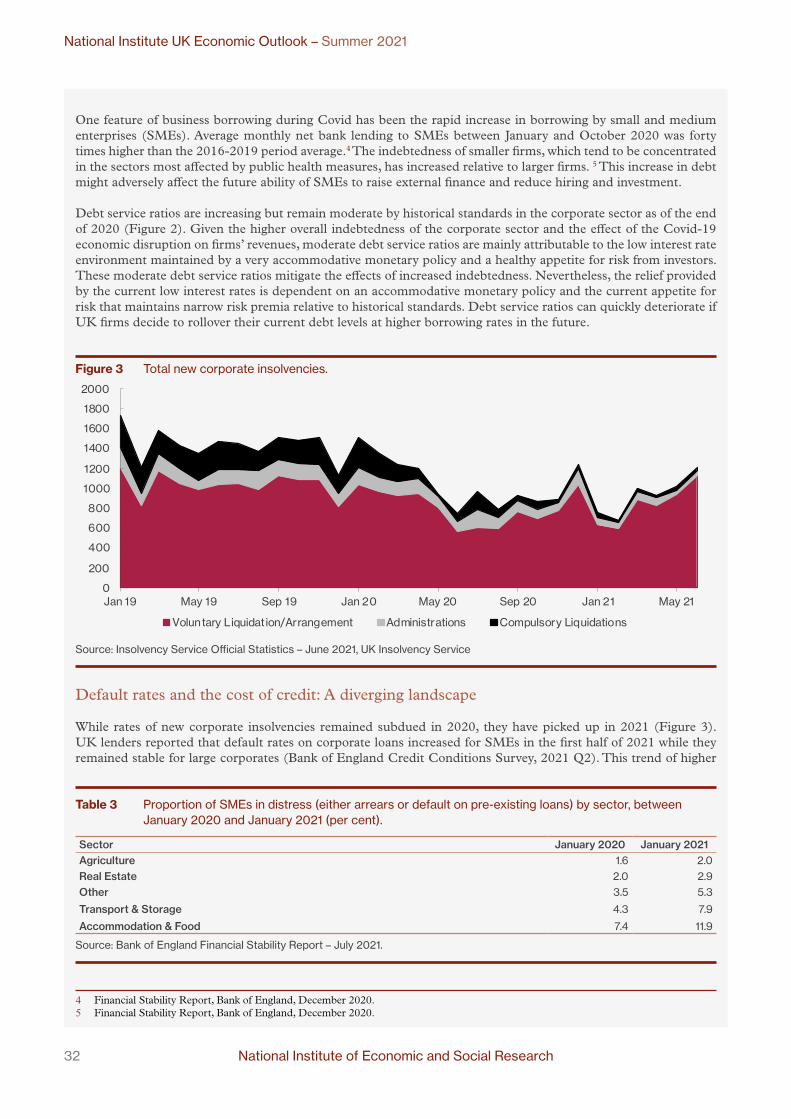
32 National Institute of Economic and Social Research
National Institute UK Economic Outlook – Summer 2021
One feature of business borrowing during Covid has been the rapid increase in borrowing by small and medium enterprises (SMEs). Average monthly net bank lending to SMEs between January and October 2020 was forty times higher than the 2016-2019 period average.4 The indebtedness of smaller firms, which tend to be concentrated in the sectors most affected by public health measures, has increased relative to larger firms. 5 This increase in debt might adversely affect the future ability of SMEs to raise external finance and reduce hiring and investment.
Debt service ratios are increasing but remain moderate by historical standards in the corporate sector as of the end of 2020 (Figure 2). Given the higher overall indebtedness of the corporate sector and the effect of the Covid-19 economic disruption on firms’ revenues, moderate debt service ratios are mainly attributable to the low interest rate environment maintained by a very accommodative monetary policy and a healthy appetite for risk from investors. These moderate debt service ratios mitigate the effects of increased indebtedness. Nevertheless, the relief provided by the current low interest rates is dependent on an accommodative monetary policy and the current appetite for risk that maintains narrow risk premia relative to historical standards. Debt service ratios can quickly deteriorate if UK firms decide to rollover their current debt levels at higher borrowing rates in the future.
Figure 3 Total new corporate insolvencies.
0
200
400
600
800
1000
1200
1400
1600
1800
2000
Jan 19 May 19 Sep 19 Jan 20 May 20 Sep 20 Jan 21 May 21
Voluntary Liquidation/Arrangement Administrations Compulsory Liquidations
Source: Insolvency Service Official Statistics – June 2021, UK Insolvency Service
4 Financial Stability Report, Bank of England, December 2020.5 Financial Stability Report, Bank of England, December 2020.
Default rates and the cost of credit: A diverging landscape
While rates of new corporate insolvencies remained subdued in 2020, they have picked up in 2021 (Figure 3). UK lenders reported that default rates on corporate loans increased for SMEs in the first half of 2021 while they remained stable for large corporates (Bank of England Credit Conditions Survey, 2021 Q2). This trend of higher
Table 3 Proportion of SMEs in distress (either arrears or default on pre-existing loans) by sector, between January 2020 and January 2021 (per cent).
Sector January 2020 January 2021Agriculture 1.6 2.0Real Estate 2.0 2.9Other 3.5 5.3
Transport & Storage 4.3 7.9
Accommodation & Food 7.4 11.9
Source: Bank of England Financial Stability Report – July 2021.

National Institute of Economic and Social Research 33
National Institute UK Economic Outlook – Summer 2021
default rates among SMEs looks likely to continue, as the proportion of SMEs in distress increases (Table 3). Reflecting these realities, the Bank of England Credit Conditions Survey reports that spreads on corporate loan lending to SMEs widened in the first half of 2021 while spreads on loans to larger corporates narrowed in the same period.
The picture emerging from the corporate bond market confirms the trends in the loan market. Better-rated corporates can issue bonds at increasingly lower yields relative to their worse rated peers. Golan (2020) reports that the ratio of BBB-rated to A-rated bond yields widened from 1.2x at the start of 2020 to around 1.45x by September 2020. This corroborates a corporate debt picture of a diverging ability to raise financing within the UK’s corporate sector.
Lenders foresee a divergence in the credit quality of smaller and larger firms, with smaller businesses expected to witness higher default rates than larger firms. Moreover, capital markets imply a divergence in the credit quality of rated corporates, with better rated corporates expected to suffer lower default rates. This is reflected in the price of risk, as larger/better rated firms have been accessing credit with increasingly favourable terms relative to their smaller/worse rated counterparts.
Debt overhang and risks to business investment and hiring
At the start of the pandemic, UK firms were carrying relatively high debt levels by historical standards, with a debt to GDP ratio close to 70 per cent. These levels of indebtedness have increased further since the outbreak of the pandemic to reach 80 per cent by the end of 2020. In addition, smaller firms have increased their indebtedness more relative to larger corporate entities.
Government support helped UK firms remain in business and maintain some of their investments during the pandemic period (Jibril, Roper and Hart, 2021). Nonetheless, a debt overhang can hinder future investment by firms. If the current trends of increasing debt service ratios continue, less of the firms’ cashflows can be dedicated to investments and hiring. In addition, high leverage can increase the risk perceived by investors bringing new capital to the firm, thus increasing the firms’ financing rates and crowding out new investment opportunities with a positive net present value (Krugman, 1988).
The extent of the debt overhang from the build-up of debt in the years before the GFC is one explanation for low business investment in the period that followed the GFC. Kalemli-Ozcan, Laeven, & Moreno (2018) and Barbiero, Popov, & Wolski (2020) show that the negative effect of excessive leverage on investment by European firms (including UK firms) in the post-GFC period was both sizeable and persistent.6
The increased level of indebtedness of UK firms that has resulted from the experience of the pandemic might adversely affect the ability of UK businesses to invest and hire over the next few years. This could especially be the case for SMEs that have accumulated relatively more debt than larger corporates since the start of the pandemic.
REFERENCES
6 Other explanations for low investment in the post-GFC period include higher levels of uncertainty (Baker and Bloom 2013).
Baker, S. R. & Bloom, N. (2013). Does uncertainty reduce growth? Using disasters as natural experiments. National Bureau of Economic Research.
Barbiero, F., Popov, A., & Wolski, M. (2020). Debt overhang, global growth opportunities, and investment. Journal of Banking and Finance.
Demmou, L., Calligaris, S., Franco, G., Dlugosch, D., McGowan, M., & Sakha, S. (2021). Insolvency and debt overhang following the Covid-19 outbreak: Assessment of risks and policy responses. OECD.
Golan, Jonathan;. (2020). Why we see a golden opportunity in corporate bonds. Retrieved from Schroders.com: https://www.schroders.com/en/gr/professional-investor/ insights/markets/why-we-see-a-golden-opportunity-in-uk-corporate-bonds/
Jibril, H., Roper S. & Hart, M. (2021). Covid-19, business support and SME productivity in the UK. The Productivity Institute.
Kalemli-Ozcan, S., Laeven, L., & Moreno, D. (2018). Debt overhang, rollover risk, and corporate investment. National Bureau of Economic Research.
Krugman, P. (1988). Financing vs. forgiving a debt overhang. Journal of Development Economics, 253-268.
Naisbitt, B. (2020). Vulnerability from debt in the Coronavirus crisis. NIESR Policy Paper, 020.

34 National Institute of Economic and Social Research
National Institute UK Economic Outlook – Summer 2021
Box D Foreign aid makes good macroeconomic senseBy Dawn Holland1 and Dirk Willem te Velde2
1 NIESR.2 Overseas Development Institute. The authors are grateful to Jagjit Chadha and Barry Naisbitt for helpful comments and suggestions.3 https://www.gov.uk/government/publications/spending-review-2020-documents/spending-review-20204 https://questions-statements.parliament.uk/written-statements/detail/2021-07-12/hcws1725 https://www.devex.com/news/tracking-the-uk-s-controversial-aid-cuts-998836 https://www.undp.org/for_the_record/Statement_on_UK_funding_cuts
On 25 November 2020, the UK government took the decision3 to reduce the budget for foreign aid from 0.7 to 0.5 per cent of gross national income (GNI) in 2021. On 13 July 2021, Parliament voted in favour of maintaining these cuts, following the Chancellor’s Statement4. This reduces the amount of aid available in 2021 by approximately £4.5 billion compared to what otherwise would have been the case. The announcement does not meet commitments in the main party election manifestos. Nor does it meet targets set in the 2015 International Development Act (although this Act allows for deviations in a single calendar year under certain fiscal circumstances). A UN resolution adopted in 1970 established the Official Development Assistance target of 0.7 per cent of donor countries’ GNI. Fifty years later, the UK was one of just six countries that had achieved this target, alongside Germany, Denmark, Luxembourg, Norway and Sweden.
A £4.5 billion cut represents a small saving to the UK in the short term (0.4 per cent of planned total managed public expenditure of £1,053 billion in 2021). The bulk of this will fall on UK bilateral aid. Figure 1 illustrates UK bilateral aid flows in 2019 relative to the size of GDP in the recipient countries. These flows constitute a crucial source of finance in countries with limited access to international capital markets, and where extreme poverty rates tend to exceed 30 per cent. For example, a 30 per cent “cut” in UK aid to fragile countries such as South Sudan or Somalia would leave a hole in the countries’ financial resources in excess of 1 per cent of GDP. Estimates by Miller and Roger (2021) suggest that UK bilateral aid to Ethiopia will be halved in 2021, an amount worth a quarter of a percentage point of Ethiopian GDP. Devex is tracking reports by aid agencies and other sources on the impact of UK aid cuts5, which have reported significant budget cuts in many other poor countries, including Bangladesh, Central African Republic, Myanmar, Nigeria, South Sudan, Somalia and Yemen. This will pose a substantial cost in these aid recipient countries.
Mitchell, Hughes and Ritchie (2021) estimate that, based on the Government’s reported estimates of aid results over the period of 2015-2020, a cut in UK foreign aid of this magnitude could prevent 5.3 million children a year from being immunised against basic diseases, at a cost of 100,000 lives each year, and 4.5 million children a year may lose out on a decent education. The United Nations Development Programme has issued a Statement on UK funding cuts6, stating that preventing the UK cuts to their organisation alone could have helped 1.2 million people to have better access to basic services; 350,000 people in crisis-affected countries to get a job; 280,000 people to gain access to justice; and 23 million hectares of land and marine habitats to be protected, improved or restored.
The aid cut fails to take into account macroeconomic spillover effects. Holland and te Velde (2012) simulated the effects of aid on both donor and recipient countries using the NiGEM model. They modelled the empirical effects of aid on growth and productivity by applying historical social rates of return from infrastructure spending (Briceño-Garmendia, Estache, and Shafik, 2004) and econometric estimations of the effects of Aid for Trade on reducing trade costs (Cali and te Velde, 2011). The scenarios suggested that an increase in aid that raises growth and productivity in recipient countries – for example, when directed towards infrastructure investment and reducing trade costs – has positive spillover effects on the rest of the world, by reducing consumer prices and expanding the volume of trade, including in those countries providing aid. In short, aid at this kind of level tends to pay for itself. A survey of the literature on aid studies supports the positive relationship between development aid and economic growth (Arndt, Jones and Tarp, 2016), although weak institutions and poor governance in recipient countries may limit the potential returns from development assistance (Bräutigam and Knack, 2004).
The UK benefits directly from external aid through the creation of UK-based jobs, through higher levels of exports and through cheaper imports from aid recipient countries. Mendez-Parra and te Velde (2017) estimate that UK bilateral aid provided 12,000 jobs in 2014 through aid-trade linkages (without tying aid). Cutting aid directly reduces the number of UK-based jobs. The UK also derives indirect benefits from its external aid through the provision of global public goods such as addressing climate change, conflict resolution, or supporting the timely vaccination of the global population.
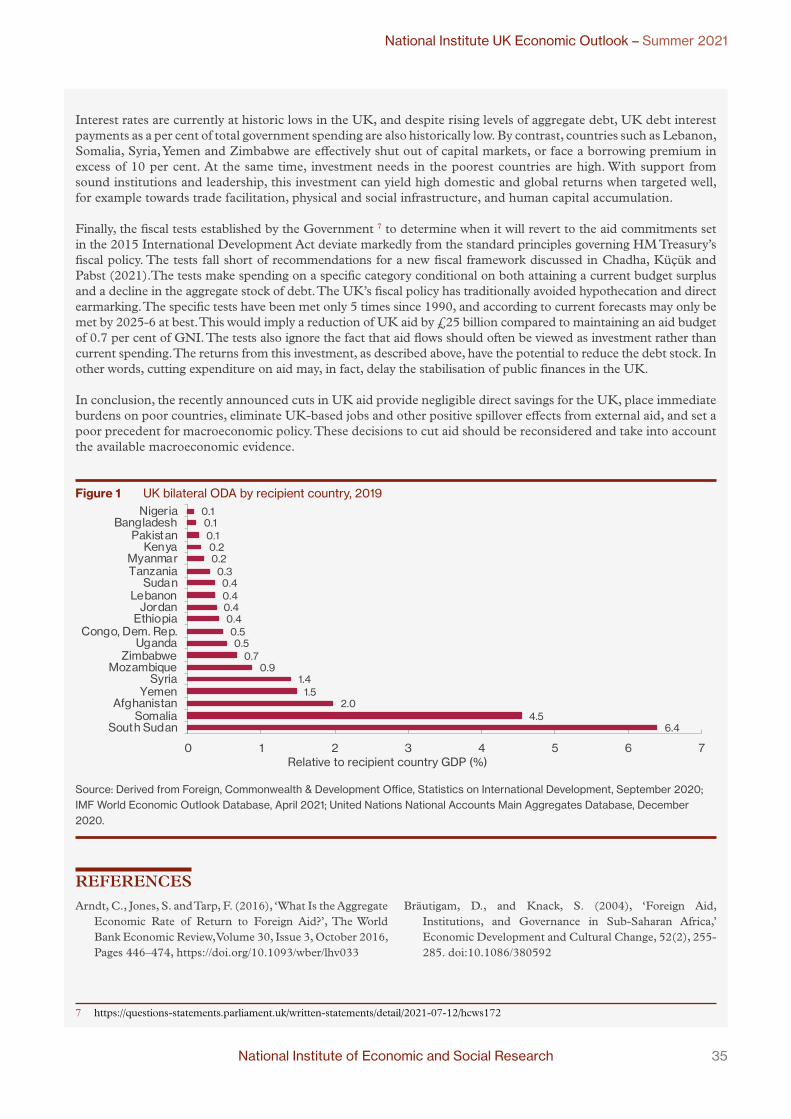
National Institute of Economic and Social Research 35
National Institute UK Economic Outlook – Summer 2021
Interest rates are currently at historic lows in the UK, and despite rising levels of aggregate debt, UK debt interest payments as a per cent of total government spending are also historically low. By contrast, countries such as Lebanon, Somalia, Syria, Yemen and Zimbabwe are effectively shut out of capital markets, or face a borrowing premium in excess of 10 per cent. At the same time, investment needs in the poorest countries are high. With support from sound institutions and leadership, this investment can yield high domestic and global returns when targeted well, for example towards trade facilitation, physical and social infrastructure, and human capital accumulation.
Finally, the fiscal tests established by the Government 7 to determine when it will revert to the aid commitments set in the 2015 International Development Act deviate markedly from the standard principles governing HM Treasury’s fiscal policy. The tests fall short of recommendations for a new fiscal framework discussed in Chadha, Küçük and Pabst (2021).The tests make spending on a specific category conditional on both attaining a current budget surplus and a decline in the aggregate stock of debt. The UK’s fiscal policy has traditionally avoided hypothecation and direct earmarking. The specific tests have been met only 5 times since 1990, and according to current forecasts may only be met by 2025-6 at best. This would imply a reduction of UK aid by £25 billion compared to maintaining an aid budget of 0.7 per cent of GNI. The tests also ignore the fact that aid flows should often be viewed as investment rather than current spending. The returns from this investment, as described above, have the potential to reduce the debt stock. In other words, cutting expenditure on aid may, in fact, delay the stabilisation of public finances in the UK.
In conclusion, the recently announced cuts in UK aid provide negligible direct savings for the UK, place immediate burdens on poor countries, eliminate UK-based jobs and other positive spillover effects from external aid, and set a poor precedent for macroeconomic policy. These decisions to cut aid should be reconsidered and take into account the available macroeconomic evidence.
Figure 1 UK bilateral ODA by recipient country, 2019
6.44.5
2.01.5
1.40.9
0.70.5
0.50.40.40.40.4
0.30.20.2
0.10.10.1
0 1 2 3 4 5 6 7
South SudanSomalia
AfghanistanYemen
SyriaMozambique
ZimbabweUganda
Congo, Dem. Rep.Ethiopia
JordanLebanon
SudanTanzaniaMyanmar
KenyaPakistan
BangladeshNigeria
Relative to recipient country GDP (%)
Source: Derived from Foreign, Commonwealth & Development Office, Statistics on International Development, September 2020; IMF World Economic Outlook Database, April 2021; United Nations National Accounts Main Aggregates Database, December 2020.
REFERENCES
7 https://questions-statements.parliament.uk/written-statements/detail/2021-07-12/hcws172
Arndt, C., Jones, S. and Tarp, F. (2016), ‘What Is the Aggregate Economic Rate of Return to Foreign Aid?’, The World Bank Economic Review, Volume 30, Issue 3, October 2016, Pages 446–474, https://doi.org/10.1093/wber/lhv033
Bräutigam, D., and Knack, S. (2004), ‘Foreign Aid, Institutions, and Governance in Sub-Saharan Africa,’ Economic Development and Cultural Change, 52(2), 255-285. doi:10.1086/380592

36 National Institute of Economic and Social Research
National Institute UK Economic Outlook – Summer 2021
Briceño-Garmendia, C., A. Estache A. and N. Shafik (2004), ‘Infrastructure Services in Developing Countries: Access, Quality, Costs, and Policy Reform’, World Bank Policy Research Paper No. 3468
Cali, M. and D.W. te Velde (2011), ‘Does aid for trade really improve trade performance?’, World Development
Chadha, J., Küçük, H. and A. Pabst (Eds), (2021), Designing a new fiscal framework: Understanding and confronting uncertainty, NIESR Occasional Paper LXI.
Holland, D. and D.W. te Velde (2012), ‘The effects of EU aid on receiving and sending countries. A modelling approach, study for One’, http://one.org.s3.amazonaws.com/pdfs/The_effects_of_EU_aid_on_receiving_and_sending_countries_Report.pdf
Mendez-Parra, M. and D.W. te Velde (2017), ‘Aid, export and employment in the UK, ODI Briefing Note, ‘https://euagenda.eu/upload/publications/untitled-91177-ea.pdf
Miller, M. and L. Roger (2021), ‘Piecing together changes to UK bilateral aid allocations’, ODI. https://odi.org/en/insights/piecing-together-changes-to-uk-bilateral-aid-allocations/
Mitchell, I., Hughes, S. and E. Ritchie (2021), ‘An Overview of the Impact of Proposed Cuts to UK Aid, CGD Notes’, Jan 2021. https://www.cgdev.org/publication/overview-impact-proposed-cuts-uk-aid

National Institute of Economic and Social Research 37
National Institute UK Economic Outlook – Summer 2021
2 UK Regional Outlook: Summer 2021Arnab Bhattacharjee, Elena Lisauskaite, Adrian Pabst and Tibor Szendrei1
J As economic growth accelerates after the lifting of many lockdown restrictions across the UK, the recovery in the devolved nations and regions of England will vary widely. Some parts of the country are projected not to return to their pre-pandemic levels of economic output, as measured by Gross Value Added (GVA), even by the end of 2024, including the North East, Yorkshire & the Humber, Wales and Northern Ireland.
J By the end of 2024, only the West Midlands and London are projected to have GVA about 4-5 per cent above the pre-pandemic level at the end of 2019. This is still only about half of what growth over this period would have been in normal times. This reflects the eventual recovery to 2019 levels but with severe scarring effects.
J Employment growth is projected to be brisk in London but sluggish elsewhere, eventually recovering to pre-pandemic levels in most regions and nations of the UK by the end of 2024. The exceptions are Scotland and the Midlands: the former is expected to catch up in 2025 whereas the latter projected to take even longer.
J Despite weak employment recovery, the Midlands is projected to have a relatively stronger rebound in productivity compared to other parts of the UK, with 8 per cent and 9 per cent above the pre-pandemic level of end 2019 in 2023 and 2024 respectively. This is largely because of labour being reallocated out of less productive sectors.
J Wales and Northern Ireland are projected to have sharp rises in economic inactivity throughout the period 2021-2023, with projected inactivity rates rising to above 40 per cent over the period. As well as the North of England, unemployment rates in Wales and Scotland will also rise sharply over the period to about 6 per cent or above. With rising labour force participation, London is projected to have the lowest inactivity rate (below 30 per cent) but an unemployment rate of 7.3 per cent that is well above the national average of 5.3 per cent.
J The number of unemployed women is expected to rise across all age groups between 18 and 64 years. This also applies to young (18-24) and older men (50-64), but not men aged 25-49. Youth unemployment is emerging as a very serious issue. Compared to 2019-20, the number of young unemployed men, aged 18-24, is expected to be more than double in 2021-22 and to increase further in 2022-23. Likewise, the number of young unemployed women in 2021-22 is projected to rise by 70 per cent over 2019-20 levels and remain almost equally high in 2022-23.
J In terms of income, consumption and savings, the situation also varies significantly across the UK. The central projection is a continued rise in the savings ratio over the Covid-19 lockdowns (2020-21) and beyond (2021-22). Among the four nations, Wales has both the highest share of wages and pensions in total income and the highest and rising savings rate. By contrast, Northern Ireland has the lowest share of wages/pensions and the highest consumption as a proportion of income. Income shares are relatively stable across the English regions, but London has the lowest savings ratio. We suggest enhanced UC should continue for longer.
J Households in the bottom quartile in terms of income have the highest reliance on benefits and the lowest savings ratio. Whereas enhanced Universal Credit payments in 2020-21 and part of 2021-22 account for less than 5 per cent of aggregate benefits, this poorest quarter of households is the main beneficiary, accounting for 16 per cent of their total benefit income. Higher benefits also accrue to single-adult households, particularly those with children. Ethnically Asian households have lower savings initially, but also a sharp rise in the savings rate.
1 We are grateful for comments and input from Jagjit S. Chadha, Hande Küçük, Rory Macqueen and Barry Naisbitt.
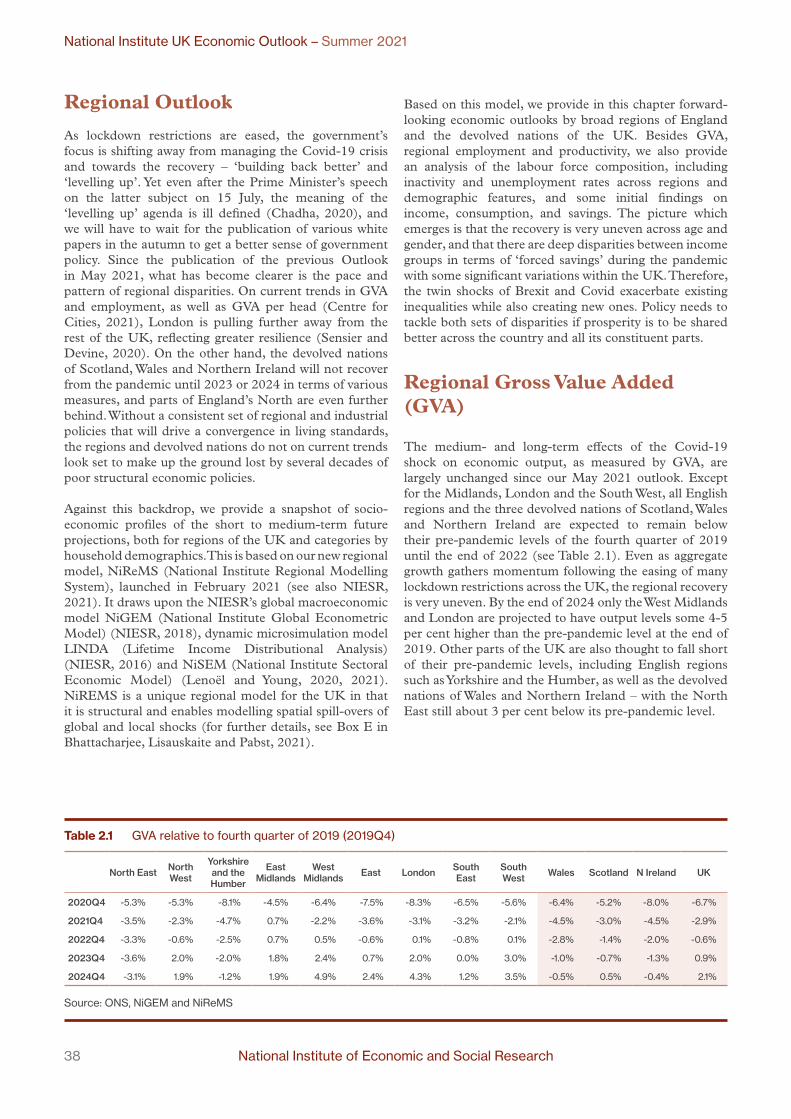
38 National Institute of Economic and Social Research
National Institute UK Economic Outlook – Summer 2021
Regional Outlook
As lockdown restrictions are eased, the government’s focus is shifting away from managing the Covid-19 crisis and towards the recovery – ‘building back better’ and ‘levelling up’. Yet even after the Prime Minister’s speech on the latter subject on 15 July, the meaning of the ‘levelling up’ agenda is ill defined (Chadha, 2020), and we will have to wait for the publication of various white papers in the autumn to get a better sense of government policy. Since the publication of the previous Outlook in May 2021, what has become clearer is the pace and pattern of regional disparities. On current trends in GVA and employment, as well as GVA per head (Centre for Cities, 2021), London is pulling further away from the rest of the UK, reflecting greater resilience (Sensier and Devine, 2020). On the other hand, the devolved nations of Scotland, Wales and Northern Ireland will not recover from the pandemic until 2023 or 2024 in terms of various measures, and parts of England’s North are even further behind. Without a consistent set of regional and industrial policies that will drive a convergence in living standards, the regions and devolved nations do not on current trends look set to make up the ground lost by several decades of poor structural economic policies.
Against this backdrop, we provide a snapshot of socio-economic profiles of the short to medium-term future projections, both for regions of the UK and categories by household demographics. This is based on our new regional model, NiReMS (National Institute Regional Modelling System), launched in February 2021 (see also NIESR, 2021). It draws upon the NIESR’s global macroeconomic model NiGEM (National Institute Global Econometric Model) (NIESR, 2018), dynamic microsimulation model LINDA (Lifetime Income Distributional Analysis) (NIESR, 2016) and NiSEM (National Institute Sectoral Economic Model) (Lenoël and Young, 2020, 2021). NiREMS is a unique regional model for the UK in that it is structural and enables modelling spatial spill-overs of global and local shocks (for further details, see Box E in Bhattacharjee, Lisauskaite and Pabst, 2021).
Based on this model, we provide in this chapter forward-looking economic outlooks by broad regions of England and the devolved nations of the UK. Besides GVA, regional employment and productivity, we also provide an analysis of the labour force composition, including inactivity and unemployment rates across regions and demographic features, and some initial findings on income, consumption, and savings. The picture which emerges is that the recovery is very uneven across age and gender, and that there are deep disparities between income groups in terms of ‘forced savings’ during the pandemic with some significant variations within the UK. Therefore, the twin shocks of Brexit and Covid exacerbate existing inequalities while also creating new ones. Policy needs to tackle both sets of disparities if prosperity is to be shared better across the country and all its constituent parts.
Regional Gross Value Added (GVA)
The medium- and long-term effects of the Covid-19 shock on economic output, as measured by GVA, are largely unchanged since our May 2021 outlook. Except for the Midlands, London and the South West, all English regions and the three devolved nations of Scotland, Wales and Northern Ireland are expected to remain below their pre-pandemic levels of the fourth quarter of 2019 until the end of 2022 (see Table 2.1). Even as aggregate growth gathers momentum following the easing of many lockdown restrictions across the UK, the regional recovery is very uneven. By the end of 2024 only the West Midlands and London are projected to have output levels some 4-5 per cent higher than the pre-pandemic level at the end of 2019. Other parts of the UK are also thought to fall short of their pre-pandemic levels, including English regions such as Yorkshire and the Humber, as well as the devolved nations of Wales and Northern Ireland – with the North East still about 3 per cent below its pre-pandemic level.
Table 2.1 GVA relative to fourth quarter of 2019 (2019Q4)
North East North West
Yorkshire and the Humber
East Midlands
West Midlands East London South
EastSouth West Wales Scotland N Ireland UK
2020Q4 -5.3% -5.3% -8.1% -4.5% -6.4% -7.5% -8.3% -6.5% -5.6% -6.4% -5.2% -8.0% -6.7%
2021Q4 -3.5% -2.3% -4.7% 0.7% -2.2% -3.6% -3.1% -3.2% -2.1% -4.5% -3.0% -4.5% -2.9%
2022Q4 -3.3% -0.6% -2.5% 0.7% 0.5% -0.6% 0.1% -0.8% 0.1% -2.8% -1.4% -2.0% -0.6%
2023Q4 -3.6% 2.0% -2.0% 1.8% 2.4% 0.7% 2.0% 0.0% 3.0% -1.0% -0.7% -1.3% 0.9%
2024Q4 -3.1% 1.9% -1.2% 1.9% 4.9% 2.4% 4.3% 1.2% 3.5% -0.5% 0.5% -0.4% 2.1%
Source: ONS, NiGEM and NiReMS
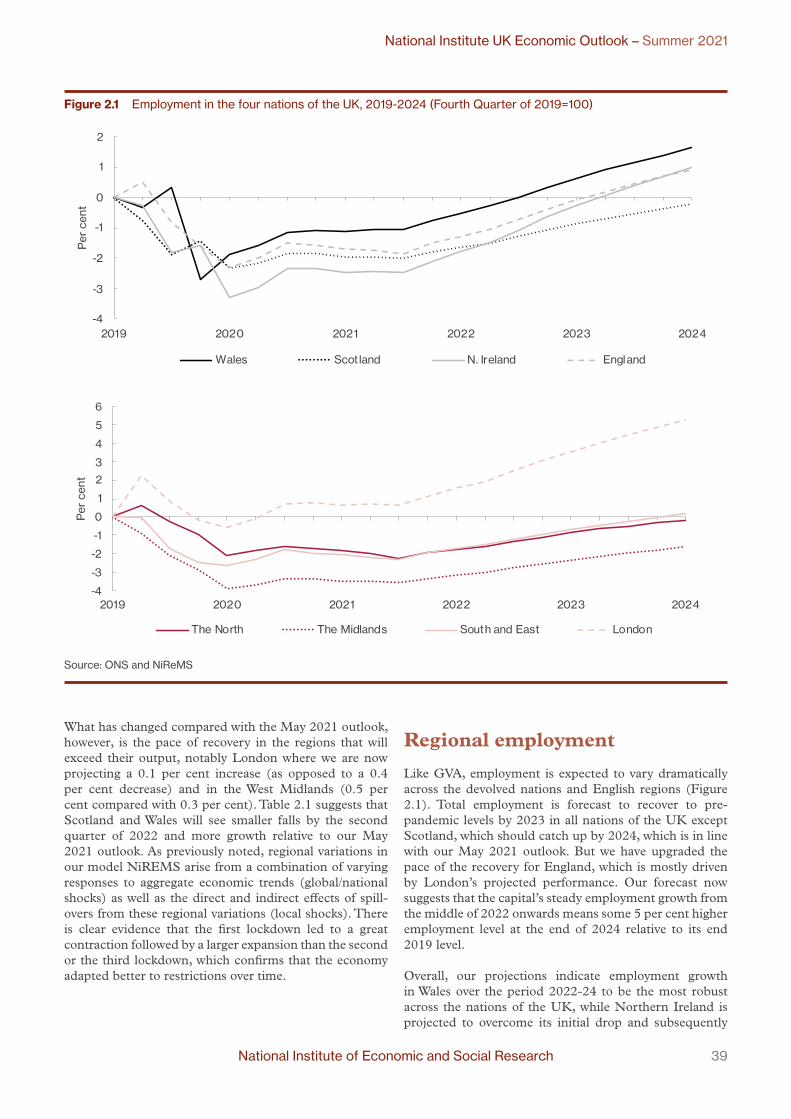
National Institute of Economic and Social Research 39
National Institute UK Economic Outlook – Summer 2021
What has changed compared with the May 2021 outlook, however, is the pace of recovery in the regions that will exceed their output, notably London where we are now projecting a 0.1 per cent increase (as opposed to a 0.4 per cent decrease) and in the West Midlands (0.5 per cent compared with 0.3 per cent). Table 2.1 suggests that Scotland and Wales will see smaller falls by the second quarter of 2022 and more growth relative to our May 2021 outlook. As previously noted, regional variations in our model NiREMS arise from a combination of varying responses to aggregate economic trends (global/national shocks) as well as the direct and indirect effects of spill-overs from these regional variations (local shocks). There is clear evidence that the first lockdown led to a great contraction followed by a larger expansion than the second or the third lockdown, which confirms that the economy adapted better to restrictions over time.
Regional employment
Like GVA, employment is expected to vary dramatically across the devolved nations and English regions (Figure 2.1). Total employment is forecast to recover to pre-pandemic levels by 2023 in all nations of the UK except Scotland, which should catch up by 2024, which is in line with our May 2021 outlook. But we have upgraded the pace of the recovery for England, which is mostly driven by London’s projected performance. Our forecast now suggests that the capital’s steady employment growth from the middle of 2022 onwards means some 5 per cent higher employment level at the end of 2024 relative to its end 2019 level.
Overall, our projections indicate employment growth in Wales over the period 2022-24 to be the most robust across the nations of the UK, while Northern Ireland is projected to overcome its initial drop and subsequently
Figure 2.1 Employment in the four nations of the UK, 2019-2024 (Fourth Quarter of 2019=100)
-4
-3
-2
-1
0
1
2
2019 2020 2021 2022 2023 2024
Per
cen
t
Wales Scotland N. Ireland England
-4
-3
-2
-1
0
1
2
3
4
5
6
2019 2020 2021 2022 2023 2024
Per
cen
t
The North The Midlands South and East London
Source: ONS and NiReMS
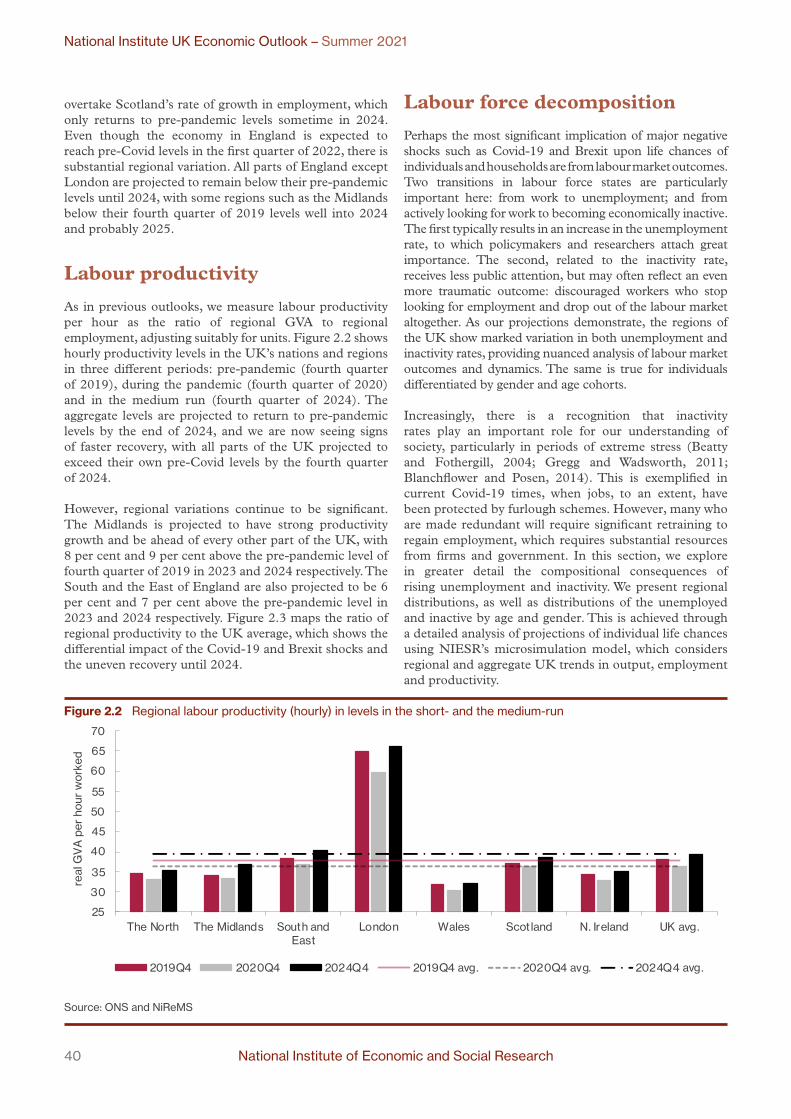
40 National Institute of Economic and Social Research
National Institute UK Economic Outlook – Summer 2021
overtake Scotland’s rate of growth in employment, which only returns to pre-pandemic levels sometime in 2024. Even though the economy in England is expected to reach pre-Covid levels in the first quarter of 2022, there is substantial regional variation. All parts of England except London are projected to remain below their pre-pandemic levels until 2024, with some regions such as the Midlands below their fourth quarter of 2019 levels well into 2024 and probably 2025.
Labour productivity
As in previous outlooks, we measure labour productivity per hour as the ratio of regional GVA to regional employment, adjusting suitably for units. Figure 2.2 shows hourly productivity levels in the UK’s nations and regions in three different periods: pre-pandemic (fourth quarter of 2019), during the pandemic (fourth quarter of 2020) and in the medium run (fourth quarter of 2024). The aggregate levels are projected to return to pre-pandemic levels by the end of 2024, and we are now seeing signs of faster recovery, with all parts of the UK projected to exceed their own pre-Covid levels by the fourth quarter of 2024.
However, regional variations continue to be significant. The Midlands is projected to have strong productivity growth and be ahead of every other part of the UK, with 8 per cent and 9 per cent above the pre-pandemic level of fourth quarter of 2019 in 2023 and 2024 respectively. The South and the East of England are also projected to be 6 per cent and 7 per cent above the pre-pandemic level in 2023 and 2024 respectively. Figure 2.3 maps the ratio of regional productivity to the UK average, which shows the differential impact of the Covid-19 and Brexit shocks and the uneven recovery until 2024.
Labour force decomposition
Perhaps the most significant implication of major negative shocks such as Covid-19 and Brexit upon life chances of individuals and households are from labour market outcomes. Two transitions in labour force states are particularly important here: from work to unemployment; and from actively looking for work to becoming economically inactive. The first typically results in an increase in the unemployment rate, to which policymakers and researchers attach great importance. The second, related to the inactivity rate, receives less public attention, but may often reflect an even more traumatic outcome: discouraged workers who stop looking for employment and drop out of the labour market altogether. As our projections demonstrate, the regions of the UK show marked variation in both unemployment and inactivity rates, providing nuanced analysis of labour market outcomes and dynamics. The same is true for individuals differentiated by gender and age cohorts.
Increasingly, there is a recognition that inactivity rates play an important role for our understanding of society, particularly in periods of extreme stress (Beatty and Fothergill, 2004; Gregg and Wadsworth, 2011; Blanchflower and Posen, 2014). This is exemplified in current Covid-19 times, when jobs, to an extent, have been protected by furlough schemes. However, many who are made redundant will require significant retraining to regain employment, which requires substantial resources from firms and government. In this section, we explore in greater detail the compositional consequences of rising unemployment and inactivity. We present regional distributions, as well as distributions of the unemployed and inactive by age and gender. This is achieved through a detailed analysis of projections of individual life chances using NIESR’s microsimulation model, which considers regional and aggregate UK trends in output, employment and productivity.
Figure 2.2 Regional labour productivity (hourly) in levels in the short- and the medium-run
25
30
35
40
45
50
55
60
65
70
The North The Midlands South andEast
London Wales Scotland N. Ireland UK avg.
real
GV
A p
er h
our
wor
ked
2019Q4 2020Q4 2024Q4 2019Q4 avg. 2020Q4 avg. 2024Q4 avg.
Source: ONS and NiReMS

National Institute of Economic and Social Research 41
National Institute UK Economic Outlook – Summer 2021
Regional inactivity and unemployment
Tables 2.2 and 2.3 show inactivity and unemployment rates, respectively, in different regions of the UK for all individuals aged over 16 (including people of retirement age, some of whom work). Overall, both inactivity and unemployment rates are projected to keep increasing throughout 2021-2023. On closer inspection, London has seen a decrease in its inactivity rate, which means that more people have either found employment or started actively searching for a job. This result persists and, in comparison to 2019, the inactivity rate is projected to be below that level in 2022-23. However, the unemployment rate in London is estimated to be well above the national average, reaching 7.3 per cent in 2022-23 compared to 5.3 per cent in 2022-23 (Table 2.3). This could, potentially, be a result of individuals moving from being inactive to looking for jobs and not finding one. Although this might be seen as a positive as it involves increased engagement with the labour market, the time that it takes these people to find employment is costly for them and for society. Referring to our overview of employment trends, London is projected to have a sharp increase in employment. Therefore, even though the unemployment rate is increasing, it could stabilise in the short- to medium-run if employment continues to increase.
Other regions that do better than the national average in terms of falling inactivity rates are the South East and the Midlands. The regions with the highest proportion of workers becoming discouraged and leaving the active labour force are Wales, the North East, and Northern Ireland – with inactivity rates of 5.5 per cent and 4.4 per cent respectively above the pre-pandemic levels. High inactivity rates raise important questions about the reasons for such trends. The phenomenon of why workers become discouraged is a complex one, involving issues around job skills mismatches, the availability of employment and the age structure of the population, amongst other factors.
Wales and Northern Ireland are also projected to have the largest increases in their unemployment rates, but Northern Ireland still stands below the UK average. Wales and the North are estimated to have unemployment rates of 5.8 per cent in 2022-23 relative to the UK average of 5.3 per cent. For Scotland, although the inactivity rate in 2022-23 is projected to be at its 2019-20 level, the unemployment rate is estimated to increase from 3.8 per cent to 6.1 per cent. A greater alignment of skills to jobs is a key component of the Scottish Government’s economic transformation strategy currently under public consultation, and it could significantly affect the outcomes.
Figure 2.3 Ratio of regional productivity to the average of the UK
20242019 2020
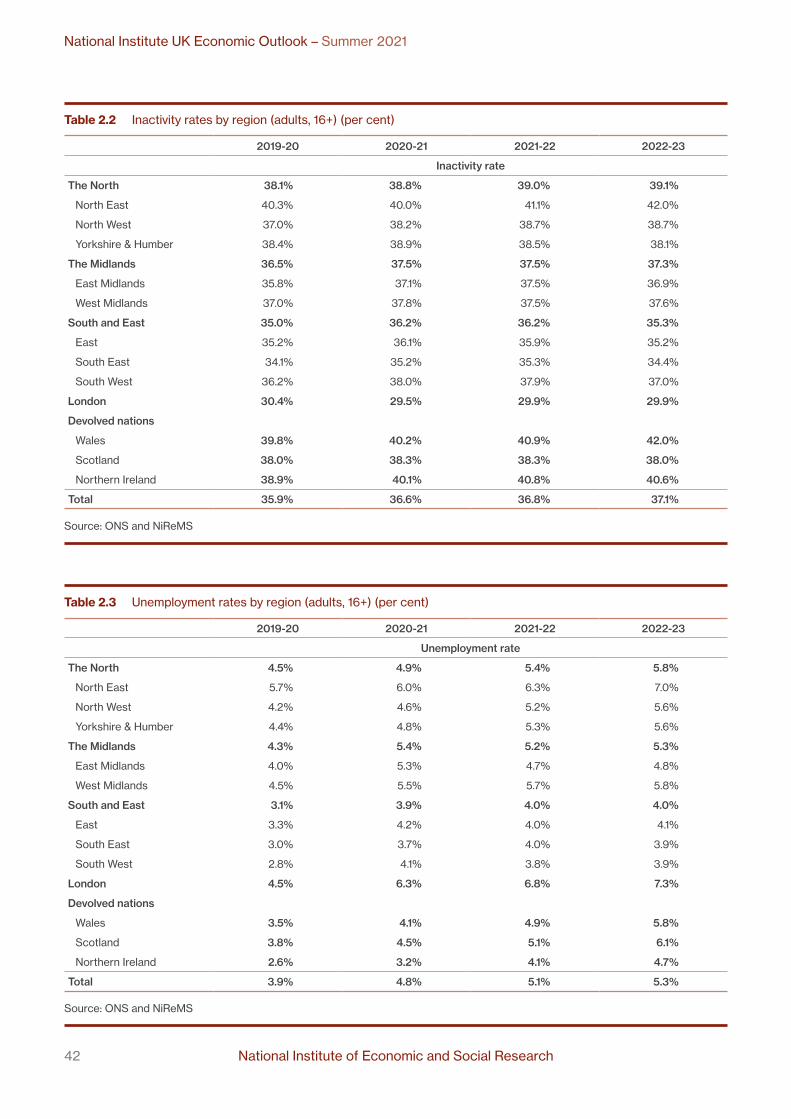
42 National Institute of Economic and Social Research
National Institute UK Economic Outlook – Summer 2021
Table 2.2 Inactivity rates by region (adults, 16+) (per cent)
2019-20 2020-21 2021-22 2022-23
Inactivity rate
The North 38.1% 38.8% 39.0% 39.1%
North East 40.3% 40.0% 41.1% 42.0%
North West 37.0% 38.2% 38.7% 38.7%
Yorkshire & Humber 38.4% 38.9% 38.5% 38.1%
The Midlands 36.5% 37.5% 37.5% 37.3%
East Midlands 35.8% 37.1% 37.5% 36.9%
West Midlands 37.0% 37.8% 37.5% 37.6%
South and East 35.0% 36.2% 36.2% 35.3%
East 35.2% 36.1% 35.9% 35.2%
South East 34.1% 35.2% 35.3% 34.4%
South West 36.2% 38.0% 37.9% 37.0%
London 30.4% 29.5% 29.9% 29.9%
Devolved nations
Wales 39.8% 40.2% 40.9% 42.0%
Scotland 38.0% 38.3% 38.3% 38.0%
Northern Ireland 38.9% 40.1% 40.8% 40.6%
Total 35.9% 36.6% 36.8% 37.1%
Source: ONS and NiReMS
Table 2.3 Unemployment rates by region (adults, 16+) (per cent)
2019-20 2020-21 2021-22 2022-23
Unemployment rate
The North 4.5% 4.9% 5.4% 5.8%
North East 5.7% 6.0% 6.3% 7.0%
North West 4.2% 4.6% 5.2% 5.6%
Yorkshire & Humber 4.4% 4.8% 5.3% 5.6%
The Midlands 4.3% 5.4% 5.2% 5.3%
East Midlands 4.0% 5.3% 4.7% 4.8%
West Midlands 4.5% 5.5% 5.7% 5.8%
South and East 3.1% 3.9% 4.0% 4.0%
East 3.3% 4.2% 4.0% 4.1%
South East 3.0% 3.7% 4.0% 3.9%
South West 2.8% 4.1% 3.8% 3.9%
London 4.5% 6.3% 6.8% 7.3%
Devolved nations
Wales 3.5% 4.1% 4.9% 5.8%
Scotland 3.8% 4.5% 5.1% 6.1%
Northern Ireland 2.6% 3.2% 4.1% 4.7%
Total 3.9% 4.8% 5.1% 5.3%
Source: ONS and NiReMS

National Institute of Economic and Social Research 43
National Institute UK Economic Outlook – Summer 2021
Inactivity and unemployment by age and gender
Tables 2.4 and 2.5 focus on inactivity and unemployment rates by age and gender. Unemployment is projected to rise between 2019-20 and 2022-23 for men and women of all ages between 18 and 64, except for men aged 25-49, where we predict the number unemployed to decrease by 17 per cent below the 2019-20 level in 2021-22 and go back up, but still to remain 1 per cent below the pre-pandemic level in 2022-23.
The number of young unemployed men, aged 18-24, is expected to be more than double the 2019-20 level in 2021-22 and increase further in 2022-23. Young women
are also expected to experience a large increase in the unemployment rates, up by 70 per cent over 2019-20 levels in 2021-22. These results are consistent with the recent findings of ONS research on young people’s unemployment (Wadsworth, 2021), which found that more young people were in full time education in 2020 than in 2019 and that their job-to-job transition rates declined, and that this group is also the biggest one on zero-hour contracts, which means that unemployment statistics may mask the true extent of under-employment.
Inactivity rates are projected to be rising for men and women, in all age bands, except for the men aged 50-64, for whom the inactivity rate is projected to be 11 per cent below the 2019-20 in 2021-22. Our estimation shows that the level of women’s inactivity is projected to increase
Table 2.4 Distribution of unemployed persons by gender and age-group
2019-20 2020-21 2021-22 2022-23 2020-21 2021-22 2022-23
% change compared to 2019-20
Men
18-24 years 199,565 311,798 411,471 424,827 56.2% 106.2% 112.9%
25-49 years 296,824 356,341 246,235 293,580 20.1% -17.0% -1.1%
50-64 years 202,099 222,713 233,020 236,052 10.2% 15.3% 16.8%
Women
18-24 years 200,383 218,664 342,055 332,781 9.1% 70.7% 66.1%
25-49 years 295,653 364,439 325,451 357,563 23.3% 10.1% 20.9%
50-64 years 129,809 145,776 149,540 153,824 12.3% 15.2% 18.5%
Total 1,324,333 1,619,731 1,724,215 1,816,587 22.3% 30.2% 37.2%
Unemployment rate 3.87% 4.77% 5.10% 5.31%
Source: ONS and NiReMS
Table 2.5 Distribution of economically inactive persons by gender and age-group
2019-20 2020-21 2021-22 2022-23 2020-21 2021-22 2022-23
% change compared to 2019-20
Men
18-24 years 482,394 504,668 518,177 520,584 4.6% 7.4% 7.9%
25-49 years 462,624 483,193 482,192 479,913 4.4% 4.2% 3.7%
50-64 years 964,788 883,170 854,992 911,022 -8.5% -11.4% -5.6%
Women
18-24 years 486,348 510,037 525,374 528,718 4.9% 8.0% 8.7%
25-49 years 1,205,985 1,261,671 1,295,442 1,301,459 4.6% 7.4% 7.9%
50-64 years 1,213,893 1,272,409 1,309,836 1,317,728 4.8% 7.9% 8.6%
Total 4,816,031 4,915,148 4,986,014 5,059,423 2.1% 3.5% 5.1%
Inactivity rate 35.92% 36.58% 36.95% 37.06%
Source: ONS and NiReMS

44 National Institute of Economic and Social Research
National Institute UK Economic Outlook – Summer 2021
more than men’s. In the short-term, the main reasons for increased inactivity rates were found to be an increased number of students and discouraged workers as well as more people of working age retiring (ONS, 2021). Our results show the need not only to tackle the unemployment problem, especially for the young workers, but also to find ways to encourage workers back into the active labour force. The analysis in this chapter underscores the importance of focused analysis at more granular levels to help policy makers target specific age and gender cohorts.
Income, consumption and savings at the household level
Covid-19 has had devastating consequences for many households and been challenging for many others. Aggregate macroeconomic analyses of income, consumption and savings can be found in Chapter 1. The aim of this section is to conduct household level analysis, taking aggregate projections from NiGEM into account, and by combining these with a microsimulation exercise applied to a random sample of 10,000 households for 2017-18 from the UK Wealth and Assets Survey. A pseudo-sample representing Northern Ireland is also included in the frame. We include explicit modelling of excess Covid-19 mortality, potential changes to immigration and the benefits system including recent temporary uplifts to Universal Credit (UC) payments. The projections highlight markedly different shares of income in wages/pensions and benefits, and different consumption/saving pattern by regions and household income, composition and ethnicity.
Microsimulation enables modelling of a variety of behavioural decisions at the household level, permitting a rich and granular analysis (Figari et al., 2015). In particular, the framework can model changes to the sampling frame, covering childbirths and deaths, household formation and dissolution, transition between education, work, economic activity and retirement, internal and international migration, and transitions between sectors of economic activity. Wages are determined by a Mincer-type empirical model (Heckman et al., 2003) that takes account of sectoral trajectories projected by NIESR’s sectoral model NiSEM. Benefit incomes are also explicitly computed. To ensure household decisions are rooted in economic theory, dynamic optimisation is used to model the trade-off between consumption and savings as well as the decision between work and leisure.
Segregation of income into different sources and uses is retained at a reasonably high level. Individuals derive disposable income from current and past work (wages and pensions), benefits and other income (which includes investment income, rental income and miscellaneous other income). Income is put to two uses: consumption and savings. In addition to household income, a proportion of liquid assets can also be liquidated and used
to support consumption in any period, one year in this case. Remaining income goes into savings and augments liquid assets in the short run. This framework allows us to analyse the consequences of lockdowns, furlough and its withdrawal on incomes through reduced wages, employment and self-employment opportunities.
The impact of changes to benefit systems is directly modelled, subject to the age and gender composition of households as well as the incomes of their constituent individuals. The relative shares of these sources and trends in household income provide important insights about the income trajectories of households. Likewise, relative shares of consumption and savings imply information about the potential for a consumption-led recovery. Together with the analysis by regions, this has implications for the government’s regional ‘levelling up’ agenda. The effectiveness of the welfare measures in place can be evaluated with a disaggregated analysis of households by ethnicity and household composition. The case for support for specific cohorts and their needs can also be examined in this analysis.
Table 2.6 presents the distribution of projected consumption and savings at the household level as a percentage of household disposable income, by quartiles of household income. Here, Q1 represents the poorest quarter of households in terms of household disposable income and Q4 is the richest quarter. The distribution in 2019-20, before the Covid-19 shock struck, is representative of recent experiences of societies in the global north, where for a majority of households consumption outruns income, so that there is dis-saving, but the richest quarter of households accumulate substantial savings to leave the aggregate savings share at about 20 per cent (Tonkin, 2015).
As the Covid-19 shock affected the economy, households reduced consumption shares and started saving more. This was due to two reasons: (1) lockdown-led restrictions to consumption opportunities, and (2) precautionary savings as uncertainty increased. This trend is most prominent in 2020-21 but also continues into 2021-22 as the economy comes out of Covid-19 lockdowns but is then subject to potential Brexit shocks (trade and investment) together with the withdrawal of temporary welfare measures like furlough and enhanced UC. Households in the second quartile have a somewhat different experience though: against rising unemployment and wage pressures, these households face income constraints that are relatively less moderated by welfare benefits. Hence, they need to continue to consume relatively more of their income.
All other things being equal, these projections imply that a consumption led recovery may not be as unambiguous as many have been expecting. The government has promoted schemes like “Eat Out to Help Out” and reduced stamp duty for first-time home buyers, which help to address the first of the two reasons outlined above. However, if consumption needs to recover more quickly,
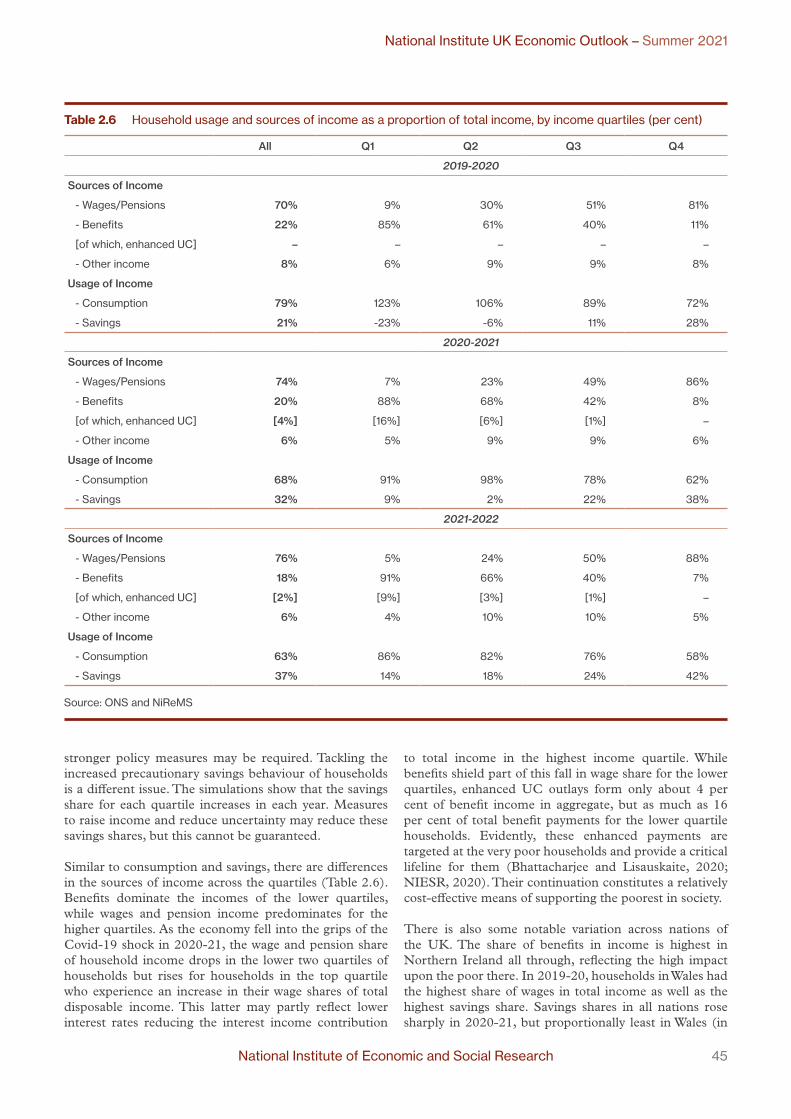
National Institute of Economic and Social Research 45
National Institute UK Economic Outlook – Summer 2021
stronger policy measures may be required. Tackling the increased precautionary savings behaviour of households is a different issue. The simulations show that the savings share for each quartile increases in each year. Measures to raise income and reduce uncertainty may reduce these savings shares, but this cannot be guaranteed.
Similar to consumption and savings, there are differences in the sources of income across the quartiles (Table 2.6). Benefits dominate the incomes of the lower quartiles, while wages and pension income predominates for the higher quartiles. As the economy fell into the grips of the Covid-19 shock in 2020-21, the wage and pension share of household income drops in the lower two quartiles of households but rises for households in the top quartile who experience an increase in their wage shares of total disposable income. This latter may partly reflect lower interest rates reducing the interest income contribution
to total income in the highest income quartile. While benefits shield part of this fall in wage share for the lower quartiles, enhanced UC outlays form only about 4 per cent of benefit income in aggregate, but as much as 16 per cent of total benefit payments for the lower quartile households. Evidently, these enhanced payments are targeted at the very poor households and provide a critical lifeline for them (Bhattacharjee and Lisauskaite, 2020; NIESR, 2020). Their continuation constitutes a relatively cost-effective means of supporting the poorest in society.
There is also some notable variation across nations of the UK. The share of benefits in income is highest in Northern Ireland all through, reflecting the high impact upon the poor there. In 2019-20, households in Wales had the highest share of wages in total income as well as the highest savings share. Savings shares in all nations rose sharply in 2020-21, but proportionally least in Wales (in
Table 2.6 Household usage and sources of income as a proportion of total income, by income quartiles (per cent)
All Q1 Q2 Q3 Q4
2019-2020
Sources of Income
- Wages/Pensions 70% 9% 30% 51% 81%
- Benefits 22% 85% 61% 40% 11%
[of which, enhanced UC] – – – – –
- Other income 8% 6% 9% 9% 8%
Usage of Income
- Consumption 79% 123% 106% 89% 72%
- Savings 21% -23% -6% 11% 28%
2020-2021
Sources of Income
- Wages/Pensions 74% 7% 23% 49% 86%
- Benefits 20% 88% 68% 42% 8%
[of which, enhanced UC] [4%] [16%] [6%] [1%] –
- Other income 6% 5% 9% 9% 6%
Usage of Income
- Consumption 68% 91% 98% 78% 62%
- Savings 32% 9% 2% 22% 38%
2021-2022
Sources of Income
- Wages/Pensions 76% 5% 24% 50% 88%
- Benefits 18% 91% 66% 40% 7%
[of which, enhanced UC] [2%] [9%] [3%] [1%] –
- Other income 6% 4% 10% 10% 5%
Usage of Income
- Consumption 63% 86% 82% 76% 58%
- Savings 37% 14% 18% 24% 42%
Source: ONS and NiReMS
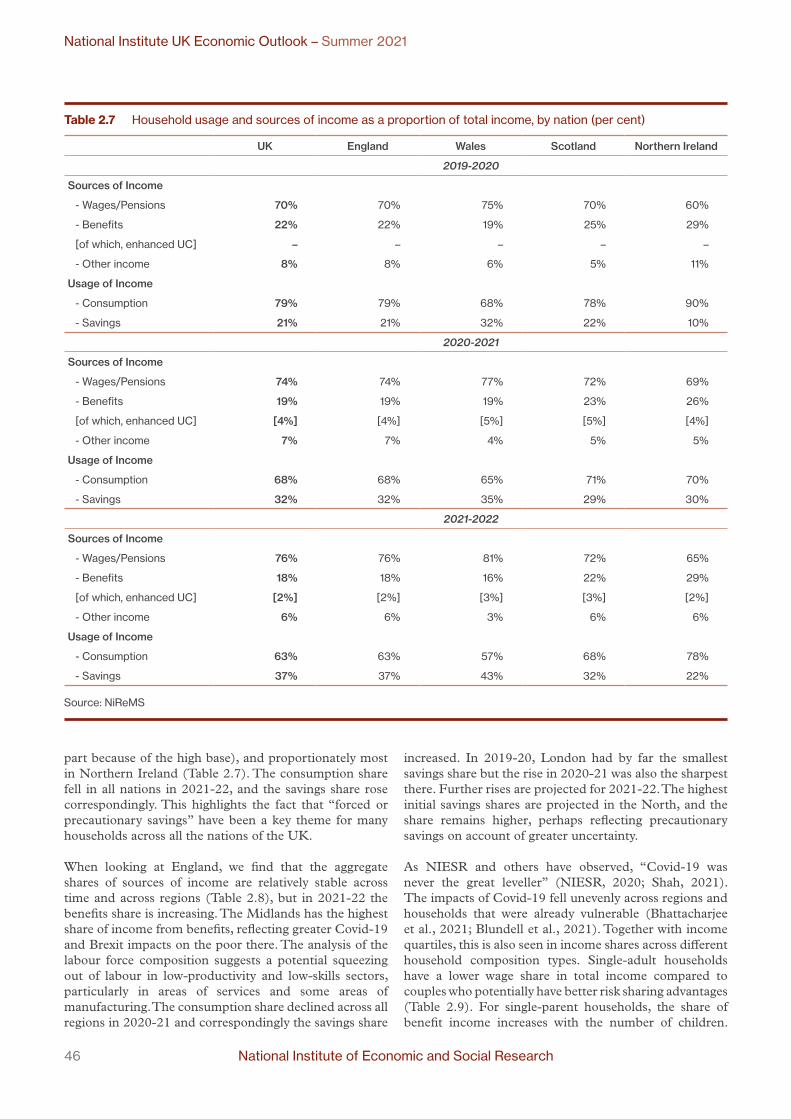
46 National Institute of Economic and Social Research
National Institute UK Economic Outlook – Summer 2021
part because of the high base), and proportionately most in Northern Ireland (Table 2.7). The consumption share fell in all nations in 2021-22, and the savings share rose correspondingly. This highlights the fact that “forced or precautionary savings” have been a key theme for many households across all the nations of the UK.
When looking at England, we find that the aggregate shares of sources of income are relatively stable across time and across regions (Table 2.8), but in 2021-22 the benefits share is increasing. The Midlands has the highest share of income from benefits, reflecting greater Covid-19 and Brexit impacts on the poor there. The analysis of the labour force composition suggests a potential squeezing out of labour in low-productivity and low-skills sectors, particularly in areas of services and some areas of manufacturing. The consumption share declined across all regions in 2020-21 and correspondingly the savings share
increased. In 2019-20, London had by far the smallest savings share but the rise in 2020-21 was also the sharpest there. Further rises are projected for 2021-22. The highest initial savings shares are projected in the North, and the share remains higher, perhaps reflecting precautionary savings on account of greater uncertainty.
As NIESR and others have observed, “Covid-19 was never the great leveller” (NIESR, 2020; Shah, 2021). The impacts of Covid-19 fell unevenly across regions and households that were already vulnerable (Bhattacharjee et al., 2021; Blundell et al., 2021). Together with income quartiles, this is also seen in income shares across different household composition types. Single-adult households have a lower wage share in total income compared to couples who potentially have better risk sharing advantages (Table 2.9). For single-parent households, the share of benefit income increases with the number of children.
Table 2.7 Household usage and sources of income as a proportion of total income, by nation (per cent)
UK England Wales Scotland Northern Ireland
2019-2020
Sources of Income
- Wages/Pensions 70% 70% 75% 70% 60%
- Benefits 22% 22% 19% 25% 29%
[of which, enhanced UC] – – – – –
- Other income 8% 8% 6% 5% 11%
Usage of Income
- Consumption 79% 79% 68% 78% 90%
- Savings 21% 21% 32% 22% 10%
2020-2021
Sources of Income
- Wages/Pensions 74% 74% 77% 72% 69%
- Benefits 19% 19% 19% 23% 26%
[of which, enhanced UC] [4%] [4%] [5%] [5%] [4%]
- Other income 7% 7% 4% 5% 5%
Usage of Income
- Consumption 68% 68% 65% 71% 70%
- Savings 32% 32% 35% 29% 30%
2021-2022
Sources of Income
- Wages/Pensions 76% 76% 81% 72% 65%
- Benefits 18% 18% 16% 22% 29%
[of which, enhanced UC] [2%] [2%] [3%] [3%] [2%]
- Other income 6% 6% 3% 6% 6%
Usage of Income
- Consumption 63% 63% 57% 68% 78%
- Savings 37% 37% 43% 32% 22%
Source: NiReMS
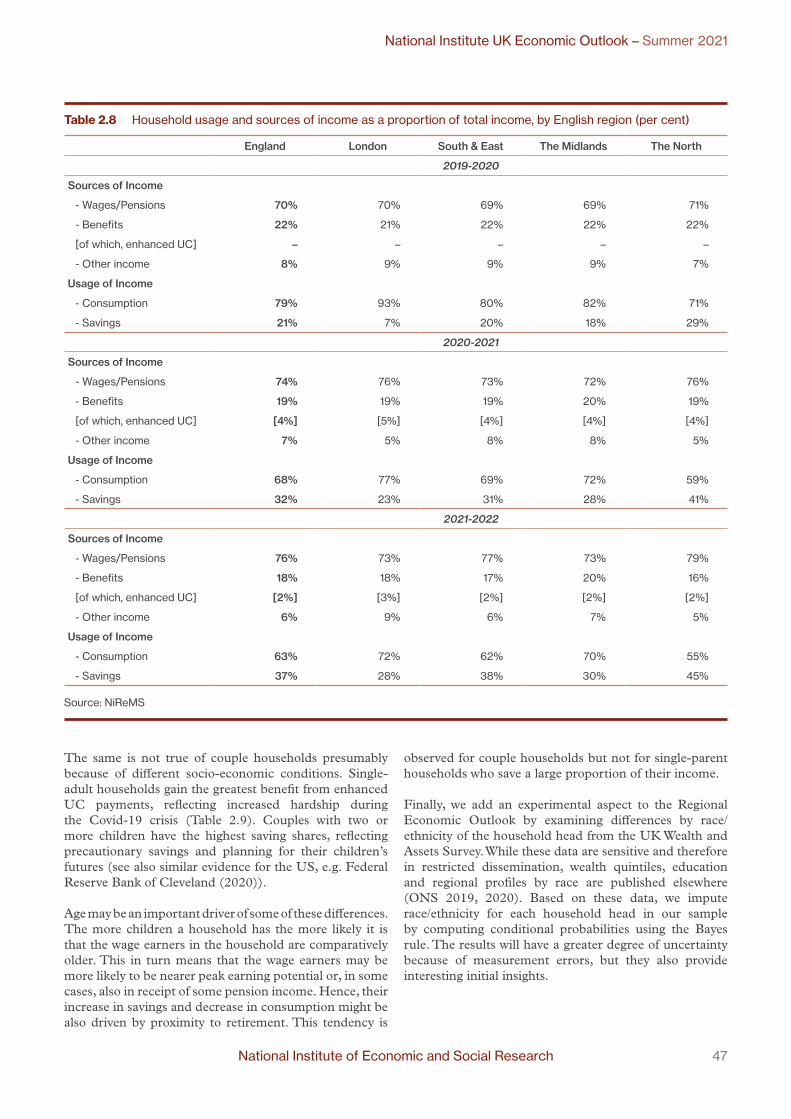
National Institute of Economic and Social Research 47
National Institute UK Economic Outlook – Summer 2021
The same is not true of couple households presumably because of different socio-economic conditions. Single-adult households gain the greatest benefit from enhanced UC payments, reflecting increased hardship during the Covid-19 crisis (Table 2.9). Couples with two or more children have the highest saving shares, reflecting precautionary savings and planning for their children’s futures (see also similar evidence for the US, e.g. Federal Reserve Bank of Cleveland (2020)).
Age may be an important driver of some of these differences. The more children a household has the more likely it is that the wage earners in the household are comparatively older. This in turn means that the wage earners may be more likely to be nearer peak earning potential or, in some cases, also in receipt of some pension income. Hence, their increase in savings and decrease in consumption might be also driven by proximity to retirement. This tendency is
observed for couple households but not for single-parent households who save a large proportion of their income.
Finally, we add an experimental aspect to the Regional Economic Outlook by examining differences by race/ethnicity of the household head from the UK Wealth and Assets Survey. While these data are sensitive and therefore in restricted dissemination, wealth quintiles, education and regional profiles by race are published elsewhere (ONS 2019, 2020). Based on these data, we impute race/ethnicity for each household head in our sample by computing conditional probabilities using the Bayes rule. The results will have a greater degree of uncertainty because of measurement errors, but they also provide interesting initial insights.
Table 2.8 Household usage and sources of income as a proportion of total income, by English region (per cent)
England London South & East The Midlands The North
2019-2020
Sources of Income
- Wages/Pensions 70% 70% 69% 69% 71%
- Benefits 22% 21% 22% 22% 22%
[of which, enhanced UC] – – – – –
- Other income 8% 9% 9% 9% 7%
Usage of Income
- Consumption 79% 93% 80% 82% 71%
- Savings 21% 7% 20% 18% 29%
2020-2021
Sources of Income
- Wages/Pensions 74% 76% 73% 72% 76%
- Benefits 19% 19% 19% 20% 19%
[of which, enhanced UC] [4%] [5%] [4%] [4%] [4%]
- Other income 7% 5% 8% 8% 5%
Usage of Income
- Consumption 68% 77% 69% 72% 59%
- Savings 32% 23% 31% 28% 41%
2021-2022
Sources of Income
- Wages/Pensions 76% 73% 77% 73% 79%
- Benefits 18% 18% 17% 20% 16%
[of which, enhanced UC] [2%] [3%] [2%] [2%] [2%]
- Other income 6% 9% 6% 7% 5%
Usage of Income
- Consumption 63% 72% 62% 70% 55%
- Savings 37% 28% 38% 30% 45%
Source: NiReMS

48 National Institute of Economic and Social Research
National Institute UK Economic Outlook – Summer 2021
There are interesting differences in composition of sources and uses of household income by ethnicity of the household head (Figure 2.4 and Table 2.9). Households where the head is White (British or otherwise) have the highest share of income from wages, followed by those where the household head is Indian. Correspondingly, Black and Other Asian household head have lower wage shares and higher shares of benefits in income. Indian households have the lowest rise in savings ratio (Table 2.10), reflecting less focus on precautionary savings, while a high rise in savings is projected for other ethnicities.
Table 2.10 Change in Savings Rate by imputed ethnicity of household head
White Indian Oth Asian Black Others
Change in Savings Ratio (from prev. year)
2020-2021 11% 7% 16% 21% 13%
2021-2022 7% 8% 5% -8% 12%
Source: NiReMS
Table 2.9 Household usage and sources of income as a proportion of total income, by household composition (per cent)
Single-adult households Couple households
0 child 1 child 2+ children 0 child 1 child 2+ children
2019-2020
Sources of Income
- Wages/Pensions 60% 59% 34% 74% 86% 80%
- Benefits 31% 36% 61% 17% 12% 17%
[of which, enhanced UC] – – – – – –
- Other income 9% 5% 5% 9% 2% 3%
Usage of Income
- Consumption 80% 87% 70% 82% 73% 66%
- Savings 20% 13% 30% 18% 27% 34%
2020-2021
Sources of Income
- Wages/Pensions 64% 59% 32% 77% 87% 82%
- Benefits 28% 38% 64% 15% 12% 17%
[of which, enhanced UC] [7%] [7%] [4%] [2%] [2%] [1%]
- Other income 8% 3% 4% 8% 1% 1%
Usage of Income
- Consumption 76% 74% 67% 67% 59% 54%
- Savings 24% 26% 33% 33% 41% 46%
2021-2022
Sources of Income
- Wages/Pensions 68% 61% 34% 79% 87% 81%
- Benefits 24% 37% 63% 14% 11% 15%
[of which, enhanced UC] [4%] [3%] [2%] [1%] [1%] –
- Other income 8% 2% 3% 7% 2% 4%
Usage of Income
- Consumption 73% 66% 66% 62% 53% 47%
- Savings 27% 34% 34% 38% 47% 53%
Source: NiReMS

National Institute of Economic and Social Research 49
National Institute UK Economic Outlook – Summer 2021
Conclusion
The twin shocks of Covid-19 and Brexit have brought about great economic disruption and hardship for many individuals, households and communities (Bhattacharjee et al., 2021; Blundell et al., 2021). However, the brunt of the burden has been borne by households, individuals and regions under persistent deprivation and lagging behind. Our projections, based on NiReMS and drawing inputs from NiGEM and NiSEM, reflect evidence of permanent scarring everywhere. Compared with the May 2021 projections, we are now finding evidence of a slightly faster recovery to return to 2019 levels. However, the pace of recovery is widely different across regions, with particular and continued hardship in pockets of low-skills, low-productivity, low-wages nexus.
Our estimates of cross-sectional distributions moving forward highlight many such inequalities. We find devastating consequences in the labour market, not only in unemployment but an increasingly discouraged workforce. The consequent rise in rates of economic inactivity can lead to persistent underemployment that is detrimental to societal wellbeing. These impacts are particularly severe upon women and young people.
Consumption is not projected to pick up by itself. Whither the consumption-led recovery? Public policy is required to encourage consumption and income sustenance through benefits may be helpful in achieving this. In the short run, new welfare measures are needed, potentially targeted, as furlough and enhanced UC payments are scrapped. In the medium run, retraining and new decent jobs are required. Can higher savings be guided towards investment to promote ‘levelling up’? We suggest enhanced UC should continue longer, so that the extreme poor can receive
sustenance without further sacrifices. Consumption can also be promoted together with a zero-carbon agenda by providing incentives for adoption of green technologies, for example in hybrid/electric vehicles and energy efficient housing.
REFERENCES Beatty, C. and Fothergill, S. (2004) ‘Economic Change and
the Labour Market in Britain’s Seaside Towns’, Regional Studies, 38 (5), 461–480.
Bhattacharjee, A., & Lisauskaite, E. (2020) ‘Covid-19 impacts on destitution in the UK’, National Institute Economic Review, 253, R77-R85.
Bhattacharjee, A., Lisauskaite, E., & Pabst, A. (2021) ‘UK regional outlook’, National Institute UK Economic Outlook, (2), 42-57.
Blanchflower, D. G., & Posen, A. S. (2014) ‘Wages and labor market slack: making the dual mandate operational’, Peterson Institute for International Economics Working Paper, (14-6).
Blundell, R., Cribb, J., McNally, S., Warwick, R., & Xu, X. (2021) ‘Inequalities in education, skills, and incomes in the UK: The implications of the Covid-19 pandemic’, IFS-Deaton Review of Inequalities, The Institute for Fiscal Studies and Nuffield Foundation.
Centre for Cities (2021) Cities Outlook 2021. https://www.centreforcities.org/wp-content/uploads/2021/01/Cities-Outlook-2021.pdf
Chadha, J.S. (2020) ‘The government’s levelling up agenda is a short-term gimmick – real change requires at least 50 years’, The Independent, 8 March 2020. https://www.independent.co.uk/independentpremium/voices/level-northern-cities-bradford-budget-uk-economy-a9385461.html
Chadha, J.S. (2021) ‘Commentary: Whither after Covid-19 and Brexit: A social science perspective’, National Institute Economic Review, 255, 1-8.
Figure 2.4 Household sources of income as a proportion of total income, by imputed ethnicity of household head (per cent)
0102030405060708090
10020
19-2
02
0
202
0-2
021
202
1-20
22
2019
-20
20
202
0-2
021
202
1-20
22
2019
-20
20
202
0-2
021
202
1-20
22
2019
-20
20
202
0-2
021
202
1-20
22
2019
-20
20
202
0-2
021
202
1-20
22
White Indian Other Asian Black Others
Per
cen
t
Wage/Pension Benefits Other
Source: NiReMS

50 National Institute of Economic and Social Research
National Institute UK Economic Outlook – Summer 2021
Figari, F., Paulus, A., & Sutherland, H. (2015) ‘Microsimulation and policy analysis. Chapter 24’, in Atkinson, A.B. & Bourguignon, F. (eds.), Handbook of Income Distribution (Vol. 2), Elsevier, pp. 2141-2221.
Federal Reserve Bank of Cleveland (2020) Consumers and Covid-19. https://www.clevelandfed.org/en/our-research/indicators-and-data/consumers-and-covid-19.aspx
Gregg, P., & Wadsworth, J. (2011) ‘Unemployment and inactivity. Chapter 2’, in P. Gregg and J. Wadsworth (eds.), The Labour Market in Winter: The State of Working Britain, Oxford University Press, pp. 22-38.
Heckman, James J.; Lochner, Lance J.; Todd, Petra E. (2003) ‘Fifty Years of Mincer Earnings Regressions’, NBER Working Paper No. 9732.
Lenoël, C., & Young, G. (2020), ‘Prospects for the UK Economy’, National Institute Economic Review 252, May 2020.
Lenoël, C., & Young, G. (2021) ‘UK sectoral outlook’, National Institute UK Economic Outlook, National Institute of Economic & Social Research, February 2021.
NIESR (2016) LINDA: a dynamic microsimulation model for analysing policy effects on the evolving population crosssection. National Institute of Economic and Social Research, https://www.niesr.ac.uk/publications/linda-dynamicmicrosimulation-modelanalysing-policy-effects-evolvingpopulation-cross
NIESR (2018) NiGEM: National Institute Global Econometric Model – Global macroeconomic model for economic forecasting, scenario and simulation. National Institute of Economic and Social Research. https://nimodel.niesr.ac.uk/
NIESR (2020) ‘Covid-19’s ‘shocking’ impact on people in need of food banks’, Press Release, National Institute of Economic & Social Research, 14 September 2020. https://www.niesr.ac.uk/media/covid-19%E2%80%99s-%E2%80%98shocking%E2%80%99-impact-people-needfood-banks-14386
NIESR (2021) NiREMS: National Institute Regional Economic Modelling System. National Institute of Economic and Social Research.
ONS (2019) Research report on population estimates by ethnic group and religion. 4 December 2019. https://www.ons.gov.uk/peoplepopulationandcommunity/populationandmigra-tion/populationestimates/articles/researchreportonpopulation estimatesbyethnicgroupandreligion/2019-12-04
ONS (2020) Household wealth by ethnicity, Great Britain: April 2016 to March 2018. 23 November 2020. https://www.ons.gov.uk/peoplepopulat ionandcommunity/per sonalandhouseholdf inances/ incomeandwealth/ar t ic les /householdweal thbyethnic i tyg reatbr i ta in /april2016tomarch2018
ONS (2021) Employment in the UK: July 2021. 15 July 2021. https://www.ons.gov.uk/employmentandlabourmarket/peopleinwork/employmentandemployeetypes/bulletins/employmentintheuk/july2021
Sensier, M., & Devine, F. (2020). Understanding regional economic performance and resilience in the UK: trends since the global financial crisis. National Institute Economic Review, 253 (August 2020), R18-R28.
Shah, H. (2021) ‘Covid-19 recovery: science isn’t enough to save us’, Nature, 591(7851), 503-503.
Tonkin, R. (2015) The Distribution of Household Income, Consumption and Savings: an OECD Study, Technical Report, ONS.
Wadsworth, J. (2021) ‘A year in the UK labour market: what’s happened over the coronavirus pandemic?’, Economics Observatory, 14 Apr 2021. https://www.economics observatory.com/a-year-in-the-uk-labour-market-whats-happened-over-the-coronavirus-pandemic

National Institute of Economic and Social Research 51
National Institute UK Economic Outlook – Summer 2021
Appendix
Table A1 Exchange rates and interest rates
UK exchange rates FTSE All-share
index
Interest ratesEffective 2017=100 Dollar Euro 3-month
rates10-year
gilts Worlda Bank Rateb
2015 117.3 1.53 1.38 2605 1.80 0.80 0.50 0.502016 105.8 1.35 1.22 2565 1.30 0.90 0.25 0.252017 100.0 1.29 1.14 2930 1.20 1.20 0.41 0.412018 101.9 1.34 1.13 2937 1.40 1.90 0.75 0.752019 101.6 1.28 1.14 2898 0.90 2.10 0.75 0.752020 102.1 1.28 1.13 2537 0.30 0.90 0.10 0.102021 106.9 1.38 1.16 2897 0.70 1.10 0.10 0.102022 107.4 1.38 1.16 3007 0.90 1.00 0.25 0.102023 107.5 1.38 1.16 3090 1.10 1.00 0.69 0.252024 107.3 1.38 1.15 3257 1.20 1.00 0.82 0.402025 107.1 1.38 1.15 3468 1.40 1.00 0.93 0.53
2020Q1 103.2 1.28 1.16 2766 0.50 1.40 0.61 0.612020Q2 101.4 1.24 1.13 2395 0.20 0.70 0.10 0.102020Q3 101.4 1.29 1.11 2447 0.10 0.70 0.10 0.102020Q4 102.2 1.32 1.11 2538 0.30 0.90 0.10 0.10
2021Q1 105.6 1.38 1.14 2749 0.60 1.10 0.10 0.102021Q2 107.4 1.40 1.16 2903 0.80 1.10 0.10 0.102021Q3 107.4 1.38 1.16 2945 0.70 1.10 0.10 0.102021Q4 107.4 1.38 1.16 2991 0.80 1.10 0.10 0.10
2022Q1 107.4 1.38 1.16 3012 0.80 1.00 0.10 0.102022Q2 107.4 1.38 1.16 2995 0.90 1.00 0.10 0.102022Q3 107.5 1.38 1.16 3001 0.90 1.00 0.10 0.102022Q4 107.5 1.38 1.16 3020 1.00 1.00 0.25 0.10
Percentage changes2015/2014 6.3 -7.2 11.1 0.42016/2015 -9.8 -11.4 -11.2 -1.52017/2016 -5.5 -4.9 -6.7 14.22018/2017 1.9 3.6 -1.0 0.32019/2018 -0.3 -4.4 0.9 -1.32020/2019 0.5 0.5 -1.3 -12.52021/2020 4.8 7.8 2.9 14.22022/2021 0.5 -0.3 0.5 3.82023/2022 0.1 0.1 -0.3 2.82024/2023 -0.2 0.0 -0.6 5.42025/2024 -0.2 0.0 -0.7 6.5
2020Q4/2019Q4 -1.0 2.6 -4.8 -13.62021Q4/2020Q4 5.0 4.4 5.1 17.82022Q4/2021Q4 0.1 0.1 -0.1 1.0
Notes: a Weighted average of central bank intervention rates in OECD economies. b End of period.

52 National Institute of Economic and Social Research
National Institute UK Economic Outlook – Summer 2021
Table A2 Price indices (2018=100)
Unit labour costs
Imports deflator
Exports deflator
World Oil Price ($)a
Consumption deflator
Consumer prices
GDP deflator(market prices)
RPIb CPIc CPIHd
2015 92.9 88.0 88.3 52.1 94.4 93.9 91.8 94.4 94.42016 95.0 91.9 92.4 42.9 95.7 95.9 93.4 95.0 95.32017 97.3 97.6 97.0 54.0 97.7 97.8 96.8 97.6 97.82018 100.0 100.0 100.0 70.4 100.0 100.0 100.0 100.0 100.02019 103.3 101.6 101.5 63.7 101.4 102.1 102.6 101.8 101.72020 118.2 100.9 101.0 43.0 102.9 108.0 104.1 102.7 102.82021 113.7 102.2 101.6 68.0 105.4 109.1 107.4 104.8 105.02022 113.9 100.7 102.8 65.4 108.1 112.4 112.4 107.7 108.32023 114.9 100.3 103.4 64.1 109.0 113.7 116.4 109.5 109.32024 117.2 101.7 105.0 65.3 111.0 115.9 120.0 111.6 111.22025 120.0 103.6 107.0 66.5 113.5 118.5 123.4 113.8 113.7
Percentage changes2015/2014 0.5 -5.6 -3.1 -47.0 0.0 0.7 1.0 0.1 0.42016/2015 2.2 4.5 4.7 -17.7 1.4 2.1 1.7 0.7 1.02017/2016 2.4 6.2 5.0 25.8 2.1 1.9 3.6 2.7 2.62018/2017 2.8 2.5 3.1 30.5 2.4 2.2 3.3 2.4 2.32019/2018 3.3 1.6 1.5 -9.6 1.4 2.1 2.6 1.8 1.72020/2019 14.4 -0.6 -0.4 -32.5 1.5 5.8 1.5 0.8 1.02021/2020 -3.8 1.2 0.5 58.3 2.4 1.0 3.2 2.1 2.22022/2021 0.2 -1.4 1.2 -3.9 2.6 3.0 4.7 2.7 3.12023/2022 0.9 -0.4 0.6 -1.9 0.8 1.2 3.6 1.7 0.92024/2023 2.0 1.3 1.6 1.8 1.8 1.9 3.1 1.8 1.82025/2024 2.4 1.9 1.9 1.8 2.3 2.3 2.8 2.0 2.2
2020Q4/2019Q4 12.0 0.4 -1.5 -27.4 1.0 4.9 1.1 0.5 0.82021Q4/2020Q4 -4.7 0.2 1.8 56.4 3.8 2.6 5.0 3.5 3.52022Q4/2021Q4 2.2 -1.0 0.3 -10.0 1.5 2.0 3.3 1.3 1.8
Notes: a Per barrel, average of Dubai and Brent spot prices. b Retail price index. c Consumer price index. d Consumer prices index, including owner occupiers’ housing costs.

National Institute of Economic and Social Research 53
National Institute UK Economic Outlook – Summer 2021
Table A3 Gross domestic product and components of expenditure (£ billion, 2018 prices)
Final consumption expenditure Gross capital formation
Domestic demand
Total exportsc
Total final expenditure
Total importsc
Net trade
GDP at
market pricesdH-Holds &
NPISHa
General govt.
Gross fixed
investment
Changes in inventoriesb
2015 1306 389 354 12 2078 593 2672 627 -34 20442016 1351 393 370 10 2121 609 2731 652 -42 20792017 1366 396 380 15 2142 642 2784 669 -27 21152018 1386 398 381 2 2167 662 2829 687 -26 21422019 1401 414 387 1 2203 679 2882 706 -27 21732020 1248 388 353 -17 1972 572 2544 580 -8 19592021 1299 431 393 -2 2121 615 2737 637 -21 20922022 1422 440 418 0 2280 701 2981 770 -68 22032023 1477 448 426 0 2350 752 3103 838 -85 22572024 1519 453 428 0 2400 793 3193 882 -89 23032025 1558 458 429 0 2445 823 3268 914 -91 2346
Percentage changes2015/2014 3.0 1.8 5.3 3.1 2.8 3.1 5.4 2.42016/2015 3.4 1.0 4.4 2.1 2.7 2.2 3.9 1.72017/2016 1.1 0.7 2.8 1.0 5.4 1.9 2.6 1.72018/2017 1.4 0.6 0.4 1.2 3.0 1.6 2.7 1.32019/2018 1.1 4.0 1.5 1.6 2.7 1.9 2.7 1.42020/2019 -10.9 -6.5 -8.8 -10.5 -15.8 -11.8 -17.8 -9.82021/2020 4.1 11.1 11.3 7.6 7.6 7.6 9.7 6.82022/2021 9.4 2.3 6.3 7.5 14.0 8.9 20.9 5.32023/2022 3.9 1.6 2.0 3.1 7.3 4.1 8.8 2.42024/2023 2.9 1.3 0.5 2.1 5.4 2.9 5.3 2.12025/2024 2.6 1.1 0.3 1.9 3.8 2.3 3.6 1.8
Decomposition of growth in GDP (percentage points)
2015 1.9 0.3 0.9 -0.2 3.2 0.8 4.0 -1.6 -0.8 2.42016 2.2 0.2 0.8 -0.1 2.1 0.8 2.9 -1.2 -0.4 1.72017 0.7 0.1 0.5 0.3 1.0 1.6 2.6 -0.8 0.8 1.72018 0.9 0.1 0.1 -0.6 1.2 0.9 2.1 -0.9 0.1 1.32019 0.7 0.7 0.3 -0.1 1.7 0.8 2.5 -0.9 -0.1 1.42020 -7.0 -1.2 -1.6 -0.8 -10.6 -4.9 -15.6 5.8 0.8 -9.82021 2.6 2.2 2.0 0.8 7.6 2.4 9.9 -3.0 -0.7 6.82022 5.8 0.5 1.2 0.1 7.6 4.1 11.7 -6.4 -2.2 5.32023 2.5 0.3 0.4 0.0 3.2 2.3 5.5 -3.1 -0.8 2.42024 1.9 0.3 0.1 0.0 2.2 1.8 4.0 -2.0 -0.2 2.12025 1.7 0.2 0.0 0.0 1.9 1.3 3.2 -1.4 -0.1 1.8
Notes: a Non–profit institutions serving households. b Including acquisitions less disposals of valuables and quarterly alignment adjustment. c Includes Missing Trader Intra–Community Fraud. d Components may not add up to total GDP growth due to rounding and the statistical discrepancy included in GDP.

54 National Institute of Economic and Social Research
National Institute UK Economic Outlook – Summer 2021
Table A4 External sector
Exports of goodsa
Imports of goodsa
Net trade in goodsa
Exports of
services
Imports of
services
Net trade in services
Export price competitivenessc
World traded
Terms of tradee
Current balance
£ billion, 2018 pricesb 2018=100 % of GDP
2015 329 456 -127 265 171 94 103.4 88.8 100.3 -5.02016 329 476 -147 281 176 104 97.9 92.0 100.5 -5.42017 350 487 -137 293 183 110 95.6 96.6 99.4 -3.82018 351 488 -137 311 199 111 100.0 100.0 100.0 -3.72019 367 499 -131 312 207 104 98.3 104.0 99.9 -3.12020 317 425 -108 255 156 99 96.6 94.9 100.1 -3.52021 337 479 -142 278 157 121 102.6 103.3 99.4 -2.52022 382 585 -203 319 184 135 102.9 112.6 102.1 -3.62023 407 638 -231 345 200 145 102.5 120.6 103.1 -4.12024 427 671 -243 366 211 155 102.4 127.0 103.3 -4.22025 442 694 -252 381 220 161 102.5 131.8 103.3 -4.2
Percentage changes2015/2014 3.6 4.0 1.8 9.6 -3.2 5.6 2.72016/2015 -0.1 4.3 6.0 3.1 -5.3 3.6 0.22017/2016 6.4 2.3 4.3 3.6 -2.3 5.0 -1.12018/2017 0.4 0.3 6.1 9.1 4.6 3.5 0.62019/2018 4.6 2.1 0.4 4.2 -1.7 4.0 -0.12020/2019 -13.8 -14.8 -18.2 -25.0 -1.7 -8.7 0.22021/2020 6.5 12.9 9.0 1.1 6.2 8.8 -0.72022/2021 13.3 22.1 14.8 17.3 0.4 9.0 2.72023/2022 6.5 8.9 8.2 8.4 -0.5 7.2 0.92024/2023 4.9 5.1 6.0 5.7 0.0 5.3 0.22025/2024 3.4 3.4 4.2 4.3 0.1 3.7 0.0
Notes: a Includes Missing Trader Intra–Community Fraud. b Balance of payments basis. c A rise denotes a loss in UK competitiveness. d Weighted by import shares in UK export markets. e Ratio of average value of exports to imports.

National Institute of Economic and Social Research 55
National Institute UK Economic Outlook – Summer 2021
Table A5 Household sector
Averagea earnings
Employee compensation
Total personal income
Gross disposable
income
Real disposable
income
Final consumption expenditure
Saving ratioc
House pricesd
Net worth to income
ratioe
£ billion, current prices £ billion, 2018 prices Per cent2015 92.0 930 1674 1322 1400 1306 10.1 102.9 6.52016 94.7 967 1717 1348 1408 1351 7.6 110.1 7.02017 97.6 1007 1766 1376 1409 1366 5.7 115.1 7.02018 100.0 1048 1846 1441 1441 1386 6.1 118.8 6.72019 104.2 1099 1915 1487 1466 1401 6.5 120.0 6.82020 106.1 1127 1936 1500 1457 1248 15.8 123.7 7.42021 108.6 1163 2044 1579 1498 1299 15.1 132.8 7.22022 114.3 1228 2176 1704 1576 1422 11.1 134.9 7.02023 117.0 1269 2255 1757 1612 1477 9.4 135.3 7.02024 120.6 1322 2347 1824 1643 1519 8.4 135.5 6.82025 124.8 1378 2450 1904 1678 1558 7.8 136.6 6.7
Percentage changes2015/2014 0.8 2.9 5.7 6.0 6.0 3.0 6.02016/2015 3.0 4.0 2.6 1.9 0.6 3.4 7.02017/2016 3.0 4.2 2.8 2.1 0.1 1.1 4.52018/2017 2.5 4.1 4.5 4.7 2.3 1.4 3.32019/2018 4.2 4.8 3.8 3.2 1.8 1.1 0.92020/2019 1.8 2.6 1.1 0.9 -0.6 -10.9 3.12021/2020 2.4 3.2 5.6 5.2 2.8 4.1 7.42022/2021 5.2 5.6 6.4 7.9 5.2 9.4 1.62023/2022 2.4 3.4 3.6 3.1 2.3 3.9 0.32024/2023 3.1 4.1 4.1 3.8 2.0 2.9 0.12025/2024 3.5 4.3 4.4 4.4 2.1 2.6 0.8
Notes: a Average earnings equals total labour compensation divided by the number of employees. b Deflated by consumers’ expenditure deflator. c Includes adjustment for change in net equity of households in pension funds. d Office for National Statistics, mix–adjusted. e Net worth is defined as housing wealth plus net financial assets.

56 National Institute of Economic and Social Research
National Institute UK Economic Outlook – Summer 2021
Table A6 Fixed investment and capital (£ billion, 2018 prices)
Gross fixed investmentUser cost of capital (%)
Corporate profit share of GDP (%)
Capital stockBusiness
investmentPrivate
housinga
General government Total Private Publicb
2015 206 85 63 354 13.7 24.5 3437 7282016 217 89 64 370 13.3 24.3 3548 7552017 220 94 66 380 13.2 24.4 3685 7052018 215 104 63 381 12.9 24.1 3732 7192019 217 105 65 387 12.8 23.6 3783 7372020 195 91 67 353 11.9 22.7 3789 7522021 203 108 83 393 10.0 25.5 3820 7822022 221 110 87 418 10.3 26.4 3868 8142023 223 110 94 426 11.1 26.2 3916 8502024 224 109 96 428 11.1 26.2 3961 8862025 225 108 96 429 11.2 26.3 4004 920
Percentage changes2015/2014 7.7 5.1 -1.5 5.3 0.1 1.12016/2015 5.5 4.7 0.7 4.4 3.2 3.72017/2016 1.5 5.6 3.1 2.8 3.9 -6.62018/2017 -2.5 11.0 -5.0 0.4 1.3 2.02019/2018 1.1 1.2 3.5 1.5 1.4 2.52020/2019 -10.2 -13.1 3.1 -8.8 0.2 2.02021/2020 3.9 18.1 24.0 11.3 0.8 3.92022/2021 8.8 1.8 5.8 6.3 1.3 4.12023/2022 1.0 -0.3 7.2 2.0 1.2 4.42024/2023 0.5 -1.0 2.0 0.5 1.2 4.22025/2024 0.7 -1.0 0.8 0.3 1.1 3.8
Notes: a Includes private sector transfer costs of non–produced assets. b Including public sector non–financial corporations.

National Institute of Economic and Social Research 57
National Institute UK Economic Outlook – Summer 2021
Table A7 Productivity and the labour market (thousands unless otherwise stated)
Employment ILO unemployment Labour forceb Population of
working agec
Productivity (2018=100)
per hour
ILO unemployment
rateEmployees Totala
2015 26504 31285 1781 33066 40879 98.6 5.42016 26771 31744 1633 33377 41062 98.8 4.92017 27065 32057 1476 33533 41169 99.5 4.42018 27494 32439 1380 33819 41260 100.0 4.12019 27652 32799 1306 34105 41344 100.2 3.82020 27862 32644 1529 34173 41436 100.6 4.52021 28083 32554 1723 34277 41513 101.3 5.02022 28182 32673 1789 34462 41585 102.0 5.22023 28459 32969 1635 34604 41651 103.0 4.72024 28751 33279 1469 34748 41717 104.0 4.22025 28958 33505 1391 34897 41785 105.2 4.0
Percentage changes2015/2014 2.1 1.7 -12.1 0.9 0.5 0.72016/2015 1.0 1.5 -8.3 0.9 0.4 0.32017/2016 1.1 1.0 -9.6 0.5 0.3 0.72018/2017 1.6 1.2 -6.5 0.9 0.2 0.52019/2018 0.6 1.1 -5.4 0.8 0.2 0.22020/2019 0.8 -0.5 17.1 0.2 0.2 0.42021/2020 0.8 -0.3 12.7 0.3 0.2 0.72022/2021 0.4 0.4 3.9 0.5 0.2 0.72023/2022 1.0 0.9 -8.6 0.4 0.2 1.02024/2023 1.0 0.9 -10.1 0.4 0.2 1.02025/2024 0.7 0.7 -5.3 0.4 0.2 1.1
Notes: a Includes self–employed, government–supported trainees and unpaid family members. b Employment plus ILO unemployment. c Population projections are based on annual rates of growth from 2018–based population projections by the ONS.

58 National Institute of Economic and Social Research
National Institute UK Economic Outlook – Summer 2021
Table A8 Public sector financial balance and borrowing requirement (£ billion, fiscal years)
2018–19 2019–20 2020–21 2021–22 2022–23 2023–24 2024–25 2025–26
Current receipts:
Taxes on income 470.3 483.3 494.5 511.4 519.2 580.0 604.0 630.5Taxes on expenditure 274.0 276.0 148.1 251.8 296.4 310.0 324.9 340.6Other current receipts 70.9 69.9 151.8 98.2 104.3 108.2 112.6 117.2
Total 815.2 829.2 794.4 861.3 919.9 998.1 1041.4 1088.3(as a % of GDP) 37.7 37.3 37.8 36.6 36.8 38.5 38.6 38.8
Current expenditure:
Goods and services 402.8 428.3 504.7 491.0 508.0 525.5 546.6 569.4Net social benefits paid 242.4 242.1 262.9 276.7 288.5 297.4 306.7 318.5Debt interest 54.8 54.6 41.3 45.2 45.4 45.3 45.4 45.6Other current expenditure 61.3 67.0 179.1 122.5 73.7 75.5 78.3 81.2
Total 761.3 792.0 988.1 935.4 915.6 943.7 976.9 1014.7(as a % of GDP) 35.2 35.7 47.0 39.8 36.7 36.4 36.2 36.1
Depreciation 49.8 51.3 52.3 57.3 60.9 63.2 65.7 68.4
Surplus on public sector current budgeta 4.1 -14.1 -246.1 -131.4 -56.6 -8.7 -1.2 5.2(as a % of GDP) 0.2 -0.6 -12.0 -5.6 -2.3 -0.3 0.0 0.2
Gross investment 92.3 92.7 104.0 119.7 127.0 136.4 140.9 145.6Net investment 42.5 41.4 51.7 62.4 66.1 73.2 75.2 77.2(as a % of GDP) 2.0 1.9 2.5 2.7 2.6 2.8 2.8 2.7
Total managed expenditure 853.6 884.7 1092.1 1055.1 1042.6 1080.0 1117.8 1160.3(as a % of GDP) 39.5 39.8 51.9 44.9 41.7 41.7 41.5 41.3
Public sector net borrowing 38.4 55.5 297.8 193.8 122.7 81.9 76.4 71.9(as a % of GDP) 1.8 2.5 14.2 8.2 4.9 3.2 2.8 2.6
Public sector net debt (% of GDP) 81.0 85.4 96.8 96.4 98.6 98.4 93.7 92.3
GDP deflator at market prices (2018=100) 100.5 102.8 109.3 109.8 112.7 114.2 116.5 119.2
Money GDP (£ billion) 2163 2221 2103 2351 2498 2591 2695 2808
Notes: These data are constructed from seasonally adjusted national accounts data. This results in differences between the figures here and unadjusted fiscal year data. Data exclude the impact of financial sector interventions, but include flows from the Asset Purchase Facility of the Bank of England. a Public sector current budget surplus is total current receipts less total current expenditure and depreciation.
Table A9 Accumulation (% of GDP)
Households Companies General government Whole economy Finance from abroada Net
national savingSaving Investment Saving Investment Saving Investment Saving Investment Total
Net factor
income2015 7.2 4.2 6.7 11.0 -1.2 2.5 12.7 17.7 5.0 2.2 -1.62016 5.4 4.3 7.1 11.1 -0.1 2.5 12.4 17.9 5.4 2.4 -2.02017 3.9 4.7 9.5 11.0 1.0 2.6 14.5 18.2 3.8 1.2 -0.22018 4.2 4.6 8.8 10.7 1.2 2.6 14.2 17.9 3.7 1.2 -0.52019 4.5 4.7 9.6 10.9 1.2 2.7 15.2 18.3 3.1 0.6 0.52020 11.6 4.2 10.5 9.6 -8.7 3.0 13.4 16.9 3.5 1.7 -2.52021 10.7 4.6 11.9 11.1 -5.8 3.6 16.8 19.3 2.5 0.4 1.02022 7.8 4.4 9.2 11.4 -1.3 3.5 15.7 19.3 3.6 0.2 -0.12023 6.5 4.3 8.1 11.3 0.6 3.7 15.2 19.4 4.1 0.5 -0.52024 5.8 4.2 7.9 11.2 1.3 3.8 15.0 19.2 4.2 0.6 -0.82025 5.4 4.1 7.7 11.1 1.6 3.7 14.7 19.0 4.2 0.6 -1.0
Notes: Saving and investment data are gross of depreciation unless otherwise stated. a Negative sign indicates a surplus for the UK.
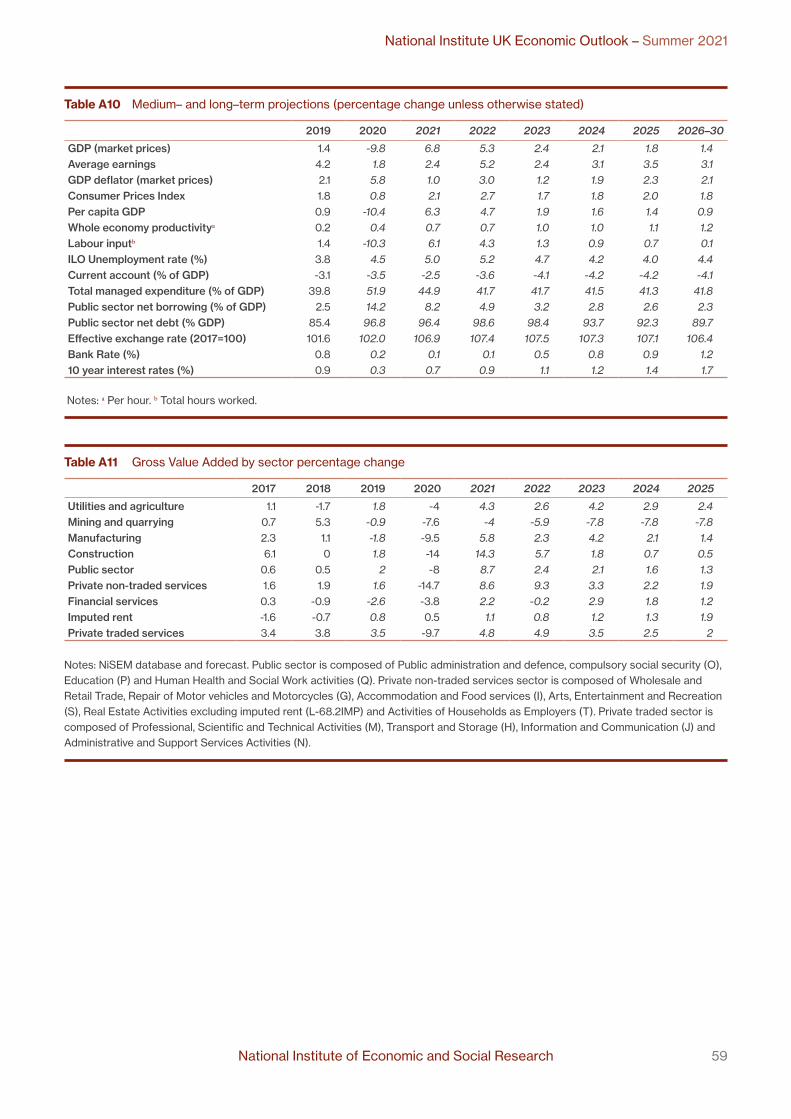
National Institute of Economic and Social Research 59
National Institute UK Economic Outlook – Summer 2021
Table A10 Medium– and long–term projections (percentage change unless otherwise stated)
2019 2020 2021 2022 2023 2024 2025 2026–30
GDP (market prices) 1.4 -9.8 6.8 5.3 2.4 2.1 1.8 1.4Average earnings 4.2 1.8 2.4 5.2 2.4 3.1 3.5 3.1GDP deflator (market prices) 2.1 5.8 1.0 3.0 1.2 1.9 2.3 2.1Consumer Prices Index 1.8 0.8 2.1 2.7 1.7 1.8 2.0 1.8Per capita GDP 0.9 -10.4 6.3 4.7 1.9 1.6 1.4 0.9Whole economy productivitya 0.2 0.4 0.7 0.7 1.0 1.0 1.1 1.2Labour inputb 1.4 -10.3 6.1 4.3 1.3 0.9 0.7 0.1ILO Unemployment rate (%) 3.8 4.5 5.0 5.2 4.7 4.2 4.0 4.4Current account (% of GDP) -3.1 -3.5 -2.5 -3.6 -4.1 -4.2 -4.2 -4.1Total managed expenditure (% of GDP) 39.8 51.9 44.9 41.7 41.7 41.5 41.3 41.8Public sector net borrowing (% of GDP) 2.5 14.2 8.2 4.9 3.2 2.8 2.6 2.3Public sector net debt (% GDP) 85.4 96.8 96.4 98.6 98.4 93.7 92.3 89.7Effective exchange rate (2017=100) 101.6 102.0 106.9 107.4 107.5 107.3 107.1 106.4Bank Rate (%) 0.8 0.2 0.1 0.1 0.5 0.8 0.9 1.210 year interest rates (%) 0.9 0.3 0.7 0.9 1.1 1.2 1.4 1.7
Notes: a Per hour. b Total hours worked.
Table A11 Gross Value Added by sector percentage change
2017 2018 2019 2020 2021 2022 2023 2024 2025
Utilities and agriculture 1.1 -1.7 1.8 -4 4.3 2.6 4.2 2.9 2.4Mining and quarrying 0.7 5.3 -0.9 -7.6 -4 -5.9 -7.8 -7.8 -7.8Manufacturing 2.3 1.1 -1.8 -9.5 5.8 2.3 4.2 2.1 1.4Construction 6.1 0 1.8 -14 14.3 5.7 1.8 0.7 0.5Public sector 0.6 0.5 2 -8 8.7 2.4 2.1 1.6 1.3Private non-traded services 1.6 1.9 1.6 -14.7 8.6 9.3 3.3 2.2 1.9Financial services 0.3 -0.9 -2.6 -3.8 2.2 -0.2 2.9 1.8 1.2Imputed rent -1.6 -0.7 0.8 0.5 1.1 0.8 1.2 1.3 1.9Private traded services 3.4 3.8 3.5 -9.7 4.8 4.9 3.5 2.5 2
Notes: NiSEM database and forecast. Public sector is composed of Public administration and defence, compulsory social security (O), Education (P) and Human Health and Social Work activities (Q). Private non-traded services sector is composed of Wholesale and Retail Trade, Repair of Motor vehicles and Motorcycles (G), Accommodation and Food services (I), Arts, Entertainment and Recreation (S), Real Estate Activities excluding imputed rent (L-68.2IMP) and Activities of Households as Employers (T). Private traded sector is composed of Professional, Scientific and Technical Activities (M), Transport and Storage (H), Information and Communication (J) and Administrative and Support Services Activities (N).

National Institute of Economic and Social Research 2 Dean Trench St
London SW1P 3HET: +44 (0)20 7222 7665E: [email protected]
W: niesr.ac.uk
Keep in touch with our range of blogs, events, policy and discussion papers